Embed Size (px)
Citation preview


Confidential
Blackstone Alternative Asset Management
November 2018

Blackstone
Table of Contents
Confidential
1
BAAM Overview 3I.
Investment Process 12II.
Macroeconomic Landscape 19III.
Hope Street Fund L.P. 30IV.
Appendix 41A.

Blackstone
Blackstone Team Biographies
2
Brad Rudner is a Managing Director of the Hedge Fund Solutions Group, where he serves as the Head of Global BusinessStrategy and works with BAAM’s largest clients and prospects across geographies. Prior to joining Blackstone in 2014,Mr. Rudner was the Head of Global Business Development and Client Relations for Aetos Capital. Prior to joining Aetos,Mr. Rudner was a Vice President at Lazard Asset Management where he was involved with institutional new businessdevelopment, client service and consultant relations across business channels.
Mr. Rudner received a B.A. in Economics from Duke University.
Alberto Santulin is a Managing Director of the Hedge Fund Solutions Group. Mr. Santulin is involved in portfoliomanagement and in hedge fund manager evaluation, selection and monitoring. He is primarily focused on multi‐strategy,event, arbitrage and reinsurance strategies. Before joining Blackstone in 2003, Mr. Santulin worked at Rasini & Co. Inc., aEuropean fund‐of‐hedge‐funds, where he opened and ran the New York office. Prior to joining Rasini, Mr. Santulin workedin London for Banque Paribas where he was in Fixed Income Derivatives Sales & Trading covering Italian institutions andhedge funds.
Mr. Santulin received a BA with a major in Finance from Bocconi University in Milan, Italy. His degree dissertation is titled"Hedge Funds: Evolution and Investment Strategies." He has earned the right to use the Chartered Financial Analystdesignation.
Bobby McGann is an Associate of the Hedge Fund Solutions Group. Mr. McGann is involved in servicing existing BAAM clientrelationships and also in new business development. Before joining Blackstone in 2016, Mr. McGann worked at TheGoldman Sachs Group as an investment banker within the Public Sector and Infrastructure Group.
Mr. McGann graduated from Georgetown University with a BA degree in Government Studies and a minor in Economics.

I. BAAM Overview
Blackstone
Confidential
4
(1) Subject to Blackstone’s information walls(2) AUM as of 6/30/2018, estimated and unaudited. AUM includes committed but uncalled capital. (3) Standard & Poor’s and Fitch ratings are as of October 2017. (4) As of 9/1/17. Information is estimated and unaudited.(5) Source: InvestHedge Billion Dollar Club (as of December 31, 2017) based on AUM.
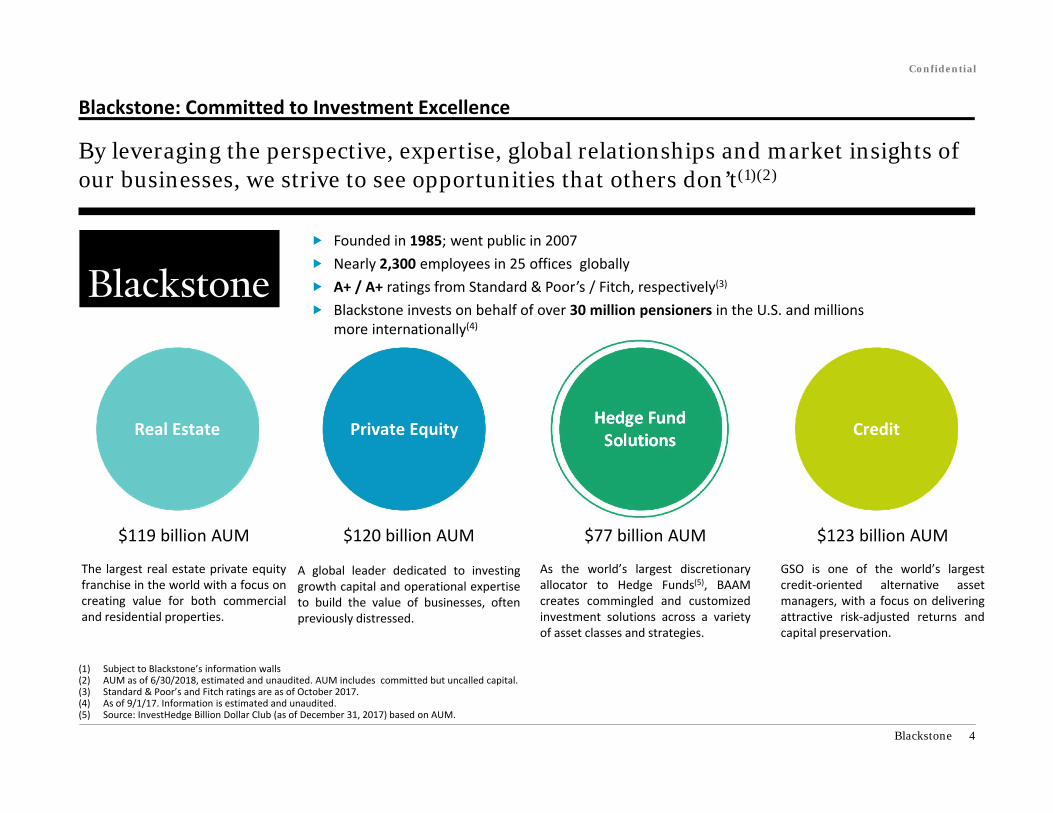
$123 billion AUM
GSO is one of the world’s largestcredit‐oriented alternative assetmanagers, with a focus on deliveringattractive risk‐adjusted returns andcapital preservation.
$77 billion AUM
As the world’s largest discretionaryallocator to Hedge Funds(5), BAAMcreates commingled and customizedinvestment solutions across a varietyof asset classes and strategies.
$119 billion AUM
The largest real estate private equityfranchise in the world with a focus oncreating value for both commercialand residential properties.
$120 billion AUM
A global leader dedicated to investinggrowth capital and operational expertiseto build the value of businesses, oftenpreviously distressed.
Founded in 1985; went public in 2007 Nearly 2,300 employees in 25 offices globally A+ / A+ ratings from Standard & Poor’s / Fitch, respectively(3)
Blackstone invests on behalf of over 30 million pensioners in the U.S. and millions more internationally(4)
Hedge Fund SolutionsPrivate EquityReal Estate Credit
By leveraging the perspective, expertise, global relationships and market insights of our businesses, we strive to see opportunities that others don’t(1)(2)
Blackstone: Committed to Investment Excellence

Blackstone
Confidential
BAAM: Leveraging Hedge Fund Talent to Provide Innovative Solutions(1)
A broad range of solutions with high alignment of interests
(1) All data as of 7/1/2018, unless otherwise noted. AUM includes unfunded commitments and internal capital. AUM is estimated and unaudited. Assets of certain inter‐fund investments may be double counted. AUM data is rounded to the nearest billion and as such, may differ materially from the figures shown above. Further information may be provided upon request. Availability of any BAAM fund is subject to local Security Laws in each jurisdiction.
(2) Customized AUM includes custom fund assets that are subject to custom fees. (3) Includes all registered funds managed by the Hedge Fund Solutions Group.(4) Represents AUM of Blackstone NWI Asset Management L.L.C., a 50/50 joint venture between Blackstone Alternative Asset Management L.P. and NWI Management, L.P. (5) Custom Co‐Investments includes committed but uncalled capital. Parallel Investments are defined as excess capacity co‐investment trades in BSOF executed investments, or investments that do not fit
the BSOF risk mandate. Data as of 6/30/2018.(6) Representative of committed capital in SAF I, SAF II and SAF III. As of 6/30/2018, AUM was $1.3 billion across all SAF vehicles.(7) Representative of committed capital in Blackstone Strategic Capital Holdings. (8) Inclusive of GP AUM.
5
High alignment of interests: $2 bn of BAAM & Blackstone Capital(8)
GP Economic Participation
Customized ~$40b(2):• Customized hedge fund portfolio solutions
tailored to client needs and objectives
Commingled ~$20b: • Diversified, strategy focused and
opportunistic strategies
Registered Funds ~$9b(3):• Registered & individual‐focused
investment solutions (Mutual Fund, Closed‐End Funds, and UCITS)
Long Biased EM Debt ~$2b(4):• Partnership with NWI Management.
Unconstrained multi‐sector EM debt strategy in both local and external markets
PortfolioSolutions
Direct Investing
Strategic Opportunity ~$5b(5): • Special situations platform targeting
idiosyncratic opportunities across geographies and asset classes
• Hedged platform, leveraging ideas from BAAM’s network of hedge fund partners and other Blackstone relationships
Parallel Investments ~$3b(5): • Excess capacity co‐investment trades
Custom Co-Investments ~$1b(5): • Customized separate account targeting
special situation and co‐invest exposures utilizing tailored guidelines
Strategic Alliance ~ $5b(6): • Meaningful early stage seed to help hedge
fund managers launch their business
• Source of emerging manager capacity
Strategic Capital Holdings ~$3b(7):• Acquiring minority GP stakes in established
alternative asset managers
• Strategy seeks to generate continuous cash flows and allow for potential monetization

Blackstone
Confidential
Arthur LiaoChief
Financial Officer
Oli Meyohas
Head of Global Investor Relations and Business
Development
Ian Morris
Head of Allocation Strategy
Greg Geiling
Head of Special Situations Investing
Brian GavinChief
Operating Officer
Bob Jordan
Risk Management; Special Situations
Investing
Gideon BergerCo‐Chief
Investment Officer
Brett Condron
Head of Global Individual
Investor Solutions
Mohamed El BeihHead of
Middle East
Min Htoo
Co‐Chief Investment Officer and Head of
Opportunistic Investing
(1) Data presented is as of 7/1/2018. Headcount excludes consultants and administrative staff(2) Inclusive of Senior Managing Directors(3) Inclusive of Investment Operations team(4) As of 6/30/2018
229BAAM
professionals
102investment professionals
11 yearsaverage Blackstone tenure of Management Team(2)
Risk Management
Investment Team
Business & Financial
Evaluation
Legal, Compliance, & Product
StructuringOperations Investor
Solutions
J. Tomilson HillChairman of BAAM & Vice Chairman of Blackstone
• 10 Risk professionals • 3 PhDs
• 72 professionals(3)
• 6 strategy focused groups
• 59manager research• 6 asset allocation and portfolio management
• 10 professionals • 2 CPA
• 26 professionals • 14 JDs(2)
• 44 professionals • 9 CPAs(2)
• 40 professionals
Deep and Experienced Team(1)
Steve Sullens
Head of Portfolio Management
Scott Soussa
Head of Strategic Capital Group
Peter KofflerGeneral
Counsel & Chief Compliance Officer
John McCormickPresident & CEO of BAAM
Indicates Senior Managing Director
Technology
• 12 Technology professionals
• 23 additional technology consultants (4)
6

Blackstone
Confidential
(1) Number shown as a percentage of total flows from external investors for the period 2008 – 2017. (2) Based on assets under management, as of 7/1/2018.
7
Diversified and Institutional Client Base
Institutional composition of our client base provides the business with stability
BAAM Client Breakdown by Investor Type(2) BAAM Client Breakdown by Geography(2)
On average, over 50% of our inflows in recent years have come from existing investors(1)
Emphasis on transparency, knowledge transfer and investor education Institutional investor base allows for customization and innovation

Blackstone
Top 20 Clients and Investors by AUM(1)
(1) As of October 1, 2018. Estimated and unaudited.
8
Ranking Client Domicile AUM
1 Government Institution Middle East $ 5,799
2 Corporate Japan 4,431
3 Government Institution Hong Kong 3,131
4 Public Pension California, United States 2,240
5 Distribution Platform United States 1,906
6 Non‐US Plan Assets Canada 1,797
7 Government Institution Middle East 1,747
8 Distribution Platform United States 1,700
9 Government Institution Australia 1,551
10 Government Institution China 1,425
11 Public Pension Michigan, United States 1,098
12 Foundation Texas, United States 978
13 US Pension Minnesota, United States 964
14 Healthcare Michigan, United States 943
15 Distribution Platform Netherlands 917
16 Non‐US Plan Assets United Kingdom 908
17 Public Pension Pennsylvania, United States 907
18 Corporate British Virgin Islands 768
19 Government Institution Middle East 756
20 Public Pension California, United States 692

Blackstone
Confidential
(1) This analysis was performed utilizing BAAM’s 7/1/2018 active manager strategy list. This only includes investments by BAAM Principal Solutions in third‐party managed hedge funds. It does not include investments by BAAM's individual investor solutions (liquid alternatives), Strategic Capital (seeding and minority interests), Strategic Opportunities (co‐invests), and non‐discretionary platforms. This also generally excludes strategies where full redemptions in corresponding fund investments have been submitted by BAAM but BAAM has not yet received proceeds, and strategies with which BAAM’s remaining investment is held in a side pocket or hedge fund strategies that are in liquidation. Active strategies generally exclude those strategies where BAAM’s only remaining investment is through a committed capital structure beyond the fund’s investment period. Such strategies may be included in the analysis if there is a strategy with a substantially similar investment mandate within its investment period. AUM data is as of 3/31/2018 or later for all strategies. Totals might not equal 100% due to rounding.
(2) Includes all BAAM Hedge Fund Solutions advisors (together “BAAM”). Negotiated Structures/Transactions is calculated by dividing total amount invested in (i) all customized vehicles, which includes underlying funds where BAAM is the sole external investor and funds with which BAAM has negotiated guaranteed capacity; (ii) seeding platform funds; (iii) underlying vehicles with negotiated fee discounts, which includes beneficial fees exclusively negotiated for BAAM and beneficial fees applicable to some or all other investors where BAAM participated in the negotiations (negotiated benefits to BAAM funds will fluctuate depending on related AUM); and (iv) co‐investments (BSOF transactions) funded as of 6/30/2018, by BAAM's total AUM as at 7/1/2018. Analysis excludes unfunded commitments.
9
Partnerships with Managers
Size and stability of our allocations enhances our ability to create deep relationships with many talented managers
Managers’ Size(1)Negotiated
Structures/Transactions(2)
• Experience partnering with both established and emerging hedge fund managers
• Valued partner for managers looking to raise capital
• Customized exposures created exclusively for BAAM• Ability to manufacture capacity • Infrastructure to support special situations investing

Blackstone
Confidential
(1) Source: InvestHedge Billion Dollar Club. Data as of June 2018 unless otherwise noted.(2) BAAM AUM is estimated and unaudited for 2018. Shown as of June 2018.(3) Source: InvestHedge Billion Dollar Club. Time period was selected by InvestHedge. Use of alternate time periods may yield different results. This reflects the 10 largest Fund of Hedge Funds firms by AUM ranked by
their AUM as of June 2018.
10
BAAM’s Industry Leadership is Demonstrated by its AUM Growth
A solutions-oriented partner to global institutions
Top 10 Industry Players by AUM as of 6/30/2018(3)
(US$ in billions)
Cumulative Growth in Assets for FoHFs >$1 billion(1), and BAAM(2)
(US$ in billions)
Cumulative Growth Since 2008
BAAM AUM ($bn)
6/30/2008 6/30/2018 % Change SinceManager AUM AUM June 2008
BAAM $31.7 $77.4 144.2%
Competitor 1 56.8 40.8 (28.2%)Competitor 2 23.7 32.6 37.6%Competitor 3 25.4 31.3 23.3%Competitor 4 27.4 27.3 (0.4%)Competitor 5 24.5 23.6 (3.7%)Competitor 6 21.9 23.2 5.9%Competitor 7 46.6 21.6 (53.6%)Competitor 8 43.5 20.7 (52.4%)Competitor 9 15.6 16.8 7.9%
$0
$10
$20
$30
$40
$50
$60
$70
$80
‐100%
‐50%
0%
50%
100%
150%
200%
250%
2008 2009 2010 2011 2012 2013 2014 2015 2016 2017 2018
BAAM AUM ($bn) BAAM FOF > $1bn ex‐BAAM

Blackstone
Confidential
(1) Past performance is not indicative of future results. There can be no assurance any BAAM funds will achieve its investment objectives or avoid significant losses.(2) As at 6/30/18. Estimated and unaudited.(3) Flows include both fee‐paying and non‐fee paying commitments.(4) Number shown as a percentage of average annual flows from external investors for the period 2008 – 2017.(5) Active managers as of 7/1/18. Includes active BAAM Principal Solutions (BPS), MMLS and BEMAP strategies only; does not include strategies of managers exclusively on BAAM's mutual fund, seed, minority interest,
strategic opportunity (“BSOF”) and advisory platforms.(6) Includes all Hedge Fund Solutions advisors (together “BAAM”). Negotiated Structures/Transactions is calculated by dividing total amount invested in (i) all customized vehicles, which includes underlying funds
where BAAM is the sole external investor and funds with which BAAM has negotiated guaranteed capacity; (ii) seeding platform funds; (iii) underlying vehicles with negotiated fee discounts, which includesbeneficial fees exclusively negotiated for BAAM and beneficial fees applicable to some or all other investors where BAAM participated in the negotiations (negotiated benefits to BAAM funds will fluctuatedepending on related AUM); and (iv) co‐investments (BSOF transactions) funded as of 6/30/2018, by BAAM's total AUM as at 7/1/2018. Analysis excludes unfunded commitments.
(7) Reflects underlying manager performance and management fee savings for Partners OS Fund based on allocations and negotiations completed as of 7/1/2018. Please see results using different return assumptionsand additional disclosures at the end of this presentation.
11
11 yearAverage tenure of Senior
Managing Directors
~110 ManagersCurrently on
BAAM’s platform(5)
$2.0bnInternal capital invested
in BAAM funds(2)
50%Of annual inflows from
existing clients in recent years(4)
18 yearsOf consecutive positive
net inflows(3)
20+ yearTrack record (1)
Experienced Team Stable Business Strong Partnerships
79% of AUMIn negotiated
structures / transactions(6)
31-52bpsTotal potential fee savings for BAAM’s flagship fund assuming gross manager returns of 0% to 12%(7)
20+ yearTrack record of partnering with
institutional investors
BAAM’s Competitive Advantage
Innovative, solutions focused and relationship driven culture

II. Investment Process

Blackstone
Confidential
Deep Investment Team, with Real Market Experience
Investment team of 102 professionals, with 4 independent due diligence groups(1)
(1) As at 7/1/2018.(2) Includes team head where team head is Senior Managing Director
13
ManagerResearch
RiskManagement
Business &Financial Evaluation
Legal, Compliance, and Product Restructuring
Bob Jordan
Risk Management; Special Situations
Investing
BAAM Investment Committee
10 investment professionals 3 PhDs Focus on manager’s risk controls
and risk profile
65 investment professionals Focus on identifying investment
edge 6 strategy focused groups 59 investment professionals
dedicated to manager research 6 investment professionals
dedicated to asset allocation and PM
10 investment professionals 2 CPA Focus on manager operations and
compliance
6 investment professionals 3 JDs(2)
Focus on key terms and protections as well as analysis of structural / tax implications
BAAM Due Diligence Teams
Researches & classifies managers. Conducts in‐depth due diligence. Prepares recommendations to the Investment Committee.
Responsible for all allocation and investment decisions for each BAAM fund
Gideon Berger
Co‐CIO; Chairman of Investment Committee
Greg Geiling
Head of Special Situations Investing
Steve SullensHead of Portfolio
Management
John McCormickPresident & CEO of BAAM
Ian Morris
Vice Chairman of the Investment Committee; Head of Allocation
Strategy
Min Htoo
Co‐CIO; Head of Opportunistic Investing

Blackstone
Confidential
BAAM’s Investment Process
Each investment in a hedge fund is the culmination of our disciplined and multi-stage decision-making process(1)
(1) BAAM does not have any involvement in or responsibility for, and provides no assurance regarding, the performance, management or affairs of BAAM’s underlying managers.
14
Macro Perspective
Manager Sourcing
Due Diligence
Portfolio Construction &
Organization
Ongoing Monitoring
Top‐down views on global economy and
markets combined with robust scenario analysis guide manager and strategy research
Differentiated sourcing network provides edge in identifying and screening
managers
In‐depth qualitative and quantitative analyses by our multi‐disciplinary
team identify prospective managers
Rigorous portfolio construction utilizing scenario analysis, risk
budgeting and differentiated tools leads to optimal portfolios
Four‐pronged due diligence approach
ensures continual review of managers

Blackstone
Top Down: BAAM’s Proprietary Approach to Allocation Strategy
(1) Subject to The Blackstone Group’s Internal Information Wall Policy
15
Dedicated Team Integration with Blackstone(1) Manager Relationships
Insights on the economy through BX ownership of portfolio companies
Perspective on capital markets through BX’s buying, selling and refinancing activities
Allocation Strategy Team focused solely on formulating top down views
Led by Ian Morris, an economist with over 15 years experience
Differentiated relationships with hedge fund managers• Invested with some of the
most talented & experienced managers in the business
• Market color from a broad array of managers across different strategies
All these inputs are brought together in BAAM’s structured Allocation Strategy process
BAAM’s approach to formulating a top-down view stems from:

Blackstone
Confidential
Bottom Up: Manager Sourcing & Selection – Existing Managers
Global footprint and broad strategy expertise enhances BAAM’s manager sourcing capabilities
(1) Meant to represent the entire Hedge Fund Industry. Source: HFR Industry Reports, © HFR, Inc. Q3 2016, www.hedgefundresearch.com.(2) Subject to The Blackstone Group’s internal Information Wall Policy
16
Qualitative and quantitative screens identify high‐priority hedge funds consistent with our top‐down view
High quality managers moved on to evaluation stage Classified & monitored in our proprietary system (No Interest, Revisit, Monitor,
Prospect)
Only funds classified as Prospects are taken forward to due diligenceProspect
BAAM’s Strategy Teams meet with several hundred managers a year, new and existing
Trading backgrounds and deep network of contacts enables the Investment Team to view a wide section of the hedge fund industry
Sourcing through traditional channels (spin‐offs, cap intro, etc.) and the BX network(2); access to thousands of manager returns
High Quality
Manager Interaction
Sourcing Managers
9,000+(1)
Blackstone
Confidential
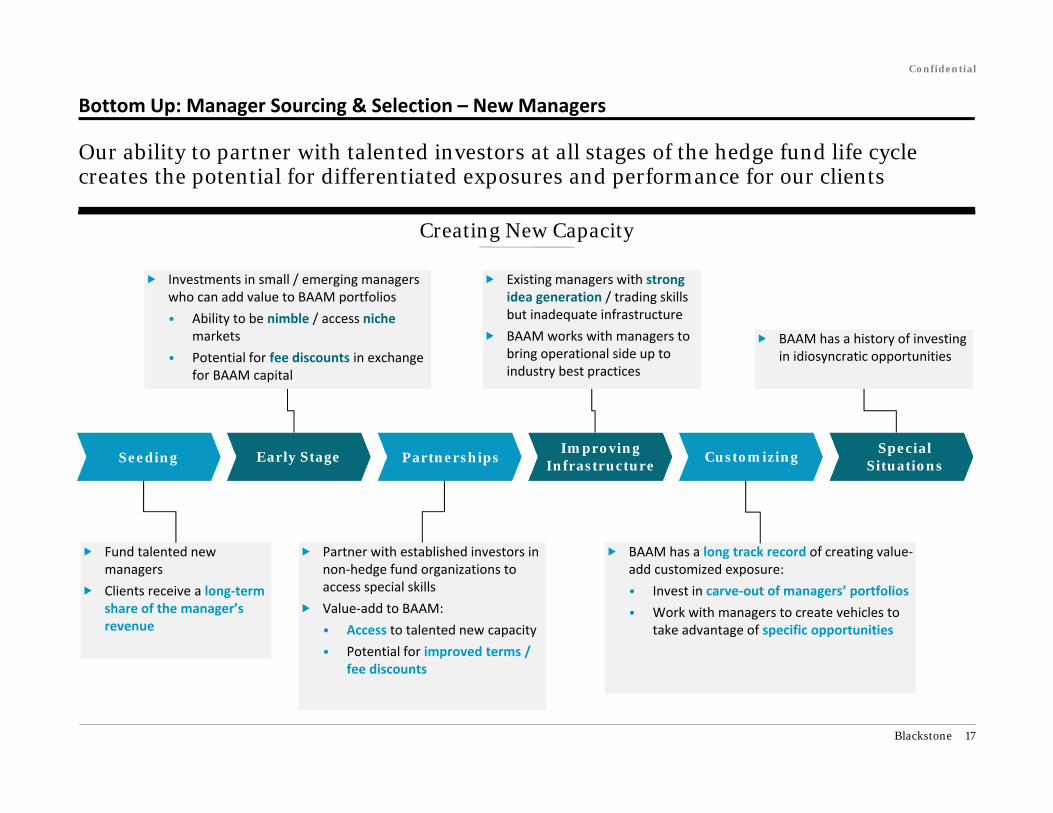
Bottom Up: Manager Sourcing & Selection – New Managers
Our ability to partner with talented investors at all stages of the hedge fund life cycle creates the potential for differentiated exposures and performance for our clients
17
Creating New Capacity
Seeding Early Stage Partnerships Customizing
Fund talented new managers
Clients receive a long‐term share of the manager’s revenue
Investments in small / emerging managers who can add value to BAAM portfolios• Ability to be nimble / access niche
markets• Potential for fee discounts in exchange
for BAAM capital
Partner with established investors in non‐hedge fund organizations to access special skills
Value‐add to BAAM: • Access to talented new capacity• Potential for improved terms /
fee discounts
Improving Infrastructure
Existing managers with strong idea generation / trading skills but inadequate infrastructure
BAAM works with managers to bring operational side up to industry best practices
BAAM has a long track record of creating value‐add customized exposure:• Invest in carve‐out of managers’ portfolios• Work with managers to create vehicles to
take advantage of specific opportunities
SpecialSituations
BAAM has a history of investing in idiosyncratic opportunities
Blackstone
Confidential
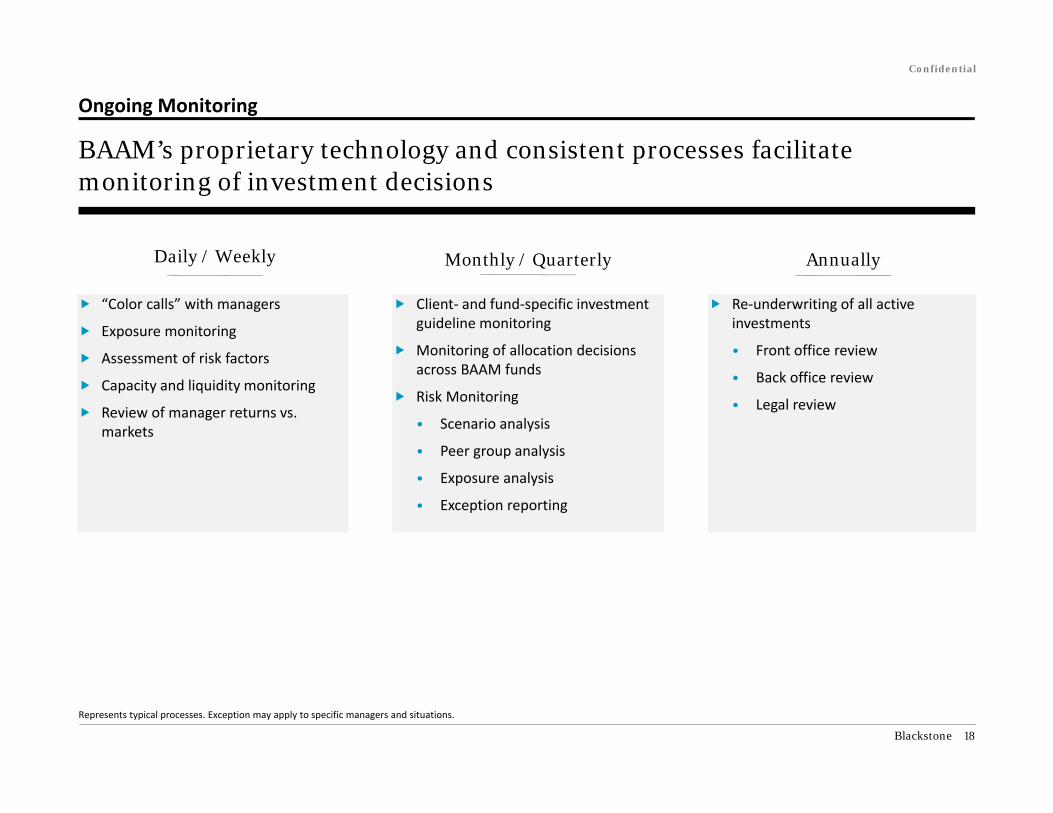
Ongoing Monitoring
BAAM’s proprietary technology and consistent processes facilitate monitoring of investment decisions
Represents typical processes. Exception may apply to specific managers and situations.
18
“Color calls” with managers
Exposure monitoring
Assessment of risk factors
Capacity and liquidity monitoring
Review of manager returns vs. markets
Client‐ and fund‐specific investment guideline monitoring
Monitoring of allocation decisions across BAAM funds
Risk Monitoring
• Scenario analysis
• Peer group analysis
• Exposure analysis
• Exception reporting
Re‐underwriting of all active investments
• Front office review
• Back office review
• Legal review
Daily / Weekly Monthly / Quarterly Annually

III. Macroeconomic Landscape

Blackstone
0
5
10
15
20
25
30
35
40
45
50
1880 1890 1900 1910 1920 1930 1940 1950 1960 1970 1980 1990 2000 2010
Cyclically-Adjusted Price/Earnings Ratio
Source: Robert Shiller, Standard & Poor’s, Bureau of Labor Statistics, Research Affiliates, Shiller Barclays CAPE Indices, BAAM calculations. As of June 30, 2018, Europe as of May, 31 2018.Information is not intended to be a prediction of how any financial markets will perform in the future.
20
Ratio
US Average: 16.8
31.7+1 Stdev
‐1 Stdev
Europe
Emerging Markets
United States

Blackstone
‐20 ‐10 0 10 20 30 40
Prob
ability
Real S&P 500 Annualized TR (%)
21
Real S&P 500: Next 5 Year Annualized TR (%)
WhenCAPE = 29
Source: Robert Shiller, Standard & Poor’s, Bureau of Labor Statistics, BAAM analysis. Uses Kernel Density Estimation (KDE), which is a non‐parametric statistical technique to estimate the probability density function of a random variable. Vertical dotted line represents the fitted distribution mean. CAPE = Real S&P Price / 10 Year Average of Real S&P 500 EPS with 2008 adjustment. Analysis is from Dec 1880 – Sep 2017. These numbers are not intended to be a prediction of how any markets will perform in the future.
WhenCAPE = 10

Blackstone
Real S&P 500: Next 5 Year Annualized TR (%)Conditional on Starting Valuation and Unemployment Rate
Source: Robert Shiller, Standard & Poor’s, Bureau of Labor Statistics, BAAM analysis. Uses Kernel Density Estimation (KDE), which is a non‐parametric statistical technique to estimate the probability density function of a random variable. CAPE = Real S&P Price / 10 Year Average of Real S&P 500 EPS with 2008 adjustment. Analysis is from Jan 1950 – Sep 2017. These numbers are not intended to be a prediction of how any markets will perform in the future.
22
Unemployment Rate (%)All 4 6 8 9
All 7.1 3.1 7.5 10.2 11.7
16 8.2 6.0 7.6 10.5 12.318 7.9 4.2 7.9 12.5 12.8
CAPE 20 7.7 2.9 8.5 13.3 12.624 5.7 1.1 7.6 13.5 11.628 2.5 0.1 3.9 12.2 10.930 1.5 ‐0.2 2.8 10.1 10.6

Blackstone
Real S&P 500: Next 5 Year Max Loss (%)Conditional on Starting Valuation and Unemployment Rate
Source: Robert Shiller, Standard & Poor’s, Bureau of Labor Statistics, BAAM analysis. Uses Kernel Density Estimation (KDE), which is a non‐parametric statistical technique to estimate the probability density function of a random variable. CAPE = Real S&P Price / 10 Year Average of Real S&P 500 EPS with 2008 adjustment. Max Loss is defined as the return from the beginning of a 5 year period to the trough. Analysis is from Jan 1950 – Sep 2017. These numbers are not intended to be a prediction of how any markets will perform in the future.
23
Unemployment Rate (%)All 4 6 8 9
All ‐15.8 ‐24.0 ‐14.4 ‐8.6 ‐7.4
10 ‐9.0 ‐8.4 ‐9.4 ‐10.4 ‐8.215 ‐12.9 ‐15.5 ‐14.8 ‐8.1 ‐5.9
CAPE 20 ‐14.6 ‐20.7 ‐14.1 ‐5.3 ‐6.925 ‐20.9 ‐28.9 ‐16.3 ‐6.2 ‐9.930 ‐26.5 ‐31.9 ‐22.3 ‐10.3 ‐12.4

Blackstone
Real S&P 500: Next 5 Year Annualized TR (%)Conditional on Starting Valuation and Real 10 Year Yield
Source: Robert Shiller, Standard & Poor’s, Bureau of Labor Statistics, Macrobond, BAAM analysis. Uses Kernel Density Estimation (KDE), which is a non‐parametric statistical technique to estimate the probability density function of a random variable. CAPE = Real S&P Price / 10 Year Average of Real S&P 500 EPS with 2008 adjustment. Analysis is from Jan 1950 – Sep 2017. These numbers are not intended to be a prediction of how any markets will perform in the future.
24
Real 10 Year Yield (%)All 0 1 2 3 4
All 7.1 7.3 5.5 4.9 5.8 8.0
16 8.2 7.2 6.6 7.4 8.2 9.618 7.9 6.2 6.0 7.1 8.7 10.6
CAPE 20 7.7 6.0 5.5 6.5 9.0 11.924 5.7 5.4 3.4 3.9 7.3 12.528 2.5 1.8 0.4 1.1 3.6 7.230 1.5 0.1 ‐0.4 0.4 2.1 4.4

Blackstone
Real S&P 500: Next 5 Year Annualized TR (%)Conditional on Starting Valuation and Forward 5 Year Change in 10 Year Yield
Source: Robert Shiller, Standard & Poor’s, Bureau of Labor Statistics, Macrobond, BAAM analysis. Uses Kernel Density Estimation (KDE), which is a non‐parametric statistical technique to estimate the probability density function of a random variable. CAPE = Real S&P Price / 10 Year Average of Real S&P 500 EPS with 2008 adjustment. Analysis is from Jan 1950 – Sep 2017. These numbers are not intended to be a prediction of how any markets will perform in the future.
25
Forward 5 Year Change in 10 Year Yield (%)All ‐1 0 1 2 3 4
All 7.2 8.2 8.5 7.1 5.4 4.2 3.2
16 8.2 11.0 9.1 6.8 5.2 4.7 3.918 7.9 11.5 8.7 5.7 4.1 3.5 2.2
CAPE 20 7.7 11.7 8.8 5.3 3.6 2.6 0.724 5.7 8.3 7.7 5.0 3.0 1.3 ‐0.328 2.5 3.2 4.0 4.0 2.3 0.4 ‐0.830 1.5 1.9 2.5 3.0 2.1 0.2 ‐0.9

Blackstone
S&P 500: Next 1 Year Annualized TR (%)Conditional on Starting Valuation and Trailing 12m S&P 500 TR
Source: Robert Shiller, Standard & Poor’s, Bureau of Labor Statistics, BAAM analysis. Uses Kernel Density Estimation (KDE), which is a non‐parametric statistical technique to estimate the probability density function of a random variable. CAPE = Real S&P Price / 10 Year Average of Real S&P 500 EPS with 2008 adjustment. Analysis is from Dec 1880 – Sep 2017. These numbers are not intended to be a prediction of how any markets will perform in the future.
26
Trailing 12m S&P 500 TR (%)All ‐20 ‐10 0 10 20
All 10.8 13.4 12.9 10.2 8.3 10.1
8 19.0 29.9 25.2 20.1 17.1 16.010 16.9 23.7 20.1 17.1 15.7 16.412 14.4 16.7 14.7 13.4 13.2 15.214 11.4 12.4 11.8 9.7 9.2 12.116 8.9 9.8 11.0 7.7 5.9 8.4
CAPE 18 7.6 7.1 10.7 7.5 5.0 6.720 7.1 5.0 8.8 7.6 5.5 6.522 6.8 4.9 3.6 5.9 5.7 7.124 6.6 4.7 ‐1.3 3.2 5.5 7.926 6.3 ‐0.8 ‐4.3 2.0 5.4 8.828 5.1 ‐10.5 ‐9.8 1.0 5.3 9.930 2.9 ‐14.9 ‐15.3 ‐1.8 6.4 12.8
Blackstone
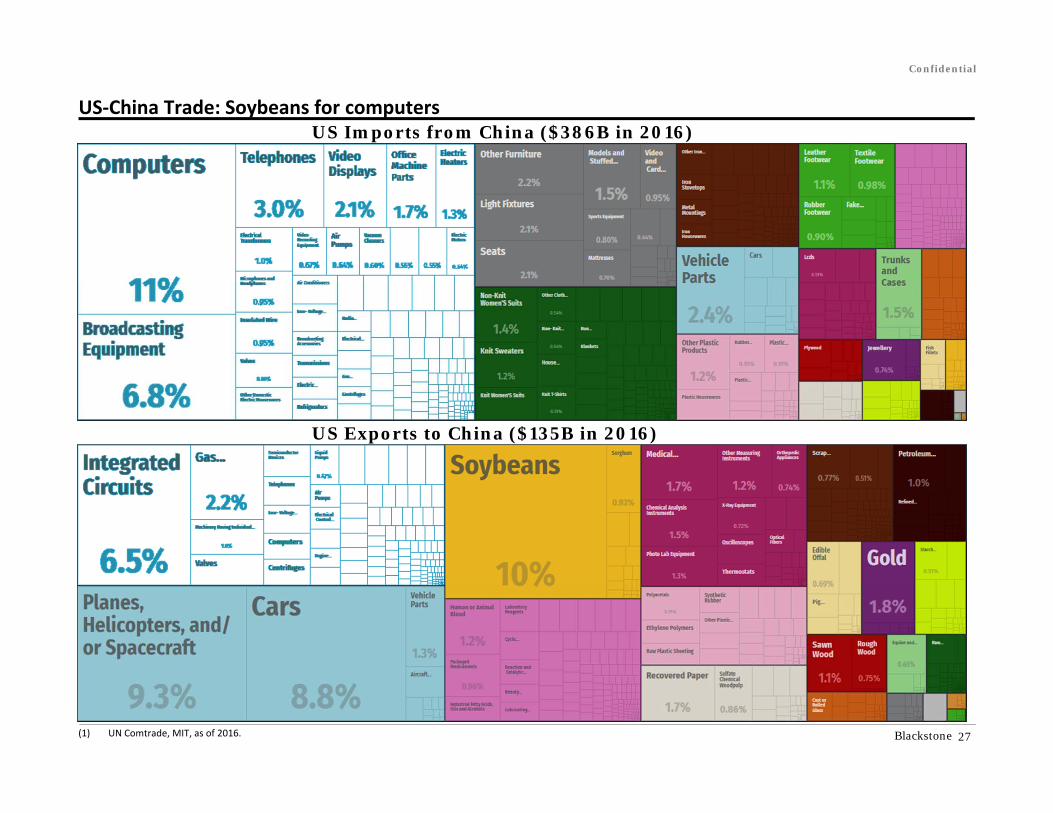
US‐China Trade: Soybeans for computers
(1) UN Comtrade, MIT, as of 2016.
US Imports from China ($386B in 2016)
US Exports to China ($135B in 2016)
27
Confidential

Blackstone
Impact of “Just A China‐US Trade War” – NOT global trade war
Favorable Unfavorable
Equity Indices• Mexico, Canada• Germany, Japan• Taiwan, Vietnam, Taiwan, Malaysia
• United States• China
Sectors
• Non‐Chinese Electronics Manufacturers• Asia ex‐China Apparel• Mexico & European Appliances,
Furniture, and Machinery• Non‐US Agriculture (Brazil, Argentina,
Australia, Canada, Russia)• Domestic Oriented US and China• Non‐US Automakers• Non‐US Aircraft manufacturers
• Chinese Electronics & ApparelManufacturers
• US Retailers• US Agriculture• US listed: tech, industrials,
materials
FX • MXN, CAD, VND, TWD, THB, MYR• EUR, JPY, CHF • CNY?
Commodities • US Steel/Aluminum, Metals, Oil? • Soy, Sorghum, Lumber
Bonds • Core Europe / Japan (on safe haven flows), US?
• Peripheral Europe, Emerging Markets (on risk aversion)
This reflects the current opinions of BAAM as of the date appearing in this material only and is not intended to be a prediction of how any financial markets will perform in the future.
28
Confidential

Blackstone
Hedge Fund Strategy Allocation Priorities
Note: Information is as of September 2018 and reflects BAAM’s opinions as of this date only. Strategy and allocation views are subject to ongoing revision. Nothing herein is intended as a prediction of how any financial markets, BAAM Fund, or underlying manager will allocate or perform in the future.
29
Add
Global Macro Diversified relative value trading on broader macro themes Quantitative Continued alpha potential with shorter
term risk‐diversifying benefit
Structured Credit / ABS
Select opportunities in niche credit and Europe
Emerging Markets
Expected dispersion across countries, more opportunities in credit
Maintain
Mortgages Select opportunities in MSRs, whole loans, RMBS and risk transfer
SpecialSituations
Focus on highly structured, credit oriented deals
Distressed Credit
Default rates remain low, sector specific stress creates opportunities
Reduce
Fundamental Equity
Prioritizing managers with potential to navigate factor exposures, and provide both long and short book alpha
Event / Activist Activist catalysts shifting towards longer‐term, BOD‐level changes
Credit Fundamental
Dislocations may provide opportunities in HY bonds and loans; valuations richer now; reallocate towards floating rate

IV. Hope Street Fund L.P.

Blackstone
Summary of LADWP’s Hedge Fund Program Objectives
(1) As provided by the LADWP Staff to BAAM.
31
LADWP’s Hedge Fund Program Objectives(1)
Enhance the Plan’s long‐term risk‐adjusted total return
Provide added diversification to the Plan’s overall investment program
Maintain a low correlation with the public global equity markets
Exhibit lower volatility than public investments for a given level of return
Absolute return orientated while also providing preservation of capital
Hedge Fund Program Objectives(1)
Return Objective 90‐day T‐Bill Index + 300bps over a full market cycle
Volatility Less than one‐third of the MSCI ACWI over 3 – 5 years
Correlation Less than or equal to 0.50 of the MSCI ACWI over 3 – 5 years
BenchmarkShort‐TermLong‐Term
HFRI FoF Conservative Index90‐day T‐Bill Index + 300bps over a full market cycle
Liquidity 75% of portfolio redeemable within 1‐Year25% of portfolio redeemable within 2‐Years
Concentration Maximum single manager position of 10% at cost or 14% at market valueMaximum new emerging manager position of 5% at cost or 7% at market value
Gross Exposure Not to exceed 400%

Blackstone
Confidential
Hope Street Fund L.P. Invests in a Diversified Group of Managers
Breadth of allocations are intended to reduce volatility and produce downside protection(1)
(1) Portfolio allocations represent the assets of the Hope Street Fund L.P. The fund is an actively managed portfolio and strategy allocations are subject to ongoing revision. There can be no assurance thatthe Fund, or any underlying manager, will achieve its objective or avoid significant losses.
(2) Data as of 10/1/2018. Estimated and unaudited.(3) As of 10/1/2018. Manager count includes only those with an allocation over 0.25%. Manager count is represented by the number of underlying vehicles in the Fund.
32
54%of fund represented by top 10 manager allocations
12strategies
28manager vehicles on a non look through basis
Portfolio Composition as of October 1, 2018AUM: $707 million(2)
Diversity Profile(3)

Blackstone
Performance(1)
(1) Certain recent performance information is estimated and unaudited. While this balance reflects all adjustments that are, in the opinion of management, based upon information currently availablenecessary for a fair presentation of the period presented, this information may be subject to a subsequent adjustment.
(2) Performance shown represents net returns for the Hope Street Fund L.P. from 10/1/2017 to 9/30/2018. Please see additional explanation at the end of this section. Results are net of all fees andexpenses. Past performance is not necessarily indicative of future results. There can be no assurance that the Fund will achieve its objective or avoid significant losses.
(3) Benchmarks of HFRI FoF Conservative Index and 90‐day T‐Bill + 3% provided by LADWP.(4) Provided at the request of LADWP. Indices are provided for illustrative purposes only. They have not been selected to represent appropriate benchmarks or targets for the Fund, but rather are disclosed
to allow for comparison of the Fund’s performance to that of well‐known and widely recognized indices. The indices will include holdings that are substantially different than investments held by theFund and do not reflect the strategy of the Fund. Comparisons to indices have limitations because indices have risk profiles, volatility, asset composition and other material characteristics that will differfrom the Fund. The indices do not reflect the deduction of fees or expenses. In the case of equity indices, performance of the indices reflects the reinvestment of dividends.
33
Hope Street
Estimated Balance on 9/30/2018 : $707,316,756
Net Returns from Initial Investment
Short‐Term Benchmark(3)
Long‐Term Benchmark(3) Indices(4)
Hope StreetGross
Hope StreetNet(2)
HFRI FoF CnsvIndex 90‐Day T‐Bill + 3% S&P 500 TR MSCI World TR
USDBarclays US Agg
Bond TR
2017(Oct‐Dec) 1.57% 1.37% 1.16% 1.05% 6.64% 5.62% 0.39%2018 3.17% 2.78% 2.65% 3.65% 10.56% 5.89% (1.60%)
January 1.28% 1.15% 1.28% 0.37% 5.73% 5.30% (1.15%)February (0.75%) (0.71%) ‐0.76% 0.37% (3.69%) (4.10%) (0.95%)March 0.01% (0.02%) 0.05% 0.39% (2.54%) (2.11%) 0.64%April 0.57% 0.51% 0.47% 0.39% 0.38% 1.21% (0.74%)May 0.40% 0.33% 0.56% 0.41% 2.41% 0.72% 0.71%June 0.22% 0.19% 0.05% 0.40% 0.62% (0.01%) (0.12%)July 0.49% 0.45% 0.12% 0.41% 3.72% 3.15% 0.02%August 0.24% 0.20% 0.31% 0.42% 3.26% 1.28% 0.64%September 0.69% 0.65% 0.48% 0.42% 0.57% 0.60% (0.64%)
YTD 2018 Net Return: 3.17% 2.78% 2.59% 3.65% 10.56% 5.89% (1.60%)Annualized Net Return: 4.79% 4.19% 3.78% 4.73% 17.91% 11.84% (1.21%)Cumulative Net Return: 4.79% 4.19% 3.78% 4.73% 17.91% 11.84% (1.21%)Std. Deviation: 1.60% 1.60% 1.70% 0.10% 8.72% 7.92% 2.16%Sharpe Ratio: 1.56 1.56 1.23 ‐ 1.86 1.28 ‐1.34Beta to Index: 0.13 0.17 ‐0.11

Blackstone
Performance
(1) Performance shown represents net returns for the Hope Street Fund L.P. from 10/1/2017 to 9/30/2018. Please see additional explanation at the end of this section. Results are net of all fees andexpenses. Past performance is not necessarily indicative of future results. There can be no assurance that the Fund will achieve its objective or avoid significant losses.
(2) Benchmarks of HFRI FoF Conservative Index provided by LADWP. Indices are provided for illustrative purposes only. They have not been selected to represent appropriate benchmarks or targets for theFund, but rather are disclosed at the request of LADWP. Comparisons to indices have limitations because indices have risk profiles, volatility, asset composition and other material characteristics thatwill differ from the Fund. The indices do not reflect the deduction of fees or expenses. In the case of equity indices, performance of the indices reflects the reinvestment of dividends.
34
1.57%
0.53%
1.19%1.43%
3.17%
4.79%
1.37%
0.41%
1.03%1.31%
2.78%
4.19%
1.16%
0.56%
1.08%0.98%
2.59%
3.78%
0.00%
1.00%
2.00%
3.00%
4.00%
5.00%
6.00%
Q4 2017 Q1 2018 Q2 2018 Q3 2018 2018 ITD
Hope Street Gross Hope Street Net HFRI FoF Consv Index(1) (2)

Blackstone
Performance Contribution by Manager – 2017 and 2018(1)
________________________________________________
(1) Managers shown on a non lookthrough basis. Allocations of less than 0.25% as of 10/1/2018 have not been included. Oct 2018 allocations as of 10/1/2018.(2) The Hope Street Fund L.P. is an actively managed portfolio and strategy allocations are subject to change(3) 2017 Returns are for the period 10/1/2017 to 12/31/17. 2018 returns are for the period 1/1/2018 to 9/30/2018. Certain recent returns are estimated and unaudited. Underlying manager performance is
shown gross of BAAM fees but net of underlying manager fees. If BAAM fees were applied, returns would be lower. See prior slides for net returns of the fund. Past performance is not necessarilyindicative of future results. There can be no assurance the funds will meet their investment objectives or avoid significant losses.
* Please refer to the end of this section for additional disclosures relating to the managers’ affiliation with Blackstone.
35
Oct 2018 YTD YTD 2017Allocations(2) Return(3) Contribution(3) Return(3)
Equity Long/ShortEquities‐FundamentalManager A 3.35% 6.03% 0.19% (2.55%)Manager B* 2.65% (1.79%) (0.05%) ‐Manager C 2.61% (4.24%) (0.12%) ‐
8.61% 0.03%Equities‐TradingManager D 3.24% 6.68% 0.20% (2.31%)Manager E 0.68% (5.19%) (0.33%) 2.63%
3.91% (0.12%)Quantitative StrategiesManager F 3.37% 9.97% 0.30% 2.55%Manager G 2.55% 6.37% 0.25% 3.12%Manager H 2.45% 2.88% 0.07% (0.68%)Manager I 2.18% 7.82% 0.14% ‐Manager J 1.13% 3.53% 0.04% ‐Manager K 0.81% 5.74% 0.04% ‐Manager L 0.54% (8.66%) (0.05%) ‐
13.03% 0.80%Arbitrage & EventCredit‐Fundamental ‐Manager M 4.45% 12.95% 0.37% ‐Manager N 2.00% (5.75%) (0.20%) ‐
6.45% 0.17%Credit‐TradingManager O 2.61% 4.68% 0.13% 0.97%
2.61% 0.13%Credit‐DistressedManager P 5.35% 4.98% 0.26% 3.06%Manager Q* 3.40% 3.17% 0.10% 1.80%Manager R 2.88% 0.41% 0.05% 1.42%
11.63% 0.42%
Oct 2018 YTD YTD 2017Allocations(2) Return(3) Contribution(3) Return(3)
EM‐CreditManager S 4.35% (4.43%) (0.21%) 1.22%
4.35% (0.21%)Structured/ABSManager T 3.72% 5.19% 0.20% ‐Manager U 3.68% 3.81% 0.13% 0.98%Manager V 3.54% 0.35% 0.01% ‐
10.94% 0.34%Residential MortgagesManager W 6.25% 8.35% 0.46% 3.38%
6.25% 0.46%Multi‐StrategyManager W* 5.22% 4.21% 0.23% 1.23%Manager Y 2.15% 3.25% 0.08% 1.80%
7.37% 0.30%Directional Trading & Fixed IncomeMacro‐Rates ‐Manager Z 13.75% 7.59% 1.11% 0.48%
13.75% 1.11%Special SituationsSpecial Situations ‐Manager AA* 3.78% (0.83%) (0.05%) 1.39%Manager AB* 2.65% 3.84% 0.06% 1.36%
6.43% 0.00%
Cash and Managers < 25 bps 4.67% ‐

Blackstone
YTD 2018 Top & Bottom Contributors(1)
(1) For the period 1/1/2018 ‐ 9/30/2018. The Fund is actively managed and strategy allocations are subject to ongoing revision. Past performance is not necessarily indicative of future results. There can beno assurance that the underlying funds will achieve their objectives or avoid significant losses. Values may not sum due to rounding. Certain recent performance is estimated and unaudited.Performance at the underlying manager level is shown net of manager fees but gross of BAAM fees, if BAAM fees were applied returns would be lower. See prior slides for the net returns of the fund.The Hope Street Fund L.P. is an actively managed portfolio and strategy allocations are subject to change
* Please refer to the end of this section for additional disclosures relating to the managers’ affiliation with Blackstone.
36
2018 YTD Top Contributors
Manager Strategy Return Contribution % 9/01/2018 Allocation
Manager Z Macro‐Rates 1.11% 13.75%
Manager W Residential Mortgages 0.46% 6.25%
Manager M Credit‐Fundamental 0.37% 4.45%
Manager F Quantitative Strategies 0.30% 3.37%
Manager P Credit‐Distressed 0.26% 5.35%
2018 YTD Bottom Contributors
Manager Strategy Return Contribution % 9/01/2018 Allocation
Manager E Equities‐Trading (0.33%) 0.68%
Manager S EM‐Credit (0.21%) 4.35%
Manager N Credit‐Fundamental (0.20%) 2.00%
Manager AC CTAs (0.15%) N/A
Manager C Equities‐Fundamental (0.12%) 2.61%

Blackstone
YTD Top Portfolio Changes(1)
(1) Shown for the period 1/1/2018 – 10/1/2018. Note that redemptions that take place on 1/1 of the beginning of the calendar year are part of prior year redemptions and are not included in YTD flows.The Hope Street Fund L.P. is an actively managed portfolio and strategy allocations are subject to ongoing revision. The above strategy definitions have been qualified to meaningfully distinguish amongvarious investment strategies and styles. BAAM's underlying managers have been categorized based on the strategy definitions to the best of BAAM's knowledge. There can be no guarantee that theunderlying managers will meet their investment objectives. Information is estimated and unaudited. Amounts redeemed/added are estimated and unaudited.
* Please refer to the end of this section for additional disclosures relating to the managers’ affiliation with Blackstone.
37
2018 Top Additions
Manager Strategy Amount Date 9/01/2018 Allocation
Manager M Credit‐Fundamental $ 29,000,000 2/18, 9/18 4.45%
Manager T Structured/ABS $ 25,000,000 1/18 3.72%
Manager V Structured/ABS $ 25,000,000 9/18 3.54%
Manager AA* Special Situations $ 22,742,254 2/18, 5/18, 8/18, 9/18, 10/18 3.78%
Manager C Equities‐Fundamental $ 19,310,000 1/18, 2/18, 7/18 2.61%
2018 Top Redemptions
Manager Strategy Amount Date 9/01/2018 Allocation
Manager E Equities‐Trading $ (22,204,715) 10/18 0.68%
Manager AD Equities‐Fundamental $ (20,141,765) 7/18 N/A
Manager L CTAs $ (10,600,759) 9/18, 10/18 0.00%
Manager G Quantitative Strategies $ (8,500,000) 7/18 2.55%
Manager AE Equities‐Fundamental $ (173,272) 4/18, 7/18, 10/18 0.00%

Blackstone
Exposure by Manager(1)
(1) Managers shown on a no lookthrough basis, with managers above 25 bps. Exposure data as of 9/30/2018.(2) Refers to the manager’s contribution to the Fund’s total gross exposure. Past performance is not necessarily indicative of future results. There can be(3) no assurance that the underlying funds will achieve their objectives or avoid significant losses.* Please refer to the end of this section for additional disclosures relating to the managers’ affiliation with Blackstone.
38
Gross Net Long Short Gross Contribution
Exposure Exposure Exposure Exposure to Fund(2)
Equity Long/ShortEquities‐FundamentalManager A 164.99% 30.73% 97.86% 67.13% 5.53%Manager B* 240.14% 8.61% 124.37% 115.76% 6.36%Manager C 662.38% 74.73% 368.56% 293.82% 17.29%
Equities‐TradingManager D 143.24% 8.86% 76.05% 67.19% 4.64%Manager E 529.00% 21.00% 275.00% 254.00% 23.91%
Quantitative StrategiesManager F 631.10% 2.70% 316.90% 314.20% 21.27%Manager G 564.30% 198.41% 381.35% 182.95% 14.38%Manager H 819.00% ‐1.00% 409.00% 410.00% 20.03%Manager I 868.35% ‐0.01% 434.17% 434.18% 18.96%Manager J 679.26% 36.80% 358.03% 321.23% 7.70%Manager K 659.20% 6.32% 332.76% 326.44% 5.34%Manager L 1239.90% 9.40% 624.65% 615.25% 6.68%
Arbitrage & EventCredit‐FundamentalManager M 129.25% 128.63% 128.94% 0.31% 5.75%Manager N 189.00% 24.20% 106.60% 82.40% 3.78%
Credit‐TradingManager O 97.83% 80.89% 89.36% 8.47% 2.56%
Credit‐DistressedManager P 346.60% 216.34% 104.10% 19.60% 4.59%Manager Q* 140.50% 98.30% 119.40% 21.10% 4.77%Manager R 121.20% 85.60% 103.40% 17.80% 3.49%
Gross Net Long Short Gross Contribution
Exposure Exposure Exposure Exposure to Fund(2)
EM‐CreditManager S 110.51% 16.97% 63.74% 46.77% 4.81%
Structured/ABSManager T 88.87% 88.87% 88.87% 0.00% 3.30%Manager U 157.01% 154.13% 155.57% 1.44% 5.78%Manager V 100.00% 100.00% 100.00% 0.00% 3.54%
Residential MortgagesManager W 172.70% 172.70% 172.70% 0.00% 9.57%
Multi‐StrategyManager W* 165.09% 96.41% 130.75% 34.34% 8.61%Manager Y 417.00% 91.00% 254.00% 163.00% 8.97%
Directional Trading & Fixed IncomeMacro‐RatesManager Z 753.74% 7.67% 380.71% 373.04% 103.61%
Special SituationsSpecial SituationsManager AA* 1045.90% 915.64% 980.77% 65.13% 9.43%Manager AB* 155.65% 94.41% 125.03% 30.62% 4.12%
Blackstone
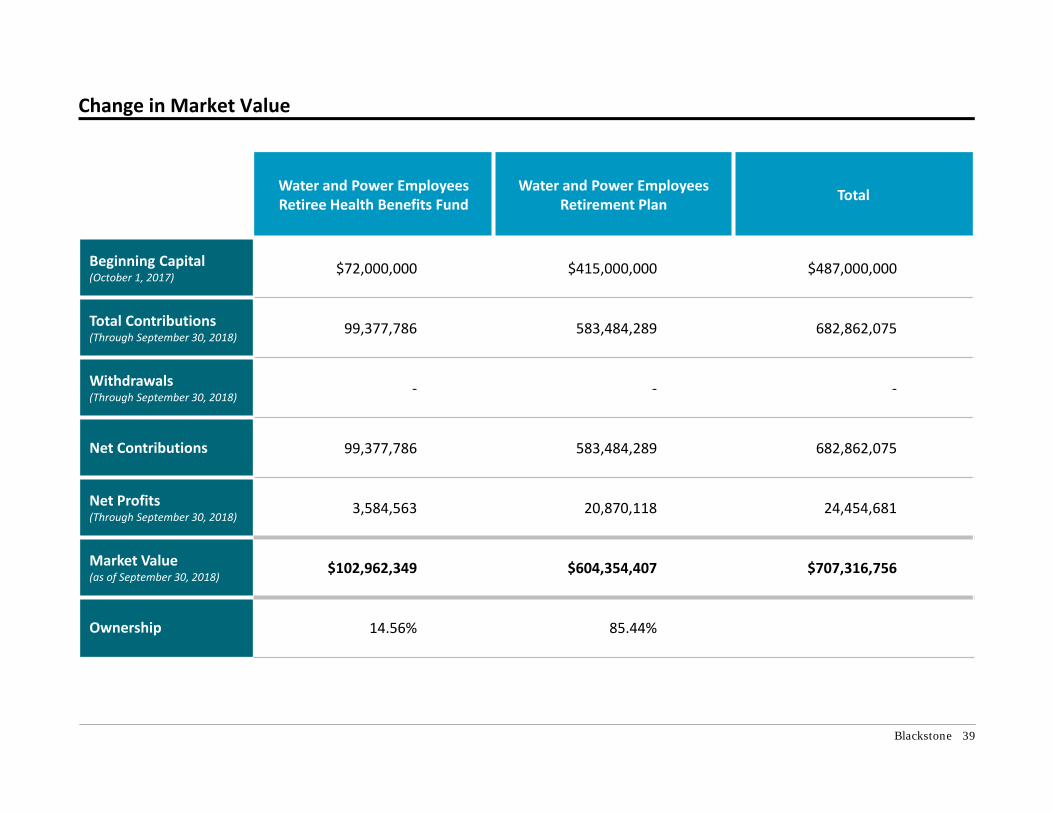
Change in Market Value
39
Water and Power Employees Retiree Health Benefits Fund
Water and Power Employees Retirement Plan Total
Beginning Capital(October 1, 2017)
$72,000,000 $415,000,000 $487,000,000
Total Contributions(Through September 30, 2018)
99,377,786 583,484,289 682,862,075
Withdrawals(Through September 30, 2018)
‐ ‐ ‐
Net Contributions 99,377,786 583,484,289 682,862,075
Net Profits(Through September 30, 2018)
3,584,563 20,870,118 24,454,681
Market Value (as of September 30, 2018)
$102,962,349 $604,354,407 $707,316,756
Ownership 14.56% 85.44%

Blackstone
Hope Street Fund L.P. – Investment Guidelines as of September 30, 2018
1. Capitalized terms used but not defined herein shall have the meaning given to such terms in the Limited Partnership Agreement of Hope Street Fund L.P., dated October 1, 2017.2. This analysis presents what percentage of Hope Street Fund L.P. (the "Fund") may be redeemed each period based on the assumptions below. Blackstone Alternative Asset Management L.P. ("BAAM") does not guarantee that the
hypothetical liquidity schedule depicted here will accurately reflect actual realized liquidity. Please note this analysis reflects the liquidity of the Fund's portfolio in the ordinary course of business and does not account for any liquidity restrictions of the Fund and any applicable feeder funds, as detailed in the respective fund documents. Certain of the data presented here is based on information obtained or derived from the underlying managers. BAAM does not guarantee the accuracy and completeness of such information. Note that the use of alternate assumptions may yield different results.
ASSUMPTIONS: All redemption notices are submitted to underlying managers on 10/01/2018.Allocation percentages are calculated on the Fund's net asset value as of 10/01/2018. Cash held at the Fund level is redeemable monthly. Time served under lock‐up and investor‐level gates are factored into the analysis, but the analysis assumes underlying managers will not apply fund or share class level gates.
The above does not include the effect of notice periods or initial lock‐ups of one year or less.The Fund will not pay a fee to redeem (i) more frequently, (ii) during a soft lock‐up or (iii) above an investor‐level gate.Note: The data presented above is based on information obtained from the underlying managers. BAAM does not guarantee the accuracy and completeness of such information. Historical data is reported by each manager and may not be calculated in a uniform or consistent basis with other managers. All information is subject to change. BAAM funds are actively managed and allocations are subject to ongoing revision.
40
Investment Guidelines(1) Concentration Compliant
Blackstone Affiliation:
Max 30% of the NAV of the Partnership invested in Blackstone Affiliated Funds, Blackstone InterestFunds and BAAM Multi‐Manager Funds for which the Founding Limited Partners bear investmentmanagement fees or incentive fees to the Investment Manager or any of its Affiliates at the BAAMMulti‐Manager Fund level.
11.32%
Investment Strategy:
Max 40% of the NAV of the Partnership invested in any one investment strategy. 13.82%
Max 40% of the NAV of the Partnership invested in Portfolio Funds primarily focused on commodities,currencies, or financial futures. 15.94%
Liquidity(2):
Min 85% of the NAV of the Partnership redeemable within 1 year. 94.04%
100% of the NAV of the Partnership redeemable within 2 years, excluding BSOF. 100.00% Borrowing:
Borrowing or other fund raising shall be limited to 5% of the NAV of the Partnership. 0.00%

Blackstone
Hope Street Fund L.P. – Investment Guidelines as of September 30, 2018 (Cont’d)
1. Capitalized terms used but not defined herein shall have the meaning given to such terms in the Limited Partnership Agreement of Hope Street Fund L.P., dated October 1, 2017.ASSUMPTIONS:
All redemption notices are submitted to underlying managers on 10/01/2018.Allocation percentages are calculated on the Fund's net asset value as of 10/01/2018. Cash held at the Fund level is redeemable monthly. Time served under lock‐up and investor‐level gates are factored into the analysis, but the analysis assumes underlying managers will not apply fund or share class level gates.
The above does not include the effect of notice periods or initial lock‐ups of one year or less.The Fund will not pay a fee to redeem (i) more frequently, (ii) during a soft lock‐up or (iii) above an investor‐level gate.Note: The data presented above is based on information obtained from the underlying managers. BAAM does not guarantee the accuracy and completeness of such information. Historical data is reported by each manager and may not be calculated in a uniform or consistent basis with other managers. All information is subject to change. BAAM funds are actively managed and allocations are subject to ongoing revision.
41
Portfolio Guidelines(1) Concentration Compliant
Max underlying manager concentration: 10% at cost 5.34%
Max underlying manager concentration: 14% at market value 5.57%
Max underlying investment in new or emerging managers: 5% at cost N/A
Max underlying investment in new or emerging managers: 7% at market value N/A
Max total gross leverage: 400% 353.36%

A. Appendix

Blackstone
Key Contacts for LADWP
43
Client Coverage
Brad RudnerManaging Director, Global Head of Business Strategy
345 Park AvenueNew York, NY 10054212‐583‐5508
Bobby McGannAssociate, Investor Relations and Business Development
345 Park AvenueNew York, NY 10054212‐390‐2453
Portfolio Management
Alberto SantulinManaging Director
345 Park AvenueNew York, NY 10054212‐583‐5143

Blackstone
Confidential
44
Additional Disclosures Relating to Fee Savings
The calculation of underlying manager negotiated fee savings for BAAM’s Flagship Fund is based on the following assumptions. Fee savings will vary(potentially significantly) if assumptions are varied. Alternative assumptions will be applied upon request. The gross manager return assumptionsdo not represent a target or expected return for the fund/portfolio in question and do not reflect BAAM fees (which will materially reduce returns toinvestors).
• Static portfolio based on full look-through allocations and negotiations completed as of 7/1/2018• In instances where the negotiated deal includes a fee schedule with asset thresholds, the calculation assumes BAAM is receiving the top threshold or
maximum potential fee savings. There is no assurance that the top threshold will be met or maintained. If not met, a portion of the potential savings willnot be realized.
• The calculation ignores incentive fee hurdles and high water marks.• Exclusive fee savings represent negotiated fee savings available exclusively to BAAM.
1. Additional Assumptions Relating to Estimated Annual Potential Savings:
• The estimated underlying manager fee savings represent the estimated dollar savings as a percentage of current NAV.• The gross manager return assumptions do not represent a target or expected return for the fund/portfolio in question and do not reflect underlying manager
or BAAM fees (which will materially reduce returns to investors). Fee savings will vary (potentially significantly) depending on the actual returns of theunderlying funds; alternative return assumptions will be applied at your request.
• Management fee savings based on estimated average AUM over the period reflecting alternative assumed performance (see above).
Use of alternate assumptions could yield materially different results. Different assumptions will be applied at your request.
The data presented above is based on information obtained or derived from the underlying managers. BAAM does not guarantee the accuracy and completeness of such information. Historical data of managers is as reported by the given manager and may not be calculated in a uniform or consistent basis with information of other managers and all information is subject to change. Please consult your own third party advisors before making any investment decisions based on this information.
Assumed Gross Return of Underlying Manager12.00% 8.00% 4.00% 0.00%
Total Fee Savings 0.52% 0.45% 0.38% 0.31%Management Fee Savings 0.32% 0.32% 0.31% 0.31%
Performance Fee Savings 0.20% 0.13% 0.07% 0.00%

Blackstone
Disclaimer
45
*The Fund allocates to investment managers in which affiliates of Blackstone Alternative Asset Management L.P. (“BAAM”) own equity interests. These equity interests range from a minority stake to 100% ownership. An investment with such managers would benefit Blackstone and a withdrawal from such managers would be detrimental to Blackstone. Please refer to the Fund’s Private Placement Memorandum for additional information regarding BAAM’s potential conflicts of interest.

Blackstone
Confidential
46
Important Disclosure InformationThe materials contained herein are for informational purposes only and do not constitute an offer to sell or a solicitation of an offer to purchase any interest in any private investment vehicles (the“Blackstone Funds”) managed by Blackstone Alternative Asset Management L.P. or any of its investment advisory affiliates (together, “Blackstone”). Any such offer of the Blackstone Funds is exempt fromregistration with the SEC and shall be made only pursuant to the confidential private placement memorandum for a Blackstone Fund (“PPM”), which qualifies in its entirety the information set forth hereinand contains a description of the risks of investing. These materials are also qualified by reference to the governing documents and the subscription agreement relating to the relevant Blackstone Fund(collectively, the “Agreements”). The PPM and Agreements relating to a Blackstone Fund have not been reviewed or approved by the SEC and should be reviewed carefully by all prospective investors priorto an investment in that Fund. The Blackstone Funds are speculative and involve a high degree of risk and may be offered only to investors who meet minimum financial requirements and for whom theinvestment is otherwise suitable. Prospective investors may not rely on any information contained in these materials in determining whether to invest in a Blackstone Fund.
In connection with your consideration of an investment in any Blackstone Funds, you should be aware of the following risks (Please see the Offering Memorandum for a summary of additional risks):
The Blackstone Funds may be leveraged and their portfolios may lack diversification, thereby increasing the risk of loss. Many of the Blackstone Funds may invest in instruments that are illiquidand difficult to value, which may limit an investor's ability to redeem or transfer its investment or delay receipt of redemption proceeds. The Blackstone Funds are speculative, involve a highdegree of risk and their performance may be volatile. An investor may lose some or all of its investment. Blackstone has total investment authority over the Blackstone Funds. There is nosecondary market for investors’ interests in the Blackstone Funds. There are restrictions on withdrawal and transfer of interests in the Blackstone Funds. The Blackstone Funds’ fees and expenses,and those of any underlying funds or managers, are substantial and will negatively impact performance.
Investments in the Blackstone Funds are not subject to the same regulatory requirements or governmental oversight as mutual funds. Blackstone Funds and their underlying managers maypurchase instruments that are traded on exchanges located outside the United States that are “principal markets” and are subject to the risk that the counterparty will not perform. Furthermore,since there may be government supervision and regulation of foreign exchanges, Blackstone Funds and their underlying managers are also subject to the risk of the failure of the exchanges andthere may be a higher risk of financial irregularities and/or lack of appropriate risk monitoring and controls.
Investors in Blackstone funds are entitled to receive limited pricing and valuation information and generally will have limited rights with respect to their investment interest, including limitedvoting rights and no participation in the management of the Funds.
Investment in any of the Blackstone Funds is only suitable for sophisticated investors for which such an investment does not constitute a complete investment program and which fully understandand are willing to assume the risks involved in such Funds. We strongly encourage Investors to obtain independent advice from their own investment tax, accounting and legal advisers regardingany investment in any Blackstone Fund. Investors are also urged to take appropriate advice regarding any applicable legal requirements and any applicable taxation and exchange controlregulations in the country of their citizenship, residence or domicile which may be relevant to the subscription, purchase, holding, exchange, redemption or disposal of any Blackstone Funds.Blackstone Funds may involve complex tax and legal structures.
The past performance of any Blackstone Fund is not necessarily indicative of future results. There can be no assurance that any Blackstone Fund or any of its underlying investments will achievetheir objectives or avoid significant losses. There is no publically available performance information source for Blackstone Funds. Further details on the performance of these funds is available onrequest.
Blackstone has fiduciary and contractual obligations to a significant number of funds and accounts (“Blackstone Clients”), some of which have overlapping investment guidelines and mandates andtherefore compete for limited capacity. If an investment opportunity is appropriate for more than one Blackstone Client, Blackstone intends to allocate such opportunity in accordance withBlackstone’s allocation procedures, which take into account various investment criteria, such as the relative amounts of capital available for investments, relative exposure to market trends,investment objectives, liquidity, diversification, contractual restrictions and similar factors.
This document contains highly confidential information regarding Blackstone's investments, strategy and organization. Your acceptance of this document from Blackstone constitutes your agreement to (i)keep confidential all the information contained in this document, as well as any information derived by you from the information contained in this document (collectively, "Confidential Information") and notdisclose any such Confidential Information to any other person, (ii) not use any of the Confidential Information for any purpose other than to consider investing in, or monitor investments in, BlackstoneFunds, (iii) not use the Confidential Information for purposes of trading any security, including, without limitation, securities of Blackstone or its portfolio companies, (iv) not copy this document without theprior consent of Blackstone, and (v) promptly return this document and any copies hereof to Blackstone upon Blackstone's request. The use of the Confidential Information also is subject to theconfidentiality provisions set forth in the Agreements and in any other written agreement between the recipient and Blackstone.
ERISA Fiduciary Disclosure:The forgoing information has not been provided in a fiduciary capacity under ERISA, and it is not intended to be, and should not be considered as, impartial investment advice.


![Statement of Asof @ffi]](https://img.pdfslide.us/doc/110x75/62323b9cf8ec8a0dfe5dbabb/statement-of-asof-ffi.jpg)