Embed Size (px)
Citation preview
Confidence Estimation for Machine Translation
J. Blatz et.al,Coling 04
SSLI MTRG 11/17/2004
Takahiro Shinozaki
Abstract
Detailed study of CE for machine translation Various machine learning methods CE for sentences and for words Different definitions of correctness
Experiments NIST 2003 Chinese-to-English MT
evaluation
1 Introduction
CE can improve usability of NLP based systems
CE techniques is not well studied in Machine translation
Investigate sentence and word level CE
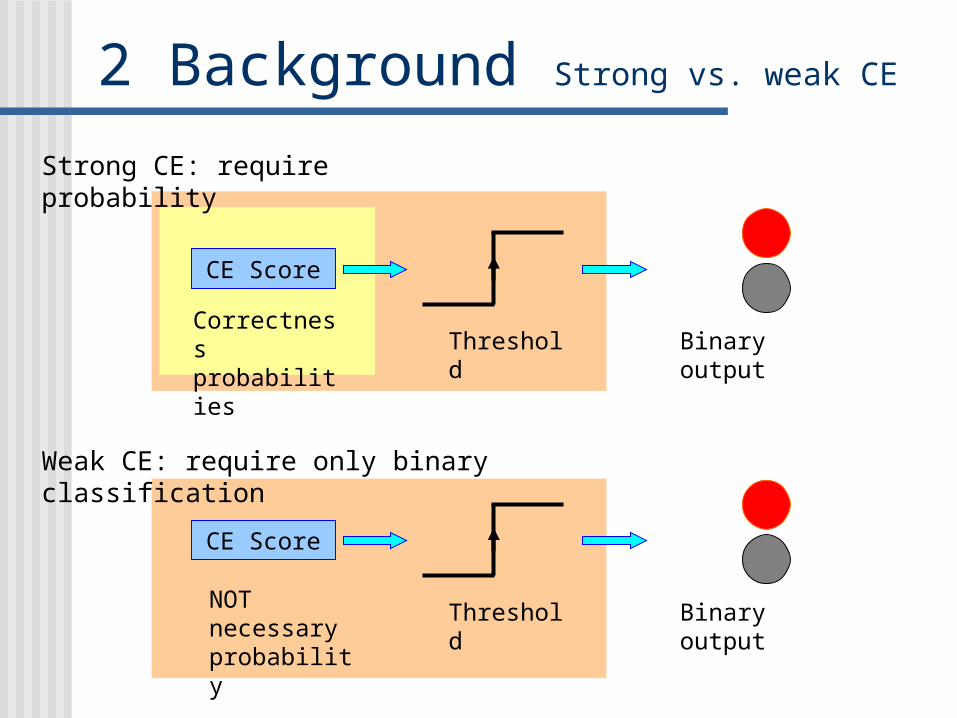
2 Background Strong vs. weak CE
CE Score
Threshold Binary output
CE Score
Threshold Binary outputCorrectness probabilities
Strong CE: require probability
Weak CE: require only binary classification
NOT necessary probability
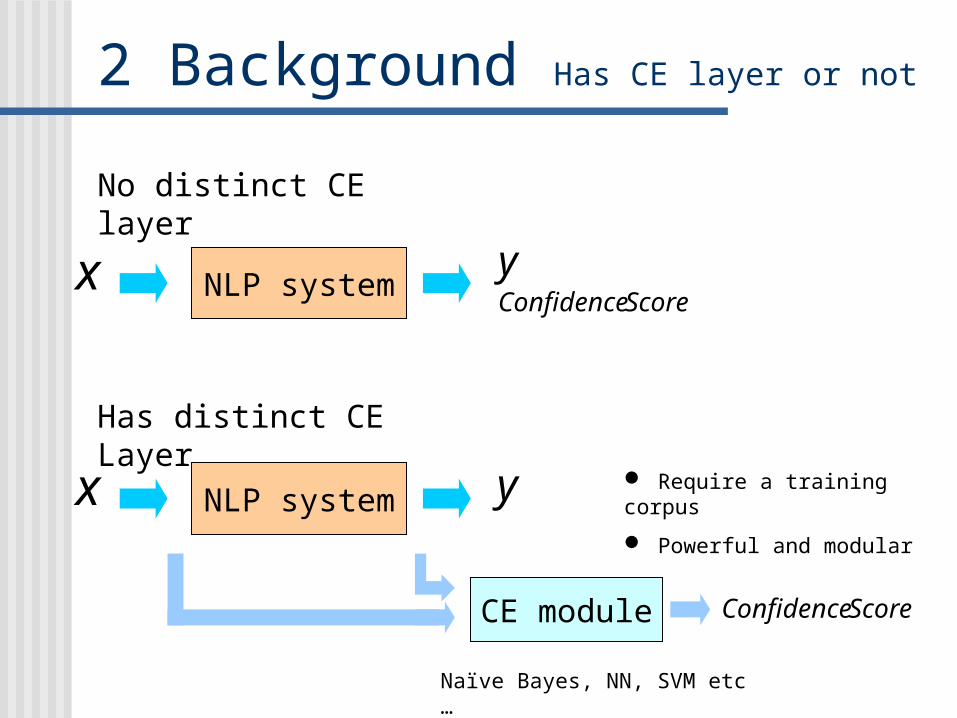
2 Background Has CE layer or not
No distinct CE layer
Has distinct CE Layer
NLP systemx y
NLP systemx y
CE module ScoreConfidence
ScoreConfidence
Naïve Bayes, NN, SVM etc…
Require a training corpus
Powerful and modular
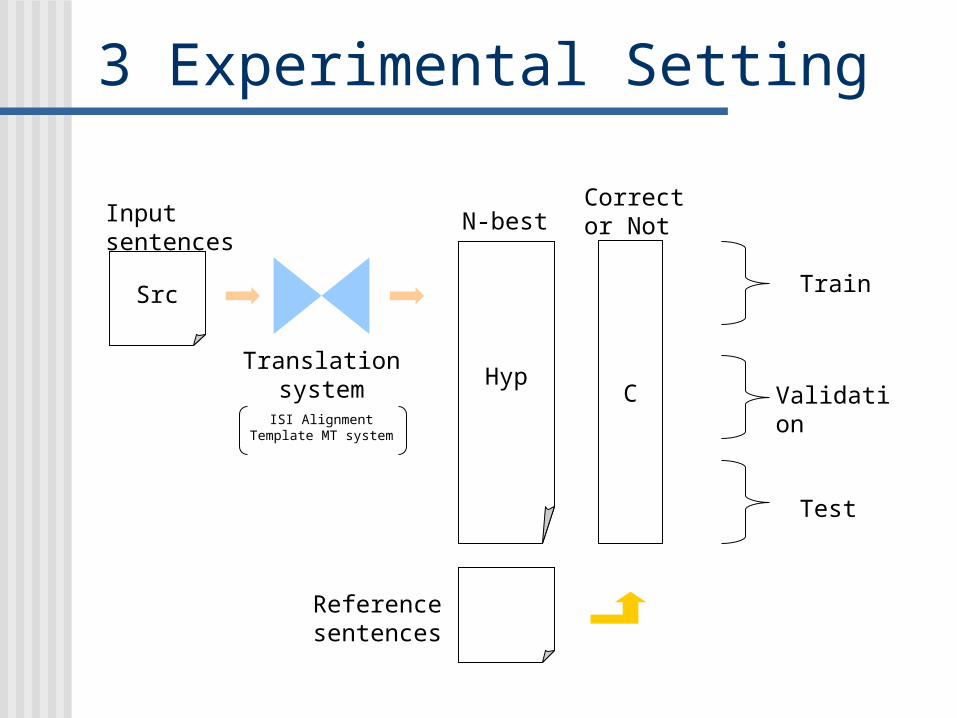
3 Experimental Setting
Src
Hyp
Input sentences
Translation system
ISI Alignment Template MT system
N-best
Validation
Train
Test
Reference sentences
C
Correct or Not
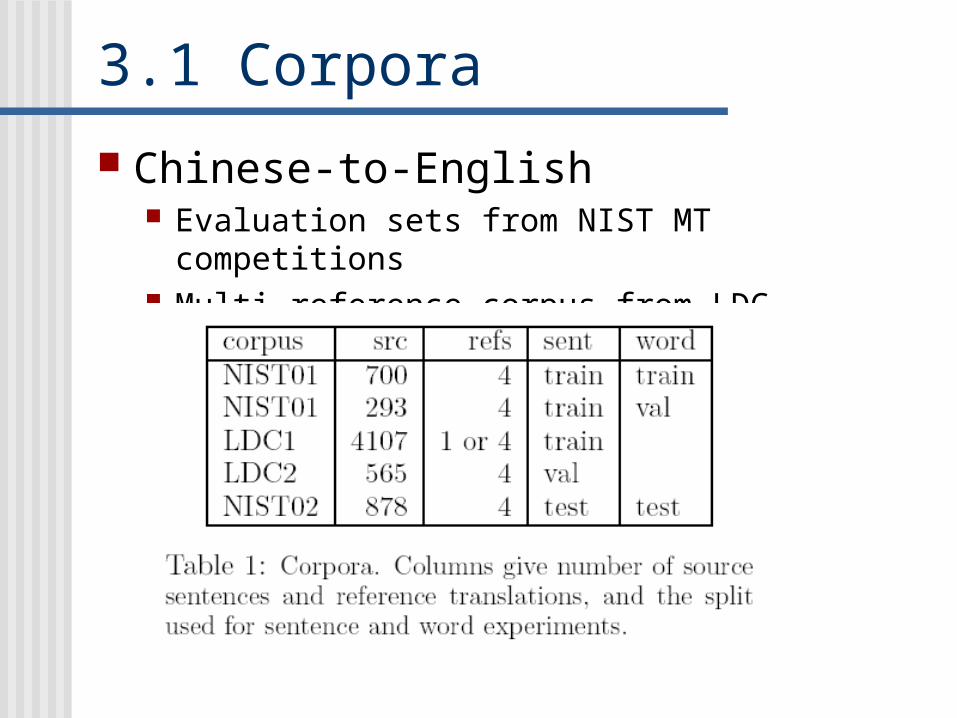
3.1 Corpora Chinese-to-English
Evaluation sets from NIST MT competitions Multi reference corpus from LDC
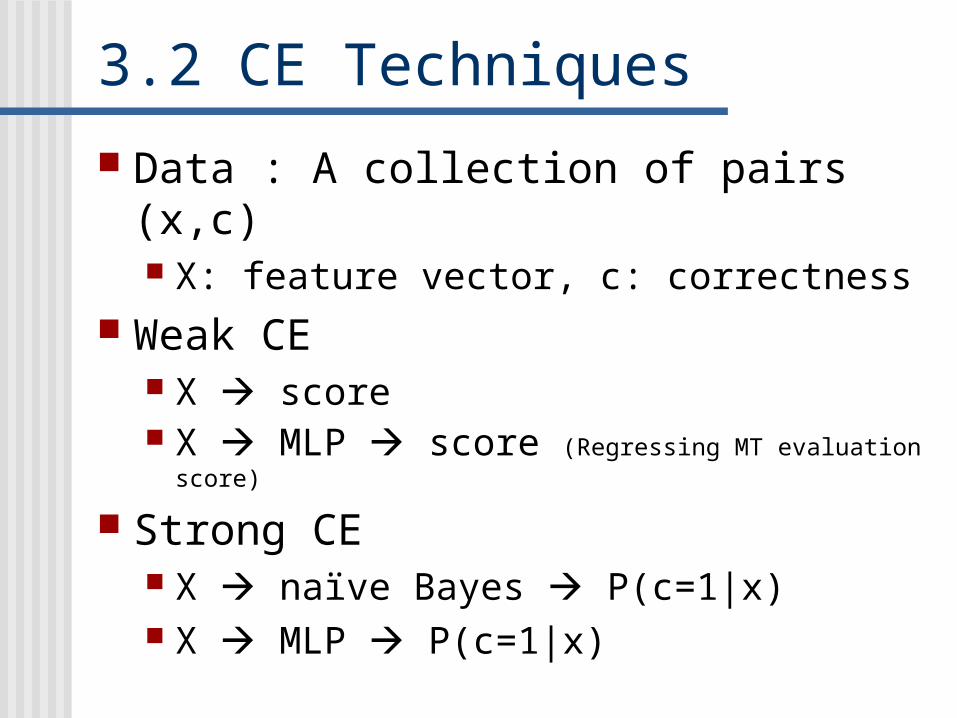
3.2 CE Techniques Data : A collection of pairs (x,c)
X: feature vector, c: correctness Weak CE
X score X MLP score (Regressing MT evaluation score)
Strong CE X naïve Bayes P(c=1|x) X MLP P(c=1|x)
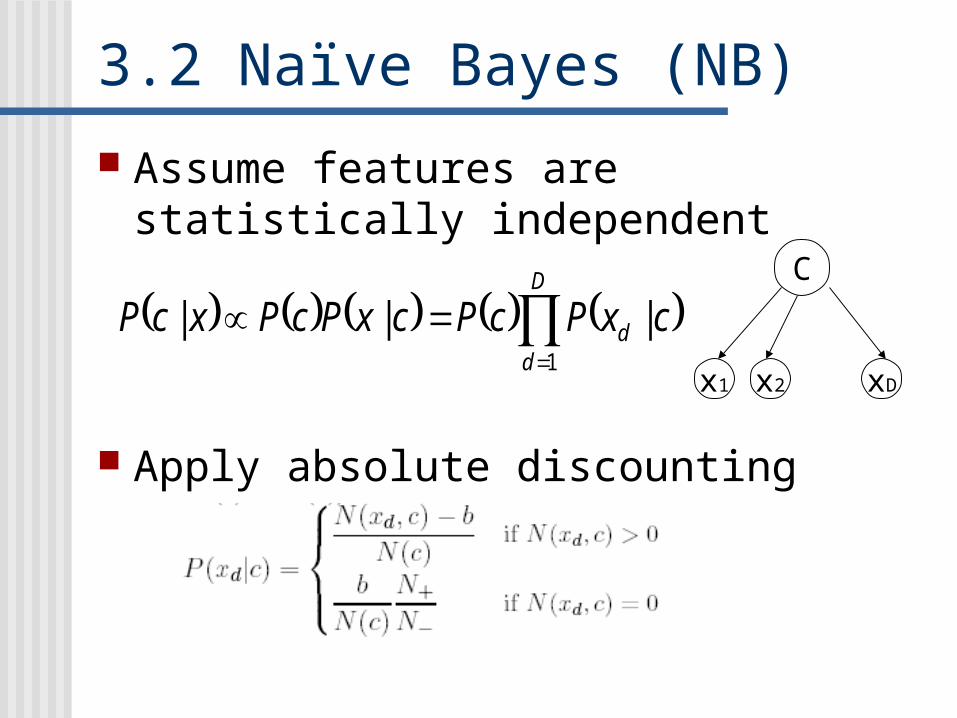
3.2 Naïve Bayes (NB) Assume features are statistically
independent
Apply absolute discounting
D
dd cxPcPcxPcPxcP
1
|||C
x1 x2 xD
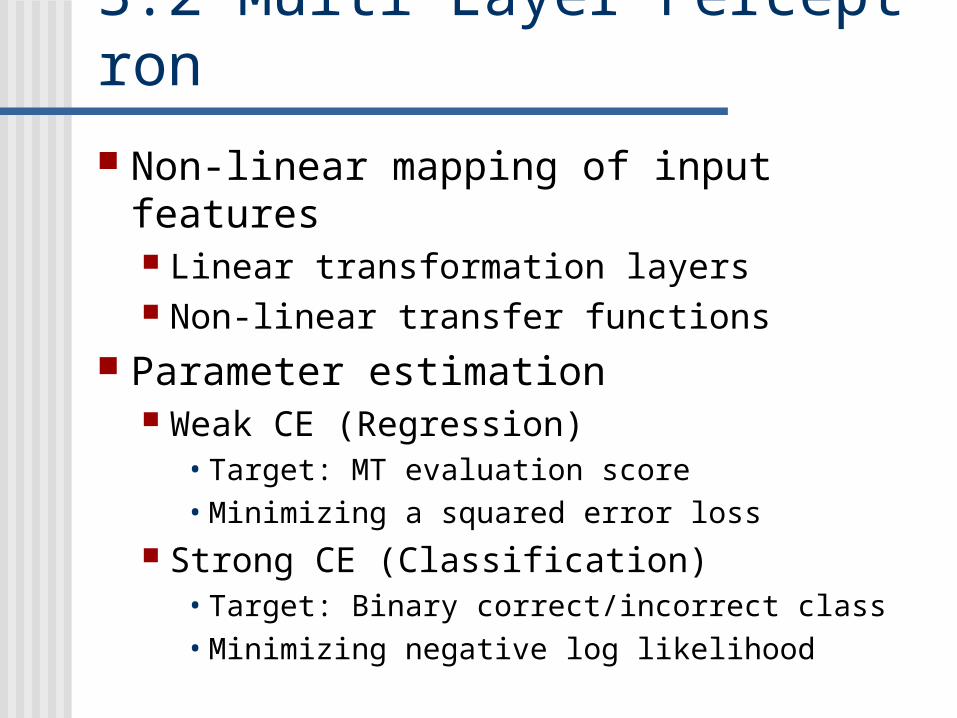
3.2 Multi Layer Perceptron Non-linear mapping of input features
Linear transformation layers Non-linear transfer functions
Parameter estimation Weak CE (Regression)
• Target: MT evaluation score• Minimizing a squared error loss
Strong CE (Classification)• Target: Binary correct/incorrect class• Minimizing negative log likelihood
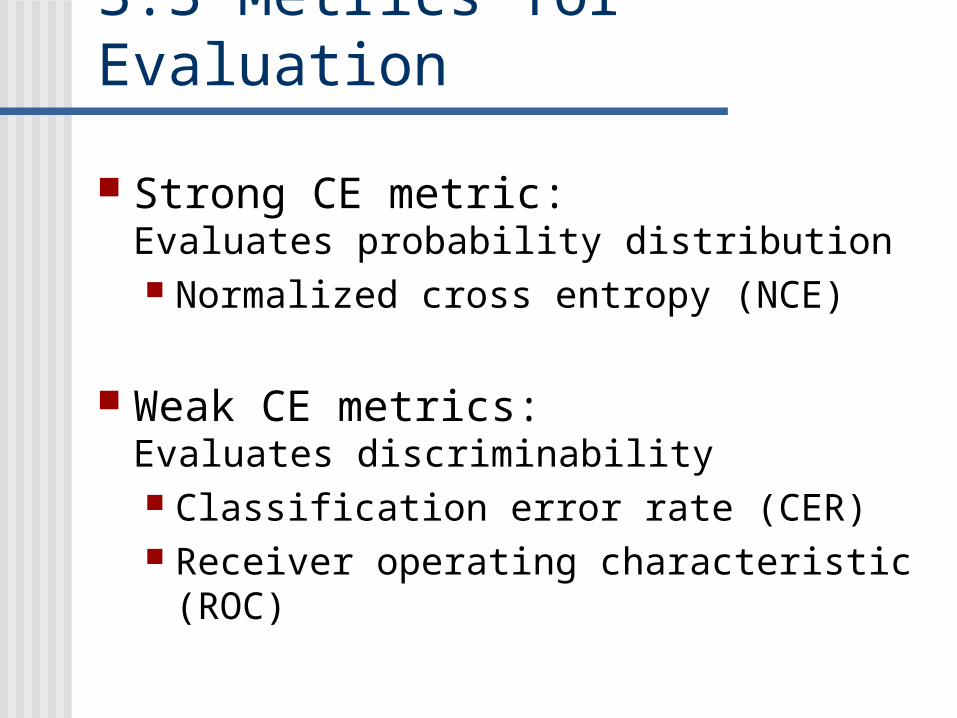
3.3 Metrics for Evaluation
Strong CE metric:Evaluates probability distribution Normalized cross entropy (NCE)
Weak CE metrics:Evaluates discriminability Classification error rate (CER) Receiver operating characteristic (ROC)
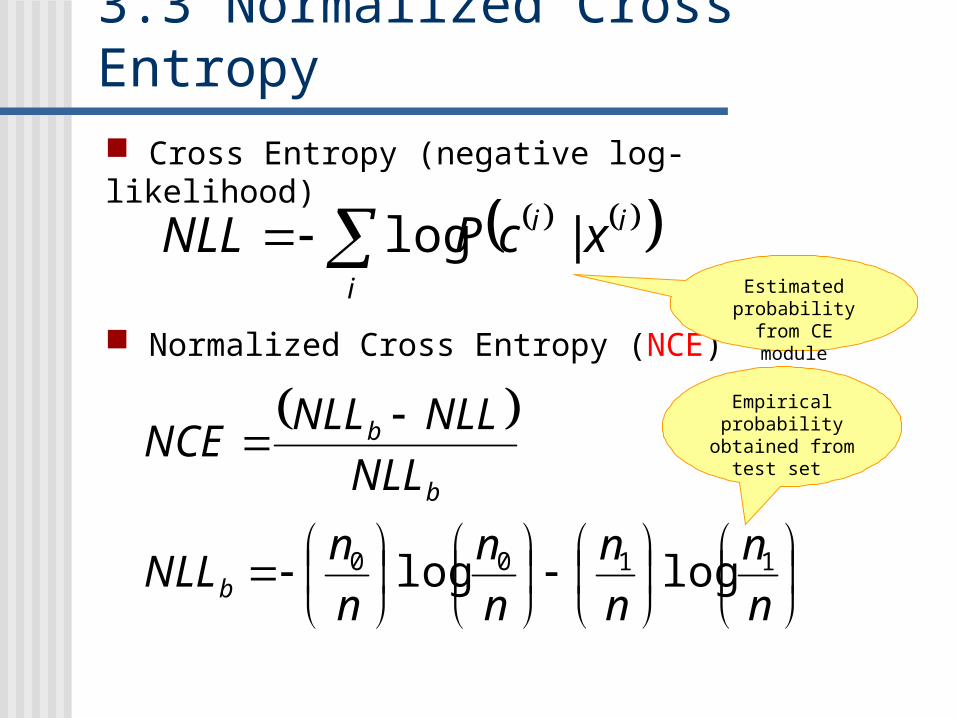
3.3 Normalized Cross Entropy Cross Entropy (negative log-likelihood)
i
ii xcPNLL |log
Normalized Cross Entropy (NCE)
n
n
n
n
n
n
n
nNLL
NLL
NLLNLLNCE
b
b
b
1100 loglog
Estimated probability from
CE module
Empirical probability
obtained from test set
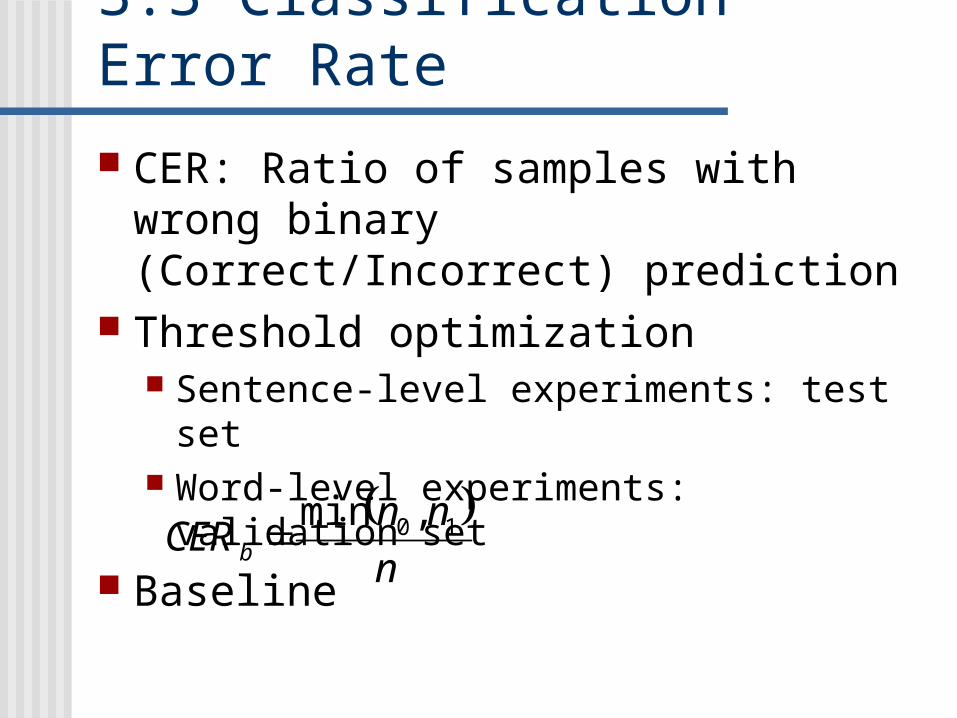
3.3 Classification Error Rate
CER: Ratio of samples with wrong binary (Correct/Incorrect) prediction
Threshold optimization Sentence-level experiments: test set Word-level experiments: validation set
Baseline n
nnCERb
10 ,min
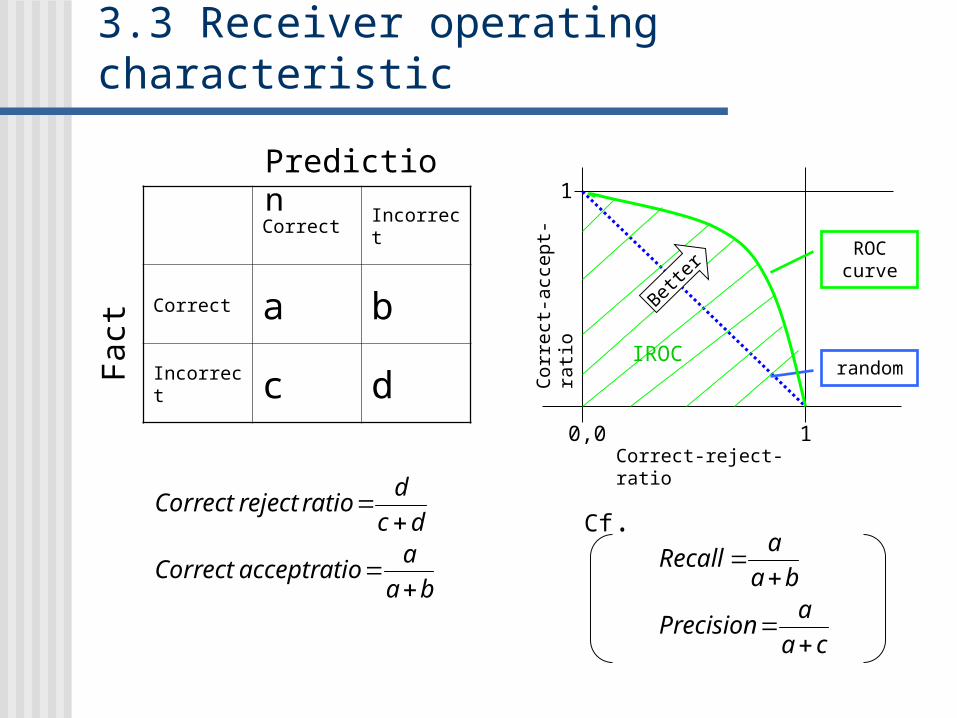
3.3 Receiver operating characteristic
Correct Incorrect
Correct a b
Incorrect c d
Prediction
Fact
ba
aratioacceptCorrect
dc
dratiorejectCorrect
ca
aPrecision
ba
aRecall
Cf.
0,0 1
1
random
ROC curve
IROC
Bette
r
Correct-reject-ratio
Corr
ect
-acc
ept-
rati
o
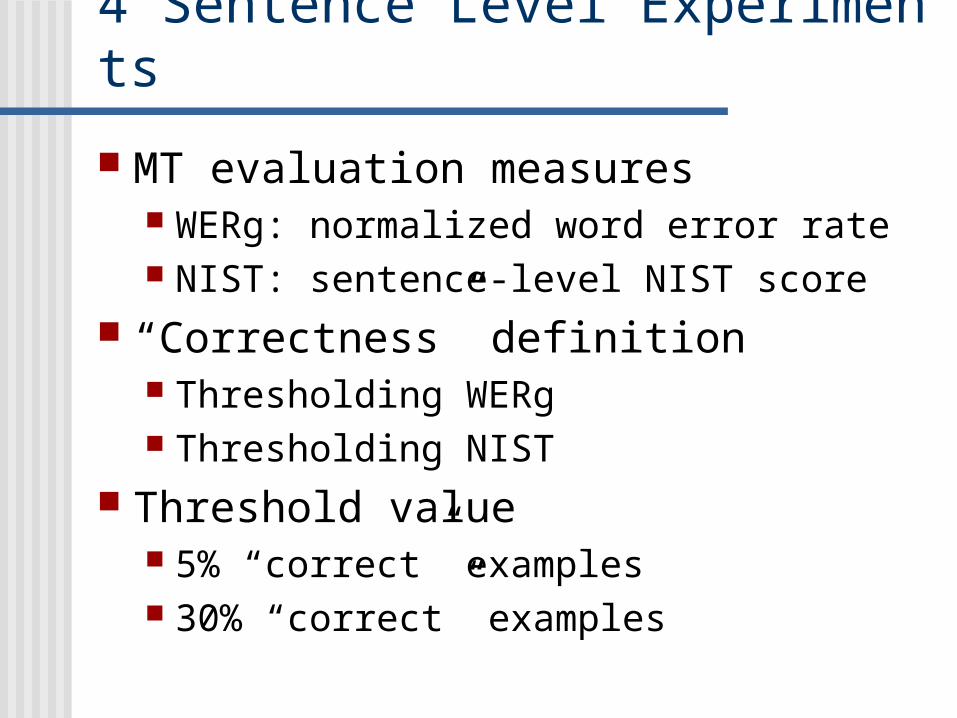
4 Sentence Level Experiments
MT evaluation measures WERg: normalized word error rate NIST: sentence-level NIST score
“Correctness” definition Thresholding WERg Thresholding NIST
Threshold value 5% “correct” examples 30% “correct” examples
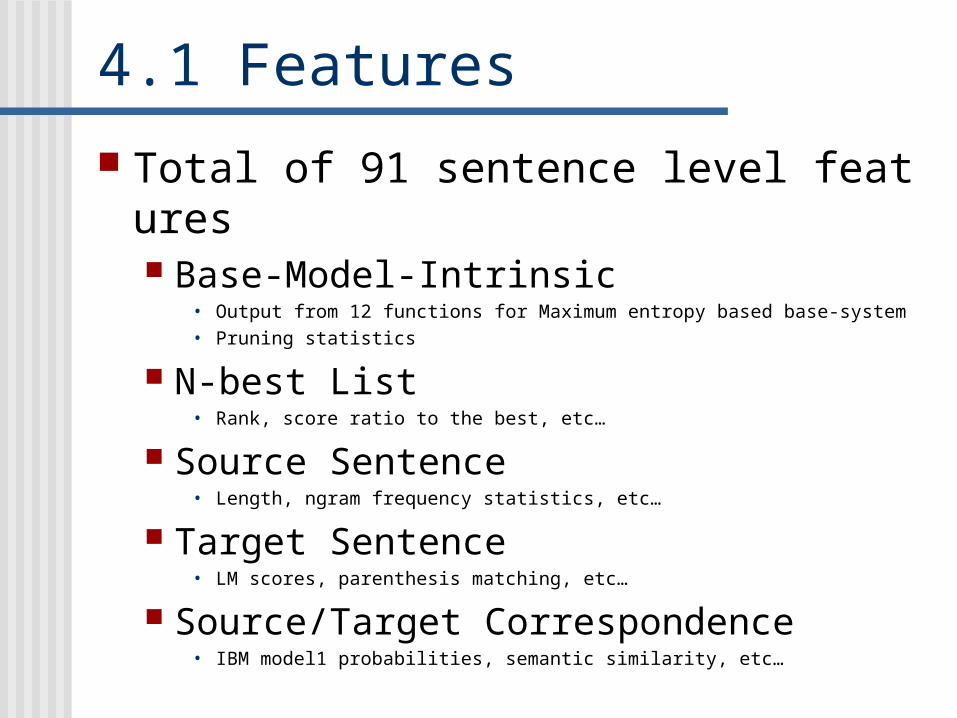
4.1 Features
Total of 91 sentence level features Base-Model-Intrinsic
• Output from 12 functions for Maximum entropy based base-system• Pruning statistics
N-best List• Rank, score ratio to the best, etc…
Source Sentence• Length, ngram frequency statistics, etc…
Target Sentence• LM scores, parenthesis matching, etc…
Source/Target Correspondence• IBM model1 probabilities, semantic similarity, etc…
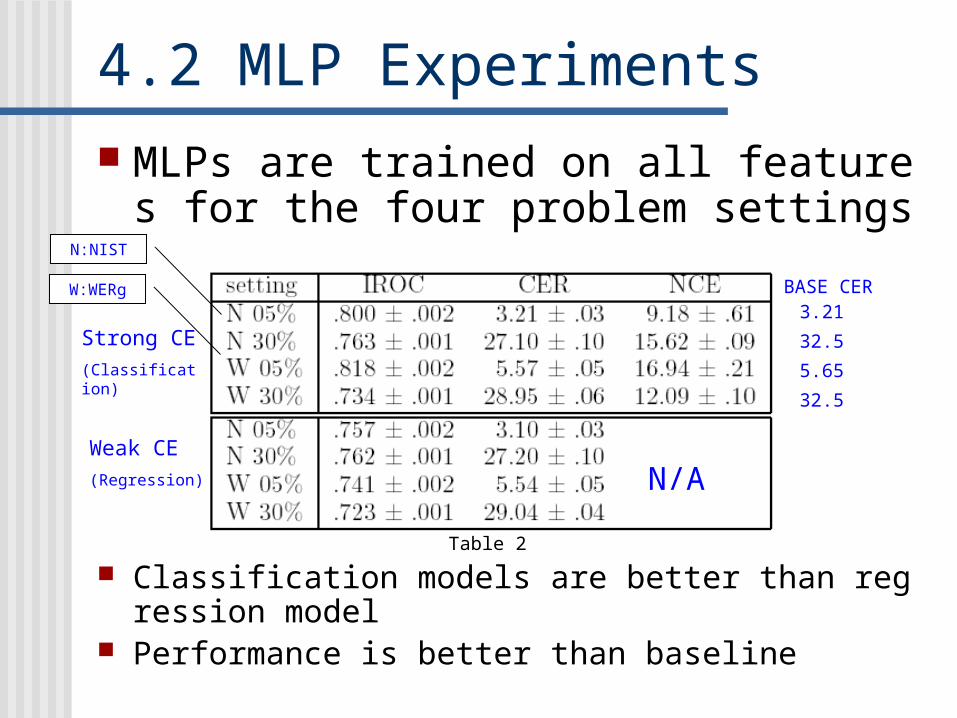
4.2 MLP Experiments MLPs are trained on all features for the fo
ur problem settings
Classification models are better than regression model Performance is better than baseline
Strong CE(Classification)
Weak CE(Regression) N/A
BASE CER3.21
32.5
5.65
32.5
N:NIST
W:WERg
Table 2
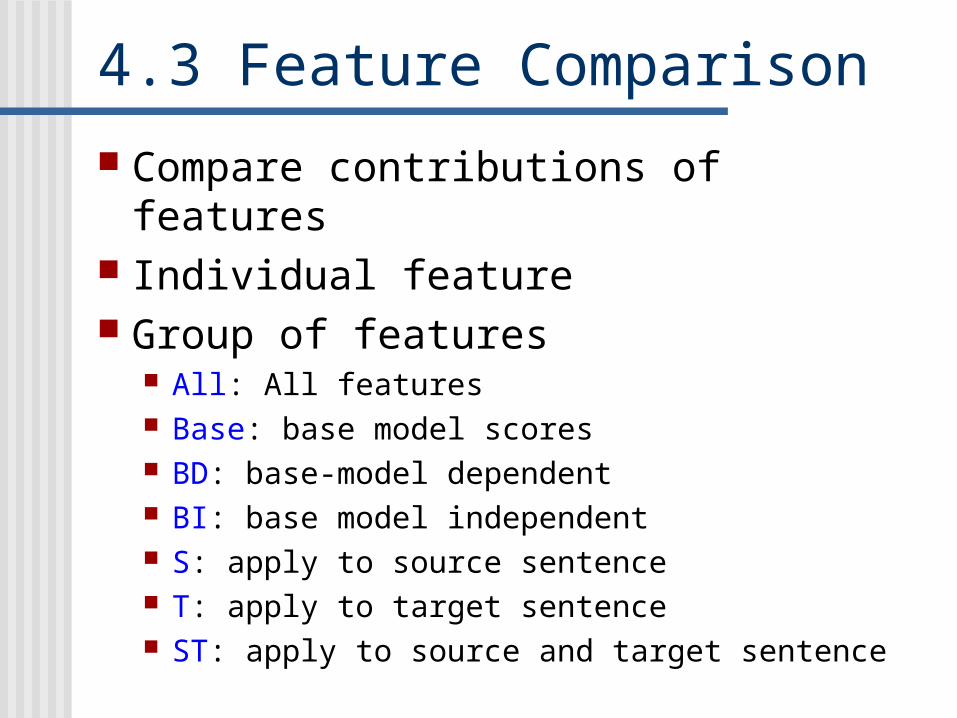
4.3 Feature Comparison
Compare contributions of features Individual feature Group of features
All: All features Base: base model scores BD: base-model dependent BI: base model independent S: apply to source sentence T: apply to target sentence ST: apply to source and target sentence
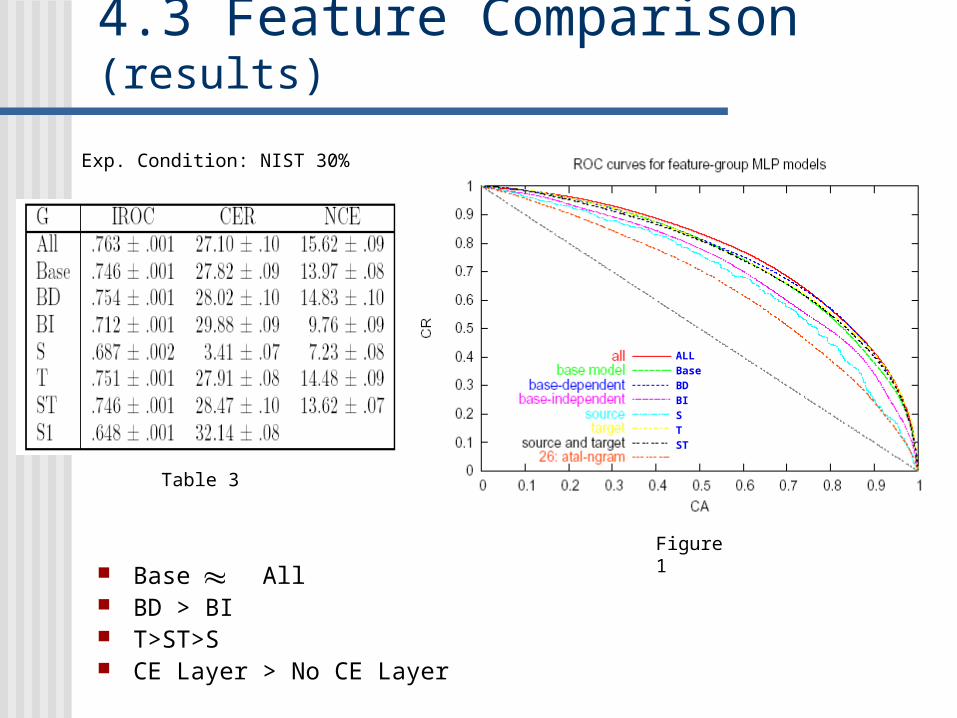
4.3 Feature Comparison (results)
Base All BD > BI T>ST>S CE Layer > No CE Layer
ALLBaseBDBISTST
Table 3
Figure 1
Exp. Condition: NIST 30%
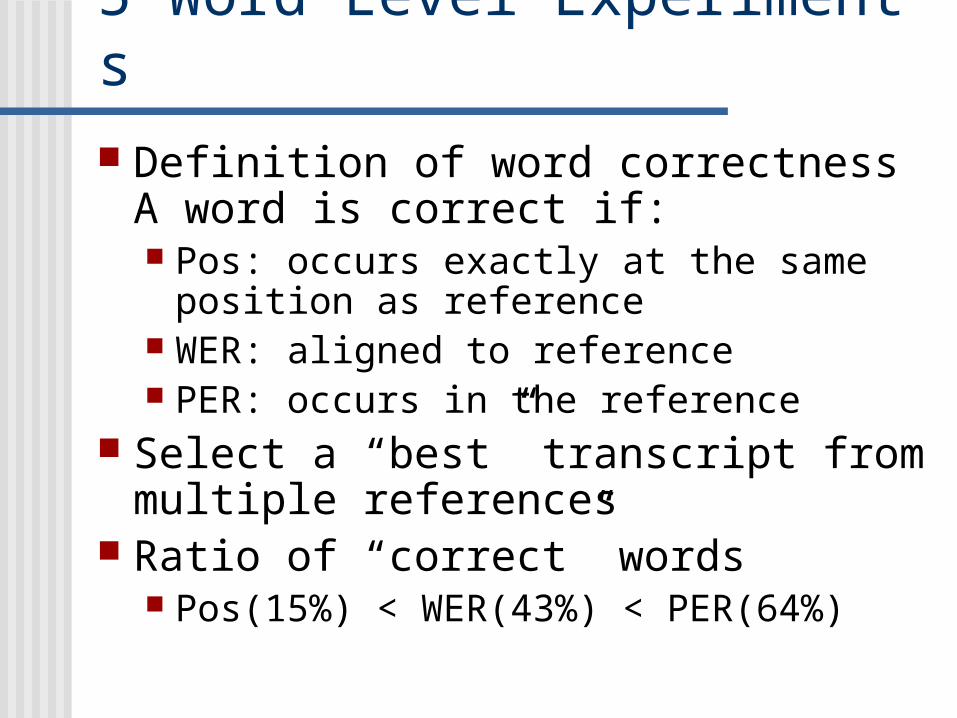
5 Word Level Experiments Definition of word correctness
A word is correct if: Pos: occurs exactly at the same position
as reference WER: aligned to reference PER: occurs in the reference
Select a “best” transcript from multiple references
Ratio of “correct” words Pos(15%) < WER(43%) < PER(64%)
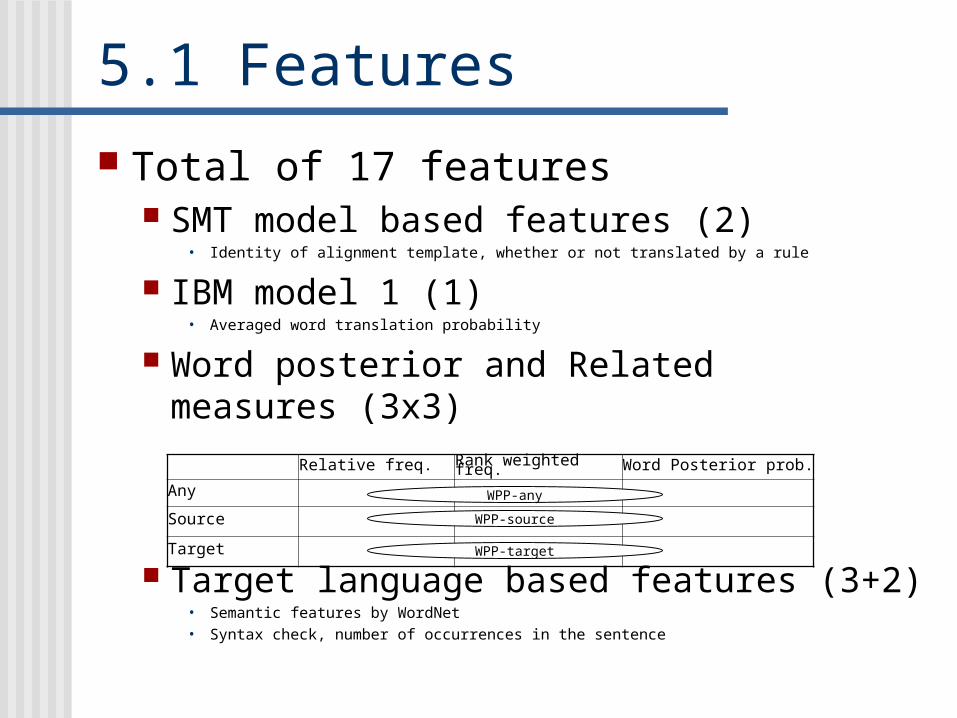
5.1 Features Total of 17 features
SMT model based features (2)• Identity of alignment template, whether or not translated by a rule
IBM model 1 (1)• Averaged word translation probability
Word posterior and Related measures (3x3)
Target language based features (3+2)• Semantic features by WordNet• Syntax check, number of occurrences in the sentence
Relative freq. Rank weighted freq. Word Posterior prob.
Any
Source
Target
WPP-any
WPP-source
WPP-target
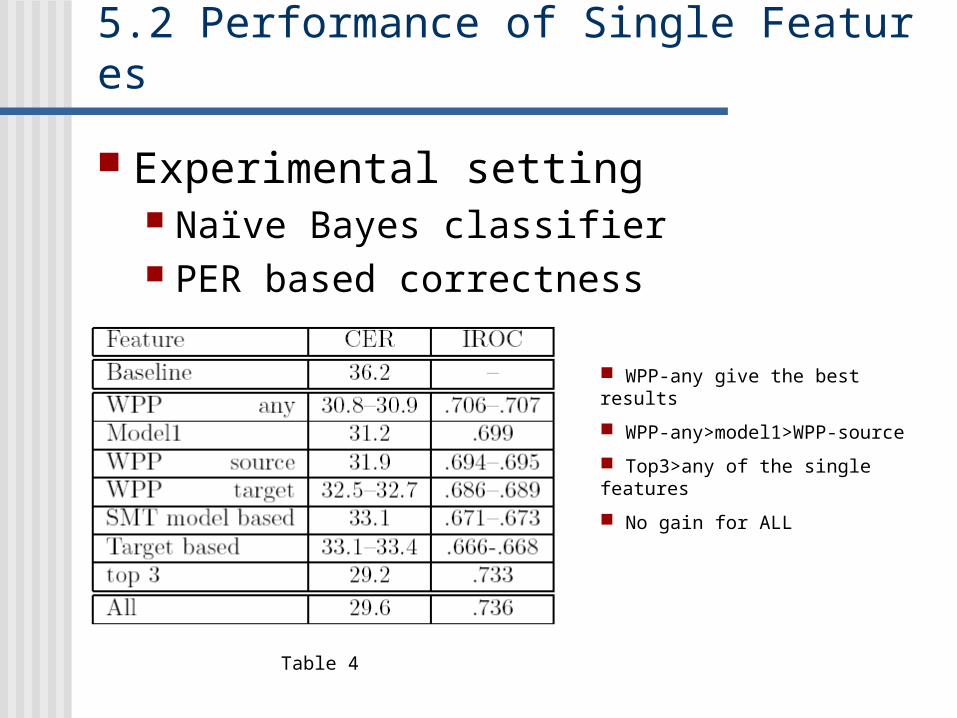
5.2 Performance of Single Features
Experimental setting Naïve Bayes classifier PER based correctness
Table 4
WPP-any give the best results
WPP-any>model1>WPP-source
Top3>any of the single features
No gain for ALL
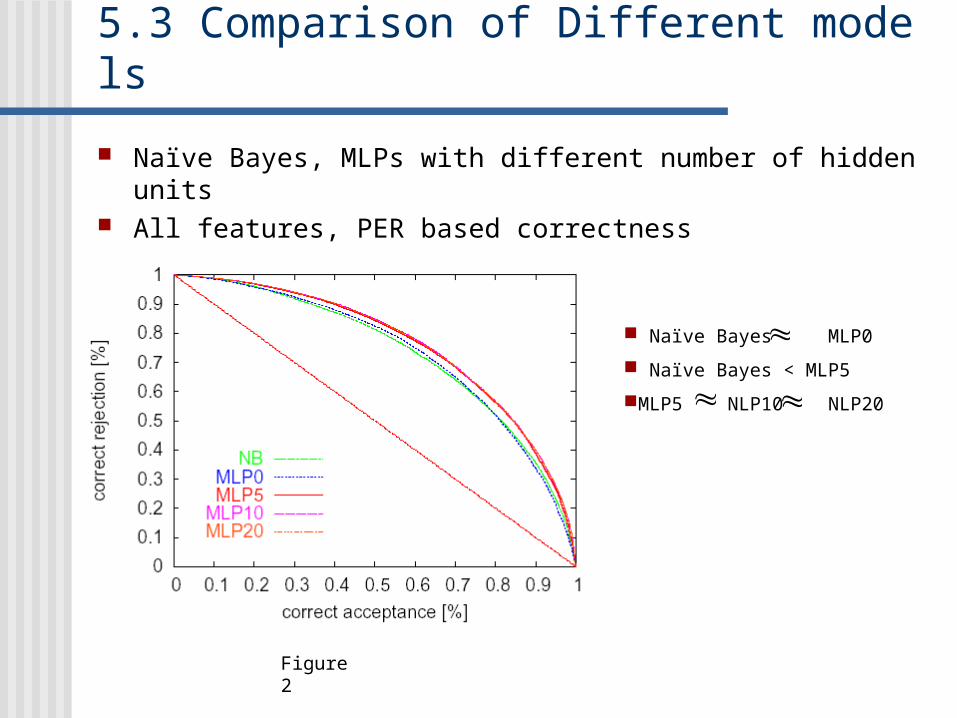
5.3 Comparison of Different models
Naïve Bayes, MLPs with different number of hidden units All features, PER based correctness
Naïve Bayes MLP0
Naïve Bayes < MLP5
MLP5 NLP10 NLP20
Figure 2
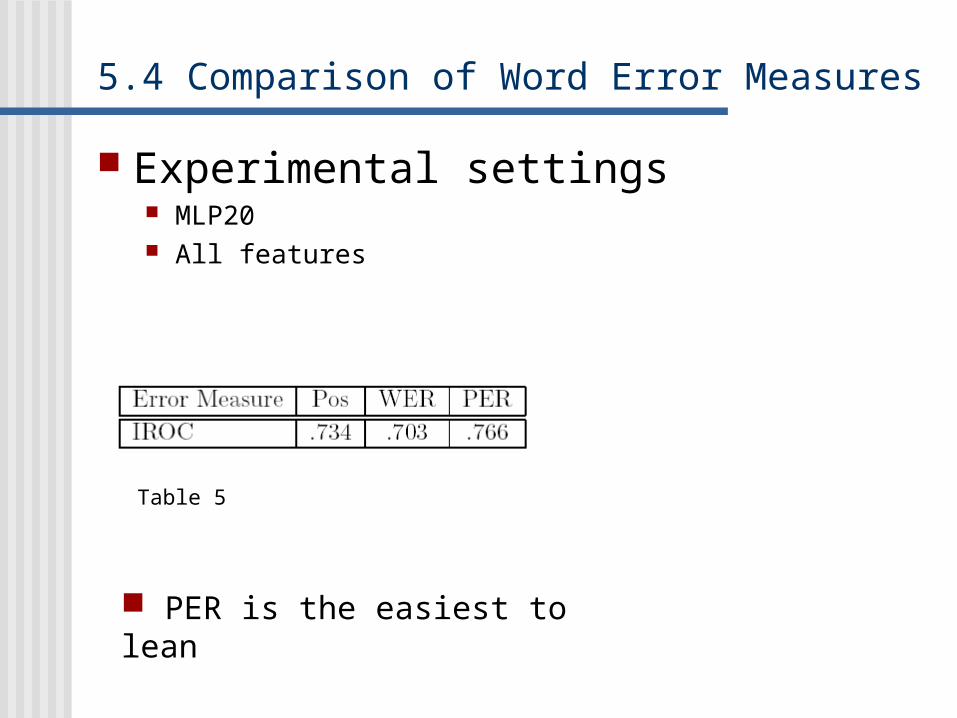
5.4 Comparison of Word Error Measures
Experimental settings MLP20 All features
PER is the easiest to lean
Table 5
6 Conclusion Separate CE layer is useful Features derived from base model are bet
ter than external ones N-best based features are valuable Target based features are more valuable t
han those not MLPs with hidden units are better than naï
ve Bayes