Embed Size (px)
Citation preview

The IT&T
9th International Conference on Information Technology and
Telecommunication 2009
______________
___________ ______
Ubiquitous and Green Computing
Dublin Institute of Technology Dublin, Ireland
22-23 October 2009
Markus Hofmann (ITB) Mark Deegan (DIT)
Phelim Murnion (GMIT) (Eds)

ISSN 1649‐1246

iii
IT&T 2009 General Chair’s Letter
As the General Chair of the Ninth Information Technology and Telecommunications Conference (IT&T 2009), it gives me great pleasure to bring to your attention this year’s conference which will take place in Dublin Institute of Technology, Kevin Street, Dublin 8 on Thursday 22nd and Friday 23rd October 2009. This year’s conference has as its focus: Ubiquitous and Green Computing: The Challenges Facing Computing Systems in Presenting Ubiquitous Computing in an Environmentally Sustainable Manner. Nineteen research papers and eight posters will be presented over six sessions. There will also be a Doctoral Symposium to assist newer researchers currently studying for their PhD. Key-note speeches will be delivered by invited industry guests from IBM and Microsoft. I would like to express my sincere thanks to Gerry Murray and the Executive Board of the Institutes of Technology Ireland (IOTI) for providing funding for this conference. Without this support it would have been very difficult to continue the good work done by the eight previous conferences in this series. The past months have seen a significant change in the economic conditions faced by industry and this is reflected in the fact that as we go to press we are without an industrial sponsor for the conference. I sincerely hope this can be remedied before we gather in October. The preparation for this year’s conference has been a most enjoyable journey made possible by the energy and enthusiasm of colleagues from Institutes of Technology and Universities across Ireland. I would like to thank all those who have given of their time to make this year’s conference a success. I would like to welcome you all to this year’s conference and I hope you enjoy and benefit from the experience. Thank you, Mark Deegan General Chair of IT&T 20009 Lecturer School of Computing Dublin Institute of Technology Kevin Street Dublin 8 Ireland

iv

v
Technical Programme Committee Chairs’ Letter
Dear Colleagues, As Technical Programme Chairs, we would like to welcome you to the Ninth Information Technology and Telecommunications Conference (IT&T 2009) hosted by the Dublin Institute of Technology, Ireland. IT&T is an annual international conference which not only publishes research in the areas of information technologies and telecommunications, but also brings together researchers, developers and practitioners from the academic and industrial environments, enabling research interaction and collaboration. The focus of the ninth IT&T is “Ubiquitous and Green Computing - The Challenges Facing Computing Systems in Presenting Ubiquitous Computing in an Environmentally Sustainable Manner”. We welcomed research papers with topics in Ubiquitous Computing Systems Performance, Mobile and Wearable Computing, Location Based Services, Security, Trust and Privacy, Designing Software for the Mobile User, Network Management and Planning, Virtual Machine Technology, Data and Text Mining, Mobile Games and Entertainment, Digital Gaming and Entertainment Technologies, Learning Technologies, Universal Design Technologies, Wireless Services, Data and Knowledge Management, Virtual Communities, Social Communities, Avatars and Intelligent Agents, and Green Software Design, Multi-Lingual Systems. All submitted papers were peer-reviewed by the Technical Programme Committee members and we would like to express our sincere gratitude to all of them for their help in the reviewing process. After the review process, nineteen papers were accepted and will be presented during six technical sessions spanning the two days of the conference. This year’s conference will also display a number of posters. A doctoral consortium session will also be held with researchers who are nearing completion of their PhDs. These sessions will be preceded by plenary talks given by ICT experts from Irish academia and industry. We hope you will have a very interesting and enjoyable conference. Markus Hofmann, Blanchardstown Institute of Technology, Ireland Nick Timmons, Letterkenny Institute of Technology, Ireland Paul Doyle, Dublin Institute of Technology, Ireland

vi

vii
IT&T 2008 Chairs and Committees Conference General Chair
Mark Deegan, Dublin Institute of Technology
Conference Vice Chair
Phelim Murnion, Galway-Mayo Institute of Technology
Technical Programme Committee Chairs
Markus Hofmann, Institute of Technology Blanchardstown Nick Timmons, Letterkenny Institute of Technology Paul Doyle, Dublin Institute of Technology
Doctoral Symposium Committee Chair
Fred Mtenzi, Dublin Institute of Technology Patronage & Sponsor Chair
Dave Denieffe, Institute of Technology Carlow
Proceedings Editors
Markus Hofmann, Institute of Technology Blanchardstown Mark Deegan, Dublin Institute of Technology Phelim Murnion, Galway-Mayo Institute of Technology

viii
Organising Committee
Brian Nolan, Institute of Technology Blanchardstown Bryan Duggan, Dublin Institute of Technology Ciaran O’Driscoll, Dublin Institute of Technology Dave Denieffe, Institute of Technology Carlow David Tracey, WiSAR Lab, Letterkenny Institute of Technology Declan O’Sullivan, Trinity College Dublin Dirk Pesch, Cork Institute of Technology Fred Mtenzi, Dublin Institute of Technology Gabriel-Miro Muntean, Dublin City University John Murphy, University College Dublin Mark Deegan, Dublin Institute of Technology Markus Hofmann, Institute of Technology Blanchardstown Nick Timmons, Letterkenny Institute of Technology Paul Doyle, Dublin Institute of Technology Phelim Murnion, Galway-Mayo Institute of Technology
Doctoral Symposium Technical Committee
Anthony Keane, Institute of Technology Blanchardstown Cristina Muntean, National College of Ireland Rob Brennan, Trinity College Dublin
ix
Technical Programme Committee
Arnold Hensman, Institute of Technology Blanchardstown Brendan Tierney, Dublin Institute of Technology Brian Crean, Cork Institute of Technology Brian Nolan, Institute of Technology Blanchardstown Bryan Duggan, Dublin Institute of Technology Ciaran O’Driscoll, Dublin Institute of Technology Ciaran O’Leary, Dublin Institute of Technology Conn Cremin, Institute of Technology Blanchardstown Cormac J. Sreenan, University College Cork Cristina Hava Muntean, National College of Ireland Damien Gordon, Dublin Institute of Technology Dave Denieffe, Institute of Technology Carlow Dave Lewis, Trinity College Dublin David Tracey, Letterkenny Institute of Technology Declan O'Sullivan, Trinity College Dublin Deirdre Lawless, Dublin Institute of Technology Enda Fallon, Athlone Institute of Technology Frank Duignan, Dublin Institute of Technology Fred Mtenzi, Dublin Institute of Technology Gabriel-Miro Muntean, Dublin City University Ian Pitt, University College Cork Jeanne Stynes, Cork Institute of Technology Jim Morrison, Letterkenny Institute of Technology John Murphy, University College Dublin Larry McNutt, Institute of Technology Blanchardstown Laura Keyes, Institute of Technology Blanchardstown Liam Kilmartin, National University of Ireland Galway Margaret Kinsella, Institute of Technology Blanchardstown Markus Hofmann, Institute of Technology Blanchardstown Matt Smith, Institute of Technology Blanchardstown Michael Lang, NUI Galway Nick Timmons, Letterkenny Institute of Technology Paul Doyle, Dublin Institute of Technology Paul Kelly, Dublin Institute of Technology Paul Walsh, Cork Institute of Technology Phelim Murnion, Galway-Mayo Institute of Technology Richard Gallery, Institute of Technology Blanchardstown Sarah Jane Delany, Dublin Institute of Technology Sean Duignan, Galway Mayo Institute of Technology Simon McLoughlin, Institute of Technology Blanchardstown Svetlana Hensman, Dublin Institute of Technology Tom Pfeiffer, TSSG, Waterford Institute of Technology

x
xi
Table of Contents Session 1: Algorithms & Data Mining
Chaired by: Dr. Declan O’Sullivan, Trinity College Dublin
Sentiment Classification of Reviews Using SentiWordNet 3
Bruno Ohana, DIT, Brendan Tierney, DIT
Comparison of Feature Classification Algorithms for Activity Recognition based on
Accelerometer and Heart Rate Data 11
Dominic Maguire - WIT, Richard Frisby - WIT
An Improved CamShift Algorithm for Target Tracking in Video Surveillance 19
Chunrong Zhang – AIT, Yuansong Qiao – AIT, Enda Fallon – WIT, Changqiao Xu
Session 2: E-Learning
Chaired by: Dr. Cristina Muntean, National College of Ireland
Universal Design, Education and Technology 29
Ciaran O’Leary – DIT, Damien Gordon - DIT
Development of a Moodle Course Content Filter using Meta Data 40
Kyle Goslin - ITB, Markus Hofmann – ITB, Geraldine Gray – ITB
Context Aware Smart Classroom for Real Time Configuration of Computer Rooms
Paula Kelly – DIT, Peter Daly – DIT, Ciaran O’Driscoll – DIT 51
Sensing Learner Interest through Eye Tracking 61
Haolin Wei – DCU, Arghir-Nicolae Moldovan – NCI, Cristina Hava Muntean –
xii
Session 3: Mobile Applications
Chaired by: David Tracey, Letterkenny Institute of Technology
A Study of Mobile Internet Capability Trends to Assess the Effectiveness the W3C
Default Delivery Context (DDC) 71
Ivan Dunn- ITT, Gary Clynch, ITT
Power Save-based Adaptive Multimedia Delivery Mechanism 79
David McMullin – DCU, Ramona Trestian – DCU, Gabriel-Miro Muntean - DCU
A Novel Protocol for Inter-Vehicular Video Transmission 87
Kevin O'Flynn – DCU, Hrishikesh Venkataraman – DCU, Gabriel-Miro Muntean – DCU
Session 4: Green IT
Chaired by: Paul Doyle, Dublin Institute of Technology
Desktop Virtualisation Scaling Experiments with VirtualBox 97
John Griffin – DIT, Paul Doyle – DIT
Optimising Security & Cryptography Across Diverse Environments 105
Martin Connolly – CIT, Fergus O'Reilly – CIT
Session 5: WiFi & Wireless
Chaired by: Enda Fallon, Athlone Institute of Technology
Efficient UWB indoor localisation using a ray-tracing propagation tool 117
Tam N. Huynh – DCU, Conor Brennan - DCU
VOSHM - A Velocity Optimized Seamless Handover Mechanism for WiMAX
Networks 125
Chi Ma – AIT, Enda Fallon – AIT, Yansong Qiao, AIT
Parallelised EM wave propagation modelling for accurate network simulation 133
Catalin David – DCU, Conor Brennan – DCU, Olga Ormond – DCU, Marie Mullen - DCU
xiii
Session 6: Networks & Sensor Networks
Chaired by: Ciaran O’Driscoll, Dublin Institute of Technology
QoS-Aware IPTV Routing Algorithms 143
Patrick McDonagh – UCD, Philip Perry - UCD, Liam Murphy - UCD
Policy Refinement for Traffic Management in Home Area Network – Problem
Statement 150
Annie Ibrahim – WIT, Micheal O Foghlu - WIT
Error Rate Based Switchover Analysis on Multi-homed Body Sensor Networks 154
Sadik Armagan – AIT, Enda Fallon – AIT, Yuansong Qiao - AIT
Building Fire Emergency Detection and Response Using Wireless Sensor Networks
Yuanyuan Zeng – UCC, Sean Murphy – UCC, Lanny Sitanayah – UCC, Tatiana Maria Tabirca - UCC,
Thuy Truong - UCC, Ken Brown - UCC, Cormac J. Sreenan - UCC 163
Session 7: Doctoral Symposium
Chaired by: Dr. Fred Mtenzi, Dublin Institute of Technology
Policy Refinement for Traffic Management in Home Area
Networks – Problem Statement 173
Annie Ibrahim Rana, Mícheál Ó Foghlú, TSSG
Cloud Forensic Architecture and Investigative Technique 177
Keyun Ruan, Joe Carthy, Tahar Kec, UCD
A Unified Model of Learning Styles 182
Damian Gordon, DIT
xiv
Poster Session
PlayLearn: Supporting Motivation through Gaming in E-Learning 185
Ioana Ghergulescu, Cristina Hava Muntean
Towards Integrated Hybrid Modelling and Simulation Platform for Building
Automation Systems; Application to HVAC 191
Alie El-Din Mady, Menouer Boubekeur, Gregory Provan
Beyond Home Automation: Designing More Effective Smart Home Systems 200
Paolo Carner
Tracker: Indoor Positioning for the LOK8 Project 207
Viacheslav Filonenko, James D. Carswell
Intelligent Virtual Agent: Creating a Multi-Modal 3D Avatar Interface 211
Mark Dunne, Brian MacNamee, John Kelleher
Vocate: Auditory Interfaces for the LOK8 Project 216
John McGee, Charlie Cullen
A Mobile Multimodal Dialogue System for Location Based Services 221
Niels Schütte, John Kelleher, Brian MacNamee
Performace Optimization of the AIT Campus Wireless Mesh Network Deployment
Eduardo Brito, Robert Stuart, John Allen, MN Hassan 226

xv
ITT09 Author Index A Allen, John 226 Armagan Sadik 154 B Boubekeur Menouer 191 Brennan Conor 117, 133 Brito Eduardo 226 Brown Ken 163 C Carner Paolo 200 Carswell James 207 Carthy Joe 177 Clynch Gary 71 Connolly Martin 105 Cullen Charlie 216 D Daly Peter 51 David Catalin 133 Doyle Paul 97 Dunn Ivan 71 E El-Din Mady Alie 191 F Fallon Enda 19, 125, 154 Filonenko Viacheslev 207 Frisby Richard 11 G Ghergulescu Ioana 185 Gordon Damian 29, 182 Goslin Kyle 40 Gray Geraldine 40 Griffin John 97 H Hassan MN 226 Hava Muntean Cristina 61, 185 Hofmann Markus 40 Huynh Tam 117 I Ibrahim Rana Annie 150, 173
K Kechadi Tahar 177 Kelleher John 221 Kelly Paula 51 M Ma Chi 125 MacNamee Brian 221 Maguire Dominic 11 McDonagh Patrick 143 McGee John 216 McMullin David 79 Moldovan Arghir-Nicolae 61 Mullen Marie 133 Muntean Gabriel-Miro 79, 87 Murphy Liam 143 Murphy Seán Óg 163
O Ó Foghlú Mícheál 150, 173 O’Driscoll Ciaran 51 O’Flynn Kevin 87 O’Leary Ciarán 29 O’Reilly Fergus 105 Ohana Bruno 3 Ormond Olga 133 P Perry Philip 143 Provan Gregory 191 Q Qiao, Yuansong 19, 125, 154 R Ruan Keyun 177 S Schütte Niels 221 Sitanayah Lanny 163 Sreenan Cormac 163 Stewart Robert 226 T Tabirca Tatiana 163 Tierney Brendan 3 Trestian Ramona 79 Truong Thuy 163

xvi
V Venkataraman Hrishikesh 87 W Wei Haolin 61 X Xu, Changqiao 19 Z Zeng Yuanyuan 163 Zhang Chunrong 19

Session 1
Algorithms & Data Mining
1

�
2
Sentiment Classification of Reviews Using SentiWordNet
Bruno Ohana 1, Brendan Tierney 2
1 Dublin Institute of Technology, School of Computing
Kevin St. Dublin 8, Ireland [email protected]
2 Dublin Institute of Technology, School of Computing
Kevin St. Dublin 8, Ireland [email protected]
Abstract
Sentiment classification concerns the use of automatic methods for predicting the orientation of subjective content on text documents, with applications on a number of areas including recommender and advertising systems, customer intelligence and information retrieval. SentiWordNet is an opinion lexicon derived from the WordNet database where each term is associated with numerical scores indicating positive and negative sentiment information. This research presents the results of applying the SentiWordNet lexical resource to the problem of automatic sentiment classification of film reviews. Our approach comprises counting positive and negative term scores to determine sentiment orientation, and an improvement is presented by building a data set of relevant features using SentiWordNet as source, and applied to a machine learning classifier. We find that results obtained with SentiWordNet are in line with similar approaches using manual lexicons seen in the literature. In addition, our feature set approach yielded improvements over the baseline term counting method. The results indicate SentiWordNet could be used as an important resource for sentiment classification tasks. Additional considerations are made on possible further improvements to the method and its use in conjunction with other techniques.
Keywords: Sentiment Analysis, Opinion Mining, SentiWordNet, Data Mining, Knowledge Discovery
1 Introduction
Opinion mining research considers the computational treatment of subjective information contained in text. With the rapid growth of available subjective text on the internet in the form of product reviews, blog posts and comments in discussion forums, opinion mining can assist in a number of potential applications in areas such as search engines, recommender systems and market research. One approach for detecting sentiment in text present in literature concerns the use of lexical resources such as a dictionary of opinionated terms. SentiWordNet �[6] is one such resource, containing opinion information on terms extracted from the WordNet database and made publicly available for research purposes. SentiWordNet is built via a semi supervised method and could be a valuable resource for performing opinion mining tasks: it provides a readily available database of term sentiment information for the English language, and could be used as a replacement to the process of manually deriving ad-hoc opinion lexicons. In addition, SentiWordNet is built upon a semi automated process, and could easily be updated for future versions of WordNet, and for other languages where similar
3

lexicons are available. Thus, an interesting research question is to assess how effective is SentiWordNet in the task of detecting sentiment in comparison to other methods, and what are the potential advantages that could be obtained from this approach. This paper proposes a method for applying SentiWordNet to derive a data set of document metrics and other relevant features, and performs an experiment on sentiment classification of film reviews using the polarity data set introduced in �[14]. We present and discuss the results obtained in light of similar research performed using manually built lexicons, and investigate possible sources of inaccuracies with this method. Further analysis of the results revealed opportunities for improvements to this approach, which are presented in our concluding remarks.
2 Sentiment Classification
Sentiment classification is an opinion mining activity concerned with determining what, if any, is the overall sentiment orientation of the opinions contained within a given document. It is assumed in general that the document being inspected contains subjective information, such as in product reviews and feedback forms. Opinion orientation can be classified as belonging to opposing positive or negative polarities – positive or negative feedback about a product, favorable or unfavorable opinions on a topic – or ranked according to a spectrum of possible opinions, for example on film reviews with feedback ranging from one to five stars. Supervised learning methods using different aspects of text as sources of features have been proposed in the literature. Early work seen in �[13] presents several supervised learning algorithms using bag-of-words features common in text mining research, with best performance obtained using support vector machines in combination with unigrams. Classifying terms from a document into its grammatical roles, or parts of speech has also been explored: In �[21] part of speech information is used as part of a feature set for performing sentiment classification on a data set of newswire articles, with similar approaches attempted in �[10], �[7] and �[16], on different data sets. On �[20] a method that detects and scores patterns in part of speech is applied to derive features for sentiment classification, with a similar idea applied to opinion extraction for product features seen in �[4]. Separation of subjective and objective sentences for the purposes of improving document level sentiment classification are found in �[14], where considerable improvements were obtained over a baseline word vector classifier. Other studies focus on the correlation of writing style to overall sentiment, taking into account the use of colloquialisms and punctuation that may convey sentiment. In �[22] a lexicon of colloquial expressions and a regular expression rule base is created to detect unique opinion terms such as unusual spellings (“greeeat”) and word combinations (“supergood”). In �[1] document statistics and features measuring aspects of writing style are combined with word vectors to obtain considerable improvements over a baseline classifier on a data set of film reviews.
2.1 Opinion Lexicons
Opinion lexicons are resources that associate sentiment orientation and words. Their use in opinion mining research stems from the hypothesis that individual words can be considered as a unit of opinion information, and therefore may provide clues to document sentiment and subjectivity. Manually created opinion lexicons were applied to sentiment classification as seen in �[13], where a prediction of document polarity is given by counting positive and negative terms. A similar approach is presented in the work of Kennedy and Inkpen �[10], this time using an opinion lexicon based on the combination of other existing resources. Manually built lexicons however tend to be constrained to a small number of terms. By its nature, building manual lists is a time consuming effort, and may be subject to annotator bias. To overcome these issues lexical induction approaches have been proposed in the literature with a view to extend the size of opinion lexicons from a core set of seed terms, either by exploring term relationships, or by evaluating similarities in document corpora. Early work in this area seen in �[9] extends a list of positive and negative adjectives by evaluating conjunctive statements in a document corpus. Another common approach is to derive opinion terms from the WordNet database of terms and relationships �[12], typically by examining the semantic relationships of a term such as synonyms and antonyms.
4

Lexicons built using this approach can be seen applied to subjectivity detection research in �[21] and applied to sentiment classification in ��[4] and �[16].
2.1 WordNet Glosses and SentiWordNet
As noted in ��[15], term relationships in the WordNet database form a highly disconnected graph, and thus expansion of opinion information from a core of seed words by examining semantic relationships such as synonyms and antonyms is bound to be restricted only to a subset of terms. To overcome this problem, information contained in term glosses – explanatory text accompanying each term – can be explored to infer term orientation, based on the assumption that a given term and the terms contained in its gloss are likely to indicate the same polarity. In �[2]� a method for lexicon expansion is proposed where terms are assigned positive or negative opinions based on the existence of terms known to carry opinion content found on the term gloss. The authors argue that glosses have a potentially low level of noise since they “are designed to match as close as possible the components of meaning of the word, have relatively standard style, grammar and syntactic structure”; This idea is also seen in �[5], this time by using supervised learning methods for extending a lexicon by exploring gloss information, yielding positive accuracy improvements over a gold standard in comparison to some of the methods previously discussed in this section. This is the same approach employed on building the SentiWordNet opinion lexicon �[6]. SentiWordNet is built in a two-stage approach: initially, WordNet term relationships such as synonym, antonym and hyponymy are explored to extend a core of seed words used in �[19], and known a priori to carry positive or negative opinion bias. After a fixed number of iterations, a subset of WordNet terms is obtained with either a positive or negative label. These term’s glosses are then used to train a committee of machine learning classifiers. To minimize bias, the classifiers are trained using different algorithms and different training set sizes. The predictions from the classifier committee are then used to determine the sentiment orientation of the remainder of terms in WordNet. The table below compares the coverage of SentiWordNet in relation to other manually built opinion lexicons available in the literature.
Opinion Lexicon Total Sentiment Bearing Terms
General Inquirer (1) �[17]. 4216 Subjectivity Clues Lexicon �[21]. 7650 (out of 8221 terms) Grefenstette et al �[8]. 2258 SentiWordNet �[6]. 28431 (out of total 86994 WordNet
terms) Table 1. Coverage of Opinion Lexicons
3 Approach
Our research assesses the use of SentiWordNet to the task of document level sentiment classification using the Polarity data set of film reviews presented in �[14]. Initially, the lexicon was applied by counting positive and negative terms found in a document and determining sentiment orientation based on which class received the highest score, similar to the methods presented in �[13] and �[10]. A refinement to this method consisted on building a data set of features derived from SentiWordNet scores, following a careful evaluation of the data set and SentiWordNet. Each set of terms sharing the same meaning in SentiWordNet (synsets) is associated with two numerical scores ranging from 0 to 1, each indicating the synset’s positive and negative bias. The scores reflect the agreement amongst the classifier committee on the positive or negative label for a term, thus one distinct aspect of SentiWordNet is that it is possible for a term to have non-zero values for both positive and negative scores, according to the formula:
1 http://www.wjh.harvard.edu/~inquirer
5

Pos. Score(term) + Neg. Score(term) + Objective Score(term) = 1 (1)
Terms in the SentiWordNet database follow the categorization into parts of speech derived from WordNet, and therefore to correctly apply scores to terms, a part of speech tagger program was applied to the polarity data set. In our experiment, the Stanford Part of Speech Tagger described in �[18] was used. SentiWordNet scores were then calculated for terms found, and additional metrics were calculated from the scores. Overall scores for each part of speech were computed, along with ratios of scores in relation to number of terms. Documents were also divided into equally sized segments, and scoring was performed on each segment to assess the impact of different parts of the document to overall sentiment. A total of 96 distinct features were generated as summarized on the table below.
Metric Category Features Overall Document Scores Sum of positive and negative scores for Adjectives.
Sum of positive and negative scores for Adverbs. Sum of positive and negative scores for Verbs.
Score ratio to total terms Ratio of overall score per total terms found, for each part of speech.
Positive to negative score ratios Positive to negative scores ratio per part of speech. Scores per document segment Ratios for the above metrics for each of N partitions of a
document. • Each document was segmented into 10 partitions with
equal number of terms. Negation Percentage of negated terms in document.
Table 2. Metrics Derived From SentiWordNet
3.1 Natural Language and Style Considerations
Another aspect evaluated by this experiment was the influence of applying weights to scores as a function of its position in the document. This would intuitively translate to the existence of areas within a document that tend to carry more opinion content, such as the end of the document where closing remarks would reflect the general author view. Several adjusting schemes were attempted and the chosen method implements a linearly increasing weight adjustment to scores, as given by the formula below.
(2)
With C being a constant value, and ti the position of the given term t relative to the total of terms T in the document. Negation detection is also an important element of implementing sentiment analysis by using term scores, since negation in a sentence such as “I did not find this movie funny or interesting” would invert the opinion orientation of otherwise positive terms such as “funny” and “interesting”. This research implemented a version of the NegEx algorithm �[3] for negation detection, which scans sentences based on a database of pre defined negation expressions. The algorithm maintains three distinct lists, depending on the scope of the negation: expressions that modify preceding terms, subsequent terms and pseudo-negation expressions with no effect on term polarity. Finally, the data set was generated from the source documents by extracting the above information with SentiWordNet. A support vector machine classifier was then trained based on a label indicating positive and negative sentiment, and classification performance was measured using average
6

accuracies and 3-fold cross validation. The experiment was executed using the support vector machine implementation available in the RapidMiner data mining application �[11].
4 Results
4.1 Term Counting
SentiWordNet scores were calculated as positive and negative terms were found on each document, and used to determine sentiment orientation by assigning the document to the class with the highest score. This method yielded an overall accuracy of 65.85%, with results detailed in the table below.
Class Positive Negative Predicted Positive 576 259
Predicted Negative 424 741 Total 1000 1000
Class Recall 57.6% 74.1% Class Precision 68.98% 63.76%
Table 3. SentiWordNet Score Counting Results
4.1 SentiWordNet Features
For this method, a linear support vector machine classifier was trained using the features derived from SentiWordNet detailed on Section 3. Best results were obtained when combined with a feature selection refinement step based on attribute information gain. The table below presents accuracies for each stage of the experiment. It can be noticed that small improvements were obtained when negation detection and scoring functions were added to the model.
Experiment Accuracy
SentiWordNet Features (no refinement). 67.40% - Including Linear Weight Adjustment to Scores. 68.00% - Including Negation Detection and Linear Weight Scoring. 68.50% SentiWordNet, Negation Detection, Linear Scoring and Feature Selection.
69.35%
Table 4. SVM Accuracy Results
5 Discussion
The table below illustrates how SentiWordNet compares to other published results in the area using the same data set and similar approaches bases on opinion lexicons.
Method AccuracySentiWordNet – Term Counting (this research) 65.85%SentiWordNet Scores used as Features (this research). 69.35%Term Counting - Manually built list of Positive/Negative words �[13].
69.00%
Term counting from Combined Lexicon and valence shifters �[10].
67.80%
Table 5. Accuracy Comparisons
Term counting using SentiWordNet remains close to other results using manually built lexicons, which is encouraging for the use of resources built from semi supervised methods. Our second method using SentiWordNet as a source of features for a supervised learning algorithm yielded improvements
7

over the term counting approach. The use of weight adjustment has yielded small improvements to the method, suggesting remarks affecting overall sentiment being placed towards the end of a document. On both cases, the results are within close range of other results employing opinion lexicons seen in the literature: In �[13] the results are based on term counting from a manually built word list for the domain of film reviews, whereas results from �[10] follow the same principle, but leverage a combined lexicon and take into account intensifier and diminisher terms such as “very” and “seldom”.
4.1 Misclassifications
Results for the term counting approach seen in Table 3 show that the method provides better recall for the negative class than the positive one. This may indicate a stronger and more explicit choice of terms on negative reviews than in positive ones, and that authors are more likely to include negative remarks on positive reviews for a more balanced assessment, like the ones seen in the concluding remarks of a film review presented below:
“the only downfall of the opening sequence is the editing style used… it’s choppy, slow motion which is unsettling and distracting.”
The phenomenon of thwarted expectations reported in �[13] can also affect this method, where the author chooses to build up the expectation of a good film, for example by mentioning director and actor’s previous achievements, only to later frustrate it by presenting an overall negative view. On those cases, the number of terms with positive orientation would be high, therefore affecting conclusions made by a classifier using data based on term polarity. Some inaccuracies seen on SentiWordNet scores may be caused by the reliance on glosses as a source of information for determining term orientation. As an example the term ludicrous has a positive score in SentiWordNet, and the following gloss:
“absurd, cockeyed, derisory, idiotic, laughable, ludicrous, nonsensical, preposterous, ridiculous (incongruous; inviting ridicule) "the absurd excuse that the dog ate his homework"; "that's a cockeyed idea"; "ask a nonsensical question and get a nonsensical answer"; "a contribution so small as to be laughable"; "it is ludicrous to call a cottage a mansion"; "a preposterous attempt to turn back the pages of history"; "her conceited assumption of universal interest in her rather dull children was ridiculous."
It can be argued that this term should contain a negative orientation, given its association to the synonyms farcical and idiotic. However SentiWordNet may have chosen a positive score on the basis the gloss text is more likely to be associated with a positive term than a negative one: terms such as exuberance and clown and the somewhat ambiguous laughable could be influencing the construction method in assigning incorrect scores. The dependence of SentiWordNet scores on term glosses could be a limiting factor in the accuracy of term scores and the overall classification accuracy of this method. Finally, the use of colloquial language and expressions where no opinion information exists, disambiguation of WordNet terms with more than one meaning, inaccuracies in the assignment of part of speech tags, and the correct detection of named entities such as actor and film names were identified as contributing factors to misclassifications seen using this method.
5 Conclusions and Future Work
This research assessed the use of the SentiWordNet opinion lexicon in the task of sentiment classification of film reviews. Results obtained by simple word counting were similar to other results employing manual lexicons, indicating SentiWordNet performs well when compared with manual resources on this task. In addition, using SentiWordNet as a source of features for a supervised learning scheme has shown improvements over pure term counting. This study also revealed opportunities where further linguistic processing yield gains in classification accuracies. These,
8
coupled with the relative low dimensionality of a data set built from SentiWordNet data set - less than 100 features compared to several thousand typically seen on word vector approaches - could lead to more attractive models for real world applications. Further aspects of our research will involve a more detailed comparison of the performance of SentiWordNet and other lexicons on similar opinion mining tasks could help in better understanding their strengths, and how they can be used together. This could be particularly beneficial in overcoming some of the limitations seen in SentiWordNet’s reliance on glosses. In addition, research in combining a classifier based on SentiWordNet with other approaches such as word vectors may produce better results than each individual classifier can produce on its own. Some encouraging empirical results of such methods applied to sentiment classification research are seen in �[9] and �[23].
Acknowledgements
We wish to thank Andrea Esuli and Fabrizio Sebastiani, from the Italian Institute of Information Science and Technology, for making the SentiWordNet lexical resource available for use in this research.
References
[1] Abbasi, A., Chen, H., and Salem, A. (2008). Sentiment analysis in multiple languages: Feature selection for opinion classification in Web forums. ACM Transactions on Information Systems, 26, 3 (Jun. 2008), 1-34.
[2] Andreevskaya A., Bergler S. (2006). Mining WordNet for Fuzzy Sentiment: Sentiment Tag Extraction from WordNet Glosses. In Proceedings of the 11th Conference of the European Chapter of the Association for Computational Linguistics – EACL 2006.
[3] Chapman W, Bridewell W, Hanbury P, Cooper G, Buchanan B. (2001). Evaluation of Negation Phrases in Narrative Clinical Report. Proceedings of 2001 AMIA Symposium, 105-109.
[4] Dave K, Lawrence S, Pennock D. (2003). Mining the Peanut Gallery: Opinion Extraction and Semantic Classification in Product Reviews. Proceedings of the 12th International conference on the World Wide Web - ACM WWW2003, (May 20-24, 2003), Budapest, Hungary.
[5] Esuli, A. and Sebastiani, F. (2005). Determining the semantic orientation of terms through gloss classification. Proceedings of the 14th ACM international Conference on information and Knowledge Management (Bremen, Germany, October 31 - November 05, 2005). CIKM '05. ACM, New York, NY, 617-624.
[6] Esuli A, Sebastiani F. (2006). SentiWordNet: A Publicly Available Lexical Resource for Opinion Mining. Proceedings from International Conference on Language Resources and Evaluation (LREC), Genoa, 2006.
[7] Gamon, M. (2004). Sentiment Classification on Customer Feedback Data: Noisy Data, Large Feature Vectors, and the Role of Linguistic Analysis. Proceedings of the 20th international conference on Computational Linguistics. Geneva, Switzerland: Association for Computational Linguistics.
[8] Grefenstette G., Qu Y., Shanahan J., Evans d. (2004). Coupling Niche Browsers and Affect Analysis for an Opinion Mining Application. Proceedings of the RIAO 2004, pp.186-194.
[9] Hatzivassiloglou, V., and McKeown, K. (1997). Predicting the Semantic Orientation of Adjectives. Preceedings of the 35th Annual Meeting of the Association of Computational Linguistics (ACL’97). Madrid, Spain, pp. 174-181.
[10] Kennedy A. and Inkpen D. (2006). Sentiment Classification of Movie Reviews Using Contextual Valence Shifters. Computational Intelligence, Vol. 22, 110–125.
[11] Mierswa I., Wurst M., Klinkenberg R., Scholz M., Euler T. (2006). YALE: Rapid Prototyping for Complex Data Mining Tasks. Proceedings of the 12th ACM SIGKDD International Conference on Knowledge Discovery and Data Mining (KDD-06).
9

[12] Miller G. A., Beckwith R., Fellbaum C, Gross D, Miller K. J. (1990). Introduction to Wordnet: An On-line Lexical Database. International Journal of Lexicography. Vol. 3, No. 4 (Jan. 1990), 235-244.
[13] Pang B., Lee L., and Vaithyanathan, S. (2002). Thumbs up? Sentiment Classification using Machine Learning Techniques. Proceedings of EMNLP, 2002.
[14] Pang B., Lee L. (2004). A Sentimental Education: Sentiment Analysis Using Subjectivity Summarization Based on Minimum Cuts. Proceedings of the ACL, 2004.
[15] Rao D. and Ravichandran D. (2009). Semi-Supervised Polarity Lexicon Induction. Proceedings of the 12th Conference of the European Chapter of the ACL. Athens, Greece (2009, Mar. 30th to Apr. 3rd), 675-682.
[16] Salvetti F., Lewis S., Reichenbach C. (2004). Automatic Opinion Polarity Classification of Movie Reviews. Colorado Research in Linguistics. Volume 17, Issue 1 (June 2004). Boulder: University of Colorado.
[17] Stone, P.J., Dunphy, D.C., Smith,M.S., Oglivie D.M. (1966). The General Enquirer: A computer Approach to Content Analysis. MIT Press, Cambridge MA.
[18] Toutanova K., Manning C. (2000). Enriching the Knowledge Sources Used in a Maximum Entropy Part-of-Speech Tagger. Proceedings of the Joint SIGDAT Conference on Empirical Methods in Natural Language Processing and Very Large Corpora (EMNLP/VLC-2000), pp. 63-70.
[19] Turney P., and Littman M. (2003). Measuring praise and Criticism: Inference of Semantic Orientation from Association. ACM Transactions on Information Systems, No. 21, 4, 315–346.
[20] Turney P. (2002). Thumbs up or Thumbs down? Sentiment Orientation Applied to Unsupervised Classification of Reviews. Proceedings of the 40th Annual Meeting of the Association of Computational Linguistics – ACL, 2002.
[21] Wilson T., Wiebe J., and Hoffmann P. (2005). Recognizing Contextual Polarity in Phrase-Level Sentiment Analysis. Proceedings of HLT/EMNLP, Vancouver, Canada.
[22] Yang K., Yu N., Zhang H. (2007). WIDIT in TREC-2007 Blog Track: Combining Lexicon-based Methods to Detect Opinionated Blogs. Proceedings of the 16th Text Retrieval Conference (TREC 2007).
[23] Yu H., Hatzivassiloglou V. (2003). Towards Answering Opinion Questions: Separating Facts from Opinions and Identifying Polarity in Sentences. Proceedings of the 2003 Conference on Empirical Methods in Natural Language Processing, 129-136.
10
Comparison of Feature ClassificationAlgorithms for Activity Recognition
Based on Accelerometer andHeart Rate Data
Dominic Maguire 1, Richard Frisby 2
1 Waterford Institute of [email protected]
2 Waterford Institute of [email protected]
Abstract
This paper describes a project to compare two feature classification algorithms used in activity recog-
nition in relation to accelerometer and heart rate data. Data was collected from six male and female
subjects using a single tri-axial accelerometer and heart monitor attached to each subject’s dominant
thigh. Subjects carried out eight activities and the data was labelled semi-automatically. Features
(mean, standard deviation, energy, correlation and mean heart rate) were extracted from the data
using a window of 256 (3.4 seconds) and an overlap of 50%. Two classifers, k-NN and J48, were
evaluated for activity recognition with 10-fold validation with k-NN (k = 1) achieving a better overall
score of 90.07%.
Keywords: Activity recognition, feature classification
1 Introduction
Activity recognition fits into the bigger domain of context awareness by making devices aware of the
activity or activities of the user [1]. The ability to recognise human activities is a key factor if computing
systems are to interact seamlessly with the user’s environment [2]. Context awareness is leading to
the ’reinvention’ of some domains such as healthcare [3] with studies examining a diverse range of
applications such as hospital worker activity estimation [4], chronic disease management [5] and remote
patient monitoring [6].
In context aware computing, data can be collected from a diverse range of sensors such as audio sensors,
image sensors and accelerometers. Accelerometers facilitate the real-time recording of acceleration data
along the x-, y- or z-axis. Due to their ever-diminishing size and embeddable nature, accelerometers can
be unobtrusively worn by users. It has been noted that accelerometers have successfully crossed over to
the mainstream via devices such as Apple’s iPhone and Nintendo’s Wii [7].
Much recent research has applied classification algorithms to accelerometer data in order to increase
activity recognition accuracy [8] with some commentators stating that activity recognition is primarily a
classification problem [1], [9]. Two classifiers, k-NN and J48/C4.5 (J48 is the Weka Toolkit [10] Java
implementation of C4.5), were evaluated in this study. The Weka Toolkit is a collection of state-of-the-
art machine learning algorithms and data pre-processing tools developed at the University of Waikato in
New Zealand. Lombriser et al [11] identify k-NN and J48/C4.5 as being “the classifiers with the least
11
complexities but rendering acceptable performance”. The next section is an examination of related work
which is followed by a description of the research methodology. The paper finishes with an analysis of
the results and outlines some pointers for future work.
2 Related Work
Bao and Intille [12] noted that most previous studies examining activity recogition from accelerometer
data were not suitable for real-world situations and were conducted either in laboratory conditions or
used limited datasets. They assessed the performance of algorithms in identifying twenty activities un-
der semi-naturalistic, simulated real-world conditions using five biaxial accelerometers. Decision table,
instance-based learning, decision tree (C4.5) and naive Bayes classifiers were used with C4.5 providing
the best performance recognsing everyday activities with an overall accuracy of 84%. The above study
also identified the optimal single accelerometer position, for the set of activities they chose, as being on
the thigh and that accuracy increased by 25% by using more than one accelerometer. Furthermore, it
was shown that acceleration data could be augmented with heart rate data to determine the intensity of
physical activities.
Pirttikangas et al [9] undertook a study using coin-sized sensor devices attached to four parts of the
body: right thigh and wrist, left wrist and a necklace. 17 daily activties were examined using triaxial
accelerometer and heart rate data. Two classifiers were used (multilayer perceptrons and kNN classifiers)
with kNN achieving a 90.61% aggregate recognition rate for 4-fold cross-validation. Interestingly, heart
rate data was collected but not used in the activity recognition process.
Ravi et al [1] collected data for eight activities using a single triaxial accelerometer worn near the pelvic
region. In their introduction they outline research questions which are also relevant to this author:
• Which are the best classifiers for recognising activities; is combining classifiers a good idea?
• Which among the selected features/attributes are less important than others?
• Which activities are harder to recognise?
In this study, the performance of base-level classifiers and meta-level classifiers was compared. They
found that combining classifiers using Plurality Voting provided the best overall results. Plurality Voting
choses the class that has been predicted by a majority of the base-level classifiers as the final predicted
class. Of the base-level classifiers, the decision tree C4.5 performed the best. In one setting, data was
collected for a single subject over different days and mixed together and cross-validated. Accuracy was
shown to be 97.29%. They concluded that activities can be accurately recognised using a single triaxial
accelerometer.
Lombriser et al [11] demonstrated that online activity recognition algorithms could be run on their Sen-sorButton miniaturised wireless sensor platform. Their main challenge was in selecting algorithms which
would achieve acceptable recognition performance with limited computation resources. They examined
seven office worker activities such as drinking water and using a mouse via accelerometer and light sen-
sor data. They used k-NN and J48/C4.5 classifiers with both providing 98% accuracy during offline
evaluation. Accuracy dropped during online implementation due to floating point bit accuracy on the
16-bit microcontroller. However, the k-NN classifier did slightly better (91%) than the J48/C4.5 (86%)
for online recognition. The authors state that these classifiers were used due to their low complexity and
acceptable rendering performance.
12
3 Data Collection
3.1 Hardware
The hardware used for this project included an Alive Technologies Heart Monitor and Accelerometer.
This provides triaxial accelerometry at 75 Hz with a dynamic range of +/-2.7 g using an 8-bit resolution.
Data was stored, using the proprietary .ats format, to a Secure Digital (SD) card on the device. Elec-
trodes from Medick Healthcare were used to facilitate the capture of heart data. Data processing was
undertaken on a 2.66 GHz Apple iMac with 4 GB of RAM.
Bao and Intille [12] identified the dominant thigh as being the optimal single accelerometer position and
this was emulated in this study. The accelerometer was attached to a loose-fitting tourniquet using tape.
The relatively short length of the ECG leads meant that the choice of electrode positions for monitoring
heart rate was limited to the supra-xiphisternal level.
A mobile phone stopwatch was used to synchronise the accelerometer timestamp for accurate label gen-
eration.
3.2 Label Generation
Data was collected for the set of eight activities examined by Ravi et al [1] in a similar single ac-
celerometer study: standing, brushing teeth, climbing up stairs, climbing down stairs, walking, running,
vacuuming and situps. Each subject performed the activities in the same order as stated above. Each
activity was performed for one minute except for climbing and descending stairs (in a regular two-storey
house) which were carried out twice. Label generation was semi-automatic, i.e. the author recorded start
and stop times for each subject and labelled each period with the specific, observed activity. Ten seconds
were removed from the beginning and end of most activities to ensure the data actually corresponded to
the activity being recorded. This was reduced to two seconds in the case of climbing and descending
stairs. Six subjects, four males and two females, aged between 43 and 45 took part with all but one
left-handed female subject positioning the accelerometer on the right thigh. All subjects enjoyed average
fitness levels and were recruited by convenience sampling.
Data was stored automatically on the accelerometer SD card as an .ats file. This was converted to the
European Data Format (EDF) using the AtsConvert program that accompanied the accelerometer.
EDF is a format designed for biosignal exchange. The resulting .edf file was viewable using the
accompanying EDFview program. This was helpful in visualising the data and validating the recorded
activity start and stop times.
Data was extracted from the .edf file using the edf2ascii executable which is downloadable from
http://www.teuniz.net/edf2ascii/. The author wrote a Java class using the Weka API
(LabelGenerator.java) that combines the raw data and the recorded times/activities to output
labelled raw data in the Weka Toolkit .arff (Attribute-Relation File) format. This format was chosen
to simplify the subsequent feature extraction stage which also avails of the same API. The above feature
extraction process was repeated for each subject with their specific, recorded times being used to label
the data.
Two subject recordings had to be repeated due to absent heart rate data. It is thought that this was due to
the adhesive jelly on the Medick Healthcare electrodes being dry. Once replaced, the readings were fine.
13
3.3 Feature Extraction
The following features were extracted from each of the three accelerometer axes in the raw data. These
were found to be useful in previous studies [12], [1], [9]:
• Mean
• Standard Deviation
• Energy
• Correlation
The mean value represents the DC component of the signal over the window time frame while the stan-
dard deviation allows for the discrimination of similar accelerometer values for differing activities. En-
ergy is a measure of the intensity of movement and is calculated by taking the sum of the squared discrete
FFT magnitudes and dividing by the window length. Correlation enables the differentiation of activities
that involve transition, i.e. between walking, running and stair climbing. Mean heart rate was also
calculated giving a total of thirteen features.
The author wrote a Java class (FeatureExtractor.java) to output the features as attributes to an
.arff file. This class avails of a range of tools to extract the features including the Apache Commons
Math Library (Energy), the Weka API (Correlation) and Schildt and Holmes’ advanced Java primer [13]
(Standard Deviation). The .arff format consists of two sections: a header and a data section. The
header contains the name of the relation (ActivityRecognition), a list of the attributes (extracted features)
and their types. The data is then arranged as a list of instances.
Previous studies have noted the effect of window size and overlap on the performance of a classifier [12],
[11]. The FeatureExtractor class takes these parameters as arguments which allowed for easy
comparison of a range of values. The raw data was sampled at a rate of 75 Hz. A window size of 256,
therefore, equates to 3.4 seconds of activity. Using a window size of 256 and overlap of 50% reduced
110587 labelled readings to 768 usable instances.
4 Results
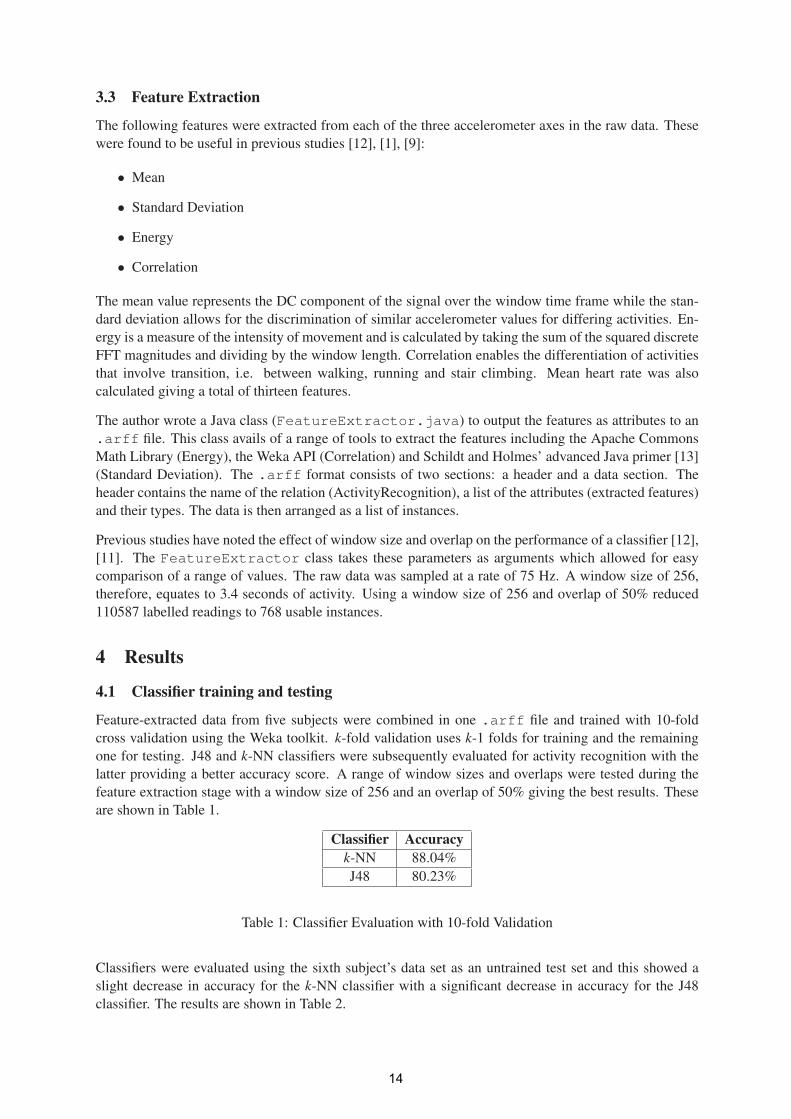
4.1 Classifier training and testing
Feature-extracted data from five subjects were combined in one .arff file and trained with 10-fold
cross validation using the Weka toolkit. k-fold validation uses k-1 folds for training and the remaining
one for testing. J48 and k-NN classifiers were subsequently evaluated for activity recognition with the
latter providing a better accuracy score. A range of window sizes and overlaps were tested during the
feature extraction stage with a window size of 256 and an overlap of 50% giving the best results. These
are shown in Table 1.
Classifier Accuracyk-NN 88.04%
J48 80.23%
Table 1: Classifier Evaluation with 10-fold Validation
Classifiers were evaluated using the sixth subject’s data set as an untrained test set and this showed a
slight decrease in accuracy for the k-NN classifier with a significant decrease in accuracy for the J48
classifier. The results are shown in Table 2.
14

Classifier Accuracyk-NN 84.83%
J48 60.67%
Table 2: Classifier Evaluation with Untrained Test Set
Adding the sixth data set to the other five showed a slight increase in accuracy for both classifiers using
10-fold validation. The results are shown in Table 3.
Classifier Accuracyk-NN 90.07%
J48 83.95%
Table 3: Classifier Evaluation on Six Subject Dataset
4.2 Effects of removing features on classifier accuracy
The effects of removing specific features on classifier accuracy were evaluated and the results are shown
in Table 4.
Removed Feature k-NN J48Mean Heart Rate -5.28% -0.63%
Mean Acceleration -3.16% -2.43%
Standard Deviation -2.42% -2.64%
Correlation +1.17% -2.22%
Energy -0.52% +0.63%
Table 4: Effect of removing specific features on classifier accuracy.
The attribute evaluator CfsSubsetEval was run on the data using the BestFirst search method.
CfsSubsetEval considers each feature’s specific predictive ability to produce a subset of features
that will provide a similar degree of classifier accuracy. This process resulted in a reduction of thirteen
features to seven (meanHeartRate, meanZ, stdX, stdY, stdZ, energyY and energyZ). The
subsequent classifier evaluation using 10-fold validation produced accuracies of 80.78% for J48 and
89.33% for k-NN.
4.3 Specific activity recognition
The Weka-generated confusion matrix for the k-NN classifier is shown in Fig 1. Precision, recall and
F-measure values are also included. Precision reflects the number of correctly identified activities among
those classified as the activity. Recall denotes the proportion of instances classified as activity x, among
all instances that actually are activity x, and is related to the true positive value. The F-measure (2*Pre-
cision*Recall/(Precision+Recall)) combines precision and recall values in a hybrid measure of a test’s
accuracy [14]. The activities easiest to recognise are situps, running and vacuuming with precision val-
ues of 1.0, 0.954 and 0.94 respectively. Walking up and down stairs are shown to be difficult to recognise
with the latter only having a precision value of 0.556.
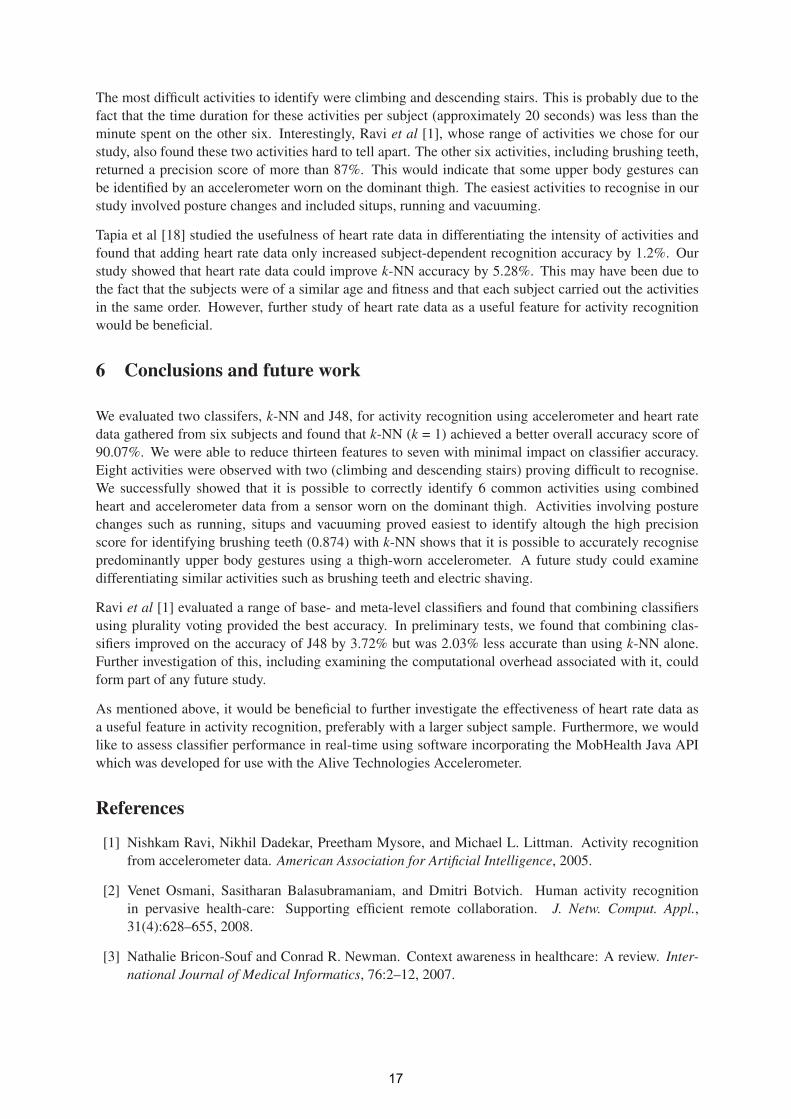
The J48 classifier found situps and running the easiest to recognise with climbing and descending stairs
again proving difficult to differentiate. The precision values for the latter two activities were just 0.478
15
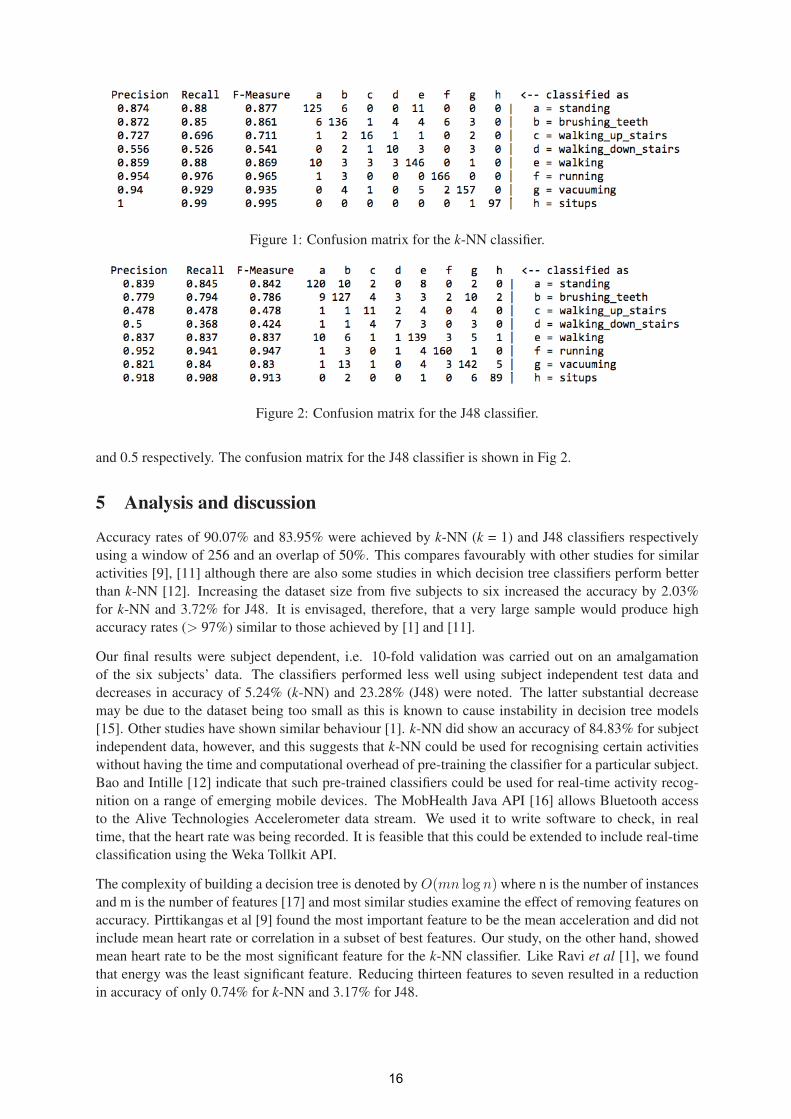
Figure 1: Confusion matrix for the k-NN classifier.
Figure 2: Confusion matrix for the J48 classifier.
and 0.5 respectively. The confusion matrix for the J48 classifier is shown in Fig 2.
5 Analysis and discussion
Accuracy rates of 90.07% and 83.95% were achieved by k-NN (k = 1) and J48 classifiers respectively
using a window of 256 and an overlap of 50%. This compares favourably with other studies for similar
activities [9], [11] although there are also some studies in which decision tree classifiers perform better
than k-NN [12]. Increasing the dataset size from five subjects to six increased the accuracy by 2.03%
for k-NN and 3.72% for J48. It is envisaged, therefore, that a very large sample would produce high
accuracy rates (> 97%) similar to those achieved by [1] and [11].
Our final results were subject dependent, i.e. 10-fold validation was carried out on an amalgamation
of the six subjects’ data. The classifiers performed less well using subject independent test data and
decreases in accuracy of 5.24% (k-NN) and 23.28% (J48) were noted. The latter substantial decrease
may be due to the dataset being too small as this is known to cause instability in decision tree models
[15]. Other studies have shown similar behaviour [1]. k-NN did show an accuracy of 84.83% for subject
independent data, however, and this suggests that k-NN could be used for recognising certain activities
without having the time and computational overhead of pre-training the classifier for a particular subject.
Bao and Intille [12] indicate that such pre-trained classifiers could be used for real-time activity recog-
nition on a range of emerging mobile devices. The MobHealth Java API [16] allows Bluetooth access
to the Alive Technologies Accelerometer data stream. We used it to write software to check, in real
time, that the heart rate was being recorded. It is feasible that this could be extended to include real-time
classification using the Weka Tollkit API.
The complexity of building a decision tree is denoted by O(mn log n) where n is the number of instances
and m is the number of features [17] and most similar studies examine the effect of removing features on
accuracy. Pirttikangas et al [9] found the most important feature to be the mean acceleration and did not
include mean heart rate or correlation in a subset of best features. Our study, on the other hand, showed
mean heart rate to be the most significant feature for the k-NN classifier. Like Ravi et al [1], we found
that energy was the least significant feature. Reducing thirteen features to seven resulted in a reduction
in accuracy of only 0.74% for k-NN and 3.17% for J48.
16
The most difficult activities to identify were climbing and descending stairs. This is probably due to the
fact that the time duration for these activities per subject (approximately 20 seconds) was less than the
minute spent on the other six. Interestingly, Ravi et al [1], whose range of activities we chose for our
study, also found these two activities hard to tell apart. The other six activities, including brushing teeth,
returned a precision score of more than 87%. This would indicate that some upper body gestures can
be identified by an accelerometer worn on the dominant thigh. The easiest activities to recognise in our
study involved posture changes and included situps, running and vacuuming.
Tapia et al [18] studied the usefulness of heart rate data in differentiating the intensity of activities and
found that adding heart rate data only increased subject-dependent recognition accuracy by 1.2%. Our
study showed that heart rate data could improve k-NN accuracy by 5.28%. This may have been due to
the fact that the subjects were of a similar age and fitness and that each subject carried out the activities
in the same order. However, further study of heart rate data as a useful feature for activity recognition
would be beneficial.
6 Conclusions and future work
We evaluated two classifers, k-NN and J48, for activity recognition using accelerometer and heart rate
data gathered from six subjects and found that k-NN (k = 1) achieved a better overall accuracy score of
90.07%. We were able to reduce thirteen features to seven with minimal impact on classifier accuracy.
Eight activities were observed with two (climbing and descending stairs) proving difficult to recognise.
We successfully showed that it is possible to correctly identify 6 common activities using combined
heart and accelerometer data from a sensor worn on the dominant thigh. Activities involving posture
changes such as running, situps and vacuuming proved easiest to identify altough the high precision
score for identifying brushing teeth (0.874) with k-NN shows that it is possible to accurately recognise
predominantly upper body gestures using a thigh-worn accelerometer. A future study could examine
differentiating similar activities such as brushing teeth and electric shaving.
Ravi et al [1] evaluated a range of base- and meta-level classifiers and found that combining classifiers
using plurality voting provided the best accuracy. In preliminary tests, we found that combining clas-
sifiers improved on the accuracy of J48 by 3.72% but was 2.03% less accurate than using k-NN alone.
Further investigation of this, including examining the computational overhead associated with it, could
form part of any future study.
As mentioned above, it would be beneficial to further investigate the effectiveness of heart rate data as
a useful feature in activity recognition, preferably with a larger subject sample. Furthermore, we would
like to assess classifier performance in real-time using software incorporating the MobHealth Java API
which was developed for use with the Alive Technologies Accelerometer.
References
[1] Nishkam Ravi, Nikhil Dadekar, Preetham Mysore, and Michael L. Littman. Activity recognition
from accelerometer data. American Association for Artificial Intelligence, 2005.
[2] Venet Osmani, Sasitharan Balasubramaniam, and Dmitri Botvich. Human activity recognition
in pervasive health-care: Supporting efficient remote collaboration. J. Netw. Comput. Appl.,31(4):628–655, 2008.
[3] Nathalie Bricon-Souf and Conrad R. Newman. Context awareness in healthcare: A review. Inter-national Journal of Medical Informatics, 76:2–12, 2007.
17

[4] Jesus Favela, Monica Tentori, Luis A. Castro, Victor M. Gonzalez, Elisa B. Moran, and Ana I.
Martınez-Garcıa. Activity recognition for context-aware hospital applications: issues and opportu-
nities for the deployment of pervasive networks. Mob. Netw. Appl., 12(2-3):155–171, 2007.
[5] J. Boyle, M. Karunanithi, T. Wark, W. Chan, and C. Colavitti. Quantifying functional mobility
progress for chronic disease management. In Engineering in Medicine and Biology Society, 2006.EMBS ’06. 28th Annual International Conference of the IEEE, pages 5916–5919, 2006.
[6] Erich P. Stuntebeck, II John S. Davis, Gregory D. Abowd, and Marion Blount. Healthsense: clas-
sification of health-related sensor data through user-assisted machine learning. In HotMobile ’08:Proceedings of the 9th workshop on Mobile computing systems and applications, pages 1–5, New
York, NY, USA, 2008. ACM.
[7] Yen-Ping Chen, Jhun-Ying Yang, Shun-Nan Liou, Gwo-Yun Lee, and Jeen-Shing Wang. Online
classifier construction algorithm for human activity detection. Applied Mathematics and Computa-tion, 205(2):849–860, 2008.
[8] Emmanuel Munguia Tapia. Using Machine Learning for Real-time Activity Recognition and Esti-mation of Energy Expenditure. PhD thesis, Massachusetts Institute of Technology, 2008.
[9] Pirttikangas S., Fujinami K., and Nakajima T. Feature selection and activity recognition from wear-
able sensors. In International Symposium on Ubiquitous Computing Systems (UCS2006), 2006.
International Symposium on Ubiquitous Computing Systems (UCS2006), Seoul, Korea, Oct. 11 -
13, 2006, pp. 516-527.
[10] Stephen R. Garner. Weka: The waikato environment for knowledge analysis. In In Proc. of theNew Zealand Computer Science Research Students Conference, pages 57–64, 1995.
[11] Clemens Lombriser, Nagendra B. Bharatula, Daniel Roggen, and Gerhard Troster. On-body activity
recognition in a dynamic sensor network. In BodyNets ’07: Proceedings of the ICST 2nd interna-tional conference on Body area networks, pages 1–6, ICST, Brussels, Belgium, Belgium, 2007.
ICST (Institute for Computer Sciences, Social-Informatics and Telecommunications Engineering).
[12] Ling Bao and Stephen S. Intille. Activity recognition from user-annotated acceleration data. In
Pervasive 2004, pages 1–17. Springer, 2004.
[13] Herbert Schildt and James Holmes. The Art of Java. McGraw-Hill Osborne Media, 2003.
[14] Remco R. Bouckaert, Eibe Frank, Mark Hall, Richard Kirkby, Peter Reutemann, Alex Seewald,
and David Scuse. WEKA Manual for Version 3-6-0. The University of Waikato, 2008.
[15] WekaDocs. Classification Trees, 2009. http://wekadocs.com/node/2 Accessed Online: 20/08/2009.
[16] MobHealth. MobHealth Java API for Accelerometer/Heart Rate Data Capture. 2008.
http://sourceforge.net/projects/mobhealth.
[17] Ian H. Witten and Eibe Frank. Data Mining: Practical Machine Learning Tools and Techniques,Second Edition (Morgan Kaufmann Series in Data Management Systems). Morgan Kaufmann,
June 2005.
[18] E.M. Tapia, S.S. Intille, W. Haskell, K. Larson, J. Wright, A. King, and R. Friedman. Real-time
recognition of physical activities and their intensities using wireless accelerometers and a heart rate
monitor. pages 37–40, Oct. 2007.
18
An Improved CamShift Algorithm for Target Tracking in
Video Surveillance
Chunrong Zhang1, 2, 3, Yuansong Qiao1,2, Enda Fallon1, Changqiao Xu2
1 Software Research Institute, Athlone Institute of Technology, Athlone, Ireland
2 Institute of Software, Chinese Academy of Sciences, Beijing, China 3Graduate University of the Chinese Academy of Sciences, Beijing, China
[email protected], {ysqiao, efallon}@ait.ie, [email protected]
Abstract
Target tracking in a cluttered environment remains a challenging research topic. The task of target tracking is a key component of video surveillance and monitoring systems. In this paper, we present an improved CamShift algorithm for tracking a target in video sequences in real time. Firstly, a background-weighted histogram which helps to distinguish the target from the background and other targets is introduced. Secondly, the window size is calculated to track the target as its shape and orientation change. Finally, we use a Kalman Filter to avoid being trapped by a local maximum. The introduction of the Kalman Filter also enables track recovery following a total occlusion. Experiments on various video sequences illustrate the proposed algorithm performs better than the original CamShift approach.
Key words: Target tracking; CamShift ; Kalman filter ; Background-weighted histogram
1 Introduction Network video surveillance has been a popular security application for many years. Target tracking in a cluttered environment remains one of the challenging problems of video surveillance. The task of target tracking is a key component of video surveillance and monitoring systems [1]. It provides input to high-level processing such as recognition [2], access control, or re-identification, or is used to initialize the analysis and classification of human activities. Tracking algorithms can be classified into two major groups, namely state-space approach and kernel-based approach. State-space approaches are based largely on probability, stochastic processes and estimation theory, which, when combined with systems theory and combinatorial optimization, lead to
19

a plethora of approaches, such as Kalman filter, Extended Kalman Filter (EKF) [3], Unscented Kalman Filter (UKF)[4], Particle Filter (PF)[5]. The ability to recover from lost tracks makes State-space approach one of the most used tracking algorithms. However, some of them require high computational costs so they are not appropriate for real time video surveillance systems. The Mean Shift (MS) algorithm is a non-parametric method which belongs to the second group. MS is an iterative kernel-based deterministic procedure which converges to a local maximum of the measurement function under certain assumptions about the kernel behaviors [6]. CamShift (Continuously Adaptive Mean Shift) algorithm [7] is based on an adaptation of mean shift that, given a probability density image, finds the mean (mode) of the distribution by iterating in the direction of maximum increase in probability density. CamShift algorithm has recently gained significant attention as an efficient and robust method for visual tracking. A number of attempts have been made to achieve robust, high-performance target tracking [8][9][10]. CamShift algorithm is a low complexity algorithm, which provides a general and reliable solution independent of the features representing the target. But it has some important inherent drawbacks. Firstly , the algorithm may fail to track multi-hued targets or targets where hue alone cannot allow the target to be distinguished from the background and other targets. Secondly, CamShift is primarily intended to perform efficient head and face tracking in a perceptual user interface, it may lose the target when the target’s shape and orientation are changing. Thirdly, CamShift, like the mean shift algorithm, can only be used to find local modes [11]. It fails in tracking small and fast moving targets (interframe displacement larger than their size) because it is trapped in a local maximum. Finally, for single stationary camera surveillance, target occlusion is a common phenomenon owing to the limitation of camera views. CamShift cannot track the target when a total occlusion happens. The algorithm proposed here is using a tracker representing the center of the target. The tracker tracks the target by the CamShift algorithm. Then, to avoid being trapped by a local maximum, we search the true maximum beyond the local one by using the Kalman Filter. In the meantime, the Kalman Filter can also help to recover a track after a total occlusion. In addition, we use the background-weighted histogram to distinguish the target from the background. The rest of the paper is organized as follows: Section 2 presents the original mean shift and CamShift algorithms. The proposed tracking algorithm is developed and analyzed in Section 3. Experiments and comparisons are given in Section 4, and the conclusion is in Section 5.
2 The Original CamShift Algorithm 2.1 Mean Shift Algorithm The mean-shift algorithm is a non-parametric density gradient estimator. It is basically an iterative expectation maximization clustering algorithm executed within local search regions. Comaniciu has adapted the mean-shift for the tracking of manually initialized targets [12]. The mean-shift tracker provides accurate localization and it is computationally feasible.
20

A widely used form of target representation is color histograms, because of its independence from scaling and rotation and its robustness to partial occlusions. Define the target model as its normalized color histogram, q = {qu}1,...m,
��� � � � ��� ���
��� ����� � � �� (1)
where m is the number of bins. The normalized color distribution of a target candidate p(y) = {pu(y)}1,...nh centered in y can be calculated as
���� � �� � � ���� !�
��
"�#��� ������ � �� (2)
where {xi},i=1,...nh are the nh pixel locations of the target candidate in the target area,$����$associates the pixel xi to the histogram bin, k(x) is the kernel profile with bandwidth h, and$�� is a normalization function defined as
�� � �
� %��&'(!
# �)
"*#!+,
(3)
In order to calculate the likelihood of a candidate we need a similarity function which defines a distance between the model and the candidate. A metric can be based on the Bhattacharyya coefficient [13], defined between two normalized histograms p(y) and q as
�����- �� � � .����- ��/��� (4)
Hence we define the distance as
0����- �� � .1 � �����- �� (5)
To track the target using the Mean Shift algorithm, it iterates the following steps: 1. Choose a search window size and the initial location of the search window. 2. Compute the mean location in the search window. 3. Center the search window at the mean location computed in Step 2. 4. Repeat Steps 2 and 3 until convergence (or until the mean location moves less than a preset threshold).
2.2 CamShift Algorithm
In the CamShift Algorithm, a probability distribution image of the desired color in the video sequence is created. It first creates a model of the desired hue using a color histogram and uses the Hue Saturation Value (HSV) color system [14] that corresponds to projecting standard RGB color space along its principal diagonal from white to black. Color distributions derived from video image sequences change over time, so the mean shift algorithm has to be modified to adapt dynamically to the probability distribution it is tracking. CamShift is primarily intended to perform efficient head and face tracking in a perceptual user interface. For face tracking, CamShift tracks the X, Y, and Area of the flesh color probability distribution representing a face. Area is proportional to Z, the distance from the camera. Head roll is also tracked as a further degree of freedom. Then Bradski [7] uses the X, Y, Z, and Roll derived from CamShift target tracking as a perceptual user interface for controlling commercial computer games and for exploring 3D graphic virtual worlds.
21
CamShift algorithm is based on an adaptation of mean shift algorithm. And it is calculated as:
1. Choose the initial location of the search window. 2. Mean Shift as above (one or many iterations); store the zeroth moment. 3. Set the search window size equal to a function of the zeroth moment found in Step 2. 4. Repeat Steps 2 and 3 until convergence (mean location moves less than a preset threshold).
For discrete 2D image probability distributions, the mean location (the centroid) within the search window can be found by the zeroth moment. The window size, s, can also be set by the zeroth moment. The 2D orientation of the probability distribution is also easy to obtain by using the second moments, and then length, l, and width, w, of the target can be calculated.
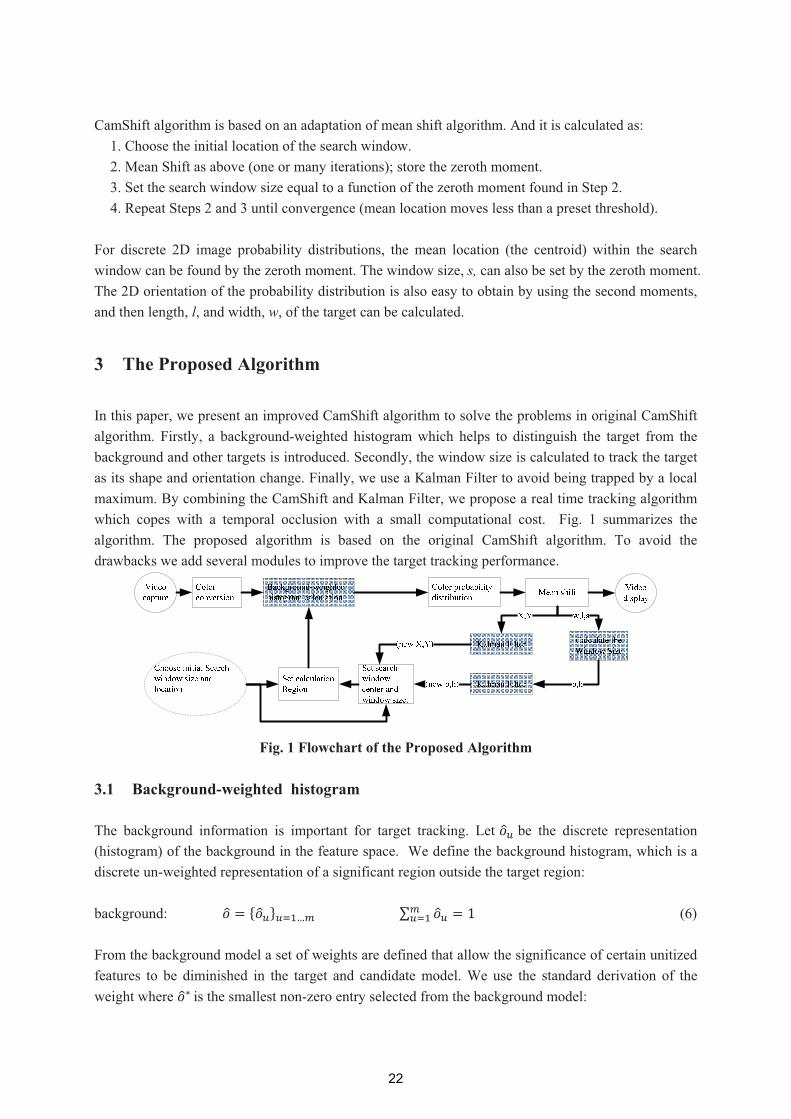
3 The Proposed Algorithm In this paper, we present an improved CamShift algorithm to solve the problems in original CamShift algorithm. Firstly, a background-weighted histogram which helps to distinguish the target from the background and other targets is introduced. Secondly, the window size is calculated to track the target as its shape and orientation change. Finally, we use a Kalman Filter to avoid being trapped by a local maximum. By combining the CamShift and Kalman Filter, we propose a real time tracking algorithm which copes with a temporal occlusion with a small computational cost. Fig. 1 summarizes the algorithm. The proposed algorithm is based on the original CamShift algorithm. To avoid the drawbacks we add several modules to improve the target tracking performance.
Fig. 1 Flowchart of the Proposed Algorithm
3.1 Background-weighted histogram The background information is important for target tracking. Let 2��$be the discrete representation (histogram) of the background in the feature space. We define the background histogram, which is a discrete un-weighted representation of a significant region outside the target region: background: 2� � 32��4���5/ � 2��
/��� � 1 (6)
From the background model a set of weights are defined that allow the significance of certain unitized features to be diminished in the target and candidate model. We use the standard derivation of the weight where 2� $is the smallest non-zero entry selected from the background model:
22

feature weights: 67� � 89: ;<�
<�=- 1>?
���5/ (7)
These weights are employed to define a transformation for the representations of the target model and candidates. The transformation diminishes the importance of those features which have low 7� , i.e., are prominent in the background. Compare with (1), the new target model representation is then defined by
��� � �7� � ��� ���
��� ����� � � �� (8)>
with the normalization constant � expressed as
� � �� %;@ !
@)>*!+, � A=BCDE !
F��GH=+,
(9)
Compare with (2) and (3), similarly, the new target candidate representation is
���� � ��7� � � ���� !�
��
"�#��� ������ � �� (10)
Uwhere now �� is given by
j�� � �
� %��&'(!
# �)
" � A=B�D !����H=+,
*#!+,
(11)
3.2 Calculate the Search Window Size In CamShift, the size s of the search window can be found. For tracking faces, Camshift sets window width to s and window length to 1.2s since faces are somewhat elliptical. But in other tracking systems, the accurate width and height of the window (ROI) are unknown. Also, the shape and orientation of the targets are changing. To solve this problem, we calculate the width and the height of the search window. Suppose the width is b, the height is h, the size is s, then:
b*h =s2 (12) The search window should be proportional to the axis, so compute the length axis l and width axis w from the distribution centroid, we can get:
b/ h = w/l (13) Then:
� � .IJK L M � .KJI L (14)
Considering the target orientation$N, the width bn and the height hn of ROI can be found using the following formulae.
�O � � P2L N Q M LRO N� MO � � S9: N QM TUS N� (15)
Experimental results show that when N is small, computing b and h is sufficient. For other values of N, bn and bh are better. 3.3 Kalman filter
23

The Kalman filter algorithm belongs to the state-space approach class of tracking algorithms. It solves the tracking problem based on the state-space equation and the measurement equation. To avoid being trapped by a local maximum, we first use one Kalman Filter to search the true maximum beyond the local one. The Kalman Filter is used to locate the start point that CamShift will search. We define the state-space equation:
V
�%W��%W�7 %W�7�%W�
X � Y1 ZZ 1
[ ZZ [
Z ZZ Z
1 ZZ 1
\*V
�%�%7 %7�%
X+ Wk (16)
and the measurement equation:
]�^%�^%
_ � ]1 ZZ 1
Z ZZ Z_ V
�%�%7 %7�%
X+ Vk (17)
Where k�1, Wk is a white Gaussian noise with diagonal variance Q, Vk is a white Gaussian noise with diagonal variance R.$�%- �%$$is the centroid of the search window, �^%- �^%$is the current measurement
of the centroid.$ 7 %$- 7�%is the velocity (displacement) of the target. T is the interval between the
frames. In addition, we use another Kalman Filter to predict the search window’s width, b, and height h (15). We define the state-space equation:
V
�%W�M%W�D%W��%W�
X � Y1 ZZ 1
[ ZZ [
Z ZZ Z
1 ZZ 1
\*V
�%M%D%�%
X+ Uk (18)
and the measurement equation:
a�^%M^%
b � ]1 ZZ 1
Z ZZ Z_ V
�%M%D%�%
X+ Zk (19)
where �%- M%$$is the width and height of the search window, �^%- M^%$is the current measurement of the width and height. D%- �% is the ratio of scale of the windows which is proportional to the scale of the target. So with two Kalman Filters we can give more accurate the centroid and the size of the search window for CamShift.
4 Experiments To compare the results of the original CamShift and the proposed algorithm, we experimented on various video sequences, Highway, face, and cup. These video sequences have been obtained by a camera with 25 per sec frame rate. And the frame has the size 320 240. In figures 2, 3, and 4 the first
24
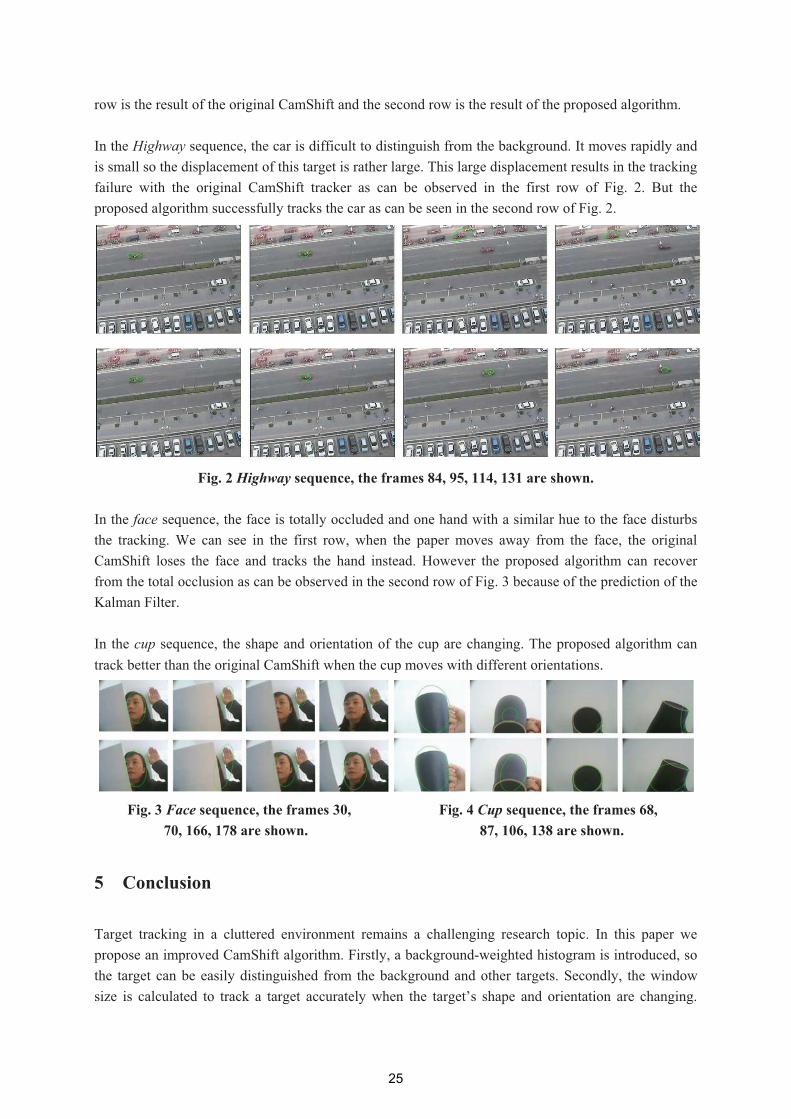
row is the result of the original CamShift and the second row is the result of the proposed algorithm. In the Highway sequence, the car is difficult to distinguish from the background. It moves rapidly and is small so the displacement of this target is rather large. This large displacement results in the tracking failure with the original CamShift tracker as can be observed in the first row of Fig. 2. But the proposed algorithm successfully tracks the car as can be seen in the second row of Fig. 2.
Fig. 2 Highway sequence, the frames 84, 95, 114, 131 are shown.
In the face sequence, the face is totally occluded and one hand with a similar hue to the face disturbs the tracking. We can see in the first row, when the paper moves away from the face, the original CamShift loses the face and tracks the hand instead. However the proposed algorithm can recover from the total occlusion as can be observed in the second row of Fig. 3 because of the prediction of the Kalman Filter. In the cup sequence, the shape and orientation of the cup are changing. The proposed algorithm can track better than the original CamShift when the cup moves with different orientations.
Fig. 3 Face sequence, the frames 30, Fig. 4 Cup sequence, the frames 68, 70, 166, 178 are shown. 87, 106, 138 are shown.
5 Conclusion Target tracking in a cluttered environment remains a challenging research topic. In this paper we propose an improved CamShift algorithm. Firstly, a background-weighted histogram is introduced, so the target can be easily distinguished from the background and other targets. Secondly, the window size is calculated to track a target accurately when the target’s shape and orientation are changing.
25
Finally, to avoid being trapped by a local maximum, we search the true maximum beyond the local one by using the Kalman Filter. By combining the CamShift and Kalman Filter, we propose a real time tracking algorithm which copes with a temporal occlusion with a small computational cost. So the proposed algorithm enhances the robustness to occlusion, avoids being trapped by a local maximum, and it can track the target accurately despite its shape and orientation change. Compared with the original CamShift algorithm, the improved CamShift algorithm shows its superior performance in various video sequences. To further enhance the capabilities of the tracker, future work includes investigating a new target representations scheme with spatial information. Other discriminative features will be adopted for better localization and tracking performance, rather than relying solely on simple color histograms. Also we will consider adding illumination adaptation modules into the current framework to provide an even more robust tracking algorithm.
References [1] R.T. Collins, A.J. Lipton, T. Kanade, "A System for Video Surveillance and Monitoring",
American Nuclear Society Eight Intern. Topical Meeting on Robotics and Remote Systems, 1999. [2] PARK, S. AND AGGARWAL, J. K. 2004. A hierarchical bayesian network for event recognition
of human actions and interactions. Multimed. Syst. 10, 2, 164–179. [3] Yaakov Bar-Shalom and Thomas E. Fortmann. 1988, Tracking and Data Association. Academic
Press, 1988. [4] Simon J. Julier. and Jeffrey K. 1997 “A new extension of the Kalman filter to nonlinear systems,”
in Proc. SPIE ,Vol. 3068, p. 182-193 [5] K. Nummiaro, E. Koller-Meier, and L. Van Gool, A color-based particle filter, in Proc.of the
1st Workshop on Generative-Model-Based Vision, June 2002, pp. 53 60. [6] R. T. Collins. Mean-shift blob tracking through scale space. In Proceedings of the IEEE
Conference on Computer Vision and Pattern Recognition, 2003. [7] G. R. Bradski. “Computer vision face tracking for use in a perceptual user interface”, Intel
Technology Journal, 2nd Quarter, 1998. [8] Z. Zivkovic and B. Krose. An EM-like algorithm for colorhistogram-based object tracking. In
CVPR, 2004. [9] Nouar, O.-D.; Ali, G.; Raphael, C.2006,Improved Object Tracking With Camshift Algorithm,
IEEE ICASSP 2006, Volume 2, 14-19 May 2006 . [10] Hongxia Chu et al. 2007, Object Tracking Algorithm Based on Camshift Algorithm Combinating
with Difference in Frame, IEEE Automation and Logistics,18-21 Aug. 2007, page: 51-55 [11] B. Georgescu, I. Shimshoni, P. Meer, Mean shift based clustering in high dimensions:A texture
classification example, in: :IEEE Int l Conf. on Comp.Vision, Vol. 2, Nice, France, 2003, pp. 456 463.
[12] D. Comaniciu, V. Ramesh, P. Meer, “Kernel-Based Object Tracking”, IEEE Trans. on Pattern Analysis and Machine Intelligence, vol.25, No. 5, 2003.
[13] T.Kailath, The divergence and bhattacharyya distance measures in signal selection, IEEE Trans. Comm. Technology, vol. 15, pp. 52 60, 1967.
[14] A.R. Smith, “Color Gamut Transform Pairs,” SIGGRAPH 78, pp. 12-19, 1978.
26

Session 2
E-Learning
27

�
28
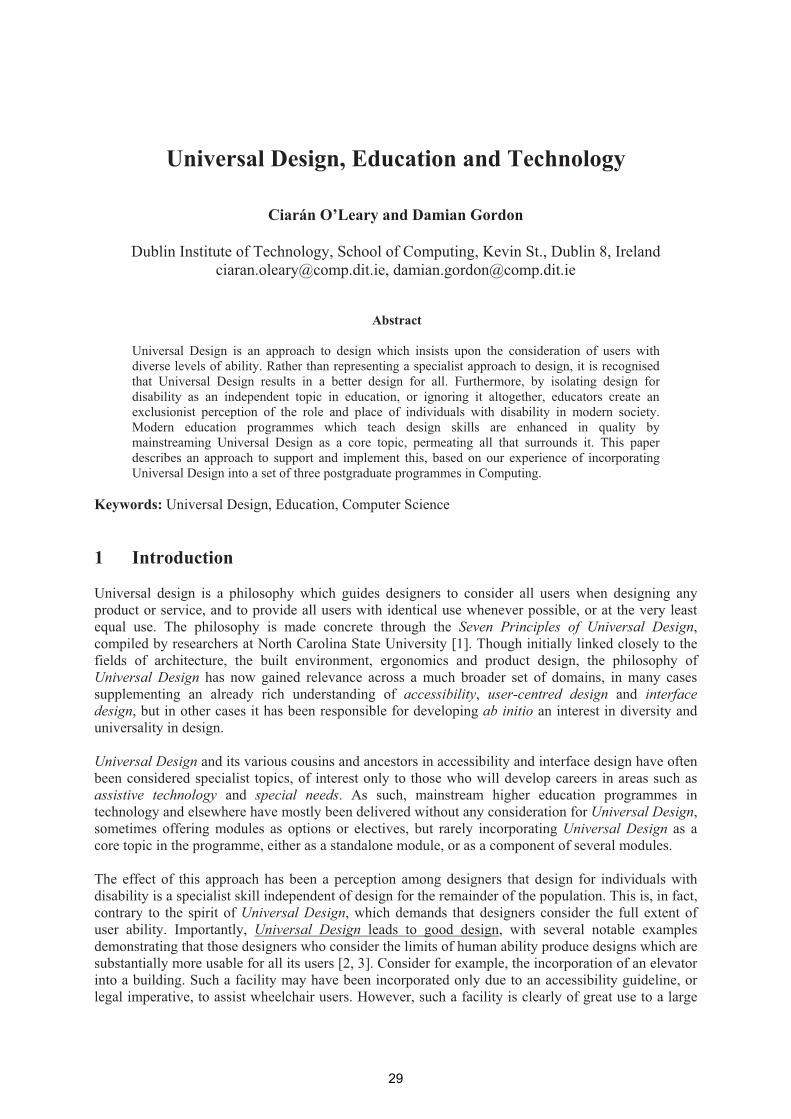
Universal Design, Education and Technology
Ciarán O’Leary and Damian Gordon
Dublin Institute of Technology, School of Computing, Kevin St., Dublin 8, Ireland [email protected], [email protected]
Abstract
Universal Design is an approach to design which insists upon the consideration of users with diverse levels of ability. Rather than representing a specialist approach to design, it is recognised that Universal Design results in a better design for all. Furthermore, by isolating design for disability as an independent topic in education, or ignoring it altogether, educators create an exclusionist perception of the role and place of individuals with disability in modern society. Modern education programmes which teach design skills are enhanced in quality by mainstreaming Universal Design as a core topic, permeating all that surrounds it. This paper describes an approach to support and implement this, based on our experience of incorporating Universal Design into a set of three postgraduate programmes in Computing.
Keywords: Universal Design, Education, Computer Science
1 Introduction
Universal design is a philosophy which guides designers to consider all users when designing any product or service, and to provide all users with identical use whenever possible, or at the very least equal use. The philosophy is made concrete through the Seven Principles of Universal Design,compiled by researchers at North Carolina State University [1]. Though initially linked closely to the fields of architecture, the built environment, ergonomics and product design, the philosophy of Universal Design has now gained relevance across a much broader set of domains, in many cases supplementing an already rich understanding of accessibility, user-centred design and interfacedesign, but in other cases it has been responsible for developing ab initio an interest in diversity and universality in design.
Universal Design and its various cousins and ancestors in accessibility and interface design have often been considered specialist topics, of interest only to those who will develop careers in areas such as assistive technology and special needs. As such, mainstream higher education programmes in technology and elsewhere have mostly been delivered without any consideration for Universal Design,sometimes offering modules as options or electives, but rarely incorporating Universal Design as a core topic in the programme, either as a standalone module, or as a component of several modules.
The effect of this approach has been a perception among designers that design for individuals with disability is a specialist skill independent of design for the remainder of the population. This is, in fact, contrary to the spirit of Universal Design, which demands that designers consider the full extent of user ability. Importantly, Universal Design leads to good design, with several notable examples demonstrating that those designers who consider the limits of human ability produce designs which are substantially more usable for all its users [2, 3]. Consider for example, the incorporation of an elevator into a building. Such a facility may have been incorporated only due to an accessibility guideline, or legal imperative, to assist wheelchair users. However, such a facility is clearly of great use to a large
29
number of non-wheelchair users. Parents with buggies, delivery personnel or people with luggage are all examples of people for whom the design is improved through the incorporation of the elevator.
The same applies for products and services outside the built environment. Websites are perhaps one of the best examples of an area which has seen considerable effort and attention directed towards accessibility and Universal Design [4]. While accessibility implies that the resulting product should be able to offer a service to individuals with a disability, Universal Design goes further than this, by insisting that wherever possible, the same product offers the same service to all people, and by insisting that this creates a better product for all users. Websites with a text-only version, for example, may be accessible, but hardly Universally Designed. Cases are reported, for example, where the alternative, or accessible version of an online shopping website did not present users with special offers [5]. In contrast, some Universally Designed websites present a highly configurable interface to the user who is not penalised in any way for changing the colour scheme, resizing or using an assistive technology such as a screen reader to interact with the website [6].
In the past academic year, a module entitled Universal Design was delivered to students on a set of three MSc programmes in the School of Computing, at the Dublin Institute of Technology. The three MSc programmes contributed to a student cohort which was diverse in background and career specialisation, as well as the typical diversity expected of all programmes. The module was core to the students undertaking the MSc Assistive Technology (AT), but was available as an elective module to students on the MSc Knowledge Management (KM) and MSc Information Technology (IT). Students on the MSc AT already have a rich background in related and relevant topics such as ergonomics,accessible web design and special needs education and their intended career progression is towards accessibility consultation. As such, Universal Design represents a core competency for this area. Graduates of the MSc KM operate as knowledge analysts and architects in knowledge-rich organisations across the private and public sectors. Universal Design would not typically be considered a core competency in these roles, but we recognise that a key function of analysts and architects is design, which can be significantly enhanced by the principles and philosophy of Universal Design. Equally, graduates of the MSc IT, while qualified to work as software engineers and Information Technology managers, would benefit significantly from a deep understanding of Universal Design, its application to software, and its support for the successful marketing and sale of software products.
This paper consists of an experiential report on the delivery of the module described above. It incorporates reflections on the module itself, and well as the positioning of the module within the respective programmes. This discussion includes reflections on the process by which the instructional material was designed and delivered to the students, according to the principles of Universal Design. The core contribution of this work is a clear and supported set of guidelines for the inclusion of the topic of Universal Design in higher level education programmes. These guidelines will support the future development of our own programmes, as well as contributing to the growing body of literature addressing Universal Design in education, and education of Universal Design.
Section 2 details the seven principles of Universal Design, and addresses their applicability to their domain of origin and other domains of interest. Section 3 outlines the relationships which exist between Universal Design and more established related topics such as accessibility, usability, user-centred design and assistive technology. This serves to highlight the means through which Universal Design could be seamlessly integrated with existing programmes, as a temporary measure awaiting a fuller redesign. Section 4 describes the delivery of the module, identifying the learning outcomes, the learning and teaching methods, the assessment methods and the content of the module. This serves as an initial template for equivalent and related modules. Section 5 provides the guidelines as discussed above, to support the mainstreaming of Universal Design through programmes for technologists. The remaining sections summarise and conclude.
30
2 Universal Design
Assistive technology is the term used to describe those specialised technologies which assist individuals with disabilities. A walking stick, for example, is an assistive technology, as is screen reading software. In truth, all inventions represent some new form of technology, and such inventions would swiftly disappear were they not assistive to someone. Email software, for example, assists users in communicating, cars assist people in travelling, music players assist people in relaxing (or not) and so on. A problem with some technologies, indeed many technologies, is that while they were designed to assist users, the reliance that is placed upon them by society has resulted in an exclusion of other users. Stairs represent an excellent invention for multi-story buildings (to continue the elevator example from earlier), but they clearly serve to exclude all but those who can easily use them. The World-Wide-Web is an incredible technology which initially served to disseminate information, but now allows many diverse uses, and indeed often represents the only means of interaction with certain organisations. Mobile phones, televisions, video recorders, kitchen appliances, music players, and the personal computer all represent technologies which assist their users in performing some operation and fulfilling some activity. Unlike conventional assistive technologies which are aimed specifically at users with a disability, these technologies are often designed for users without any significant disability, and can therefore only assist those users.
Universal Design addresses this specific problem. Technology, when being designed to assist users, must be designed such that it can assist all users, in so far as possible. This represents a design challenge, but often one that is easily met at the early stages of design. A multi-story building designed with an elevator costs only marginally more than a building without an elevator, when considered at the early stages of design. A multi-story building designed without an elevator that subsequently needs to be modified to incorporate an elevator may cost marginally less initially, but will cost substantially more in the long term. The same applies across the board, leading to the position that Universal Design is a process, or at least an aspect of a process, rather than an activity that can be applied at the end of a design.
A software engineer who completes a product and delivers it to a customer who is then asked to makeit accessible because a new hire in the company has a disability faces a significant problem. Accessibility by users with disabilities is not simply a matter of modifying an interface, it is something which affects the entire design. In order to make a software product accessible, for example, it may be necessary to provide word suggestions as data is being entered. This, in turn, can affect how data is being handled as it is entered, stored and persisted to a database. Word suggestions, as well as making the software product more accessible, will make the product more usable for all users, and more appealing to a wider market of potential customers. Consider all users, present and potential, is a useful mantra for Universal Design, which promises a better design for all users.
The world of technology is moving on from adapted interfaces being considered sufficient for inclusion. Ostroff [7] argues convincingly that the 1954 ruling of the United States Supreme Court on the case of Brown -v- The Board of Education outlawed the argument of separate but equal. While this judgment was made in respect of the institutional apartheid of many of the southern states at the time, the lesson is clear for other problems and in other countries. Clearly, Universal Design is motivated by the need to do the right thing, but as in all such cases, where a reliance is placed on altruism and self regulated ethics, this is both patronising and unsustainable. As such, many jurisdictions have legislated for Universal Design, often not by name, but in spirit. Laws punishing those who discriminate have proliferated in the past decades, but often discrimination was considered only in terms of housing or employment. In the United States, the 1968 Architectural Barriers Act required that all federal buildings be accessible to all. This was supplemented by the Rehabilitation Act of 1973, the Americans with Disabilities Act of 1990 and the Telecommunications Act of 1996, as well as others such that now it is a legal requirement for buildings, places of employment and information technology to be accessible, if in receipt of public funding. Ireland’s most important act in this area was the 2005 Disability Act [8], which, for the first time globally, included in legislation a definition of Universal Design, established an advisory Centre for Excellence in Universal Design as
31

part of the National Disability Authority, and required that in so far as is possible, courses of education in Universal Design be made available to practitioners for whom it is relevant.
While the legislative imperatives are strong, two of the strongest motivations for Universal Design are self-motivated and non-altruistic. Such motivations are always the most sustainable. Firstly, the economic benefits of Universal Design are due to both improved public perception of a product and an expanded target market. Secondly, Universal Design represents a design challenge which drives new technology. Natural language processing, speech recognition, image processing, text messaging, interface design and wireless communication are all areas of technology where developments were motivated, at least in part, by the needs of users with disability. Currently, the Google Image Labeller [9], derived from the extraordinary ideas of Luis van Ahn, owes much to van Ahn’s recognition of the barriers faced by visually impaired and blind web users when presented with an image. Coupled with the opportunity image labelling afforded Google to provide a better image search engine, the new technology represents the biggest leap forward, probably ever, in the labelling of enormous databases of images. Notable historical precedents for this are the invention of both the telephone and the typewriter (by Alexander Graham Bell and Rasmus Malling-Hansen respectively).
Those who take Universal Design seriously recognise the diversity of the potential user base, identify potential barriers, and anticipate the future profile of users. Given how our global population is rapidly ageing, to the degree that by 2040 it is expected that there will be more human beings alive over the age of 65 than under the age of 5 [10], it is becoming more and more important that designers of all products, environments and technologies consider how their inventions and creations will be used by individuals with declining motor, visual, hearing and cognitive abilities. As Suzman observes, “Global ageing is changing the social and economic nature of the planet” [10].
Universal Design, therefore, is sustainable design.
3 Principles and Guidelines
In brief, the Seven Principles of Universal Design, as presented in 1997 by researchers at North Carolina State University, are as follows:
1. Equitable Use: The design is useful and marketable to people with diverse abilities. 2. Flexibility in Use: The design accommodates a wide range of individual preferences and
abilities.3. Simple and Intuitive Use: Use of the design is easy to understand, regardless of the user's
experience, knowledge, language skills, or current concentration level. 4. Perceptible Information: The design communicates necessary information effectively to the
user, regardless of ambient conditions or the user's sensory abilities. 5. Tolerance for Error: The design minimises hazards and the adverse consequences of accidental
or unintended actions. 6. Low Physical Effort: The design can be used efficiently and comfortably and with a minimum
of fatigue. 7. Size and Space for Approach and Use: Appropriate size and space is provided for approach,
reach, manipulation, and use regardless of user's body size, posture, or mobility.
The first of these principles states quite clearly the overriding philosophy of Universal Design, with the next four principles presenting general, domain independent means of arriving at a Universally Designed product or service. The final two principles are clearly most relevant for the built environment and the design for physical products, and may find less relevance in domains such as software design. Most examples in that domain are reasonably contrived and could probably be better captured with other principles, though some examples do demonstrate the importance of low physical effort in interacting with software interfaces. Any web user who has needed to tab through links because they cannot use the mouse peripheral, or any user who has needed to use a mouth stick to type
32
and scroll through screens of content, will certainly appreciate the relevance of designing software for low physical effort.
In addition to these principles, Gregg Vanderheiden’s Basic Guidelines and Strategies for Access to Electronic Products and Documents [11] present a set of useful means of designing software to be usable by all. For example, the first principle requires that all information be perceivable by users:
� Without vision � With low vision and no hearing � With little or no tactile sensitivity � Without hearing� With impaired hearing � Without reading (due to low vision, learning disability, illiteracy, cognition or other) � Without colour perception � Without causing seizure � From different heights
In addition to the motivation of providing access to individuals with disability, adherence to this principle facilitates access for individuals who cannot look at something due to a distraction (such as driving – perhaps not to be encouraged, but there is little harm, one supposes in one using a screen reader to read a well designed news article while driving), or cannot hear something due to noise in a public area, or simply due to being in a public area and not wishing to make noise (train commuters will relate to this).
Vanderheiden’s other principles set out and justify means and motivations for increasing accessibility, and making interfaces accessible to all. The relationship between his principles and the Web Content Accessibility Guidelines version 2.0 [12] which followed, is clear to observe, as both are based less on a strict set of clear rules and measurements akin to those used by architects when deciding on doorway widths, and more on an understanding of the user and the means through which they interact with products.
User centred, or human centred, design has been a popular approach to design in software and elsewhere for some time. The term, however, leaves itself open to interpretation, with designers often considering that user testing at the end of the process has made their design user centred, or that user interviews at the beginning of the process did likewise. In reality, many of the Agile Software Methods [13] which are rapidly growing in popularity are the most powerful in terms of their involvement of the user. By stipulating that users be present during design, and often part of the design team, the Agile methods provide designers with rapid feedback on the quality of their design and implementation, and allow for swift modification of designs and much more impressive meeting of deadlines with operational, functioning products. Consider the contrast between this approach and the much maligned usability consultant. Usability and good design became key buzzwords in the 1990s due primarily to two gurus of the usability art. Jakob Nielsen frequently compiled Top 10 Mistakeslists based on his own experience of interacting with websites and other software. His word often became gospel with producers and purchasers of software, who would pay for usability tests on software before, or indeed after, release. Donald Norman shot to fame with his book The Psychology of Everyday Things, later renamed to The Design of Everyday Things (the change in title was due to a self confessed recognition of Norman not considering the user / reader who may be intimidated by the slightly more pompous sounding Psychology instead of the easily appreciated Design), which established, described and justified his guidelines for the design of everything from kettles to nuclear power plants. Nielsen and Norman teamed up to form their own consultancy, with much of their work now hidden behind the subscription form on their website. Regardless, the opposition in the software and product design fields to the work of Nielsen and Norman is due to a reluctance to accept that, say, a hyperlink must always be blue. Opponents argue that there is more to design than ease of function, often designs are required to create a mood or react to an attitude. Music websites that need to create a
33
feeling of cool are good examples. Contrast, for example, the clickable images of attractive popstars on music.com to the functional ugliness of Nielsen’s own site (useit.com). Norman recognised the validity of the opposition and followed his influential early work with Emotional Design, a book which sandwiched his earlier behavioural rules, between layers he labelled visceral or reactive, and reflective. At the visceral layer, the designer needs to consider how the user will react to the product – first impressions etc. At the reflective layer, priority is given to how the product makes the person feel about themselves, considering life goals etc. The marketing of branded products appeals exclusively to this level.
The importance of the argument over usability is the recognition that quantitative measures of usability are less effective than the qualitative measures. The hard and fastness of certain rules, while understandable and easily implemented and communicated, does not contribute as much to assessment of usability as observation of users, leading to general principles, perhaps supported by examples or patterns, but not enforced through never and don’t rules. In this respect, Universal Design shares much with user-centred design, usability and similar efforts. The key distinction between Universal Design and user-centred design is its characterisation of the user. While it would be desirable to involve users across the entire spectrum of ability, along various dimensions in the design project, often this is not possible. Designers then, must be instructed in some way to consider the effect of their design on the mobility impaired, the hearing impaired, the visually impaired and the cognitively impaired. In the absence of a practical ability to perform this real time interaction, the designer should be able to develop an empathy with the user, by observing occasionally, or perhaps through recorded media, how various users interact with their product, or similar products.
An excellent example of this is web accessibility. Most web developers are competent in technologies such as HTML, CSS and JavaScript, and use these to develop rich, interactive websites. Many of these developers are considerate enough to validate that their website is correctly rendered in different user agents before deployment. Often when the site is being developed the designer will have consulted the Web Content Accessibility Guidelines and implemented the rules relating to images, rich media, tables etc. Often they will not. The rules are sometimes restrictive on the art of the developer, preventing them from utilising, say, JavaScript, in the way they wanted. However, by observing blind, dyslexic, or arthritic web users interacting with their site, or another site, they can quickly develop an empathy with that user, and can then engage with the new design challenge. Often, this will result in a clearer organisation of the website, the redrafting of textual content into more paragraphs, using less idiomatic language, and appropriate markup for emphasis and exclamation, more appropriate colours, advanced configurability, employment of innovative technology such as AJAX for delegating jobs such as hint generation to the server and so on. Clearly, these changes make a much improved site for all users. The same would be true for anything which must be designed for another person to interact with, from an essay to an operating system. By designing with an empathy for the limits of human ability, the design is improved for all users. This is the promise of Universal Design.
Cooper [14] explains with conviction how software should be considerate or polite. Recognising that all technology is assistive technology, or at least ought to be, Cooper encourages software designers to personify their software by designing them to fulfil the role of an intelligent and considerate assistant. Considerate software, then, should:
1. Take an interest 2. Be deferential 3. Be forthcoming 4. Use common sense 5. Anticipate needs 6. Be conscientious 7. Not burden with other problems 8. Keep informed 9. Be perceptive 10. Be self confident
34
11. Not ask lots of questions 12. Fail gracefully 13. Know when to bend the rules 14. Take responsibility
Each of these represent a challenge for the designer. Once again, the designer will develop their own understanding of how to achieve considerate software by observing users, and will address each of these challenges in novel ways. Qualitative principles such as these represent a path to Universal Design, but this path must be populated with users who can motivate the reasons and means for these.
Cooper [14] proposed the use of personas, user models derived from research of the user population, to develop the empathy between designers and users. A persona is a type of user who captures many of the problems encountered by real users. By assigning the user a name and involving them in discussions over design features and interaction methods, the design team should be able to create a design closer to the needs of that user. Some suggestions regarding the incorporation of personas into software design processes have been made for established methods such as the Rational Unified Process [15]. Ongoing research within our group is examining the incorporation of personas into the agile methods.
Universal Design is a process. The process requires those involved in the process to understand the limits, behaviour, fears and personalities of the end users. By designing for extremes, the result is a better design for all.
4 Module Delivery Case Study
As part of our various programmes on Computer Science, Computing, Information Technology and Information Systems, students would historically have been taught the values and methods of user-centred design as a branch of Software Engineering. Universal Design was a topic in the content of modules in Human Computer Interaction at stage 3 of our four year degree programme. For the first time, a standalone module on Universal Design was offered to students on the three MSc programmes in our school in the past academic year. For many of the students taking the module, this represented their first exposure to the topic, and often the terminology, of Universal Design. Others taking the module were specialist practitioners in the field of Assistive Technology and disability, and as such started the module with a greater understanding of, at least, the requirement for Universal Design.
While we accept that much of the case study described here amounts to the presentation of anecdotal evidence, such is the case with much of educational research. We endeavour to demonstrate our approach such that this can inform others, and recognise that what we present is a starting point. We firmly believe that the act of design is one that requires communication for evolution of ideas and methods.
The module was delivered with three hour classes over thirteen weeks. The journey through the module began with development of a general understanding of Universal Design, through the Seven Principles of Universal Design, several case studies and examples. The economic and legislative motivations for Universal Design were treated in detail, with students required to perform investigation on the relevant topics and report back to their classmates. Case studies on web accessibility and interaction design were followed by an examination of the role and potential of tools such as personas for arriving at Universal Design. This led to a treatment of Universal Design as a process, with students required to examine, criticise and invent process models appropriate for given domains.
The module was assessed partially through examination, with the remainder of the assessment marks awarded for the design assignment. Students were required to identify a domain, investigate it thoroughly to establish how limited products and services within that domain were with respect to the principles and philosophy of Universal Design. Students were then required to present and evaluate
35

two designs. One, a retrofit, was required to show how the identified problems could be fixed. The second, an ab initio design, imposed no restriction on the student, allowing them start from the beginning to produce a Universal Design to meet the same goal of the deficient design. Topics such as costs, legislative requirements and economic and moral benefits were also covered by students.
Students began their assignment at the start of the semester, and presented their final designs and reports to the class at the end of the semester. Weekly, students gave informal reports to the class, allowing them learn from each other and contribute to each other’s ongoing work, as well as the collective knowledge within the class. Ultimately, students produced some excellent designs for products such as automated teller machines, motor cars, light switches, websites, shopping trolleysand travel time tables. Importantly, some of the work produced had an immediate impact on the professional environment in which the students worked.
The students on the module all had a background in computing, and as such had spent considerable time in their academic and professional histories producing and realising designs. While some had a familiarity with certain rules and principles, they associated these mainly with the Human Computer Interaction speciality, rather than recognising it as a foundation of good design.
A cursory review of the literature on Universal Design will reveal that, surprisingly, one of the fields which has produced most publications on Universal Design is education and instructional design. Many authors have written about how they modified their teaching and learning methods to accommodate students with disability [16], as well as other classes of student such as international students and student parents. While some authors reference the Seven Principles of Universal Design,most reference only the philosophy of Universal Design, captured by the first principle – equitable use[17]. Some of the methods which are presented in the literature include offering the taught material in many forms e.g. online, in class; and lack of reliance on images and visual material – though recognising that visual material can help many learners, students for whom visual material is less useful should be provided with a meaningful and useful alternative. Others wrote of how simply speaking more slowly to accommodate sign language interpreters or international students improved learning across the entire cohort. Recognising the value of blending the message and medium, effort was made to deliver the module on Universal Design through adherence to the principles of Universal Design. This included the use of an accessible website, the publication of notes using accessible PDF documents, redundant description of images, and careful design of assessment to cater for diverse learning styles.
5 Mainstreaming
Universal Design is for all designers, regardless of what they are designing. As educators, we design programmes, modules, classes, examinations, assignments and lectures. As technology educators, we teach students to design software, applications, and solutions. By subscribing to the philosophy that Universal Design is good design, and that it is arrived at through the development of an empathy by the designer for the user at the limits of various human abilities, as well as the development of the means to address design problems (such as how to develop software, how to program mobile devices, how to network two computers etc.), we suggest that rather than being a specialist topic, Universal Design needs to be mainstreamed through all stages of the education of designers, and importantly that it be embodied in both the message and the medium. In this case, the message is the value of the Universal Design approach to design, and the medium is our approach to education.
What follows below is an example of how we view Universal Design being mainstreamed throughout the higher education of technology students.
5.1 Early, Often and Everywhere
36

It is important that Universal Design as a philosophy, and design for the extremes of human ability as a motivation, be introduced to students early in their study. Rather than rely on specialist training of graduates, or at the latter stages of their education, students should be asked to consider how their designs and decisions will affect the users of their applications. Introducing the concept of a user to students from the very beginning will direct the students to consider their work from the perspective of those directly involved in interfacing with their design. This ought to be a core concern across design related modules such as Software Engineering, Software Development and Web Design, but also should be used as a motivation for modules on Algorithm Design, Problem Solving and so on. In these modules, students are asked to address specific problems, such as searching, sorting and representing. By making real these problems through use of user-centred examples, the student continuously develops their empathy with users, and further understands the motivation for the problems they are trying to address.
Consider for example, the following question in a first year examination paper for Algorithms and Data Structures:
Show how the quicksort algorithm sorts the following numbers:
45 30 12 19 35 11 10 19 1
This question could be reframed in the following way, which continues to assesses precisely the same skill and assess the same knowledge, but reinforces the centrality of the user in computing and uses Universal Design as a motivator for good design.
Tom’s in-car navigation system automatically calculates possible routes home for him, depending on his current location. Today, it has determined nine different routes, which Tom would like to be read out by the system, ordered by distance. Show how the quicksort algorithm could organise the following distances, from highest to lowest.
45 30 12 19 35 11 10 19 1
This example presents Tom, a circumstantially disabled user who cannot use his eyes to scan nine distances to find the least, but must instead rely on speech generation software to read the nine distances. Because of the time involved in reading, it is clearly preferable that these be ordered, so that Tom can quickly learn about the shortest routes, without needing to remember which distance is the shortest so far.
Clearly, the same question can be asked using a permanently disabled user as an example:
Mary’s grandchildren bought her a personal computer for her 80th birthday, and have shown her how to visit online stores to make purchases. To compare prices on different websites, Mary uses software which records prices when clicked, and then displays prices in order on the top of the screen. Show how this software would use the quicksort algorithm to order the following prices, from lowest to highest:
45 30 12 19 35 11 10 19 1
The key point here is that all technology design and development, from the front end all the way backwards, should be motivated by the user need. Students who understand Universal Design from an early stage will have a better understanding of why certain problems must be solved, and also may be motivated to solve some problems, such as those identified above, which will result in new applications which are better for all.
5.2 User Empathy
37

Design is a process involving requirements gathering, initial design, detailed design, implementation, testing and deployment. Depending on the type of design process, the various stages of design may be completed and signed off, or revisited in continuing iterations. Most modern design processes involve the user in more than one of these stages, with the requirement that the user be observed interacting with the current design, either through an artificial means such as paper-prototyping, or through a prototype realised in software and/or hardware.
Universal Design requires that a wide set of users be considered and as such, the designer should have an empathy with users with diverse levels of ability. Use cases and user stories for designs should cater for these different abilities. By introducing students to different users, either in person, or through media such as video recordings, and then assessing students based on how identified personas could use a particular design, the students are forced to develop their understanding of why the user must be central to the design process, and how this leads to better design.
For example, students at a particular stage of the programme could be presented with descriptions of a set of personas at the start of the academic year. Each of these personas could inform the various modules at that stage, such that the student both refers to, and is assessed with reference to each of those personas.
Rather than simply designing a website that the student finds attractive, the student should be guided to design a website that John, a blind web user can interact effectively with. Rather than providing advanced features for their hotel booking system toy application in the Software Development class, the student incorporates features that assist Betty, who interacts with her computer using a mouth stick.
Personas are recognised as a useful means of supporting Universal Design in the professional environment. Equally, they should be used to teach effective design in the academic and training environment.
5.3 Message and Medium
Efforts to improve access to education for all students, to promote lifelong learning and to include students with disabilities have resulted in a diverse cohort in the modern classroom. Rather than simply catering for certain types of student through expensive supplementary supports such as note takers, sign language interpreters and additional tutors, educators should be seen to place diverse users at the centre of their own design process. This includes the design of the classroom environment, the design of instructional material such as lecture notes, the design of support material such as web sites and the design of assessment through assignments and examinations. There exists a substantial body of knowledge in this area which should inform the approach that all educators take to designing and delivering their own material, recognising that the class which is made more accessible to the deaf, blind or mobility impaired student has benefits for all students. For example, models of learning styles [18] suggest that all students have a specific set of learning preferences, some prefer graphical information, some prefer textual information, some oral information, some kinesthetic information, etc. therefore universally designed teaching materials will address this range of preferences.
This also has the effect of reinforcing the relationship between Universal Design and good design for students in the class, and serves to further enhance the empathy of both staff and students for users with diverse abilities.
5.4 When, Why and How
The philosophy of Universal Design is best captured by the first principle of Universal Design – equitable use. In order to produce better students with better design skills, these students must understand when to consider diverse sets of users, why to consider diverse sets of users and how to
38
consider diverse sets of users. The three guidelines explored above represent our recommended approach for mainstreaming this approach and philosophy in education programmes centred on design – particularly technology related programmes. This does not suggest that focussed modules on user-centred design, Universal Design and interaction design should not be included in programmes, but rather that if they are included they should not represent the only exposure the student has to the principles and philosophy of Universal Design. We suggest that Universal Design should be the core around which all programmes are designed, and we’ve presented three means through which this core can permeate all that surrounds it.
6 Summary and Conclusions
Universal Design is not a specialised skill, nor is it a speciality topic. It is a process which leads to good design, sustainable design and inclusive design. Separating it from the core process of design results in an implied and mistaken understanding by the student of the place in society of individuals with disability, and results in designs which are limited in their application in a society where users with permanent or circumstantial disability represent both a large and growing part of the user base and a substantial market. Twenty-first century graduates must understand the motivation and means for Universal Design, and through this understanding they will produce better designs, better technology, better ideas and a better society.
Acknowledgements
The authors wish to acknowledge the support of the Centre for Excellence in Universal Design at the National Disability Authority in Dublin, Ireland.
References
[1] Centre for Universal Design, North Carolina State University. Online at http://www.design.ncsu.edu/cud. Visited August 2009 [2] Wendy Chisholm, Matt May. Universal Design for Web Applications: Web Applications That Reach Everyone. O'Reilly. 2008 [3] Donald Norman. Emotional Design: Why We Love (or Hate) Everyday Things. Basic Books. 2003 [4] Web Accessibility Initiative, W3C. Online at http://www.w3.org/WAI/. Visited August 2009 [5] Steve Winyard. Accessible Information for the Visually Impaired. Diabetes Voice, 47(1), 3/2002. [6] Web Accessibility In Mind (WebAIM). Online at http://www.webaim.org/. Visited August 2009 [7] Elaine Ostroff. Universal Design Practice in the United States. Universal Design Handbook. 2001. [8] Disability Act 2005. Ireland. Online at http://www.oireachtas.ie/documents/bills28/acts/2005/a1405.pdf. Visited August 2009 [9] Google Image Labeller. Online at http://images.google.com/imagelabeler/. Visited August 2009 [10] Kevin Kinsella and Wan He. An Aging World: 2008. U.S. Census Bureau. Online at http://www.census.gov/prod/2009pubs/p95-09-1.pdf. Visited August 2009 [11] Gregg Vanderheiden. Basic Guidelines and Strategies for Access to Electronic Products and Documents. 2001. Online at http://trace.wisc.edu/docs/accessstrategies/. Visited August 2009 [12] Web Content Access. Guidelines 2.0. Online at http://www.w3.org/TR/WCAG20/. August ‘09 [13] Manifesto for Agile Software Development. Online at agilemanifesto.org/. Visited August 2009 [14] Alan Cooper. The Essentials of Interaction Design. Wiley. 2007 [15] Gottfried Zimmermann and Gregg Vanderheiden. Creating accessible applications with RUP. At http://www.ibm.com/developerworks/rational/library/jul05/zimmerman/index.html. August ‘09 [16] Shelly Burgstahler. Universal Design of Instruction. Tech Rep. DO-IT. Uni. Washington. 2001. [17] Donna M. Johnson and Judith A. Fox. Creating Curb Cuts in the Classroom: Adapting Universal Design Principles to Education. In Curriculum Transformation and Disability: Implementing Universal Design in Higher Education. Jeanne L. Higbee Editor. US Department of Education. 2003 [18] Damian Gordon and Ciarán O'Leary, Universal Learning for the 21st Century. In proceedings of Universal Design for the 21st Century: Irish and International Perspectives, October 16th 2007.
39

Development of a Moodle Course Content Filter using Meta Data
Kyle Goslin 1, Markus Hofmann 2, Geraldine Gray 3
Institute of Technology Blanchardstown [email protected] 1, [email protected] 2, [email protected] 3
Abstract
Moodle is an E-Learning platform that is in use by many educational institutions across the world. This paper outlines the development of a Course page Content Filter created in PHP which can be applied to a Moodle course page to filter the course’s learning objects, displaying only those documents matching the filter selections.
The Course Content Filter has been developed as a code patch to be installed to the Moodle installation and activated by the Moodle administrator. It comprises of additional settings to both the Moodle course page and the learning object upload pages. Filter controls appear at the top of the student’s course page allowing a student to actively filter the course page content.
The Course Content Filter assists students in navigating to the learning objects relevant to their needs. An example, as described in this paper, is the filtering of course content by Learning Channel. Learning channels are the modes in which a student can take in information. Providing a student with course material in a form relevant to their learning style makes course content more accessible, optimising the learning experience. For example, a student with a preference for their visual learning channel will benefit from course material presented in a visual form. The content filter described here will allow them to quickly access content which is optimised for their learning preference.
This paper also outlines advantages of such a content filter in a Virtual Learning Environment (VLE), reviews current availability of such filters, and describes our approach to developing such a filter.
Keywords: E-Learning, Moodle, Virtual Learning Environments, VLE
40
1 Introduction
E-Learning tools offer a wide range of diverse content to a student facilitating a more flexible and inclusive access to education. In recent years, virtual learning has had a profound growth with most educational institutes having active installations of VLE’s[1].
Moodle offers students the ability to access course content from a remote location by using a web based application to deliver content online. Once the user is created, they can enrol in e-courses which serve as a placement for course content such as lecture presentations and additional notes. Each of the various pieces of course material on a course page is called a Learning Object.
One of the problems that students encounter while using these learning environments is the amount of learning objects per course page, which in a highly active course can include over fifty objects. This volume of course content can inhibit the students’ ability to efficiently navigate through the content to find what they are looking for. This paper reports on a solution to this problem. A content filtering plug-in was created that will run at the top of a Moodle course page. This plug-in gives the user the ability to filter through the different learning objects on the course page and leave only content which is relevant to them. Blackboard, a system which is similar to Moodle, does offer its users a limited set of tools for searching through the course content [2], but not without being redirected from the course page or filtering in such detail as described here. Currently Moodle does not offer its users any tool in which to filter the content of a course page.
Once the Course Content Filter is fully implemented on an active installation of Moodle, the filtering process allows the user to filter by different parameters and also implements features for showing outstanding assignments and to hide any content which the user has previously viewed.
In this paper a review of VLE technology is first presented with its variants and is followed by an outline on how the filter will be implemented, followed by a detailed explanation of the development of the filter. Below is a description of each of the following sections in the paper. Section 2, Background explains what VLE’s consist of and also outlines the current use of VLE’s in educational institutes and what other systems are currently being used for E-Learning. Section 3, Methodology outlines exactly what the content filter objectives are and how the filter will be designed to reach these specified filtering objectives. This section will also include an outline of the roles that each of the users who interact with the system will play, such as the student accessing the filter and the administrator tagging learning objects.
Section 4, Tool Overview, describes what each of the different filters achieve and also how the filter is implemented in to an active installation of Moodle, giving backgrounds and presenting each of the elements which make up the filter. Section 5, Distribution, outlines how the filter is distributed and how it can be applied to a Moodle Installation. Section 6, Future Work describes what changes will be made in future releases of the course page content filter.
41
2 Background
VLE's are mostly web based systems that offer users a range of learning tools such as course notes, academic testing facilities and grading tools while retaining a course structure. VLE’s have transformed offsite learning, allowing users to access course notes and work from a remote environment, replacing much of the traditional tools of remote learning such as custom created course websites and course note file servers. Three of the most successful VLE platforms are WebCT (now acquired by Blackboard Inc), Blackboard and the open source alternative and focus of this paper, Moodle. As of July 2009, Moodle.org has 36,353 registered installations of Moodle in over 202 different countries with almost 25 million users [3].
Course Management Systems (CMS) and Learning Management Systems (LMS) are closely related to VLE’s, but differ because the VLE aims to offer a solution for virtual learning rather than just providing educational content. Over the last few years, VLE’s have become commonplace in educational institutions and also in the commercial sector as a means of educating staff on and off site.
While originally created for distance education, VLE’s are now most often used to supplement traditional face to face classroom activities, commonly known as Blended Learning. Blended learning is the mixing of various different forms of learning such as face to face and E-learning. Blended Learning has been described as “a learning program where more than one delivery mode is being used with the objective of optimizing the learning outcome and cost of the program delivery” [4] and also as “The effective combination of different modes of delivery, models of teaching and styles of learning” [4]. VLE’s can be used to support blended learning because they offer the student a wide range of aids which can be used during the learning process. These include,
� interactive course material; � lecture and course content; � quizzes and self evaluation tools; � mentor communication tools.
In addition to supporting blended learning, VLE’s can also facilitate the provision of course content in a variety of formats, catering for the diverse range of learning styles and learning preferences present in any class group. Cognitive psychologists distinguish three categories of typical ways learners acquire information: visual, auditory and kinaesthetic [5]. Ongoing research at ITB has shown that raising awareness of channel or mode of learning, amongst both academic staff and learners, while adapting content to cater for the visual, auditory and kinaesthetic modes of learning, improves the learning experience for both the learner and the lecturer, and results in improved attendance and performance [6].
Tying all of these different elements together gives students a rich base of information which can help them during the learning process. VLE’s also offer a means of testing, which can allow students to take course tests from a remote location which have been popularised by
42

institutions such as the Open University (OU) which currently has over 150,000 undergraduate and more than 30,000 postgraduate students [7].
The Moodle platform currently offers no pre existing solution for allowing it’s users to filter or manage the content of a course page. Most of the VLE’s that are currently available offer additional plug-in support to allow rapid customisation of the system. An example of this is the Shareable Content Object Reference Model (SCORM) which is a collection of standards and specifications for e-learning environments such as the type described here to set a standard for how the client software and the host system interact.
3 Methodology
The methodology used followed the standard systems development life cycle. User requirements were identified based on consultation with both academics staff and students in the Department of Informatics and the Department of Engineering at ITB, and the learning styles research team, a collaborative research team from both ITB and the National Learning Network, based on campus at ITB. The information collected became the basis of the filter design, including:
� A filter that will select content which is relevant for the final course examination. This filter would remove any non relevant or supplement course content;
� A filter which will select any content which is adapted to the students learning style; � A filter which can remove assignment upload objects from the course page which the
student has already uploaded; � A filter which will allow the user to filter by file type, e.g. Presentation File, Audio
File, etc; � Filter by the type of object, e.g Lab objects or Lecture Objects; � A filter which selects objects based on keywords or learning object name.
Once the filtering types was decided the roles of each person who would interact with the filter was identified, and are defined as follows.
Moodle Administrator The Moodle administrator has the ability to add or remove the plug-in from the Moodle installation. They will be in charge of delegating the course administration power to different users. All of the powers which are associated with the Course Administrator (below) will be available to the Moodle administrator.
Course Administrator The Course Administrator has the ability to enable or disable the filter for a particular course. They do not have the ability to add or remove the plug-in from the Moodle installation, this is reserved for the Moodle administrator.
43

The Course Administrator can create new course content objects. In the process of creating these objects the course administrator will be shown a selection of radio buttons, where they can categorise the object that has been created. The course administrator will then be given the chance to manually add keywords as meta data to the object. All of this information is used during the filtering process.
Student Once the administrator have enabled the filter, it will be visible on the student view of the course page. The student does not have the ability to add or remove the filter from the course page, but can maximise or minimise the filter pane, and select filter options to filter though the content.
The user requirements above required a filtering tool that can both filter objects based on categories set for those objects and also allow meta data tags to be associated with each learning object describing the semantics and parameters related to this object. By default very little meta data is stored about the objects which are uploaded by the administrator, apart from time stamping information and course identification links. For the filtering process to work successfully, meta data needs to be stored to describe and tag of each of the learning objects.
Applying the Content Filter For the filter to be applied to an active installation of Moodle, the code was released in code patch from. Although Moodle does offer some plug-in and extension capabilities, a patch tool was chosen because as at the current time Moodle does not offer any facilities to allow code changes or rollbacks to be made to any of core pages such as the course page or database tables, which the content filter needs to modify during installation.
4 Tool Overview
In the following sections brief overviews will be given describing the tool as viewed by the different roles of interaction. 4.1 Student View
Filter selection criteria will be displayed on top of the student view of the course page. The selections made by the user will be passed to the learning object content filter and each of the learning objects will individually be tested to see if they meet the filter criteria and either added or rejected from the final learning object list that will be displayed. The user has the option to further filter if required.
Figure 1 shows the prototype filter which is added to the top of the students course page. By default the content filter is in maximized state, but the user has the ability to change it to a minimized form if it is not being used.
44
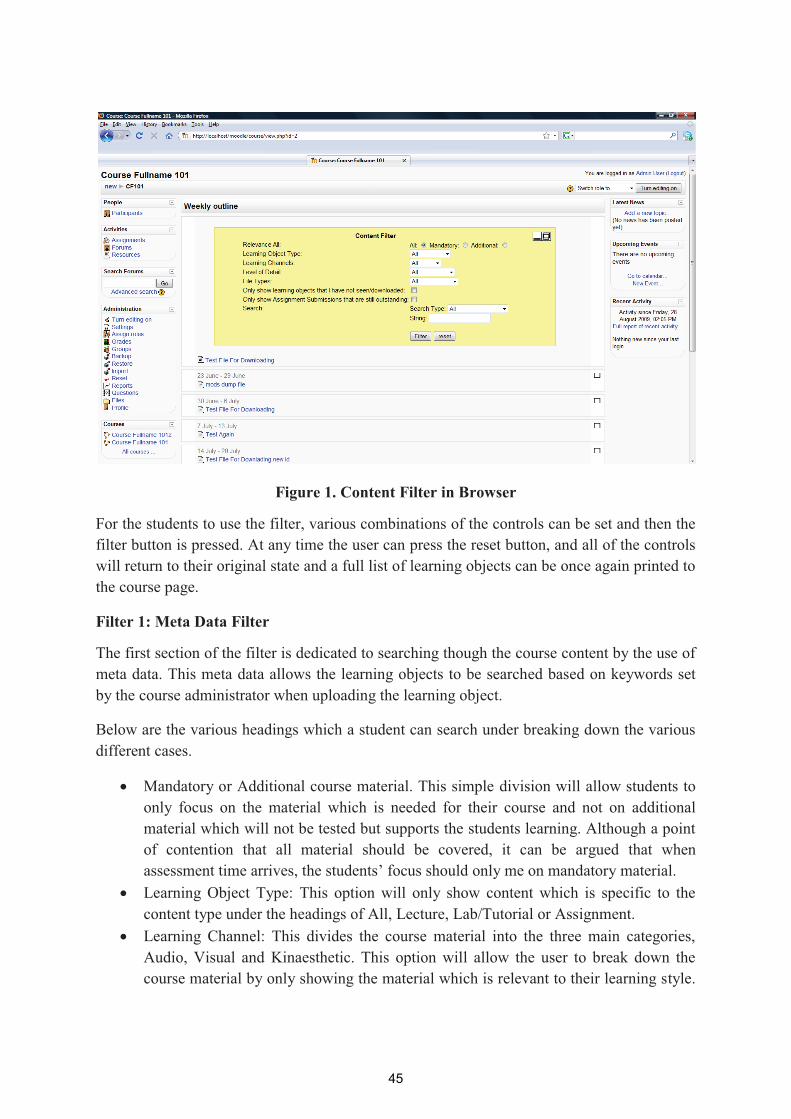
Figure 1. Content Filter in Browser
For the students to use the filter, various combinations of the controls can be set and then the filter button is pressed. At any time the user can press the reset button, and all of the controls will return to their original state and a full list of learning objects can be once again printed to the course page.
Filter 1: Meta Data Filter
The first section of the filter is dedicated to searching though the course content by the use of meta data. This meta data allows the learning objects to be searched based on keywords set by the course administrator when uploading the learning object.
Below are the various headings which a student can search under breaking down the various different cases.
� Mandatory or Additional course material. This simple division will allow students to only focus on the material which is needed for their course and not on additional material which will not be tested but supports the students learning. Although a point of contention that all material should be covered, it can be argued that when assessment time arrives, the students’ focus should only me on mandatory material.
� Learning Object Type: This option will only show content which is specific to the content type under the headings of All, Lecture, Lab/Tutorial or Assignment.
� Learning Channel: This divides the course material into the three main categories, Audio, Visual and Kinaesthetic. This option will allow the user to break down the course material by only showing the material which is relevant to their learning style.
45

For example a student with an auditory learning style can filter for podcasts and other recordings.
� Level of Detail: This option will distinguish between object giving a summary of content and objects explaining topics in more detail. The options available are Summary, Medium or Very Detailed.
� File Type: This option allows the user to specify what file type they want to filter. This can be helpful if the student knows that the file they are looking for is a Microsoft Word document or a presentation which is usually in PowerPoint form. The options available are, All Files, Text Document, Spread Sheet, Presentation, PDF file, Movie file, Sound file and Web Link.
Filter 2: Outstanding Assignment Filter
Moodle offers course administrators the option to allow students to upload assignments on the course page. If the course consists of a several continuous assessments then over time the course page becomes over crowded. The outstanding assignment filter checks to see if the assignment has been uploaded by the student and if so it will not show the upload object for that that assignment on the course page. Only the assignments upload objects which have not have any content uploaded to them will be shown on the course page. This filter helps reduce the amount of useless content shown on the course page.
Filter 3: Learning Objects not seen or downloaded
Some Moodle course pages can have a considerable amount of learning objects. When searching for a specific file which the user has not seen on a course page this amount of learning objects can make the task take a lot longer and navigation though the object becomes a problem.
As a solution to this a filter was created that allows users to filter out any learning objects that have been opened and only show the objects which they have not opened. This filter works by checking the user’s activity logs. If the log shows that the user has opened the file, then it will not be shown on the course page. If a file is modified and the user has not seen the file since the modification has been made, a check is done to see if the modification date is newer then the last seen date. If they have not seen the object since the changes have been made then it will be shown on the course page.
Filter 4: Keyword Search
Some of the users may want to search though the course content by keyword. This filter allows the titles of the learning objects to be searched either or both by the meta data or by keywords which have been supplied by the user. Once this search is complete, only learning objects which match the keyword will be returned.
Figure 2 shows an example of a user setting to search though all of the material which is a lecture and of Learning Channel type Visual. Figure 3 shows the results of this search, various lecture videos.
46
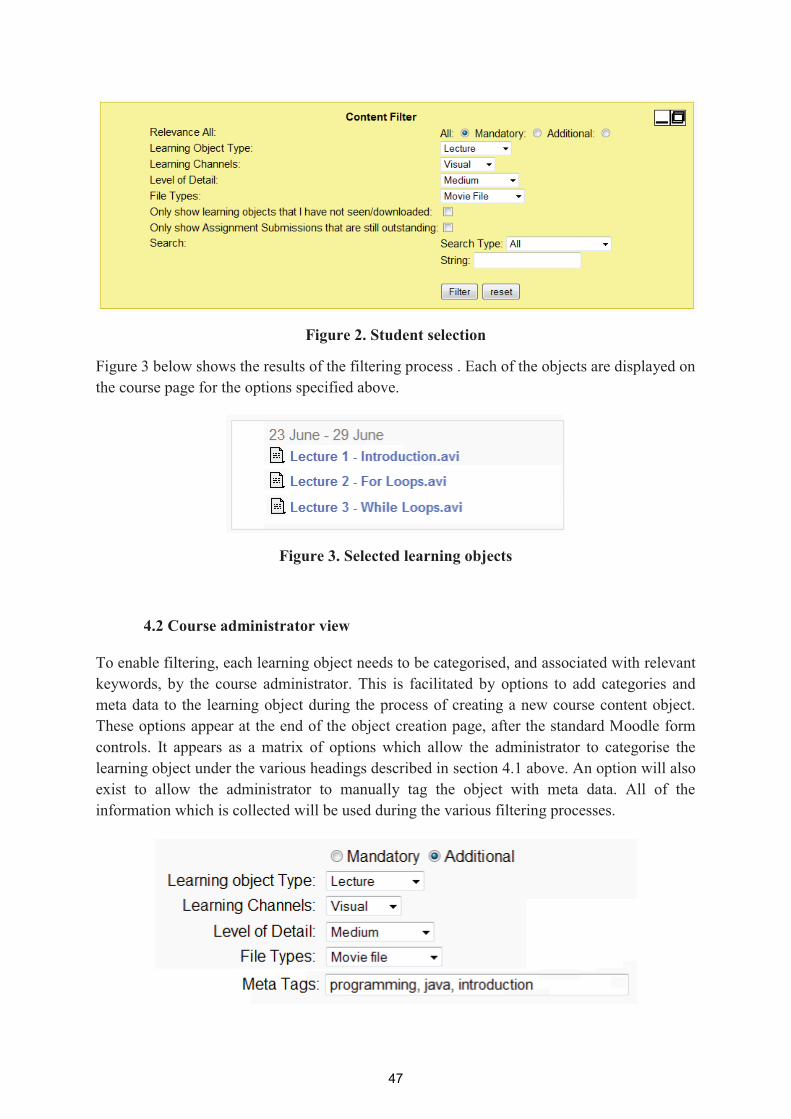
Figure 2. Student selection
Figure 3 below shows the results of the filtering process . Each of the objects are displayed on the course page for the options specified above.
Figure 3. Selected learning objects
4.2 Course administrator view
To enable filtering, each learning object needs to be categorised, and associated with relevant keywords, by the course administrator. This is facilitated by options to add categories and meta data to the learning object during the process of creating a new course content object. These options appear at the end of the object creation page, after the standard Moodle form controls. It appears as a matrix of options which allow the administrator to categorise the learning object under the various headings described in section 4.1 above. An option will also exist to allow the administrator to manually tag the object with meta data. All of the information which is collected will be used during the various filtering processes.
47
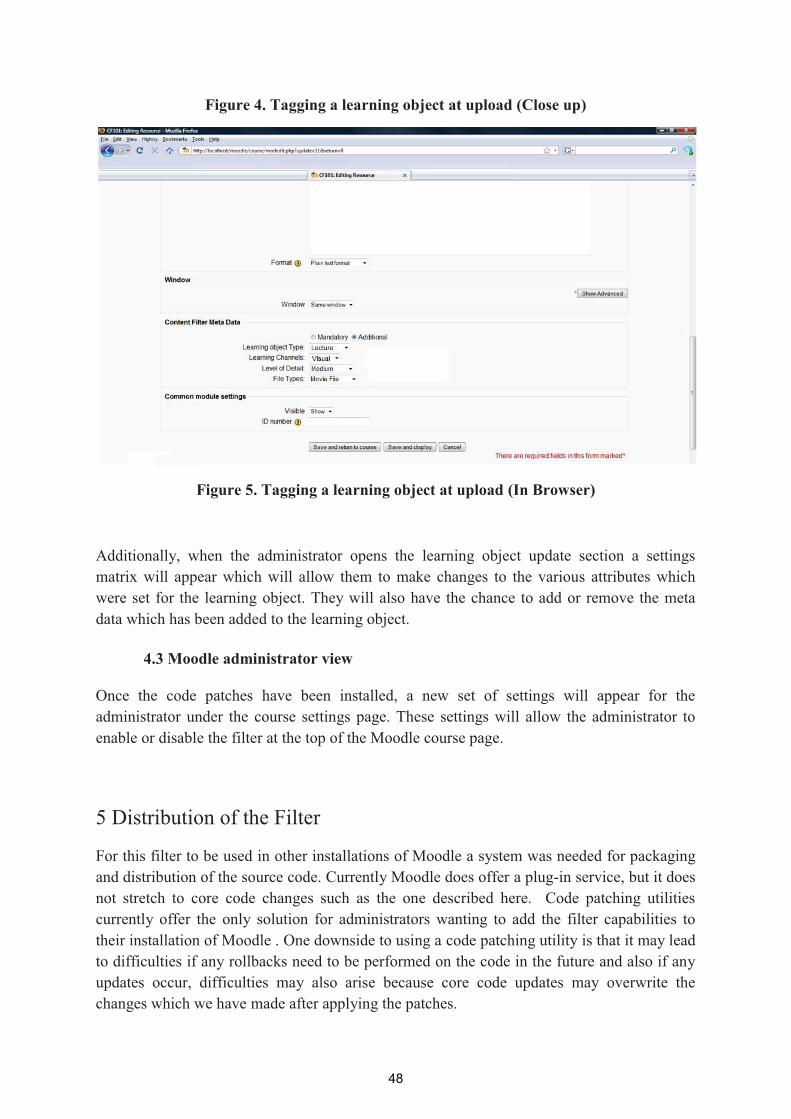
Figure 4. Tagging a learning object at upload (Close up)
Figure 5. Tagging a learning object at upload (In Browser)
Additionally, when the administrator opens the learning object update section a settings matrix will appear which will allow them to make changes to the various attributes which were set for the learning object. They will also have the chance to add or remove the meta data which has been added to the learning object.
4.3 Moodle administrator view
Once the code patches have been installed, a new set of settings will appear for the administrator under the course settings page. These settings will allow the administrator to enable or disable the filter at the top of the Moodle course page.
5 Distribution of the Filter
For this filter to be used in other installations of Moodle a system was needed for packaging and distribution of the source code. Currently Moodle does offer a plug-in service, but it does not stretch to core code changes such as the one described here. Code patching utilities currently offer the only solution for administrators wanting to add the filter capabilities to their installation of Moodle . One downside to using a code patching utility is that it may lead to difficulties if any rollbacks need to be performed on the code in the future and also if any updates occur, difficulties may also arise because core code updates may overwrite the changes which we have made after applying the patches.
48
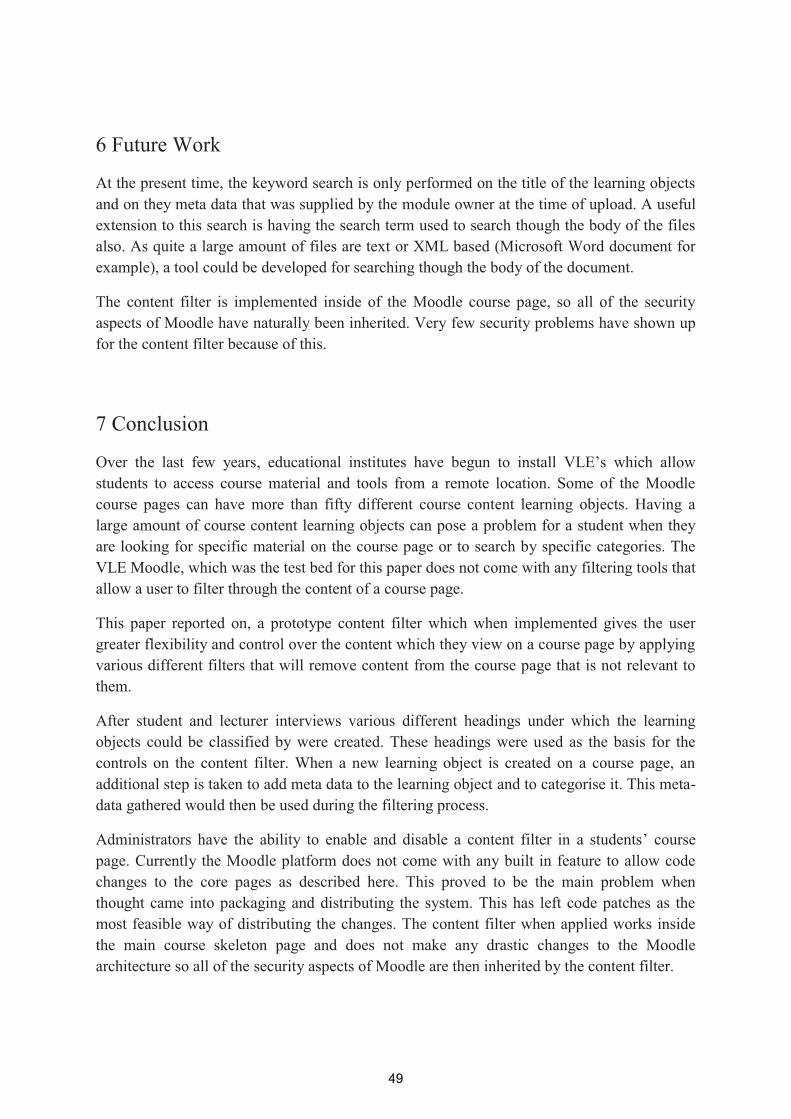
6 Future Work
At the present time, the keyword search is only performed on the title of the learning objects and on they meta data that was supplied by the module owner at the time of upload. A useful extension to this search is having the search term used to search though the body of the files also. As quite a large amount of files are text or XML based (Microsoft Word document for example), a tool could be developed for searching though the body of the document.
The content filter is implemented inside of the Moodle course page, so all of the security aspects of Moodle have naturally been inherited. Very few security problems have shown up for the content filter because of this.
7 Conclusion
Over the last few years, educational institutes have begun to install VLE’s which allow students to access course material and tools from a remote location. Some of the Moodle course pages can have more than fifty different course content learning objects. Having a large amount of course content learning objects can pose a problem for a student when they are looking for specific material on the course page or to search by specific categories. The VLE Moodle, which was the test bed for this paper does not come with any filtering tools that allow a user to filter through the content of a course page.
This paper reported on, a prototype content filter which when implemented gives the user greater flexibility and control over the content which they view on a course page by applying various different filters that will remove content from the course page that is not relevant to them.
After student and lecturer interviews various different headings under which the learning objects could be classified by were created. These headings were used as the basis for the controls on the content filter. When a new learning object is created on a course page, an additional step is taken to add meta data to the learning object and to categorise it. This meta-data gathered would then be used during the filtering process.
Administrators have the ability to enable and disable a content filter in a students’ course page. Currently the Moodle platform does not come with any built in feature to allow code changes to the core pages as described here. This proved to be the main problem when thought came into packaging and distributing the system. This has left code patches as the most feasible way of distributing the changes. The content filter when applied works inside the main course skeleton page and does not make any drastic changes to the Moodle architecture so all of the security aspects of Moodle are then inherited by the content filter.
49

The content filter proves useful as a tool to help when a student is making a learning object selection and for navigating though the content of a heavily used course page.
References
[1] Browne, Tom. Jenkins, Martin. Walker, Richard (2006). A Longitudinal Perspective Regarding the Use of VLE’s by Higher Education Institutions in the United Kingdom. Interactive Learning Environments, Volume 14 , Issue 2, Aug 2006, Pages 177-192 .
[2] Knauff, Barbra. Top 10 Blackboard tips for students (21st August 2009). Web: http://bbfaq.dartmouth.edu/faq/index.php?action=artikel&cat=27&id=82&artlang=en.
[3] Moodle Statistics (21st August 2009). Web: http://www.moodle.org/stats.
[4] Akkoyunlu, Buket. Yilmaz-Soylu, Meryem (2008). Development of a scale on learners’ views on blended learning and its implementation process, The entity from which ERIC acquires the content, including journal, organization, and conference names, or by means of online submission from the author. The Internet and Higher Education, Volume 11, Issue 1, 2008, Pages 26-32.
[5] Arthurs, Janet B (2007). A juggling act in the classroom: Managing different learning styles, Teaching and Learning in Nursing Volume 2, Issue 1, Jan 2007, Pages 2-7.
[6] Duffin, D. Gray, G (2009). Using ICT to Enable Inclusive Teaching Practices In Higher Education, Association for the Advance of Assistive Technology in Europe, Florence, Sept 2009.
[7] Open University, About the Open University (20th August 2009). Web: http://www.open.ac.uk/about/ou/.
50
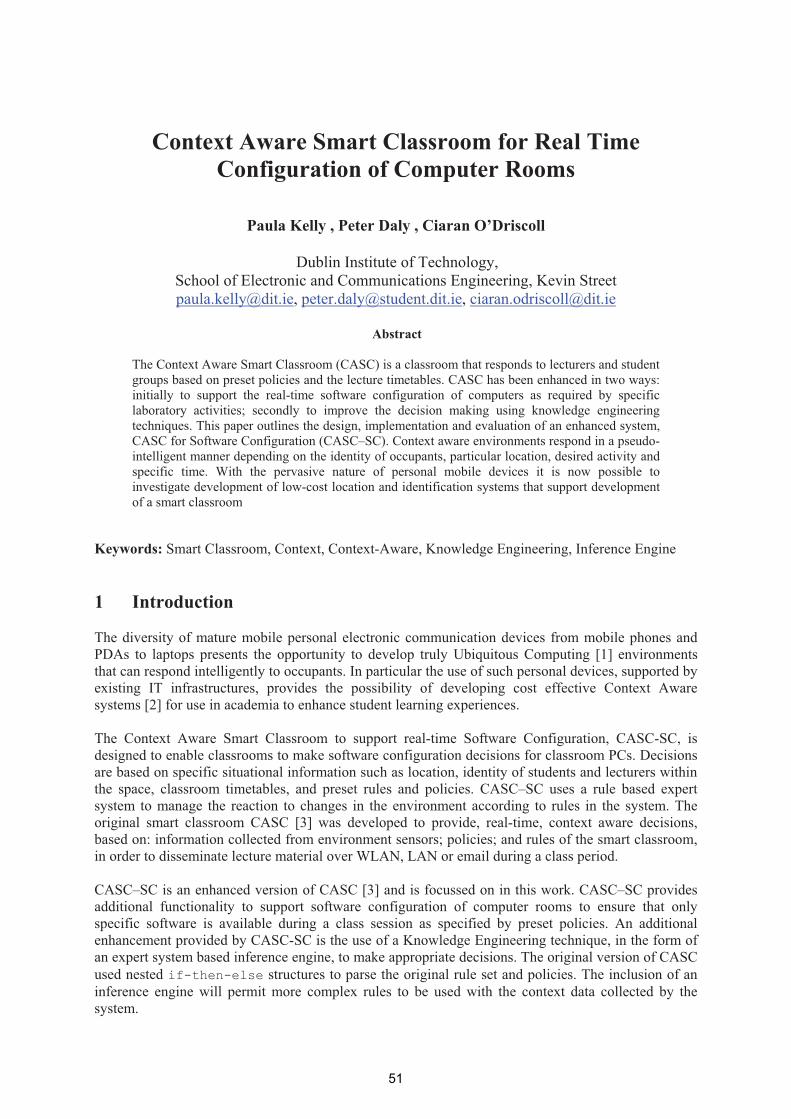
Context Aware Smart Classroom for Real Time Configuration of Computer Rooms
Paula Kelly , Peter Daly , Ciaran O’Driscoll
Dublin Institute of Technology, School of Electronic and Communications Engineering, Kevin Street [email protected], [email protected], [email protected]
Abstract
The Context Aware Smart Classroom (CASC) is a classroom that responds to lecturers and student groups based on preset policies and the lecture timetables. CASC has been enhanced in two ways: initially to support the real-time software configuration of computers as required by specific laboratory activities; secondly to improve the decision making using knowledge engineering techniques. This paper outlines the design, implementation and evaluation of an enhanced system, CASC for Software Configuration (CASC–SC). Context aware environments respond in a pseudo-intelligent manner depending on the identity of occupants, particular location, desired activity and specific time. With the pervasive nature of personal mobile devices it is now possible to investigate development of low-cost location and identification systems that support development of a smart classroom
Keywords: Smart Classroom, Context, Context-Aware, Knowledge Engineering, Inference Engine 1 Introduction The diversity of mature mobile personal electronic communication devices from mobile phones and PDAs to laptops presents the opportunity to develop truly Ubiquitous Computing [1] environments that can respond intelligently to occupants. In particular the use of such personal devices, supported by existing IT infrastructures, provides the possibility of developing cost effective Context Aware systems [2] for use in academia to enhance student learning experiences. The Context Aware Smart Classroom to support real-time Software Configuration, CASC-SC, is designed to enable classrooms to make software configuration decisions for classroom PCs. Decisions are based on specific situational information such as location, identity of students and lecturers within the space, classroom timetables, and preset rules and policies. CASC–SC uses a rule based expert system to manage the reaction to changes in the environment according to rules in the system. The original smart classroom CASC [3] was developed to provide, real-time, context aware decisions, based on: information collected from environment sensors; policies; and rules of the smart classroom, in order to disseminate lecture material over WLAN, LAN or email during a class period. CASC–SC is an enhanced version of CASC [3] and is focussed on in this work. CASC–SC provides additional functionality to support software configuration of computer rooms to ensure that only specific software is available during a class session as specified by preset policies. An additional enhancement provided by CASC-SC is the use of a Knowledge Engineering technique, in the form of an expert system based inference engine, to make appropriate decisions. The original version of CASC used nested if-then-else structures to parse the original rule set and policies. The inclusion of an inference engine will permit more complex rules to be used with the context data collected by the system.
51

2. Context Aware Smart Classroom 2.1 Context-aware “Context-aware computing is a mobile computing paradigm in which applications can discover and take advantage of contextual information (such as user location, time of day, nearby people and devices and user activity)” [4]. This concept has been around for over a decade and it is only the recent availability of suitable portable computing and wireless network resources that make it possible to implement such systems. The term context is used to describe real world situations, and everything is said to happen in a certain context. This makes it difficult to define context in a precise manner for many different situations. In computing the term “context-aware” was introduced in [5] and was applied to location information that could enable software to adapt according to its location of use, the identities of nearby people and objects, and changes to those objects over time 2.2 Context Location is an essential element in defining context but it is by no means the only aspect that needs to be considered. Context in computing terms involves a number of different aspects. In [6] a definition for context with 3 elements is presented:
1. Computing context, made up of nearby computing resources, communications and communications bandwidth.
2. User context, such as the user’s profile, location, people nearby and even the social situation. 3. Physical context, such as lighting noise levels, traffic conditions and temperature.
To more completely define context for computing, time was proposed as a fourth element in [4]:
4. Time context, where user and physical contexts can be logged to provide a context history that can be useful in certain applications.
These four particular aspects provide sufficient definition of context for the design and development of the context aware smart classroom. Awareness of the context of the environment and the ability to react to changing context permits the development of pseudo intelligent or smart environments that can make autonomous decisions without the need to refer to users. 2.3 Smart Environments Smart environments are an extension of the ubiquitous computing paradigm. One of the core concepts in ubiquitous computing is the ability of technology to disappear and become invisible to users [7, 8]. In the ubiquitous computing paradigm, Weiser [1] states, if a computer “knows merely what room it is in, it can adapt its behaviour in significant ways without requiring even a hint of artificial intelligence”. While this is certainly the case, the addition of artificial intelligence techniques extends the potential range of behaviour and supports independent reaction. Smart environments display a degree of autonomy, can adapt to changing situations and can communicate with users [9]. The provision of intelligent automation enhances ubiquitous computing environments and provides the opportunity for additional features such as detection of anomalous behaviour. Devices can easily be controlled using existing communications infrastructures based on sensor information collected and in particular predictive decision making can be included in the capabilities of the smart environment [10]. These capabilities allow an environment to exhibit pseudo-intelligent behaviour and so be considered as a smart environment.
52
2.4 Smart Classrooms The development of “applications are of course the whole point of ubiquitous computing” [11] similarly in developing smart environments an experimental methodology is used as identified in [12]. This approach has lead to the development of a number of smart classrooms such as classroom 2000 [13] and eClass [14, 15] that were intended to reduce the workload of students. These systems automatically capture the lecture and make the material available on the web and this permits students to become more actively involved in the learning process during the class. The classroom 2000 and eClass research has targeted the capture and delivery of lectures using cameras and audio recording and supporting software infrastructure [12] to prepare notes for dissemination via the web. CASC [3] was developed to disseminate lecture material used during a class period to students who had opted to participate. As part of the registration process for CASC, students provided a set of preferences for modes of receiving material such as Bluetooth, WLAN, or email etc. Details of personal Bluetooth enabled devices were also required as these were required by the system for location identification. A key limitation of CASC was the use of nested if-then-else structures to make decisions. A more complex decision making approach using knowledge engineering was identified as a requirement for developing a campus wide system that could support more complex rule sets. 2.5 Knowledge Engineering Knowledge engineering is the discipline that involves gathering and integrating knowledge into computer systems in order to solve complex problems normally requiring a high level of human expertise [16]. It is used in many computer science domains including expert systems which are a branch of Artificial Intelligence (AI) [17] that attempt to produce a solution to the level of a human expert in a specific problem domain by using the specialized knowledge that a human expert possesses. Knowledge is represented in two parts, facts and rules. Facts are data and the rules determine what the facts mean, e.g. consider a doctor using an expert system to choose the correct diagnosis based on a number of symptoms. Based on the facts that a patient has presented with a runny nose and a headache but no fever, an appropriate rule in the system might determine that the patient has a cold. Expert systems attempt to reproduce the performance of human experts for a specific domain by creating a knowledge base of inference rules for that domain using some knowledge representation formalism and populating this knowledge base with information gathered from domain experts. Each inference rule is entered separately and an inference engine is used to infer information or take action based on the interaction of facts and the inference rules in the knowledge base. 2.6 Expert Systems Expert systems are implemented using rule based languages rather than conventional procedural programming. In rule-based languages programs are composed by a set of inference rules. Each inference rule is composed of two parts, respectively called left hand side (lhs) and right hand side (rhs). The program executes on the content of a specialized memory, called working memory. The working memory always contains a collection of records. The effect of a computation is the successive application of the inference rules in the program to the content of the working memory. The effect of applying an inference rule to the working memory is either the removal of a record or the introduction of a new record. The rhs of the inference rule contains the action used to modify the contents of the working memory. The lhs of each inference rule represents the conditions that have to be met for the rule to be applicable. Examples of rule based languages include CLIPS, Prolog and Jess (Java Expert System Shell).
53
2.6.1 The Rete algorithm Expert systems with even moderately sized knowledge bases would perform too slowly if each rule had to be checked against known facts. The Rete algorithm [18] provides a more efficient implementation for an expert system . A Rete-based expert system builds a network of nodes, where each node (except the root) corresponds to a pattern occurring in the left-hand-side (the condition part) of a rule. The path from the root node to a leaf node defines a complete left-hand-side rule. Each node has a memory of facts which satisfy that pattern. As new facts are asserted or modified, they propagate along the network, causing nodes to be annotated when that fact matches the pattern. When a fact or combination of facts causes all of the patterns for a given rule to be satisfied, a leaf node is reached and the corresponding rule is triggered. The Rete algorithm is designed to sacrifice memory for increased speed. In most cases, the speed increase over naïve implementations is several orders of magnitude (because Rete performance is theoretically independent of the number of rules in the system). In very large expert systems, however, the original Rete algorithm tends to run into memory consumption problems. Rete has become the basis for many popular expert system shells, including CLIPS and Jess. 2.6.2 Jess Rules Engine Jess (Java Expert System Shell) [19] is a rules engine and scripting environment written in the Java programming language. The Jess language is derived from CLIPS in its syntax and uses the Rete algorithm for its pattern matching algorithm which makes Jess much faster than a simple set of cascading if-the statements adopted in conventional programming languages [19]. A Jess rule is something like an if-then-else statement in a procedural language, but it is not used in a procedural way. While if-then-else statements are executed at a specific time and in a specific order, according to how the programmer writes them, Jess rules are executed whenever their if parts (their LHSs) are satisfied, given only that the rule engine is running. It’s architecture can be many orders of magnitude faster than an equivalent set of traditional if-then-else statements [19]. Jess provides several constructs to enable the construction of an expert system. Users can add their own functions to the language using native Jess code which makes Jess a powerful rule language facilitating users to execute their own Java classes in the Jess environment. The fact that Jess is written in Java allows its simple integration into Java applications. 3. CASC-SC System Design Context Aware Smart Classroom for real-time Software configuration, CASC-SC, has been designed to enable the automatic software configuration of computers in a specific location for a particular class or laboratory session based on context data and a timetable schedule. In particular it is designed to ensure that only the programs required for the session are accessible to students. Preset policies determine the software requirements for a particular session. An inference engine, with appropriate rules, is used to ensure that the computers are configured in time for each session. The system is also designed to recognize different context events that occur, for example if a lecturer switches a session to a room other than that assigned in the timetable schedule, the system detects this (based on the location information for the class members) and the inference engine will automatically reconfigure the software for the PCs in the new room for that session. To help create a more efficient and secure environment the system will deny users access to PCs in a classroom if they are not scheduled to be in that classroom. Also, if a user tries to log into a PC and the system has not detected that the student is located within the room then the system will reject the login request as a security precaution.
54
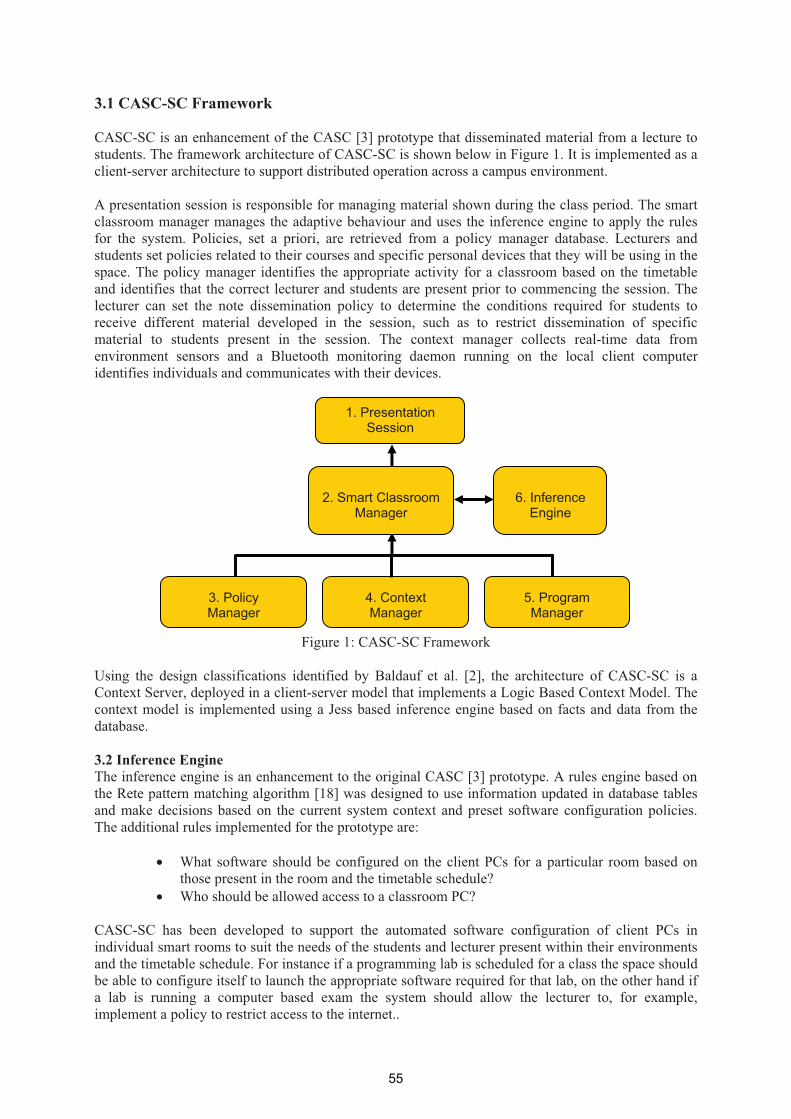
3.1 CASC-SC Framework CASC-SC is an enhancement of the CASC [3] prototype that disseminated material from a lecture to students. The framework architecture of CASC-SC is shown below in Figure 1. It is implemented as a client-server architecture to support distributed operation across a campus environment. A presentation session is responsible for managing material shown during the class period. The smart classroom manager manages the adaptive behaviour and uses the inference engine to apply the rules for the system. Policies, set a priori, are retrieved from a policy manager database. Lecturers and students set policies related to their courses and specific personal devices that they will be using in the space. The policy manager identifies the appropriate activity for a classroom based on the timetable and identifies that the correct lecturer and students are present prior to commencing the session. The lecturer can set the note dissemination policy to determine the conditions required for students to receive different material developed in the session, such as to restrict dissemination of specific material to students present in the session. The context manager collects real-time data from environment sensors and a Bluetooth monitoring daemon running on the local client computer identifies individuals and communicates with their devices. 1. Presentation
Session
2. Smart ClassroomManager
6. InferenceEngine
4. Context Manager
3. Policy Manager
5. ProgramManager
Figure 1: CASC-SC Framework Using the design classifications identified by Baldauf et al. [2], the architecture of CASC-SC is a Context Server, deployed in a client-server model that implements a Logic Based Context Model. The context model is implemented using a Jess based inference engine based on facts and data from the database. 3.2 Inference Engine The inference engine is an enhancement to the original CASC [3] prototype. A rules engine based on the Rete pattern matching algorithm [18] was designed to use information updated in database tables and make decisions based on the current system context and preset software configuration policies. The additional rules implemented for the prototype are:
� What software should be configured on the client PCs for a particular room based on those present in the room and the timetable schedule?
� Who should be allowed access to a classroom PC? CASC-SC has been developed to support the automated software configuration of client PCs in individual smart rooms to suit the needs of the students and lecturer present within their environments and the timetable schedule. For instance if a programming lab is scheduled for a class the space should be able to configure itself to launch the appropriate software required for that lab, on the other hand if a lab is running a computer based exam the system should allow the lecturer to, for example, implement a policy to restrict access to the internet..
55
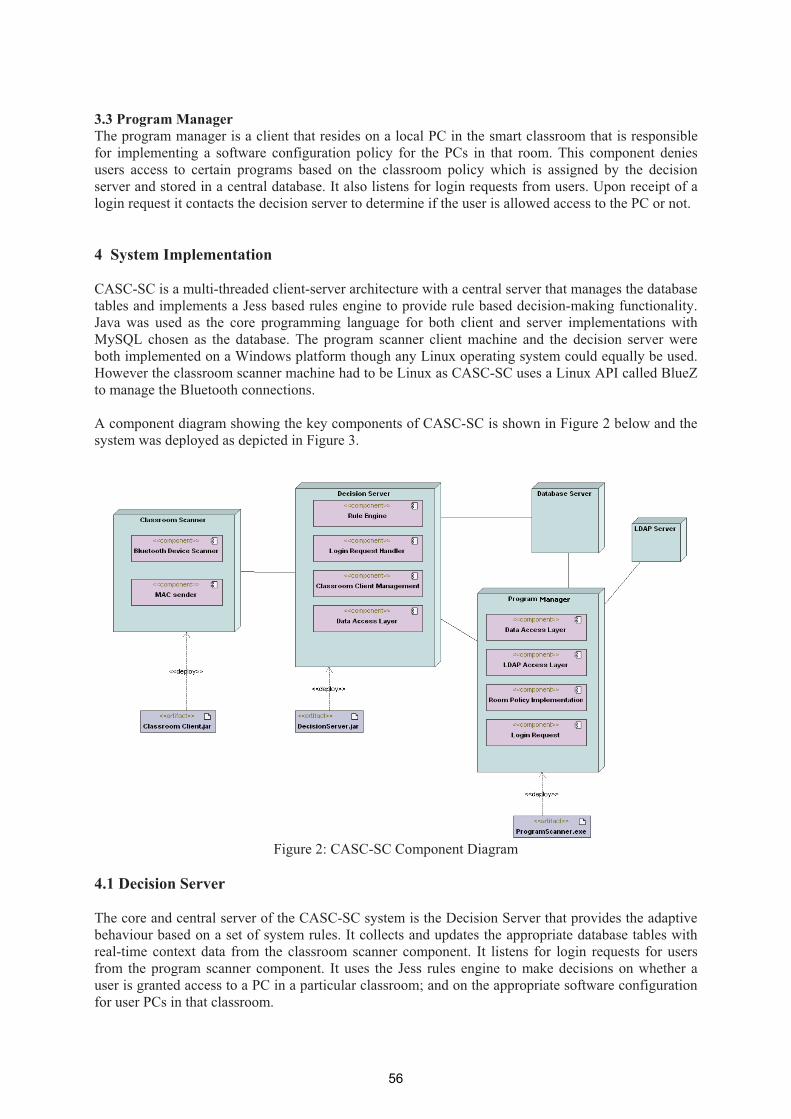
3.3 Program Manager The program manager is a client that resides on a local PC in the smart classroom that is responsible for implementing a software configuration policy for the PCs in that room. This component denies users access to certain programs based on the classroom policy which is assigned by the decision server and stored in a central database. It also listens for login requests from users. Upon receipt of a login request it contacts the decision server to determine if the user is allowed access to the PC or not. 4 System Implementation CASC-SC is a multi-threaded client-server architecture with a central server that manages the database tables and implements a Jess based rules engine to provide rule based decision-making functionality. Java was used as the core programming language for both client and server implementations with MySQL chosen as the database. The program scanner client machine and the decision server were both implemented on a Windows platform though any Linux operating system could equally be used. However the classroom scanner machine had to be Linux as CASC-SC uses a Linux API called BlueZ to manage the Bluetooth connections. A component diagram showing the key components of CASC-SC is shown in Figure 2 below and the system was deployed as depicted in Figure 3.
Figure 2: CASC-SC Component Diagram
4.1 Decision Server The core and central server of the CASC-SC system is the Decision Server that provides the adaptive behaviour based on a set of system rules. It collects and updates the appropriate database tables with real-time context data from the classroom scanner component. It listens for login requests for users from the program scanner component. It uses the Jess rules engine to make decisions on whether a user is granted access to a PC in a particular classroom; and on the appropriate software configuration for user PCs in that classroom.
56
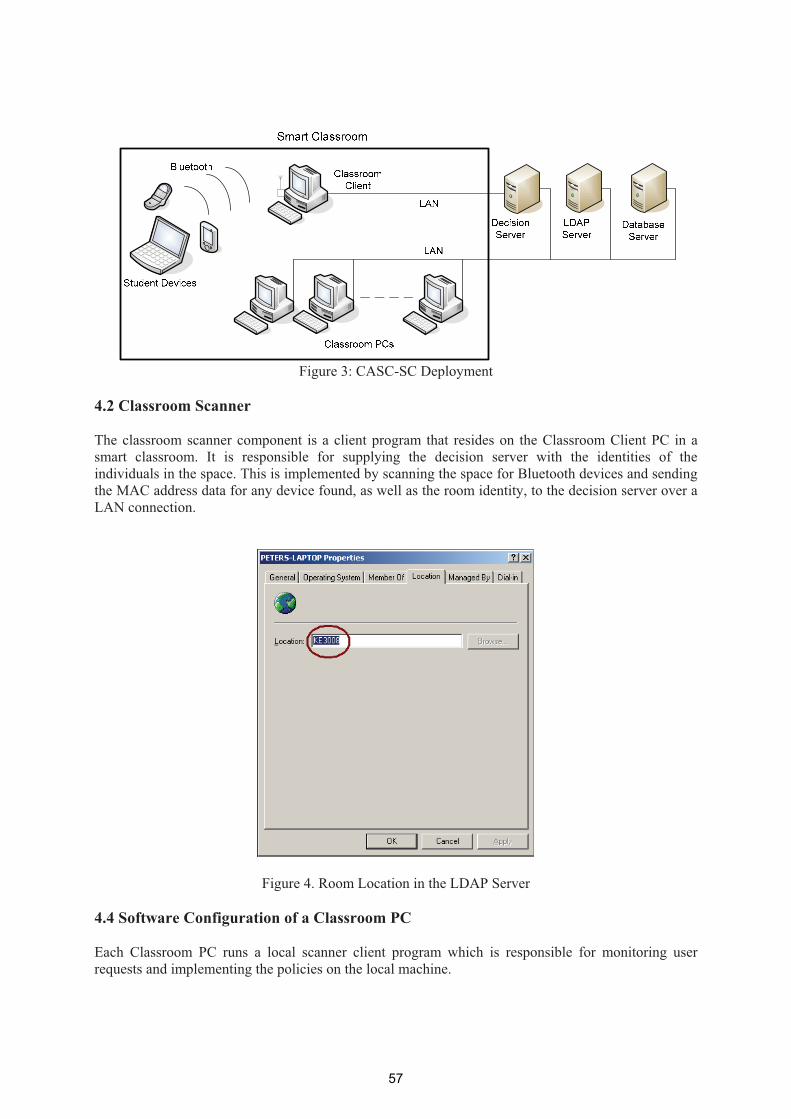
Figure 3: CASC-SC Deployment
4.2 Classroom Scanner The classroom scanner component is a client program that resides on the Classroom Client PC in a smart classroom. It is responsible for supplying the decision server with the identities of the individuals in the space. This is implemented by scanning the space for Bluetooth devices and sending the MAC address data for any device found, as well as the room identity, to the decision server over a LAN connection.
Figure 4. Room Location in the LDAP Server 4.4 Software Configuration of a Classroom PC Each Classroom PC runs a local scanner client program which is responsible for monitoring user requests and implementing the policies on the local machine.
57

When the classroom PC is booted an application is started that first retrieves its room location from an LDAP server as shown in Figure 4. After the room location is retrieved the application calls the location verifier to process a login request with the decision server. Next the application “impersonates” a user with higher credentials on the PC and retrieves three policy lists from the database – the desktop list, the start-up list and the blocked list. It then writes the desktop shortcuts, as in Figure 4, from the desktop list as the impersonated user and launches the programs from the start up list. The application then retrieves the blocked list from the database and checks which processes are in the queue on the operating system. If a program from the blocked list is found it, the program scanner will use a system call to terminate the disallowed process. This process is then continued in a constant loop. 5. Evaluation The system was evaluated over a 4 week period with two lecturer roles and several simulated student roles in order to determine the usability of the system. From this deployment, the system was evaluated from a technical perspective and recommendations developed for future enhancements. It was commented that the system removed tedious activities at the start of practical sessions and improved efficiency. It was also noted that it could potentially provide a management layer for the classroom that would abstract the lecturer from the technology. 5.1 Deployment The CASC-SC system uses commonly available personal mobile devices supported by pervasive technologies such as Bluetooth, WLAN and LAN that make system deployment relatively simple and cheap to deploy in a real academic environment. The system is a client-server architecture which makes it easy to set up many smart rooms by adding the CASC-SC client with a Bluetooth dongle to existing theatre or lecture facilities. The CASC-SC system effectively manages the software configuration of the PCs within the smart classroom. The rules engine, Jess, used in this system uses the Rete algorithm to process rules and is thus much faster than a simple set of cascading if-then-else statements adopted in conventional programming languages [20] and the original CASC implementation [3]. 5.2 System Limitations The Bluetooth sensor occasionally scanned extra devices that were not inside the room. This problem depended on the actual positioning of the Bluetooth monitoring sensor. If it was positioned near the smart classroom door Bluetooth devices outside the room could be scanned. In this case the location database would be updated with incorrect data indicating that a user was inside the smart space. However, this problem was alleviated by placing the sensor at an external wall, away from the door. Another drawback when relying on Bluetooth technology to provide context data is that a user might not have their Bluetooth devices switched on resulting in the user not being recognised within the space. A better solution would be to use RFID as a means of identification. RFID tags respond much faster than Bluetooth devices and they can be integrated into a staff or student card. Performance issues, in terms of system response time, were identified when using Bluetooth as a means of identifying people in the space. Testing showed that the Bluetooth Device Discovery Protocol requires 5 to 8 seconds to identify a device within the space. A potential bottleneck in the system is the number of facts in the rules engine working memory that might have to be evaluated against the rules in the rules engine rules base. The solution employed in this implementation is to only load into the rules engine working memory with the timetable information for one hour at a time. In addition, as outlined in [19], the performance of a Rete-based
58
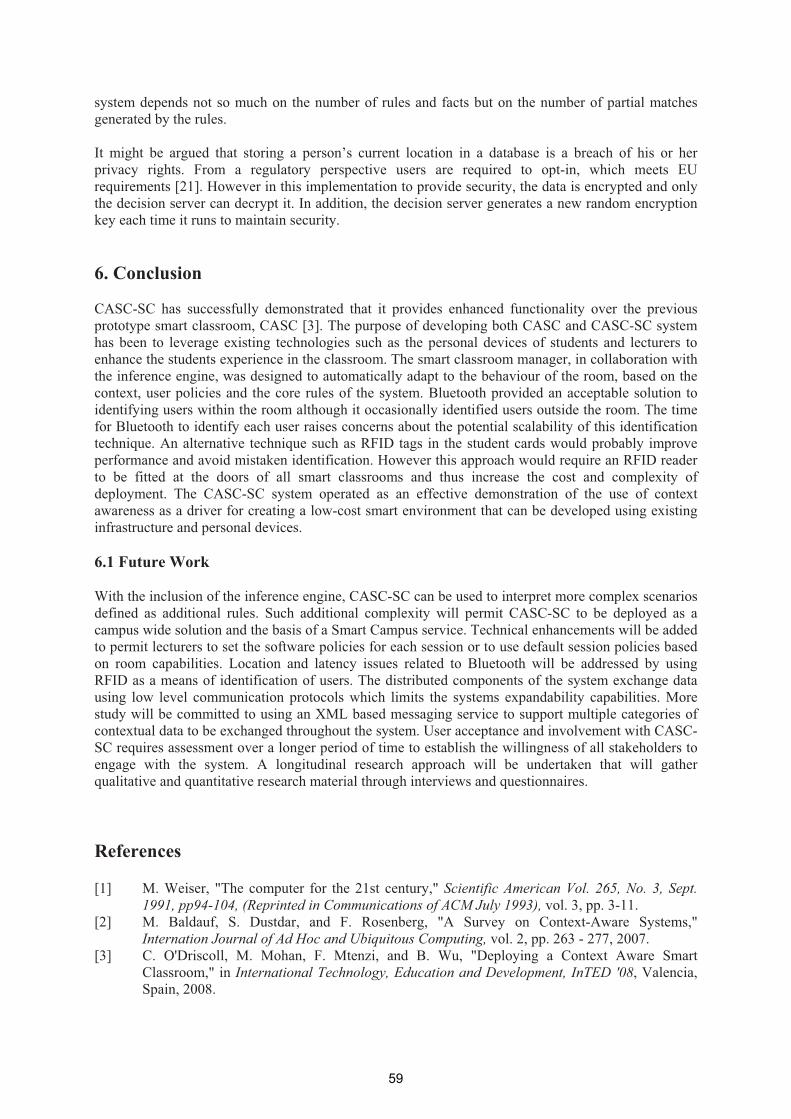
system depends not so much on the number of rules and facts but on the number of partial matches generated by the rules. It might be argued that storing a person’s current location in a database is a breach of his or her privacy rights. From a regulatory perspective users are required to opt-in, which meets EU requirements [21]. However in this implementation to provide security, the data is encrypted and only the decision server can decrypt it. In addition, the decision server generates a new random encryption key each time it runs to maintain security. 6. Conclusion CASC-SC has successfully demonstrated that it provides enhanced functionality over the previous prototype smart classroom, CASC [3]. The purpose of developing both CASC and CASC-SC system has been to leverage existing technologies such as the personal devices of students and lecturers to enhance the students experience in the classroom. The smart classroom manager, in collaboration with the inference engine, was designed to automatically adapt to the behaviour of the room, based on the context, user policies and the core rules of the system. Bluetooth provided an acceptable solution to identifying users within the room although it occasionally identified users outside the room. The time for Bluetooth to identify each user raises concerns about the potential scalability of this identification technique. An alternative technique such as RFID tags in the student cards would probably improve performance and avoid mistaken identification. However this approach would require an RFID reader to be fitted at the doors of all smart classrooms and thus increase the cost and complexity of deployment. The CASC-SC system operated as an effective demonstration of the use of context awareness as a driver for creating a low-cost smart environment that can be developed using existing infrastructure and personal devices. 6.1 Future Work With the inclusion of the inference engine, CASC-SC can be used to interpret more complex scenarios defined as additional rules. Such additional complexity will permit CASC-SC to be deployed as a campus wide solution and the basis of a Smart Campus service. Technical enhancements will be added to permit lecturers to set the software policies for each session or to use default session policies based on room capabilities. Location and latency issues related to Bluetooth will be addressed by using RFID as a means of identification of users. The distributed components of the system exchange data using low level communication protocols which limits the systems expandability capabilities. More study will be committed to using an XML based messaging service to support multiple categories of contextual data to be exchanged throughout the system. User acceptance and involvement with CASC-SC requires assessment over a longer period of time to establish the willingness of all stakeholders to engage with the system. A longitudinal research approach will be undertaken that will gather qualitative and quantitative research material through interviews and questionnaires. References [1] M. Weiser, "The computer for the 21st century," Scientific American Vol. 265, No. 3, Sept.
1991, pp94-104, (Reprinted in Communications of ACM July 1993), vol. 3, pp. 3-11. [2] M. Baldauf, S. Dustdar, and F. Rosenberg, "A Survey on Context-Aware Systems,"
Internation Journal of Ad Hoc and Ubiquitous Computing, vol. 2, pp. 263 - 277, 2007. [3] C. O'Driscoll, M. Mohan, F. Mtenzi, and B. Wu, "Deploying a Context Aware Smart
Classroom," in International Technology, Education and Development, InTED '08, Valencia, Spain, 2008.
59
[4] G. Chen and D. Kotz, " A survey of Context-Aware Mobile Computing Research," Dartmouth College Computer Science TR2000-381, 2000.
[5] B. N. Schilit and M. M. Theimer, "Disseminating active map information to mobile hosts," Network, IEEE, vol. 8, p. 22, 1994.
[6] B. Schilit, N. Adams, and R. Want, "Context-aware computing applications," in Workshop on Mobile Computing Systems and Applications, Proceedings., 1994, p. 85.
[7] N. Streitz and P. Nixon, "Introduction to The Disappearing Computer," Communications of the ACM, vol. 48, pp. 32-35, 2005.
[8] D. M. Russell, N. A. Streitz, and T. Winograd, "Building disappearing computers," Communications of the ACM, vol. 48, pp. 42-48, 2005.
[9] S. K. Das, D. J. Cook, A. Battacharya, I. Heierman E. O., and A. T.-Y. L. Tze-Yun Lin, "The role of prediction algorithms in the MavHome smart home architecture," Wireless Communications, IEEE, vol. 9, p. 77, 2002.
[10] S. K. Das and D. J. Cook, "Designing and modeling smart environments," in World of Wireless, Mobile and Multimedia Networks. WoWMoM 2006, p. 5 pp.
[11] M. Weiser, "Some computer science issues in ubiquitous computing," Communications of the ACM, vol. 36, pp. 75-84, 1993.
[12] G. D. Abowd, "Software Engineering Issues for Ubiquitous Computing," in Proceedings of the 21st International Conference on Software Engineering (ICSE '99), Los Angeles, CA, 1999.
[13] G. D. Abowd, "Classroom 2000: An Experiment with the Instrumentation of a Living educational Environment " IBM Systems Journal, vol. 38, pp. 508-530, 1999.
[14] J. Brotherton and G. D. Abowd, "eClass. Sixth Chapter " in The Digital University: Building a Learning Community, R. Hazemi, S. Hailes, and S. Wilbur, Eds.: Springer Verlag, 2002, p. 252.
[15] J. A. Brotherton and G. D. Abowd, "Lessons learned from eClass: Assessing automated capture and access in the classroom," ACM Transactions Computer-Human Interaction., vol. 11, pp. 121-155, 2004.
[16] E. Feigenbaum, McCorduck, P., Forgy, C.L., The fifth generation (1st ed.),. Reading, MA. Addison Wesley, ISBN 9780201115192, OCLC 9324691, 1983.
[17] J. Giarratano, Riley, G., Expert Systems: Principles and Programming, Thomson Press, 2004. [18] C. L. Forgy, On the efficient implementation of production systems. Ph.D. Thesis, Carnegie-
Mellon University, 1979. [19] S. J. Sandina Labratories. (1997, the Rule Engine for the Java Platform. Retrieved April 09,
2009, from Jess, the Rule Engine for the Java Platform: http://www.jessrules.com/jess/index.shtml.
[20] S. Yang, Zhang, J., Chen, O., A Jess enabled context elicitation system for providing context-aware Web services, Expert Systems with Applications, Volume 34, Issue4. 2008.
[21] "Data Protection Directive (95/46/ec) ", 1995.
60
Sensing Learner Interest Through Eye Tracking
Haolin Wei 1, Arghir-Nicolae Moldovan 2, Cristina Hava Muntean 2
1 School of Electronic Engineering, Dublin City University, Glasnevin, Dublin 9, Ireland [email protected]
2 School of Computing, National College of Ireland, Mayor Street, Dublin 1, Ireland
[email protected], [email protected]
Abstract
Due to the rapidly growing of the amount of information, a stronger need emerges for efficient and flexible strategies for personalisation of the educational content. E-learning systems are very helpful for learners, however, people differ in knowledge level, learning styles and may seek for different information when they access web based e-learning systems. Therefore, content adapted to the user’s needs should be supported by the e-learning systems. In this paper we introduce a new e-learning environment that makes use of eye tracking mechanism to follow learner interest in certain topics and to perform content personalisation. The framework of the e-learning system is presented. Furthermore, an exemplification of the e-learning environment is provided.
Keywords: e-learning, eye tracking, personalised educational content 1 Introduction With the fast increasing amount of knowledge traditional learning method no longer meet the needs of students and employees, thus improved and efficient learning activities are required. E-learning systems have developed rapidly during the last decade and currently are used in various learning environments such as: schools, home, work and so on. For example distance tutoring systems are used to provide educational content as an alternative to traditional instructor-led learning when face-to-face teaching is not possible. However, learners have different knowledge level, expectations, goals or interests. In order to cope with these problems, and to assist better the learners various solutions were proposed aiming at personalising the educational content. Traditional Adaptive and Personalised e-Learning Systems (AeLS) use different user modelling techniques to personalise a course. User models are created and updated regularily with information that is collected explicit or implicit from the users, through online forms or monitoring their behaviour. Sensing the learners’ interest and capturing their behaviour in real time is a challenging task. In this paper we explore the potential of using eye-tracking technology for sensing learner’s interest as well as other contextual information, such as tiredness or confusion. Once detected, this information may be used to improve the personalisation of the educational material, and thus increasing the learning outcome.We also introduce an eye-tracking based AeLS that follows learner’s eyes movements to detect their interest and to personalise the educational material. The remaining of the paper is structured as follows. Research efforts in the areas of adaptive e-learning and eye tracking are presented in section 2. The overview of the proposed eye-tracking based e-learning system and how the system can be used to observe learner’s interest in real time is illustrated in section 3. The paper finishes with conclusions and further work.
61
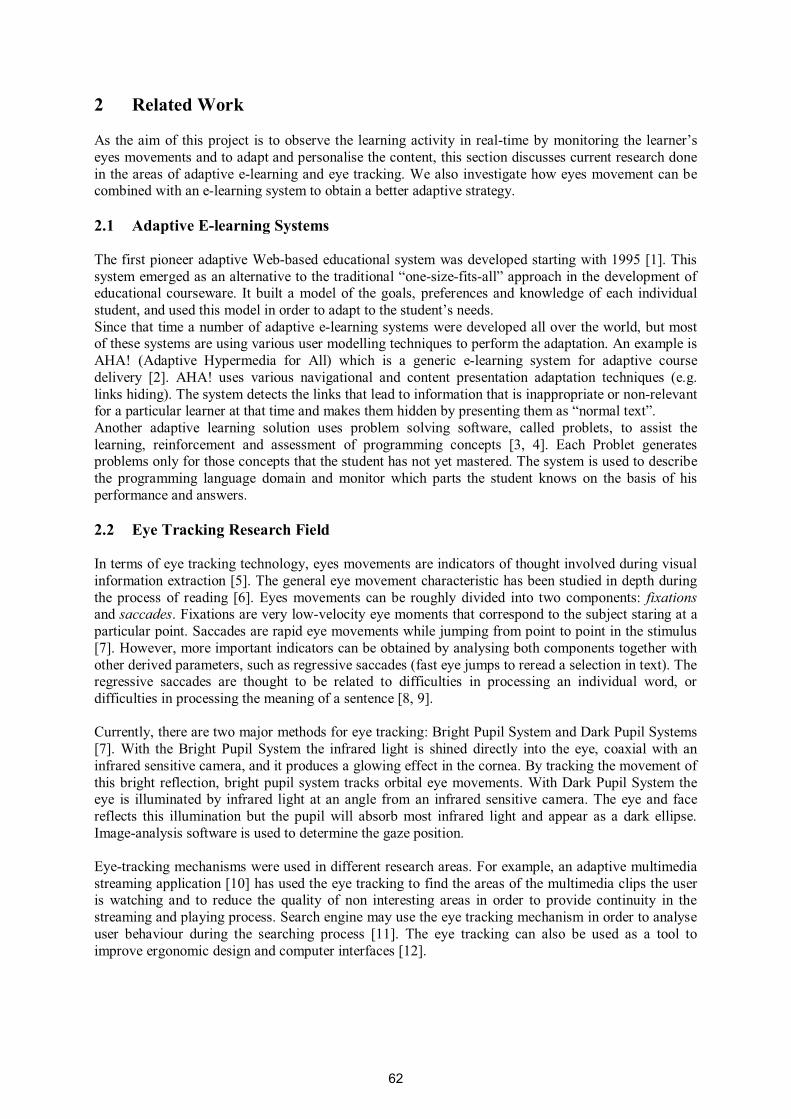
2 Related Work As the aim of this project is to observe the learning activity in real-time by monitoring the learner’s eyes movements and to adapt and personalise the content, this section discusses current research done in the areas of adaptive e-learning and eye tracking. We also investigate how eyes movement can be combined with an e-learning system to obtain a better adaptive strategy. 2.1 Adaptive E-learning Systems The first pioneer adaptive Web-based educational system was developed starting with 1995 [1]. This system emerged as an alternative to the traditional “one-size-fits-all” approach in the development of educational courseware. It built a model of the goals, preferences and knowledge of each individual student, and used this model in order to adapt to the student’s needs. Since that time a number of adaptive e-learning systems were developed all over the world, but most of these systems are using various user modelling techniques to perform the adaptation. An example is AHA! (Adaptive Hypermedia for All) which is a generic e-learning system for adaptive course delivery [2]. AHA! uses various navigational and content presentation adaptation techniques (e.g. links hiding). The system detects the links that lead to information that is inappropriate or non-relevant for a particular learner at that time and makes them hidden by presenting them as “normal text”. Another adaptive learning solution uses problem solving software, called problets, to assist the learning, reinforcement and assessment of programming concepts [3, 4]. Each Problet generates problems only for those concepts that the student has not yet mastered. The system is used to describe the programming language domain and monitor which parts the student knows on the basis of his performance and answers. 2.2 Eye Tracking Research Field In terms of eye tracking technology, eyes movements are indicators of thought involved during visual information extraction [5]. The general eye movement characteristic has been studied in depth during the process of reading [6]. Eyes movements can be roughly divided into two components: fixations and saccades. Fixations are very low-velocity eye moments that correspond to the subject staring at a particular point. Saccades are rapid eye movements while jumping from point to point in the stimulus [7]. However, more important indicators can be obtained by analysing both components together with other derived parameters, such as regressive saccades (fast eye jumps to reread a selection in text). The regressive saccades are thought to be related to difficulties in processing an individual word, or difficulties in processing the meaning of a sentence [8, 9]. Currently, there are two major methods for eye tracking: Bright Pupil System and Dark Pupil Systems [7]. With the Bright Pupil System the infrared light is shined directly into the eye, coaxial with an infrared sensitive camera, and it produces a glowing effect in the cornea. By tracking the movement of this bright reflection, bright pupil system tracks orbital eye movements. With Dark Pupil System the eye is illuminated by infrared light at an angle from an infrared sensitive camera. The eye and face reflects this illumination but the pupil will absorb most infrared light and appear as a dark ellipse. Image-analysis software is used to determine the gaze position. Eye-tracking mechanisms were used in different research areas. For example, an adaptive multimedia streaming application [10] has used the eye tracking to find the areas of the multimedia clips the user is watching and to reduce the quality of non interesting areas in order to provide continuity in the streaming and playing process. Search engine may use the eye tracking mechanism in order to analyse user behaviour during the searching process [11]. The eye tracking can also be used as a tool to improve ergonomic design and computer interfaces [12].
62
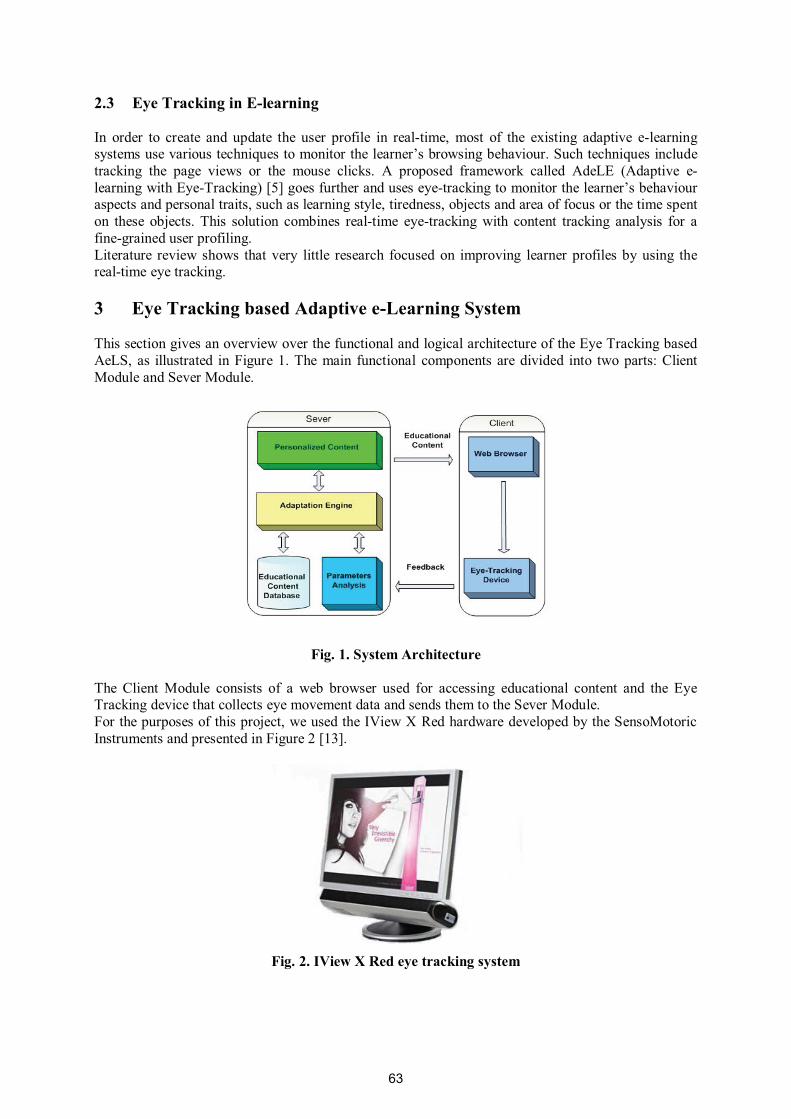
2.3 Eye Tracking in E-learning In order to create and update the user profile in real-time, most of the existing adaptive e-learning systems use various techniques to monitor the learner’s browsing behaviour. Such techniques include tracking the page views or the mouse clicks. A proposed framework called AdeLE (Adaptive e-learning with Eye-Tracking) [5] goes further and uses eye-tracking to monitor the learner’s behaviour aspects and personal traits, such as learning style, tiredness, objects and area of focus or the time spent on these objects. This solution combines real-time eye-tracking with content tracking analysis for a fine-grained user profiling. Literature review shows that very little research focused on improving learner profiles by using the real-time eye tracking. 3 Eye Tracking based Adaptive e-Learning System This section gives an overview over the functional and logical architecture of the Eye Tracking based AeLS, as illustrated in Figure 1. The main functional components are divided into two parts: Client Module and Sever Module.
Fig. 1. System Architecture The Client Module consists of a web browser used for accessing educational content and the Eye Tracking device that collects eye movement data and sends them to the Sever Module. For the purposes of this project, we used the IView X Red hardware developed by the SensoMotoric Instruments and presented in Figure 2 [13].
Fig. 2. IView X Red eye tracking system
63
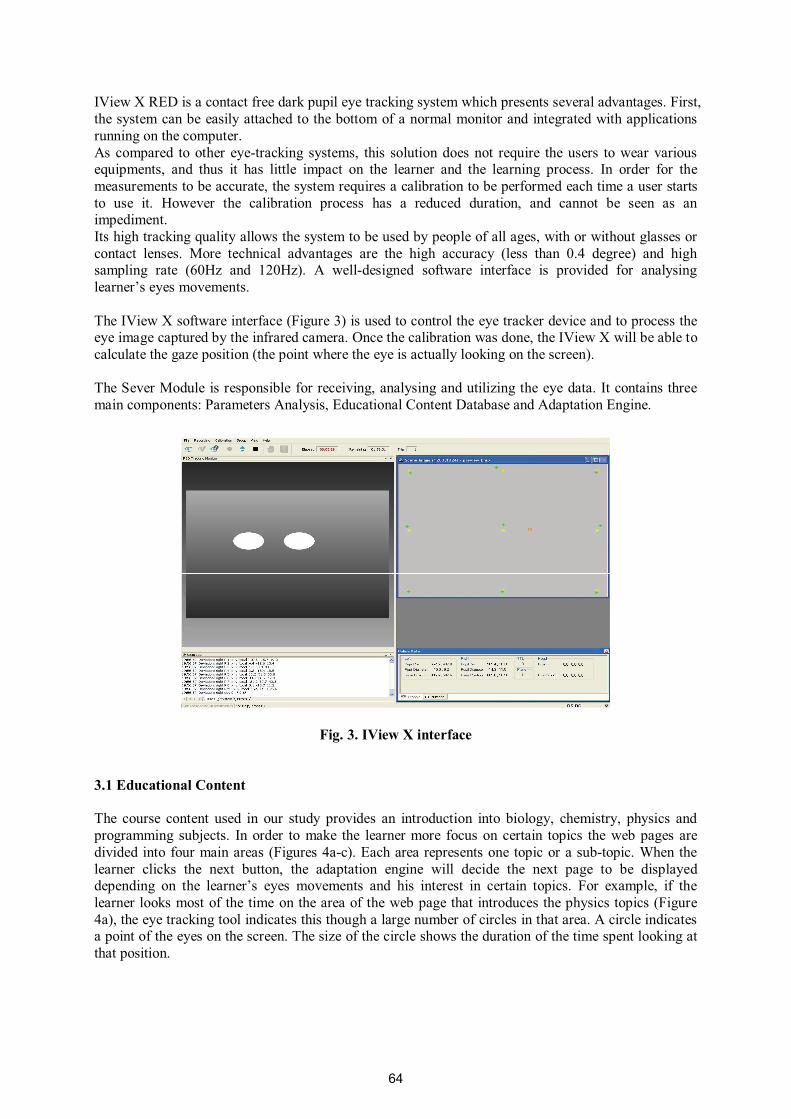
IView X RED is a contact free dark pupil eye tracking system which presents several advantages. First, the system can be easily attached to the bottom of a normal monitor and integrated with applications running on the computer. As compared to other eye-tracking systems, this solution does not require the users to wear various equipments, and thus it has little impact on the learner and the learning process. In order for the measurements to be accurate, the system requires a calibration to be performed each time a user starts to use it. However the calibration process has a reduced duration, and cannot be seen as an impediment. Its high tracking quality allows the system to be used by people of all ages, with or without glasses or contact lenses. More technical advantages are the high accuracy (less than 0.4 degree) and high sampling rate (60Hz and 120Hz). A well-designed software interface is provided for analysing learner’s eyes movements. The IView X software interface (Figure 3) is used to control the eye tracker device and to process the eye image captured by the infrared camera. Once the calibration was done, the IView X will be able to calculate the gaze position (the point where the eye is actually looking on the screen). The Sever Module is responsible for receiving, analysing and utilizing the eye data. It contains three main components: Parameters Analysis, Educational Content Database and Adaptation Engine.
Fig. 3. IView X interface
3.1 Educational Content The course content used in our study provides an introduction into biology, chemistry, physics and programming subjects. In order to make the learner more focus on certain topics the web pages are divided into four main areas (Figures 4a-c). Each area represents one topic or a sub-topic. When the learner clicks the next button, the adaptation engine will decide the next page to be displayed depending on the learner’s eyes movements and his interest in certain topics. For example, if the learner looks most of the time on the area of the web page that introduces the physics topics (Figure 4a), the eye tracking tool indicates this though a large number of circles in that area. A circle indicates a point of the eyes on the screen. The size of the circle shows the duration of the time spent looking at that position.
64
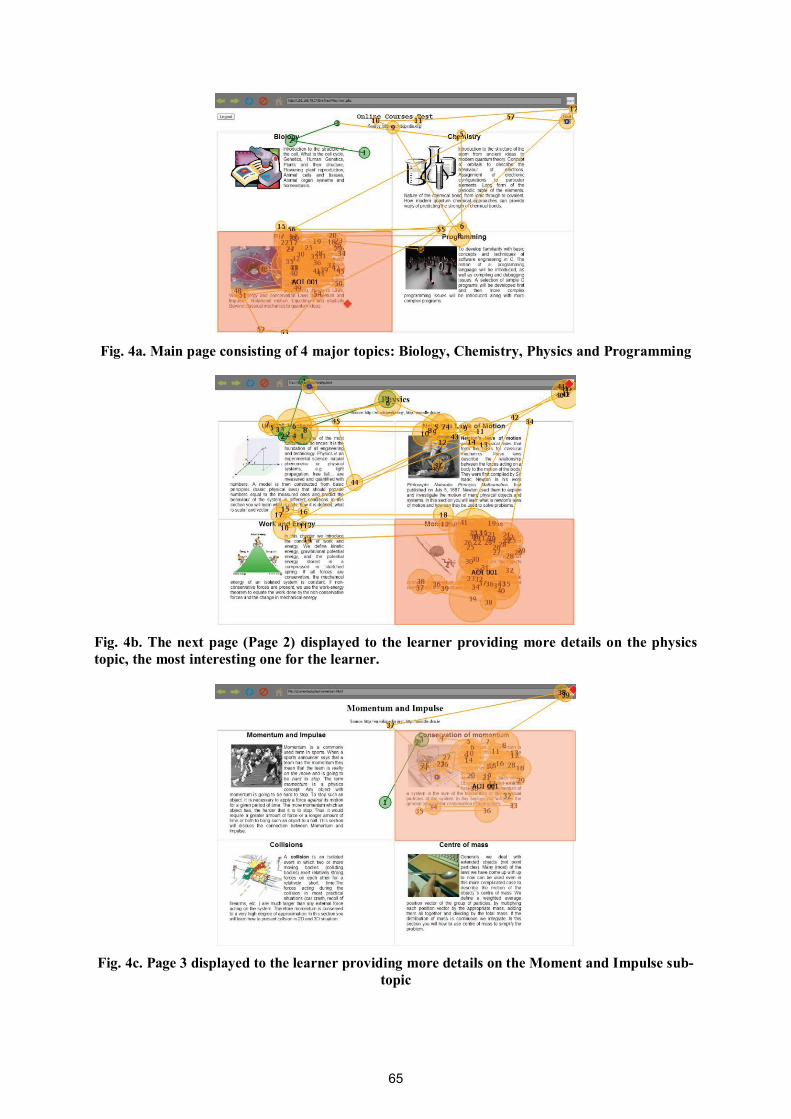
Fig. 4a. Main page consisting of 4 major topics: Biology, Chemistry, Physics and Programming
Fig. 4b. The next page (Page 2) displayed to the learner providing more details on the physics topic, the most interesting one for the learner.
Fig. 4c. Page 3 displayed to the learner providing more details on the Moment and Impulse sub-
topic
65

3.2 Parameters Analysis As the screen is divided into four areas, a boundary condition can be set for each topic. A program compares each gaze position with the interval and counts the number of samples in each area, depending on which area gets the most samples learner’s most interested topic is detected. Further analysis on the learner profile such as learning style, tiredness, confusion can also be performed once the condition is set. For example a learner with a strong visual memory but weaker verbal processing will spend more time on the picture rather than the text. Once the student’s learning method is identified, the educational content is adapted to provide mainly images and video, rather then text, and thus increasing the efficiency of the learning process. Regarding tiredness and content difficulties, it is said saccadic velocity decreases with increasing tiredness and increases with increasing task difficulty [5]. When a boundary condition is triggered, the system can interact with the learner to suggest a break or change in the content. 3.3 Adaptation Engine When learner logs in, the results from the parameters analysis block are saved in the database. Every time when the user starts a course, his behaviour is recorded in the database. This includes when the course is started, which page the learner had visited and how long she/he spends on each area. This data is combined with eye movement to get a fine-grained user profile. 4 Conclusions and Further Work Nowadays the eye tracking devices can be easily integrated with regular computer monitors used to visualise e-learning courses. Even though the cost of an advanced eye-tracking system is still high, in a couple of years the rapid technical progress may come with low-cost solutions and accurate eye tracking systems. Combining real-time contextual data that can be captured using an eye tracking system with the sophisticated user modelling techniques, a fine-grained user profile can be obtained, thus highly personalised course content can be created for the learners. Further work will address improvements in the functionality of the proposed AeLS. First, we plan to improve the adaptation model with support for multimedia content. Second, we want to add prediction to the system such as learner’s tiredness and confusion. And finally, we are going to perform subjective tests and to compare the results with traditional adaptive e-learning systems and to evaluate if learner experience is enhanced. Acknowledgements The support of Science Foundation Ireland and ODCSSS (Online Dublin Computer Science Summer School) programme is gratefully acknowledged. References [1] De Bra, P., Brusilovsky, P., & Houben, G. J. (1999). Adaptive hypermedia: from systems to
framework. ACM Computing Surveys (CSUR), 31(4es). [2] De Bra, P., Smits, D., & Stash, N. (2006). Creating and Delivering Adaptive Courses with
AHA! Lecture Notes in Computer Science, 4227, 21. [3] Kumar, A. N. (2005). Results from the evaluation of the effectiveness of an online tutor on
expression evaluation. In Proceedings of the 36th SIGCSE technical symposium on Computer science education (pp. 216–220).
[4] Kumar, A. N. (n.d.). Problets - The Home Page. Retrieved September 25, 2009, from http://www.problets.org/.
66
[5] Gütl, C., Pivec, M., Trummer, C., García-Barrio, V. M., Mödritscher, F., Pripfl, J., & Umgeher, M. (2005). AdeLE (Adaptive e-Learning with Eye-Tracking): theoretical background, system architecture and application scenarios. EURODL: European Journal of Open, Distance and E-Learning, 2005–12.
[6] Rayner, K. (1998). Eye movements in reading and information processing: 20 years of research. Psychological bulletin, 124, 372–422.
[7] SensoMotoric Instruments. (2007). An Introduction to iView X. iView X System Manual. [8] Kennedy, A., & Murray, W. S. (1987). Spatial coordinates and reading: Comments on
Monk (1985). The Quarterly Journal of Experimental Psychology Section A, 39(4), 649–656.
[9] Murray, W. S., & Kennedy, A. (1988). Spatial coding in the processing of anaphor by good and poor readers: Evidence from eye movement analyses. The Quarterly Journal of Experimental Psychology Section A, 40(4), 693–718.
[10] Ghinea, G., & Muntean, G. M. (2009). An Eye-Tracking-based Adaptive Multimedia Streaming Scheme. In 2009 IEEE International Conference on Multimedia and Expo (ICME 2009) (pp. 962 - 965).
[11] Granka, L. A., Joachims, T., & Gay, G. (2004). Eye-tracking analysis of user behavior in WWW search. In Proceedings of the 27th annual international ACM SIGIR conference on Research and development in information retrieval (pp. 478–479).
[12] Kramer, A. F., & McCarley, J. S. (2003). Oculomotor behaviour as a reflection of attention and memory processes: neural mechanisms and applications to human factors. Theoretical Issues in Ergonomics Science, 4(1), 21–55.
[13] SensoMotoric Instruments GmbH, Gaze & Eye Tracking Systems - iView X RED (n.d.). Retrieved September 27, 2009, from http://www.smivision.com/en/gaze-eye-tracking-systems/products/iview-x-red-red250.html.
67

�
68

Session 3
Mobile Applications
69

�
70
A study of mobile Internet capability trends to assess theeffectiveness the W3C Default Delivery Context (DDC)
Ivan Dunn 1, Gary Clynch2
ITT Dublin, Institute of Technology Tallaght,Tallaght, Dublin 24, Ireland.1 [email protected], 2 [email protected]
Abstract
The mobile Internet is becoming increasingly popular, but the usability of many Web applications
provides a negative mobile Internet experience. This paper researched the Internet capabilities of
Web-enabled mobile phones through statistics generated using the R programming environment with
data sourced from MobileAware’s Device Description Repository (DDR). Time series analysis and
measures of location were applied to the data set. Hands-on testing using selected mobile browsers
were carried out to backup and prove findings. The data set contained 1384 device descriptions from
LG, Nokia, Motorola, Samsung and Sony Ericsson mobile phones that have a browser capable rende-
ring XHTML Basic 1.0 or better. The results of the research were used to evaluate the effectiveness
of the W3C Default Delivery Context (DDC) and recommendations were proposed to adjust parts of
the specification to improve end user experience and give developers more flexibility when designing
mobile Internet applications. Five of the eight DDC recommendations were adjusted and presented
as an Enhanced Delivery Context (EDC).
Keywords: mobile Internet, mobile browsers, DDC, EDC
1 INTRODUCTION
The mobile Internet is a connection to a Web page using a mobile phone; any mobile phone with a
browser is capable of accessing the Internet. A research report by Nielsen Mobile (Covey 2008) believes
that mobile Internet adoption reached a critical mass in 2008 through a confluence of device availability,
network speeds, content availability and, most importantly, consumer interest.
The guidelines that make up the DDC were assessed by applying research, statistical analysis to the
data set, and hands-on testing with selected mobile browsers to verify that the guidelines are representa-
tive of the population of mobile devices that can access the Internet. In assessing the DDC it was found
that some guidelines conflicted with the majority of mobile devices; this paper will present adjusted gui-
delines as an Enhanced Delivery Context (EDC) to better represent the population of mobile devices that
can access the Internet.
During the experiment selected mobile devices were used to connect to test XHTML documents to
prove and backup findings. In order to be most efficient at this task, devices with browser types that
did not get implemented into a device in 2008 were not considered as they have more than likely been
superseded or dropped as a product. The browser types identified from the data set that were implemented
in 2008 include Netfront, Obigo, Openwave, Opera, Nokia and Mozilla (Symbian) browsers.
2 Default Delivery Context
The W3C group, Mobile Web Initiative (MWI) (W3C 2009b), consists of four active working groups
with a common goal of making Web access from a mobile device as simple as Web access from a desktop
71
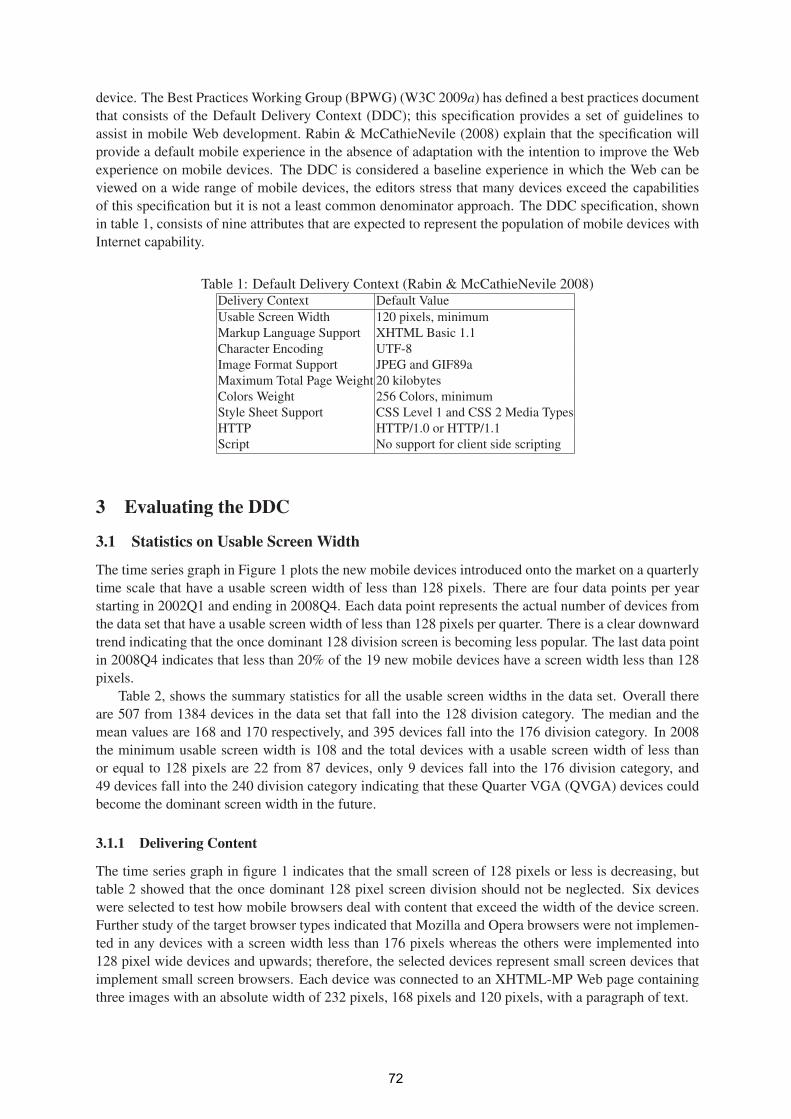
device. The Best Practices Working Group (BPWG) (W3C 2009a) has defined a best practices document
that consists of the Default Delivery Context (DDC); this specification provides a set of guidelines to
assist in mobile Web development. Rabin & McCathieNevile (2008) explain that the specification will
provide a default mobile experience in the absence of adaptation with the intention to improve the Web
experience on mobile devices. The DDC is considered a baseline experience in which the Web can be
viewed on a wide range of mobile devices, the editors stress that many devices exceed the capabilities
of this specification but it is not a least common denominator approach. The DDC specification, shown
in table 1, consists of nine attributes that are expected to represent the population of mobile devices with
Internet capability.
Table 1: Default Delivery Context (Rabin & McCathieNevile 2008)Delivery Context Default Value
Usable Screen Width 120 pixels, minimum
Markup Language Support XHTML Basic 1.1
Character Encoding UTF-8
Image Format Support JPEG and GIF89a
Maximum Total Page Weight 20 kilobytes
Colors Weight 256 Colors, minimum
Style Sheet Support CSS Level 1 and CSS 2 Media Types
HTTP HTTP/1.0 or HTTP/1.1
Script No support for client side scripting
3 Evaluating the DDC
3.1 Statistics on Usable Screen Width
The time series graph in Figure 1 plots the new mobile devices introduced onto the market on a quarterly
time scale that have a usable screen width of less than 128 pixels. There are four data points per year
starting in 2002Q1 and ending in 2008Q4. Each data point represents the actual number of devices from
the data set that have a usable screen width of less than 128 pixels per quarter. There is a clear downward
trend indicating that the once dominant 128 division screen is becoming less popular. The last data point
in 2008Q4 indicates that less than 20% of the 19 new mobile devices have a screen width less than 128
pixels.
Table 2, shows the summary statistics for all the usable screen widths in the data set. Overall there
are 507 from 1384 devices in the data set that fall into the 128 division category. The median and the
mean values are 168 and 170 respectively, and 395 devices fall into the 176 division category. In 2008
the minimum usable screen width is 108 and the total devices with a usable screen width of less than
or equal to 128 pixels are 22 from 87 devices, only 9 devices fall into the 176 division category, and
49 devices fall into the 240 division category indicating that these Quarter VGA (QVGA) devices could
become the dominant screen width in the future.
3.1.1 Delivering Content
The time series graph in figure 1 indicates that the small screen of 128 pixels or less is decreasing, but
table 2 showed that the once dominant 128 pixel screen division should not be neglected. Six devices
were selected to test how mobile browsers deal with content that exceed the width of the device screen.
Further study of the target browser types indicated that Mozilla and Opera browsers were not implemen-
ted in any devices with a screen width less than 176 pixels whereas the others were implemented into
128 pixel wide devices and upwards; therefore, the selected devices represent small screen devices that
implement small screen browsers. Each device was connected to an XHTML-MP Web page containing
three images with an absolute width of 232 pixels, 168 pixels and 120 pixels, with a paragraph of text.
72
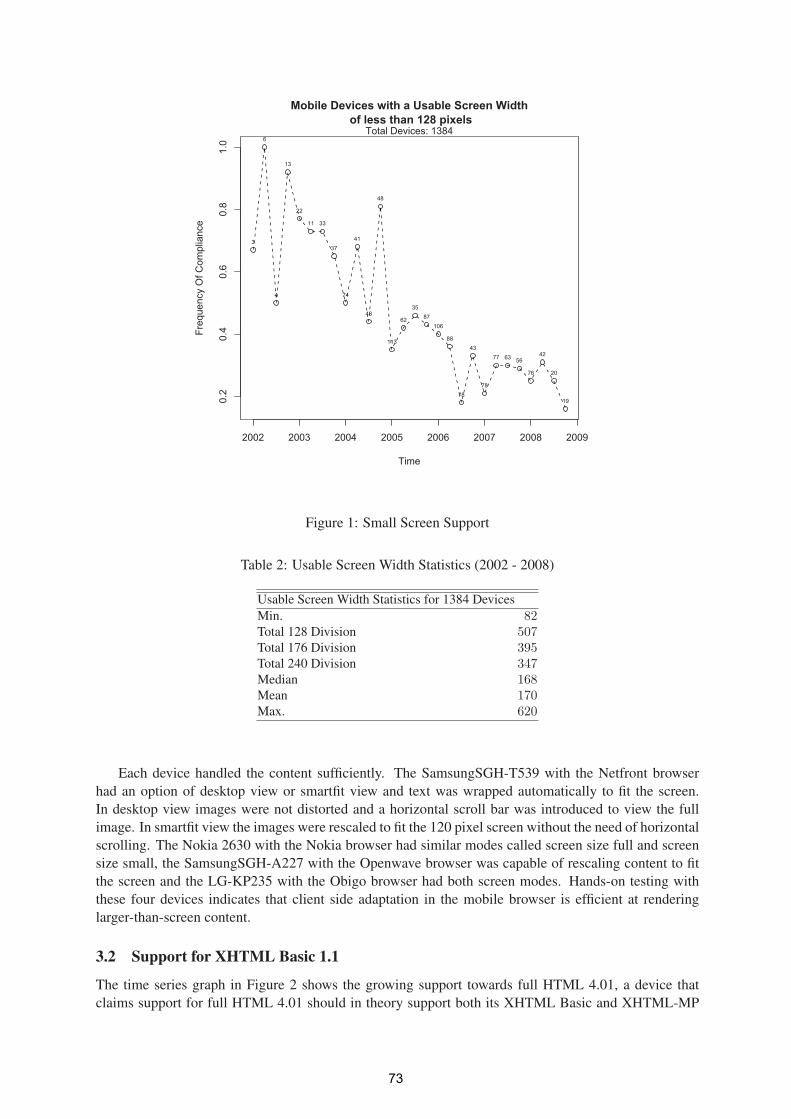
Mobile Devices with a Usable Screen Width of less than 128 pixels
Time
Freq
uenc
y O
f Com
plia
nce
2002 2003 2004 2005 2006 2007 2008 2009
0.2
0.4
0.6
0.8
1.0
Total Devices: 1384
3
6
4
13
22
11 33
37
74
41
48
48
113
62
3587
106
88
78
43
78
77 63 56
76
42
20
19
Figure 1: Small Screen Support
Table 2: Usable Screen Width Statistics (2002 - 2008)
Usable Screen Width Statistics for 1384 Devices
Min. 82Total 128 Division 507Total 176 Division 395Total 240 Division 347Median 168Mean 170Max. 620
Each device handled the content sufficiently. The SamsungSGH-T539 with the Netfront browser
had an option of desktop view or smartfit view and text was wrapped automatically to fit the screen.
In desktop view images were not distorted and a horizontal scroll bar was introduced to view the full
image. In smartfit view the images were rescaled to fit the 120 pixel screen without the need of horizontal
scrolling. The Nokia 2630 with the Nokia browser had similar modes called screen size full and screen
size small, the SamsungSGH-A227 with the Openwave browser was capable of rescaling content to fit
the screen and the LG-KP235 with the Obigo browser had both screen modes. Hands-on testing with
these four devices indicates that client side adaptation in the mobile browser is efficient at rendering
larger-than-screen content.
3.2 Support for XHTML Basic 1.1
The time series graph in Figure 2 shows the growing support towards full HTML 4.01, a device that
claims support for full HTML 4.01 should in theory support both its XHTML Basic and XHTML-MP
73
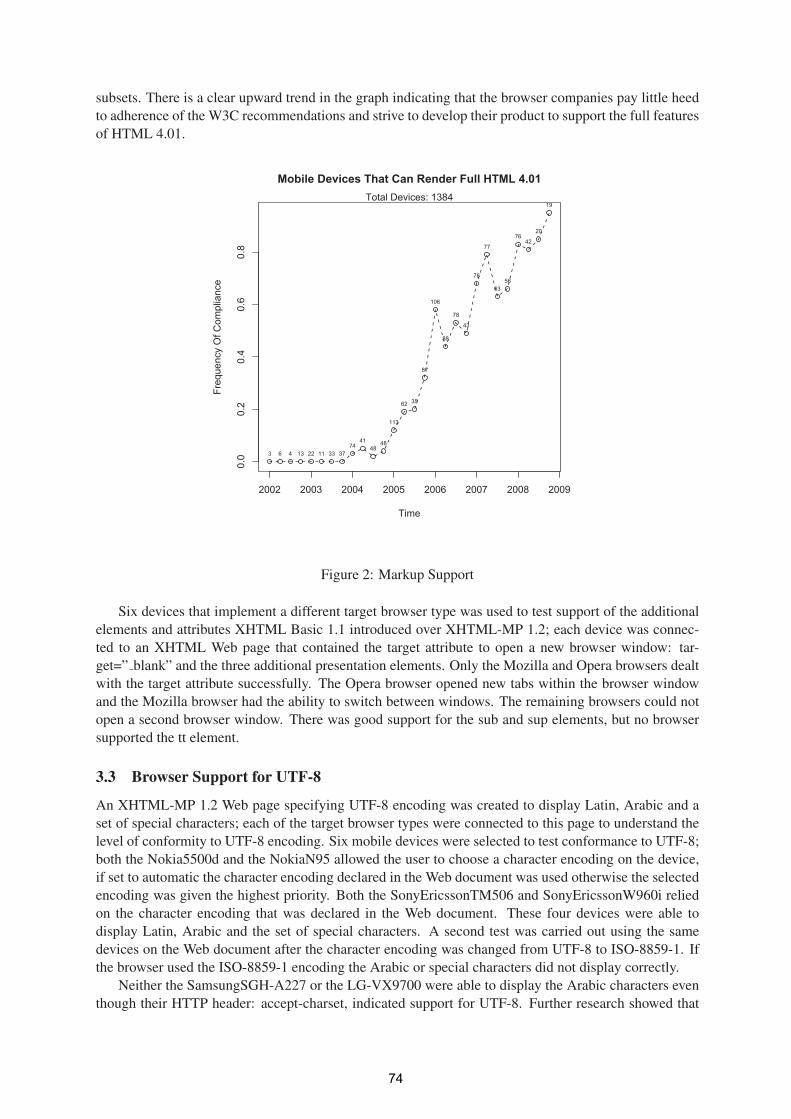
subsets. There is a clear upward trend in the graph indicating that the browser companies pay little heed
to adherence of the W3C recommendations and strive to develop their product to support the full features
of HTML 4.01.
Mobile Devices That Can Render Full HTML 4.01
Time
Freq
uenc
y O
f Com
plia
nce
2002 2003 2004 2005 2006 2007 2008 2009
0.0
0.2
0.4
0.6
0.8
Total Devices: 1384
3 6 4 13 22 11 33 3774
4148
48
113
62 35
87
106
88
78
43
78
77
6356
7642
20
19
Figure 2: Markup Support
Six devices that implement a different target browser type was used to test support of the additional
elements and attributes XHTML Basic 1.1 introduced over XHTML-MP 1.2; each device was connec-
ted to an XHTML Web page that contained the target attribute to open a new browser window: tar-
get=” blank” and the three additional presentation elements. Only the Mozilla and Opera browsers dealt
with the target attribute successfully. The Opera browser opened new tabs within the browser window
and the Mozilla browser had the ability to switch between windows. The remaining browsers could not
open a second browser window. There was good support for the sub and sup elements, but no browser
supported the tt element.
3.3 Browser Support for UTF-8
An XHTML-MP 1.2 Web page specifying UTF-8 encoding was created to display Latin, Arabic and a
set of special characters; each of the target browser types were connected to this page to understand the
level of conformity to UTF-8 encoding. Six mobile devices were selected to test conformance to UTF-8;
both the Nokia5500d and the NokiaN95 allowed the user to choose a character encoding on the device,
if set to automatic the character encoding declared in the Web document was used otherwise the selected
encoding was given the highest priority. Both the SonyEricssonTM506 and SonyEricssonW960i relied
on the character encoding that was declared in the Web document. These four devices were able to
display Latin, Arabic and the set of special characters. A second test was carried out using the same
devices on the Web document after the character encoding was changed from UTF-8 to ISO-8859-1. If
the browser used the ISO-8859-1 encoding the Arabic or special characters did not display correctly.
Neither the SamsungSGH-A227 or the LG-VX9700 were able to display the Arabic characters even
though their HTTP header: accept-charset, indicated support for UTF-8. Further research showed that
74
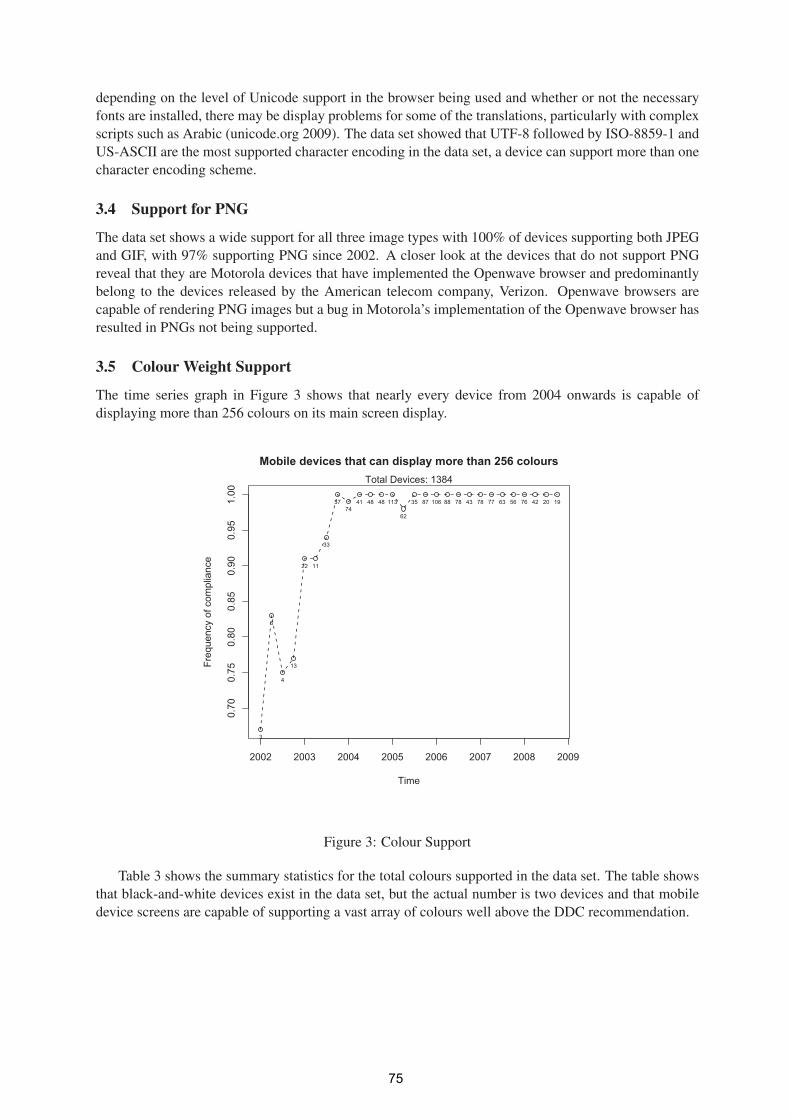
depending on the level of Unicode support in the browser being used and whether or not the necessary
fonts are installed, there may be display problems for some of the translations, particularly with complex
scripts such as Arabic (unicode.org 2009). The data set showed that UTF-8 followed by ISO-8859-1 and
US-ASCII are the most supported character encoding in the data set, a device can support more than one
character encoding scheme.
3.4 Support for PNG
The data set shows a wide support for all three image types with 100% of devices supporting both JPEG
and GIF, with 97% supporting PNG since 2002. A closer look at the devices that do not support PNG
reveal that they are Motorola devices that have implemented the Openwave browser and predominantly
belong to the devices released by the American telecom company, Verizon. Openwave browsers are
capable of rendering PNG images but a bug in Motorola’s implementation of the Openwave browser has
resulted in PNGs not being supported.
3.5 Colour Weight Support
The time series graph in Figure 3 shows that nearly every device from 2004 onwards is capable of
displaying more than 256 colours on its main screen display.
Mobile devices that can display more than 256 colours
Time
Freq
uenc
y of
com
plia
nce
2002 2003 2004 2005 2006 2007 2008 2009
0.70
0.75
0.80
0.85
0.90
0.95
1.00
Total Devices: 1384
3
6
4
13
22 11
33
3774
41 48 48 113
62
35 87 106 88 78 43 78 77 63 56 76 42 20 19
Figure 3: Colour Support
Table 3 shows the summary statistics for the total colours supported in the data set. The table shows
that black-and-white devices exist in the data set, but the actual number is two devices and that mobile
device screens are capable of supporting a vast array of colours well above the DDC recommendation.
75
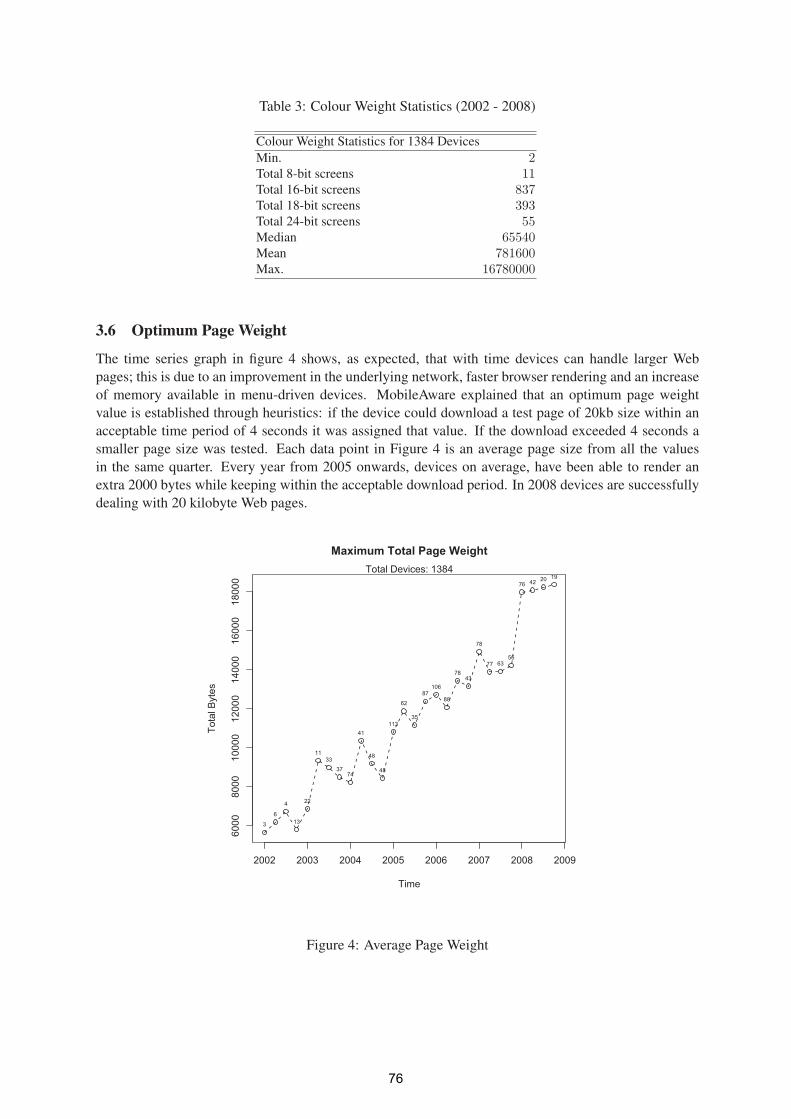
Table 3: Colour Weight Statistics (2002 - 2008)
Colour Weight Statistics for 1384 Devices
Min. 2Total 8-bit screens 11Total 16-bit screens 837Total 18-bit screens 393Total 24-bit screens 55Median 65540Mean 781600Max. 16780000
3.6 Optimum Page Weight
The time series graph in figure 4 shows, as expected, that with time devices can handle larger Web
pages; this is due to an improvement in the underlying network, faster browser rendering and an increase
of memory available in menu-driven devices. MobileAware explained that an optimum page weight
value is established through heuristics: if the device could download a test page of 20kb size within an
acceptable time period of 4 seconds it was assigned that value. If the download exceeded 4 seconds a
smaller page size was tested. Each data point in Figure 4 is an average page size from all the values
in the same quarter. Every year from 2005 onwards, devices on average, have been able to render an
extra 2000 bytes while keeping within the acceptable download period. In 2008 devices are successfully
dealing with 20 kilobyte Web pages.
Maximum Total Page Weight
Time
Tota
l Byt
es
2002 2003 2004 2005 2006 2007 2008 2009
6000
8000
1000
012
000
1400
016
000
1800
0
Total Devices: 1384
3
6
4
13
22
1133
3774
41
48
48
113
62
35
87106
88
7843
78
77 6356
76 42 20 19
Figure 4: Average Page Weight
76
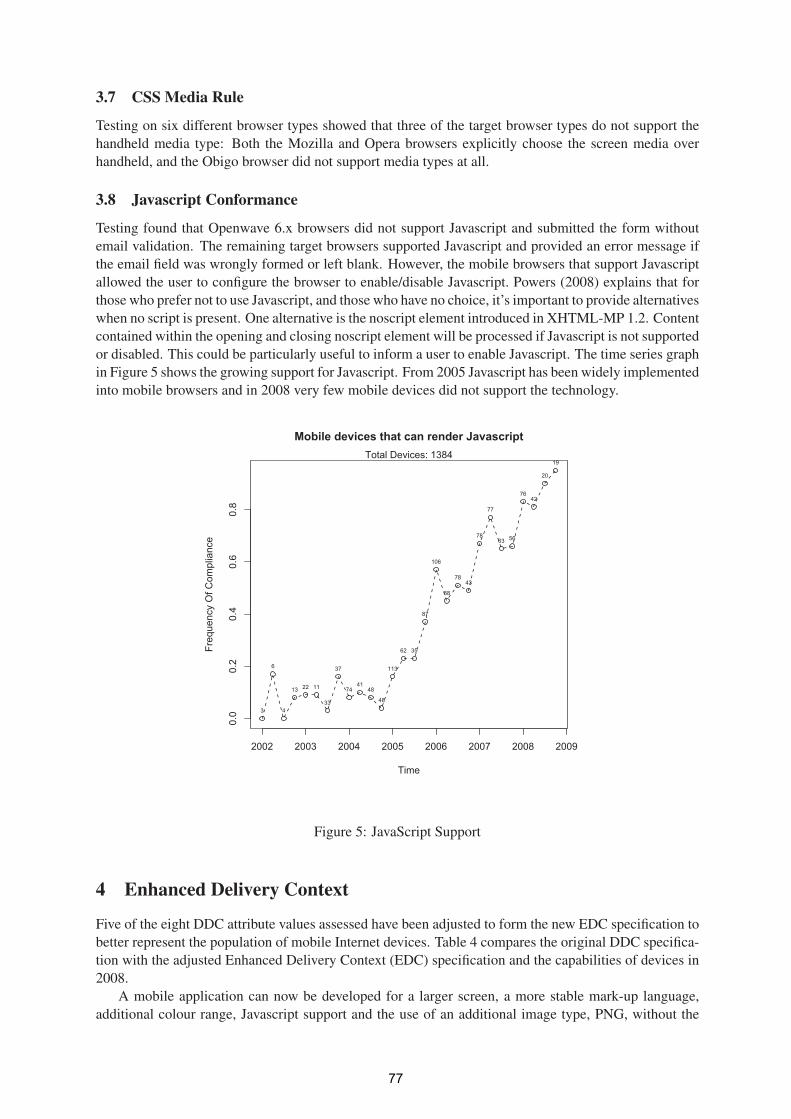
3.7 CSS Media Rule
Testing on six different browser types showed that three of the target browser types do not support the
handheld media type: Both the Mozilla and Opera browsers explicitly choose the screen media over
handheld, and the Obigo browser did not support media types at all.
3.8 Javascript Conformance
Testing found that Openwave 6.x browsers did not support Javascript and submitted the form without
email validation. The remaining target browsers supported Javascript and provided an error message if
the email field was wrongly formed or left blank. However, the mobile browsers that support Javascript
allowed the user to configure the browser to enable/disable Javascript. Powers (2008) explains that for
those who prefer not to use Javascript, and those who have no choice, it’s important to provide alternatives
when no script is present. One alternative is the noscript element introduced in XHTML-MP 1.2. Content
contained within the opening and closing noscript element will be processed if Javascript is not supported
or disabled. This could be particularly useful to inform a user to enable Javascript. The time series graph
in Figure 5 shows the growing support for Javascript. From 2005 Javascript has been widely implemented
into mobile browsers and in 2008 very few mobile devices did not support the technology.
Mobile devices that can render Javascript
Time
Freq
uenc
y O
f Com
plia
nce
2002 2003 2004 2005 2006 2007 2008 2009
0.0
0.2
0.4
0.6
0.8
Total Devices: 1384
3
6
4
13 22 11
33
37
7441
48
48
113
62 35
87
106
88
7843
78
77
63 56
7642
20
19
Figure 5: JavaScript Support
4 Enhanced Delivery Context
Five of the eight DDC attribute values assessed have been adjusted to form the new EDC specification to
better represent the population of mobile Internet devices. Table 4 compares the original DDC specifica-
tion with the adjusted Enhanced Delivery Context (EDC) specification and the capabilities of devices in
2008.
A mobile application can now be developed for a larger screen, a more stable mark-up language,
additional colour range, Javascript support and the use of an additional image type, PNG, without the
77
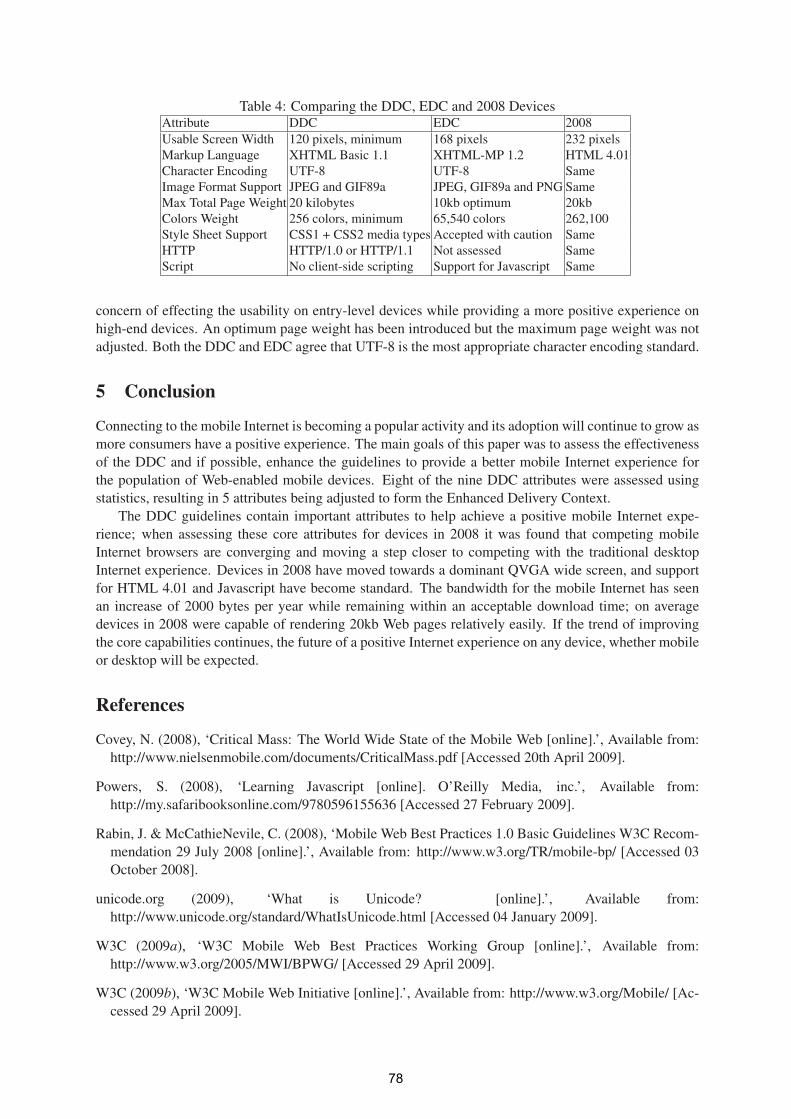
Table 4: Comparing the DDC, EDC and 2008 DevicesAttribute DDC EDC 2008
Usable Screen Width 120 pixels, minimum 168 pixels 232 pixels
Markup Language XHTML Basic 1.1 XHTML-MP 1.2 HTML 4.01
Character Encoding UTF-8 UTF-8 Same
Image Format Support JPEG and GIF89a JPEG, GIF89a and PNG Same
Max Total Page Weight 20 kilobytes 10kb optimum 20kb
Colors Weight 256 colors, minimum 65,540 colors 262,100
Style Sheet Support CSS1 + CSS2 media types Accepted with caution Same
HTTP HTTP/1.0 or HTTP/1.1 Not assessed Same
Script No client-side scripting Support for Javascript Same
concern of effecting the usability on entry-level devices while providing a more positive experience on
high-end devices. An optimum page weight has been introduced but the maximum page weight was not
adjusted. Both the DDC and EDC agree that UTF-8 is the most appropriate character encoding standard.
5 Conclusion
Connecting to the mobile Internet is becoming a popular activity and its adoption will continue to grow as
more consumers have a positive experience. The main goals of this paper was to assess the effectiveness
of the DDC and if possible, enhance the guidelines to provide a better mobile Internet experience for
the population of Web-enabled mobile devices. Eight of the nine DDC attributes were assessed using
statistics, resulting in 5 attributes being adjusted to form the Enhanced Delivery Context.
The DDC guidelines contain important attributes to help achieve a positive mobile Internet expe-
rience; when assessing these core attributes for devices in 2008 it was found that competing mobile
Internet browsers are converging and moving a step closer to competing with the traditional desktop
Internet experience. Devices in 2008 have moved towards a dominant QVGA wide screen, and support
for HTML 4.01 and Javascript have become standard. The bandwidth for the mobile Internet has seen
an increase of 2000 bytes per year while remaining within an acceptable download time; on average
devices in 2008 were capable of rendering 20kb Web pages relatively easily. If the trend of improving
the core capabilities continues, the future of a positive Internet experience on any device, whether mobile
or desktop will be expected.
References
Covey, N. (2008), ‘Critical Mass: The World Wide State of the Mobile Web [online].’, Available from:
http://www.nielsenmobile.com/documents/CriticalMass.pdf [Accessed 20th April 2009].
Powers, S. (2008), ‘Learning Javascript [online]. O’Reilly Media, inc.’, Available from:
http://my.safaribooksonline.com/9780596155636 [Accessed 27 February 2009].
Rabin, J. & McCathieNevile, C. (2008), ‘Mobile Web Best Practices 1.0 Basic Guidelines W3C Recom-
mendation 29 July 2008 [online].’, Available from: http://www.w3.org/TR/mobile-bp/ [Accessed 03
October 2008].
unicode.org (2009), ‘What is Unicode? [online].’, Available from:
http://www.unicode.org/standard/WhatIsUnicode.html [Accessed 04 January 2009].
W3C (2009a), ‘W3C Mobile Web Best Practices Working Group [online].’, Available from:
http://www.w3.org/2005/MWI/BPWG/ [Accessed 29 April 2009].
W3C (2009b), ‘W3C Mobile Web Initiative [online].’, Available from: http://www.w3.org/Mobile/ [Ac-
cessed 29 April 2009].
78
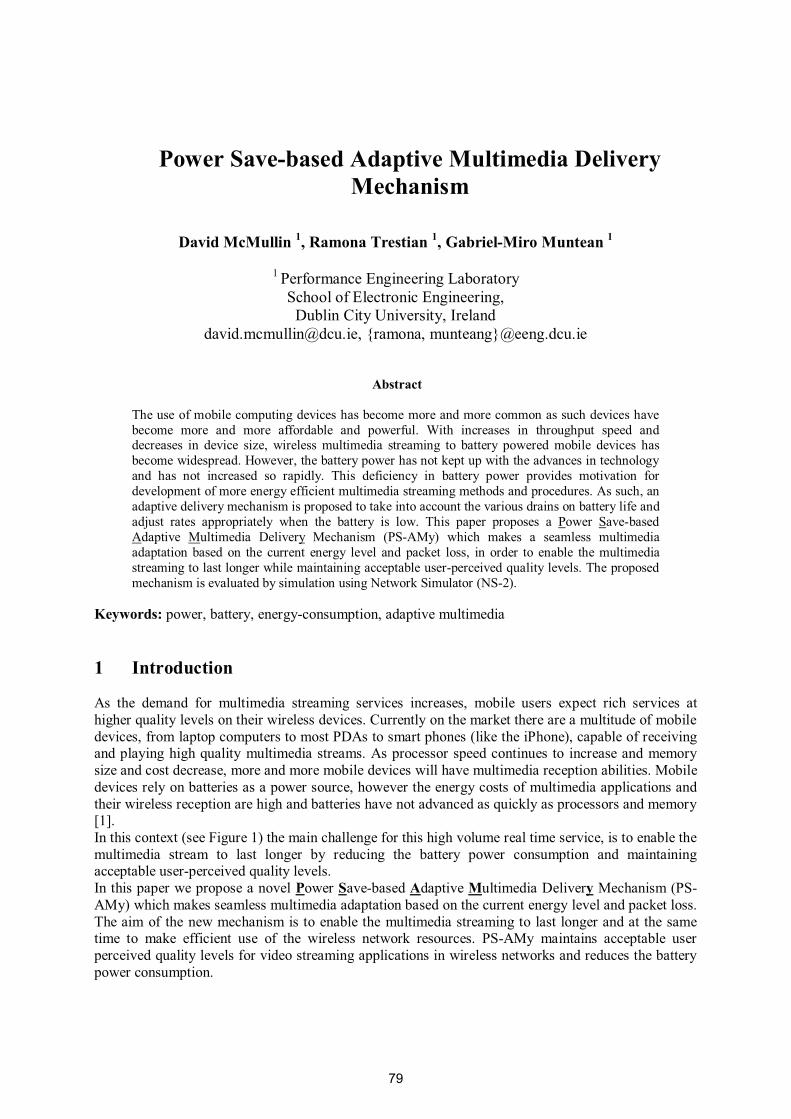
Power Save-based Adaptive Multimedia Delivery Mechanism
David McMullin 1, Ramona Trestian 1, Gabriel-Miro Muntean 1
1 Performance Engineering Laboratory
School of Electronic Engineering, Dublin City University, Ireland
[email protected], {ramona, munteang}@eeng.dcu.ie
Abstract
The use of mobile computing devices has become more and more common as such devices have become more and more affordable and powerful. With increases in throughput speed and decreases in device size, wireless multimedia streaming to battery powered mobile devices has become widespread. However, the battery power has not kept up with the advances in technology and has not increased so rapidly. This deficiency in battery power provides motivation for development of more energy efficient multimedia streaming methods and procedures. As such, an adaptive delivery mechanism is proposed to take into account the various drains on battery life and adjust rates appropriately when the battery is low. This paper proposes a Power Save-based Adaptive Multimedia Delivery Mechanism (PS-AMy) which makes a seamless multimedia adaptation based on the current energy level and packet loss, in order to enable the multimedia streaming to last longer while maintaining acceptable user-perceived quality levels. The proposed mechanism is evaluated by simulation using Network Simulator (NS-2).
Keywords: power, battery, energy-consumption, adaptive multimedia 1 Introduction As the demand for multimedia streaming services increases, mobile users expect rich services at higher quality levels on their wireless devices. Currently on the market there are a multitude of mobile devices, from laptop computers to most PDAs to smart phones (like the iPhone), capable of receiving and playing high quality multimedia streams. As processor speed continues to increase and memory size and cost decrease, more and more mobile devices will have multimedia reception abilities. Mobile devices rely on batteries as a power source, however the energy costs of multimedia applications and their wireless reception are high and batteries have not advanced as quickly as processors and memory [1]. In this context (see Figure 1) the main challenge for this high volume real time service, is to enable the multimedia stream to last longer by reducing the battery power consumption and maintaining acceptable user-perceived quality levels. In this paper we propose a novel Power Save-based Adaptive Multimedia Delivery Mechanism (PS-AMy) which makes seamless multimedia adaptation based on the current energy level and packet loss. The aim of the new mechanism is to enable the multimedia streaming to last longer and at the same time to make efficient use of the wireless network resources. PS-AMy maintains acceptable user perceived quality levels for video streaming applications in wireless networks and reduces the battery power consumption.
79
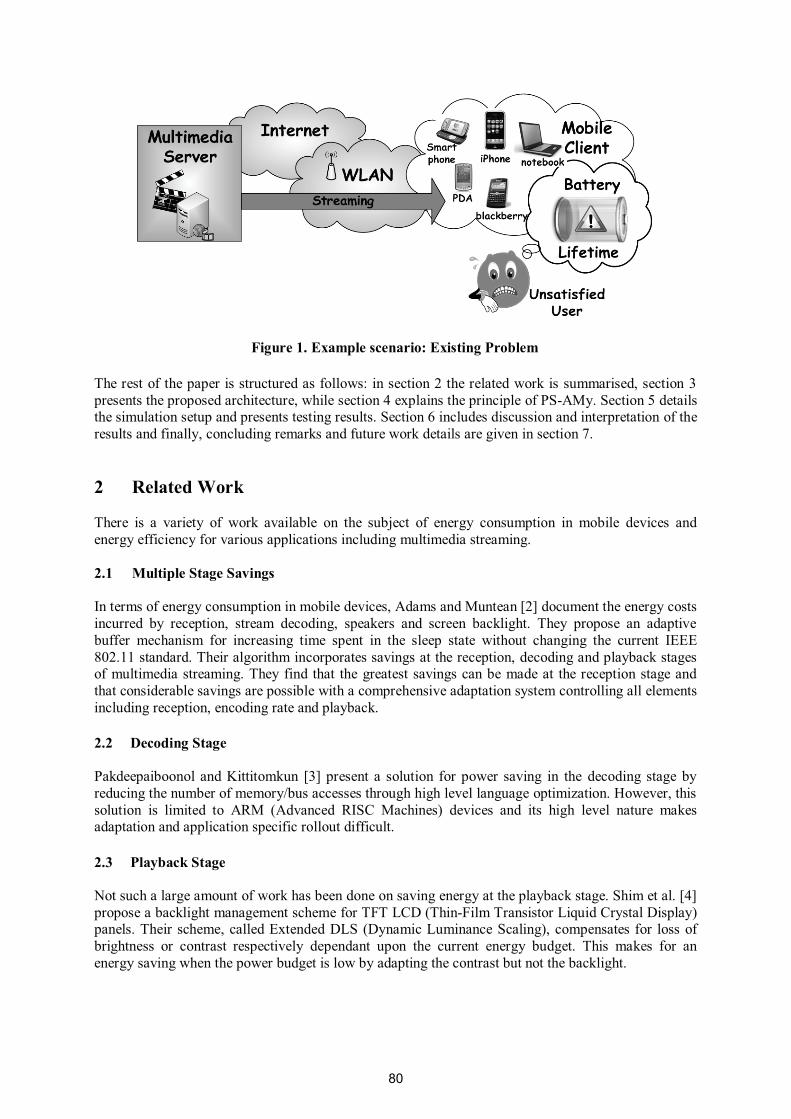
The rest of the paper is structured as follows: in section 2 the related work is summarised, section 3 presents the proposed architecture, while section 4 explains the principle of PS-AMy. Section 5 details the simulation setup and presents testing results. Section 6 includes discussion and interpretation of the results and finally, concluding remarks and future work details are given in section 7. 2 Related Work There is a variety of work available on the subject of energy consumption in mobile devices and energy efficiency for various applications including multimedia streaming. 2.1 Multiple Stage Savings In terms of energy consumption in mobile devices, Adams and Muntean [2] document the energy costs incurred by reception, stream decoding, speakers and screen backlight. They propose an adaptive buffer mechanism for increasing time spent in the sleep state without changing the current IEEE 802.11 standard. Their algorithm incorporates savings at the reception, decoding and playback stages of multimedia streaming. They find that the greatest savings can be made at the reception stage and that considerable savings are possible with a comprehensive adaptation system controlling all elements including reception, encoding rate and playback. 2.2 Decoding Stage Pakdeepaiboonol and Kittitomkun [3] present a solution for power saving in the decoding stage by reducing the number of memory/bus accesses through high level language optimization. However, this solution is limited to ARM (Advanced RISC Machines) devices and its high level nature makes adaptation and application specific rollout difficult. 2.3 Playback Stage Not such a large amount of work has been done on saving energy at the playback stage. Shim et al. [4] propose a backlight management scheme for TFT LCD (Thin-Film Transistor Liquid Crystal Display) panels. Their scheme, called Extended DLS (Dynamic Luminance Scaling), compensates for loss of brightness or contrast respectively dependant upon the current energy budget. This makes for an energy saving when the power budget is low by adapting the contrast but not the backlight.
Figure 1. Example scenario: Existing Problem
80
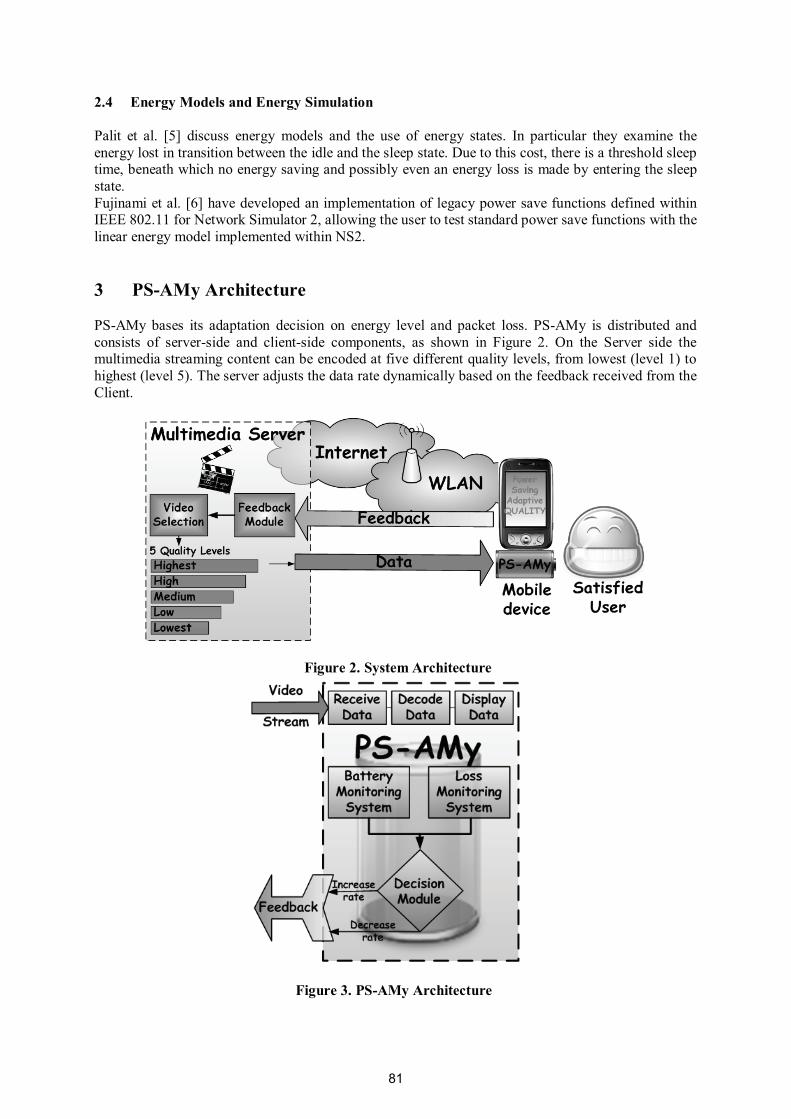
2.4 Energy Models and Energy Simulation Palit et al. [5] discuss energy models and the use of energy states. In particular they examine the energy lost in transition between the idle and the sleep state. Due to this cost, there is a threshold sleep time, beneath which no energy saving and possibly even an energy loss is made by entering the sleep state. Fujinami et al. [6] have developed an implementation of legacy power save functions defined within IEEE 802.11 for Network Simulator 2, allowing the user to test standard power save functions with the linear energy model implemented within NS2. 3 PS-AMy Architecture PS-AMy bases its adaptation decision on energy level and packet loss. PS-AMy is distributed and consists of server-side and client-side components, as shown in Figure 2. On the Server side the multimedia streaming content can be encoded at five different quality levels, from lowest (level 1) to highest (level 5). The server adjusts the data rate dynamically based on the feedback received from the Client.
Figure 3. PS-AMy Architecture
Figure 2. System Architecture
81
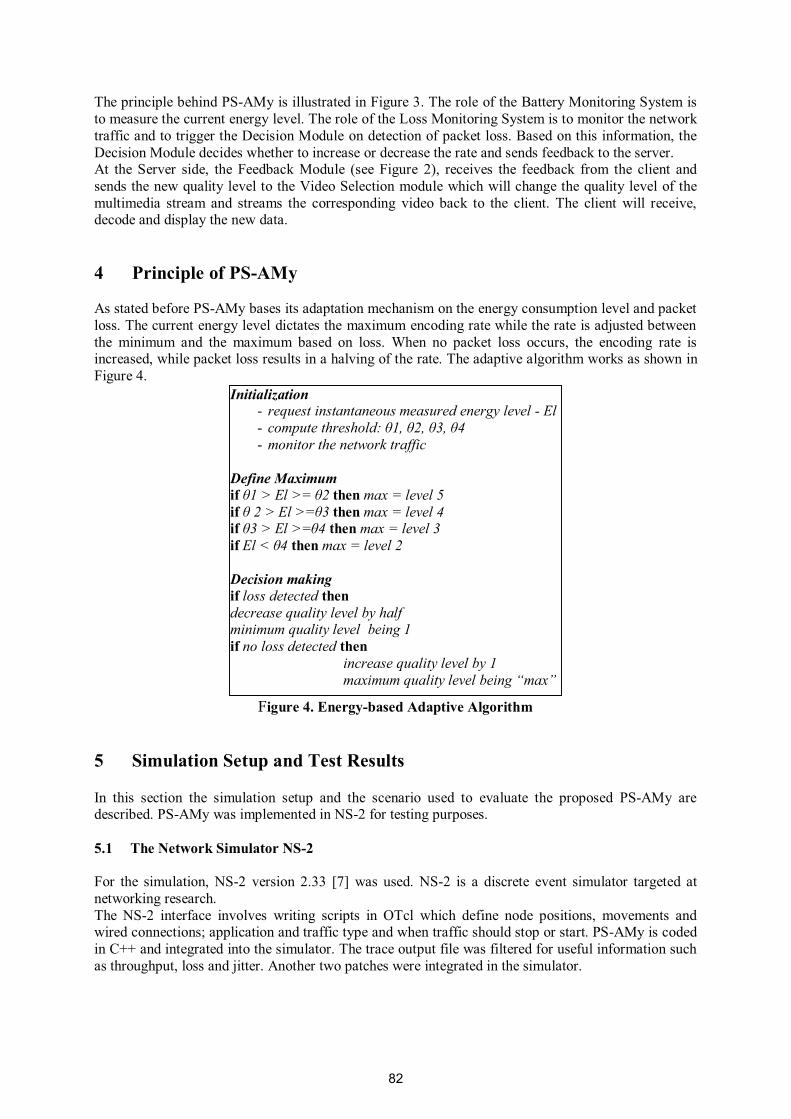
The principle behind PS-AMy is illustrated in Figure 3. The role of the Battery Monitoring System is to measure the current energy level. The role of the Loss Monitoring System is to monitor the network traffic and to trigger the Decision Module on detection of packet loss. Based on this information, the Decision Module decides whether to increase or decrease the rate and sends feedback to the server. At the Server side, the Feedback Module (see Figure 2), receives the feedback from the client and sends the new quality level to the Video Selection module which will change the quality level of the multimedia stream and streams the corresponding video back to the client. The client will receive, decode and display the new data. 4 Principle of PS-AMy As stated before PS-AMy bases its adaptation mechanism on the energy consumption level and packet loss. The current energy level dictates the maximum encoding rate while the rate is adjusted between the minimum and the maximum based on loss. When no packet loss occurs, the encoding rate is increased, while packet loss results in a halving of the rate. The adaptive algorithm works as shown in Figure 4.
Figure 4. Energy-based Adaptive Algorithm
5 Simulation Setup and Test Results In this section the simulation setup and the scenario used to evaluate the proposed PS-AMy are described. PS-AMy was implemented in NS-2 for testing purposes. 5.1 The Network Simulator NS-2 For the simulation, NS-2 version 2.33 [7] was used. NS-2 is a discrete event simulator targeted at networking research. The NS-2 interface involves writing scripts in OTcl which define node positions, movements and wired connections; application and traffic type and when traffic should stop or start. PS-AMy is coded in C++ and integrated into the simulator. The trace output file was filtered for useful information such as throughput, loss and jitter. Another two patches were integrated in the simulator.
Initialization - request instantaneous measured energy level - El - compute threshold: θ1, θ2, θ3, θ4 - monitor the network traffic
Define Maximum if θ1 > El >= θ2 then max = level 5 if θ 2 > El >=θ3 then max = level 4 if θ3 > El >=θ4 then max = level 3 if El < θ4 then max = level 2 Decision making if loss detected then decrease quality level by half minimum quality level being 1 if no loss detected then
increase quality level by 1 maximum quality level being “max”
82
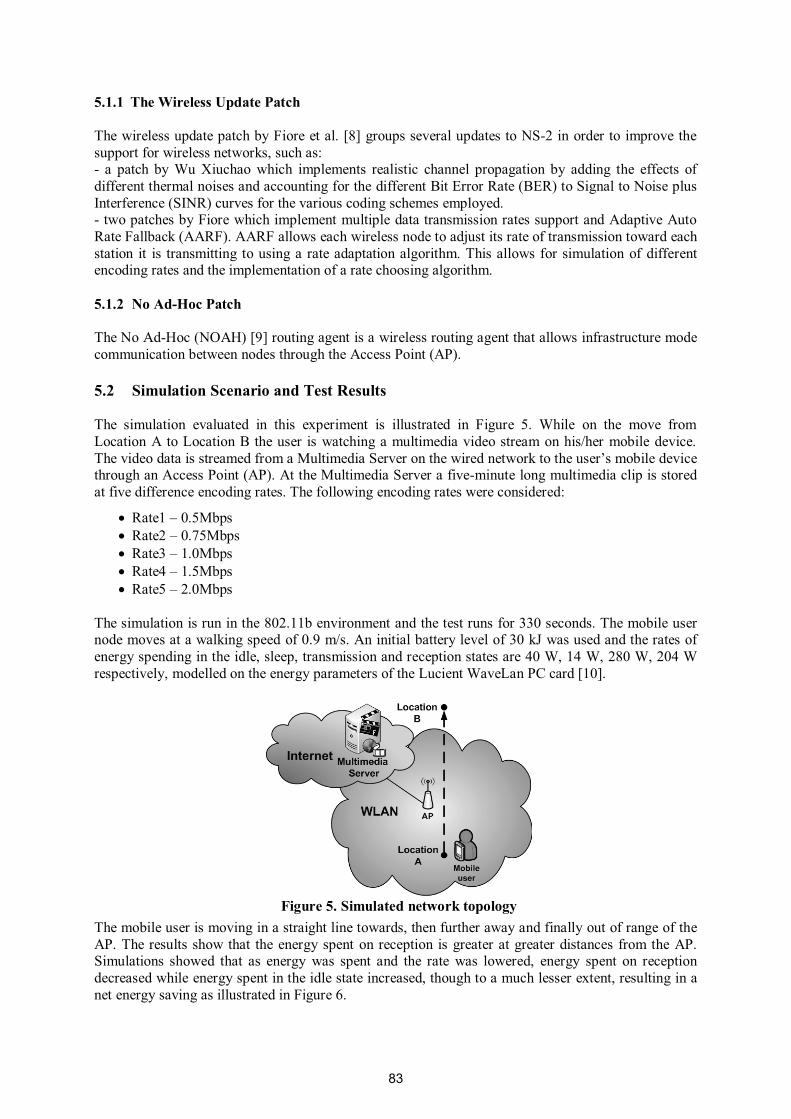
5.1.1 The Wireless Update Patch The wireless update patch by Fiore et al. [8] groups several updates to NS-2 in order to improve the support for wireless networks, such as: - a patch by Wu Xiuchao which implements realistic channel propagation by adding the effects of different thermal noises and accounting for the different Bit Error Rate (BER) to Signal to Noise plus Interference (SINR) curves for the various coding schemes employed. - two patches by Fiore which implement multiple data transmission rates support and Adaptive Auto Rate Fallback (AARF). AARF allows each wireless node to adjust its rate of transmission toward each station it is transmitting to using a rate adaptation algorithm. This allows for simulation of different encoding rates and the implementation of a rate choosing algorithm. 5.1.2 No Ad-Hoc Patch The No Ad-Hoc (NOAH) [9] routing agent is a wireless routing agent that allows infrastructure mode communication between nodes through the Access Point (AP). 5.2 Simulation Scenario and Test Results The simulation evaluated in this experiment is illustrated in Figure 5. While on the move from Location A to Location B the user is watching a multimedia video stream on his/her mobile device. The video data is streamed from a Multimedia Server on the wired network to the user’s mobile device through an Access Point (AP). At the Multimedia Server a five-minute long multimedia clip is stored at five difference encoding rates. The following encoding rates were considered:
• Rate1 – 0.5Mbps • Rate2 – 0.75Mbps • Rate3 – 1.0Mbps • Rate4 – 1.5Mbps • Rate5 – 2.0Mbps
The simulation is run in the 802.11b environment and the test runs for 330 seconds. The mobile user node moves at a walking speed of 0.9 m/s. An initial battery level of 30 kJ was used and the rates of energy spending in the idle, sleep, transmission and reception states are 40 W, 14 W, 280 W, 204 W respectively, modelled on the energy parameters of the Lucient WaveLan PC card [10].
The mobile user is moving in a straight line towards, then further away and finally out of range of the AP. The results show that the energy spent on reception is greater at greater distances from the AP. Simulations showed that as energy was spent and the rate was lowered, energy spent on reception decreased while energy spent in the idle state increased, though to a much lesser extent, resulting in a net energy saving as illustrated in Figure 6.
Figure 5. Simulated network topology
83
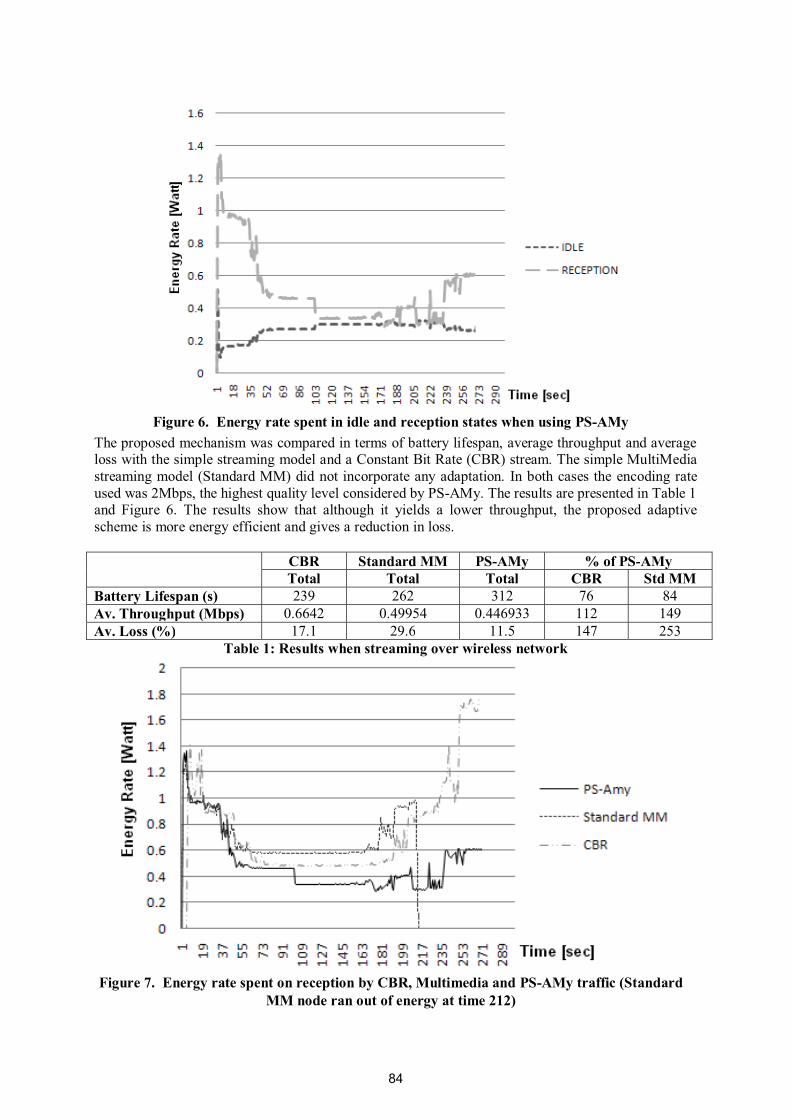
The proposed mechanism was compared in terms of battery lifespan, average throughput and average loss with the simple streaming model and a Constant Bit Rate (CBR) stream. The simple MultiMedia streaming model (Standard MM) did not incorporate any adaptation. In both cases the encoding rate used was 2Mbps, the highest quality level considered by PS-AMy. The results are presented in Table 1 and Figure 6. The results show that although it yields a lower throughput, the proposed adaptive scheme is more energy efficient and gives a reduction in loss. CBR Standard MM PS-AMy % of PS-AMy
Total Total Total CBR Std MM Battery Lifespan (s) 239 262 312 76 84 Av. Throughput (Mbps) 0.6642 0.49954 0.446933 112 149 Av. Loss (%) 17.1 29.6 11.5 147 253
Table 1: Results when streaming over wireless network
Figure 6. Energy rate spent in idle and reception states when using PS-AMy
Figure 7. Energy rate spent on reception by CBR, Multimedia and PS-AMy traffic (Standard
MM node ran out of energy at time 212)
84

6 Discussion and Reflection The results in Figure 7 and Table 1 clearly show there are gains to be made using this system. In particular, the algorithms performance in delivering extra battery life and keeping loss to a minimum should be noted. In Table 1 it can be seen that although PS-AMy delivers a lower throughput, it also suffers from loss considerably less than the other two systems. This can only result in an increase in user perceived quality. However further research should be performed to consider real world situations in order to complement modelling and simulations. Figure 7 clearly shows PS-AMy consistently delivers a significantly lower rate of energy spending. In particular, PS-AMy succeeds in regulating energy consumption even as the node moves further away from the Access Point. In similar conditions the amount of energy needed to support communications increases when both other systems are used. It should be noted that this improvement is mainly due to lowering the encoding and delivery rates, resulting in possible reduction of multimedia quality (depending on device screen size). 7 Conclusions and Future Work In this paper a novel Power Save-based Adaptive Multimedia Delivery Mechanism (PS-AMy) which bases decisions on the energy level and packet loss in order to enable the multimedia streaming to last longer, was proposed. This project concentrated on adapting the encoding rate of multimedia streaming meaning less data to transmit and therefore resulting in lower energy costs incurred by reception and decoding, however there are many other energy costs which could be tied into an adaptive mechanism. Playback settings such as volume, brightness and colour depth could be adjusted to save energy, although care should be taken in this regard that the adjustment is within reasonable bounds and unlikely to disturb the user. As the rate of energy loss in the idle state is generally not hugely less than that spent in reception, a sleep buffer could be introduced, and adjusted when necessary to maximise energy savings. While this project showed promising results within simulations, further testing and work should be done with real world testing of the application. Work in this area is highly relevant today as the energy costs of applications continue to rise while battery life struggles to keep up. As the solution explored in this project is software based, it could be easily deployed and tested, as opposed to a hardware solution. 8 Acknowledgements The support of Science Foundation Ireland which funded the On-line Dublin Computer Science Summer School through the UREKA programme is gratefully acknowledged. Many thanks to Dr. Olga Ormond and the anonymous reviewers for the comments which helped improve the paper. References [1] T. Lan and A. Tewfik, A resource management strategy in wireless multimedia communications-total power saving in mobile terminals with a guaranteed QoS, IEEE Transactions on Multimedia, vol. 5, pp. 267– 81, June 2003. [2] J. Adams and G.-M. Muntean, Power Save Adaptation Algorithm for Multimedia Streaming to Mobile Devices, in Portable Information Devices, 2007. PORTABLE07. IEEE International Conference on, 2007, 1-5. [3] P. Pakdeepaiboonpol and S. Kittitornkun, Energy optimization for mobile MPEG-4 video decoder, pp. 1–6, November 2005.
85

[4] Z. Lu, J. Lach, M. Stan, and K. Skadron, Reducing multimedia decode power using feedback control, Proceedings 21st International Conference on Computer Design, pp. 489 – 96, 2003. [5] R. Palit, K. Naik and A. Singh, Estimating the Energy Cost of Communication on Wireless Devices, in Wireless Days, 2008. WD '08. 1st IFIP, 2008, 1-5. [6] M. Fujinami, Y. Miyamoto and T. Murakami, Wireless LAN Power Management Extension for ns-2, Systems Platforms Research Laboratories, NEC Corporation. [7] The Network Simulator, Version 2.33, 2009 (http://www.isi.edu/nsnam/ns/). [8] M. Fiore, Wireless Update Patch, 2006, (http://www.tlc-networks.polito.it/fiore/). [9] NO Ad-Hoc Routing Agent, (http://icapeople.epfl.ch/widmer/uwb/ns-2/noah/). [10] L. M. Feeney and M. Nilsson, Investigating the energy consumption of a wireless network interface in an ad hoc networking environment, Conference or Workshop Item, 2001.
86
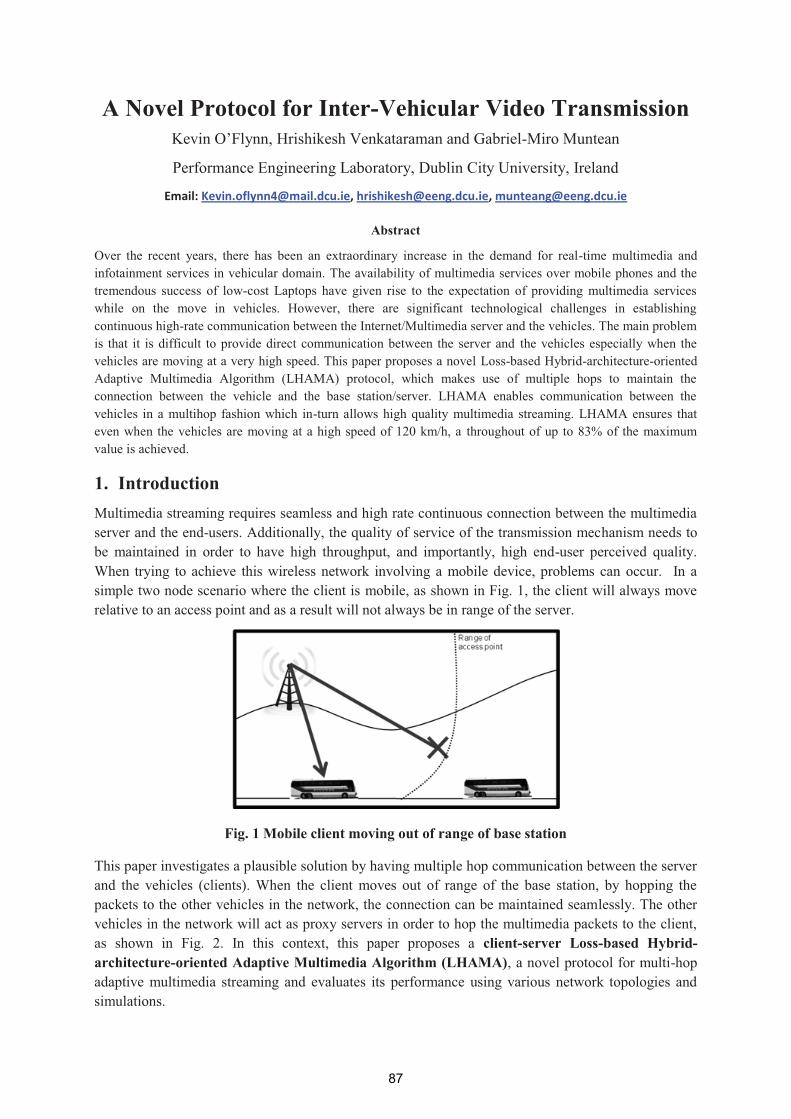
A Novel Protocol for Inter-Vehicular Video Transmission Kevin O’Flynn, Hrishikesh Venkataraman and Gabriel-Miro Muntean
Performance Engineering Laboratory, Dublin City University, Ireland
Email: [email protected], [email protected], [email protected]
Abstract
Over the recent years, there has been an extraordinary increase in the demand for real-time multimedia and infotainment services in vehicular domain. The availability of multimedia services over mobile phones and the tremendous success of low-cost Laptops have given rise to the expectation of providing multimedia services while on the move in vehicles. However, there are significant technological challenges in establishing continuous high-rate communication between the Internet/Multimedia server and the vehicles. The main problem is that it is difficult to provide direct communication between the server and the vehicles especially when the vehicles are moving at a very high speed. This paper proposes a novel Loss-based Hybrid-architecture-oriented Adaptive Multimedia Algorithm (LHAMA) protocol, which makes use of multiple hops to maintain the connection between the vehicle and the base station/server. LHAMA enables communication between the vehicles in a multihop fashion which in-turn allows high quality multimedia streaming. LHAMA ensures that even when the vehicles are moving at a high speed of 120 km/h, a throughout of up to 83% of the maximum value is achieved.
1. Introduction Multimedia streaming requires seamless and high rate continuous connection between the multimedia server and the end-users. Additionally, the quality of service of the transmission mechanism needs to be maintained in order to have high throughput, and importantly, high end-user perceived quality. When trying to achieve this wireless network involving a mobile device, problems can occur. In a simple two node scenario where the client is mobile, as shown in Fig. 1, the client will always move relative to an access point and as a result will not always be in range of the server.
Fig. 1 Mobile client moving out of range of base station
This paper investigates a plausible solution by having multiple hop communication between the server and the vehicles (clients). When the client moves out of range of the base station, by hopping the packets to the other vehicles in the network, the connection can be maintained seamlessly. The other vehicles in the network will act as proxy servers in order to hop the multimedia packets to the client, as shown in Fig. 2. In this context, this paper proposes a client-server Loss-based Hybrid-architecture-oriented Adaptive Multimedia Algorithm (LHAMA), a novel protocol for multi-hop adaptive multimedia streaming and evaluates its performance using various network topologies and simulations.
87
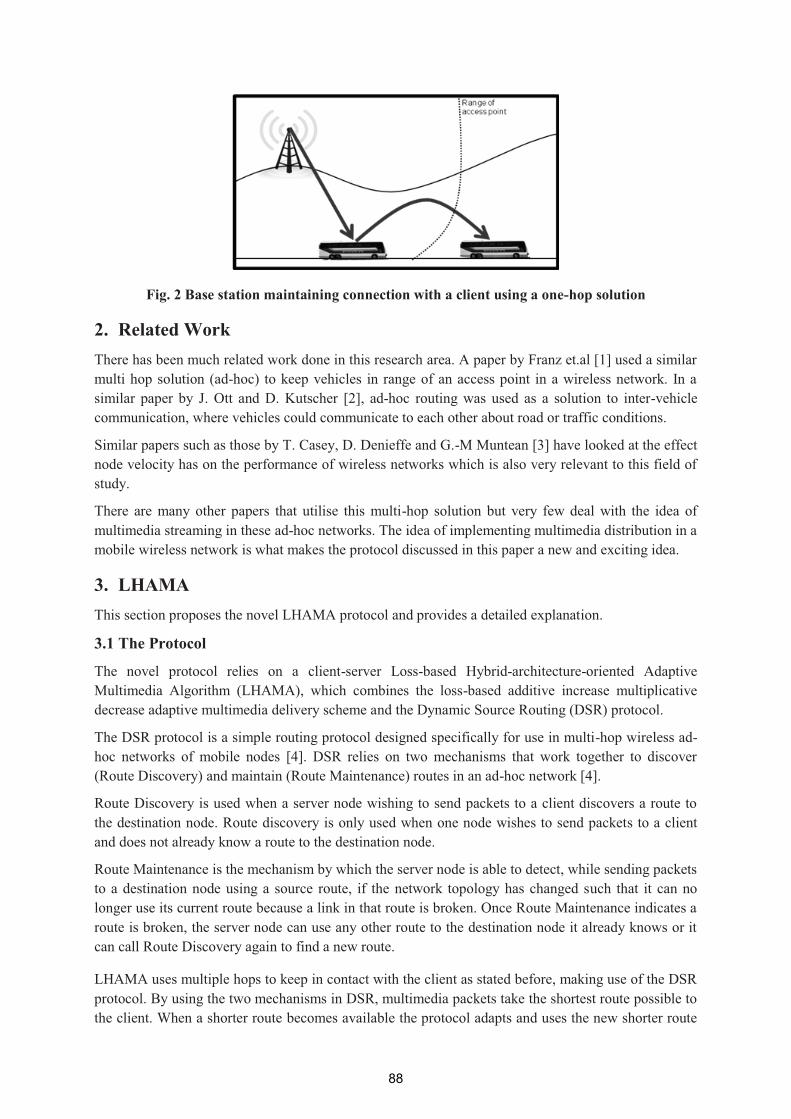
Fig. 2 Base station maintaining connection with a client using a one-hop solution
2. Related Work There has been much related work done in this research area. A paper by Franz et.al [1] used a similar multi hop solution (ad-hoc) to keep vehicles in range of an access point in a wireless network. In a similar paper by J. Ott and D. Kutscher [2], ad-hoc routing was used as a solution to inter-vehicle communication, where vehicles could communicate to each other about road or traffic conditions.
Similar papers such as those by T. Casey, D. Denieffe and G.-M Muntean [3] have looked at the effect node velocity has on the performance of wireless networks which is also very relevant to this field of study.
There are many other papers that utilise this multi-hop solution but very few deal with the idea of multimedia streaming in these ad-hoc networks. The idea of implementing multimedia distribution in a mobile wireless network is what makes the protocol discussed in this paper a new and exciting idea.
3. LHAMA This section proposes the novel LHAMA protocol and provides a detailed explanation.
3.1 The Protocol
The novel protocol relies on a client-server Loss-based Hybrid-architecture-oriented Adaptive Multimedia Algorithm (LHAMA), which combines the loss-based additive increase multiplicative decrease adaptive multimedia delivery scheme and the Dynamic Source Routing (DSR) protocol.
The DSR protocol is a simple routing protocol designed specifically for use in multi-hop wireless ad-hoc networks of mobile nodes [4]. DSR relies on two mechanisms that work together to discover (Route Discovery) and maintain (Route Maintenance) routes in an ad-hoc network [4].
Route Discovery is used when a server node wishing to send packets to a client discovers a route to the destination node. Route discovery is only used when one node wishes to send packets to a client and does not already know a route to the destination node.
Route Maintenance is the mechanism by which the server node is able to detect, while sending packets to a destination node using a source route, if the network topology has changed such that it can no longer use its current route because a link in that route is broken. Once Route Maintenance indicates a route is broken, the server node can use any other route to the destination node it already knows or it can call Route Discovery again to find a new route.
LHAMA uses multiple hops to keep in contact with the client as stated before, making use of the DSR protocol. By using the two mechanisms in DSR, multimedia packets take the shortest route possible to the client. When a shorter route becomes available the protocol adapts and uses the new shorter route
88
to the client. Also, as soon as a route is broken, for example when a node moves out of range, the protocol adapts to find a new route.
The applications that deploy LHAMA are loss based adaptive server and client multimedia applications: sMmApp and cMmApp. These applications use an adaptive five rate media scaling method [5]; the higher the scale value - the higher multimedia bitrate. When the server and client establish a connection, the server starts with the lowest transmission rate (and scale level) and changes it during the session according to what the client notifies. The client is responsible for monitoring network delivery conditions and determining the scale factor. For congestion control a simple periodical packet loss monitoring is used. If congestion is detected the client reduces the scale to half and notifies the server. If no packet loss is detected the client increases the scale level by one and notifies the server. The server performs the client-requested changes in the scale value and consequently in the multimedia transmission rate.
3.2 Development
The main work done in the development of the protocol was in the creation of the client-server loss-based adaptive multimedia algorithm, which involves a server application deployed on the base station and a client application, located at the mobile client (vehicle).
The adaptive multimedia applications rely on a modified UDP agent which was enhanced with additional features in order to support multimedia delivery. These new features included:
� Enabling multimedia packet reception and delivery. � Segmentation and reassembly of data packets � Enabling prioritisation for multimedia delivery
The client-server application and the underlying agent were developed and a model was created in order to enable performance evaluation.
4. Testing and Performance Analysis This section presents how the performance of the proposed LHAMA protocol was evaluated. An NS-2 model was built for LHAMA and deployed in four scenarios as indicated below. LHAMA’s performance was tested by looking at the effect hop count; range and mobility have on multimedia delivery aspects such as throughput and packet loss.
Network Simulator version 2 (NS-2) is a discrete event simulator targeted at networking research [6]. NS was built in C++ and provides a simulation interface through OTcl, an object oriented dialect of Tcl. The user describes a network by writing OTcl scripts and NS simulates the topology with specified parameters.
The outputs of these simulations were used to look at the performance of the novel protocol. By tracing the output of the simulations the topology could be animated using network animator (nam) to give a visual representation of the network.
By using awk scripts to analyse the trace files the results of the simulations could be plotted using xgraph. Alternatively, the results could be written to a Microsoft Excel file and plotted from there.
4.1 Scenarios
Scenario A simulates a three-hop scenario to keep the client in range after it has passed the access point.
89
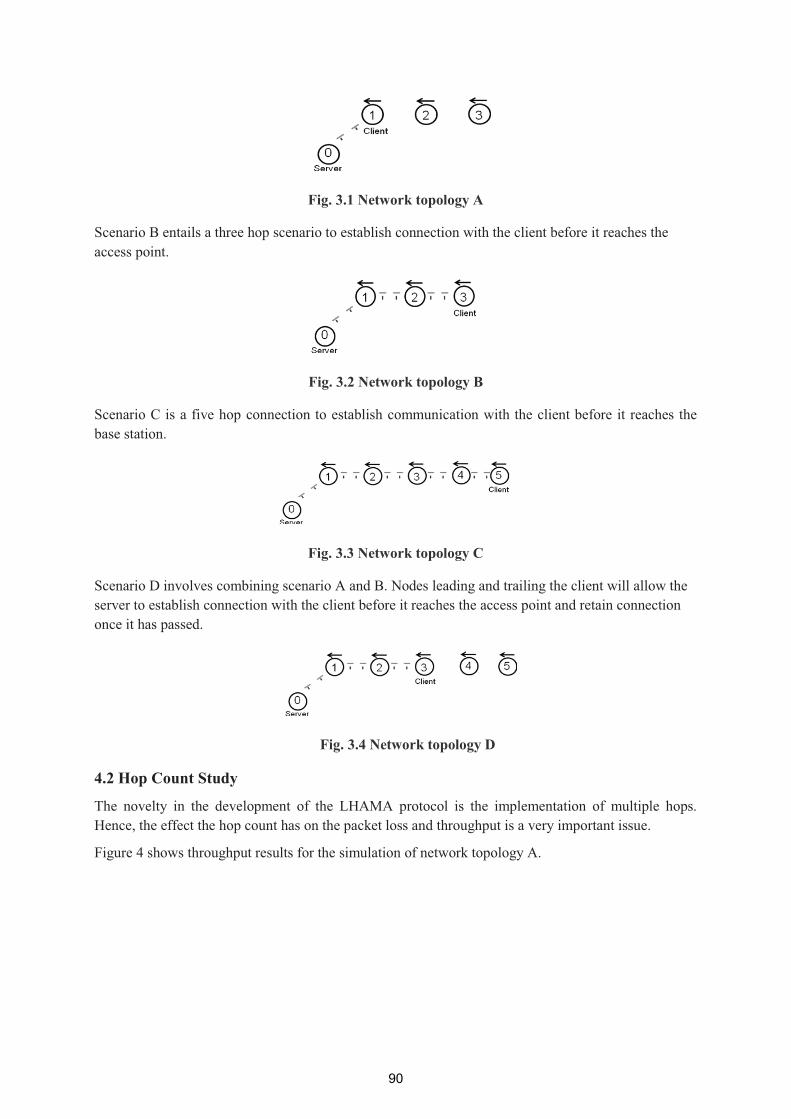
Fig. 3.1 Network topology A
Scenario B entails a three hop scenario to establish connection with the client before it reaches the access point.
Fig. 3.2 Network topology B
Scenario C is a five hop connection to establish communication with the client before it reaches the base station.
Fig. 3.3 Network topology C
Scenario D involves combining scenario A and B. Nodes leading and trailing the client will allow the server to establish connection with the client before it reaches the access point and retain connection once it has passed.
Fig. 3.4 Network topology D
4.2 Hop Count Study
The novelty in the development of the LHAMA protocol is the implementation of multiple hops. Hence, the effect the hop count has on the packet loss and throughput is a very important issue.
Figure 4 shows throughput results for the simulation of network topology A.
90
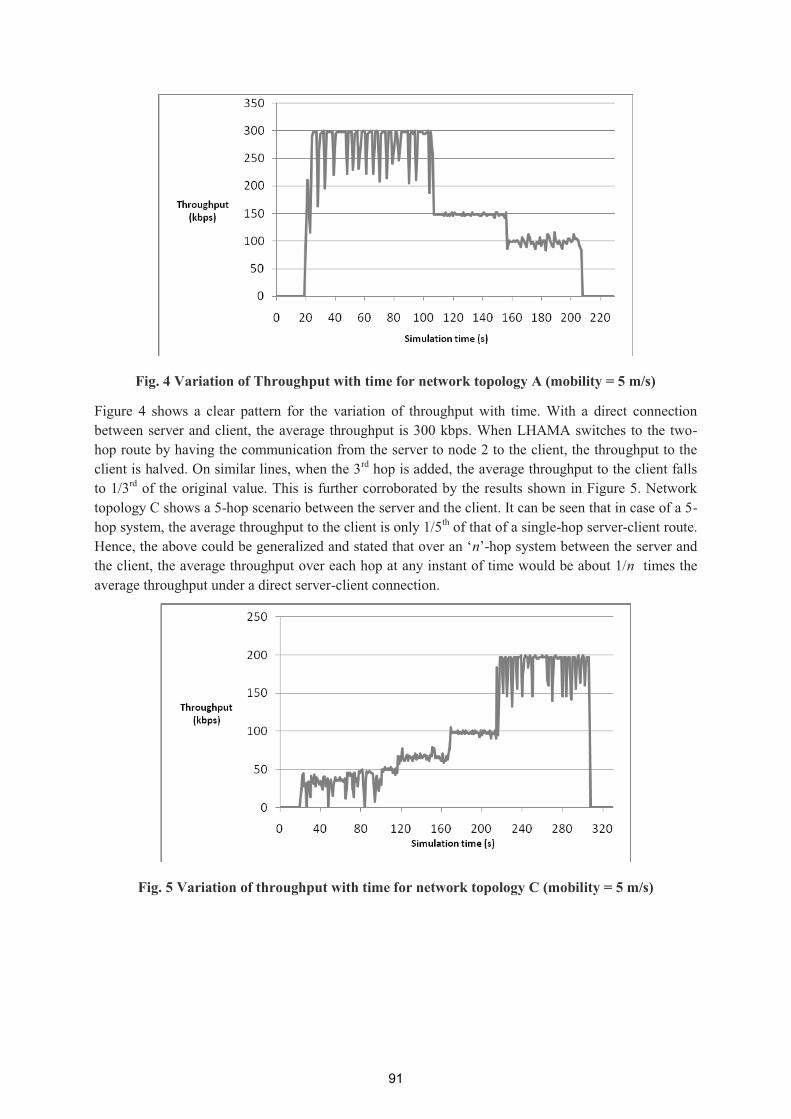
Fig. 4 Variation of Throughput with time for network topology A (mobility = 5 m/s)
Figure 4 shows a clear pattern for the variation of throughput with time. With a direct connection between server and client, the average throughput is 300 kbps. When LHAMA switches to the two-hop route by having the communication from the server to node 2 to the client, the throughput to the client is halved. On similar lines, when the 3rd hop is added, the average throughput to the client falls to 1/3rd of the original value. This is further corroborated by the results shown in Figure 5. Network topology C shows a 5-hop scenario between the server and the client. It can be seen that in case of a 5-hop system, the average throughput to the client is only 1/5th of that of a single-hop server-client route. Hence, the above could be generalized and stated that over an ‘n’-hop system between the server and the client, the average throughput over each hop at any instant of time would be about 1/n times the average throughput under a direct server-client connection.
Fig. 5 Variation of throughput with time for network topology C (mobility = 5 m/s)
91
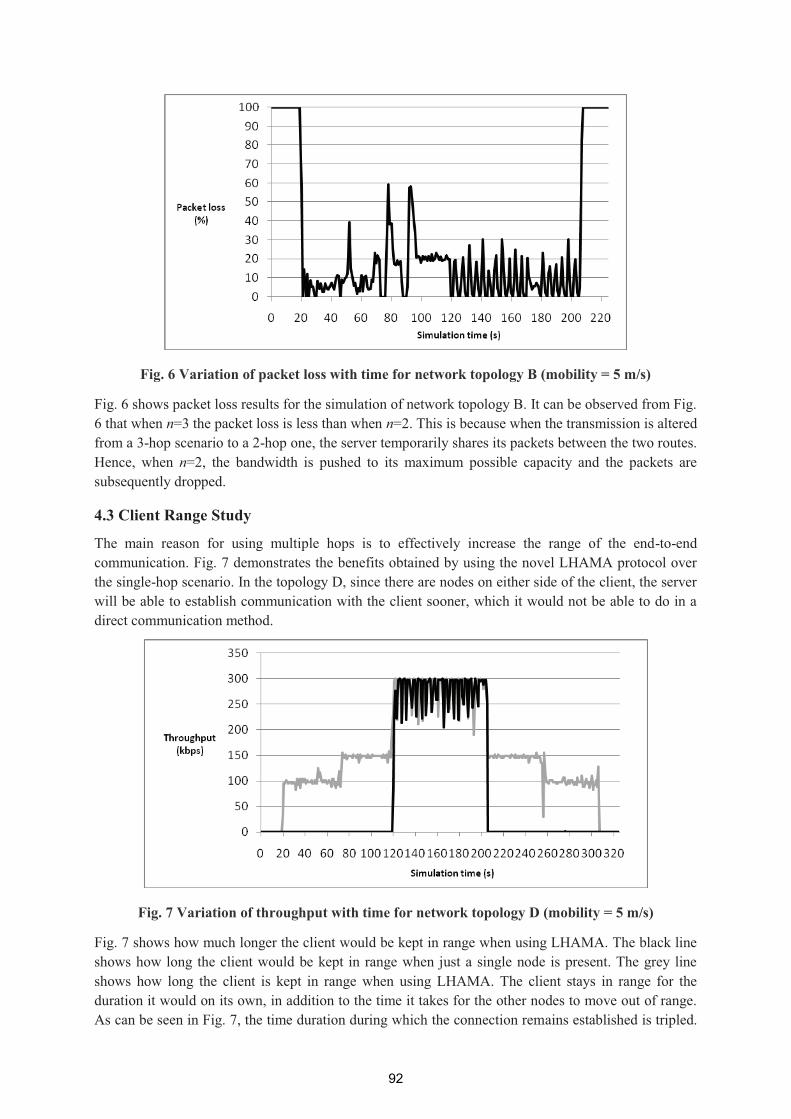
Fig. 6 Variation of packet loss with time for network topology B (mobility = 5 m/s)
Fig. 6 shows packet loss results for the simulation of network topology B. It can be observed from Fig. 6 that when n=3 the packet loss is less than when n=2. This is because when the transmission is altered from a 3-hop scenario to a 2-hop one, the server temporarily shares its packets between the two routes. Hence, when n=2, the bandwidth is pushed to its maximum possible capacity and the packets are subsequently dropped.
4.3 Client Range Study
The main reason for using multiple hops is to effectively increase the range of the end-to-end communication. Fig. 7 demonstrates the benefits obtained by using the novel LHAMA protocol over the single-hop scenario. In the topology D, since there are nodes on either side of the client, the server will be able to establish communication with the client sooner, which it would not be able to do in a direct communication method.
Fig. 7 Variation of throughput with time for network topology D (mobility = 5 m/s)
Fig. 7 shows how much longer the client would be kept in range when using LHAMA. The black line shows how long the client would be kept in range when just a single node is present. The grey line shows how long the client is kept in range when using LHAMA. The client stays in range for the duration it would on its own, in addition to the time it takes for the other nodes to move out of range. As can be seen in Fig. 7, the time duration during which the connection remains established is tripled.
92
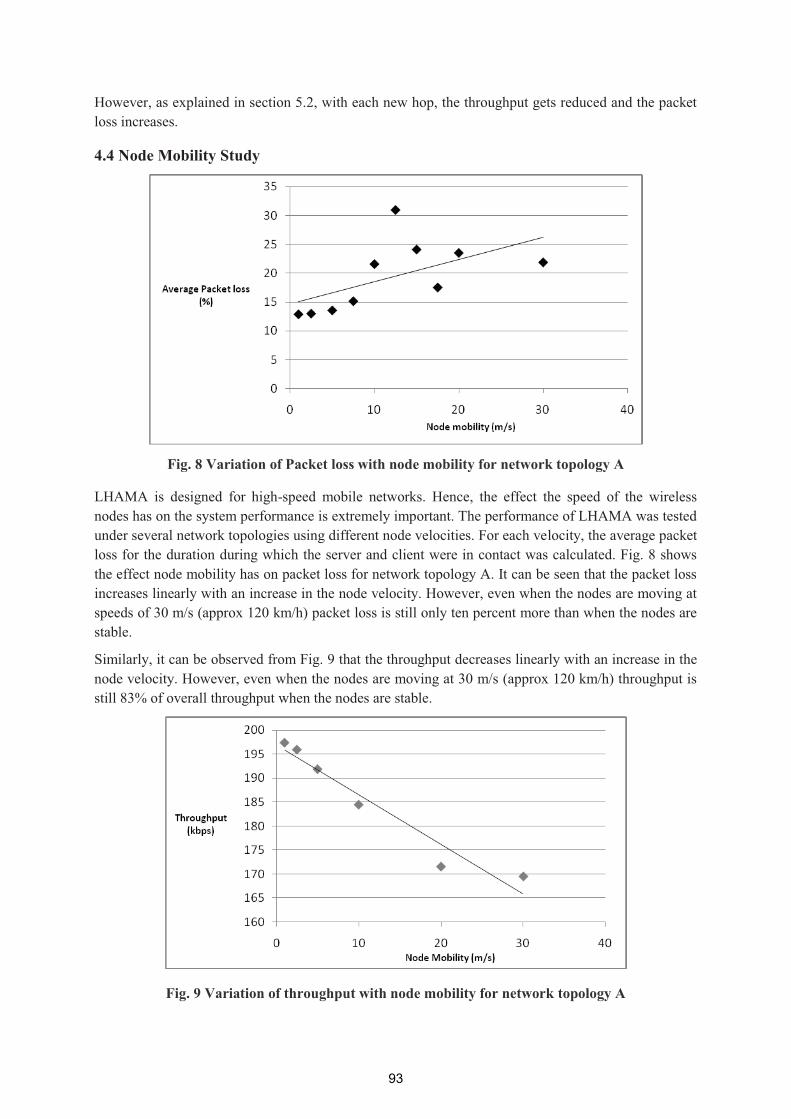
However, as explained in section 5.2, with each new hop, the throughput gets reduced and the packet loss increases.
4.4 Node Mobility Study
Fig. 8 Variation of Packet loss with node mobility for network topology A
LHAMA is designed for high-speed mobile networks. Hence, the effect the speed of the wireless nodes has on the system performance is extremely important. The performance of LHAMA was tested under several network topologies using different node velocities. For each velocity, the average packet loss for the duration during which the server and client were in contact was calculated. Fig. 8 shows the effect node mobility has on packet loss for network topology A. It can be seen that the packet loss increases linearly with an increase in the node velocity. However, even when the nodes are moving at speeds of 30 m/s (approx 120 km/h) packet loss is still only ten percent more than when the nodes are stable.
Similarly, it can be observed from Fig. 9 that the throughput decreases linearly with an increase in the node velocity. However, even when the nodes are moving at 30 m/s (approx 120 km/h) throughput is still 83% of overall throughput when the nodes are stable.
Fig. 9 Variation of throughput with node mobility for network topology A
93
5 Conclusions and Future Work This paper proposes a novel unicasting protocol, LHAMA – Loss-based Hybrid Architecture Multimedia Algorithm. The main benefit of LHAMA is that it ensures the connectivity between different nodes (vehicles) and with the Internet/server even when the vehicles are on the move. Hence, the wireless devices in the vehicles can communicate with each other and importantly, can watch streaming multimedia while on the move.
As shown earlier, LHAMA’s performance holds up extremely well under an increase in node velocity. Even under node velocity of 30 m/s throughput is maintained at 83% of its capacity under a node velocity of 0 m/s. Similarly, packet loss is only increased by 10% when node velocity is increased to 30 m/s as compared with stable nodes (0 m/s).
The only drawback at this stage is that the throughput of LHAMA degrades significantly with an increase in the number of multiple hops. Notably, for an ‘n’-hop system, the achievable throughput is only 1/n times as compared to a single-hop direct transmission between the server and the client.
LHAMA still needs considerable work before it could be applied in the real-world for multimedia streaming. Hence, the next task is to introduce spatial reuse of resources in the design of LHAMA that would increase the throughput of the network, using the same given resource. It is expected that with the exponentially decreasing power delay profile, the spatial reuse would not introduce significant interference while at the same time, increasing the network throughput. Further, in order to test its feasibility, the LHAMA protocol would be tested in a real-world environment by implementing it over a Motorola WAP 400 access point used in WiMAX [7].
ACKNOWLEDGMENTS
The authors would like to thank the support of Irish Research Council for Science Engineering and Technology (IRCSET) and Science Foundation Ireland-funded Online Dublin Computer Science Summer School (ODCSSS) programme.
REFERENCES
[1] W.J. Franz, H. Hartenstein, B. Bochow, “FleetNet-Internet on the Road via Inter-Vehicle Communications”, Project funded by German Ministry of Education and Research (BMBF), Contract Number – 01AK025; Technical report, TU-Hamburg Harburg, Germany, 2001.
[2] J. Ott and D. Kutscher. "Drive-thru Internet: IEEE 802.11 for Automobile Users , In Proc. of the 23rd IEEE International conference on INFOCOM, March 7-11, Hong Kong, 2004.
[3] T. Casey, D. Denieffe, G.-M. Muntean, “Influence of Mobile User Velocity on Data Transfer in a Multi-Network Wireless Environment”, 9th IEEE/IFIP International Conference on Mobile Wireless Communication Networks, pp. 126-130, 19-21 September, Cork, Ireland, 2007.
[4] D.B. Johnson, D.A. Maltz, J. Broch, “DSR: The Dynamic Source Routing Protocol for Multi-Hop Wireless Ad Hoc Networks”, http://www.monarch.cs.rice.edu/monarch-papers/dsr-chapter00.pdf - Last accessed on 20th August 2009.
[5] J. Chung, M. Claypool, “NS by example: Add New Application and Agent”, http://nile.wpi.edu/NS/- Last accessed on 20th August 2009
[6] “The Network Simulator: NS-2”, http://www.isi.edu/nsnam/ns/ - Last accessed on 20th August 2009
[7] “WAP 400 Series Access Point for WiMAX”, http://www.motorola.com/Business/US-EN/Product+Lines/MOTOwi4/WAP+400_US-EN – Last accessed on 28th August 2009.
94

Session 4
Green IT
95

�
96
Desktop Virtualisation Scaling Experiments with VirtualBox
John Griffin 1, Paul Doyle 2
1 School of Computing, Dublin Institute of Technology, Ireland
2 School of Computing, Dublin Institute of Technology, Ireland [email protected]
Abstract
With recent advances in virtualization and a growing concern regarding the administration and cooling costs associated with managing legacy servers, organisations are moving towards server and desktop virtualisation. Virtualisation provides the ability to provision a servers resources efficiently thus increasing hardware utilisation and reducing costs. While server virtualization provides clear advantages with regard to system management, higher system availability and lower recovery times, desktop virtualization is often complicated by the issue of determining the number of concurrent virtual desktops capable of running on a single server while providing acceptable performance to each desktop user. Determining the number of virtualised desktops capable of running on a virtual server is a non-trivial issue, and within most environments this is determined by trial and error. The objective of our experiments was to identify the maximum number of virtual desktop instances within our experimental environment. Each virtual desktop (guest operating system) was configured to automatically perform a specific tasks designed to strain the host servers resources to determine the breaking point of VirtualBox and to identify the maximum number of concurrent virtual desktops possible under 4 specific workloads.
Keywords: VirtualBox, Virtualisation, Sizing, Performance
1 Introduction
Virtualization technology has grown in popularity over the last decade. While its roots may be traced back to the 1970’s with the original IBM publications on virtual machines [1] it is only relatively recently that it has been incorporated into corporate and educational computing infrastructures. Since VMWare [2] released the first virtualisation product "VMware Virtual Platform" February 1999 to address under utilization of servers, the number of virtualisation products available has dramatically increased with Xen [3], Virtual Server [4], and VirtualBox [5] being some of the most commercially successful examples. There are also many examples of virtualisation based enterprises being constructed such as Amazon’s Elastic Compute Cloud (EC2) [6] and IBMs Cloud computing initiative [7]. Within education, virtualisation has been demonstrated as a key learning tool with virtual laboratories implemented by Border [8] and Buller [9]. There are two primary areas where virtualisation has become prevalent, server virtualisation and desktop virtualisation. Server virtualisation provides the ability to provide server based functionality within a virtual container allowing among other things, legacy systems to move from outdated hardware to more modern, higher performing systems, without the requirement for system reinstallation. Migrating from hardware installations to virtual installations is a service offered by most virtualisation technologies. Desktop virtualisation on the other hand provides the functionality of user desktops within a virtual
97

environment and typically involves the concurrent execution of virtual machine guest operating systems on the virtual host server. The focus of this paper is on desktop virtualisation. A series of 4 sizing experiments were designed to provide identical automated workloads within the virtual desktop guest operating systems and to slowly increase the number of concurrently running virtual desktops until a breaking point was reached. Each experiment used the same experimental procedure and setup with differing loads running for each experiment.
1.1 Structure of the paper
In section 2 we review virtualisation technology to provide an understanding of what the technology entails and review some of its uses today. Section 3 provides details of the experimental design and setup. Section 4 takes a critical look at the experimental data and section 5 provides conclusions and identifies future work. This paper is aimed at professionals within educational institutes seeking to understand some of the practical limits of virtualisation technology, and demonstrates an experimental method for use in future experiments.
1.2 Experimental aims and objectives
The aim of these experiments was to determine the upper limit on the number of concurrently running virtual desktops for the designed setup for each of the different loads. The loads used were – 1) No load running, 2) CPU Intensive loads, 3) Disk intensive loads, and 4) Audio intensive loads. To achieve these aims an experimental setup and procedure was required which is outlined in more detail in Section 4. The primary requirement for each experiment was to re-use the same implementation, and to have a shared set of terminating conditions. This allows a comparison between each of the experiments in Section 5.
2 Virtualisation Overview
There are currently many different platform virtualisation technology implementations in production. Each approach will undoubtedly provide varying results in a performance based experiment, however given the vast range of technologies available these experiments are limited to just once specific form of virtualisation, and one specific product, VirtualBox, which is emulation based virtualisation technology.
2.1 Emulation Virtualisation
Simulates complete operating system hardware inside the virtualisation server application. Instructions can take a longer to reach the native hardware due to the additional server software layer between the Guest OS and the underlying hardware. VirtualBox is an example of emulation virtualisation as shown in Figure 1. A Virtual Server application emulates all operating system hardware for the Virtual Machine Guest Operating systems. It should be noted that that there are other virtualisation methods such as paravirtualisation, and hardware virtualisation which are well described by Rose in his review of system virtualisation techniques [10]
Figure 1. Emulation Virtualisation
98
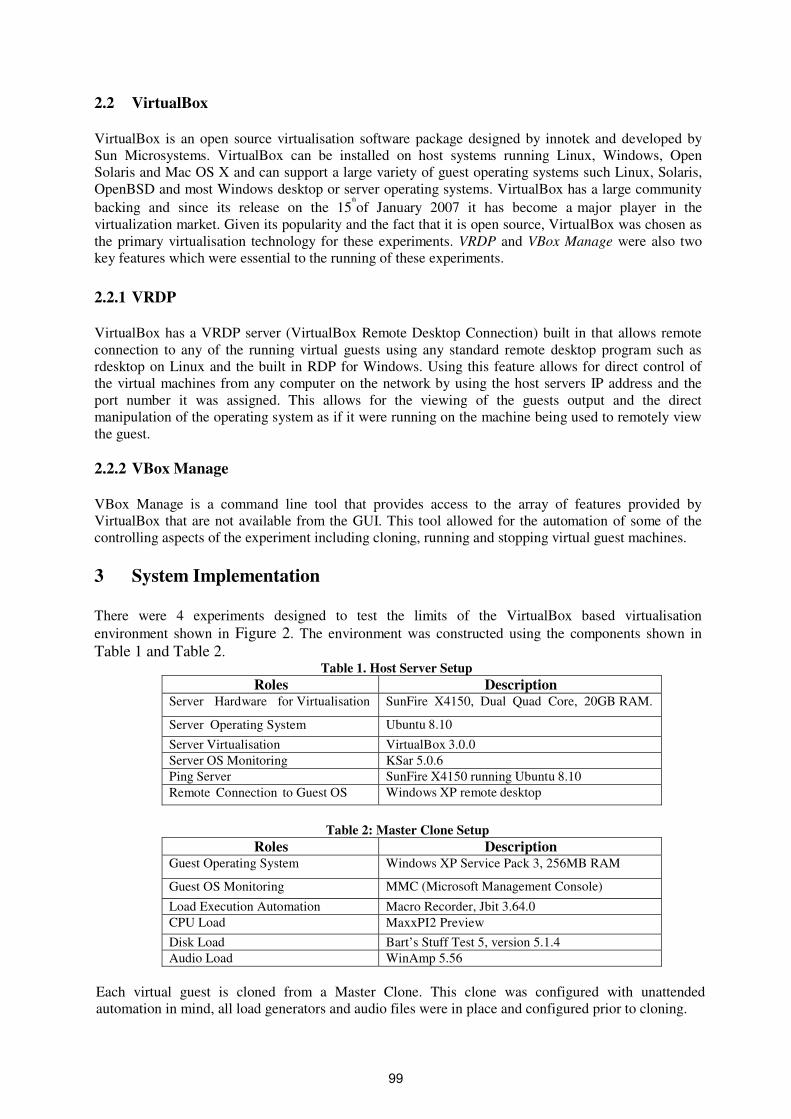
2.2 VirtualBox
VirtualBox is an open source virtualisation software package designed by innotek and developed by Sun Microsystems. VirtualBox can be installed on host systems running Linux, Windows, Open Solaris and Mac OS X and can support a large variety of guest operating systems such Linux, Solaris, OpenBSD and most Windows desktop or server operating systems. VirtualBox has a large community backing and since its release on the 15
th
of January 2007 it has become a major player in the virtualization market. Given its popularity and the fact that it is open source, VirtualBox was chosen as the primary virtualisation technology for these experiments. VRDP and VBox Manage were also two key features which were essential to the running of these experiments.
2.2.1 VRDP
VirtualBox has a VRDP server (VirtualBox Remote Desktop Connection) built in that allows remote connection to any of the running virtual guests using any standard remote desktop program such as rdesktop on Linux and the built in RDP for Windows. Using this feature allows for direct control of the virtual machines from any computer on the network by using the host servers IP address and the port number it was assigned. This allows for the viewing of the guests output and the direct manipulation of the operating system as if it were running on the machine being used to remotely view the guest.
2.2.2 VBox Manage
VBox Manage is a command line tool that provides access to the array of features provided by VirtualBox that are not available from the GUI. This tool allowed for the automation of some of the controlling aspects of the experiment including cloning, running and stopping virtual guest machines.
3 System Implementation
There were 4 experiments designed to test the limits of the VirtualBox based virtualisation environment shown in Figure 2. The environment was constructed using the components shown in Table 1 and Table 2.
Table 1. Host Server Setup Roles Description
Server Hardware for Virtualisation SunFire X4150, Dual Quad Core, 20GB RAM.
Server Operating System Ubuntu 8.10 Server Virtualisation VirtualBox 3.0.0 Server OS Monitoring KSar 5.0.6 Ping Server SunFire X4150 running Ubuntu 8.10 Remote Connection to Guest OS Windows XP remote desktop
Table 2: Master Clone Setup
Roles Description Guest Operating System Windows XP Service Pack 3, 256MB RAM
Guest OS Monitoring MMC (Microsoft Management Console)
Load Execution Automation Macro Recorder, Jbit 3.64.0 CPU Load MaxxPI2 Preview
Disk Load Bart’s Stuff Test 5, version 5.1.4 Audio Load WinAmp 5.56
Each virtual guest is cloned from a Master Clone. This clone was configured with unattended automation in mind, all load generators and audio files were in place and configured prior to cloning.
99
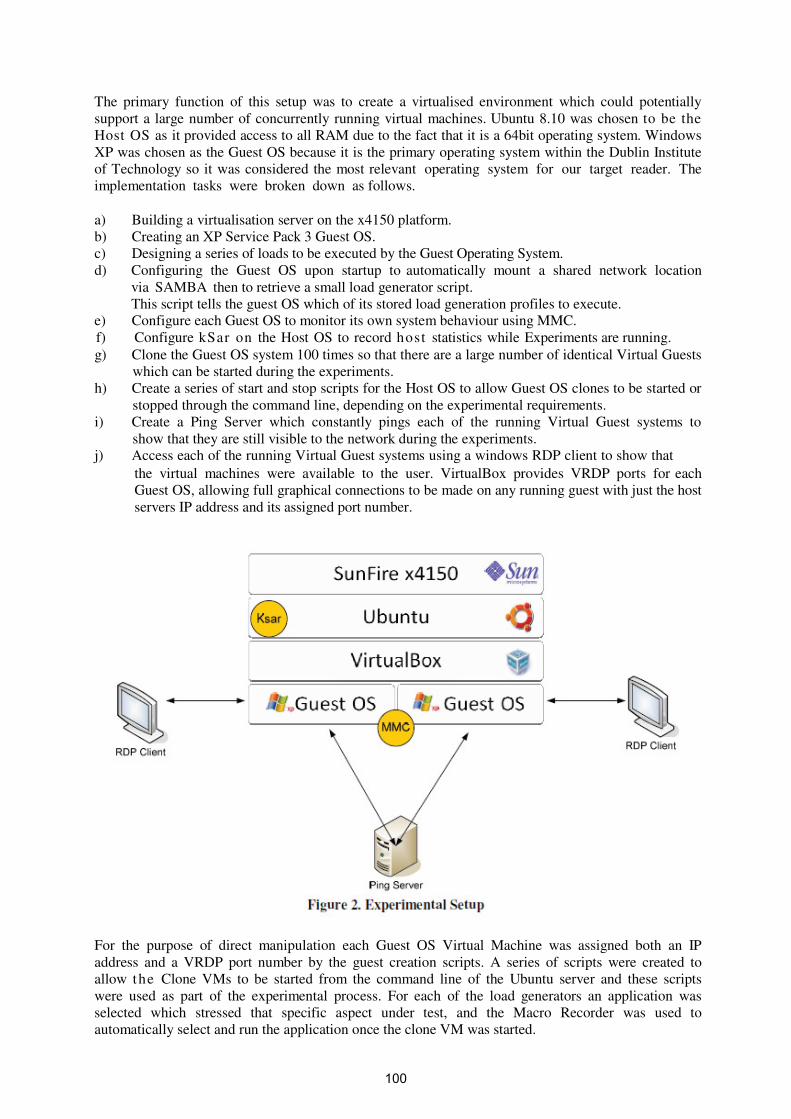
The primary function of this setup was to create a virtualised environment which could potentially support a large number of concurrently running virtual machines. Ubuntu 8.10 was chosen to be the Host OS as it provided access to all RAM due to the fact that it is a 64bit operating system. Windows XP was chosen as the Guest OS because it is the primary operating system within the Dublin Institute of Technology so it was considered the most relevant operating system for our target reader. The implementation tasks were broken down as follows.
a) Building a virtualisation server on the x4150 platform. b) Creating an XP Service Pack 3 Guest OS. c) Designing a series of loads to be executed by the Guest Operating System. d) Configuring the Guest OS upon startup to automatically mount a shared network location
via SAMBA then to retrieve a small load generator script. This script tells the guest OS which of its stored load generation profiles to execute. e) Configure each Guest OS to monitor its own system behaviour using MMC. f) Configure kSar on the Host OS to record host statistics while Experiments are running. g) Clone the Guest OS system 100 times so that there are a large number of identical Virtual Guests
which can be started during the experiments. h) Create a series of start and stop scripts for the Host OS to allow Guest OS clones to be started or
stopped through the command line, depending on the experimental requirements. i) Create a Ping Server which constantly pings each of the running Virtual Guest systems to
show that they are still visible to the network during the experiments. j) Access each of the running Virtual Guest systems using a windows RDP client to show that
the virtual machines were available to the user. VirtualBox provides VRDP ports for each Guest OS, allowing full graphical connections to be made on any running guest with just the host servers IP address and its assigned port number.
For the purpose of direct manipulation each Guest OS Virtual Machine was assigned both an IP address and a VRDP port number by the guest creation scripts. A series of scripts were created to allow the Clone VMs to be started from the command line of the Ubuntu server and these scripts were used as part of the experimental process. For each of the load generators an application was selected which stressed that specific aspect under test, and the Macro Recorder was used to automatically select and run the application once the clone VM was started.
100

4 Experimentation
There were 4 distinct sizing experiments run which all aimed to identify the maximum number of concurrently running Virtual Machine Clones running the same load before an experimental termination condition was reached. The experiments were numbered as shown below. Experiment 1: Clone Virtual Machines started with no load generator application running. Experiment 2: Clone Virtual Machines started running a CPU Intensive application (MaxxPI) Experiment 3: Clone Virtual Machines started running a Disk intensive application (BS Test v5.1.4) Experiment 4: Clone Virtual Machines started running a streaming audio file (WinAmp 5.56)
Each experiment followed the same experimental process with the primary difference between each being the load run by the VM Clone once it started running.
4.1 Experimentation Protocol
The following protocol was used for each experiment. a) Power On the Virtual Server Hardware and verify that the VirtualBox was running. b) Start the kSar monitoring software on the Host OS. c) Start the Ping Server and record the ping responses to each of the possible VM Clones to be run. d) Start the first 5 VM clones. e) Check the termination conditions for the experiment. f) Continue to start VM clones verifying that the termination conditions after each clone is started.
4.2 Experimentation Termination Conditions
To ensure that all experiments had a definitive end point a series of conditions were identified which marked the end of the experiment. Only one of the conditions needed to be met for the experiment to complete. The reasoning behind these controls was to identify realistic boundaries which would effectively cause a service outage to the user of the Virtual Desktop. The termination conditions were as follows. a) The Virtual Machines fail to respond to Pings from the Ping server for more than 10 seconds.
The purpose of this was to ensure that the virtual machines were visible on the network. Once they were not visible then this effectively was a service outage condition.
b) The Virtual Machine failed to load the shared network point to retrieve the load generator. The purpose of this condition was to ensure that the virtual machine could use the
network to identify the correct load to run. If the VM could not identify the correct load then it effectively could not take part in the experiment. During the experiments any network traffic was minimal due to the fact that the load generator script was less than 1kb in size.
c) The Virtual Machine allowed RDP connections to the GUI desktop over the VRDP assigned port. The VM only offers a service to users once it is accessible to them. RDP is the only method of accessing the virtual desktop.
d) The Virtual Machine can continue to run the assigned load. This condition was more difficult to monitor that the previous conditions in that the load
generators continued to function but were doing so at a reduced rate. It was only during the audio testing that an exception was made to determine what “reasonable” service meant.
4.3 Experiment 1 – No Load
The purpose of this experiment was to identify the maximum number of Virtual Machines required for the remaining experiments. This experiment effectively provided an upper bound on the number of VM (clones) which would be required in the remaining experiments on the grounds that when the VM was doing no specific work, it should be possible to have more running than when a load was is introduced. For this experiment the VM were started in sets of 5. Each of the 5 VMs were required to pass the termination conditions before the next set of 5 VMs were loaded. The experiment was run over a 1 hour period until all VMs suddenly failed the Ping Server condition.
101
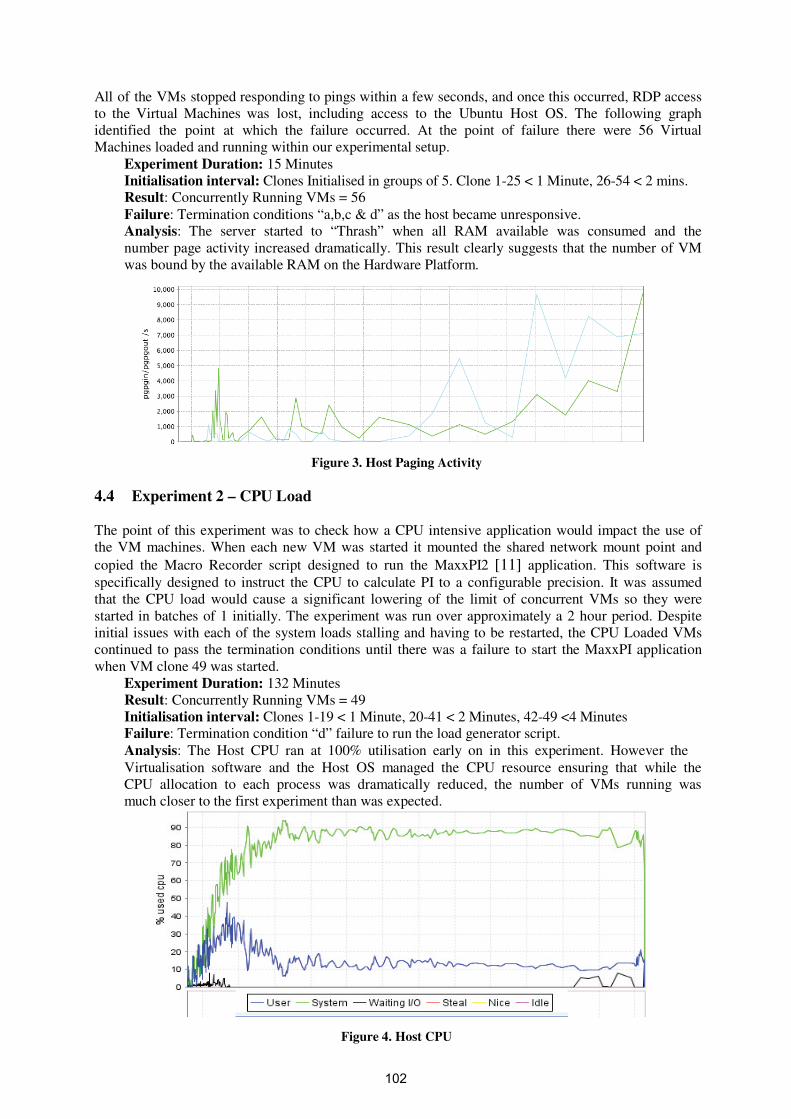
All of the VMs stopped responding to pings within a few seconds, and once this occurred, RDP access to the Virtual Machines was lost, including access to the Ubuntu Host OS. The following graph identified the point at which the failure occurred. At the point of failure there were 56 Virtual Machines loaded and running within our experimental setup.
Experiment Duration: 15 Minutes Initialisation interval: Clones Initialised in groups of 5. Clone 1-25 < 1 Minute, 26-54 < 2 mins. Result: Concurrently Running VMs = 56 Failure: Termination conditions “a,b,c & d” as the host became unresponsive. Analysis: The server started to “Thrash” when all RAM available was consumed and the number page activity increased dramatically. This result clearly suggests that the number of VM was bound by the available RAM on the Hardware Platform.
Figure 3. Host Paging Activity 4.4 Experiment 2 – CPU Load
The point of this experiment was to check how a CPU intensive application would impact the use of the VM machines. When each new VM was started it mounted the shared network mount point and copied the Macro Recorder script designed to run the MaxxPI2 [11] application. This software is specifically designed to instruct the CPU to calculate PI to a configurable precision. It was assumed that the CPU load would cause a significant lowering of the limit of concurrent VMs so they were started in batches of 1 initially. The experiment was run over approximately a 2 hour period. Despite initial issues with each of the system loads stalling and having to be restarted, the CPU Loaded VMs continued to pass the termination conditions until there was a failure to start the MaxxPI application when VM clone 49 was started.
Experiment Duration: 132 Minutes Result: Concurrently Running VMs = 49 Initialisation interval: Clones 1-19 < 1 Minute, 20-41 < 2 Minutes, 42-49 <4 Minutes Failure: Termination condition “d” failure to run the load generator script. Analysis: The Host CPU ran at 100% utilisation early on in this experiment. However the Virtualisation software and the Host OS managed the CPU resource ensuring that while the CPU allocation to each process was dramatically reduced, the number of VMs running was much closer to the first experiment than was expected.
Figure 4. Host CPU
102
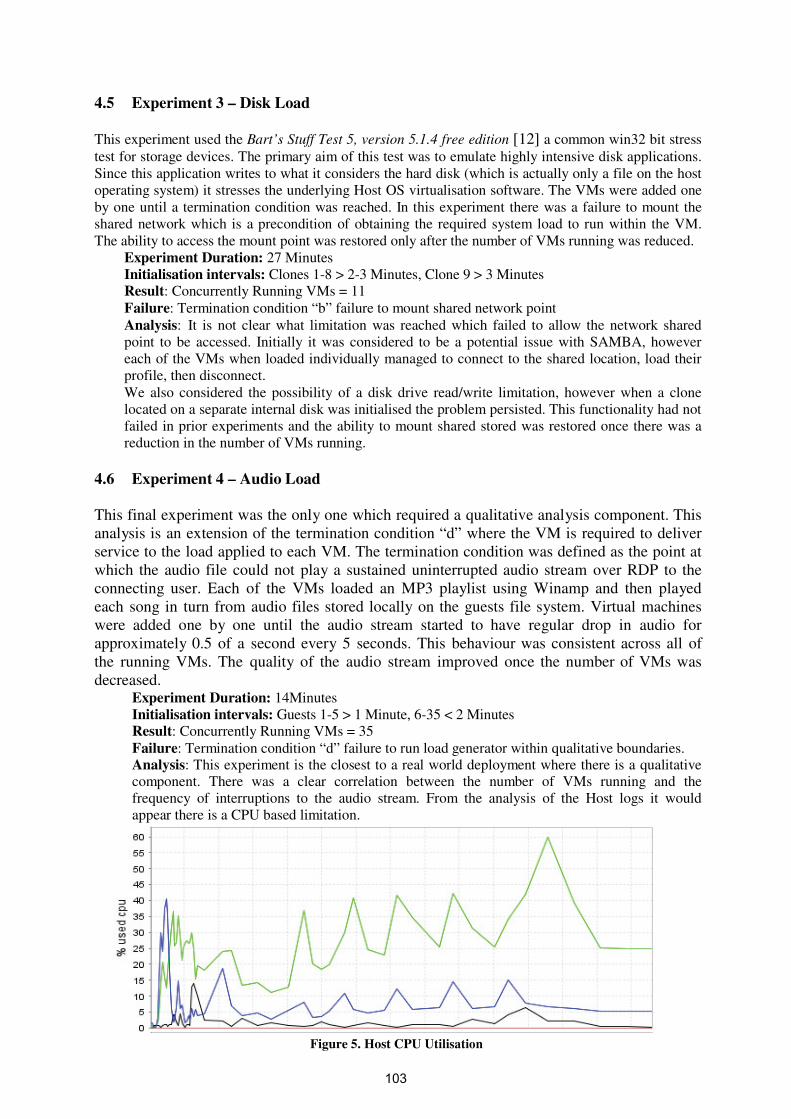
4.5 Experiment 3 – Disk Load
This experiment used the Bart’s Stuff Test 5, version 5.1.4 free edition [12] a common win32 bit stress test for storage devices. The primary aim of this test was to emulate highly intensive disk applications. Since this application writes to what it considers the hard disk (which is actually only a file on the host operating system) it stresses the underlying Host OS virtualisation software. The VMs were added one by one until a termination condition was reached. In this experiment there was a failure to mount the shared network which is a precondition of obtaining the required system load to run within the VM. The ability to access the mount point was restored only after the number of VMs running was reduced.
Experiment Duration: 27 Minutes Initialisation intervals: Clones 1-8 > 2-3 Minutes, Clone 9 > 3 Minutes Result: Concurrently Running VMs = 11 Failure: Termination condition “b” failure to mount shared network point Analysis: It is not clear what limitation was reached which failed to allow the network shared point to be accessed. Initially it was considered to be a potential issue with SAMBA, however each of the VMs when loaded individually managed to connect to the shared location, load their profile, then disconnect. We also considered the possibility of a disk drive read/write limitation, however when a clone located on a separate internal disk was initialised the problem persisted. This functionality had not failed in prior experiments and the ability to mount shared stored was restored once there was a reduction in the number of VMs running.
4.6 Experiment 4 – Audio Load
This final experiment was the only one which required a qualitative analysis component. This analysis is an extension of the termination condition “d” where the VM is required to deliver service to the load applied to each VM. The termination condition was defined as the point at which the audio file could not play a sustained uninterrupted audio stream over RDP to the connecting user. Each of the VMs loaded an MP3 playlist using Winamp and then played each song in turn from audio files stored locally on the guests file system. Virtual machines were added one by one until the audio stream started to have regular drop in audio for approximately 0.5 of a second every 5 seconds. This behaviour was consistent across all of the running VMs. The quality of the audio stream improved once the number of VMs was decreased.
Experiment Duration: 14Minutes Initialisation intervals: Guests 1-5 > 1 Minute, 6-35 < 2 Minutes Result: Concurrently Running VMs = 35 Failure: Termination condition “d” failure to run load generator within qualitative boundaries. Analysis: This experiment is the closest to a real world deployment where there is a qualitative component. There was a clear correlation between the number of VMs running and the frequency of interruptions to the audio stream. From the analysis of the Host logs it would appear there is a CPU based limitation.
Figure 5. Host CPU Utilisation
103
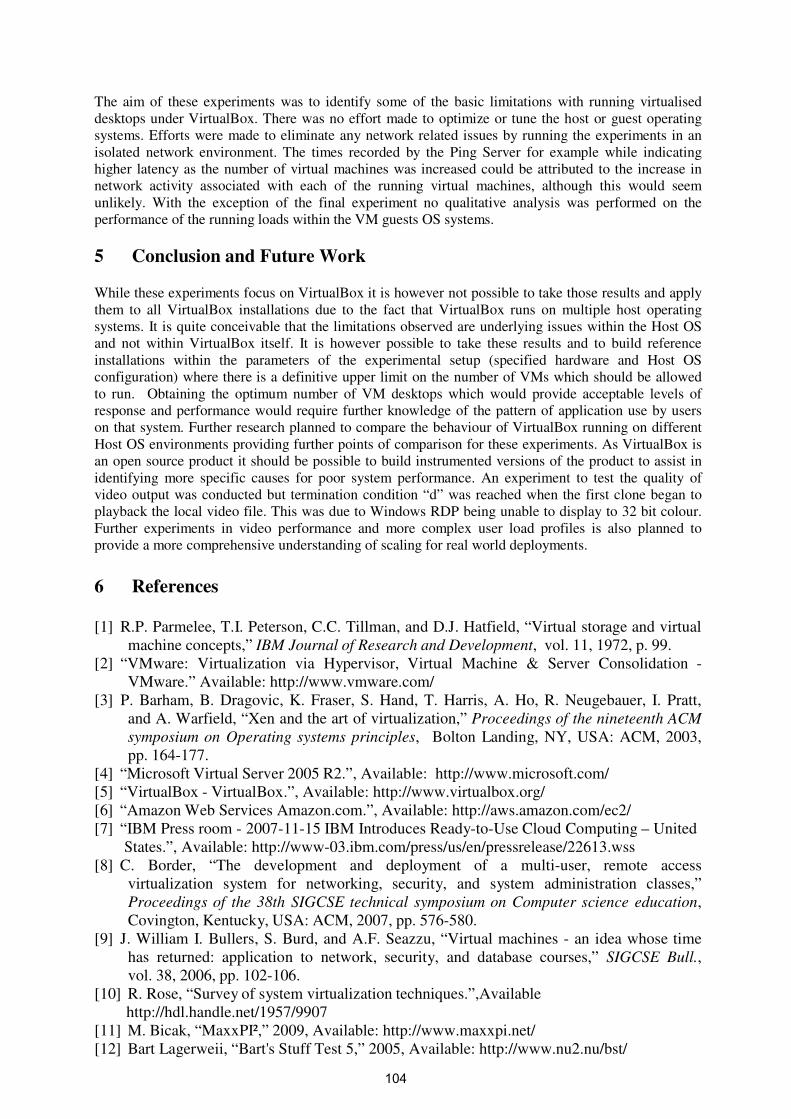
The aim of these experiments was to identify some of the basic limitations with running virtualised desktops under VirtualBox. There was no effort made to optimize or tune the host or guest operating systems. Efforts were made to eliminate any network related issues by running the experiments in an isolated network environment. The times recorded by the Ping Server for example while indicating higher latency as the number of virtual machines was increased could be attributed to the increase in network activity associated with each of the running virtual machines, although this would seem unlikely. With the exception of the final experiment no qualitative analysis was performed on the performance of the running loads within the VM guests OS systems.
5 Conclusion and Future Work
While these experiments focus on VirtualBox it is however not possible to take those results and apply them to all VirtualBox installations due to the fact that VirtualBox runs on multiple host operating systems. It is quite conceivable that the limitations observed are underlying issues within the Host OS and not within VirtualBox itself. It is however possible to take these results and to build reference installations within the parameters of the experimental setup (specified hardware and Host OS configuration) where there is a definitive upper limit on the number of VMs which should be allowed to run. Obtaining the optimum number of VM desktops which would provide acceptable levels of response and performance would require further knowledge of the pattern of application use by users on that system. Further research planned to compare the behaviour of VirtualBox running on different Host OS environments providing further points of comparison for these experiments. As VirtualBox is an open source product it should be possible to build instrumented versions of the product to assist in identifying more specific causes for poor system performance. An experiment to test the quality of video output was conducted but termination condition “d” was reached when the first clone began to playback the local video file. This was due to Windows RDP being unable to display to 32 bit colour. Further experiments in video performance and more complex user load profiles is also planned to provide a more comprehensive understanding of scaling for real world deployments.
6 References
[1] R.P. Parmelee, T.I. Peterson, C.C. Tillman, and D.J. Hatfield, “Virtual storage and virtual
machine concepts,” IBM Journal of Research and Development, vol. 11, 1972, p. 99. [2] “VMware: Virtualization via Hypervisor, Virtual Machine & Server Consolidation -
VMware.” Available: http://www.vmware.com/ [3] P. Barham, B. Dragovic, K. Fraser, S. Hand, T. Harris, A. Ho, R. Neugebauer, I. Pratt,
and A. Warfield, “Xen and the art of virtualization,” Proceedings of the nineteenth ACM symposium on Operating systems principles, Bolton Landing, NY, USA: ACM, 2003, pp. 164-177.
[4] “Microsoft Virtual Server 2005 R2.”, Available: http://www.microsoft.com/ [5] “VirtualBox - VirtualBox.”, Available: http://www.virtualbox.org/ [6] “Amazon Web Services Amazon.com.”, Available: http://aws.amazon.com/ec2/ [7] “IBM Press room - 2007-11-15 IBM Introduces Ready-to-Use Cloud Computing – United
States.”, Available: http://www-03.ibm.com/press/us/en/pressrelease/22613.wss [8] C. Border, “The development and deployment of a multi-user, remote access
virtualization system for networking, security, and system administration classes,” Proceedings of the 38th SIGCSE technical symposium on Computer science education, Covington, Kentucky, USA: ACM, 2007, pp. 576-580.
[9] J. William I. Bullers, S. Burd, and A.F. Seazzu, “Virtual machines - an idea whose time has returned: application to network, security, and database courses,” SIGCSE Bull., vol. 38, 2006, pp. 102-106.
[10] R. Rose, “Survey of system virtualization techniques.”,Available http://hdl.handle.net/1957/9907 [11] M. Bicak, “MaxxPI²,” 2009, Available: http://www.maxxpi.net/ [12] Bart Lagerweii, “Bart's Stuff Test 5,” 2005, Available: http://www.nu2.nu/bst/
104
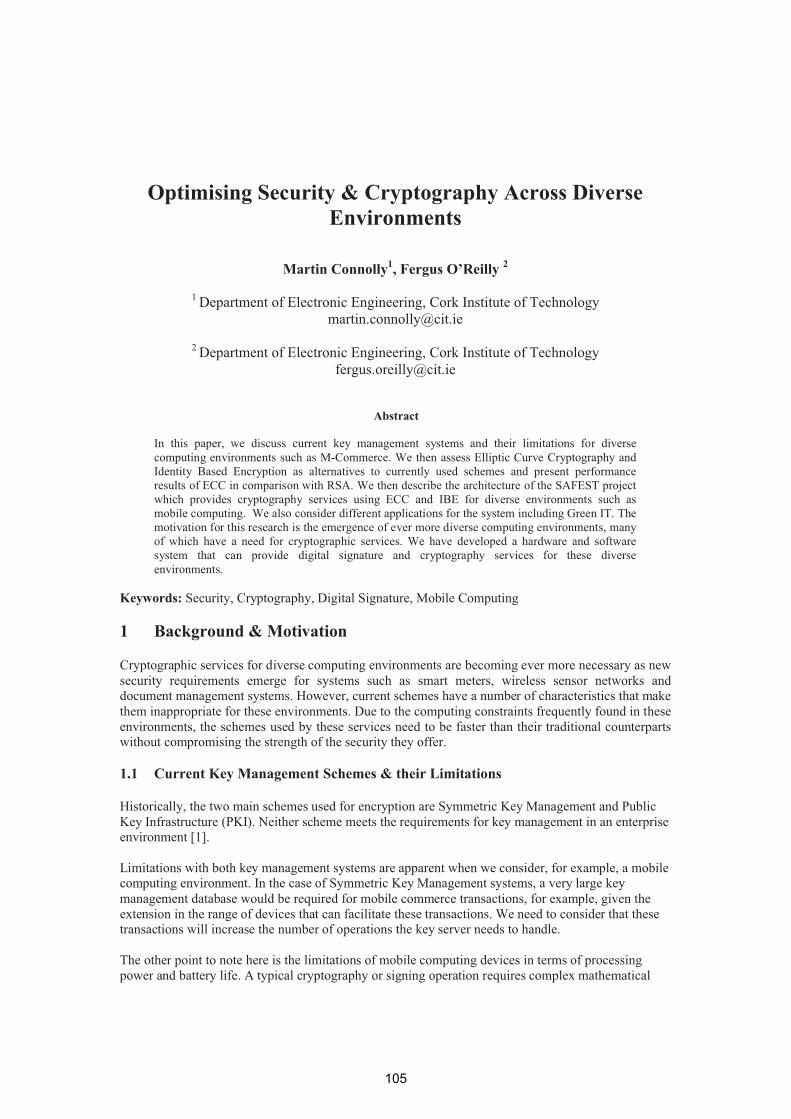
Optimising Security & Cryptography Across Diverse Environments
Martin Connolly1, Fergus O’Reilly 2
1 Department of Electronic Engineering, Cork Institute of [email protected]
2 Department of Electronic Engineering, Cork Institute of [email protected]
Abstract
In this paper, we discuss current key management systems and their limitations for diverse computing environments such as M-Commerce. We then assess Elliptic Curve Cryptography and Identity Based Encryption as alternatives to currently used schemes and present performance results of ECC in comparison with RSA. We then describe the architecture of the SAFEST project which provides cryptography services using ECC and IBE for diverse environments such as mobile computing. We also consider different applications for the system including Green IT. The motivation for this research is the emergence of ever more diverse computing environments, many of which have a need for cryptographic services. We have developed a hardware and software system that can provide digital signature and cryptography services for these diverse environments.
Keywords: Security, Cryptography, Digital Signature, Mobile Computing
1 Background & Motivation
Cryptographic services for diverse computing environments are becoming ever more necessary as new security requirements emerge for systems such as smart meters, wireless sensor networks and document management systems. However, current schemes have a number of characteristics that make them inappropriate for these environments. Due to the computing constraints frequently found in these environments, the schemes used by these services need to be faster than their traditional counterparts without compromising the strength of the security they offer.
1.1 Current Key Management Schemes & their Limitations
Historically, the two main schemes used for encryption are Symmetric Key Management and Public Key Infrastructure (PKI). Neither scheme meets the requirements for key management in an enterprise environment [1].
Limitations with both key management systems are apparent when we consider, for example, a mobile computing environment. In the case of Symmetric Key Management systems, a very large key management database would be required for mobile commerce transactions, for example, given the extension in the range of devices that can facilitate these transactions. We need to consider that thesetransactions will increase the number of operations the key server needs to handle.
The other point to note here is the limitations of mobile computing devices in terms of processing power and battery life. A typical cryptography or signing operation requires complex mathematical
105

computation which many devices will simply not be capable of. In addition, the greater the strain on processing the shorter the battery life.
1.1 Cryptographic Schemes Appropriate for Diverse Environments
Clearly, then, there is a need for cryptographic systems that can operate on both fixed and mobile devices and can carry out encryption and signing operations on these devices in a timely fashion.From a survey of the literature, the most suitable schemes would appear to be Identity Based Encryption (IBE) and Elliptic Curve Cryptography (ECC). The Voltage Security White Paper on IBE [1] and Lauter’s paper on ECC [2] provide examples of the use of these schemes.
1.1.1 Identity Based Encryption
Identity Based Encryption (IBE) is a public cryptographic scheme where any piece of text can act as a valid public key. This is a powerful concept as it means that email addresses, dates or a combination of both can act as public keys. The concept of IBE was first proposed by Shamir [3]. However, despite many proposals, no satisfactory implementation of IBE was formulated until 2001 by Boneh and Franklin [4].
With IBE, the sender specifies the identity of the receiver(s) to derive an encryption key. The data is then encrypted and sent to the receiver who authenticates the data with a key server. Once authenticated, the key server sends the decryption key to the receiver and the data can be decrypted.
Voltage Security [1] outlines how IBE meets the requirements for key management in an enterprise environment. IBE offers several advantages over other key management schemes. Keys are always available for recipients as the keys are derived mathematically from the recipient’s identity. Existing authentication resources such as directories or web authentication can be reused. Partners can manage keys jointly as IBE facilitates the selection of a local key server, a partner’s key server or a service to protect the data. The server can regenerate keys for different infrastructure components as needed. As all keys are generated from a base secret stored at the key server any key can be securely regenerated and recovered as long as this base secret can be retrieved. Finally, since we don’t need a database or aper –transaction connection to the key server, additional applications and transactions are easy to add to the system.
1.1.2 Elliptic Curve Cryptography
Elliptic Curve Cryptography (ECC) is an asymmetric cryptographic technique i.e. a key pair is used. Like all asymmetric cryptographic techniques, the public key is used for encryption while the private key is used for decryption. As its name implies, ECC uses Elliptic Curves for securing transmitted data. An Elliptic Curve is a set of solutions to an equation of the form over what are termed finite fields. The form of the equation defining an elliptic curve over a finite field differs depending on whether the field is a prime finite field or a characteristic 2 finite field. ECC was proposed independently by Koblitz [5] and Miller [6] in the 1980s.
The major advantages that ECC provides is greater security using smaller key sizes compared with other systems. This is particular relevant for environments where processing power, storage space, bandwidth and power consumption are limited – restrictions one typically finds in a mobile computing environment. ECC implementations are more compact, meaning that cryptographic operations running on constrained hardware and small chips are faster. Lauter [2] outlines the advantages that ECC can provide for wireless security.
Several public key cryptographic schemes are based on ECC including signature schemes, encryption schemes and key agreement schemes. ECC has been used in diverse mobile environments including Wireless Sensor Networks (WSNs). For example, Java Sun SPOT Sensors [7] use ECC for code
106

dissemination and North Carolina State University [8] implemented ECC for the TinyOS operating system.
1.1.3 ECC Performance
As part of our research, we assessed ECC performance by running a number of tests against the RSA public key cryptography algorithm. We used the Elliptic Curve Integrated Encryption Scheme (ECIES) implementation of the ECC algorithm using prime and characteristic 2 finite fields. We ran our comparison tests on a laptop and PDA, a Dell Latitude D630 2 GHz Laptop running Windows XP and a Dell Axim X51 128 MB 520 MHz PDA running Windows Mobile 5.0 respectively. A wired LAN, an 802.11b wireless network as well as Vodafone Ireland GPRS and 3G Networks were used to demonstrate the use of the two RSA and ECC algorithms. Application programs for carrying out these tests were developed as Java MIDlets using Java Mobile Edition (J2ME).
The three operations assessed were creating a key pair, encryption and decryption for 2 KB, 5 KB and 20 KB message sizes. Each operation was carried out on a laptop and PDA.
Figure 1: ECC & RSA Key Pair Creation
ECC completes the key pair operation 21 times faster than RSA for a PDA and 24 times faster for a laptop. See Figure 1. Similarly, Figure 2 and Figure 3 illustrate how ECC outperforms RSA for encryption on both a laptop and a PDA as file size increases. While RSA Encryption is faster for a 2KB file this trend is reversed for a file size of 20 KB for both a laptop and a PDA. RSA is marginally superior when encrypting a file size of 5 KB on a PDA but is far outstripped by ECC when the file size is 20 KB as the latter is nearly 3 times faster. This margin is even more pronounced when encryption takes place on a laptop as ECC is nearly 4 times faster than RSA. These file sizes were chosen as they represent ranges of standard text emails.
Figure 4 and Figure 5 show the results of ECC and RSA decryption for a laptop and PDA respectively. In this case, ECC is the superior performer for all message sizes. The differential ranges from nearly 6 times faster for the decryption of a 2 KB message on a PDA to nearly 53 times faster for a 20 KB message decrypted on a laptop. In general, the larger the message size the more noticeable the time taken for decrypting the operation using RSA. For a file size of 20 KB this operation take nearly 1.5 minutes on a laptop.
Figure 2: ECC & RSA Encryption - Laptop
Our findings show that the performance of ECC is superior to RSA for key pair creation, encryption and decryption operations on both fixed and mobile devices. It is for this reason
107
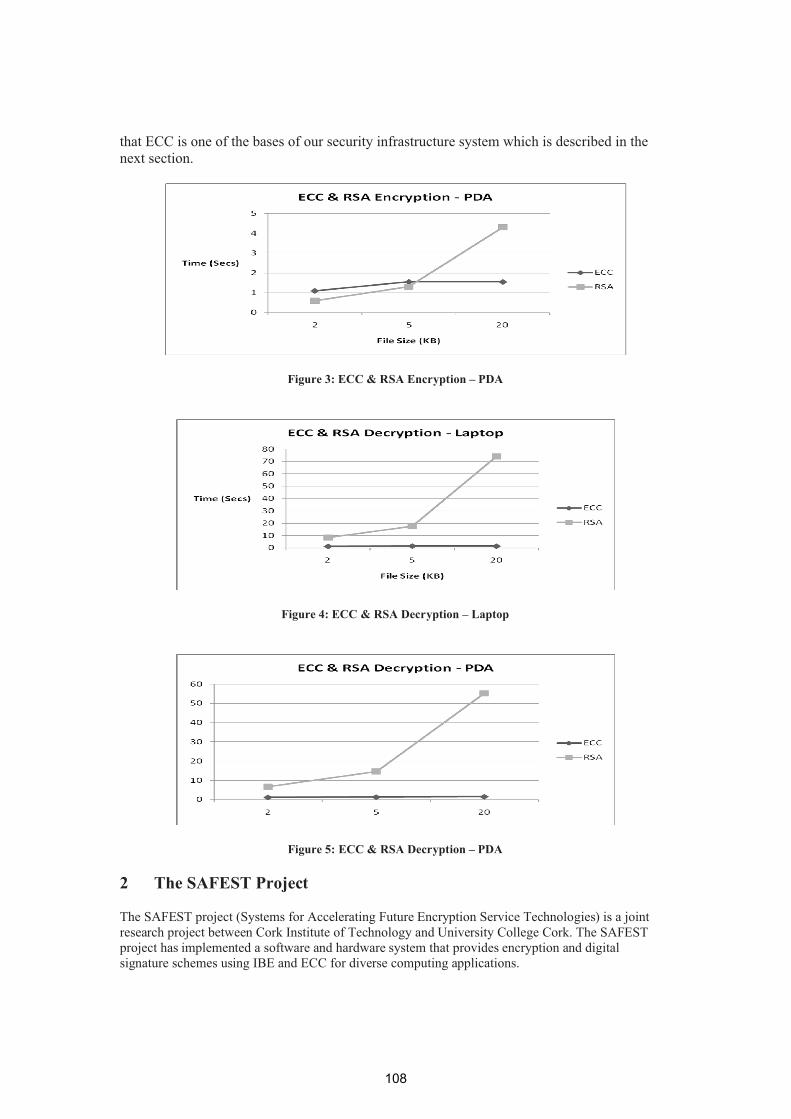
that ECC is one of the bases of our security infrastructure system which is described in the next section.
Figure 3: ECC & RSA Encryption – PDA
Figure 4: ECC & RSA Decryption – Laptop
Figure 5: ECC & RSA Decryption – PDA
2 The SAFEST Project
The SAFEST project (Systems for Accelerating Future Encryption Service Technologies) is a joint research project between Cork Institute of Technology and University College Cork. The SAFEST project has implemented a software and hardware system that provides encryption and digital signature schemes using IBE and ECC for diverse computing applications.
108
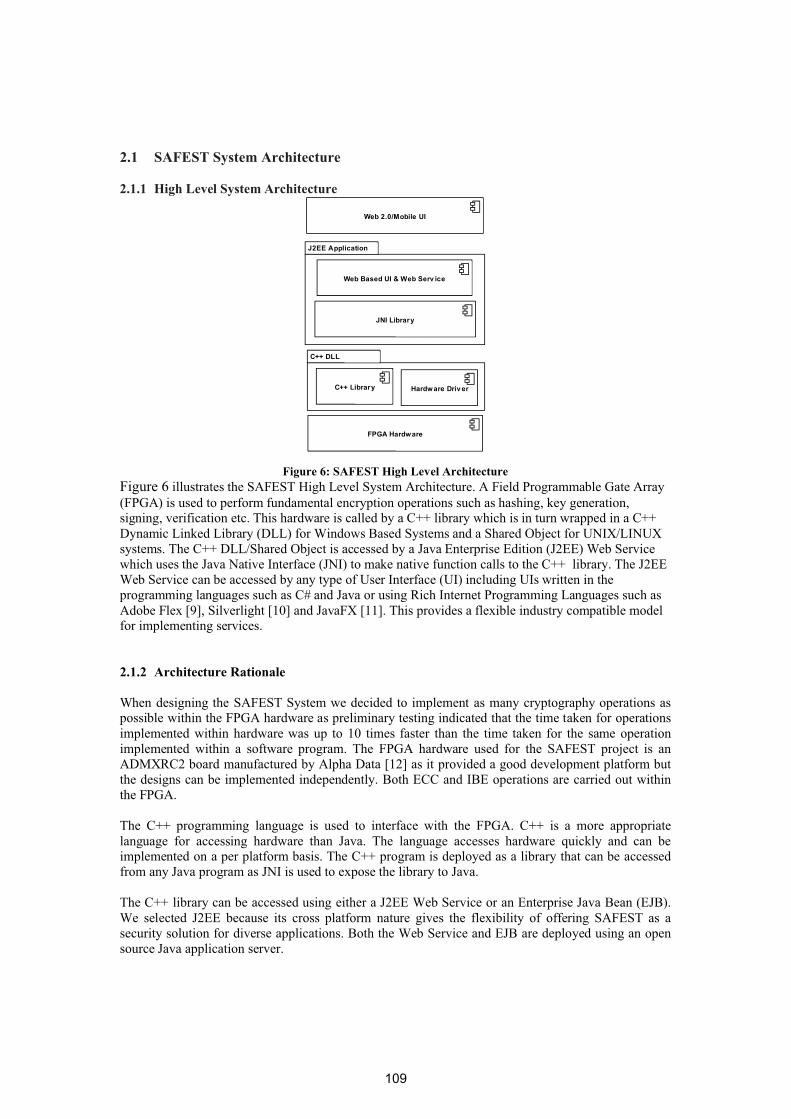
2.1 SAFEST System Architecture
2.1.1 High Level System Architecture
J2EE Application
Web Based UI & Web Serv ice
JNI Library
C++ DLL
C++ Library Hardware Driv er
FPGA Hardware
Web 2.0/Mobile UI
Figure 6: SAFEST High Level ArchitectureFigure 6 illustrates the SAFEST High Level System Architecture. A Field Programmable Gate Array (FPGA) is used to perform fundamental encryption operations such as hashing, key generation, signing, verification etc. This hardware is called by a C++ library which is in turn wrapped in a C++ Dynamic Linked Library (DLL) for Windows Based Systems and a Shared Object for UNIX/LINUX systems. The C++ DLL/Shared Object is accessed by a Java Enterprise Edition (J2EE) Web Service which uses the Java Native Interface (JNI) to make native function calls to the C++ library. The J2EE Web Service can be accessed by any type of User Interface (UI) including UIs written in the programming languages such as C# and Java or using Rich Internet Programming Languages such as Adobe Flex [9], Silverlight [10] and JavaFX [11]. This provides a flexible industry compatible model for implementing services.
2.1.2 Architecture Rationale
When designing the SAFEST System we decided to implement as many cryptography operations as possible within the FPGA hardware as preliminary testing indicated that the time taken for operations implemented within hardware was up to 10 times faster than the time taken for the same operation implemented within a software program. The FPGA hardware used for the SAFEST project is an ADMXRC2 board manufactured by Alpha Data [12] as it provided a good development platform but the designs can be implemented independently. Both ECC and IBE operations are carried out within the FPGA.
The C++ programming language is used to interface with the FPGA. C++ is a more appropriate language for accessing hardware than Java. The language accesses hardware quickly and can be implemented on a per platform basis. The C++ program is deployed as a library that can be accessed from any Java program as JNI is used to expose the library to Java.
The C++ library can be accessed using either a J2EE Web Service or an Enterprise Java Bean (EJB). We selected J2EE because its cross platform nature gives the flexibility of offering SAFEST as a security solution for diverse applications. Both the Web Service and EJB are deployed using an open source Java application server.
109
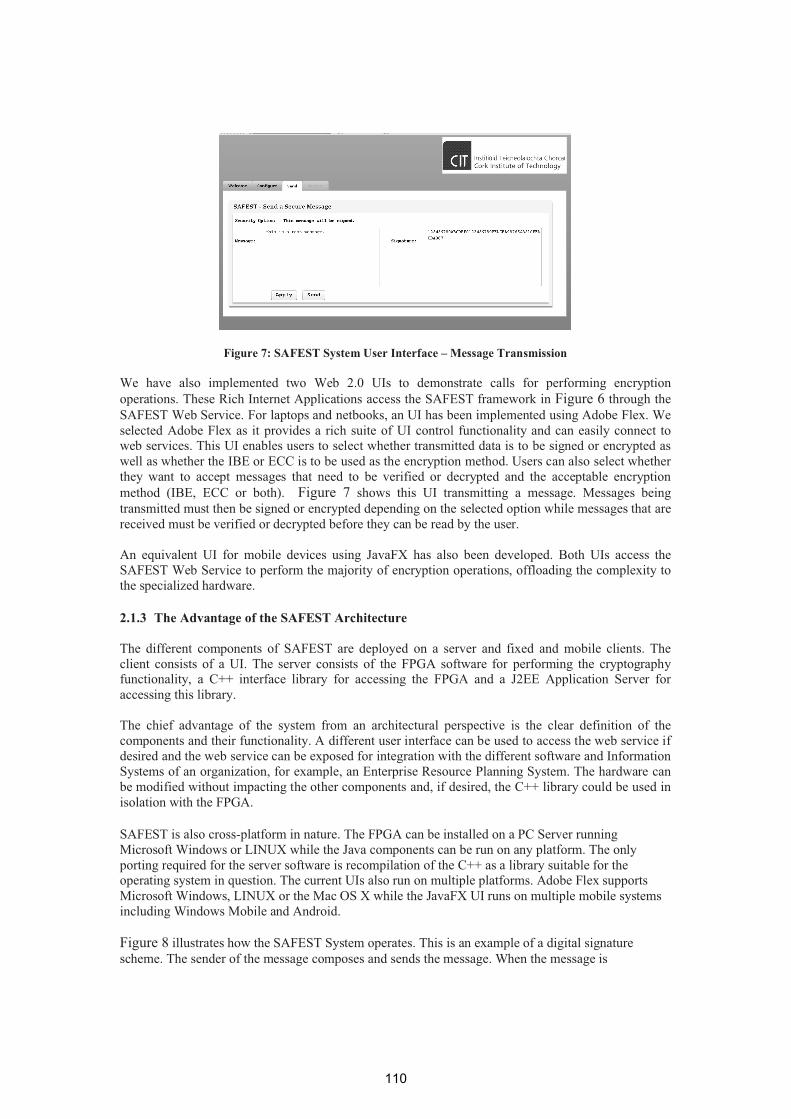
Figure 7: SAFEST System User Interface – Message Transmission
We have also implemented two Web 2.0 UIs to demonstrate calls for performing encryption operations. These Rich Internet Applications access the SAFEST framework in Figure 6 through the SAFEST Web Service. For laptops and netbooks, an UI has been implemented using Adobe Flex. We selected Adobe Flex as it provides a rich suite of UI control functionality and can easily connect to web services. This UI enables users to select whether transmitted data is to be signed or encrypted as well as whether the IBE or ECC is to be used as the encryption method. Users can also select whether they want to accept messages that need to be verified or decrypted and the acceptable encryption method (IBE, ECC or both). Figure 7 shows this UI transmitting a message. Messages being transmitted must then be signed or encrypted depending on the selected option while messages that are received must be verified or decrypted before they can be read by the user.
An equivalent UI for mobile devices using JavaFX has also been developed. Both UIs access the SAFEST Web Service to perform the majority of encryption operations, offloading the complexity to the specialized hardware.
2.1.3 The Advantage of the SAFEST Architecture
The different components of SAFEST are deployed on a server and fixed and mobile clients. The client consists of a UI. The server consists of the FPGA software for performing the cryptography functionality, a C++ interface library for accessing the FPGA and a J2EE Application Server for accessing this library.
The chief advantage of the system from an architectural perspective is the clear definition of the components and their functionality. A different user interface can be used to access the web service if desired and the web service can be exposed for integration with the different software and Information Systems of an organization, for example, an Enterprise Resource Planning System. The hardware can be modified without impacting the other components and, if desired, the C++ library could be used in isolation with the FPGA.
SAFEST is also cross-platform in nature. The FPGA can be installed on a PC Server running Microsoft Windows or LINUX while the Java components can be run on any platform. The only porting required for the server software is recompilation of the C++ as a library suitable for the operating system in question. The current UIs also run on multiple platforms. Adobe Flex supportsMicrosoft Windows, LINUX or the Mac OS X while the JavaFX UI runs on multiple mobile systems including Windows Mobile and Android.
Figure 8 illustrates how the SAFEST System operates. This is an example of a digital signature scheme. The sender of the message composes and sends the message. When the message is
110
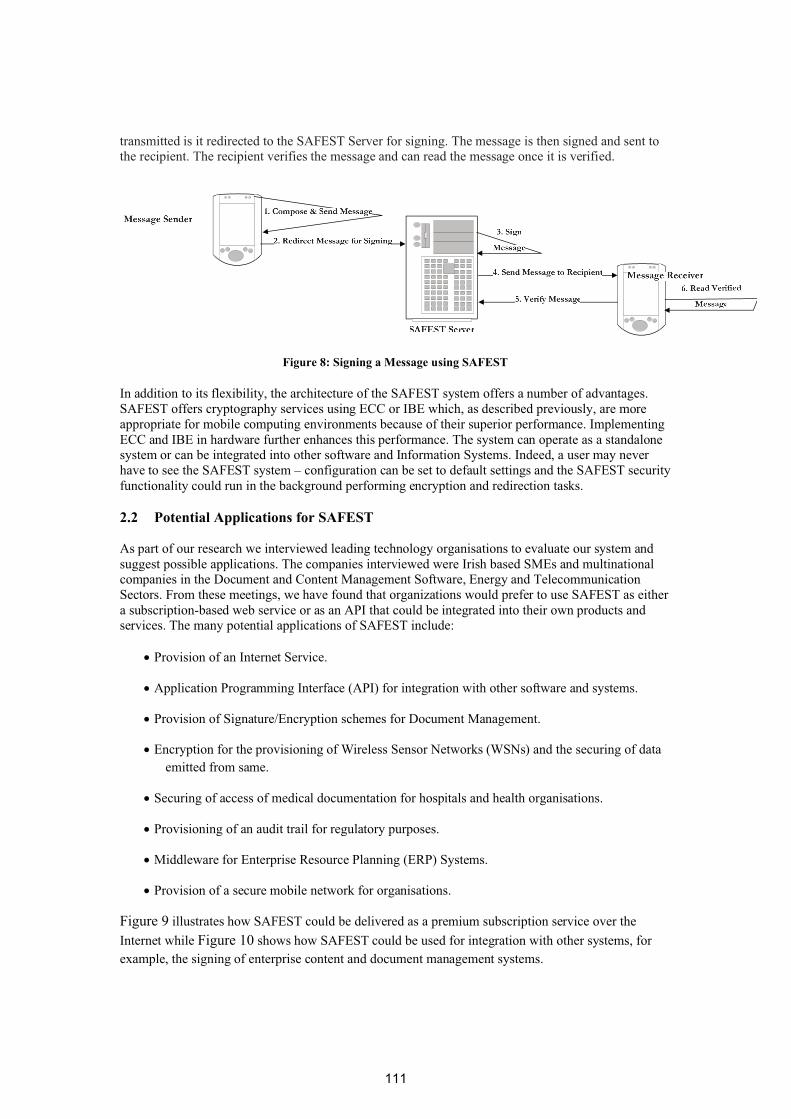
transmitted is it redirected to the SAFEST Server for signing. The message is then signed and sent to the recipient. The recipient verifies the message and can read the message once it is verified.
Figure 8: Signing a Message using SAFEST
In addition to its flexibility, the architecture of the SAFEST system offers a number of advantages. SAFEST offers cryptography services using ECC or IBE which, as described previously, are more appropriate for mobile computing environments because of their superior performance. Implementing ECC and IBE in hardware further enhances this performance. The system can operate as a standalone system or can be integrated into other software and Information Systems. Indeed, a user may never have to see the SAFEST system – configuration can be set to default settings and the SAFEST security functionality could run in the background performing encryption and redirection tasks.
2.2 Potential Applications for SAFEST
As part of our research we interviewed leading technology organisations to evaluate our system and suggest possible applications. The companies interviewed were Irish based SMEs and multinational companies in the Document and Content Management Software, Energy and Telecommunication Sectors. From these meetings, we have found that organizations would prefer to use SAFEST as either a subscription-based web service or as an API that could be integrated into their own products and services. The many potential applications of SAFEST include:
� Provision of an Internet Service.
� Application Programming Interface (API) for integration with other software and systems.
� Provision of Signature/Encryption schemes for Document Management.
� Encryption for the provisioning of Wireless Sensor Networks (WSNs) and the securing of data emitted from same.
� Securing of access of medical documentation for hospitals and health organisations.
� Provisioning of an audit trail for regulatory purposes.
� Middleware for Enterprise Resource Planning (ERP) Systems.
� Provision of a secure mobile network for organisations.
Figure 9 illustrates how SAFEST could be delivered as a premium subscription service over the Internet while Figure 10 shows how SAFEST could be used for integration with other systems, for example, the signing of enterprise content and document management systems.
111
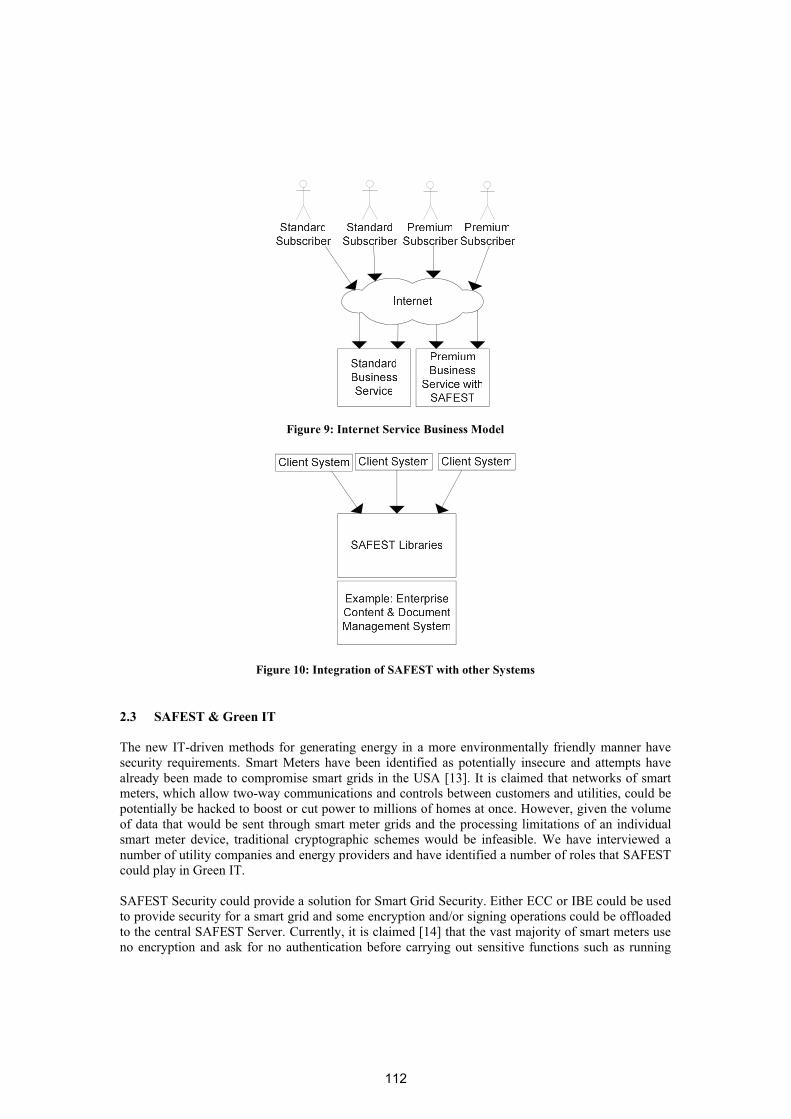
Figure 9: Internet Service Business Model
Figure 10: Integration of SAFEST with other Systems
2.3 SAFEST & Green IT
The new IT-driven methods for generating energy in a more environmentally friendly manner have security requirements. Smart Meters have been identified as potentially insecure and attempts have already been made to compromise smart grids in the USA [13]. It is claimed that networks of smart meters, which allow two-way communications and controls between customers and utilities, could be potentially be hacked to boost or cut power to millions of homes at once. However, given the volume of data that would be sent through smart meter grids and the processing limitations of an individual smart meter device, traditional cryptographic schemes would be infeasible. We have interviewed a number of utility companies and energy providers and have identified a number of roles that SAFEST could play in Green IT.
SAFEST Security could provide a solution for Smart Grid Security. Either ECC or IBE could be used to provide security for a smart grid and some encryption and/or signing operations could be offloaded to the central SAFEST Server. Currently, it is claimed [14] that the vast majority of smart meters use no encryption and ask for no authentication before carrying out sensitive functions such as running
112
software updates and severing customers from the power grid. These security vulnerabilities have been illustrated in a recent demonstration of a worm attack [15].
Figure 11: Wind Farm
Readings will be taken from smart meters used in domestic home every 30 minutes. Even in a comparatively small country like Ireland this equates to 1.5 million smart meters, each generatingreadings 48 times a day. This is equivalent to 50,000 readings per minute (833 per second). The use of a security protocol appropriate for a smart grid environment in conjunction with a hardware accelerator would make the encryption or signing of these readings feasible.
Security is also an issue for Wind Farms. Individual wind turbines can be connected to an organisation’s IT infrastructure using an OPC (Object Linking and Embedding for Process Control) Server [16]. Because, each individual wind turbine manufacturer has their own proprietary method for forwarding the data collected by an OPC Server, there is a challenge in providing a secure communication channel between each OPC Server and other Information and SCADA (Supervisory Control and Data Acquisition) Systems. One solution would be to use SAFEST to provide encryption or signing services within the OPC Server.
The key metrics for wind turbines are energy (and hence revenue) generation, availability and wind speed. Typically, data is uploaded after several hours or even the next day. In many cases, the data is sent from the turbines via FTP or through a Web Service. The securing of this data would therefore need to be lightweight given the mechanisms used to transfer what can be very large volumes of data.
In more general terms, the use of laptops, netbooks and smart phones is preferable to desktops from an environmental perspective as they consume less energy. Security services on these devices can be limited due to less processing power. However, it would be possible to use SAFEST on such devices where other security schemes would be infeasible from a performance point of view.
3 Conclusion
With the expansion of diverse computing environments the limitations of symmetric and PKI systems for these environments are becoming ever more apparent. ECC and IBE are good alternatives for these scenarios. The performance of ECC is superior to RSA in key pair creation, encryption and decryption on both a laptop and PDA ranging from 3 times faster for key pair creation on a PDA for a 20KB message to 53 times faster for encryption of a 20KB message on a PDA. The SAFEST system is a hardware and software system that implements ECC and IBE algorithms within FPGA hardware to further enhance their performance and provides end-to-end cryptographic services. The performance improvement is 10 fold on average. The system architecture is flexible, scalable and can potentially used as a standalone service or integrated into other software and Information Systems and has been integrated already with Adobe Flex, J2EE and Web Services.
Acknowledgements
113

We acknowledge the funding assistance provided by Enterprise Ireland under the CFTD scheme for this project.
References
[1] The Voltage Identity Based Encryption Advantage, http://www.voltage.com
[2] Lauter, K. (2004), The Advantages of Elliptic Curve Cryptography for Wireless Security, Wireless Communications, IEEE, Volume 11, Issue 1, Feb 2004:62-67
[3] Shamir, A. (1984), Identity-based cryptosystems and signature schemes, Advances in Cryptology—Crypto 1984, Lecture Notes in Computer Science, vol. 196, Springer-Verlag: 47-53.
[4] Boneh, D. and Franklin, M. (2001), Identity based encryption from the Weil pairing, SIAM J. of Computing, Vol. 32, No. 3:586-615, Advances in Cryptology - Crypto 2001,Springer-Verlag:213-229.
[5] Koblitz, N. (1987), Elliptic curve cryptosystems, Mathematics of Computation 48: 203–209
[6] Miller, V. (1985), Use of elliptic curves in cryptography, CRYPTO 85
[7] Java Sun SPOT Sensors Website, http://www.sunspotworld.com
[8] “TinyECC: A Configurable Library for Elliptic Curve Cryptography in Wireless Sensor Networks”, http://discovery.csc.ncsu.edu/software/TinyECC
[9] The Adobe Flex Framework, http://www.adobe.com/products/flex/
[10] Microsoft Silverlight, http://silverlight.net/
[11] JavaFX, http://javafx.com/
[12] Alpha Data Website, http://www.alpha-data.com/
[13] “Hacking the Grid: Is Smarter Less Secure?”, http://www.greentechmedia.com/articles/read/hacking-the-grid-is-smarter-less-secure-
6017/
[14] “Buggy 'smart meters' open door to power-grid botnet”,http://www.theregister.co.uk/2009/06/12/smart_grid_security_risks/
[15] “Black Hat: Smart Meter Worm Attack Planned”,http://www.informationweek.com/news/government/security/showArticle.jhtml?articleID=218700250
[16] The OPC Foundation, www.opcfoundation.org
[17] “Wind Farms – USA”, http://www.opcdatahub.com/Stories/Story_32.html
114

Session 5
WIFI & Wireless Networks
115

�
116
Efficient UWB indoor localisation using a ray-tracingpropagation tool
Tam N. Huynh1, Conor Brennan2
1 Faculty of Electrical and Electronic Engineering,Ho Chi Minh City University of Technology,
2 Network Innovation Centre,Research Institute for Networks and Communications Engineering (RINCE),
Dublin City UniversityIreland
Abstract
A novel method of applying Ray Tracing to the problem of Ultra-wide Band (UWB) indoor user-localization is presented. This novel method for UWB localization is based on correlation betweenthe received signal and a database of pre-computed ray-traced signals computed on a search curve. Inthe absence of real data the technique is validated by generating synthetic received signals using raytracing plus Rayleigh distributed random multipath clusters as well as random amplitude and delayfactors which account for database uncertainty. Results are presented that indicate that acceptablelocation and tracking performance can be achieved with a single sensor.
Keywords: Ray Tracing, Semi-Deterministic model, UWB localization
1 Introduction
Ultra wideband communication is based on the transmission of very short pulses with relatively lowenergy [Molisch, 2006]. Among the variety of potential UWB applications, precision indoor localizationhas been one of the most obvious for impulse radio (IR) UWB technology. These applications exploitthe fine time resolution of UWB signals. The ultra short pulse waveform enables UWB receivers toaccurately determine the Time of Arrival (TOA) of the transmitted signal from another UWB transmitter.For example, the accuracy of TOA measurements up to 40ps has been achieved, which corresponds to1.2cm spatial uncertainty as mentioned in [Shen et al., 2006].
There are several methods for UWB-based indoor localization. Most of them are based on the Time-of-Arrival (TOA) or Time-Different-of-Arrival (TDOA) and the Direction-of-Arrival (DOA) of the re-ceived signal at a collection of UWB sensors. The basic method based on the TOA or TDOA estima-tion is presented in [Kang et al., 2006, Molisch, 2006, Shen et al., 2006]. In this approach, the TOA orTDOA of received signal at a certain number of sensors (at least 3) is used to create a nonlinear systemof equations which is solved to produce an estimate of the position of the object. Another approachwas based on DOA and TOA at a monostation (or single sensor) to predict the position of the object[Sun et al., 2008]. The TOA is used for estimating the distance from object to the base-station and theDOA is used for specifying the angle of the object in polar coordinates. Some other methods can befound in [Pierucci and Roig, 2005, Jo et al., 2005] .
117
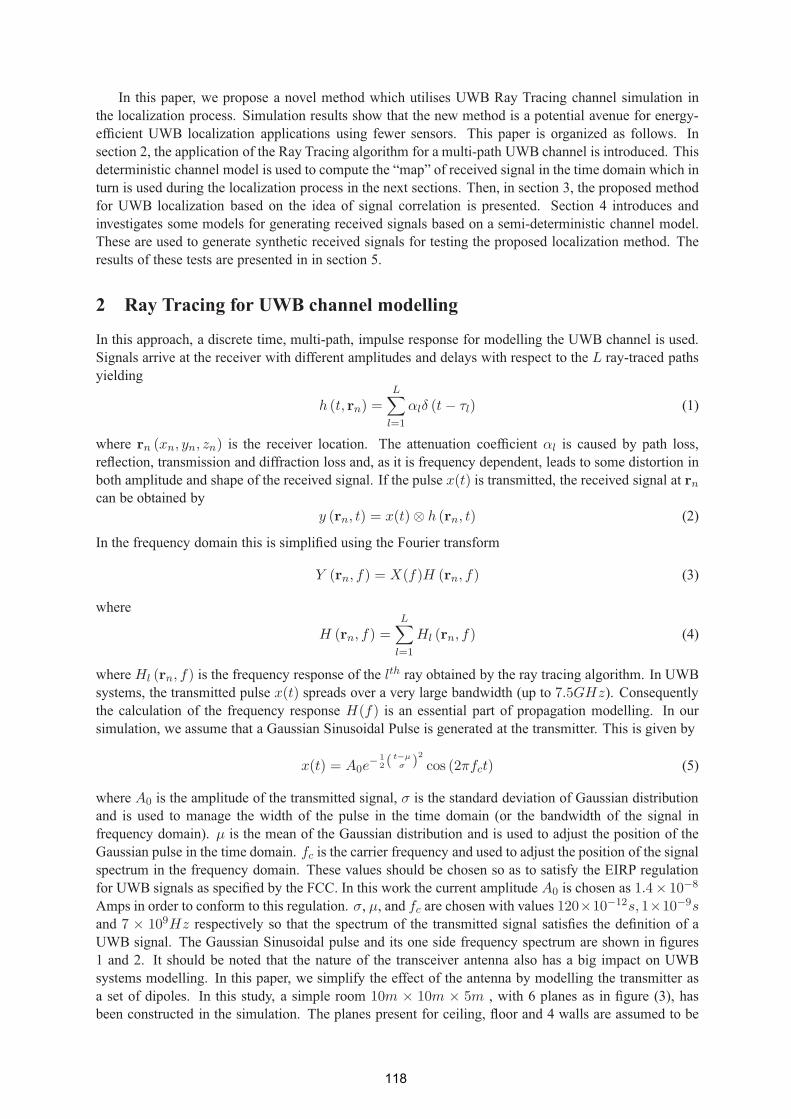
In this paper, we propose a novel method which utilises UWB Ray Tracing channel simulation inthe localization process. Simulation results show that the new method is a potential avenue for energy-efficient UWB localization applications using fewer sensors. This paper is organized as follows. Insection 2, the application of the Ray Tracing algorithm for a multi-path UWB channel is introduced. Thisdeterministic channel model is used to compute the “map” of received signal in the time domain which inturn is used during the localization process in the next sections. Then, in section 3, the proposed methodfor UWB localization based on the idea of signal correlation is presented. Section 4 introduces andinvestigates some models for generating received signals based on a semi-deterministic channel model.These are used to generate synthetic received signals for testing the proposed localization method. Theresults of these tests are presented in in section 5.
2 Ray Tracing for UWB channel modelling
In this approach, a discrete time, multi-path, impulse response for modelling the UWB channel is used.Signals arrive at the receiver with different amplitudes and delays with respect to the L ray-traced pathsyielding
h (t, rn) =L∑
l=1
αlδ (t − τl) (1)
where rn (xn, yn, zn) is the receiver location. The attenuation coefficient αl is caused by path loss,reflection, transmission and diffraction loss and, as it is frequency dependent, leads to some distortion inboth amplitude and shape of the received signal. If the pulse x(t) is transmitted, the received signal at rn
can be obtained byy (rn, t) = x(t) ⊗ h (rn, t) (2)
In the frequency domain this is simplified using the Fourier transform
Y (rn, f) = X(f)H (rn, f) (3)
where
H (rn, f) =L∑
l=1
Hl (rn, f) (4)
where Hl (rn, f) is the frequency response of the lth ray obtained by the ray tracing algorithm. In UWBsystems, the transmitted pulse x(t) spreads over a very large bandwidth (up to 7.5GHz). Consequentlythe calculation of the frequency response H(f) is an essential part of propagation modelling. In oursimulation, we assume that a Gaussian Sinusoidal Pulse is generated at the transmitter. This is given by
x(t) = A0e−
1
2( t−μ
σ )2
cos (2πfct) (5)
where A0 is the amplitude of the transmitted signal, σ is the standard deviation of Gaussian distributionand is used to manage the width of the pulse in the time domain (or the bandwidth of the signal infrequency domain). μ is the mean of the Gaussian distribution and is used to adjust the position of theGaussian pulse in the time domain. fc is the carrier frequency and used to adjust the position of the signalspectrum in the frequency domain. These values should be chosen so as to satisfy the EIRP regulationfor UWB signals as specified by the FCC. In this work the current amplitude A0 is chosen as 1.4× 10⁻⁸
Amps in order to conform to this regulation. σ, μ, and fc are chosen with values 120×10−12s, 1×10⁻⁹sand 7 × 10⁹Hz respectively so that the spectrum of the transmitted signal satisfies the definition of aUWB signal. The Gaussian Sinusoidal pulse and its one side frequency spectrum are shown in figures1 and 2. It should be noted that the nature of the transceiver antenna also has a big impact on UWBsystems modelling. In this paper, we simplify the effect of the antenna by modelling the transmitter asa set of dipoles. In this study, a simple room 10m × 10m × 5m , with 6 planes as in figure (3), hasbeen constructed in the simulation. The planes present for ceiling, floor and 4 walls are assumed to be
118

0.2 0.4 0.6 0.8 1 1.2 1.4 1.6 1.8
x 10−9
−1.5
−1
−0.5
0
0.5
1
1.5x 10⁻⁸
Time(s)
Am
plitu
de
Gaussian PulseSinusoidal Gaussian Pulse
Figure 1: Gaussian and Gaussian Sinusoidal pulsein time domain
−1 −0.5 0 0.5 1
x 1010
0
0.5
1
1.5
2
x 10−6
Frequency(Hz)
Am
plitu
de
Gaussian PulseSinusoidal Gaussian Pulse
Figure 2: Frequency spectra of Gaussian andGaussian sinusoidal pulses
made from concrete. It is worth mentioning that we assume the electrical properties of dry concrete donot depend appreciably on frequency within the band of interest, although such frequency variation isreadily incorporated into our model if necessary. The relative permittivity, εr and conductivity, σ of dryconcrete [Yao et al., 2003] are 5 and 0.7, respectively. Figure (4) shows an example of the multi-pathsignal generated by the ray-tracing code at a specific receiver point.
02
46
810
0
2
4
6
8
100
1
2
3
4
5
Figure 3: The multipath channel in 10m×10m×
5m room
0 1 2 3 4 5 6 7 8 9
x 10−8
−4
−3
−2
−1
0
1
2
3x 10⁻⁷ Multipath Received Signal in Time Domain
Time(s)
Am
plitu
de
Figure 4: The received signal up to second orderreflection
3 Proposed method for UWB ray tracing localisation
In this paper, we propose a novel method that computes the correlation between the signal received ata single UWB sensor and the signal computed by a ray-tracing simulation on a regular grid of points.The point at which this correlation value is maximised is deemed to be the location of the transmitter.The method reduces the cost and complexity of the localization system as only a single UWB sensor isrequired. Referring to figure (5), the localization process is set out below:
1. The TOA of the received UWB signal is used to estimated the distance d from the Base Station(BS) to the localized object or Mobile Station (MS)
2. The ray-tracing simulation is implemented at all points a distance d, as obtained from step (1), fromthe BS. To make this step more efficient these ray-tracing received signals should be pre-computedon a regular grid and loaded into RAM as required.
3. Correlations are computed between the received signal and the simulated received signals at all
119
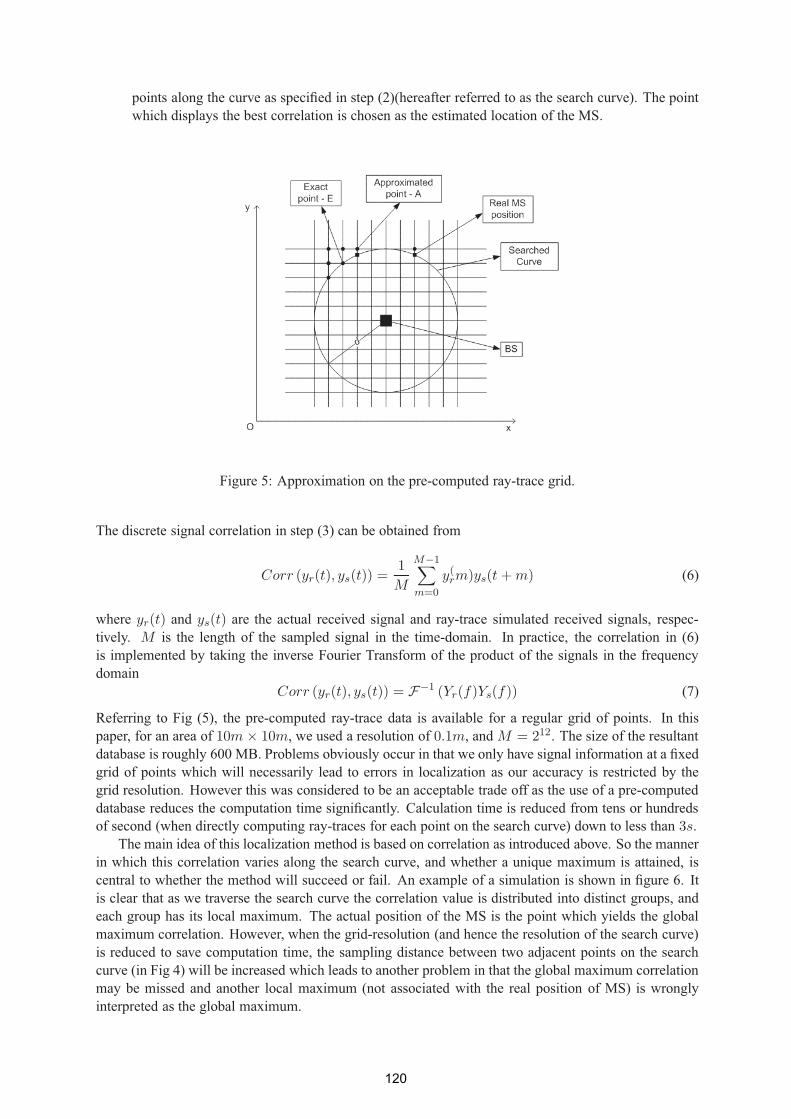
points along the curve as specified in step (2)(hereafter referred to as the search curve). The pointwhich displays the best correlation is chosen as the estimated location of the MS.
Figure 5: Approximation on the pre-computed ray-trace grid.
The discrete signal correlation in step (3) can be obtained from
Corr (yr(t), ys(t)) =1
M
M−1∑
m=0
y(rm)ys(t + m) (6)
where yr(t) and ys(t) are the actual received signal and ray-trace simulated received signals, respec-tively. M is the length of the sampled signal in the time-domain. In practice, the correlation in (6)is implemented by taking the inverse Fourier Transform of the product of the signals in the frequencydomain
Corr (yr(t), ys(t)) = F−1 (Yr(f)Ys(f)) (7)
Referring to Fig (5), the pre-computed ray-trace data is available for a regular grid of points. In thispaper, for an area of 10m × 10m, we used a resolution of 0.1m, and M = 212. The size of the resultantdatabase is roughly 600 MB. Problems obviously occur in that we only have signal information at a fixedgrid of points which will necessarily lead to errors in localization as our accuracy is restricted by thegrid resolution. However this was considered to be an acceptable trade off as the use of a pre-computeddatabase reduces the computation time significantly. Calculation time is reduced from tens or hundredsof second (when directly computing ray-traces for each point on the search curve) down to less than 3s.
The main idea of this localization method is based on correlation as introduced above. So the mannerin which this correlation varies along the search curve, and whether a unique maximum is attained, iscentral to whether the method will succeed or fail. An example of a simulation is shown in figure 6. Itis clear that as we traverse the search curve the correlation value is distributed into distinct groups, andeach group has its local maximum. The actual position of the MS is the point which yields the globalmaximum correlation. However, when the grid-resolution (and hence the resolution of the search curve)is reduced to save computation time, the sampling distance between two adjacent points on the searchcurve (in Fig 4) will be increased which leads to another problem in that the global maximum correlationmay be missed and another local maximum (not associated with the real position of MS) is wronglyinterpreted as the global maximum.
120
0 100 200 300 400 500 600 700 800 9001.8
1.82
1.84
1.86
1.88
1.9
1.92x 10⁻¹² Max correlation along tracking line
Cor
rela
tion
Figure 6: Correlation values along the search curve
4 Pseudo received signal using semi-deterministic channel model
In the absence of measured data it was necessary to generate some synthetic received signals in orderto validate the method outlined in the previous section. A procedure for generating a synthetic receivedsignal is implemented, called “Semi-Deterministic” UWB channel modelling. In this approach, wecombine the ray-trace channel model which is presented in section 2 and ray cluster theory following theSaleh-Valenzuela (SV) model as described in [Molisch, 2006, Kunisch and Pamp, 2002]. The “main”rays of the clusters are obtained using the ray-trace algorithm and the other rays in each cluster areobtained from a Rayleigh random process. The channel impulse response of our proposed model can beexpressed as
h(t) =L∑
l=0
α0,lζlδ (t − Tl − vrnd) +L∑
l=0
K∑
k=1
αk,lδ (t − Tl − τk,l) + n(t) (8)
where αk,l is the tap weight of the kth component in the lth cluster, Tl is the delay of the lth cluster. τk,l
is the delay of the kth multi-path component relative to the lth cluster arrival time Tl. n(t) representsadditive white Gaussian noise (AWGN) within the channel. In (8), the “main” rays of each cluster(k = 0) are represented by the first term. In this term, the attenuation and the cluster delay Tl (or delay of“main” rays) is obtained from ray-tracing simulation. To make the synthetic received signal more realisticwe model database uncertainty. To do this a random amplitude coefficient ζl, uniformly distributed in theinterval of (0.5, 1), is included (to account for imprecise knowledge of material electrical properties aswell as shadowing effects etc). A random amount vrnd was also added to the cluster delay Tl (to accountfor imprecise information about the exact location of reflecting walls and ceilings etc). This was alsouniformly distributed.
The second term in equation (8) represents the “auxiliary” rays in each cluster which are groupedaround the main ray. The delay of each auxiliary ray is given by a Rayleigh distribution as mentionedabove. The attenuation αk,l for k > 0 can be obtained as
αk,l = α0,lRrnde−
τk,l
γ (9)
Rrnd represents a random amplitude reflection coefficient caused by unknown material electrical prop-erties. In this paper, we assume that Rrnd is uniformly distributed in the range (0.5, 1.2). The last term
121
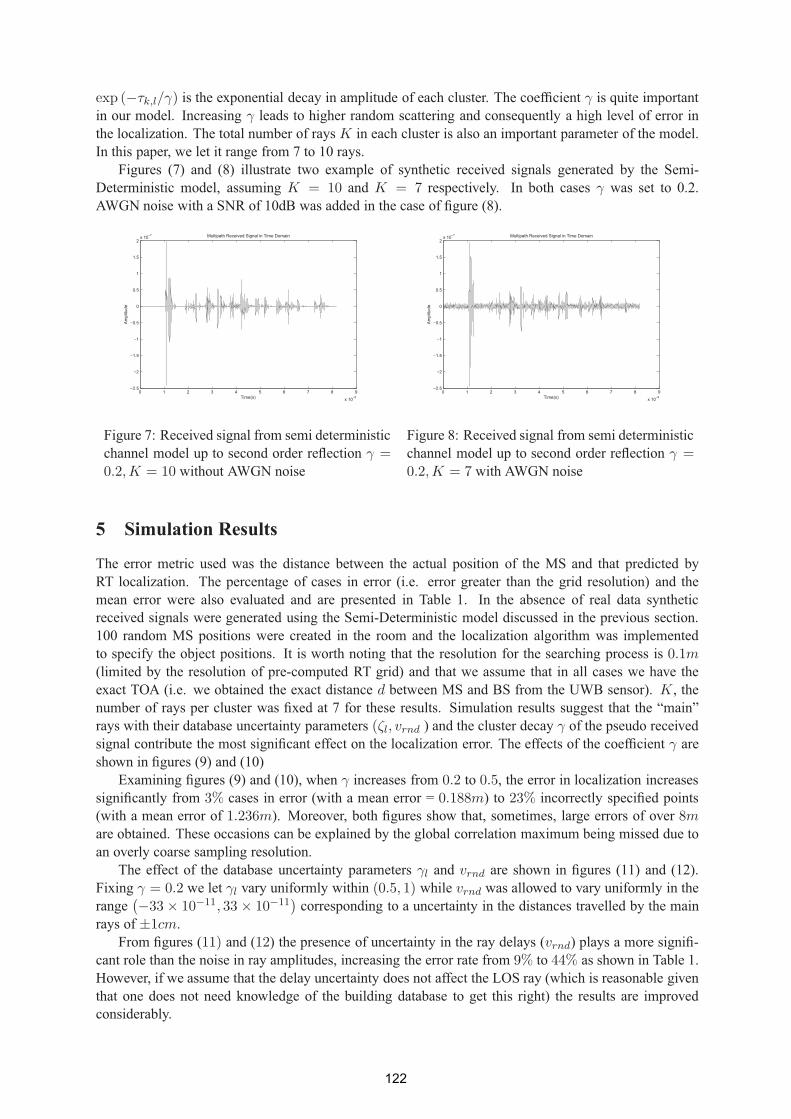
exp (−τk,l/γ) is the exponential decay in amplitude of each cluster. The coefficient γ is quite importantin our model. Increasing γ leads to higher random scattering and consequently a high level of error inthe localization. The total number of rays K in each cluster is also an important parameter of the model.In this paper, we let it range from 7 to 10 rays.
Figures (7) and (8) illustrate two example of synthetic received signals generated by the Semi-Deterministic model, assuming K = 10 and K = 7 respectively. In both cases γ was set to 0.2.AWGN noise with a SNR of 10dB was added in the case of figure (8).
0 1 2 3 4 5 6 7 8 9
x 10−8
−2.5
−2
−1.5
−1
−0.5
0
0.5
1
1.5
2x 10⁻⁷ Multipath Received Signal in Time Domain
Time(s)
Am
plitu
de
Figure 7: Received signal from semi deterministicchannel model up to second order reflection γ =0.2,K = 10 without AWGN noise
0 1 2 3 4 5 6 7 8 9
x 10−8
−2.5
−2
−1.5
−1
−0.5
0
0.5
1
1.5
2x 10⁻⁷ Multipath Received Signal in Time Domain
Time(s)
Am
plitu
de
Figure 8: Received signal from semi deterministicchannel model up to second order reflection γ =0.2,K = 7 with AWGN noise
5 Simulation Results
The error metric used was the distance between the actual position of the MS and that predicted byRT localization. The percentage of cases in error (i.e. error greater than the grid resolution) and themean error were also evaluated and are presented in Table 1. In the absence of real data syntheticreceived signals were generated using the Semi-Deterministic model discussed in the previous section.100 random MS positions were created in the room and the localization algorithm was implementedto specify the object positions. It is worth noting that the resolution for the searching process is 0.1m(limited by the resolution of pre-computed RT grid) and that we assume that in all cases we have theexact TOA (i.e. we obtained the exact distance d between MS and BS from the UWB sensor). K, thenumber of rays per cluster was fixed at 7 for these results. Simulation results suggest that the “main”rays with their database uncertainty parameters (ζl, vrnd ) and the cluster decay γ of the pseudo receivedsignal contribute the most significant effect on the localization error. The effects of the coefficient γ areshown in figures (9) and (10)
Examining figures (9) and (10), when γ increases from 0.2 to 0.5, the error in localization increasessignificantly from 3% cases in error (with a mean error = 0.188m) to 23% incorrectly specified points(with a mean error of 1.236m). Moreover, both figures show that, sometimes, large errors of over 8mare obtained. These occasions can be explained by the global correlation maximum being missed due toan overly coarse sampling resolution.
The effect of the database uncertainty parameters γl and vrnd are shown in figures (11) and (12).Fixing γ = 0.2 we let γl vary uniformly within (0.5, 1) while vrnd was allowed to vary uniformly in therange
(−33 × 10−11, 33 × 10−11
)corresponding to a uncertainty in the distances travelled by the main
rays of ±1cm.From figures (11) and (12) the presence of uncertainty in the ray delays (vrnd) plays a more signifi-
cant role than the noise in ray amplitudes, increasing the error rate from 9% to 44% as shown in Table 1.However, if we assume that the delay uncertainty does not affect the LOS ray (which is reasonable giventhat one does not need knowledge of the building database to get this right) the results are improvedconsiderably.
122

0 1 2 3 4 5 6 7 8 9 100
5
10Real random moving object
0 1 2 3 4 5 6 7 8 9 100
5
10Tracked object position
0 10 20 30 40 50 60 70 80 90 1000
5
10Tracking Error
Point
Err
or(m
)
Figure 9: Localisation error when the pseudo re-ceived signal model has γ = 0.2
0 1 2 3 4 5 6 7 8 9 100
5
10Real random moving object
0 1 2 3 4 5 6 7 8 9 100
5
10Tracked object position
0 10 20 30 40 50 60 70 80 90 1000
5
10
15Tracking Error
Point
Err
or(m
)
Figure 10: Localisation error when the pseudo re-ceived signal model has γ = 0.5
0 1 2 3 4 5 6 7 8 9 100
5
10Real random moving object
0 1 2 3 4 5 6 7 8 9 100
5
10Tracked object position
0 10 20 30 40 50 60 70 80 90 1000
5
10Tracking Error
Point
Err
or(m
)
Figure 11: Localisation error when the pseudo re-ceived signal model includes γl only
0 1 2 3 4 5 6 7 8 9 100
5
10Real random moving object
0 1 2 3 4 5 6 7 8 9 100
5
10Tracked object position
0 10 20 30 40 50 60 70 80 90 1000
5
10
15Tracking Error
Point
Err
or(m
)
Figure 12: Localisation error when the pseudo re-ceived signal model includes γl and delay uncer-tainty vrnd.
Essentially the ray-trace localisation procedure works well when the ray-trace accurately models thereal life signal as generated synthetically using the Semi-Deterministic model. When this occurs it ispossible to pick out a unique global maximum along the search curve which corresponds to the actualMS location (See figure (13) for an example). In contrast when the ray-trace result deviates significantlyfrom the received signal due to the presence of too much unknown multipath or database error in theray-trace result it is impossible to identify a unique global maximum (See figure (14) for an example).
6 Conclusion
A novel method of applying Ray Tracing in UWB localization has been presented. A database obtainedby exhaustive ray-tracing UWB channel simulation is created and is used to identify the most likelyreceiver location by computing correlations between the received signal and the simulated signals alonga search curve (specified by the TOA). In the absence of real-data the method is validated using syntheticreceived signals which are generated using semi-deterministic channel models. In addition the effectof inaccuracies in the building database, resulting in incorrect amplitudes and delays, are investigated.As expected the results indicate that the methods accuracy depends on how well the ray-traced signalsmatch the actual received signals. It should be noted that even in the worse case the match is, on average,reasonable and could be improved by imposing physical constraints on motion and smoothing filterswhen tracking a user through the environment.
123
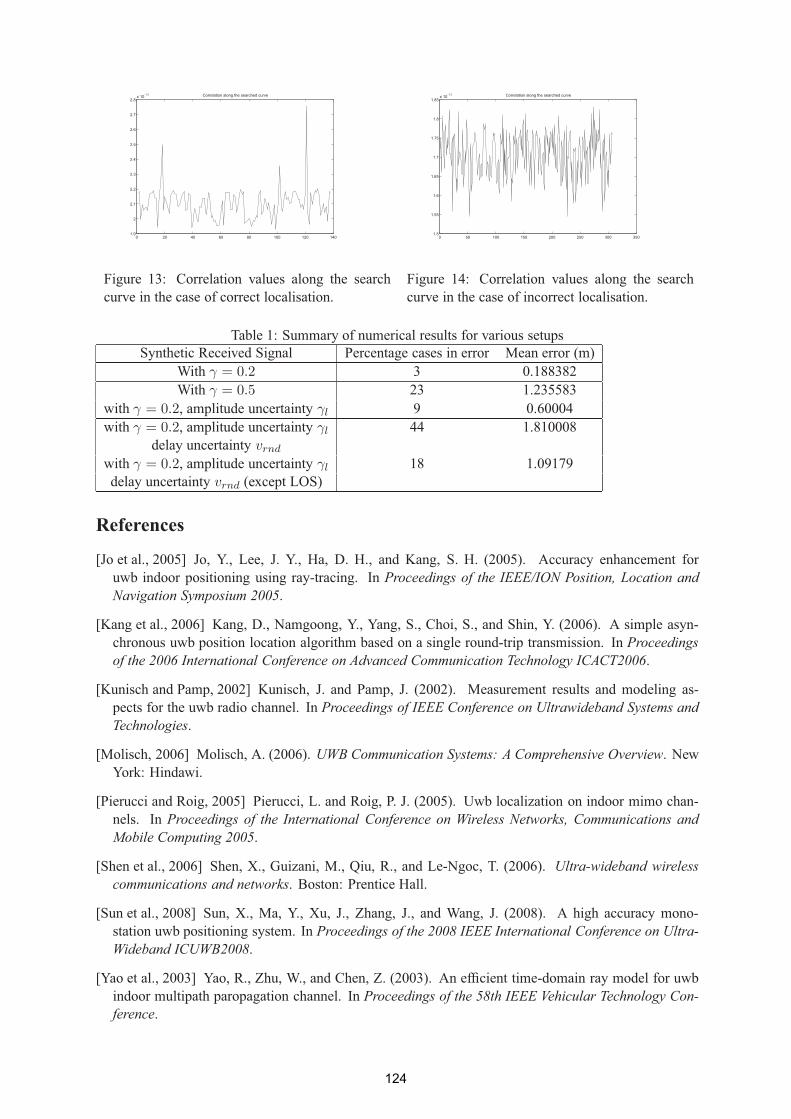
0 20 40 60 80 100 120 1401.9
2
2.1
2.2
2.3
2.4
2.5
2.6
2.7
2.8x 10⁻¹³ Correlation along the searched curve
Figure 13: Correlation values along the searchcurve in the case of correct localisation.
0 50 100 150 200 250 300 3501.5
1.55
1.6
1.65
1.7
1.75
1.8
1.85x 10⁻¹³ Correlation along the searched curve
Figure 14: Correlation values along the searchcurve in the case of incorrect localisation.
Table 1: Summary of numerical results for various setupsSynthetic Received Signal Percentage cases in error Mean error (m)
With γ = 0.2 3 0.188382With γ = 0.5 23 1.235583
with γ = 0.2, amplitude uncertainty γl 9 0.60004with γ = 0.2, amplitude uncertainty γl 44 1.810008
delay uncertainty vrnd
with γ = 0.2, amplitude uncertainty γl 18 1.09179delay uncertainty vrnd (except LOS)
References
[Jo et al., 2005] Jo, Y., Lee, J. Y., Ha, D. H., and Kang, S. H. (2005). Accuracy enhancement foruwb indoor positioning using ray-tracing. In Proceedings of the IEEE/ION Position, Location andNavigation Symposium 2005.
[Kang et al., 2006] Kang, D., Namgoong, Y., Yang, S., Choi, S., and Shin, Y. (2006). A simple asyn-chronous uwb position location algorithm based on a single round-trip transmission. In Proceedingsof the 2006 International Conference on Advanced Communication Technology ICACT2006.
[Kunisch and Pamp, 2002] Kunisch, J. and Pamp, J. (2002). Measurement results and modeling as-pects for the uwb radio channel. In Proceedings of IEEE Conference on Ultrawideband Systems andTechnologies.
[Molisch, 2006] Molisch, A. (2006). UWB Communication Systems: A Comprehensive Overview. NewYork: Hindawi.
[Pierucci and Roig, 2005] Pierucci, L. and Roig, P. J. (2005). Uwb localization on indoor mimo chan-nels. In Proceedings of the International Conference on Wireless Networks, Communications andMobile Computing 2005.
[Shen et al., 2006] Shen, X., Guizani, M., Qiu, R., and Le-Ngoc, T. (2006). Ultra-wideband wirelesscommunications and networks. Boston: Prentice Hall.
[Sun et al., 2008] Sun, X., Ma, Y., Xu, J., Zhang, J., and Wang, J. (2008). A high accuracy mono-station uwb positioning system. In Proceedings of the 2008 IEEE International Conference on Ultra-Wideband ICUWB2008.
[Yao et al., 2003] Yao, R., Zhu, W., and Chen, Z. (2003). An efficient time-domain ray model for uwbindoor multipath paropagation channel. In Proceedings of the 58th IEEE Vehicular Technology Con-ference.
124
VOSHM - A Velocity Optimized Seamless Handover Mechanism for WiMAX Networks
Chi Ma, Enda Fallon, Yansong Qiao
Software Research Institute, Athlone Institute of Technology, Athlone, Ireland {cma, efallon, ysqiao}@ait.ie
Abstract
For seamless handover in heterogeneous wireless networks, service continuity and minimal handover disruption time are the primary requirements. The emerging Media Independent Handover (MIH) standard proposes to address these requirements through the introduction of link performance prediction features. In particular the MIH Event Service introduces a Link_Going_Down event which utilizes L2 performance characteristics to trigger predictive events. While the MIH standard proposes a framework by which L2 events can be communicated to the upper layer, it does provide detail on the performance characteristics which trigger these events. In this paper, we design a MIH based Velocity Optimized Seamless Handover Mechanism (VOSHM) for WiMAX networks. We analyse how the handover probability value, which is a critical parameter used to trigger link going down event, is effected by the velocity of the mobile node. A number of simulation scenarios illustrating handover between WiMAX and 3G networks are evaluated. Our results indicate that VOSHM can reduce more than 95% handover delay in comparison to without utilizing the Link_Going_Down trigger.
Keywords: MIH, IEEE802.21, IEEE 802.16, WiMAX, Handover
1 Introduction
Wireless Networks have been developed rapidly during the last decade and have become widely adopted as many device manufacturers integrate more network interfaces into their devices. Many cell phone models support both Wi-Fi [1] and third generation (3G) wireless networks. Notebook computers are available with built-in support for Wi-Fi, WiMAX [2], and 3G. As this trend towards multi-interface devices continues, the need for sophisticated resource and mobility management mechanisms arise. Media Independent Handover (MIH) is a draft standard under development by the IEEE 802.21 working group [3]. MIH proposes to support the seamless session continuity during network migration. It defines a framework which significantly improves handover performance between heterogeneous network technologies. It also defines a set of tools to exchange information, events, and commands to facilitate handover initiation and handover preparation. IEEE 802.21 does not attempt to standardize the actual handover execution mechanism. Therefore, the MIH framework is equally applicable to systems that employ mobile IP at the IP layer as to systems that employ Session Initiation Protocol (SIP) at the application layer [14].
In this paper, we design a Velocity Optimized Seamless Handover Mechanism (VOSHM) for WiMAX networks. In particular we focus on the predictive Link_Going_Down event which relies on a fast handover mechanism using L2 triggering. Implementations specified by the National Institute of Standards in Technology (NIST) propose a handover probability value which is calculated using
125
received signal strength and the threshold of received signal strength to determine when Link_Going_Down should be triggered. This paper focuses on the optimization of the calculation of the handover probability value considering the Mobile Node’s (MN) velocity. Several simulated scenarios are undertaken which utilize NS2 [4] and the WiMAX mobility package from NIST [5]. Our results indicate that handover time reductions of up to 95% are achievable using the VOSHM approach.
2 Related Work
In recent years, research had focused on MIH seamless horizontal and vertical handovers in heterogeneous networks. In [14], authors describe and discuss the design considerations for a proof-of-concept IEEE 802.21 implementation and share practical insights into how this standard can optimize handover performance. [12] focuses on the MIH interfaces specifications in relation to the two emerging future mobile communication network technologies, WiMAX and 3G-LTE/SAE. In [9], authors design an enhanced Media Independent Handover Framework (eMIHF), which extends IEEE 802.21 by allowing for efficient provisioning and activation of QoS resources in the target radio access technology during the handover preparation phase. [7] focuses on how IEEE 802.21 supports seamless mobility between IEEE 802.11 and IEEE 802.16. [6] discusses how MIH can enhance mobility management; the authors evaluate mobile WiMAX via simulating its capacity to support real time applications in high-speed vehicular scenarios and assesses the potential of using cross-layer information made available by MIH. [13] presents a simulation study of handover performance between 3G and WLAN access networks showing the impact of mobile users’ speeds, the mobile devices are based on the IEEE 802.21 cross layer architecture and use WLAN signal level threshold as handover criteria.
A number of studies have investigated handover algorithms to optimize network migration. [8] develops a vertical handoff decision algorithm that enables a wireless access network to not only balance the overall load among all attachment points but also to maximize the collective battery lifetime of MNs. Handover performance and its impact on real time applications are investigated in [10], authors investigate the use of signal strength as part of the Link_Going_Down trigger to improve the handover performance and propose methods to set appropriate thresholds for the trigger. [11] proposes a link trigger mechanism which can be applied to IEEE 802.21 for seamless horizontal and vertical handovers in heterogeneous wireless networks which is adaptively and timely fired in accordance with the network conditions. [15] and [16] propose a new predictive handover framework that uses the neighbor network information to generate timely the link triggers so that the required handover procedures can appropriately finish before the current link goes down. [17] proposes a novel architecture which is called Seamless Wireless internet for Fast Trains (SWiFT), it relies on a fast handoff mechanism by L2 triggering using a handover probability value evaluated by high speed movement and received signal strength to decide handoff.
3 Media Independent Handover Background
The Media Independent Handover (MIH) is a standard being developed by IEEE 802.21 which aims at enabling handovers between heterogeneous networks by defining a networks model which includes different entities with specific roles and supports several services [6]. The importance of MIH derives from the fact that a diverse range of broadband wireless access technologies are available and in the course of development, including GSM, UMTS, CDMA2000, WiFi WiMAX, Mobile-Fi and WPANs. Multimode wireless devices that incorporate more than one of these wireless interfaces require the ability to switch among them during the course of an IP session, and devices such as laptops with Ethernet and wireless interfaces need to switch similarly between wired and wireless access. MIH provides mechanisms to prepare the target network before handover execution occurs, reducing latency [7]. MIH defines the Media Independent Event Service for the propagation of events, the Media Independent Command Service which allows the MIH user to issue specific actions on lower
126
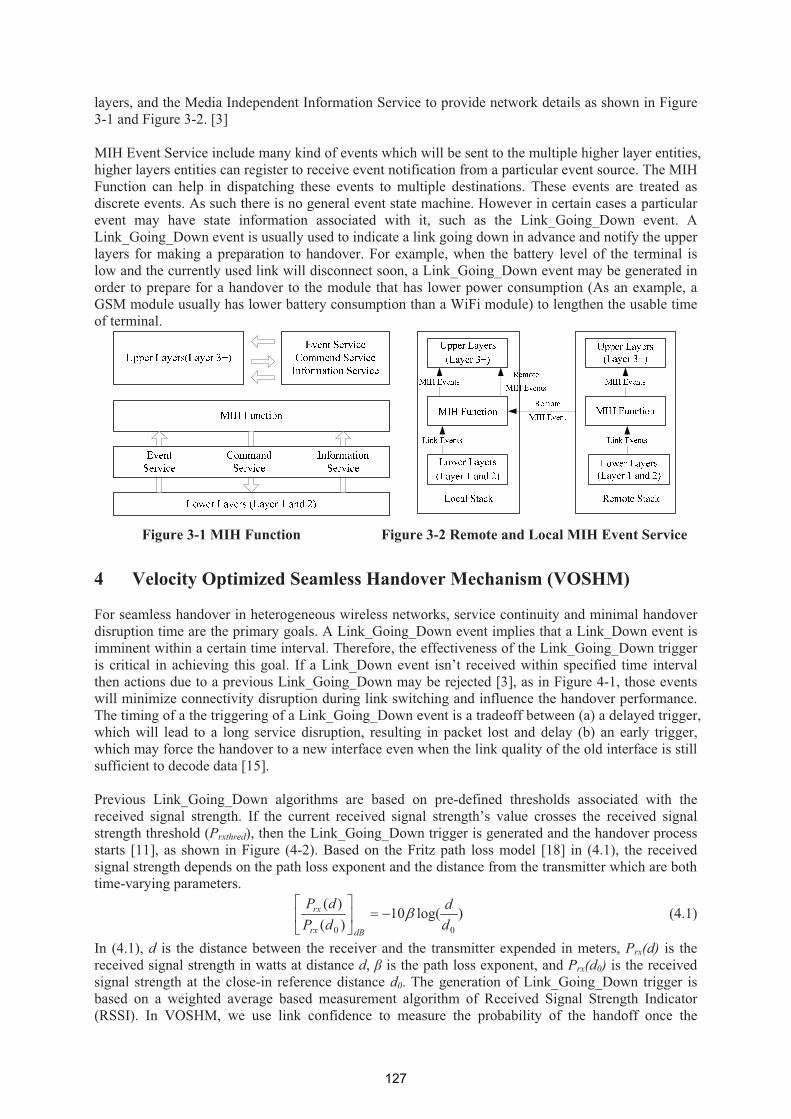
layers, and the Media Independent Information Service to provide network details as shown in Figure 3-1 and Figure 3-2. [3]
MIH Event Service include many kind of events which will be sent to the multiple higher layer entities, higher layers entities can register to receive event notification from a particular event source. The MIH Function can help in dispatching these events to multiple destinations. These events are treated as discrete events. As such there is no general event state machine. However in certain cases a particular event may have state information associated with it, such as the Link_Going_Down event. A Link_Going_Down event is usually used to indicate a link going down in advance and notify the upper layers for making a preparation to handover. For example, when the battery level of the terminal is low and the currently used link will disconnect soon, a Link_Going_Down event may be generated in order to prepare for a handover to the module that has lower power consumption (As an example, a GSM module usually has lower battery consumption than a WiFi module) to lengthen the usable time of terminal.
Figure 3-1 MIH Function Figure 3-2 Remote and Local MIH Event Service
4 Velocity Optimized Seamless Handover Mechanism (VOSHM)
For seamless handover in heterogeneous wireless networks, service continuity and minimal handover disruption time are the primary goals. A Link_Going_Down event implies that a Link_Down event is imminent within a certain time interval. Therefore, the effectiveness of the Link_Going_Down trigger is critical in achieving this goal. If a Link_Down event isn’t received within specified time interval then actions due to a previous Link_Going_Down may be rejected [3], as in Figure 4-1, those events will minimize connectivity disruption during link switching and influence the handover performance. The timing of a the triggering of a Link_Going_Down event is a tradeoff between (a) a delayed trigger, which will lead to a long service disruption, resulting in packet lost and delay (b) an early trigger, which may force the handover to a new interface even when the link quality of the old interface is still sufficient to decode data [15].
Previous Link_Going_Down algorithms are based on pre-defined thresholds associated with the received signal strength. If the current received signal strength’s value crosses the received signal strength threshold (Prxthred), then the Link_Going_Down trigger is generated and the handover process starts [11], as shown in Figure (4-2). Based on the Fritz path loss model [18] in (4.1), the received signal strength depends on the path loss exponent and the distance from the transmitter which are both time-varying parameters.
)log(10)()(
00 dd
dPdP
dBrx
rx �����
�
� (4.1)
In (4.1), d is the distance between the receiver and the transmitter expended in meters, Prx(d) is the received signal strength in watts at distance d, � is the path loss exponent, and Prx(d0) is the received signal strength at the close-in reference distance d0. The generation of Link_Going_Down trigger is based on a weighted average based measurement algorithm of Received Signal Strength Indicator (RSSI). In VOSHM, we use link confidence to measure the probability of the handoff once the
127
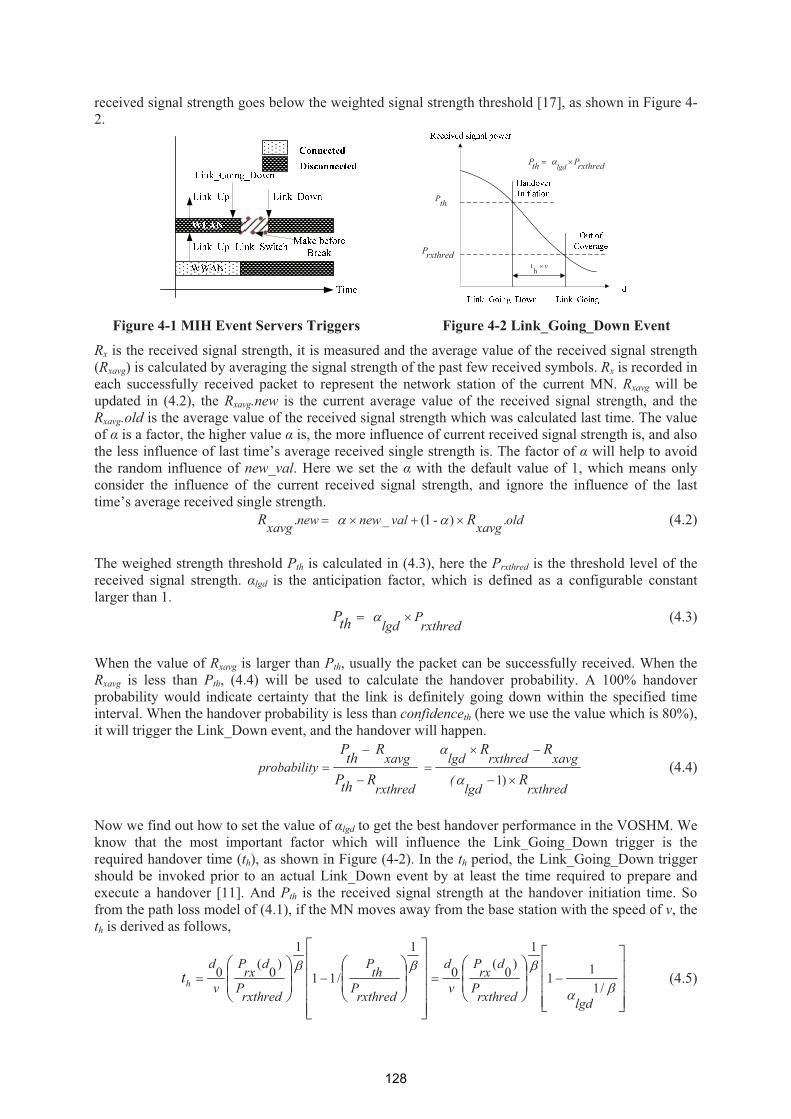
received signal strength goes below the weighted signal strength threshold [17], as shown in Figure 4-2.
rxthredPv�
ht
rxthredP thPlgd
��
thP
Figure 4-1 MIH Event Servers Triggers Figure 4-2 Link_Going_Down Event
Rx is the received signal strength, it is measured and the average value of the received signal strength (Rxavg) is calculated by averaging the signal strength of the past few received symbols. Rx is recorded in each successfully received packet to represent the network station of the current MN. Rxavg will be updated in (4.2), the Rxavg.new is the current average value of the received signal strength, and the Rxavg.old is the average value of the received signal strength which was calculated last time. The value of � is a factor, the higher value � is, the more influence of current received signal strength is, and also the less influence of last time’s average received single strength is. The factor of � will help to avoid the random influence of new_val. Here we set the � with the default value of 1, which means only consider the influence of the current received signal strength, and ignore the influence of the last time’s average received single strength.
oldxavgvalnewnewxavg RR .)-(_. 1 ���� (4.2)
The weighed strength threshold Pth is calculated in (4.3), here the Prxthred is the threshold level of the received signal strength. �lgd is the anticipation factor, which is defined as a configurable constant larger than 1.
rxthredP
lgd thP �� (4.3)
When the value of Rxavg is larger than Pth, usually the packet can be successfully received. When the Rxavg is less than Pth, (4.4) will be used to calculate the handover probability. A 100% handover probability would indicate certainty that the link is definitely going down within the specified time interval. When the handover probability is less than confidenceth (here we use the value which is 80%), it will trigger the Link_Down event, and the handover will happen.
rxthredlgd(
xavg
rxthredlgd
rxthred
xavg
yprobabilit
R
RR
RthP
RthP
��
���
�
��
)1
(4.4)
Now we find out how to set the value of �lgd to get the best handover performance in the VOSHM. We know that the most important factor which will influence the Link_Going_Down trigger is the required handover time (th), as shown in Figure (4-2). In the th period, the Link_Going_Down trigger should be invoked prior to an actual Link_Down event by at least the time required to prepare and execute a handover [11]. And Pth is the received signal strength at the handover initiation time. So from the path loss model of (4.1), if the MN moves away from the base station with the speed of v, the th is derived as follows,
���
�
�
�
���
����
�
����
�
�
�
���
����
����
����
�����
�
���
/11
1
1)0(0
1
/11
1)0(0
lgdrxthredP
drxP
v
d
rxthredPthP
rxthredP
drxP
v
dht (4.5)
128
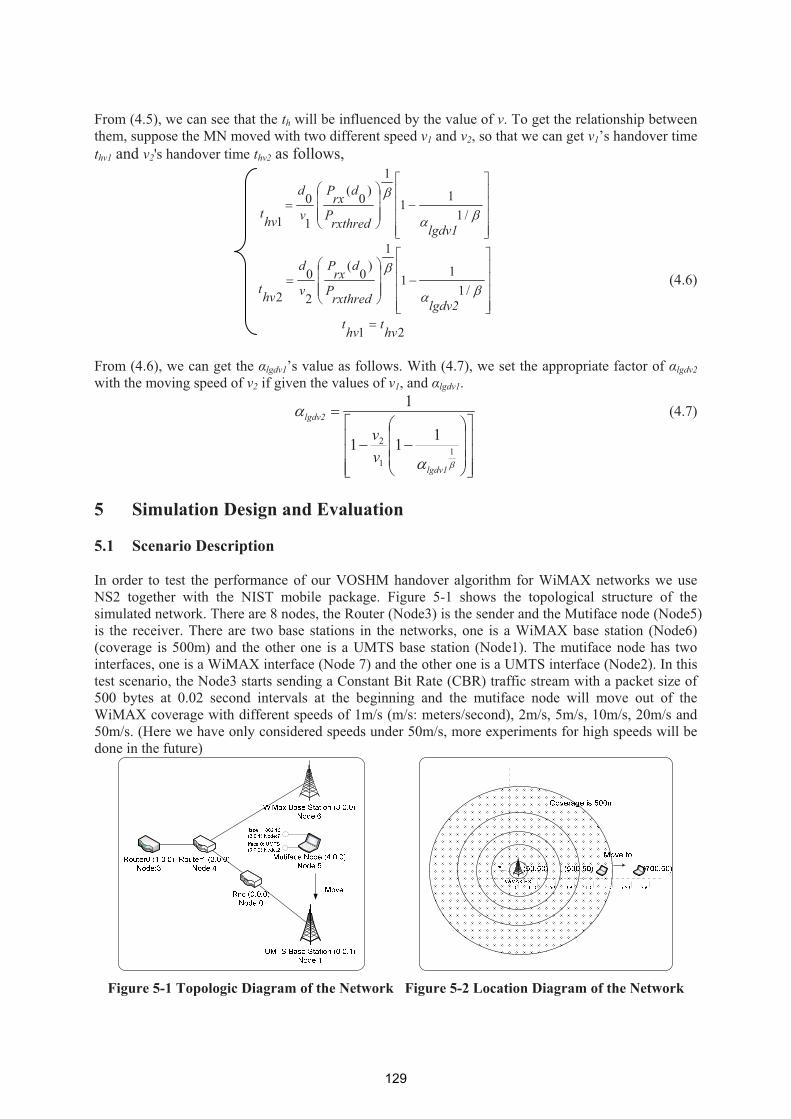
From (4.5), we can see that the th will be influenced by the value of v. To get the relationship between them, suppose the MN moved with two different speed v1 and v2, so that we can get v1’s handover time thv1 and v2's handover time thv2 as follows,
21
/11
1
1)0(
2
0
2
/11
1
1)0(
1
0
1
hvthvtlgdv2rxthredP
drxP
v
d
hvt
lgdv1rxthredP
drxP
v
d
hvt
�����
�
�
�
����
�
�
���
�
��
����
�
�
�
����
�
�
���
�
��
�
�
�
�
(4.6)
From (4.6), we can get the �lgdv1’s value as follows. With (4.7), we set the appropriate factor of �lgdv2with the moving speed of v2 if given the values of v1, and �lgdv1.
���
�
�
�
���
�
�
���
�
���
�
�
11
2 111
1
lgdv1
lgdv2
vv
(4.7)
5 Simulation Design and Evaluation
5.1 Scenario Description
In order to test the performance of our VOSHM handover algorithm for WiMAX networks we use NS2 together with the NIST mobile package. Figure 5-1 shows the topological structure of the simulated network. There are 8 nodes, the Router (Node3) is the sender and the Mutiface node (Node5) is the receiver. There are two base stations in the networks, one is a WiMAX base station (Node6) (coverage is 500m) and the other one is a UMTS base station (Node1). The mutiface node has two interfaces, one is a WiMAX interface (Node 7) and the other one is a UMTS interface (Node2). In this test scenario, the Node3 starts sending a Constant Bit Rate (CBR) traffic stream with a packet size of 500 bytes at 0.02 second intervals at the beginning and the mutiface node will move out of the WiMAX coverage with different speeds of 1m/s (m/s: meters/second), 2m/s, 5m/s, 10m/s, 20m/s and 50m/s. (Here we have only considered speeds under 50m/s, more experiments for high speeds will be done in the future)
Figure 5-1 Topologic Diagram of the Network Figure 5-2 Location Diagram of the Network
129

In Figurlocated afrom (50
5.2 T
In the ahandoveappropri(e.g. 1m/
We definWiMAXreceived
To deterperformaget the b(1) the hhandovehandove
lgd 1.000 1.005 1.010 1.015 1.020 1.025 1.030 1.035 1.040 1.045 1.050
Tabl
Using (410m/s, 2
T
re 5-2, we caat (50m, 50m00m, 50m) to
est Results
above test scer occurs wheiate value of/s).
ne the handoX network. Td through the
rmine the optance when �best performahandover durer (�lgd =1.00er duration tim
StartTime (s
59.99035559.98812759.89087959.76847259.64960459.53018559.40842559.28847059.16881359.07046258.948617
le 5-1 Hando
4.7) with �lgd20m/s and 50
Sp
2m5m102050
Table 5-3 Ha
an see the Mm), and the Mo (700m, 50m
and Evalu
cenarios, theen the MN m
f the �lgd. We
over start timThe handover
UMTS netw
timal value o�lgd’s value iance when �ration time i0) start time me will not d
s)End
Time666 60.740295 60.040092 59.920284 59.800
4186 59.680779 59.560740 59.440
0041 59.320825 59.200874 59.100319 58.980
over Start E
dv1=1.010, an0m/ (here we
Speed
lgd
Table 5-2 �
peed �lgd
m/s 1.000m/s 1.0000m/s 1.0000m/s 1.0000m/s 1.000
andover Star
MN and WiMMN is locatem) with diffe
uation
e MN movesmoves out ofe first calcul
me (tstart) as tr end time (tework. Handov
handt
of �lgd when s set betwee
�lgd is set witis the shorteresulting in
decrease obv
d(s)
HandTime
0015 749.650015 51.880015 29.130015 31.540015 30.410015 29.820015 31.580015 31.540015 31.200015 29.550015 31.39
End Time (1
d v1=1m/s, w set the � wit
2m/s 51.020 1
�lgd’s Value
d Star
0 34.99110 19.98940 14.9900 12.4870 10.988
rt End and
MAX base stad at (500m,
erent speeds.
s far away ff WiMAX neate the optim
the time of tend) is also dver time (than
start
dover�
the speed ofen 1.000 ~ 1th the value ost (2), the hafull utilizatio
viously when
dovere (ms) 59334 87705 35908 42716 10814 29221 8926
44959 01175 52126 97681
m/s)
we calculateth the value
5m/s 10m.052 1.12
when Move
rt(s)
138903 35452051 2012625 1541909 1386948 1
Delay Time
ation’s locat50m). In the
from the Wietwork covermal value of
the last packefined as thendover) is calcu
endt
rt�
f mobility is .050. From Tof 1.010. Thandover staron of the Wi
n the �lgd is la
Figure
the value ofof 1).
m/s 20m/s20 1.247
e with Differ
End(s)
5.740015 0.760015 5.7600153.2400151.740015
without Lin
tion. The Wie test scenari
iMAX base rage. Using (f �lgd when m
ket which is e time of theulated as foll
1m/s, we firsTable 5-1 an
he reason for rt time is veriMAX netwoarger than thi
5-3 Handov
f �lgd with th
50m/s 1.980
rent Speeds
HandoverDelay Time(m
748.8761770.5629769.8887752.5959751.1455
nk_Going_D
lgd
iMAX base io, the MN w
station. In t(4.7) we calc
moving at fix
received thre first packetlows:
st check the hnd Figure 5-
this value isry near to thork. We also is value.
ver Time (1m
he speeds 2m
rms)
Down Trigge
station is will move
this way, culate the xed speed
rough the t which is
(5.1)
handover 3 we can s because
he normal note that
m/s)
m/s, 5m/s,
er
130
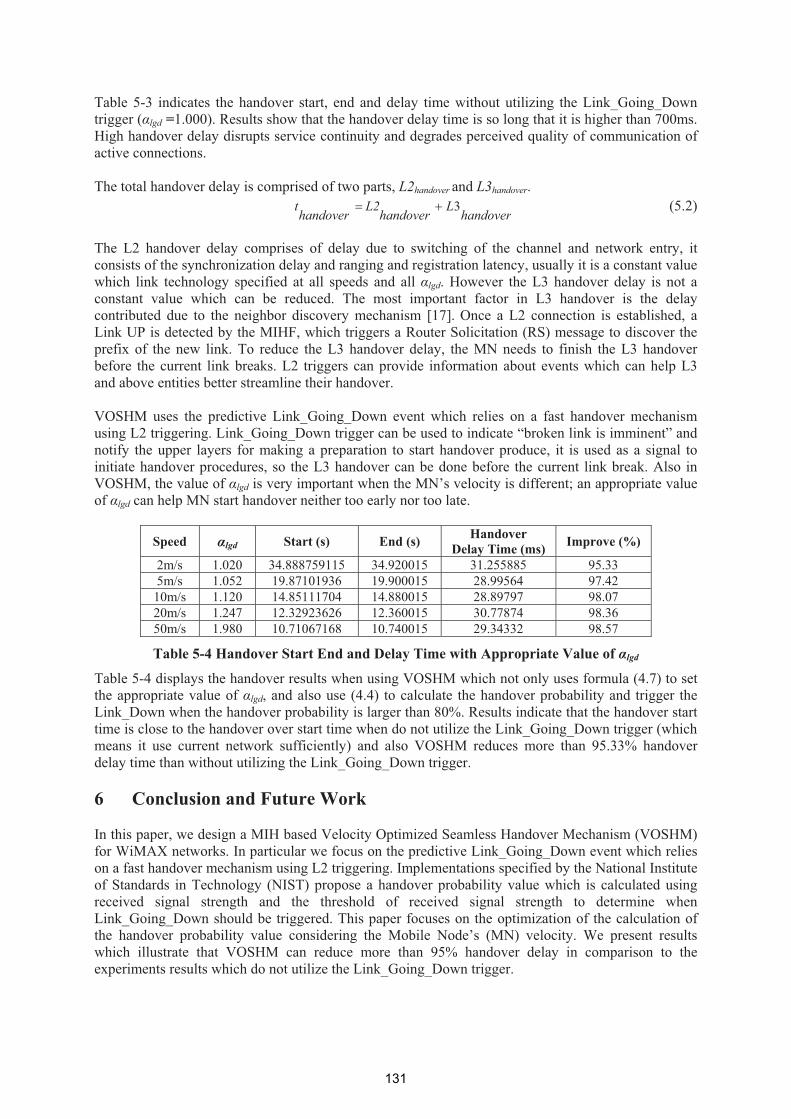
Table 5-3 indicates the handover start, end and delay time without utilizing the Link_Going_Down trigger (�lgd =1.000). Results show that the handover delay time is so long that it is higher than 700ms. High handover delay disrupts service continuity and degrades perceived quality of communication of active connections.
The total handover delay is comprised of two parts, L2handover and L3handover.
handoverL
handoverL2
handovert 3�� (5.2)
The L2 handover delay comprises of delay due to switching of the channel and network entry, it consists of the synchronization delay and ranging and registration latency, usually it is a constant value which link technology specified at all speeds and all �lgd. However the L3 handover delay is not a constant value which can be reduced. The most important factor in L3 handover is the delay contributed due to the neighbor discovery mechanism [17]. Once a L2 connection is established, a Link UP is detected by the MIHF, which triggers a Router Solicitation (RS) message to discover the prefix of the new link. To reduce the L3 handover delay, the MN needs to finish the L3 handover before the current link breaks. L2 triggers can provide information about events which can help L3 and above entities better streamline their handover.
VOSHM uses the predictive Link_Going_Down event which relies on a fast handover mechanism using L2 triggering. Link_Going_Down trigger can be used to indicate “broken link is imminent” and notify the upper layers for making a preparation to start handover produce, it is used as a signal to initiate handover procedures, so the L3 handover can be done before the current link break. Also in VOSHM, the value of �lgd is very important when the MN’s velocity is different; an appropriate value of �lgd can help MN start handover neither too early nor too late.
Speed �lgd Start (s) End (s) HandoverDelay Time (ms) Improve (%)
2m/s 1.020 34.888759115 34.920015 31.255885 95.33 5m/s 1.052 19.87101936 19.900015 28.99564 97.42 10m/s 1.120 14.85111704 14.880015 28.89797 98.07 20m/s 1.247 12.32923626 12.360015 30.77874 98.36 50m/s 1.980 10.71067168 10.740015 29.34332 98.57
Table 5-4 Handover Start End and Delay Time with Appropriate Value of �lgd
Table 5-4 displays the handover results when using VOSHM which not only uses formula (4.7) to set the appropriate value of �lgd, and also use (4.4) to calculate the handover probability and trigger the Link_Down when the handover probability is larger than 80%. Results indicate that the handover start time is close to the handover over start time when do not utilize the Link_Going_Down trigger (which means it use current network sufficiently) and also VOSHM reduces more than 95.33% handover delay time than without utilizing the Link_Going_Down trigger.
6 Conclusion and Future Work
In this paper, we design a MIH based Velocity Optimized Seamless Handover Mechanism (VOSHM) for WiMAX networks. In particular we focus on the predictive Link_Going_Down event which relies on a fast handover mechanism using L2 triggering. Implementations specified by the National Institute of Standards in Technology (NIST) propose a handover probability value which is calculated using received signal strength and the threshold of received signal strength to determine when Link_Going_Down should be triggered. This paper focuses on the optimization of the calculation of the handover probability value considering the Mobile Node’s (MN) velocity. We present results which illustrate that VOSHM can reduce more than 95% handover delay in comparison to the experiments results which do not utilize the Link_Going_Down trigger.
131
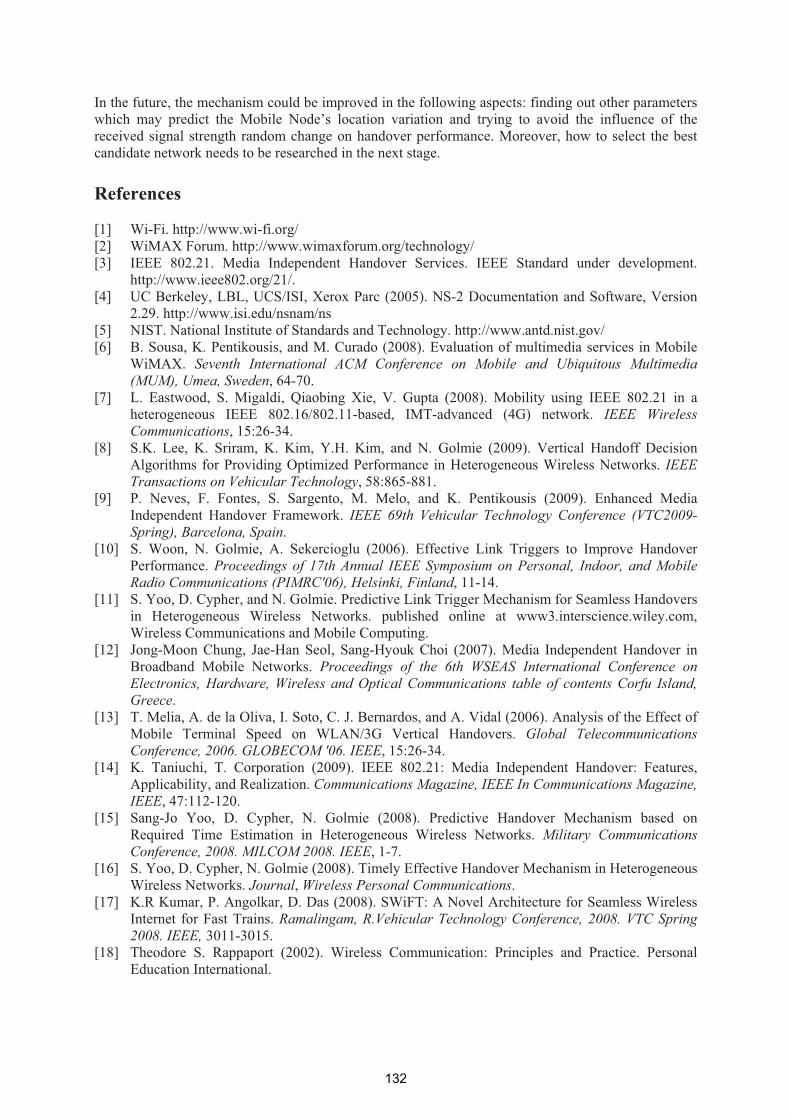
In the future, the mechanism could be improved in the following aspects: finding out other parameters which may predict the Mobile Node’s location variation and trying to avoid the influence of the received signal strength random change on handover performance. Moreover, how to select the best candidate network needs to be researched in the next stage.
References
[1] Wi-Fi. http://www.wi-fi.org/ [2] WiMAX Forum. http://www.wimaxforum.org/technology/ [3] IEEE 802.21. Media Independent Handover Services. IEEE Standard under development.
http://www.ieee802.org/21/.[4] UC Berkeley, LBL, UCS/ISI, Xerox Parc (2005). NS-2 Documentation and Software, Version
2.29. http://www.isi.edu/nsnam/ns [5] NIST. National Institute of Standards and Technology. http://www.antd.nist.gov/ [6] B. Sousa, K. Pentikousis, and M. Curado (2008). Evaluation of multimedia services in Mobile
WiMAX. Seventh International ACM Conference on Mobile and Ubiquitous Multimedia (MUM), Umea, Sweden, 64-70.
[7] L. Eastwood, S. Migaldi, Qiaobing Xie, V. Gupta (2008). Mobility using IEEE 802.21 in a heterogeneous IEEE 802.16/802.11-based, IMT-advanced (4G) network. IEEE Wireless Communications, 15:26-34.
[8] S.K. Lee, K. Sriram, K. Kim, Y.H. Kim, and N. Golmie (2009). Vertical Handoff Decision Algorithms for Providing Optimized Performance in Heterogeneous Wireless Networks. IEEE Transactions on Vehicular Technology, 58:865-881.
[9] P. Neves, F. Fontes, S. Sargento, M. Melo, and K. Pentikousis (2009). Enhanced Media Independent Handover Framework. IEEE 69th Vehicular Technology Conference (VTC2009-Spring), Barcelona, Spain.
[10] S. Woon, N. Golmie, A. Sekercioglu (2006). Effective Link Triggers to Improve Handover Performance. Proceedings of 17th Annual IEEE Symposium on Personal, Indoor, and Mobile Radio Communications (PIMRC'06), Helsinki, Finland, 11-14.
[11] S. Yoo, D. Cypher, and N. Golmie. Predictive Link Trigger Mechanism for Seamless Handovers in Heterogeneous Wireless Networks. published online at www3.interscience.wiley.com, Wireless Communications and Mobile Computing.
[12] Jong-Moon Chung, Jae-Han Seol, Sang-Hyouk Choi (2007). Media Independent Handover in Broadband Mobile Networks. Proceedings of the 6th WSEAS International Conference on Electronics, Hardware, Wireless and Optical Communications table of contents Corfu Island, Greece.
[13] T. Melia, A. de la Oliva, I. Soto, C. J. Bernardos, and A. Vidal (2006). Analysis of the Effect of Mobile Terminal Speed on WLAN/3G Vertical Handovers. Global Telecommunications Conference, 2006. GLOBECOM '06. IEEE, 15:26-34.
[14] K. Taniuchi, T. Corporation (2009). IEEE 802.21: Media Independent Handover: Features, Applicability, and Realization. Communications Magazine, IEEE In Communications Magazine, IEEE, 47:112-120.
[15] Sang-Jo Yoo, D. Cypher, N. Golmie (2008). Predictive Handover Mechanism based on Required Time Estimation in Heterogeneous Wireless Networks. Military Communications Conference, 2008. MILCOM 2008. IEEE, 1-7.
[16] S. Yoo, D. Cypher, N. Golmie (2008). Timely Effective Handover Mechanism in Heterogeneous Wireless Networks. Journal, Wireless Personal Communications.
[17] K.R Kumar, P. Angolkar, D. Das (2008). SWiFT: A Novel Architecture for Seamless Wireless Internet for Fast Trains. Ramalingam, R.Vehicular Technology Conference, 2008. VTC Spring 2008. IEEE, 3011-3015.
[18] Theodore S. Rappaport (2002). Wireless Communication: Principles and Practice. Personal Education International.
132

Parallelised EM wave propagation modelling for accuratenetwork simulation
Catalin David, Conor Brennan, Olga Ormond, Marie MullenNetwork Innovation Centre,
Research Institute for Networks and Communications Engineering (RINCE),Dublin City University,
Abstract
A description of ongoing work which aims to provide better quality propagation models for use in
network simulators is provided in this paper. A 3D ray-tracing model is described which allows for
accurate specification of a variety of wave scattering phenomena. Details of its parallelisation are
given as well as a discussion of future work including the incorporation of a visibility algorithm.
Results illustrate the increased realism obtained by using site-specific propagation models.
Keywords: Ray tracing, wave propagation, parallel computing, ad hoc networks
1 Introduction
The accurate modelling of wireless networks is a complex task as it must take into account what is
happening at all layers of the OSI model. Simulation packages such as NS2 allow engineers to form
reasonably useful models which attempt to address all such layers. However these are acknowledged
to suffer in particular from over-simplistic propagation models at the physical layer [Stepanov, 2008].
The assumption of free-space propagation or simple two-ray models are simply inadequate to model the
complexity of propagation effects, especially in urban or indoor scenarios. Consequently the conclusions
to be drawn from such network simulations are often questionable, suffering as they do from an overly
benign model of the wireless channel. Deployments of networks designed using incorrect channel infor-
mation can be sub-optimal and inefficient, in terms of energy usage and capacity, as compared to those
based on correct treatment of the physical layer[Coinchon, 2002]. An alternative is to incorporate a more
realistic propagation model into the simulations. Options include the COST231 Walfisch Ikegami model,
which is based on an abstracted model of propagation over a succession of rooftops [Walfisch, 1988]. In-
put parameters include the average building height and separation and as such it only models propagation
in an average sense. A further drawback is its inability to produce information about delay spread and
angle of arrival. In contrast a ray-tracing model uses precise building database information and computes
a simplified high frequency approximate solution to Maxwell’s equations for the problem at hand. It can
generate signal strength information as well as angle of arrival and delay spread information, the latter
being particularly important for high speed wideband systems where ISI becomes more of an issue. The
main drawback of ray-tracing is the onerous computational burden associated with it. It is simply unfea-
sible to incorporate a ray-tracing engine into a network simulator to be called each time an estimate of
propagation information between two points is needed. The approach we describe in this paper is instead
one where exhaustive simulations are performed off-line and the resultant database is made available to
the network simulator as required. In particular the parallelisation of the ray tracing code is essential,
especially when modelling ad-hoc networks. The analysis of ad-hoc networks require ray traces for mul-
tiple receiver locations. Thus the use of a parallelised ray tracing code would allow the simulation of each
transmitter-receiver channel to be performed on a separate processor. The simulation of such networks
133
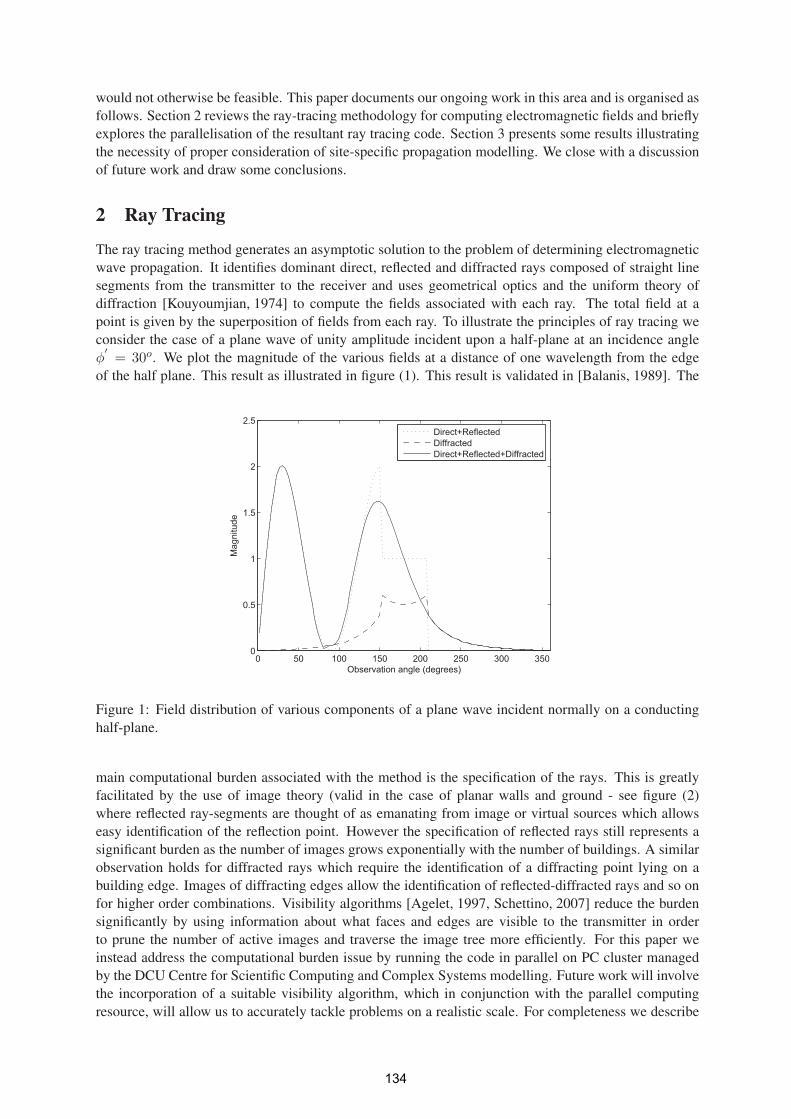
would not otherwise be feasible. This paper documents our ongoing work in this area and is organised as
follows. Section 2 reviews the ray-tracing methodology for computing electromagnetic fields and briefly
explores the parallelisation of the resultant ray tracing code. Section 3 presents some results illustrating
the necessity of proper consideration of site-specific propagation modelling. We close with a discussion
of future work and draw some conclusions.
2 Ray Tracing
The ray tracing method generates an asymptotic solution to the problem of determining electromagnetic
wave propagation. It identifies dominant direct, reflected and diffracted rays composed of straight line
segments from the transmitter to the receiver and uses geometrical optics and the uniform theory of
diffraction [Kouyoumjian, 1974] to compute the fields associated with each ray. The total field at a
point is given by the superposition of fields from each ray. To illustrate the principles of ray tracing we
consider the case of a plane wave of unity amplitude incident upon a half-plane at an incidence angle
φ′
= 30o. We plot the magnitude of the various fields at a distance of one wavelength from the edge
of the half plane. This result as illustrated in figure (1). This result is validated in [Balanis, 1989]. The
0 50 100 150 200 250 300 3500
0.5
1
1.5
2
2.5
Observation angle (degrees)
Mag
nitu
de
Direct+ReflectedDiffractedDirect+Reflected+Diffracted
Figure 1: Field distribution of various components of a plane wave incident normally on a conducting
half-plane.
main computational burden associated with the method is the specification of the rays. This is greatly
facilitated by the use of image theory (valid in the case of planar walls and ground - see figure (2)
where reflected ray-segments are thought of as emanating from image or virtual sources which allows
easy identification of the reflection point. However the specification of reflected rays still represents a
significant burden as the number of images grows exponentially with the number of buildings. A similar
observation holds for diffracted rays which require the identification of a diffracting point lying on a
building edge. Images of diffracting edges allow the identification of reflected-diffracted rays and so on
for higher order combinations. Visibility algorithms [Agelet, 1997, Schettino, 2007] reduce the burden
significantly by using information about what faces and edges are visible to the transmitter in order
to prune the number of active images and traverse the image tree more efficiently. For this paper we
instead address the computational burden issue by running the code in parallel on PC cluster managed
by the DCU Centre for Scientific Computing and Complex Systems modelling. Future work will involve
the incorporation of a suitable visibility algorithm, which in conjunction with the parallel computing
resource, will allow us to accurately tackle problems on a realistic scale. For completeness we describe
134
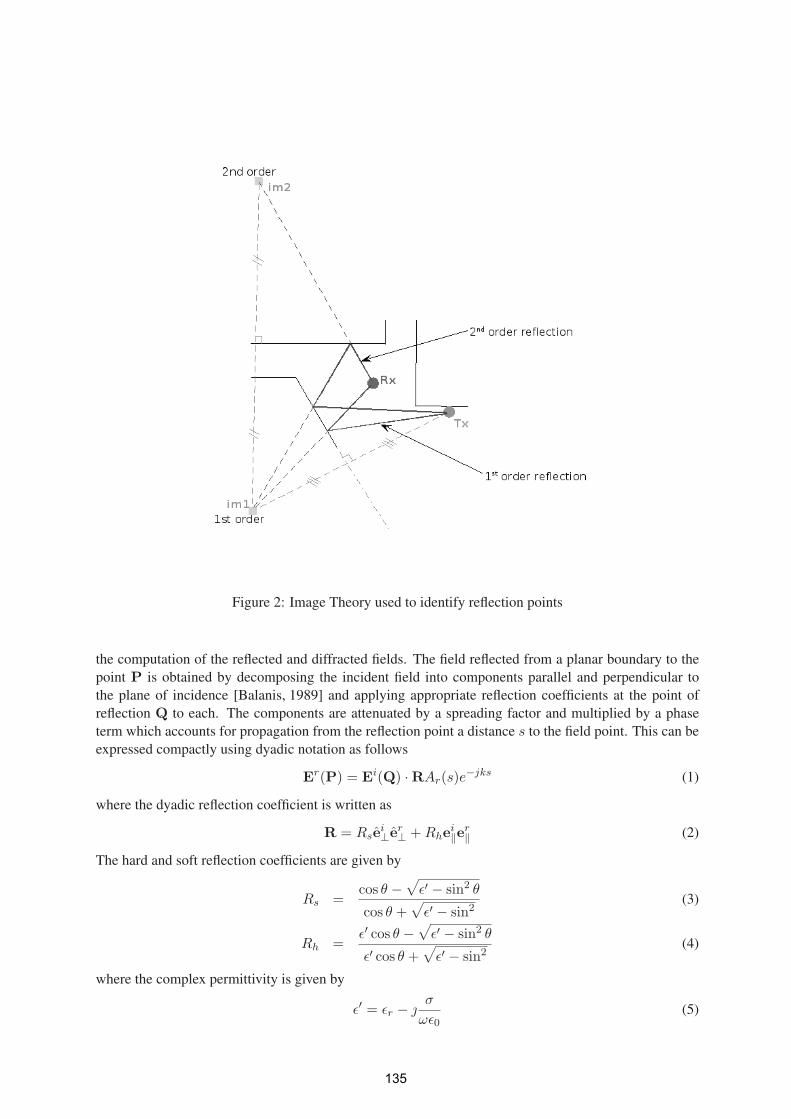
Figure 2: Image Theory used to identify reflection points
the computation of the reflected and diffracted fields. The field reflected from a planar boundary to the
point P is obtained by decomposing the incident field into components parallel and perpendicular to
the plane of incidence [Balanis, 1989] and applying appropriate reflection coefficients at the point of
reflection Q to each. The components are attenuated by a spreading factor and multiplied by a phase
term which accounts for propagation from the reflection point a distance s to the field point. This can be
expressed compactly using dyadic notation as follows
Er(P) = E
i(Q) · RAr(s)e−jks (1)
where the dyadic reflection coefficient is written as
R = Rsei⊥e
r⊥ + Rhe
i‖e
r‖ (2)
The hard and soft reflection coefficients are given by
Rs =cos θ −
√ε′ − sin2 θ
cos θ +√
ε′ − sin2(3)
Rh =ε′ cos θ −
√ε′ − sin2 θ
ε′ cos θ +√
ε′ − sin2(4)
where the complex permittivity is given by
ε′ = εr − jσ
ωε0(5)
135
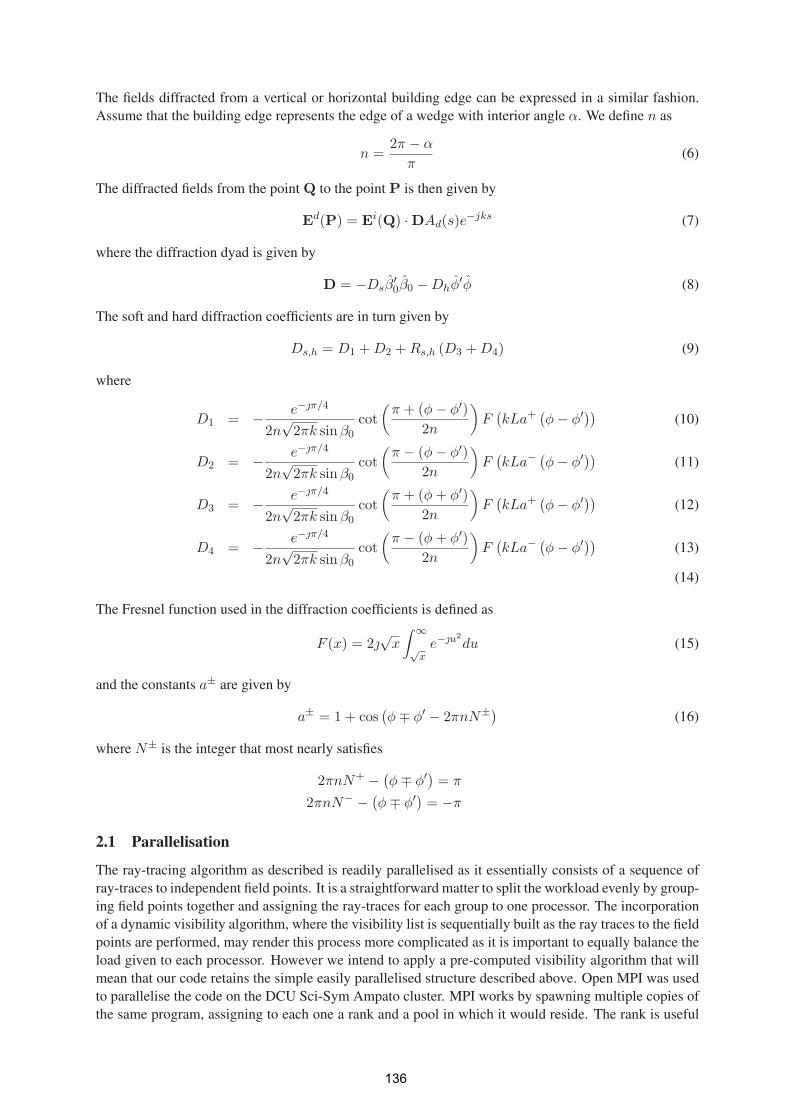
The fields diffracted from a vertical or horizontal building edge can be expressed in a similar fashion.
Assume that the building edge represents the edge of a wedge with interior angle α. We define n as
n =2π − α
π(6)
The diffracted fields from the point Q to the point P is then given by
Ed(P) = E
i(Q) · DAd(s)e−jks (7)
where the diffraction dyad is given by
D = −Dsβ′0β0 − Dhφ′φ (8)
The soft and hard diffraction coefficients are in turn given by
Ds,h = D1 + D2 + Rs,h (D3 + D4) (9)
where
D1 = − e−jπ/4
2n√
2πk sinβ0
cot
(π + (φ − φ′)
2n
)F
(kLa+ (
φ − φ′)) (10)
D2 = − e−jπ/4
2n√
2πk sinβ0
cot
(π − (φ − φ′)
2n
)F
(kLa−
(φ − φ′)) (11)
D3 = − e−jπ/4
2n√
2πk sinβ0
cot
(π + (φ + φ′)
2n
)F
(kLa+ (
φ − φ′)) (12)
D4 = − e−jπ/4
2n√
2πk sinβ0
cot
(π − (φ + φ′)
2n
)F
(kLa−
(φ − φ′)) (13)
(14)
The Fresnel function used in the diffraction coefficients is defined as
F (x) = 2j√
x
∫ ∞√
xe−ju2
du (15)
and the constants a± are given by
a± = 1 + cos(φ ∓ φ′ − 2πnN±)
(16)
where N± is the integer that most nearly satisfies
2πnN+ − (φ ∓ φ′) = π
2πnN− − (φ ∓ φ′) = −π
2.1 Parallelisation
The ray-tracing algorithm as described is readily parallelised as it essentially consists of a sequence of
ray-traces to independent field points. It is a straightforward matter to split the workload evenly by group-
ing field points together and assigning the ray-traces for each group to one processor. The incorporation
of a dynamic visibility algorithm, where the visibility list is sequentially built as the ray traces to the field
points are performed, may render this process more complicated as it is important to equally balance the
load given to each processor. However we intend to apply a pre-computed visibility algorithm that will
mean that our code retains the simple easily parallelised structure described above. Open MPI was used
to parallelise the code on the DCU Sci-Sym Ampato cluster. MPI works by spawning multiple copies of
the same program, assigning to each one a rank and a pool in which it would reside. The rank is useful
136
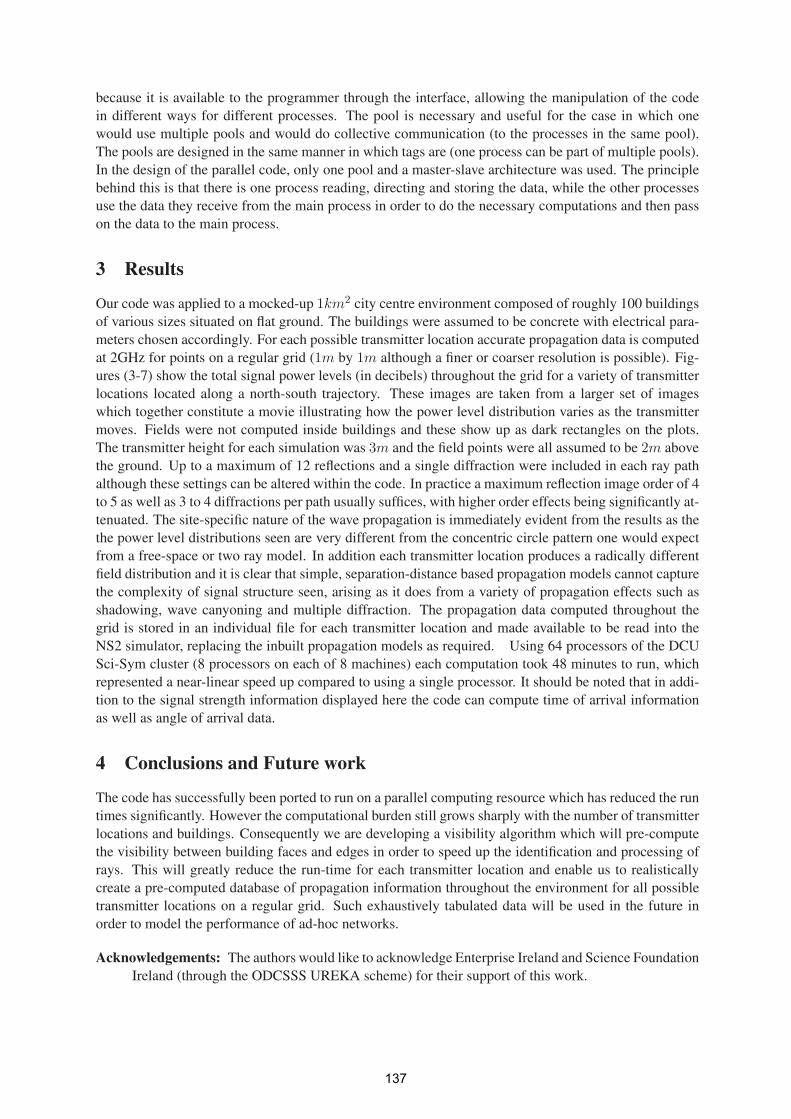
because it is available to the programmer through the interface, allowing the manipulation of the code
in different ways for different processes. The pool is necessary and useful for the case in which one
would use multiple pools and would do collective communication (to the processes in the same pool).
The pools are designed in the same manner in which tags are (one process can be part of multiple pools).
In the design of the parallel code, only one pool and a master-slave architecture was used. The principle
behind this is that there is one process reading, directing and storing the data, while the other processes
use the data they receive from the main process in order to do the necessary computations and then pass
on the data to the main process.
3 Results
Our code was applied to a mocked-up 1km2 city centre environment composed of roughly 100 buildings
of various sizes situated on flat ground. The buildings were assumed to be concrete with electrical para-
meters chosen accordingly. For each possible transmitter location accurate propagation data is computed
at 2GHz for points on a regular grid (1m by 1m although a finer or coarser resolution is possible). Fig-
ures (3-7) show the total signal power levels (in decibels) throughout the grid for a variety of transmitter
locations located along a north-south trajectory. These images are taken from a larger set of images
which together constitute a movie illustrating how the power level distribution varies as the transmitter
moves. Fields were not computed inside buildings and these show up as dark rectangles on the plots.
The transmitter height for each simulation was 3m and the field points were all assumed to be 2m above
the ground. Up to a maximum of 12 reflections and a single diffraction were included in each ray path
although these settings can be altered within the code. In practice a maximum reflection image order of 4
to 5 as well as 3 to 4 diffractions per path usually suffices, with higher order effects being significantly at-
tenuated. The site-specific nature of the wave propagation is immediately evident from the results as the
the power level distributions seen are very different from the concentric circle pattern one would expect
from a free-space or two ray model. In addition each transmitter location produces a radically different
field distribution and it is clear that simple, separation-distance based propagation models cannot capture
the complexity of signal structure seen, arising as it does from a variety of propagation effects such as
shadowing, wave canyoning and multiple diffraction. The propagation data computed throughout the
grid is stored in an individual file for each transmitter location and made available to be read into the
NS2 simulator, replacing the inbuilt propagation models as required. Using 64 processors of the DCU
Sci-Sym cluster (8 processors on each of 8 machines) each computation took 48 minutes to run, which
represented a near-linear speed up compared to using a single processor. It should be noted that in addi-
tion to the signal strength information displayed here the code can compute time of arrival information
as well as angle of arrival data.
4 Conclusions and Future work
The code has successfully been ported to run on a parallel computing resource which has reduced the run
times significantly. However the computational burden still grows sharply with the number of transmitter
locations and buildings. Consequently we are developing a visibility algorithm which will pre-compute
the visibility between building faces and edges in order to speed up the identification and processing of
rays. This will greatly reduce the run-time for each transmitter location and enable us to realistically
create a pre-computed database of propagation information throughout the environment for all possible
transmitter locations on a regular grid. Such exhaustively tabulated data will be used in the future in
order to model the performance of ad-hoc networks.
Acknowledgements: The authors would like to acknowledge Enterprise Ireland and Science Foundation
Ireland (through the ODCSSS UREKA scheme) for their support of this work.
137
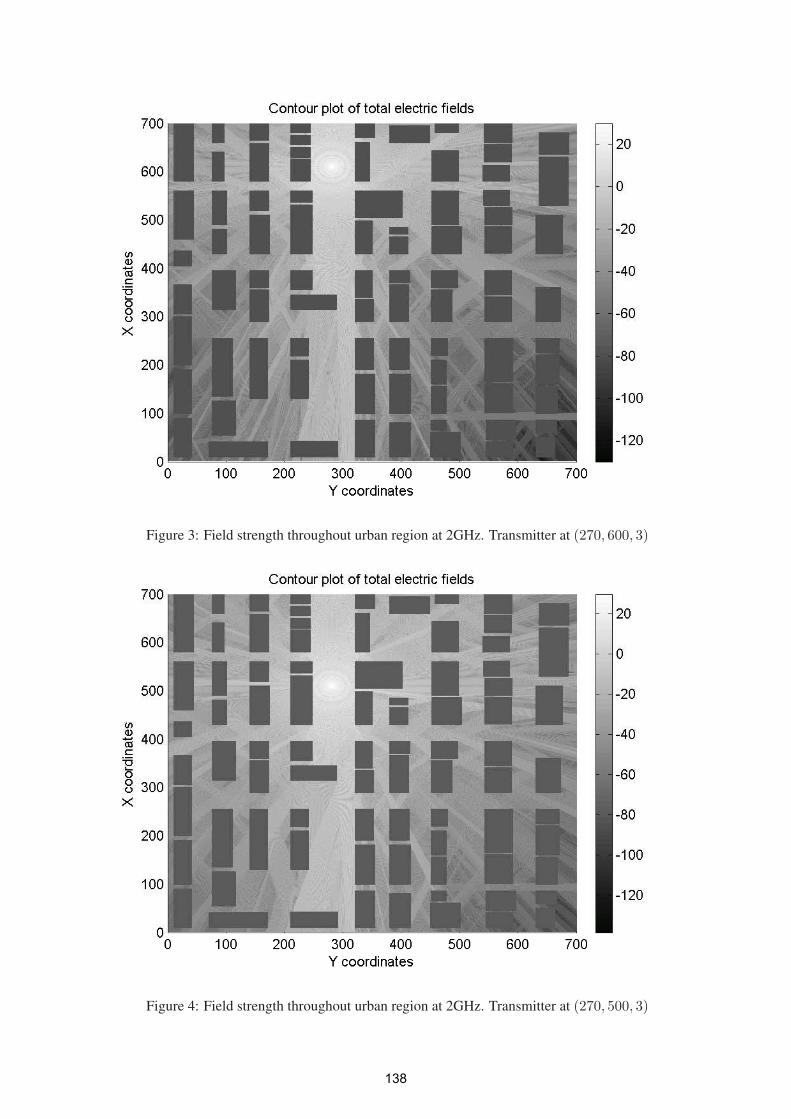
Figure 3: Field strength throughout urban region at 2GHz. Transmitter at (270, 600, 3)
Figure 4: Field strength throughout urban region at 2GHz. Transmitter at (270, 500, 3)
138
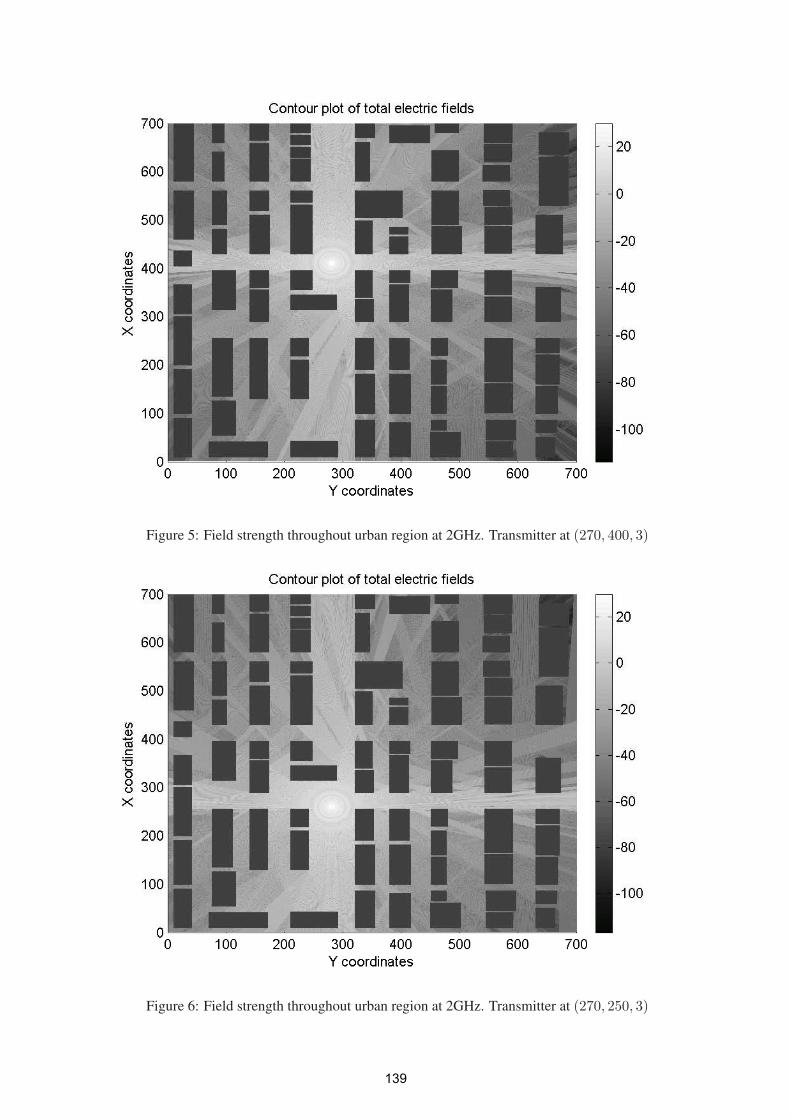
Figure 5: Field strength throughout urban region at 2GHz. Transmitter at (270, 400, 3)
Figure 6: Field strength throughout urban region at 2GHz. Transmitter at (270, 250, 3)
139
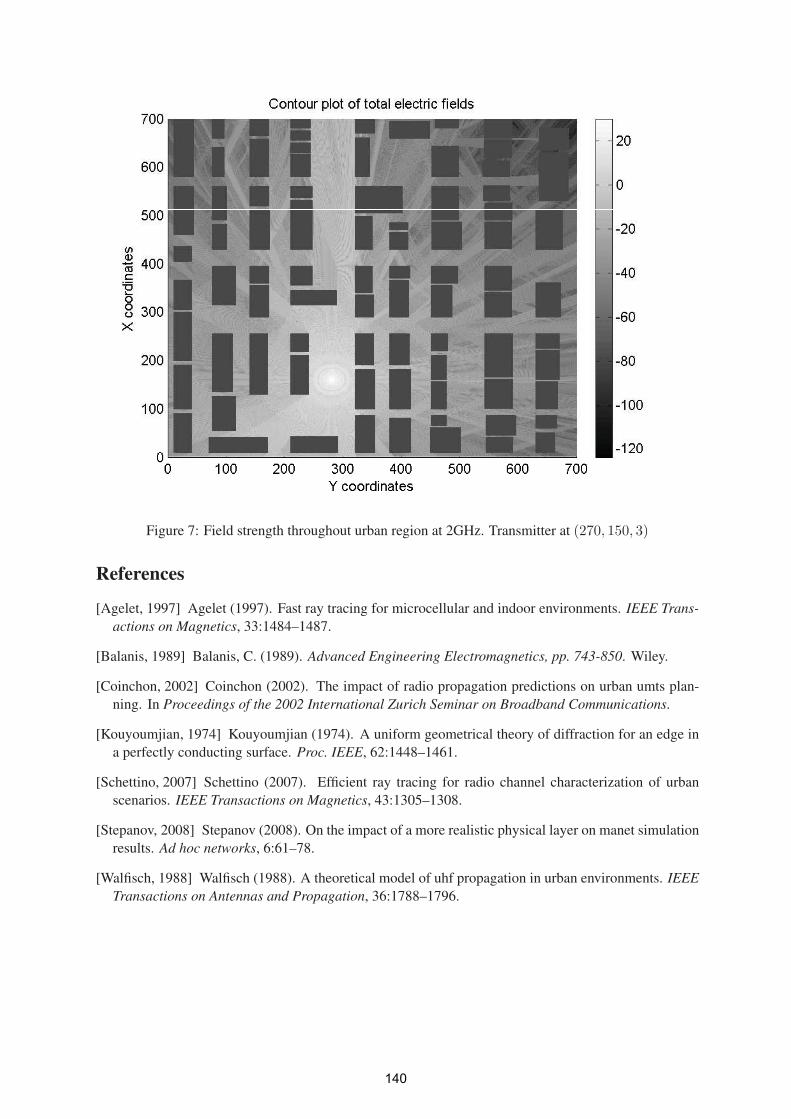
Figure 7: Field strength throughout urban region at 2GHz. Transmitter at (270, 150, 3)
References
[Agelet, 1997] Agelet (1997). Fast ray tracing for microcellular and indoor environments. IEEE Trans-actions on Magnetics, 33:1484–1487.
[Balanis, 1989] Balanis, C. (1989). Advanced Engineering Electromagnetics, pp. 743-850. Wiley.
[Coinchon, 2002] Coinchon (2002). The impact of radio propagation predictions on urban umts plan-
ning. In Proceedings of the 2002 International Zurich Seminar on Broadband Communications.
[Kouyoumjian, 1974] Kouyoumjian (1974). A uniform geometrical theory of diffraction for an edge in
a perfectly conducting surface. Proc. IEEE, 62:1448–1461.
[Schettino, 2007] Schettino (2007). Efficient ray tracing for radio channel characterization of urban
scenarios. IEEE Transactions on Magnetics, 43:1305–1308.
[Stepanov, 2008] Stepanov (2008). On the impact of a more realistic physical layer on manet simulation
results. Ad hoc networks, 6:61–78.
[Walfisch, 1988] Walfisch (1988). A theoretical model of uhf propagation in urban environments. IEEETransactions on Antennas and Propagation, 36:1788–1796.
140

Session 6
Networks & Sensor Networks
141

�
142
QoS-Aware IPTV Routing Algorithms
Patrick McDonagh, Philip Perry, Liam Murphy.
School of Computer Science and Informatics, University College Dublin, Belfield, Dublin 4.{patrick.mcdonagh, philip.perry, liam.murphy}@ucd.ie
Abstract
The aim of this paper is to describe how QoS (Quality of Service) metrics such as packet delay can
be used to optimise the routing algorithms used in a network where IP Television (IPTV) content is
being distributed. We outline the usage of metric instrumentation in a network to gauge the bandwidth
limits of the network and how to use this information to generate a model of network link utilisation.
Furthermore, we show that as the link utilisation rates change in our network model, we can modify
the network routing algorithms to optimise the distribution of IPTV content to end-users.
Keywords: IPTV, Network Management, Quality of Service.
1 Introduction
Internet Protocol Television (IPTV) is a distribution mechanism for a digital television service using ex-
isting IP-based technologies and broadband network infrastructures. Due to the fact that IPTV uses the
same network infrastructures as broadband Internet and VoIP services, it is often found offered as part of
a triple-play service by Internet Service Providers [1]. IPTV is designed to compete with existing televi-
sion distribution mechanisms, such as Cable and Satellite Television. As a result of this competition and
in order to ensure adoption of IPTV, it must at the very least ensure a similar standard of audio-visual
quality, ease of use, and content availability as these existing distribution mechanisms. This constraint
can be difficult to fulfil due to the shared nature of the network infrastructure, which is often used concur-
rently by other network applications. An IPTV service requires that the network infrastructure meets the
minimum required bandwidth for video distribution, as well as additional bandwidth to allow concurrent
utilisation of triple-play and/or other services.
In order to ensure an always-on and reliable IPTV service, over-provisioning of resources and/or redun-
dancies may be designed into the network at the planning phase. This may be replaced or supplemented
by performance monitoring during the deployment phase. Some methods involve audio-visual signal
monitoring methods to analyse the received content and use this as an indicator of quality of service
(QoS) [2]. Network QoS metrics are used to gather information regarding the current status of the net-
work. Using data gathered from these metrics, decisions or actions can be taken to modify network
parameters or network configuration to ensure degradation of services can be avoided or kept to an ac-
ceptable level. IPTV is especially sensitive to variations in network conditions due to the real-time nature
of the content being delivered. QoS metrics such as data loss and transmission delay are some of the fac-
tors which are currently used to determine how well the network is delivering content to the viewer and,
potentially, how the user experiences the service.
In this paper, we describe a number of existing QoS metrics and discuss how variations within these
metrics affect the perceived quality of an IPTV service from an end-user perspective. The metrics that
143
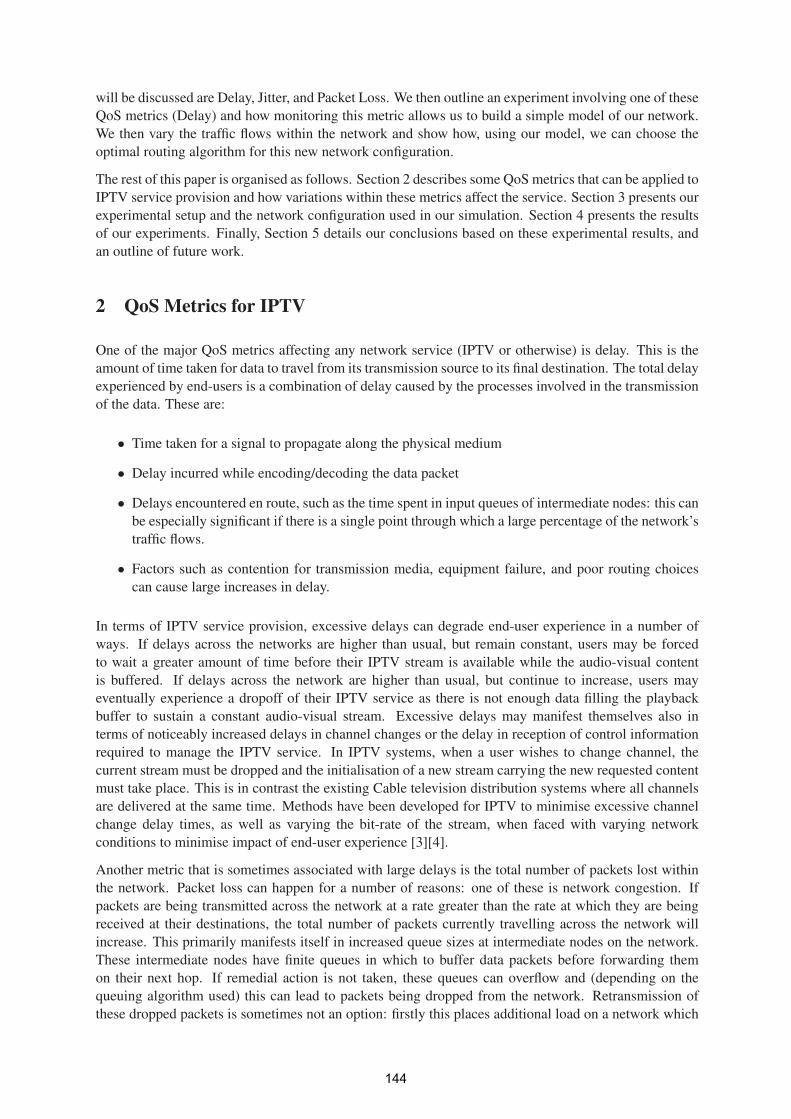
will be discussed are Delay, Jitter, and Packet Loss. We then outline an experiment involving one of these
QoS metrics (Delay) and how monitoring this metric allows us to build a simple model of our network.
We then vary the traffic flows within the network and show how, using our model, we can choose the
optimal routing algorithm for this new network configuration.
The rest of this paper is organised as follows. Section 2 describes some QoS metrics that can be applied to
IPTV service provision and how variations within these metrics affect the service. Section 3 presents our
experimental setup and the network configuration used in our simulation. Section 4 presents the results
of our experiments. Finally, Section 5 details our conclusions based on these experimental results, and
an outline of future work.
2 QoS Metrics for IPTV
One of the major QoS metrics affecting any network service (IPTV or otherwise) is delay. This is the
amount of time taken for data to travel from its transmission source to its final destination. The total delay
experienced by end-users is a combination of delay caused by the processes involved in the transmission
of the data. These are:
• Time taken for a signal to propagate along the physical medium
• Delay incurred while encoding/decoding the data packet
• Delays encountered en route, such as the time spent in input queues of intermediate nodes: this can
be especially significant if there is a single point through which a large percentage of the network’s
traffic flows.
• Factors such as contention for transmission media, equipment failure, and poor routing choices
can cause large increases in delay.
In terms of IPTV service provision, excessive delays can degrade end-user experience in a number of
ways. If delays across the networks are higher than usual, but remain constant, users may be forced
to wait a greater amount of time before their IPTV stream is available while the audio-visual content
is buffered. If delays across the network are higher than usual, but continue to increase, users may
eventually experience a dropoff of their IPTV service as there is not enough data filling the playback
buffer to sustain a constant audio-visual stream. Excessive delays may manifest themselves also in
terms of noticeably increased delays in channel changes or the delay in reception of control information
required to manage the IPTV service. In IPTV systems, when a user wishes to change channel, the
current stream must be dropped and the initialisation of a new stream carrying the new requested content
must take place. This is in contrast the existing Cable television distribution systems where all channels
are delivered at the same time. Methods have been developed for IPTV to minimise excessive channel
change delay times, as well as varying the bit-rate of the stream, when faced with varying network
conditions to minimise impact of end-user experience [3][4].
Another metric that is sometimes associated with large delays is the total number of packets lost within
the network. Packet loss can happen for a number of reasons: one of these is network congestion. If
packets are being transmitted across the network at a rate greater than the rate at which they are being
received at their destinations, the total number of packets currently travelling across the network will
increase. This primarily manifests itself in increased queue sizes at intermediate nodes on the network.
These intermediate nodes have finite queues in which to buffer data packets before forwarding them
on their next hop. If remedial action is not taken, these queues can overflow and (depending on the
queuing algorithm used) this can lead to packets being dropped from the network. Retransmission of
these dropped packets is sometimes not an option: firstly this places additional load on a network which
144
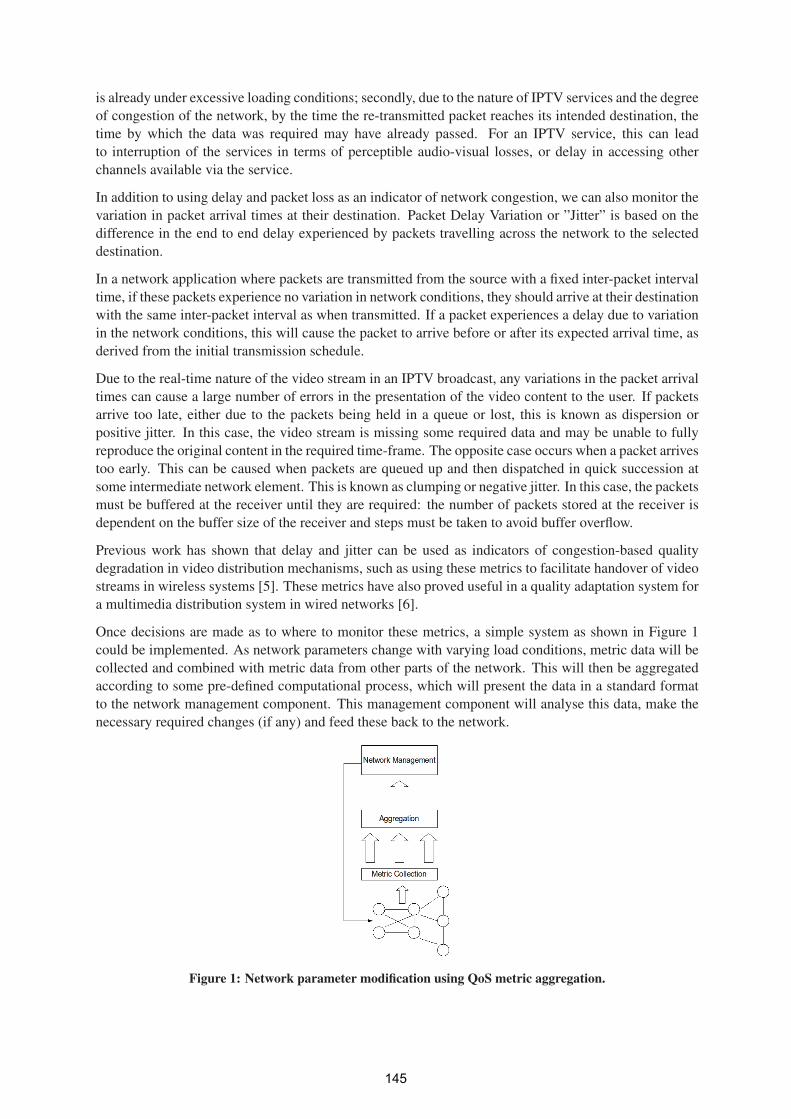
is already under excessive loading conditions; secondly, due to the nature of IPTV services and the degree
of congestion of the network, by the time the re-transmitted packet reaches its intended destination, the
time by which the data was required may have already passed. For an IPTV service, this can lead
to interruption of the services in terms of perceptible audio-visual losses, or delay in accessing other
channels available via the service.
In addition to using delay and packet loss as an indicator of network congestion, we can also monitor the
variation in packet arrival times at their destination. Packet Delay Variation or ”Jitter” is based on the
difference in the end to end delay experienced by packets travelling across the network to the selected
destination.
In a network application where packets are transmitted from the source with a fixed inter-packet interval
time, if these packets experience no variation in network conditions, they should arrive at their destination
with the same inter-packet interval as when transmitted. If a packet experiences a delay due to variation
in the network conditions, this will cause the packet to arrive before or after its expected arrival time, as
derived from the initial transmission schedule.
Due to the real-time nature of the video stream in an IPTV broadcast, any variations in the packet arrival
times can cause a large number of errors in the presentation of the video content to the user. If packets
arrive too late, either due to the packets being held in a queue or lost, this is known as dispersion or
positive jitter. In this case, the video stream is missing some required data and may be unable to fully
reproduce the original content in the required time-frame. The opposite case occurs when a packet arrives
too early. This can be caused when packets are queued up and then dispatched in quick succession at
some intermediate network element. This is known as clumping or negative jitter. In this case, the packets
must be buffered at the receiver until they are required: the number of packets stored at the receiver is
dependent on the buffer size of the receiver and steps must be taken to avoid buffer overflow.
Previous work has shown that delay and jitter can be used as indicators of congestion-based quality
degradation in video distribution mechanisms, such as using these metrics to facilitate handover of video
streams in wireless systems [5]. These metrics have also proved useful in a quality adaptation system for
a multimedia distribution system in wired networks [6].
Once decisions are made as to where to monitor these metrics, a simple system as shown in Figure 1
could be implemented. As network parameters change with varying load conditions, metric data will be
collected and combined with metric data from other parts of the network. This will then be aggregated
according to some pre-defined computational process, which will present the data in a standard format
to the network management component. This management component will analyse this data, make the
necessary required changes (if any) and feed these back to the network.
Figure 1: Network parameter modification using QoS metric aggregation.
145
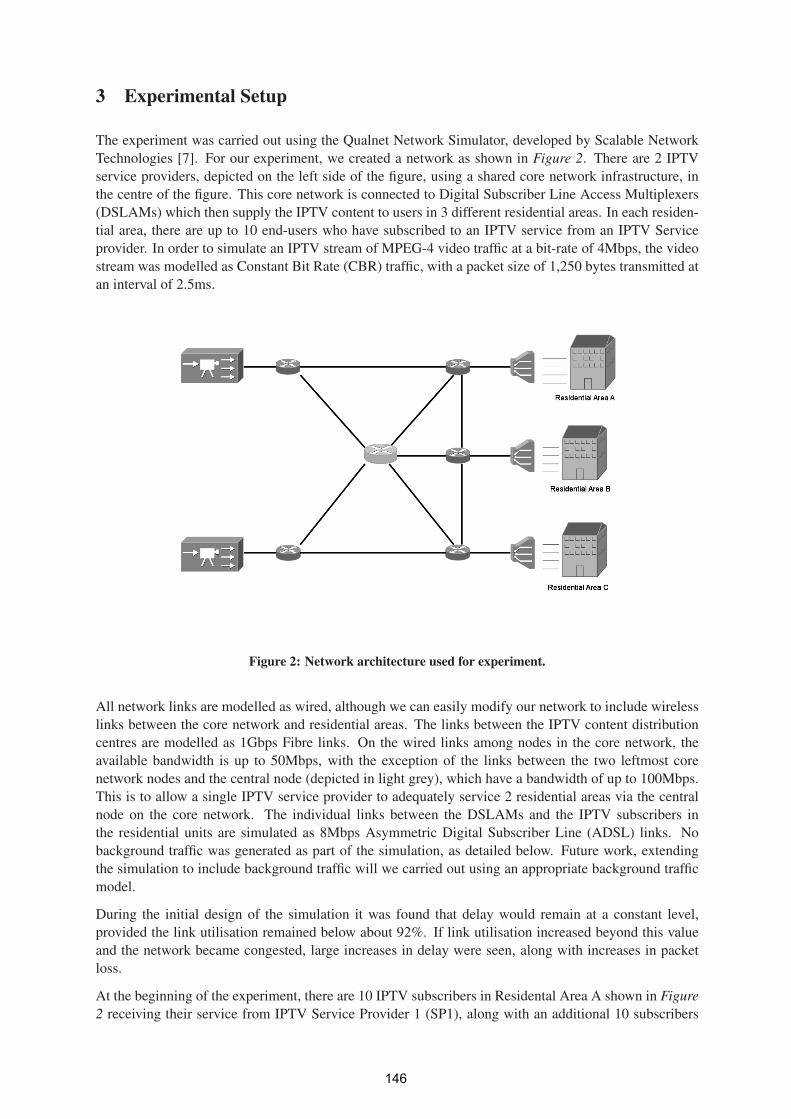
3 Experimental Setup
The experiment was carried out using the Qualnet Network Simulator, developed by Scalable Network
Technologies [7]. For our experiment, we created a network as shown in Figure 2. There are 2 IPTV
service providers, depicted on the left side of the figure, using a shared core network infrastructure, in
the centre of the figure. This core network is connected to Digital Subscriber Line Access Multiplexers
(DSLAMs) which then supply the IPTV content to users in 3 different residential areas. In each residen-
tial area, there are up to 10 end-users who have subscribed to an IPTV service from an IPTV Service
provider. In order to simulate an IPTV stream of MPEG-4 video traffic at a bit-rate of 4Mbps, the video
stream was modelled as Constant Bit Rate (CBR) traffic, with a packet size of 1,250 bytes transmitted at
an interval of 2.5ms.
Figure 2: Network architecture used for experiment.
All network links are modelled as wired, although we can easily modify our network to include wireless
links between the core network and residential areas. The links between the IPTV content distribution
centres are modelled as 1Gbps Fibre links. On the wired links among nodes in the core network, the
available bandwidth is up to 50Mbps, with the exception of the links between the two leftmost core
network nodes and the central node (depicted in light grey), which have a bandwidth of up to 100Mbps.
This is to allow a single IPTV service provider to adequately service 2 residential areas via the central
node on the core network. The individual links between the DSLAMs and the IPTV subscribers in
the residential units are simulated as 8Mbps Asymmetric Digital Subscriber Line (ADSL) links. No
background traffic was generated as part of the simulation, as detailed below. Future work, extending
the simulation to include background traffic will we carried out using an appropriate background traffic
model.
During the initial design of the simulation it was found that delay would remain at a constant level,
provided the link utilisation remained below about 92%. If link utilisation increased beyond this value
and the network became congested, large increases in delay were seen, along with increases in packet
loss.
At the beginning of the experiment, there are 10 IPTV subscribers in Residental Area A shown in Figure2 receiving their service from IPTV Service Provider 1 (SP1), along with an additional 10 subscribers
146
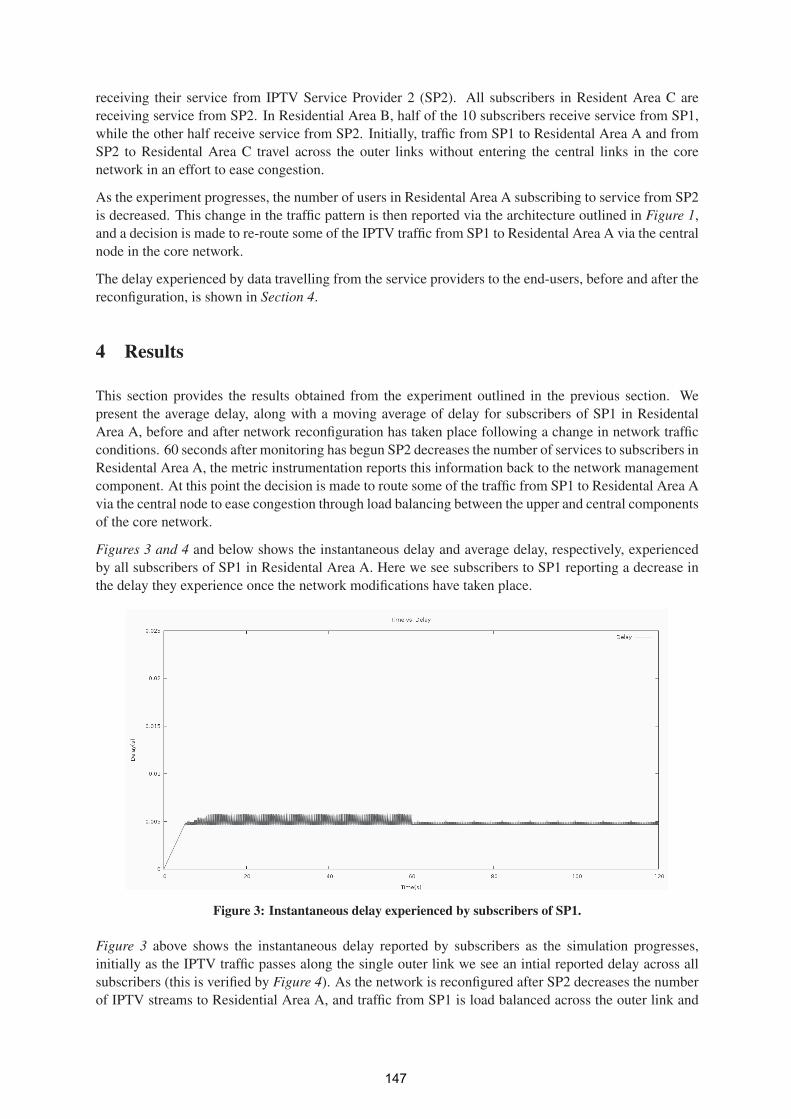
receiving their service from IPTV Service Provider 2 (SP2). All subscribers in Resident Area C are
receiving service from SP2. In Residential Area B, half of the 10 subscribers receive service from SP1,
while the other half receive service from SP2. Initially, traffic from SP1 to Residental Area A and from
SP2 to Residental Area C travel across the outer links without entering the central links in the core
network in an effort to ease congestion.
As the experiment progresses, the number of users in Residental Area A subscribing to service from SP2
is decreased. This change in the traffic pattern is then reported via the architecture outlined in Figure 1,
and a decision is made to re-route some of the IPTV traffic from SP1 to Residental Area A via the central
node in the core network.
The delay experienced by data travelling from the service providers to the end-users, before and after the
reconfiguration, is shown in Section 4.
4 Results
This section provides the results obtained from the experiment outlined in the previous section. We
present the average delay, along with a moving average of delay for subscribers of SP1 in Residental
Area A, before and after network reconfiguration has taken place following a change in network traffic
conditions. 60 seconds after monitoring has begun SP2 decreases the number of services to subscribers in
Residental Area A, the metric instrumentation reports this information back to the network management
component. At this point the decision is made to route some of the traffic from SP1 to Residental Area A
via the central node to ease congestion through load balancing between the upper and central components
of the core network.
Figures 3 and 4 and below shows the instantaneous delay and average delay, respectively, experienced
by all subscribers of SP1 in Residental Area A. Here we see subscribers to SP1 reporting a decrease in
the delay they experience once the network modifications have taken place.
Figure 3: Instantaneous delay experienced by subscribers of SP1.
Figure 3 above shows the instantaneous delay reported by subscribers as the simulation progresses,
initially as the IPTV traffic passes along the single outer link we see an intial reported delay across all
subscribers (this is verified by Figure 4). As the network is reconfigured after SP2 decreases the number
of IPTV streams to Residential Area A, and traffic from SP1 is load balanced across the outer link and
147
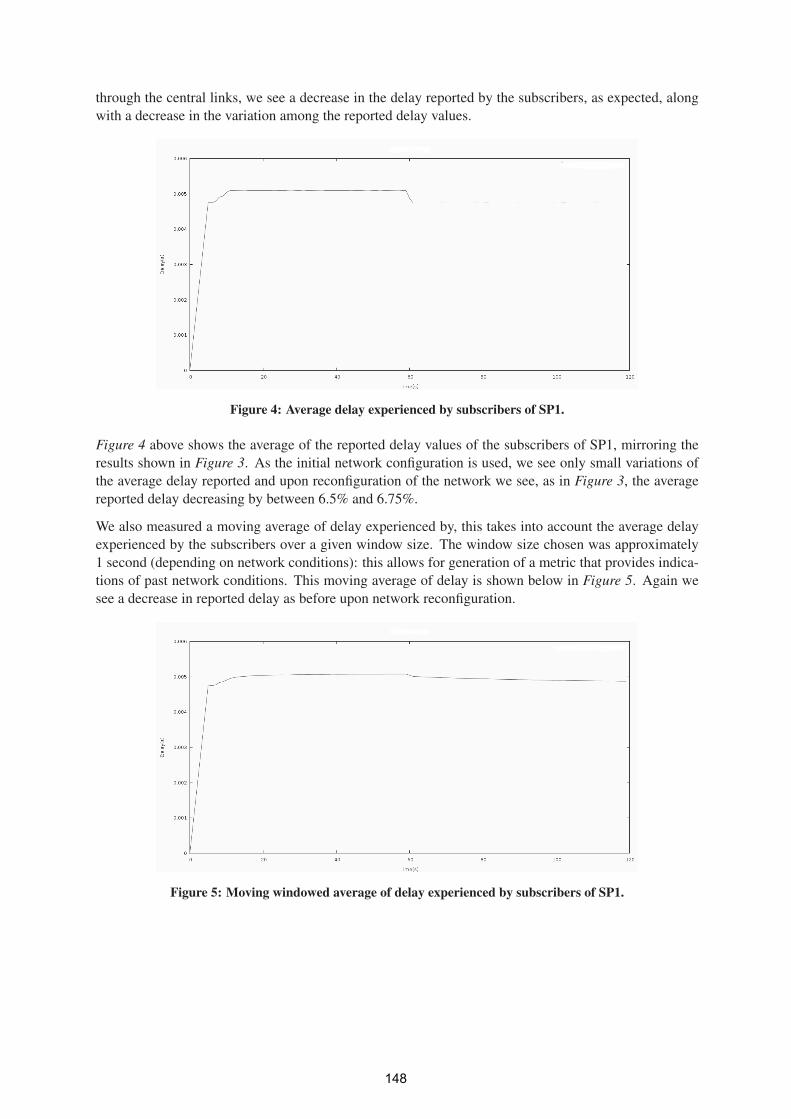
through the central links, we see a decrease in the delay reported by the subscribers, as expected, along
with a decrease in the variation among the reported delay values.
Figure 4: Average delay experienced by subscribers of SP1.
Figure 4 above shows the average of the reported delay values of the subscribers of SP1, mirroring the
results shown in Figure 3. As the initial network configuration is used, we see only small variations of
the average delay reported and upon reconfiguration of the network we see, as in Figure 3, the average
reported delay decreasing by between 6.5% and 6.75%.
We also measured a moving average of delay experienced by, this takes into account the average delay
experienced by the subscribers over a given window size. The window size chosen was approximately
1 second (depending on network conditions): this allows for generation of a metric that provides indica-
tions of past network conditions. This moving average of delay is shown below in Figure 5. Again we
see a decrease in reported delay as before upon network reconfiguration.
Figure 5: Moving windowed average of delay experienced by subscribers of SP1.
148
5 Conclusions
In this paper we described some of the QoS metrics that can be used to characterise network perfor-
mance and how these metrics specifically apply to IPTV service provision. We also outlined a method
to use these QoS metrics to provide information on current network conditions and how, using this in-
formation, a network management function can modify network parameters to optimise service flows
through the network. Our simulation results show the decrease in delay experienced by subscribers of an
IPTV service when using this approach, thus minimising excessive wait times and increasing end-user
experience.
Future work will include extending the simulation setup to include multiple metrics and making deci-
sions based on these, as well as storing previous network configurations for use as an aid to network
reconfiguration. We also intend to investigate the impact of multiple service types concurrently using the
network, as would be found in actual triple-play service deployments. Comparisons will also be carried
out against other routing algorithms used in video content distribution.
Acknowledgements
This work was supported in part by Science Foundation Ireland under the FAME SRC Grant no. 08/SRC/I1403.
References
[1] A. Yarali and A. Cherry, (2005) Internet Protocol Television (IPTV), TENCON 2005 IEEE Region
10 pp. 1-6.
[2] Z. Jelacic, H. Balasko, and M. Grgic (2008) End-to-End Real-Time IPTV Quality Monitoring, EL-
MAR 2008. 50th International Symposium, pp. 73-77.
[3] H. Joo, H. Song, D. Lee, and I. Lee. (2008) An Effective IPTV Channel Control Algorithm Consid-ering Channel Zapping Time and Network Utilization, IEEE Transactions On Broadcasting, Vol. 54, pp.
208-216.
[4] Y. Zhu, W. Liu, L. Dong, W. Zeng, and H. Yu (2009) High Performance Adaptive Video ServicesBased on Bitstream Switching for IPTV Systems, Consumer Communications and Networking Confer-
ence (CCNC) 2009. 6th IEEE, pp. 1-5.
[5] G. Cunningham, P. Perry and L. Murphy (2004) Soft, Vertical Handover of Streamed Video, Proc. 5th
IEE International Conference on 3G Mobile Communication Technologies (3G 2004).
[6] G. Muntean, P. Perry and L. Murphy (2005) Subjective Assessment of the Quality-Oriented AdaptiveScheme, IEEE Transactions on Broadcasting, Vol. 51, No. 3, Sept. 2005, pp. 276-286.
[7] Scalable Network Technologies (SNT), Website: www.scalable-networks.com
149
Policy Refinement for Traffic Management in Home Area Networks – Problem Statement
Annie Ibrahim Rana1, Mícheál Ó Foghlú2
Telecommunications Software and Systems Group
Waterford Institute of Technology Waterford, Ireland.
1 [email protected], 2 [email protected]
Abstract
Traditional home area network (HAN) equipment is usually unmanaged and network traffic is served in best effort fashion. This type of unmanaged network sometimes causes quality-of-service issues in the HAN, for example loss of quality in streamed video or audio content. Traffic management rules using policies to prioritise certain types of traffic according to user requirements and to assign bandwidth limits to other traffic types. However very little work has been done yet addressing the specification of these requirements, how they would be communicated to the gateway device using policies, and how the policies would be refined into device level configurations to effectively implement the user requirements. In this paper we briefly discuss this as a research problem, placing it within the context of the research goals and an initial research methodology in the area of policy refinement for policy-based traffic management in home area networks (HANs).
Keywords: Policy, Policy-based traffic management, Policy refinement, Home area network, Autonomic networks.
1 Problem Statement In a traditional home area network (HAN), there can be several types of network traffic e.g. VoIP, audio & video on demand, web, large file downloads and uploads. Usually the HAN Internet Protocol (IP) traffic works in a best effort fashion where quality-of-service (QoS) is not guaranteed. Therefore the quality can deteriorate when some bursty traffic e.g. UDP based download or upload, tries to consume the maximum available bandwidth. This can cause bandwidth unavailability for other traffic types, such as streaming audio or video, that are very sensitive to QoS. This leads the network into a state of congestion, which blocks other traffic flows (usually though packets being delayed or dropped due to the congestion) and results in poor quality of network applications. One solution to resolve congestion issues is to assign more bandwidth for the network, but logically this can only alleviates the issue rather than providing a long lasting remedy for better traffic management. In addition, in many HANs, customers have a maximum potential bandwidth set by the service provider’s infrastructure; in ADSL this is often a lower maximum for upload compared to download. The general problem with adding more bandwidth as a solution is that greedy network applications simply attempt to consume more of the bandwidth, and risk here is that the actual congestion remains. In a HAN most user generated traffic has equal priority with no bandwidth constraints; this means the packets are queued on the gateway device in a first-in first-out (FIFO) queue (depending on default configuration). When two UDP traffic flows (e.g. VoIP and Video streaming) of equal priority compete for bandwidth, their quality can suffer because of varying bandwidth availability, which can result in great packet loss and unwanted packet
150
delays. We know that policies can be used to manage QoS requirements, therefore by separating the VoIP and streaming traffic into two different priority queues, with optimal flow rates, this can potentially improve the quality both traffic flows. It works best where one is clearly a lower priority than the other. Policy-based network management (PBNM) provides a flexible and robust mechanism to allocate bandwidth and to prioritise the network traffic. This approach has been used extensively in larger telecommunication networks, but potentially is also a good approach to meet HAN requirements, if this type of solution can be designed so that it can be easily managed by end users. The best advantage of using PBNM is that policies can be changed at run time without affecting underlying working model. This means that traffic management policies can be changed dynamically; this is a basic requirement in managing network traffic as user requirements can change over time (e.g. new devices, new services, changing priorities). To cater for this issue, autonomic policy refinement can play a very important role in establishing a policy-based traffic management system on residential gateway device. The quality of network traffic is measured in terms of QoS parameters -i.e. packet loss and delay, our research questions are: (1) How can QoS requirements for a traffic flow or aggregate flows be communicated to a gateway device using policies? (2) How can a comprehensive policy framework can be devised from the user requirements and then refined into configuration rules, which also contains desired QoS settings? As currently formulated, these are not easy to evaluate or measure, and will they will require further refinement. The aim is to focus in on the knowledge representation issues in a suitable policy representation, but to deploy a working prototype that demonstrates that it can be effective in a real HAN deployment. Additionally, issues such as the usability of the resulting systems by end users are important, but may lead the research towards a more social science methodology, that the author would rather avoid. Thus the aim is to design the questions so that they can be evaluated through an empirical experimental design or simulation, whilst ensuring that the results have some real validity and are not merely artefacts of simulation.
2 State of the Art Significant work has been published relating to the management of QoS requirements in access and core networks using policy-based network management (PBNM). Different architectures are proposed in [2] for the control plane of a software router that integrates signalling protocols and control mechanisms for QoS and in [3] using PBNM. The paper [2] claims that the use of proposed architecture can meet the end-to-end QoS requirements for most the internet applications if applied on the access network routers. Traditional PBNM systems focus on the management of core networks and the internet in the broader sense. The access and the core networks use policies to meet service level agreements (SLAs) for different service users. However the concept of end-to-end QoS in the big picture would remain in a status-quo if QoS is not ensured at the edge networks. PBNM can play a significant role in managing home networks focusing on users’ requirements. We purpose an intelligent gateway device to control and manage all outgoing and incoming traffic. The device can be configured according to user requirements through a policy manager; it would make HAN users’ life much easier. The paper [4] proposes similar solution but it focuses more on intelligent control centre (ICC) to connect all other networks with in HAN e.g. power line network, PC network, wireless network, home automation network, and home gateway.
151
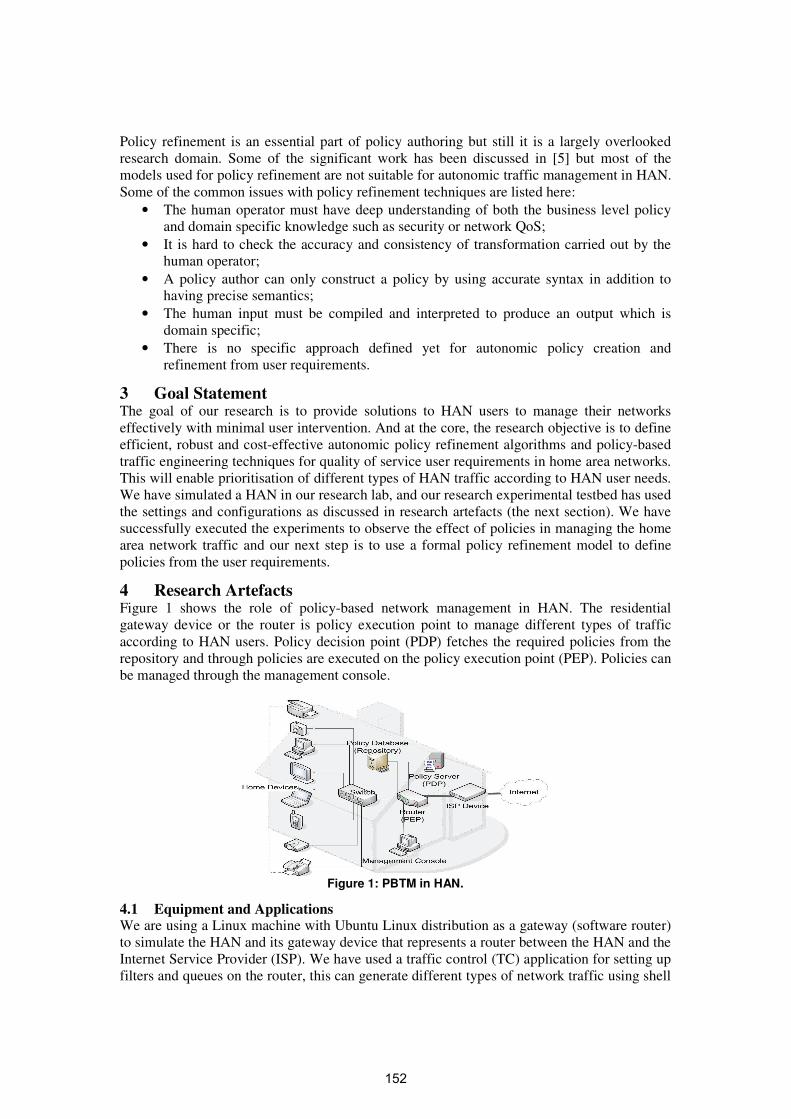
Policy refinement is an essential part of policy authoring but still it is a largely overlooked research domain. Some of the significant work has been discussed in [5] but most of the models used for policy refinement are not suitable for autonomic traffic management in HAN. Some of the common issues with policy refinement techniques are listed here:
• The human operator must have deep understanding of both the business level policy and domain specific knowledge such as security or network QoS;
• It is hard to check the accuracy and consistency of transformation carried out by the human operator;
• A policy author can only construct a policy by using accurate syntax in addition to having precise semantics;
• The human input must be compiled and interpreted to produce an output which is domain specific;
• There is no specific approach defined yet for autonomic policy creation and refinement from user requirements.
3 Goal Statement The goal of our research is to provide solutions to HAN users to manage their networks effectively with minimal user intervention. And at the core, the research objective is to define efficient, robust and cost-effective autonomic policy refinement algorithms and policy-based traffic engineering techniques for quality of service user requirements in home area networks. This will enable prioritisation of different types of HAN traffic according to HAN user needs. We have simulated a HAN in our research lab, and our research experimental testbed has used the settings and configurations as discussed in research artefacts (the next section). We have successfully executed the experiments to observe the effect of policies in managing the home area network traffic and our next step is to use a formal policy refinement model to define policies from the user requirements.
4 Research Artefacts Figure 1 shows the role of policy-based network management in HAN. The residential gateway device or the router is policy execution point to manage different types of traffic according to HAN users. Policy decision point (PDP) fetches the required policies from the repository and through policies are executed on the policy execution point (PEP). Policies can be managed through the management console.
Figure 1: PBTM in HAN.
4.1 Equipment and Applications We are using a Linux machine with Ubuntu Linux distribution as a gateway (software router) to simulate the HAN and its gateway device that represents a router between the HAN and the Internet Service Provider (ISP). We have used a traffic control (TC) application for setting up filters and queues on the router, this can generate different types of network traffic using shell
152

scripts. The IPTables package is used for defining NAT, as commonly deployed in IPv4-based HANs. The TCPDump package is used for packet and queue analysis, the raw data dumps being processed by some perl scripts. The testbed will be further refined to allow investigation of PBNM. The interesting aspects of the testbed that we would be looking at in HAN traffic management are:
1. Use of policy continuum [6] 2. Formal policy specification language 3. Use of autonomic policy refinement techniques [1] 4. Building traffic management tool for HAN users
.
5 Methodology The aim is to use a set of research questions that can be empirically tested on the extended testbed. Thus the aim is to measure the effectiveness of a managed QoS network, compared to an unmanaged network, quantitatively. Some additional work will be done to measure the effective usability of the resulting PBNM system, but this usability will not be the main focus of the methodology. This may involve some user testing and questionnaires on a small sample set.
6 Conclusion We have presented the key challenges being addressed in our research and outlined the major elements of ongoing research work in a number of inter-related network management fields that are relevant to policy-based traffic management, quality of service and policy refinement. The primary research methodology is an experimental one, potentially using elements of actual deployments of policy-based traffic management system that can be tested with real network traffic.
Acknowledgement The authors wish to acknowledge the support of the SFI SRC FAME (Ref: 08/SRC/I1403) award that contributed financially to the work that is reported in this article.
References [1] Jennings, B., van der Meer S., Balasubramaniam, S., Botvich, D., OFoghlu, M., Donnelly, W.
and Strassner, J., (2007). Towards autonomic management of communications networks. Communications Magazine, IEEE Publications, 45(10):112–121, October 2007.
[2] Maniyeri, J., Zhang, Z., Pillai, R., and Braun, P. (2003). A Linux Based Software Router Supporting QoS, Policy Based Control and Mobility. In Proceedings of the Eighth IEEE international Symposium on Computers & Communications ( June 30 - July 03, 2003). ISCC. IEEE Computer Society, Washington, DC, 101.
[3] Ponnappan, A., Yang, L., Pillai, R. and Braun, P., (2002). A Policy Based QoS Management System for the IntServ/DiffServ Based Internet. In Proceedings of the 3rd international Workshop on Policies For Distributed Systems and Networks, POLICY. IEEE Computer Society, Washington, DC, 159.
[4] Liu, G., Zhou, S. Zhou, X. and Huang, X., (2006). QoS Management in Home Network. In Proceedings of the international Conference on Computational intelligence for Modelling Control and Automation and international Conference on intelligent Agents Web Technologies & international Commerce ( November 28 - December 01, 2006). CIMCA. IEEE Computer Society, Washington, DC, 203.
[5] Damianou, N., (2002) A Policy Framework for Management of Distributed Systems,” PhD Thesis, Imperial College London, Mar. 2002.
[6] Davy, S., Jennings, B., Strassner, J., (2007). The policy continuum - a formal model, Proceedings of the Second IEEE International Workshop on Modelling Autonomic Communications Environments, MACE, pp. 65–79, 2007.
153
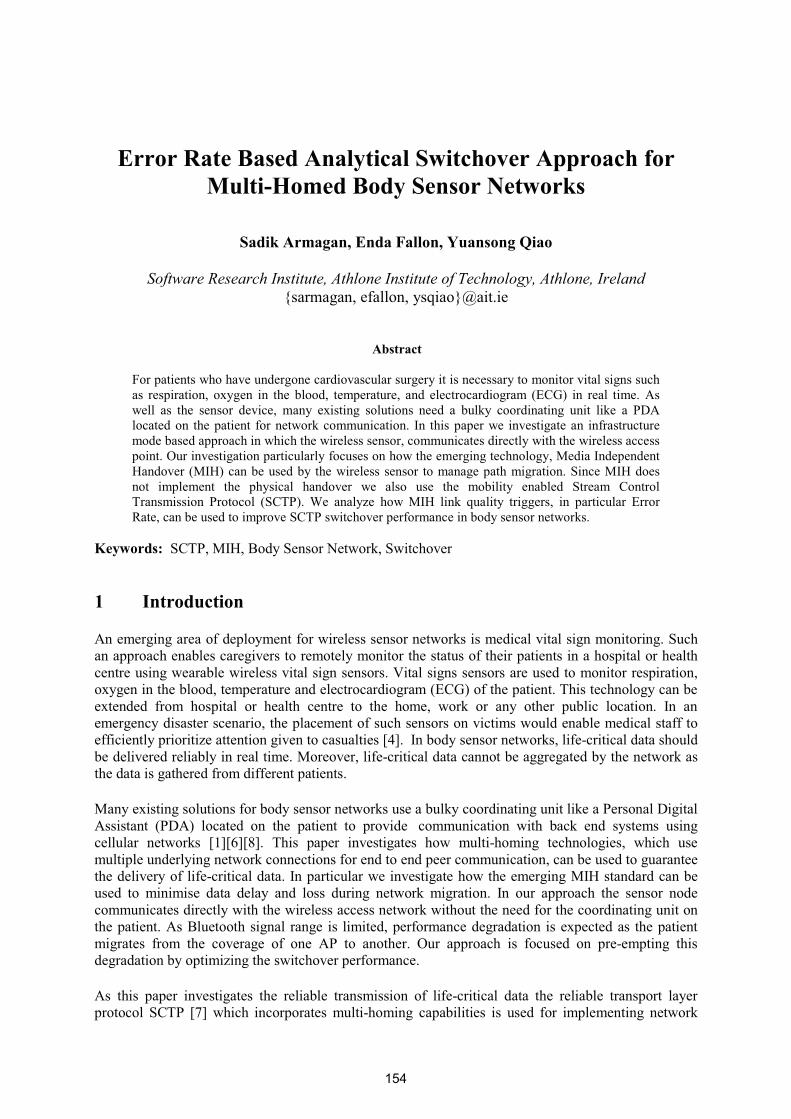
���
�������������� �������������������� �����������������������������������������
��
������ ��� ��!������"�����!�#������ �$������
����������� ��������������������������� ��������������������������������� �����������������
��
%��������
���������������������������������������� ���������������������������������������� �������������� ����������� ������ �� ���� � ���� ������������ ��� � ���������������� !"#$� �� ��� � ������%���� � ��� ���� ������ ������� ���� �������� �� ������ ���� �� �� &�� ����������� ���� �&�� �� '(%� ��������� ����������� ���������&�������������� )� ����� ��������� ������������� �������������������������������������������������� ���������������������������� ��������������� �����������������*���������������������� �� ��������������������������������� ����+�����)��������,������� +),$��������������� �������� ���� ������ ������������������������-����+),��������� ��� ����� ���� ������� � �������� ��� � ��� ���� ���� ���� ���� ��� ��� -������ "���� �.���������� '������ � -".'$�� /�� �� �0�� ���� +),� �&� ��� ���� ��������� �� ������� ��� !�����1��������������������������-".'�����������������������������������������&����
�&������'��-".'�+),�2����-�����3�����&�-������������(� )������������
%�������������������� �������������� ���������������&����������� ����� ���������������-������������������ ����������������������� ������������������������������������������������ ������� �������������������� ������ �������� �������������4��� �������������������������������������������������������� �������������������� ���������������� !"#$����������������.��������� ������������������ ����� ������� � ��� ��� ��� ������ ��� ���� ����� ���&� ��� ��� ������ ��� ��� �������� )� ��������������������������������� ����������������������������������� ����� �������� ������������������ ����������0����������������������� �����567���)�����������������&�� ���8������� ���������� ������� ��������� ��� ������� �������+�������� ���8������� �������������������������������������&������������������������������������������������
+������������� ��������������������������&���������� &����������������� �&����'����� �(����� �%�������� '(%$� ������� �� ���� ������� ��� �������� ������������� ����� ���&� ��� �������� ������� � ��� �����&�� 5975:75;7�� .���� ������ ������������ ���� �� ��8������ ����� ������ ������ ������ ��� ������ ���������&��������������������������������������������������������������������� ��������� ���8������� �������)�������� ���������������������������������+),�������������������� ��� �������� ����� �� ��� ��� ���� ������ �����&� ���������� )� ���� ��������� ���� ������ ���������������������� ��������������� ����������������&������������������������������������������������������%��2 ������������ � ����� ��� �������������������������������������������� �������������������� ����� ���� ��������� ��� ��� %'� ��� �������� *��� ��������� ��� �������� �� ���8������� �������������������������0�������������������������������
%�� ����� ������ ������������ ���� �� ��� �� ����������� ��� ���8������� � ����� ���� �� ��� �� ��������� ������������ � -".'� 5<7������� �������������� ��8������ ������ ������ ��� ����� ���� ��� ������� �����&�
154

���� �����/������� ����������������������������� ������-".'�������������������������������)!.�=�� ��� �������� +),� 5>7� ��� ������0�� ����������� ����� ���� ����� ������ �����&��� *��� +),���� ��������� ����� ��� ��� ���� �&� �������� ���������� ��� ���� 3����� � )�������� ��� -�������� ��.���� ���� ���� ����� ����� ��� �� ������� ��������� /�� �������� ���� ����������� ��� ���� ���������������� �������� -".'� ����� ��� ����� ��������� ������������ 1��� ��� ��������� �������� ����� ��������������������������������������
.���� ������ ��� �����0��� ��� �� ���?� -������ @� ���������� ���� �� ����� ���&�� -������ A� ��� ���� ��������� ������������������� ������-������6������������������������������������� �0����������� ����-������>������������������ �������
*� ������+�����.����� ���� ������ ��� �� ������ ��� ������0�� ���� 2���� -����� 3�����&�� ������������ )� 5997� ���������� ��������� ��� ��������� � ������� ���� ������ � ������ �����&�� �� ��� ������� ���������������� )�� ��������� ������� �� ���� ������� ���������� ��� ��� ������ �� ������ �������� .����� ������� ����������������������������%� ��������������������������������������������� ������������������� ����������������������� ���������)�597��������� �������������������������������������������&�����������������������'(%���������������������������������)�5;7����������������������������������!"#����� ����������������������'(%�������������������� �������������� ���������������������������������������������������)�5:7��������� ������������� ������������� ����� ������+).��� � ����������������.������������������� ������ ��� '(%� ��� ���� !"#� ����� # ��� � '��������� -������ #'-$� �������� �&�� ������������ ����� ������&�����������% ��������� ����������������������������� &�������������������� �������������������-���������������������������������������������&��������&��� �����������������������*��� ��������� �����2 �������� �� ������������������� ������� ���� ����� ������� ������ �� ��� ���� ��� ������&�����������������������������������������������������)� 5<759@7� -".'� ��� ������� ��� �� �� ��� �� ."'8����� �� ���������8�������� ��������� ����� ������� ���������������)!.���.���&���������������-".'��� ��8����������� ��8�����������&����������� ����������������������� 8������������������������������������-".'���������� �&����&8��������������������������������� �����������������&8��� �&���������������������������������������������������������������-".'=������������������������� ��������������� �&���� ������������)�������������������� ��������������������������������������������������&8����������)� 59A7� �� ��������� ��� )!!!� ��� �������� +),� ;B@�@9$� ������ ��������� ���� ���� ���� ������������������������� ���������������������&� ���������� ������������� )� 5A7� �������+),�������-".'�������������������������������������% ����������&��������������������+),������������������������������������������������������-".'������� ����������������������������������������,� -������ ��.�������,/(� �����)����������������0�)�1��)!!!�;B@�@9���������� ���&������+),��������� ���������� ������&����������������� ������������������������������������������������&������������+),������������ �������������������������� ���)���������������� ������� �������������������� �&��-".'��)��������������������������������������������� ���� ����������� �&�� �&� ������� ��������� �����&�� ��������� ����� ����� .��� +),����������&������������&��������������� ���.���+),�������������������A����������� �����C��������������2�.���������������������������������� ������������������������������������� �&������������������.���������������� �� ����D�&�%��� �� ��D�&�E��D�&�'����������"�����D�&�#����E��D�&�(���D�&�#����(���D@-(E�.����������-������!����1� ���&������
155

� ������������2�.������������������������������������������������������������ ������������� ����� �������)���� ���������������������������� ��������+),� ����������� ��������� ����������� ����+),����$���������+),���� ����� ����� �����+),����+%"����+),����',F$������ ��� �� ������ 2� .��� ���������� �������� ��������� ������� ��� ������� ���������� ����� ������������ ����� �� ���� �� �����&� ����������� .���� ��� �� �� ���� �&� ����� ����������� ����� ������� �����������+%"������������������������������������,/*�� ������3�������-������������4��������0�3-41��-".'� ����� �� ��� �� ��������� ������������ ����������� ���� )!.����� �������������������� )�� ����������������� ��� ��������� �� ������ ������ � ��� ��� ���������� �������� ����������� .��� -".'=�� ������������� ���� �� ��8������ ��� �� ��8��������� ������ ������� !�������� ���� ������ � �� ���� ���� ���������� �������� �������������� ��&�� ��� ������ �� ���� -".'� ��� ������ ��� ���� ��������� ����� ������ ��������������������� ��������������������������&������������,/*/(� ����������� ��-".'���� ������������������������������������������������ ��� ��)'���������������������� ���������� ������ �� ��� �� �����&� �������� ���� ���� �� ��� %� �������� ������� ���� �������� ���&�������������������������-".'������������������������������������������������������������������������(���� ����������������=������������ �&���������������������)'����������������-".'��������������������������������������������8������������������������������������������������������ ��������.����������� ��������������� �&����&�������������������� ����������������������������������������������������������3�8�������������������������������������������������������������������������������� ������,/*/*� ������������� ��-".'���������������� ��8�������������������������������� ���������������!�������������� ����� ����������� ��� � � ������ ��������� )�� ���� ��� ��� ���� �������� ��� � ��&��� ��� ����� ��� ������� ���� �������������� �� �� ������������ .���� ��� ��������� �������� ��� ����� ��� ������ �� G���������� ��� ���H����� ����������������������������������������������������,/*/,� 4���������������%��-".'������������ ������� ��� ��� ���� ������� � ������ ��� ���������� ��� ������������ ����� ��� ���������� ��� ��� ���������� ��� ���� ��������� ������ .���� �������� ����� ��� ���� �� ����� ���� ��������������&���� ��������&�$� ��������������� ��� �����������/��� ����������������� ��� ����������� ������������� ������� � ��� �� ������ ��� �������� ����� ���-".'��������� ��� ���� ���� ���&���� ����� ����������� .��� -".'� ����� ��������� ����� ���������� ���&���� ��� ����� � ���� �������� ���� ��� ����������������)��������&�� ����������������������������������������������������������������������������������������������� ����������������������������G������H���)������������&������������������������������ �������������� ���� ���������� ���������� ������ � ���� �������� ��� ��������� ��� G�� �H�� � )�� ��-".'� ������ ����� ��� �������� �� ��&�� �������� ���� �� -".'� ����� ���&� ����� ���� ������������������������������������1������������.���8*��� 1.*$������������� ����&�������������������&���� ����� )�� �� ������ ��� ����� ���&� ������ ������ ��� ��� ����� ������ �������� ���� -".'� ����������'����+���1������ ����� ��>$��������������� ����������������G�������H���������������������� �������� ��� ���&���� ��� � ��� �������� ������� ������ "������� �� 1.*� ��� �� ��������� ������� ������������������������� ������������������ ����,/,�� ��������-������ ���2 �������� ��� �� ��� ����� ��� ������ ������ ����� ����� ���� ������ �� ���� ����� ��� �� ��� ����� ��������� ������������������������������������������ ��������������������������������� ��
156
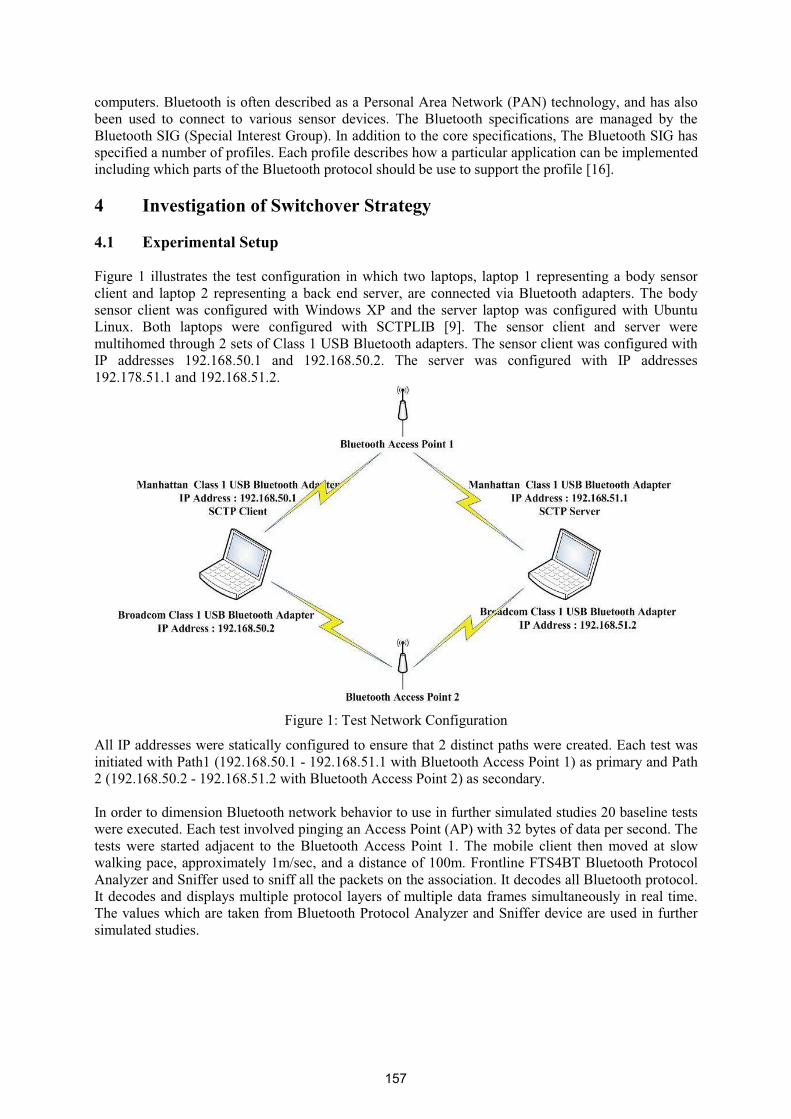
�����������2 �������������������������������'����� �%����3�����&� '%3$������ ������������ ������� ����� ��� ������ ��� �������� ������ ��������� .��� 2 �������� �������������� ���� ������� ��� ����2 ��������-)#� -����� �)�������#����$��)�����������������������������������.���2 ��������-)#������������������������������� ����!��������� ������������������������� ������ ���������������� ��������� ������������������������2 ��������������� ����� ����������������������������� ��59:7���5� )����� ������������������������ ���5/(�� �6����������������������9� � ��������� ���� ����������������� �������� ���� ������� ������9� ������������������������� ������� ������@� ����������������&���� ������� ���� ������������2 ������������������.�������������� � �������� ���������������/������I'� ��� ���� ������� ���������� ���������������E�����D����� 2���� ������� ����� ���������� ����� -".'D)2� 5J7�� .��� ������ � ���� ��� ������� ������� ����������������@���������" ����9�E-2�2 ������������������.���������� �����������������������)'� ���������� 9J@�9:;�>B�9� ��� 9J@�9:;�>B�@�� .��� ������� ���� ���������� ����� )'� ����������9J@�9<;�>9�9����9J@�9:;�>9�@��
��������9C�.����3�����&�"�����������
% �)'����������������������� ��������������������������@�����������������������������!���������������������������'���9� 9J@�9:;�>B�9�8�9J@�9:;�>9�9������2 ��������%������'����9$���������������'����@� 9J@�9:;�>B�@�8�9J@�9:;�>9�@������2 ��������%������'����@$���������������
�)������������������2 �������������&������������������������������� �������������@B����� ������������������������!������������ ������������%������'���� %'$������A@��������������������������.�������������� �������� ��K����� ��� ����2 ��������%������'���� 9��.������� �� � ���� ���������� ��� � ����� &������������������� ��9�L��������������������9BB������� ����.-62.�2 ��������'������ �%� �0������-�������������������� ��������&����������������������)����������� �2 ��������������� ��)����������������� ������ ��� ��������� � ����������� ��� ������������������ ������ ������� �������.����� ����������������&�������2 ��������'������ �%� �0������-������������������������������������ ���������������
157
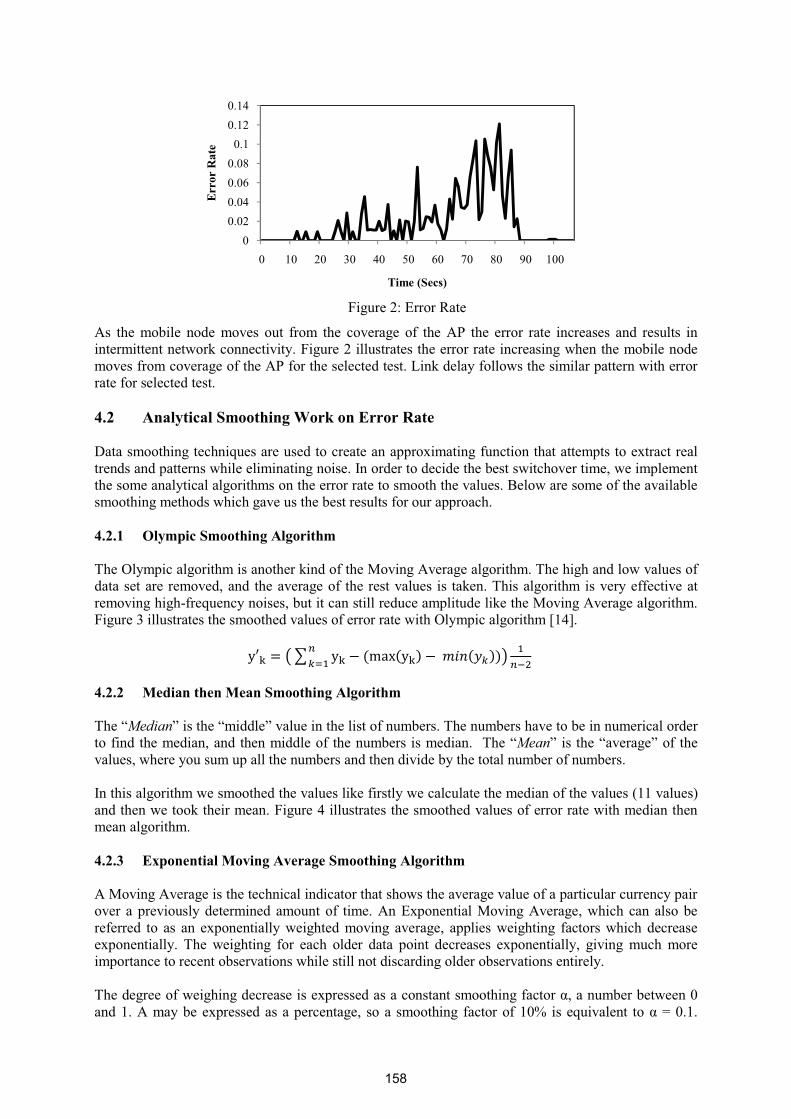
��������������@C�!�����1����
%�� �������� �� ���������� ���� ����� ���� ��������� ��� ����%'� ���� ������ ����� ��������� ��� ���� ��� ������������������&��������������������@�� ��������������������������������������������� ���������������������������������%'����������� ������������D�&��� ����� ������������ �������������������������������� ��������������5/*�� ������������������ �+������������������(�������������������������������������������������������������������������������������������� ��������������������� ��� ��������������)������������������������������������������������ ���������������� ����� �� ������������������������������������������ �����2� ����������������������� �� ���������������������������������������������� ����������������������5/*/(�� .��������������� � � ��������.���* ������� ������������������&����������+�����%�������� ���������.����������� ����� ������������������������������� �������������������������� ������� ��&���.����� �����������������������������������������8���������������������������� ����������� ������ �&������+�����%�������� ����������������A�� ������������������������ �����������������������* ������� ��������5967������������������������������������������������ � �� �� �� ��� ��������
��� �� ������������������
���������������5/*/*�� ���������������������� � � ��������.���G!����H��������G���� �H��� ��������� ���������������.������������������������������ ����������������������������������� �������������������������� �.���G!��H���� ����G�������H���������� ���������������������� ������������������������������������� ��������������������)������� �������������������������� ���� �&������� ������� �� ����������������������� ���� 99��� ���$��������������&�������������������6�� ������������������������ �������������������������������������� ����������5/*/,�� �6�������������� � ��� ��������� � � ��������%�+�����%��������������������� ����������������������������������� ��������������� ��������������������� ���������� ��������������������� ������%�!������� �+�����%����������������� ��������������� ��� ��� �� �������� ����������������� �������� ��� ������������� �������������� ����������������� ��� .������������ ���� ����� � ���� ����� ����� ���������� �������� �� �������������������������������������������������� ����� ��������������� ��������������������� ����.�����������������������������������������������������������������������M����������������B����9��N��������������������������������� ����� ��������� ����������9BO���������� ��� ���M�P�B�9��
BB�B@B�B6B�B:B�B;B�9
B�9@B�96
B 9B @B AB 6B >B :B <B ;B JB 9BB
���������
-���0���1
158
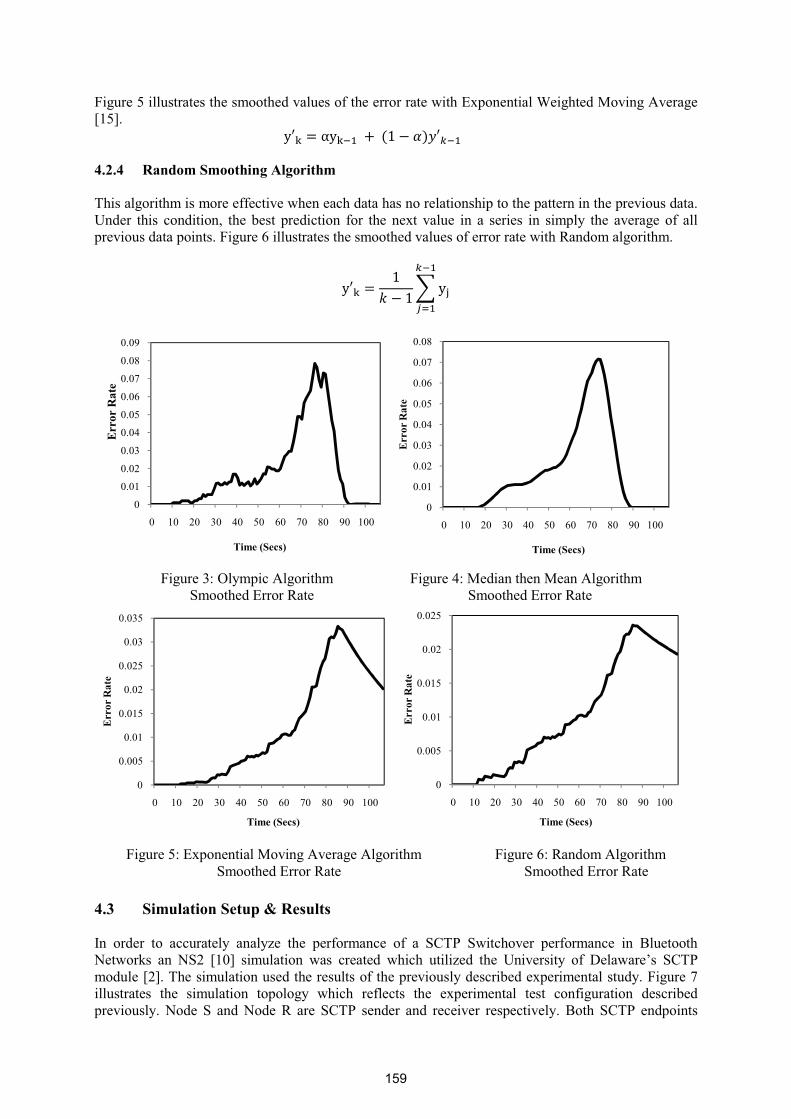
�������>�� ������������������������ ���������������������������!������� �/��������+�����%�������59>7��������������������������������������������������������������� � ����� ���� ���������5/*/5�� ��������������� � � ����������.����� ������������������������������������������������ ��������������������������������������������E���� ����� �������� ��������� ���������� ���� ���� ���� �� ��� �� �� ������� �� ���� �� ���� �������� ��� � �����������������������������:�� ������������������������ �����������������������1������ ����������
��� � �� � � �
���
!���
�
��������������������������AC�* ������% �����������������������������������6C�+���������+���% �����������������������������������-��������!�����1���������������������������������������������-��������!�����1����
�������>C�!������� �+�����%�������% ����������������������������������:C�1�����% ���������������������������-��������!�����1�����������������������������������������������������-��������!�����1����
�5/,�� ����������������7���������)� ������ ��� �������� �� �� �0�� ���� ����������� ��� �� -".'� -���������� ����������� �� 2 ��������3�����&�� �� 3-@� 59B7� ���� ����� ���� �������� ������ ��� �0��� ���� E��������� ��� (� �����=�� -".'����� ��5@7��.������� ������������������ ������������������ ���������������������� ���������������<�� ��������� ���� ���� ����� ���� ���� ������ ��� ����� ���� ���������� � ����� ������������ ������������������ ���3���� -� ���3����1� ���� -".'� ������ ��� ��������� ���������� ���2���� -".'� ��������
B
B�B9
B�B@
B�BA
B�B6
B�B>
B�B:
B�B<
B�B;
B�BJ
B 9B @B AB 6B >B :B <B ;B JB 9BB
���������
-���0���1
B
B�B9
B�B@
B�BA
B�B6
B�B>
B�B:
B�B<
B�B;
B 9B @B AB 6B >B :B <B ;B JB 9BB
���������
-���0���1
B
B�BB>
B�B9
B�B9>
B�B@
B�B@>
B�BA
B�BA>
B 9B @B AB 6B >B :B <B ;B JB 9BB
���������
-���0���1
B
B�BB>
B�B9
B�B9>
B�B@
B�B@>
B 9B @B AB 6B >B :B <B ;B JB 9BB
���������
-���0���1
159
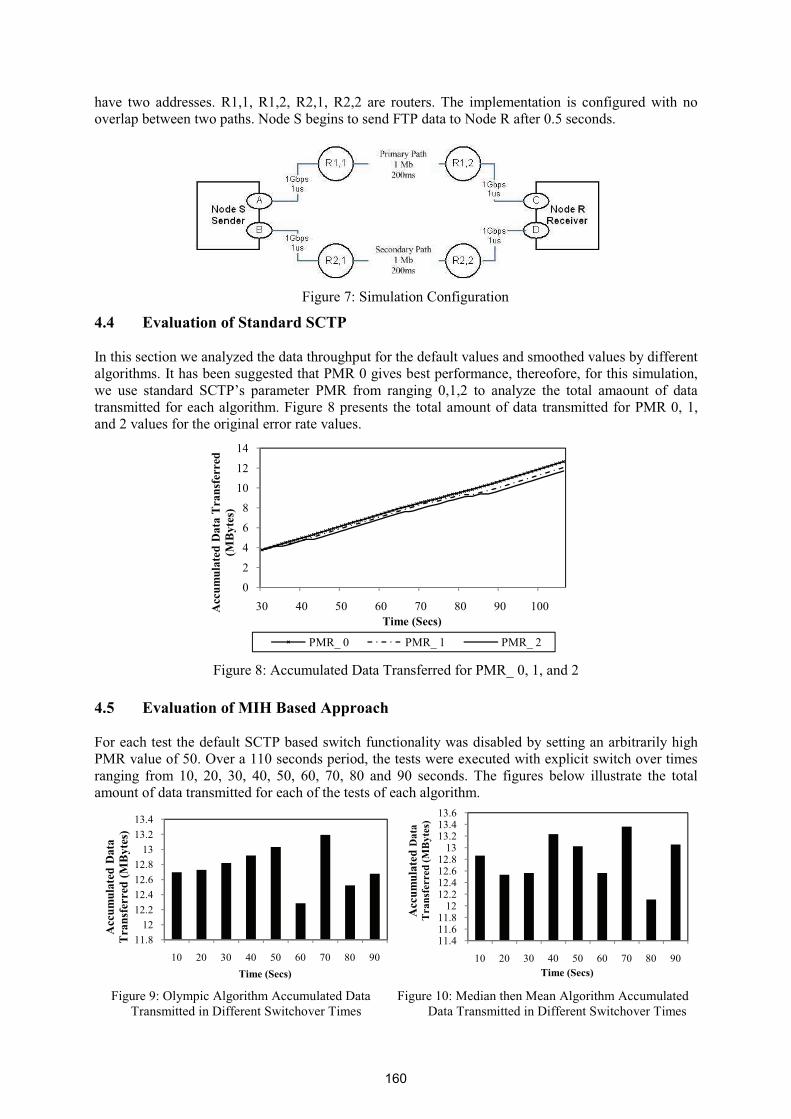
����� ���� �����������199�19@�1@9�1@@� ���� ���������.��� ��� ��������� ��� ��������������� ������ ���������������������3����-���������������.'���������3����1�������B�>����������
�������������<C�-��� �����"�����������
5/5�� ������������������������3-4���)������������������ �0������������������������������������ ���� ������������������ ����������������� ����������)�������������������������'+1�B����������������������������������������������� �������� ���� �������� -".'=�� ���������� '+1� ����� ������ B9@� ��� �� �0�� ���� ���� � ������� ��� �������������������������� ����������������;����������������� ������������������������������'+1�B�9����@��� ������������������ �������������� �����
��������;C�%����� �����(����.��������������'+1Q�B�9����@�
�5/8�� ���������������)������ ��������������������������������� ��-".'��������������������� ������������� ������������������������ �������'+1��� ������>B��*������99B����������������������������������������������� ����������������������������� ����� 9B� @B� AB� 6B� >B� :B� <B� ;B� ��� JB� �������� .��� �������� �� ��� � �������� ���� ���� ��������������������������������������������������������� ���������
� �������������JC�* ������% ��������%����� �����(������������������9BC�+���������+���% ��������%����� ����������������.������������(��������-����������.������������������������(����.������������(��������-����������.������
B
@
6
:
;
9B
9@
96
AB 6B >B :B <B ;B JB 9BB ����
�����
�9����-���������
0����1
-���0���1
'+1Q�B '+1Q�9 '+1Q�@
99�;9@
9@�@9@�69@�:9@�;
9A9A�@9A�6
9B @B AB 6B >B :B <B ;B JB
����
������9
����
-���
������0�
���1
-���0���1
99�699�:99�;
9@9@�@9@�69@�:9@�;
9A9A�@9A�69A�:
9B @B AB 6B >B :B <B ;B JB
����
�����
9����
-���������0�
���1
-���0���1
160
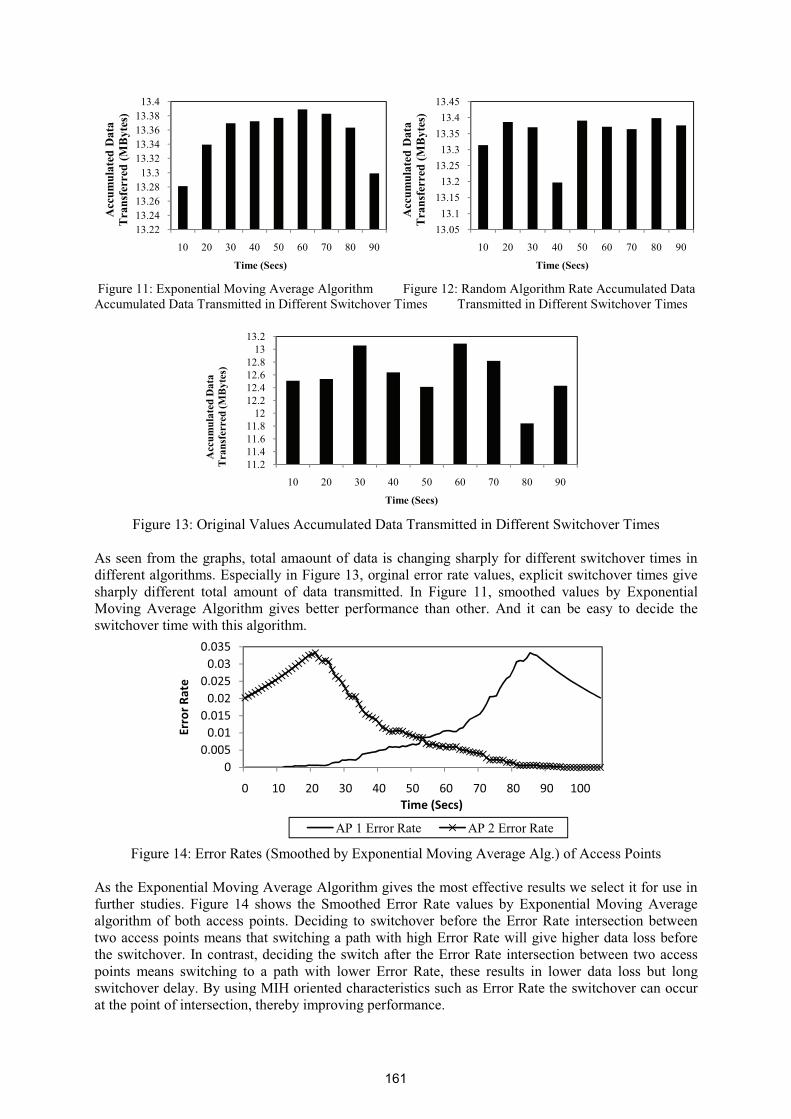
� ���������99C�!������� �+�����%�������% �����������������������9@C�1�����% ��������1����%����� �����(����%����� �����(����.������������(��������-����������.�������������.������������(��������-����������.�����
�
��������9AC�*����� �4� ����%����� �����(����.������������(��������-����������.�����
�%�������������������������� ������������������������������� �������������������������������������������� ����������!������ �����������9A������ �������������� ������� �������������������������������� �� ��������� ���� � ������ ��� ����� ������������ )� ������� 99� ��������� �� ���� ��� !������� �+�����%�������% �������� ������ ������� ����������� ���� ������� %�� ��� ��� ��� ����� ��� ������� ������������������������������� ����������
��������96C�!�����1����� -�����������!������� �+�����%�������% ��$����%������'�����
�%������!������� �+�����%�������% ������������������������������������� �������� ������������������������� ��������� ������� 96� ������ ���� -�������� !����� 1���� �� ���� ��� !������� �+�����%�������� ����������� ����� ������� �������(������� ��� ����������� ������� ����!�����1���� ����������� ������������������������������������������������������������!�����1������ ������������������ ���������������������������)��������������������������������������!�����1��������������������������������������� ����� ��������� ��� �� ����� ����� ����� !����� 1���� ������ ���� ��� �� ����� ����� ���� ���� ���������������� ����2�������+),���������������������������������!�����1������������������������������������������������������������������������������������
9A�@@9A�@69A�@:9A�@;9A�A
9A�A@9A�A69A�A:9A�A;9A�6
9B @B AB 6B >B :B <B ;B JB
����
������9
����
-���
������0�
���1
-���0���1
9A�B>9A�9
9A�9>9A�@
9A�@>9A�A
9A�A>9A�6
9A�6>
9B @B AB 6B >B :B <B ;B JB
����
������9
����
-���
������0�
���1
-���0���1
99�@99�699�:99�;
9@9@�@9@�69@�:9@�;
9A9A�@
9B @B AB 6B >B :B <B ;B JB
����
������9����
-���������0�
���1
-���0���1
���������������������������������
� �� �� �� �� �� � � �� �� ���
����
�����
��� ����
%'�9�!�����1��� %'�@�!�����1���
161
8� 3����������7�"�����+����
)��������������������������������������������������������������������&������������������������������������������������� ��������������� ����������������&����������������������������������������������������/���� �0������+),� �&������������������� ������������������������������������-".'������������������������1��� ����������������������������������������������-".'��������������������� ��� ��������������� ,����� ���������� �� ��������� ���� ���&��� ������ ����� ��� ��� ������������� ��������� � �������� ��� ��������� ������ � ����������� ������ 1��� ��� ��������� �������� �����!������� �+�����%����������������� ������������������������� ��������������������� ������ �����������������+),������������������������������������ �������������������� ���� ������������-".'=������������
����������&��� �������������������0��������������+),� �&���������������������������3)-.����������������������� ������������ �������������� ������������� �����������������������������������&��
��������597� 2�D��-�.����K�����1�R���#�F���@BB>�����������"���� #�$�����������������%
�����&���&'���� ��!��������������A���)�������� �"����������'���������"���������5@7� "����%�)������S��3-8@�-".'�+��� ��4������A�>��
���()**���+��%���� ���+��*�������*��,� �(*+�5A7� F��8+��� ��� � �� @BB:�� -".'8������ ������� ������ �� +),� ��������� ���������� �� �������
�����&��;���)�������� �%�������"�����������.���� ����"���������567� #���0����F���@BB:��2����-�����3�����&���-�������)-23C�J<;898;6:@;8@<@8B���5>7� )!!!� ;B@�@9� +����� )�������� ,������� -�������� )!!!� -������� ����� ���� �������
����CLL��������;B@����L@9L��5:7� '�� ���%��@BB6C�'�������)!�� ��� �������� �%�$��������)!!!�"������������
A< >$C�6@86J��5<7� 1��-����������� C�-������"���� �.����������'������ �)!.��1�"�6J:B�-���������@BB<��5;7� 1����'��!��@BB6��!������������������������)!!!�-������������9689J��5J7� -".'�D������� ���� ��$�4���������� ��89�B>������CLL�������������59B7� E"�2��&� ���D2D�E"-L)-)�I�����'���� @BB>��3-8@�(����������� ���-��������4������
@�@J�����CLL�����������L���L���5997� -������� 4�� "��� 2�� D����0� R�� .�������� 1�� ��� /� ��� +�� @BB>�� ����� "���� � ���
!�� �������,�������E���������.������ �1������.18B;8B>��59@7� 1��� � 1�� -������� T������ I��� @BB:�� -������ "���� � .���������� '������ � -".'$� U� %�
1��������#������%�����8/�� �����59A7� (��D��* �����%��������� ��@BB;����-&�&��������./,+,0)!������(����'����&�
��&� ��)!!!�)�������� �/��� ����"������������"���������5967� (�����"����������.������ �3����6A�9JJ;��1�����%���������������%� �����
������"���������%������(����59>7� R�� ���+��@BB;��2��3�3(�������!�&����&�����������%�+�59:7� 2 ��������.���� ����2 ��������-����� �)�������#����� -)#$��
���(�)**���+��������+���*�((�* �����*+
162
Building Fire Emergency Detection and Response Using Wireless Sensor Networks
Yuanyuan Zeng, Seán Óg Murphy, Lanny Sitanayah, Tatiana Maria Tabirca, Thuy Truong, Ken Brown, Cormac J. Sreenan
Department of Computer Science, University College Cork {yz2, jmm3, ls3, tabirca1, tt11, k.brown, cjs}@cs.ucc.ie
Abstract
Wireless sensor networks (WSNs) provide a low cost solution with respect to maintenance and installation and in particular, building refurbishment and retrofitting are easily accomplished via wireless technologies. Fire emergency detection and response for building environments is a novel application area for the deployment of wireless sensor networks. In such a critical environment, timely data acquisition, detection and response are needed for successful building automation. This paper presents an overview of our recent research activity in this area. Firstly we explain research on communication protocols that are suitable for this problem. Then we describe work on the use of WSNs to improve fire evacuation and navigation.
Keywords: Wireless Sensor Networks, Fire Detection, Fire Evacuation, Emergency Response
1 Introduction
In the near future we expect buildings to be equipped with a range of wireless sensors and actuators functioning as part of an overall building management system. Included in this set of sensors will be devices to monitor fire and smoke and to respond to the sensed events, allowing detection, localisation and tracking of fires, and providing guidance to evacuees and firefighters on the progress of the fire, on escape routes, and on the locations of people needing assistance. As part of the NEMBES project [1], we are developing a variety of techniques and application solutions to enable this vision of enhanced fire response through wireless embedded systems. In this paper, we present an overview of our work in two areas: protocol design for robust network operation, and sensor driven evacuation planning and simulation. The remainder of this paper is structured as follows: Section 2 presents the routing and MAC layer designed especially for building fire. Section 3, we outline the evacuation and guidance in fire, and then propose the emergency simulation. Section 4 involves some related work. Finally, Section 5 concludes this paper.
2 Routing and MAC Layer Design for Building Fire
Wireless sensor networks for sensing and reporting on a spreading fire are faced with two main issues.Firstly, large volumes of data need to be reported as quickly as possible to a central sink (also called base station) – the rate of sensing will be greatly increased over normal operation, requiring more frequent data transmission. Access protocols and schedules used during normal conditions will no longer apply; instead new protocols designed to ensure rapid transmission of critical data without increased collisions are required. Secondly, the network itself will degrade as the fire spreads, blocking links and killing individual nodes. Stored routing information will quickly become invalid, and whole areas of the network may become disconnected. Adaptive routing protocols are required which can adapt quickly to the changing network, which can act opportunistically, and which are robust to the spreading fire. On the other hand, energy efficiency and node lifetimes are of little concern. We investigate three techniques for operation of an in-building sensor network during a fire: real-time robust routing, a routing protocol able to take advantage of transient connectivity provided by firefighters, and traffic-adaptive MAC. We present each of these in turn below.
2.1 Real-time and Robust Routing in Fire (RTRR)
163
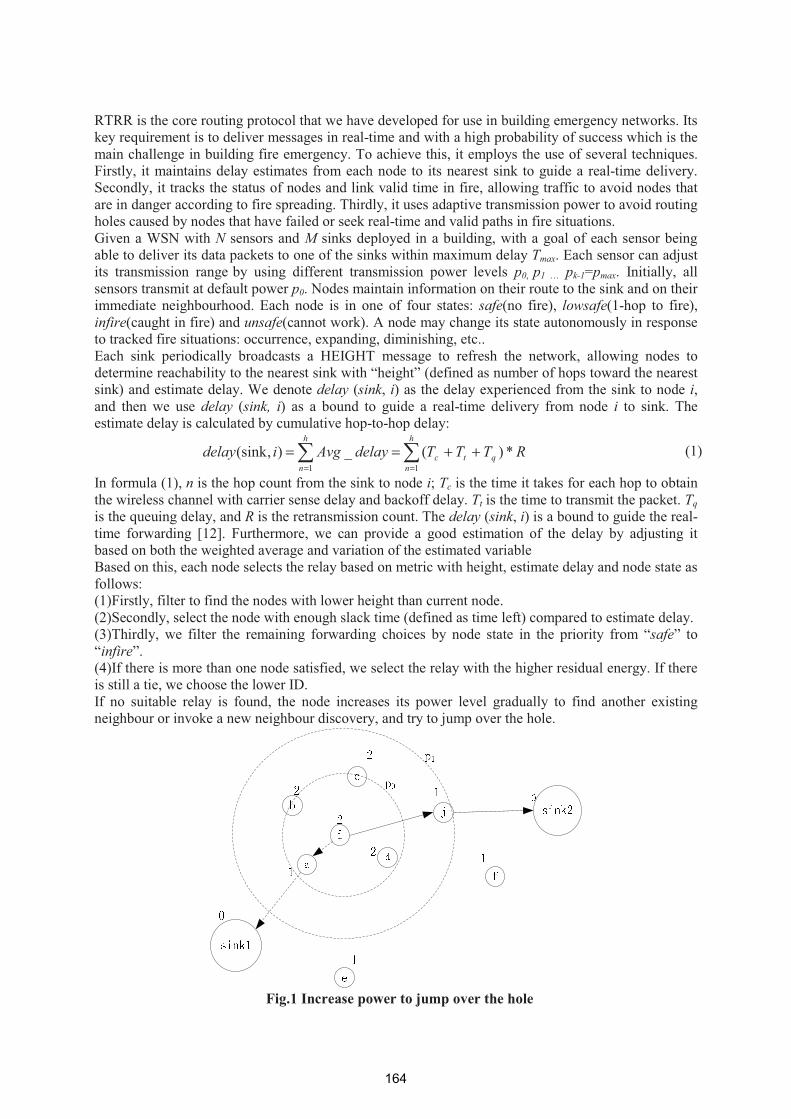
RTRR is the core routing protocol that we have developed for use in building emergency networks. Its key requirement is to deliver messages in real-time and with a high probability of success which is the main challenge in building fire emergency. To achieve this, it employs the use of several techniques. Firstly, it maintains delay estimates from each node to its nearest sink to guide a real-time delivery. Secondly, it tracks the status of nodes and link valid time in fire, allowing traffic to avoid nodes that are in danger according to fire spreading. Thirdly, it uses adaptive transmission power to avoid routing holes caused by nodes that have failed or seek real-time and valid paths in fire situations. Given a WSN with N sensors and M sinks deployed in a building, with a goal of each sensor being able to deliver its data packets to one of the sinks within maximum delay Tmax. Each sensor can adjust its transmission range by using different transmission power levels p0, p1 … pk-1=pmax. Initially, all sensors transmit at default power p0. Nodes maintain information on their route to the sink and on their immediate neighbourhood. Each node is in one of four states: safe(no fire), lowsafe(1-hop to fire), infire(caught in fire) and unsafe(cannot work). A node may change its state autonomously in response to tracked fire situations: occurrence, expanding, diminishing, etc.. Each sink periodically broadcasts a HEIGHT message to refresh the network, allowing nodes to determine reachability to the nearest sink with “height” (defined as number of hops toward the nearest sink) and estimate delay. We denote delay (sink, i) as the delay experienced from the sink to node i, and then we use delay (sink, i) as a bound to guide a real-time delivery from node i to sink. The estimate delay is calculated by cumulative hop-to-hop delay:
��==
++==h
nqtc
h
nRTTTdelayAvgidelay
11
*)(_),sink( (1)
In formula (1), n is the hop count from the sink to node i; Tc is the time it takes for each hop to obtain the wireless channel with carrier sense delay and backoff delay. Tt is the time to transmit the packet. Tqis the queuing delay, and R is the retransmission count. The delay (sink, i) is a bound to guide the real-time forwarding [12]. Furthermore, we can provide a good estimation of the delay by adjusting it based on both the weighted average and variation of the estimated variable Based on this, each node selects the relay based on metric with height, estimate delay and node state as follows: (1)Firstly, filter to find the nodes with lower height than current node. (2)Secondly, select the node with enough slack time (defined as time left) compared to estimate delay.(3)Thirdly, we filter the remaining forwarding choices by node state in the priority from “safe” to “infire”. (4)If there is more than one node satisfied, we select the relay with the higher residual energy. If there is still a tie, we choose the lower ID. If no suitable relay is found, the node increases its power level gradually to find another existing neighbour or invoke a new neighbour discovery, and try to jump over the hole.
Fig.1 Increase power to jump over the hole
164
Fig.1 shows the new neighbor discovery. The sink1 and sink2 are two sinks, and the other nodes are sensors. The number beside each node represents the “height” of each node toward the sink. Node i reports and routes the data to the sink. The path: {i, e, sink1} (with p0 from sensor i to e) is invalid because slack does not satisfy the estimated end-to-end delay. If there are no existing eligible neighbours, then i will increase its power to p1 to reach node j and delivers the packets to another sink: sink2 by path {i, j, sink2} when slack on this route is no less than delay estimation. In building fire emergencies, robust routing is crucial due to the impact of quickly moving fire on node liveness. We assume that: (1) the minimal time interval between “infire” and “unsafe” state of a node is chosen as a parameter known beforehand. (2) We use necessary transmission range for connectivity between nodes (according to selected power level) to approximate the minimal fire spreading time between two nodes. In practice there are well-known guidelines for estimating the rate of fire spread, taking into account building materials, etc. It’s also the case that obstacles, such as walls, that mitigate radio propagation also have the effect of slowing fire spread. When a relay is used for routing, we add a timeout to avoid the use of stale and unsafe nodes, i.e., every node on the path from source to destination has a timeout to record the valid time. At the same time, each link’s valid time is decided by the nodes adjacent to it. The timeout is updated when node state changes among the neighbourhood. The relay and its adjacent path links that exceed the timeoutvalue is considered invalid and then evicted. Accordingly, a routing re-discovery is invoked to find another relay with a valid route path onward one of the sinks (may be a different sink from current one).
2.2 Opportunistic Routing With Mobile Sinks
We now consider scenarios where the network is damaged: routes to the sink may be very long for some nodes, and other areas are now completely disconnected. We envisage firefighters entering the building with small specialized sensor nodes attached to them. These nodes can act as mobile sink nodes, able to relay data back to the main static sink in a single hop, and so provide new transient paths to the static sink. We assume, though, that the firefighters are concerned only with fire fighting and rescue, and thus network issues have no influence on the movement of the mobile sinks. The main question we consider is how to make best use of these mobile sinks. When should sensor nodes relay data via the mobile sink? How does the mobile sink make its presence known to the sensor nodes? How can we use the mobile sink to re-connect disconnected regions of the field? We assume an underlying routing protocol for the network similar to RTRR. Thus each node maintains information on its relay node and hop count for transmitting data to the static sink through the network. First, we assume that the mobile sink transmits a beacon as its moves through the building. If the speed of movement is higher than a threshold, the beacon signal is suspended. Nodes that receive the beacon forward it for up to k hops. Each node then decides whether or not to use this new transient route. Each node, however, also maintains its old route. When the mobile sink moves out of range, the links to it will be broken, and the nodes revert to their old routes. Secondly, we assume that nodes in a disconnected region reply to the beacon with a panic code, which causes the mobile sink to change its beacon to indicate that it will only relay data from the disconnected region. This gives priority to the disconnected region to transmit whatever buffered data it has been able to store. Thirdly, we envisage the mobile sink using a directional antenna to transmit predictive beacons announcing its expected arrival, assuming it maintains its current speed and trajectory. Nodes receiving the predictive beacon can then decide whether to buffer data and wait for the arrival of the mobile sink. In the first and third cases, the main issue is in the tradeoff between taking advantage of the newly available shorter routes and wasting time transmitting control messages and rerouting data only to find that the mobile sink has moved on and is no longer available. If the behaviour is too conservative, opportunities to transmit data are lost; if the behaviour is too aggressive, latency increases and data is lost as the new routes disappear while data is in transit.
2.3 A Hybrid MAC Protocol for Emergency Response (ER-MAC)
165
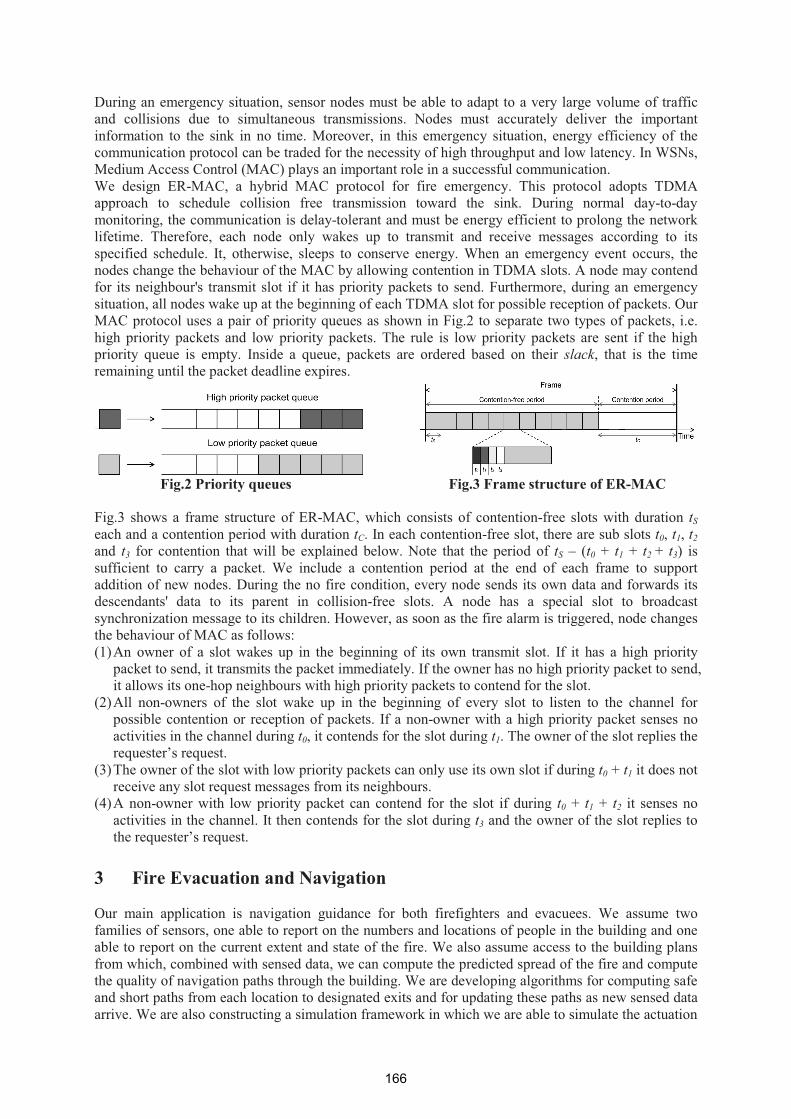
During an emergency situation, sensor nodes must be able to adapt to a very large volume of traffic and collisions due to simultaneous transmissions. Nodes must accurately deliver the important information to the sink in no time. Moreover, in this emergency situation, energy efficiency of the communication protocol can be traded for the necessity of high throughput and low latency. In WSNs, Medium Access Control (MAC) plays an important role in a successful communication. We design ER-MAC, a hybrid MAC protocol for fire emergency. This protocol adopts TDMA approach to schedule collision free transmission toward the sink. During normal day-to-day monitoring, the communication is delay-tolerant and must be energy efficient to prolong the network lifetime. Therefore, each node only wakes up to transmit and receive messages according to its specified schedule. It, otherwise, sleeps to conserve energy. When an emergency event occurs, the nodes change the behaviour of the MAC by allowing contention in TDMA slots. A node may contend for its neighbour's transmit slot if it has priority packets to send. Furthermore, during an emergency situation, all nodes wake up at the beginning of each TDMA slot for possible reception of packets. Our MAC protocol uses a pair of priority queues as shown in Fig.2 to separate two types of packets, i.e. high priority packets and low priority packets. The rule is low priority packets are sent if the high priority queue is empty. Inside a queue, packets are ordered based on their slack, that is the time remaining until the packet deadline expires.
Fig.2 Priority queues Fig.3 Frame structure of ER-MAC
Fig.3 shows a frame structure of ER-MAC, which consists of contention-free slots with duration tSeach and a contention period with duration tC. In each contention-free slot, there are sub slots t0, t1, t2and t3 for contention that will be explained below. Note that the period of tS – (t0 + t1 + t2 + t3) is sufficient to carry a packet. We include a contention period at the end of each frame to support addition of new nodes. During the no fire condition, every node sends its own data and forwards its descendants' data to its parent in collision-free slots. A node has a special slot to broadcast synchronization message to its children. However, as soon as the fire alarm is triggered, node changes the behaviour of MAC as follows: (1) An owner of a slot wakes up in the beginning of its own transmit slot. If it has a high priority
packet to send, it transmits the packet immediately. If the owner has no high priority packet to send, it allows its one-hop neighbours with high priority packets to contend for the slot.
(2) All non-owners of the slot wake up in the beginning of every slot to listen to the channel for possible contention or reception of packets. If a non-owner with a high priority packet senses no activities in the channel during t0, it contends for the slot during t1. The owner of the slot replies the requester’s request.
(3) The owner of the slot with low priority packets can only use its own slot if during t0 + t1 it does not receive any slot request messages from its neighbours.
(4) A non-owner with low priority packet can contend for the slot if during t0 + t1 + t2 it senses no activities in the channel. It then contends for the slot during t3 and the owner of the slot replies to the requester’s request.
3 Fire Evacuation and Navigation
Our main application is navigation guidance for both firefighters and evacuees. We assume two families of sensors, one able to report on the numbers and locations of people in the building and one able to report on the current extent and state of the fire. We also assume access to the building plans from which, combined with sensed data, we can compute the predicted spread of the fire and compute the quality of navigation paths through the building. We are developing algorithms for computing safe and short paths from each location to designated exits and for updating these paths as new sensed data arrive. We are also constructing a simulation framework in which we are able to simulate the actuation
166
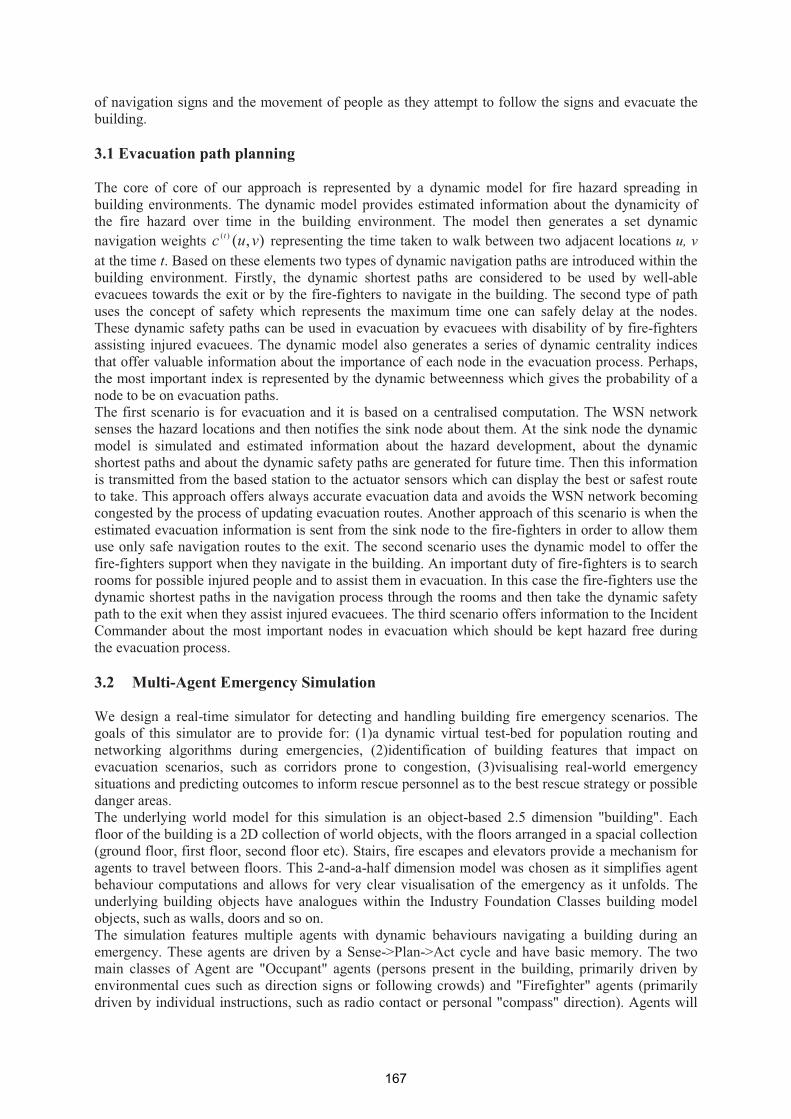
of navigation signs and the movement of people as they attempt to follow the signs and evacuate the building.
3.1 Evacuation path planning
The core of core of our approach is represented by a dynamic model for fire hazard spreading in building environments. The dynamic model provides estimated information about the dynamicity of the fire hazard over time in the building environment. The model then generates a set dynamic navigation weights ),()( vuc t representing the time taken to walk between two adjacent locations u, vat the time t. Based on these elements two types of dynamic navigation paths are introduced within the building environment. Firstly, the dynamic shortest paths are considered to be used by well-able evacuees towards the exit or by the fire-fighters to navigate in the building. The second type of path uses the concept of safety which represents the maximum time one can safely delay at the nodes. These dynamic safety paths can be used in evacuation by evacuees with disability of by fire-fighters assisting injured evacuees. The dynamic model also generates a series of dynamic centrality indices that offer valuable information about the importance of each node in the evacuation process. Perhaps, the most important index is represented by the dynamic betweenness which gives the probability of a node to be on evacuation paths. The first scenario is for evacuation and it is based on a centralised computation. The WSN network senses the hazard locations and then notifies the sink node about them. At the sink node the dynamic model is simulated and estimated information about the hazard development, about the dynamic shortest paths and about the dynamic safety paths are generated for future time. Then this information is transmitted from the based station to the actuator sensors which can display the best or safest route to take. This approach offers always accurate evacuation data and avoids the WSN network becoming congested by the process of updating evacuation routes. Another approach of this scenario is when the estimated evacuation information is sent from the sink node to the fire-fighters in order to allow them use only safe navigation routes to the exit. The second scenario uses the dynamic model to offer the fire-fighters support when they navigate in the building. An important duty of fire-fighters is to search rooms for possible injured people and to assist them in evacuation. In this case the fire-fighters use the dynamic shortest paths in the navigation process through the rooms and then take the dynamic safety path to the exit when they assist injured evacuees. The third scenario offers information to the Incident Commander about the most important nodes in evacuation which should be kept hazard free during the evacuation process.
3.2 Multi-Agent Emergency Simulation
We design a real-time simulator for detecting and handling building fire emergency scenarios. The goals of this simulator are to provide for: (1)a dynamic virtual test-bed for population routing and networking algorithms during emergencies, (2)identification of building features that impact on evacuation scenarios, such as corridors prone to congestion, (3)visualising real-world emergency situations and predicting outcomes to inform rescue personnel as to the best rescue strategy or possible danger areas. The underlying world model for this simulation is an object-based 2.5 dimension "building". Each floor of the building is a 2D collection of world objects, with the floors arranged in a spacial collection (ground floor, first floor, second floor etc). Stairs, fire escapes and elevators provide a mechanism for agents to travel between floors. This 2-and-a-half dimension model was chosen as it simplifies agent behaviour computations and allows for very clear visualisation of the emergency as it unfolds. The underlying building objects have analogues within the Industry Foundation Classes building model objects, such as walls, doors and so on. The simulation features multiple agents with dynamic behaviours navigating a building during an emergency. These agents are driven by a Sense->Plan->Act cycle and have basic memory. The two main classes of Agent are "Occupant" agents (persons present in the building, primarily driven by environmental cues such as direction signs or following crowds) and "Firefighter" agents (primarily driven by individual instructions, such as radio contact or personal "compass" direction). Agents will
167
have steering and crowding mechanisms to accurately reflect real-life population movement. The underlying physical model of the world combined with such measures will provide useful knowledge as to areas in the building with excessive traffic and poor movement flow, or parts of a building which are of high-importance for evacuation (e.g. a main corridor).
Fig.4 Simulation illustration
The simulation also incorporates simulated embedded network elements. These virtual sensors detect people, fire, smoke and temperature. The simulated actuators will drive building elements such as direction signs, windows, door locks and fire suppression systems (sprinklers etc). Fig. 4 shows a screenshot of our simulation for building fire. The sensors will be used to drive a view of the building apart from the actual underlying simulation itself. This "sensor view" is limited by sensor uncertainty, sensing range characteristics and sensing schedules. This limited view of the building provides information to a higher-level Application Layer which will be running Evacuation route planning algorithms, fire-fighter direction and other emergency applications. The systems running on the application layer feed actuation instructions to the in-simulation actuators which reflect these instructions in the underlying simulation (signs direct the occupants along the evacuation path, sprinklers activate, fire-fighters remotely receive a new instruction, and so on).
4 Related work
Our research discussed in this paper is based on the NEMBES project funded by the Irish Higher Education Authority under the PRTLI-IV programme. NEMBES is an inter-institutional and multi-disciplinary research programme that will investigate a "whole system" approach to the design of networked embedded systems, marrying expertise in hardware, software and networking with the design and management of built environments. Our research is covered by one of the main research strands in NEMBES: facilities management as “sensor network management within buildings”. The focus of the research is to develop dynamic sensor network management methodologies for building environment where wireless sensor network technology providing low cost data acquisition also provides a means of detecting the environment and the combine wireless sensing and actuating capabilities to provide some response capability for sensed events. While the network routing and MAC protocols govern the successful data reporting of the wireless sensor network, it will also be tasked with fire events via alarm triggers. These alarmed events can be interpreted, ranked and routedbased on urgency and maintenance, repair, replace requests or highlight the need for additional equipment/sensors meters to satisfy building services demands such as making fire evacuation for people in fire and providing guidance for firefighter to find injured. There are a lot of routing and MAC layer protocols designed for WSNs. Real-time design is one of the challenges in building fire emergency. Some WSN applications require real-time communication, typically for timely surveillance or tracking, e.g. SPEED [2], MM-SPEED [3], RPAR [4] and RTLD [5] were designed for real-time applications. But they are not well suited for building fire emergency especially the situation will be even worse with dynamic topology changes and node failure caused by fire spreading.
168
In building fire emergency applications, we envisage firefighters entering the building with small base stations attached to them. These base stations can act as mobile sink nodes, able to relay data back to the main base station in a single hop. Recently, many researchers have considered mobile relays or mobile sinks to solve the sink neighbourhood problem [10, 11]. In these scenarios, mobile nodes play an important role for relaying or collecting data continuously. Combining our application, the main question we consider in fire is how to make best use of these mobile sinks. In WSNs, Medium Access Control (MAC) plays an important role in a successful communication. Existing contention-based MAC protocols such as S-MAC [6], schedule-based MAC protocols such as TRAMA [7], and the combination of both contention and schedule (hybrid) for example Z-MAC [8] are not suitable for fire emergency. During this emergency situation, successful communication of the WSN depends on a robust and reliable communication protocol to transport important messages to the base station. Furthermore, in the emergency situation, energy efficiency of the communication protocol can be traded for the necessity of high throughput and low latency. Different from existing work, nodes change the behaviour of the MAC by allowing contention in TDMA slots when an emergency event occurs. A node may contend for its neighbour's transmission slot if it has priority packets to send. The last couple of years have seen an important number of applications of sensors in building environments. The usage of the WSN networks in emergency evacuation is just one of them with various solutions proposed so far [9]. Different from this, our work uses a novel dynamic evacuation model [13] to consider dynamic evacuation graph with fire spreading. Currently, there is no simulator that is designed specifically for emergency applications such as building fire. We designed a simulator that could provide a dynamic virtual testbed for designed protocols and algorithms especially for emergency scenarios.
5 Conclusions
In this paper, we outline some of the main ideas of our NEMBES project work on building fire emergency applications. Firstly, we present the mechanism of the real-time and reliable routing protocol designed for building fire to guarantee a delay bounded and high successful probabilistic end-to-end data delivery in fire. Secondly, we propose an opportunistic routing scheme with mobile sinks. Thirdly, we present a MAC protocol that is adaptive to priority-based traffic and collisions due to simultaneous transmissions. Next, we give some details about fire evacuation/navigation mechanism by using a dynamic evacuation model. At last, we bring forward a simulation testbed especially for building fire based on the protocols we designed. Our research is still in progress and it could benefit applications for building fire emergency and other similar emergency situations such as earthquakes and other urban disasters. The further work includes exploring the complementary of existing protocols and mechanisms, as well as implementing simulations under different network scenarios and fire models.
References [1] Networked Embedded Systems (NEMBES), http://www.nembes.org. [2] T. He, J. Stankovic, C. Lu, and T. Abdelzaher, “SPEED: A Stateless Protocol for Real-time
Communication in Sensor Networks,” 23rd International Conference on Distributed Computing Systems, pp.46-55, May. 2003.
[3] E. Felemban, C. –G. Lee, E. Ekici, R. Boder, and S. Vural, “Probabilistic QoS Guarantee in Reliability and Timeliness Domains in Wireless Sensor Networks,” 24th Annual Joint Conference of the IEEE Computer and Communication Societies(InfoCom’05), 4(4), pp. 2646- 2657, Mar 2005.
[4] O. Chipara, Z. He, G. Xing, Q. Chen, et. al., “Real-time power-aware routing in sensor networks,” 14th IEEE International Workshop on Quality of Service, pp.83-92, 2006.
[5] A. Ahmed, N. Fisal, “A real-time routing protocol with load distribution in wireless sensor networks,” Computer Communications, 31(14), pp.3190-3203, 2008.
169

[6] W. Ye, J. Heidemann, and D. Estrin, “An Energy-Efficient MAC Protocol for Wireless Sensor Networks”, 21st Annual Joint Conference of IEEE Computer and Communications Societies (InfoCom’02), 3(3), pp.1567- 1576, Jun.2002.
[7] V. Rajendran, K. Obraczka, and J.J. Garcia-Luna-Aceves, “Energy-Efficient Collision-Free Medium Access Control for Wireless Sensor Networks”, 1st International Conference on Embedded Networked Sensor Systems (SenSys’03), pp.181-192, Nov.2003.
[8] I. Rhee, A. Warrier, M. Aia, and J. Min, “Z-MAC: A Hybrid MAC for Wireless Sensor Networks”, 3rd International Conference on Embedded Networked Sensor Systems (SenSys’05), pp.90-101, Nov.2005.
[9] M. Barnes, H. Leather and D.K. Arvind, “Emergency Evacuation using Wireless Sensor Networks”, 32nd IEEE Conference on Local Computer Networks (LCN’07), pp 851-857, Oct. 2007.
[10] Yihong Wu, Lin Zhang, Yiqun Wu, Zhisheng Niu, “Interest Dissemination with Directional Antennas for Wireless Sensor Networks with Mobile Sinks,” 4th International Conference on Embedded Networked Sensor Systems (Sensys’06), pp.99-111, 2006.
[11] Wook Hyun Kwon, Tarek F. Abdelzaher, Hyung Seok Kim, “Minimum-Energy Asynchronous Dissemination to Mobile Sinks in Wireless Sensor Networks,” 1st International Conference on Embedded Networked Sensor Systems (SenSys’ 03), pp.193-204, Oct.2003.
[12] Yuanyuan Zeng, Cormac Sreenan, “A Real-Time and Robust Routing Protocol for Building Fire Emergency Applications Using Wireless Sensor Networks”, 8th International Workshop on Real-Time Networks( RTN'09), 2009.
[13] Tatiana Tabirca, Kenneth N. Brown and Cormac J. Sreenan, “A Dynamic Model for Fire Emergency Evacuation Based on Wireless Sensor Networks”, 8th International Symposium on Parallel and Distributed Computing (ISPDC), July 2009.
170

Session 7
Doctoral Symposium
171

�
172

Policy Refinement for Traffic Management in Home Area Networks – Problem Statement
Annie Ibrahim Rana1, Mícheál Ó Foghlú2
Telecommunications Software and Systems Group
Waterford Institute of Technology Waterford, Ireland.
1 [email protected], 2 [email protected]
Abstract
Traditional home area network (HAN) equipment is usually unmanaged and network traffic is served in best effort fashion. This type of unmanaged network sometimes causes quality-of-service issues in the HAN, for example loss of quality in streamed video or audio content. Traffic management rules using policies to prioritise certain types of traffic according to user requirements and to assign bandwidth limits to other traffic types. However very little work has been done yet addressing the specification of these requirements, how they would be communicated to the gateway device using policies, and how the policies would be refined into device level configurations to effectively implement the user requirements. In this paper we briefly discuss this as a research problem, placing it within the context of the research goals and an initial research methodology in the area of policy refinement for policy-based traffic management in home area networks (HANs).
Keywords: Policy, Policy-based traffic management, Policy refinement, Home area network, Autonomic networks.
1 Problem Statement In a traditional home area network (HAN), there can be several types of network traffic e.g. VoIP, audio & video on demand, web, large file downloads and uploads. Usually the HAN Internet Protocol (IP) traffic works in a best effort fashion where quality-of-service (QoS) is not guaranteed. Therefore the quality can deteriorate when some bursty traffic e.g. UDP based download or upload, tries to consume the maximum available bandwidth. This can cause bandwidth unavailability for other traffic types, such as streaming audio or video, that are very sensitive to QoS. This leads the network into a state of congestion, which blocks other traffic flows (usually though packets being delayed or dropped due to the congestion) and results in poor quality of network applications. One solution to resolve congestion issues is to assign more bandwidth for the network, but logically this can only alleviates the issue rather than providing a long lasting remedy for better traffic management. In addition, in many HANs, customers have a maximum potential bandwidth set by the service provider’s infrastructure; in ADSL this is often a lower maximum for upload compared to download. The general problem with adding more bandwidth as a solution is that greedy network applications simply attempt to consume more of the bandwidth, and risk here is that the actual congestion remains. In a HAN most user generated traffic has equal priority with no bandwidth constraints; this means the packets are queued on the gateway device in a first-in first-out (FIFO) queue (depending on default configuration). When two UDP traffic flows (e.g. VoIP and Video streaming) of equal priority compete for bandwidth, their quality can suffer because of varying bandwidth availability, which can result in great packet loss and unwanted packet
173

delays. We know that policies can be used to manage QoS requirements, therefore by separating the VoIP and streaming traffic into two different priority queues, with optimal flow rates, this can potentially improve the quality both traffic flows. It works best where one is clearly a lower priority than the other. Policy-based network management (PBNM) provides a flexible and robust mechanism to allocate bandwidth and to prioritise the network traffic. This approach has been used extensively in larger telecommunication networks, but potentially is also a good approach to meet HAN requirements, if this type of solution can be designed so that it can be easily managed by end users. The best advantage of using PBNM is that policies can be changed at run time without affecting underlying working model. This means that traffic management policies can be changed dynamically; this is a basic requirement in managing network traffic as user requirements can change over time (e.g. new devices, new services, changing priorities). To cater for this issue, autonomic policy refinement can play a very important role in establishing a policy-based traffic management system on residential gateway device. The quality of network traffic is measured in terms of QoS parameters -i.e. packet loss and delay, our research questions are: (1) How can QoS requirements for a traffic flow or aggregate flows be communicated to a gateway device using policies? (2) How can a comprehensive policy framework can be devised from the user requirements and then refined into configuration rules, which also contains desired QoS settings? As currently formulated, these are not easy to evaluate or measure, and will they will require further refinement. The aim is to focus in on the knowledge representation issues in a suitable policy representation, but to deploy a working prototype that demonstrates that it can be effective in a real HAN deployment. Additionally, issues such as the usability of the resulting systems by end users are important, but may lead the research towards a more social science methodology, that the author would rather avoid. Thus the aim is to design the questions so that they can be evaluated through an empirical experimental design or simulation, whilst ensuring that the results have some real validity and are not merely artefacts of simulation.
2 State of the Art Significant work has been published relating to the management of QoS requirements in access and core networks using policy-based network management (PBNM). Different architectures are proposed in [2] for the control plane of a software router that integrates signalling protocols and control mechanisms for QoS and in [3] using PBNM. The paper [2] claims that the use of proposed architecture can meet the end-to-end QoS requirements for most the internet applications if applied on the access network routers. Traditional PBNM systems focus on the management of core networks and the internet in the broader sense. The access and the core networks use policies to meet service level agreements (SLAs) for different service users. However the concept of end-to-end QoS in the big picture would remain in a status-quo if QoS is not ensured at the edge networks. PBNM can play a significant role in managing home networks focusing on users’ requirements. We purpose an intelligent gateway device to control and manage all outgoing and incoming traffic. The device can be configured according to user requirements through a policy manager; it would make HAN users’ life much easier. The paper [4] proposes similar solution but it focuses more on intelligent control centre (ICC) to connect all other networks with in HAN e.g. power line network, PC network, wireless network, home automation network, and home gateway.
174

Policy refinement is an essential part of policy authoring but still it is a largely overlooked research domain. Some of the significant work has been discussed in [5] but most of the models used for policy refinement are not suitable for autonomic traffic management in HAN. Some of the common issues with policy refinement techniques are listed here:
• The human operator must have deep understanding of both the business level policy and domain specific knowledge such as security or network QoS;
• It is hard to check the accuracy and consistency of transformation carried out by the human operator;
• A policy author can only construct a policy by using accurate syntax in addition to having precise semantics;
• The human input must be compiled and interpreted to produce an output which is domain specific;
• There is no specific approach defined yet for autonomic policy creation and refinement from user requirements.
3 Goal Statement The goal of our research is to provide solutions to HAN users to manage their networks effectively with minimal user intervention. And at the core, the research objective is to define efficient, robust and cost-effective autonomic policy refinement algorithms and policy-based traffic engineering techniques for quality of service user requirements in home area networks. This will enable prioritisation of different types of HAN traffic according to HAN user needs. We have simulated a HAN in our research lab, and our research experimental testbed has used the settings and configurations as discussed in research artefacts (the next section). We have successfully executed the experiments to observe the effect of policies in managing the home area network traffic and our next step is to use a formal policy refinement model to define policies from the user requirements.
4 Research Artefacts Figure 1 shows the role of policy-based network management in HAN. The residential gateway device or the router is policy execution point to manage different types of traffic according to HAN users. Policy decision point (PDP) fetches the required policies from the repository and through policies are executed on the policy execution point (PEP). Policies can be managed through the management console.
Figure 1: PBTM in HAN.
4.1 Equipment and Applications We are using a Linux machine with Ubuntu Linux distribution as a gateway (software router) to simulate the HAN and its gateway device that represents a router between the HAN and the Internet Service Provider (ISP). We have used a traffic control (TC) application for setting up filters and queues on the router, this can generate different types of network traffic using shell
175
scripts. The IPTables package is used for defining NAT, as commonly deployed in IPv4-based HANs. The TCPDump package is used for packet and queue analysis, the raw data dumps being processed by some perl scripts. The testbed will be further refined to allow investigation of PBNM. The interesting aspects of the testbed that we would be looking at in HAN traffic management are:
1. Use of policy continuum [6] 2. Formal policy specification language 3. Use of autonomic policy refinement techniques [1] 4. Building traffic management tool for HAN users
.
5 Methodology The aim is to use a set of research questions that can be empirically tested on the extended testbed. Thus the aim is to measure the effectiveness of a managed QoS network, compared to an unmanaged network, quantitatively. Some additional work will be done to measure the effective usability of the resulting PBNM system, but this usability will not be the main focus of the methodology. This may involve some user testing and questionnaires on a small sample set.
6 Conclusion We have presented the key challenges being addressed in our research and outlined the major elements of ongoing research work in a number of inter-related network management fields that are relevant to policy-based traffic management, quality of service and policy refinement. The primary research methodology is an experimental one, potentially using elements of actual deployments of policy-based traffic management system that can be tested with real network traffic.
Acknowledgement The authors wish to acknowledge the support of the SFI SRC FAME (Ref: 08/SRC/I1403) award that contributed financially to the work that is reported in this article.
References [1] Jennings, B., van der Meer S., Balasubramaniam, S., Botvich, D., OFoghlu, M., Donnelly, W.
and Strassner, J., (2007). Towards autonomic management of communications networks. Communications Magazine, IEEE Publications, 45(10):112–121, October 2007.
[2] Maniyeri, J., Zhang, Z., Pillai, R., and Braun, P. (2003). A Linux Based Software Router Supporting QoS, Policy Based Control and Mobility. In Proceedings of the Eighth IEEE international Symposium on Computers & Communications ( June 30 - July 03, 2003). ISCC. IEEE Computer Society, Washington, DC, 101.
[3] Ponnappan, A., Yang, L., Pillai, R. and Braun, P., (2002). A Policy Based QoS Management System for the IntServ/DiffServ Based Internet. In Proceedings of the 3rd international Workshop on Policies For Distributed Systems and Networks, POLICY. IEEE Computer Society, Washington, DC, 159.
[4] Liu, G., Zhou, S. Zhou, X. and Huang, X., (2006). QoS Management in Home Network. In Proceedings of the international Conference on Computational intelligence for Modelling Control and Automation and international Conference on intelligent Agents Web Technologies & international Commerce ( November 28 - December 01, 2006). CIMCA. IEEE Computer Society, Washington, DC, 203.
[5] Damianou, N., (2002) A Policy Framework for Management of Distributed Systems,” PhD Thesis, Imperial College London, Mar. 2002.
[6] Davy, S., Jennings, B., Strassner, J., (2007). The policy continuum - a formal model, Proceedings of the Second IEEE International Workshop on Modelling Autonomic Communications Environments, MACE, pp. 65–79, 2007.
176
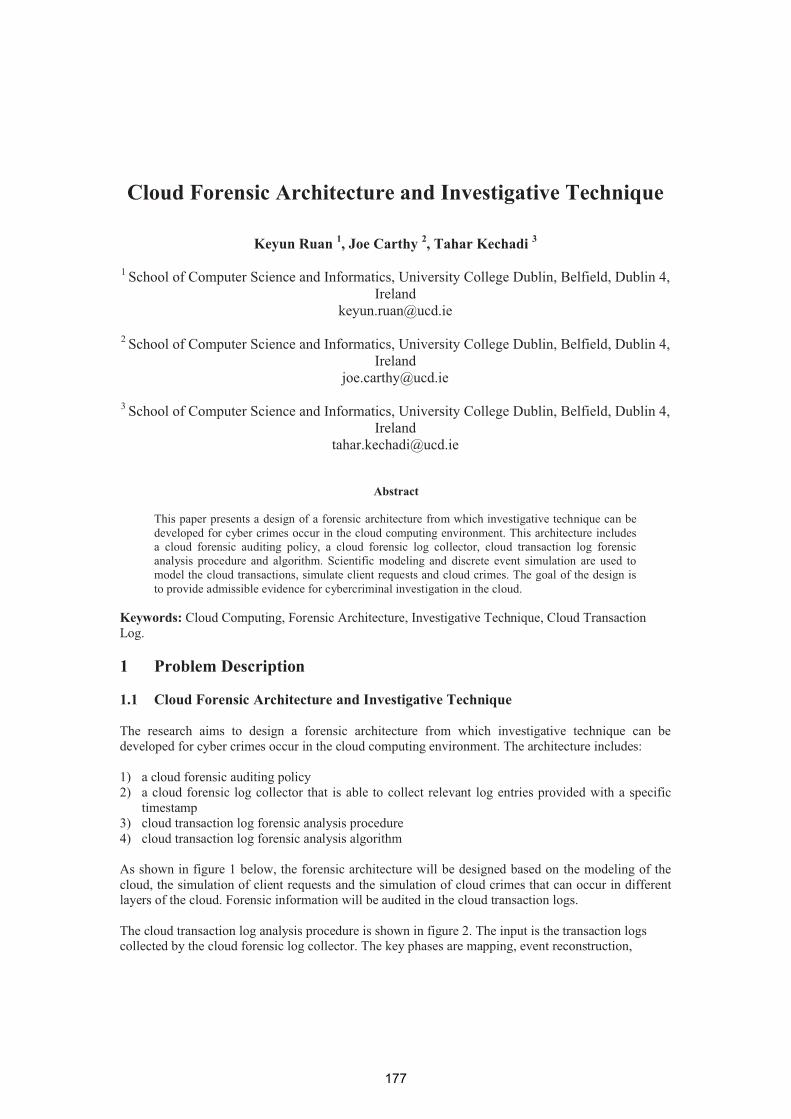
Cloud Forensic Architecture and Investigative Technique
Keyun Ruan 1, Joe Carthy 2, Tahar Kechadi 3
1 School of Computer Science and Informatics, University College Dublin, Belfield, Dublin 4, Ireland
2 School of Computer Science and Informatics, University College Dublin, Belfield, Dublin 4, Ireland
3 School of Computer Science and Informatics, University College Dublin, Belfield, Dublin 4, Ireland
Abstract
This paper presents a design of a forensic architecture from which investigative technique can be developed for cyber crimes occur in the cloud computing environment. This architecture includes a cloud forensic auditing policy, a cloud forensic log collector, cloud transaction log forensic analysis procedure and algorithm. Scientific modeling and discrete event simulation are used to model the cloud transactions, simulate client requests and cloud crimes. The goal of the design is to provide admissible evidence for cybercriminal investigation in the cloud.
Keywords: Cloud Computing, Forensic Architecture, Investigative Technique, Cloud Transaction Log.
1 Problem Description
1.1 Cloud Forensic Architecture and Investigative Technique
The research aims to design a forensic architecture from which investigative technique can be developed for cyber crimes occur in the cloud computing environment. The architecture includes:
1) a cloud forensic auditing policy2) a cloud forensic log collector that is able to collect relevant log entries provided with a specific
timestamp3) cloud transaction log forensic analysis procedure4) cloud transaction log forensic analysis algorithm
As shown in figure 1 below, the forensic architecture will be designed based on the modeling of the cloud, the simulation of client requests and the simulation of cloud crimes that can occur in different layers of the cloud. Forensic information will be audited in the cloud transaction logs.
The cloud transaction log analysis procedure is shown in figure 2. The input is the transaction logs collected by the cloud forensic log collector. The key phases are mapping, event reconstruction,
177
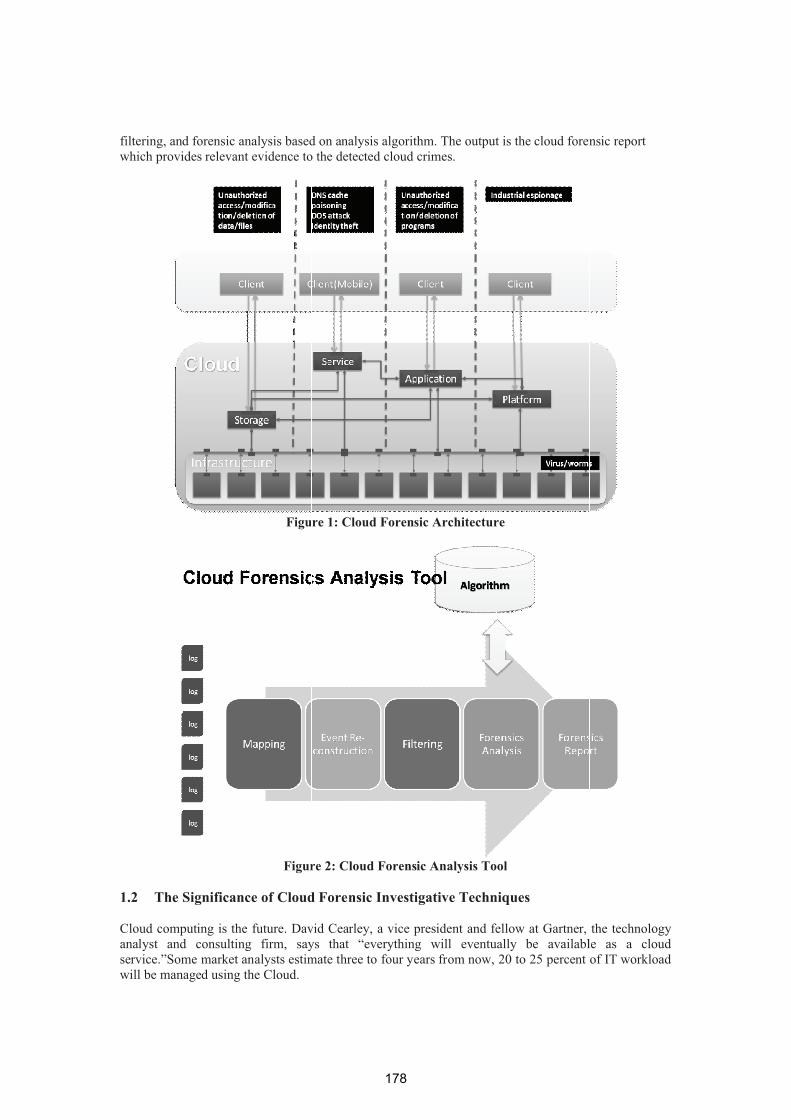
filtering, and forensic analysis basedwhich provides relevant evidence to
Figu
Figur
1.2 The Significance of Cloud
Cloud computing is the future. Davanalyst and consulting firm, sayservice.”Some market analysts estimwill be managed using the Cloud.
d on analysis algorithm. The output is the cloud foreno the detected cloud crimes.
re 1: Cloud Forensic Architecture
re 2: Cloud Forensic Analysis Tool
d Forensic Investigative Techniques
vid Cearley, a vice president and fellow at Gartner, ys that “everything will eventually be availablmate three to four years from now, 20 to 25 percent
nsic report
the technology le as a cloud of IT workload
178

However, cloud computing is still facing serious security concerns, the cloud clients have little knowledge of, and control over where resources are run and how the data is stored and processed. Last year, for instance, a number of cloud computing clients were affected by cybercriminal intrusions: retailer TJX lost 45 million credit card numbers to hackers; the British government misplaced 25 million taxpayer records; and cloud service provider Salesforce.com admitted that millions of subscribers’ e-mail addresses and phone numbers had been snagged by cybercriminals.
While cloud security poses huge problems for cloud computing, cloud forensics is totally a green area for research. In the cloud data is spread across an ever-changing set of hosts and data centers. Logging and data for multiple customers maybe co-located. Our research is aim to answer this question: when cloud security fails, how to investigate in the cloud?
1.3 The Current State of the Art
Cloud computing is a commercialized concept combined from the existing technologies such as software as a service, grid computing, utility computing, etc. However, the current state of network forensics is not catered for the massive scale of the data centers and the service model of the cloud.
2 Goal Statement
2.1 The Goal of the Research
The goal of the research is to design a forensic architecture from which investigative technique can be developed for cybercriminal investigation in the cloud.
2.2 Artifacts to be Used and Developed
Tool Theory MethodTo be used Java Security Auditing Scientific Modeling
Log Management Discrete Event SimulationEvent Reconstruction
To be developed CloudForensic Log Collector
cloud transaction log forensic analysis procedure
cloud transaction log forensic analysis algorithm
cloud forensic auditing policy
Table 1: Artifacts to be used and developed
2.3 The Usefulness of Artifacts for Reaching the Stated Goal
Java is the environment used for modeling and simulation.
Security auditing, log management, and event reconstruction are the theoretical background for the design of cloud forensic auditing policy, the creation of cloud transaction logs and cloud transaction log forensic analysis.
Scientific modeling and discrete event simulation are the methods to study the nature of the cloud, cloud behavior cloud transactions and criminal transactions.Cloud forensic log collector is a forensic crawler to collect distributed log entries provided with a specific timestamp.
Cloud transaction log forensic analysis procedure is the theory to reconstruct cloud events, detect criminal transactions, analyze transaction logs and provide valid evidence for cybercriminal
179

investigation and prosecution. Cloud forensic auditing policy is the theory to audit cloud transactions for forensic purposes. Cloud transaction log forensic analysis algorithm is the theory to analyze cloud transaction logs for forensic purposes.
3 Method
3.1 Modeling, Design and Simulations to be Produced/Executed
3.1.1 Modeling of the Cloud
Modeling the cloud includes the modeling of key cloud components, i.e., infrastructure, storage, platform, service, and application, the modeling of cloud client requests and the modeling of the change of state inside the cloud during each transaction.
3.1.2 Design of Cloud Forensic Auditing Policy
Design the forensic information to be audited for each transaction.
3.1.3 Simulation of Cloud Transaction Scenarios
Simulation of cloud transaction scenarios includes the simulation of managing cloud accounts, cloud storage, cloud applications, and cloud service.
3.1.4 Simulation of Cloud Crimes
At the current stage, simulation of cloud crimes includes the simulation of denial of service attack, the simulation of unauthorized access/modification/deletion of data/files/programs, the simulation of identity theft, and the simulation of spreading virus/worms.
3.1.5 Generation of Transaction Logs
Transaction logs will be generated according to the cloud forensic auditing policy and stored distributedly.
3.1.6 Collection of Transaction Logs
Forensics-relevant logs will be collected by the cloud forensic cloud collector (a crawler) provided by a specific timestamp.
3.1.7 Analysis of Transaction Logs
Analysis of the collected transaction logs will be executed according to the cloud transaction log forensic analysis algorithm.
3.1.8 Validation of Cloud Forensic Analysis
Valid cloud forensic analysis should provide evidence that can be admitted by court.
3.2 Validation Strategy
The evidence provided by the defined forensics architecture should be admissible.
3.3 Demonstration of the Goal Reached
180

The evidence provided by the defined forensics architecture prove to be relevant to the case, does not cause more harm than good and is not misleading.
References
[1] Michael, C. (2008). Scene of the Cybercrime, Second Edition. SYNGRESS[2] William, S., Lawrie, B. (2008) Computer Security Principles and Practice. Pearson
181
Project Title: A Unified Model of Learning Styles Student Name: Damian Gordon Project Supervisor: Prof. Gordon Bull Problem Description: Each person prefers to learn in a unique way, these preferences can be broadly categorised using learning styles models. Such models consist of a series of dimensions each of which portray a prototypical type of learner. Many models of learning styles exist, predominantly describing learners using four dimensions. These models have caused a great deal of confusion amongst the educational and research communities concerning model of learning style is most appropriate, and as a consequence of this the validity, repeatability and accuracy of learning styles models have been brought into question. Goal Statement: This research investigates these diverse models of learning styles and identifies the shared characteristics that exist within each of the dimensions of these models, in an effort to develop a metamodel that describes a unified model of learning styles. Method: Over a period of three years students in various courses were assessed with different learning styles questionnaires to confirm that the characteristics remain constant over the different models. And an analysis of the results of these questionnaires support the hypothesis that an underlying set of characteristics is shared by all models. This newly developed metamodel is then used as a tool to investigate the broader implications of learning styles for both constructive alignment (which concerns itself with teaching, assessment and learning outcomes) and eLearning systems development. When considering constructive alignment, first the implications of learning styles for teaching are considered, and a new complimentary model of instructional design was developed which incorporates the diversity of learners through the use of the Six Thinking Hats technique. Secondly assessment is considered, and how assessment may be undertaken in such a way as to accommodate a range of learners, both in parallel and in series. Thirdly approaches to curriculum design using a learning outcomes-based procedure are likewise investigated to infuse them with diversity. In terms of eLearning systems development, the implications of incorporating learning styles into both learning objects and Virtual Learning Environments are considered.
182

Poster Session – Short Papers
183

�
184
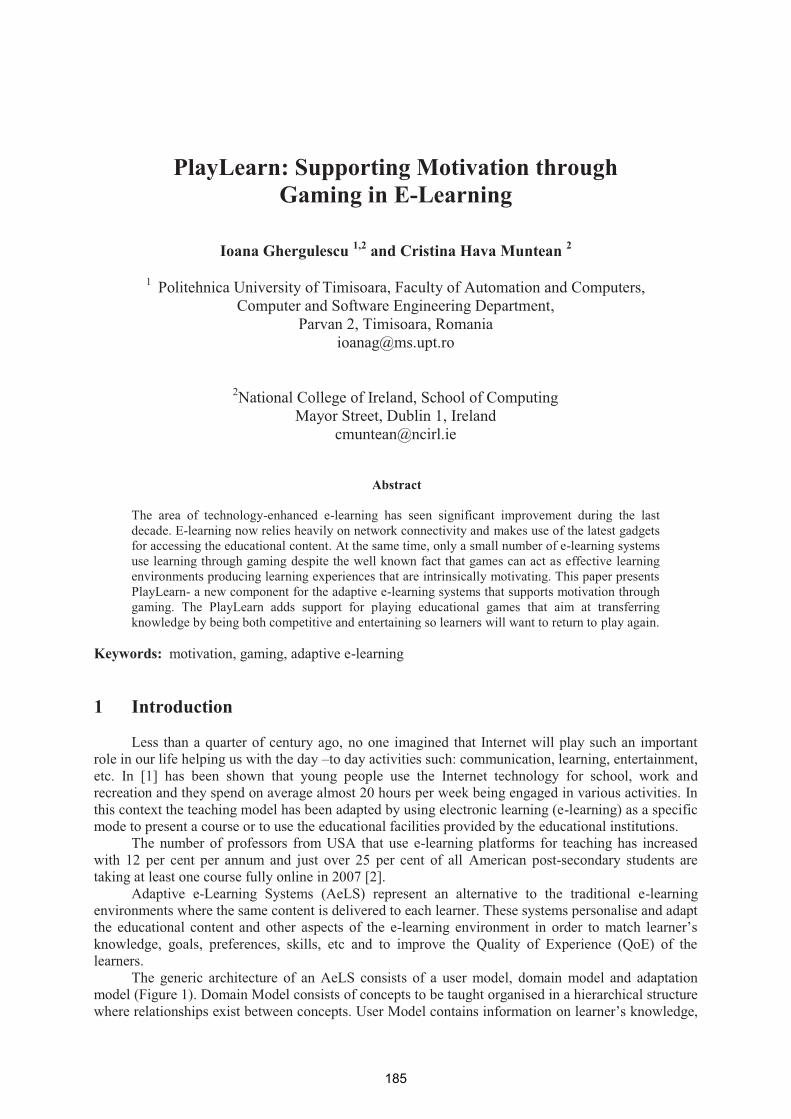
PlayLearn: Supporting Motivation through
Gaming in E-Learning
Ioana Ghergulescu 1,2 and Cristina Hava Muntean 2
1 Politehnica University of Timisoara, Faculty of Automation and Computers, Computer and Software Engineering Department,
Parvan 2, Timisoara, Romania [email protected]
2National College of Ireland, School of Computing Mayor Street, Dublin 1, Ireland
Abstract
The area of technology-enhanced e-learning has seen significant improvement during the last decade. E-learning now relies heavily on network connectivity and makes use of the latest gadgets for accessing the educational content. At the same time, only a small number of e-learning systems use learning through gaming despite the well known fact that games can act as effective learning environments producing learning experiences that are intrinsically motivating. This paper presents PlayLearn- a new component for the adaptive e-learning systems that supports motivation through gaming. The PlayLearn adds support for playing educational games that aim at transferring knowledge by being both competitive and entertaining so learners will want to return to play again.
Keywords: motivation, gaming, adaptive e-learning 1 Introduction
Less than a quarter of century ago, no one imagined that Internet will play such an important role in our life helping us with the day –to day activities such: communication, learning, entertainment, etc. In [1] has been shown that young people use the Internet technology for school, work and recreation and they spend on average almost 20 hours per week being engaged in various activities. In this context the teaching model has been adapted by using electronic learning (e-learning) as a specific mode to present a course or to use the educational facilities provided by the educational institutions.
The number of professors from USA that use e-learning platforms for teaching has increased with 12 per cent per annum and just over 25 per cent of all American post-secondary students are taking at least one course fully online in 2007 [2].
Adaptive e-Learning Systems (AeLS) represent an alternative to the traditional e-learning environments where the same content is delivered to each learner. These systems personalise and adapt the educational content and other aspects of the e-learning environment in order to match learner’s knowledge, goals, preferences, skills, etc and to improve the Quality of Experience (QoE) of the learners.
The generic architecture of an AeLS consists of a user model, domain model and adaptation model (Figure 1). Domain Model consists of concepts to be taught organised in a hierarchical structure where relationships exist between concepts. User Model contains information on learner’s knowledge,
185
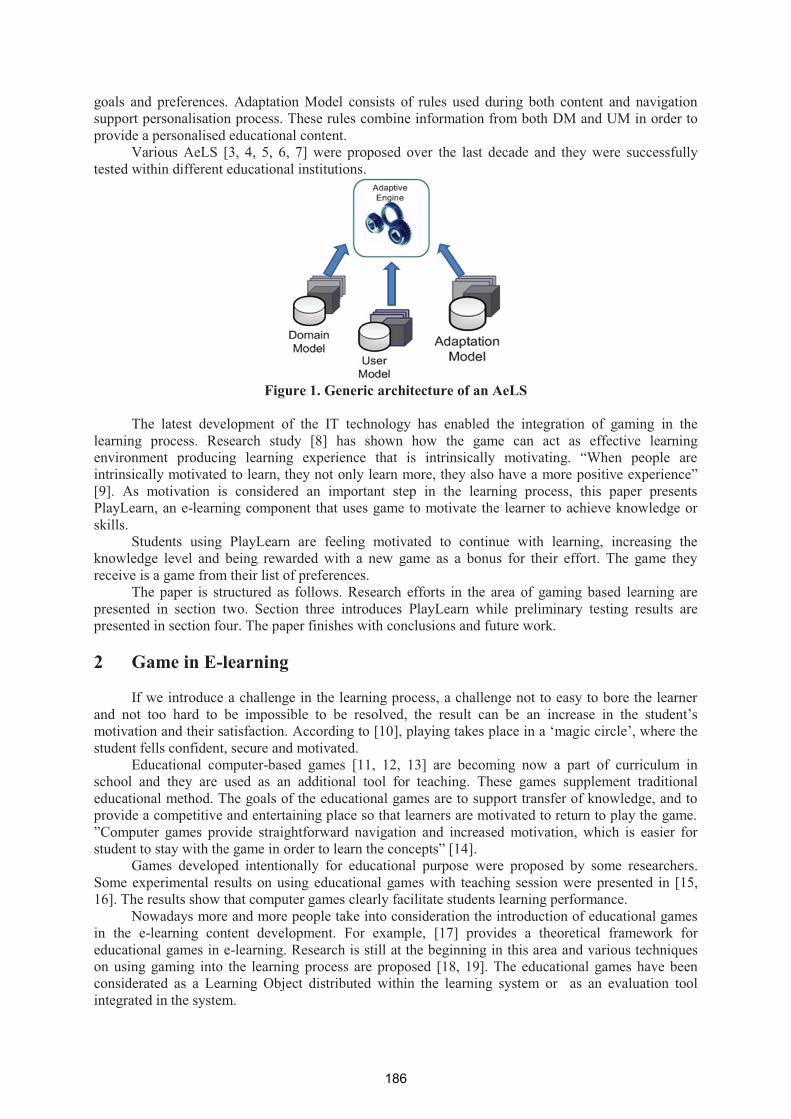
goals and preferences. Adaptation Model consists of rules used during both content and navigation support personalisation process. These rules combine information from both DM and UM in order to provide a personalised educational content.
Various AeLS [3, 4, 5, 6, 7] were proposed over the last decade and they were successfully tested within different educational institutions.
Figure 1. Generic architecture of an AeLS
The latest development of the IT technology has enabled the integration of gaming in the learning process. Research study [8] has shown how the game can act as effective learning environment producing learning experience that is intrinsically motivating. “When people are intrinsically motivated to learn, they not only learn more, they also have a more positive experience” [9]. As motivation is considered an important step in the learning process, this paper presents PlayLearn, an e-learning component that uses game to motivate the learner to achieve knowledge or skills.
Students using PlayLearn are feeling motivated to continue with learning, increasing the knowledge level and being rewarded with a new game as a bonus for their effort. The game they receive is a game from their list of preferences.
The paper is structured as follows. Research efforts in the area of gaming based learning are presented in section two. Section three introduces PlayLearn while preliminary testing results are presented in section four. The paper finishes with conclusions and future work. 2 Game in E-learning
If we introduce a challenge in the learning process, a challenge not to easy to bore the learner and not too hard to be impossible to be resolved, the result can be an increase in the student’s motivation and their satisfaction. According to [10], playing takes place in a ‘magic circle’, where the student fells confident, secure and motivated.
Educational computer-based games [11, 12, 13] are becoming now a part of curriculum in school and they are used as an additional tool for teaching. These games supplement traditional educational method. The goals of the educational games are to support transfer of knowledge, and to provide a competitive and entertaining place so that learners are motivated to return to play the game. ”Computer games provide straightforward navigation and increased motivation, which is easier for student to stay with the game in order to learn the concepts” [14].
Games developed intentionally for educational purpose were proposed by some researchers. Some experimental results on using educational games with teaching session were presented in [15, 16]. The results show that computer games clearly facilitate students learning performance.
Nowadays more and more people take into consideration the introduction of educational games in the e-learning content development. For example, [17] provides a theoretical framework for educational games in e-learning. Research is still at the beginning in this area and various techniques on using gaming into the learning process are proposed [18, 19]. The educational games have been considerated as a Learning Object distributed within the learning system or as an evaluation tool integrated in the system.
186

3 PlayLearn
In order to motivate someone you give s/he a reason (or a set of reasons) that determines that person to engage in a particular behavior. Learning motivation can be used to focus the students’ attention and to make them to want to acquire more knowledge. When the learner natural interest grows in an intrinsic satisfaction, it involves an interest in the learning task and it can become a challenge to do that task. Therefore, you can motivate students by giving them something that they like, for example a game. With PlayLearn, when a learner has passed a knowledge level they will receive a new game. In order to integrate PlayLearn with an AeLS we have extended the generic AeLs architecture that mainly consists of a User/Learner Model, Domain Model and Adaptation Model with a PlayLearn component (Figure 2).
Figure 2. PlayLearn integrated with AeLS
The requirements for the PlayLearn module include a list of assessment items as input for the adaptation engine and the type of games a learner enjoys the most. The learner knowledge level is required from the User Model. Learner’s game preferences and the current knowledge level stored by the User Model are saved in a PlayLearn profile database. Game adaptation rules are also created in order to determine when a student receives a new game and what kind of game should be. A game is presented to the learner through a game interface embedded in the web page that presents the learning content. Figure 3 shows in more details the PlayLearn module.
Figure 3. PlayLearn Module
187
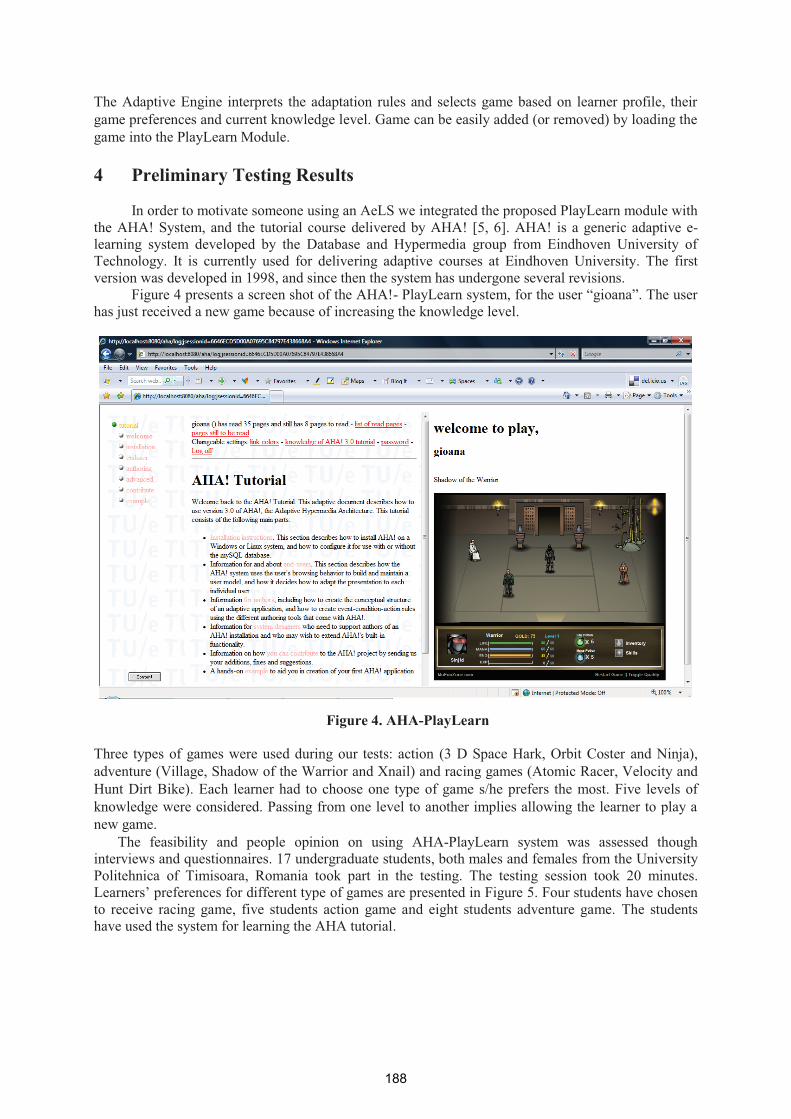
The Adaptive Engine interprets the adaptation rules and selects game based on learner profile, their game preferences and current knowledge level. Game can be easily added (or removed) by loading the game into the PlayLearn Module. 4 Preliminary Testing Results
In order to motivate someone using an AeLS we integrated the proposed PlayLearn module with the AHA! System, and the tutorial course delivered by AHA! [5, 6]. AHA! is a generic adaptive e-learning system developed by the Database and Hypermedia group from Eindhoven University of Technology. It is currently used for delivering adaptive courses at Eindhoven University. The first version was developed in 1998, and since then the system has undergone several revisions.
Figure 4 presents a screen shot of the AHA!- PlayLearn system, for the user “gioana”. The user has just received a new game because of increasing the knowledge level.
Figure 4. AHA-PlayLearn
Three types of games were used during our tests: action (3 D Space Hark, Orbit Coster and Ninja), adventure (Village, Shadow of the Warrior and Xnail) and racing games (Atomic Racer, Velocity and Hunt Dirt Bike). Each learner had to choose one type of game s/he prefers the most. Five levels of knowledge were considered. Passing from one level to another implies allowing the learner to play a new game.
The feasibility and people opinion on using AHA-PlayLearn system was assessed though interviews and questionnaires. 17 undergraduate students, both males and females from the University Politehnica of Timisoara, Romania took part in the testing. The testing session took 20 minutes. Learners’ preferences for different type of games are presented in Figure 5. Four students have chosen to receive racing game, five students action game and eight students adventure game. The students have used the system for learning the AHA tutorial.
188
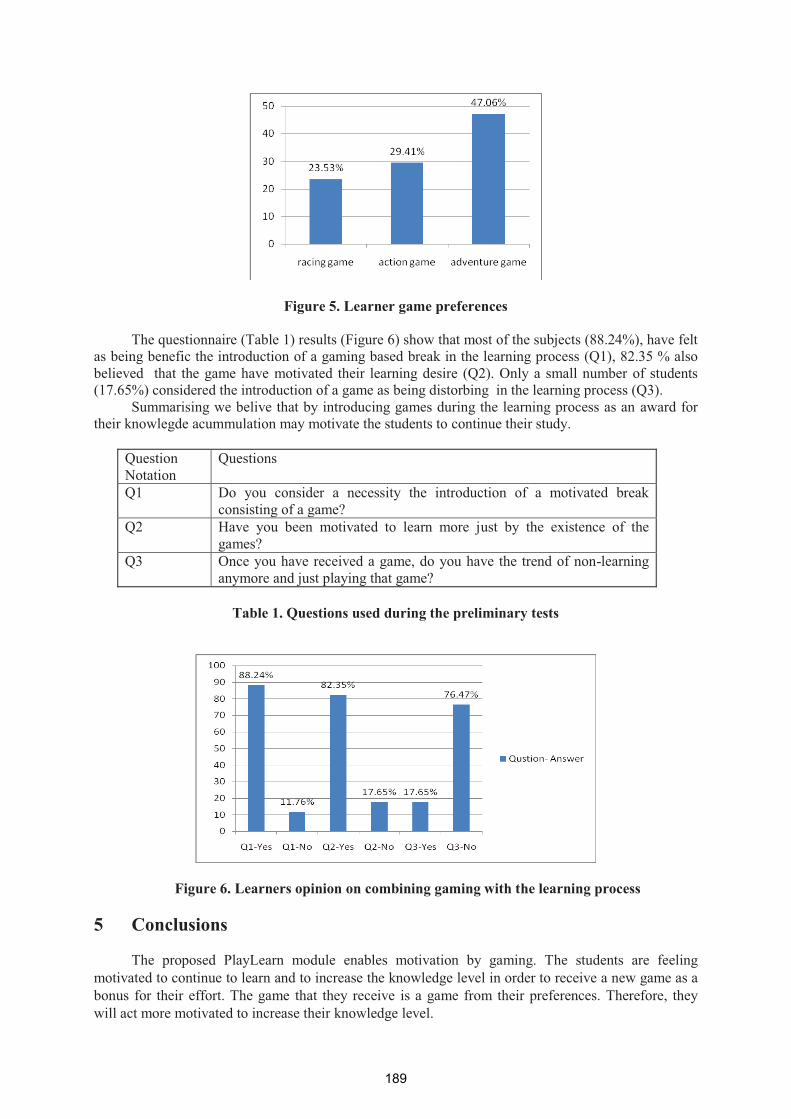
Figure 5. Learner game preferences
The questionnaire (Table 1) results (Figure 6) show that most of the subjects (88.24%), have felt as being benefic the introduction of a gaming based break in the learning process (Q1), 82.35 % also believed that the game have motivated their learning desire (Q2). Only a small number of students (17.65%) considered the introduction of a game as being distorbing in the learning process (Q3). Summarising we belive that by introducing games during the learning process as an award for their knowlegde acummulation may motivate the students to continue their study.
Question Notation
Questions
Q1 Do you consider a necessity the introduction of a motivated break consisting of a game?
Q2 Have you been motivated to learn more just by the existence of the games?
Q3 Once you have received a game, do you have the trend of non-learning anymore and just playing that game?
Table 1. Questions used during the preliminary tests
Figure 6. Learners opinion on combining gaming with the learning process
5 Conclusions
The proposed PlayLearn module enables motivation by gaming. The students are feeling motivated to continue to learn and to increase the knowledge level in order to receive a new game as a bonus for their effort. The game that they receive is a game from their preferences. Therefore, they will act more motivated to increase their knowledge level.
189
Additionally by making use of games, a significant increase in motivation is expected with direct effect on the outcome of the learning process and on the learner satisfaction.
A significant challenge for our future work is to find/create game types that best suit the learning process and they further consolidate the accumulated knowledge. We also intend to test PlayLearn in both secondary schools and third level institutions and to assess the learning ourcomes of the students.
References [1] Caruso, J. B. (2008). The ECAR Study of Undergraduate Students and Information Technology. http://net.educause.edu/ir/library/pdf/ECM/ECM0808.pdf. [2] Bates, T. (2008). The state of e-learning 2008. http://www.tonybates.ca/2008/12/19/the-state-of-
e-learning-2008. [3] Muntean, C.H. (2008).Improving Learner Quality of Experience by Content Adaptation based
on Network Conditions. Computers in Human Behavior Journal, Special issue on "Integration of Human Factors in Networked Computing, 24(4): 1452-1472.
[4] Muntean, C. H., McManis, J. (2008). End-User Quality of Experience Oriented Adaptive E-learning System. Journal of Digital Information, Special Issue on Adaptive Hypermedia, 7(1).
[5] De Bra, P., Smits, D., Stash, N. (2006).Creating and Delivering Adaptive Courses with AHA!.Proceedings of the first European Conference on Technology Enhanced Learning, Springer LNCS 4227: 21-33.
[6] De Bra, P., Calvi, L. (1998). AHA: A Generic Adaptive Hypermedia System. ACM HYPERTEXT’98 Conference, Workshop on Adaptive Hypertext and Hypermedia, 5(12).
[7] Chang, Y., Lu, T., Fang, R. (2007). An adaptive e-learning system based on intelligent agents. Proceedings of the 6th Conference on WSEAS International Conference on Applied Computer Science, 6 :200-205.
[8] Bizzocchi, J., Paras, B. (2005). Game, Motivation, and Effective Learning: An Integrated Model for Educational Game Design. DiGRA 2005 Conference: Changing Views--Worlds in Play.
[9] Chan, T. S., Ahern, T. C (1999). Targeting motivation – adapting flow theory to instructional design. Journal of Educational Computing Research, 21 (2):152-163.
[10] Salen, K., Zimmerman, E. (2004).Rules of Play: Game Design Fundamentals. Massachusetts Institute of Technology.
[11] http://www.nintendo.com/whatsnew/detail/g4kroj8bE-AOnuxW_CB57mVL4RHA55YI [12] http://www.food-force.com/ [13] http://cisr.nps.edu/cyberciege/ [14] Batson, L., Feinberg, S. (2006). Game Design that Enhance Motivation and Learning for
Teenagers. Electronic Journal for the Integration of Technology in Education. [15] Can, G., Cagiltay, K. (2009).Turkish Prospective Teachers' Perceptions Regarding the Use of
Computer Games with Educational Features. Journal of Educational Technology & Society, Special Issue on "Current Research in Learning Design, 9:308-321.
[16] Chuang, T.-Y., Chen, W.-F. (2009) “Effect of Computer-Based Video Games on Children: An Experimental Study. Journal of Educational Technology & Society, 12(2): 1–10.
[17] Bae, Y., Lim J., Lee, T. (2005). Work in progress - a study on educational computer games for e-learning based on activity theory Frontiers in Education.Proceedings 35th Annual Conference: F1C – 18.
[18] Torrente, J., Moreno-Ger, P., Martínez-Ortiz,I., Fernández-Manjón, B. (2009). Integration and Deployment of Educational Games in e-Learning Environments: The Learning Object Model Meets Educational Gaming. Educational Technology & Society (In press).
[19] Torrente, J., Lavín-Mera,P., Moreno-Ger, P., Fernández-Manjón, B.(2009). Coordinating Heterogeneous Game-based Learning Approaches In Online Learning Environments.Re-published in Transactions on Edutainment II, Lecture Notes in Computer Science 5660:1-18 (In press).
190
Towards Integrated Hybrid Modelling and SimulationPlatform for Building Automation Systems; First Models for
a Simple HVAC System
Alie El-Din Mady 1, Menouer Boubekeur 1, Gregory Provan 1
1CCSL, Computer Science Department,University College Cork,
Cork, Ireland,{mae1, m.boubekeur, g.provan}@cs.ucc.ie
Abstract
The aim of our research work is the development of an integrated platform for modelling and sim-
ulation of building operation systems. This platform uses hybrid automata which allows models
for continuous and discrete behaviours. A model-driven hierarchical hybrid automata behaving in a
multi-agent mode is adopted to provide an efficient and coherent modelling, it also facilitates system
integration. The paper introduces the modelling framework and provides the first results for mod-
elling and simulation of a simple Heating, Ventilating, and Air Conditioning (HVAC) system for a
single room.
Keywords: Building Automation Systems, HVAC, Hybrid System Modelling, Embedded Middleware.
1 Introduction
The aim of a modern Building Automation System (BAS) is to enhance the functionality of interactive
control strategies leading towards energy efficiency and a more user friendly environment. In this context,
the BAS complexity is rapidly increasing due to the large number of objects deployed, e.g. sensors and
actuators and also to the integration of complex control strategies for different physical effects, e.g. light
and temperature. This integration is required because of the physical coupling of these effects.
System integration for BAS can be achieved using model-driven techniques. Indeed, constructing
models using a compositional model-driven approach is becoming more critical, given the increased
scale of systems that are being modelled, e.g. smart automation for large buildings or chip fabrication
plants. In such cases, using a component-based tool can significantly improve the speed, and reduce the
cost of modelling and verification. It can also help developing efficient optimizations.
On the other hand, computer simulation techniques can help to tackle the challenges due to the
integration of large heterogenous systems; it is increasingly gaining importance as a tool for optimization
and analysis of buildings and their control and energy systems.
Currently many software tools are dedicated to building performance simulation. Unfortunately they
lack flexibility and transparent modelling of control strategies. What is needed is an integrated simulation
platform that is able to simulate the user comfort and energetic aspects of a given building considering
predictive control strategies. This is especially important when considering the heterogeneous nature of
the systems involved in buildings.
The main challenge is to optimize energy usage while trying to provide adequate user comfort. Sev-
eral research and industrial works have been dedicated to this topic, they use different approaches, e.g.
Matlab/simulink [MAT, ], hybrid systems[G. Labinaz, 1996], Petri net formalisms[L. Gomes, 2007] or
finite state automata. Building energy simulation tools are also used to optimize energy usage. In
191
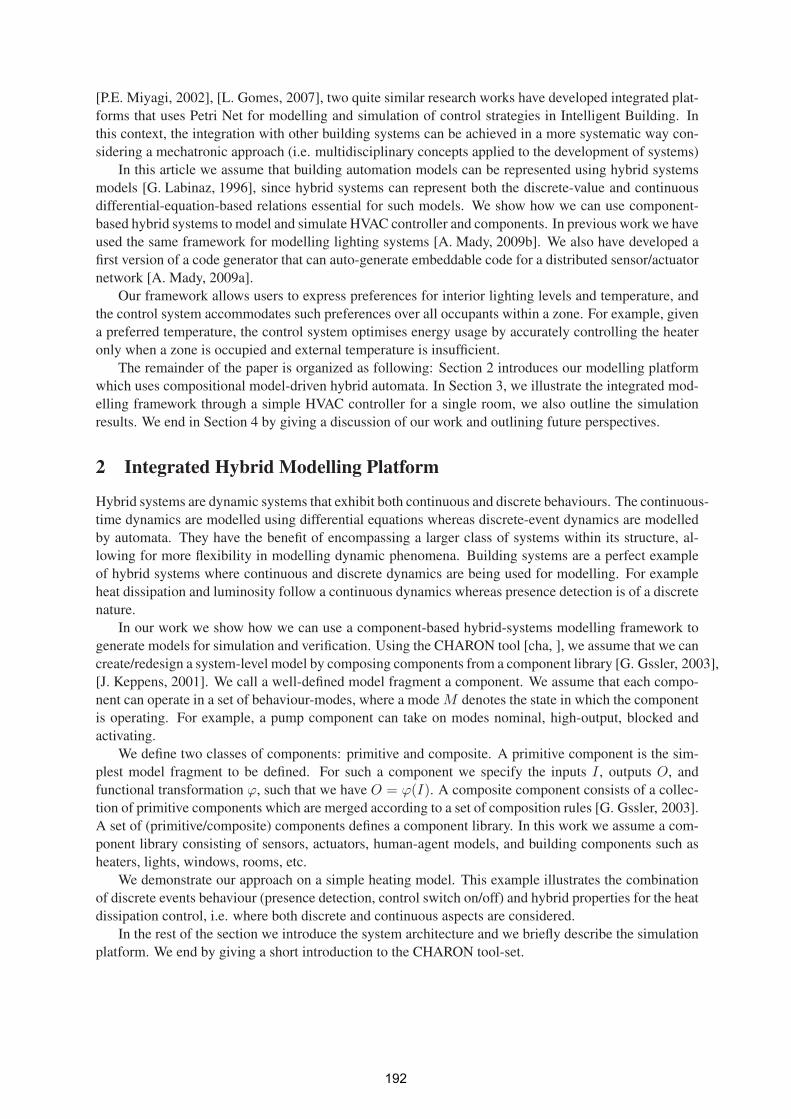
[P.E. Miyagi, 2002], [L. Gomes, 2007], two quite similar research works have developed integrated plat-
forms that uses Petri Net for modelling and simulation of control strategies in Intelligent Building. In
this context, the integration with other building systems can be achieved in a more systematic way con-
sidering a mechatronic approach (i.e. multidisciplinary concepts applied to the development of systems)
In this article we assume that building automation models can be represented using hybrid systems
models [G. Labinaz, 1996], since hybrid systems can represent both the discrete-value and continuous
differential-equation-based relations essential for such models. We show how we can use component-
based hybrid systems to model and simulate HVAC controller and components. In previous work we have
used the same framework for modelling lighting systems [A. Mady, 2009b]. We also have developed a
first version of a code generator that can auto-generate embeddable code for a distributed sensor/actuator
network [A. Mady, 2009a].
Our framework allows users to express preferences for interior lighting levels and temperature, and
the control system accommodates such preferences over all occupants within a zone. For example, given
a preferred temperature, the control system optimises energy usage by accurately controlling the heater
only when a zone is occupied and external temperature is insufficient.
The remainder of the paper is organized as following: Section 2 introduces our modelling platform
which uses compositional model-driven hybrid automata. In Section 3, we illustrate the integrated mod-
elling framework through a simple HVAC controller for a single room, we also outline the simulation
results. We end in Section 4 by giving a discussion of our work and outlining future perspectives.
2 Integrated Hybrid Modelling Platform
Hybrid systems are dynamic systems that exhibit both continuous and discrete behaviours. The continuous-
time dynamics are modelled using differential equations whereas discrete-event dynamics are modelled
by automata. They have the benefit of encompassing a larger class of systems within its structure, al-
lowing for more flexibility in modelling dynamic phenomena. Building systems are a perfect example
of hybrid systems where continuous and discrete dynamics are being used for modelling. For example
heat dissipation and luminosity follow a continuous dynamics whereas presence detection is of a discrete
nature.
In our work we show how we can use a component-based hybrid-systems modelling framework to
generate models for simulation and verification. Using the CHARON tool [cha, ], we assume that we can
create/redesign a system-level model by composing components from a component library [G. Gssler, 2003],
[J. Keppens, 2001]. We call a well-defined model fragment a component. We assume that each compo-
nent can operate in a set of behaviour-modes, where a mode M denotes the state in which the component
is operating. For example, a pump component can take on modes nominal, high-output, blocked and
activating.
We define two classes of components: primitive and composite. A primitive component is the sim-
plest model fragment to be defined. For such a component we specify the inputs I , outputs O, and
functional transformation ϕ, such that we have O = ϕ(I). A composite component consists of a collec-
tion of primitive components which are merged according to a set of composition rules [G. Gssler, 2003].
A set of (primitive/composite) components defines a component library. In this work we assume a com-
ponent library consisting of sensors, actuators, human-agent models, and building components such as
heaters, lights, windows, rooms, etc.
We demonstrate our approach on a simple heating model. This example illustrates the combination
of discrete events behaviour (presence detection, control switch on/off) and hybrid properties for the heat
dissipation control, i.e. where both discrete and continuous aspects are considered.
In the rest of the section we introduce the system architecture and we briefly describe the simulation
platform. We end by giving a short introduction to the CHARON tool-set.
192
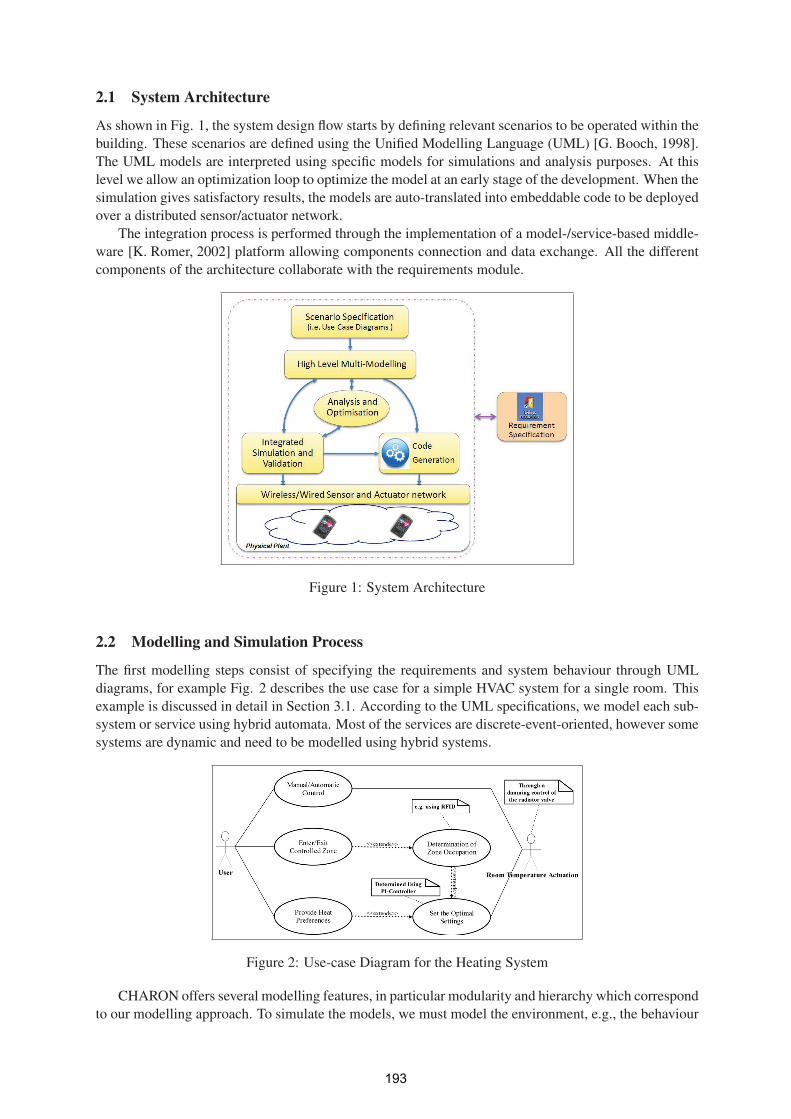
2.1 System Architecture
As shown in Fig. 1, the system design flow starts by defining relevant scenarios to be operated within the
building. These scenarios are defined using the Unified Modelling Language (UML) [G. Booch, 1998].
The UML models are interpreted using specific models for simulations and analysis purposes. At this
level we allow an optimization loop to optimize the model at an early stage of the development. When the
simulation gives satisfactory results, the models are auto-translated into embeddable code to be deployed
over a distributed sensor/actuator network.
The integration process is performed through the implementation of a model-/service-based middle-
ware [K. Romer, 2002] platform allowing components connection and data exchange. All the different
components of the architecture collaborate with the requirements module.
Figure 1: System Architecture
2.2 Modelling and Simulation Process
The first modelling steps consist of specifying the requirements and system behaviour through UML
diagrams, for example Fig. 2 describes the use case for a simple HVAC system for a single room. This
example is discussed in detail in Section 3.1. According to the UML specifications, we model each sub-
system or service using hybrid automata. Most of the services are discrete-event-oriented, however some
systems are dynamic and need to be modelled using hybrid systems.
Figure 2: Use-case Diagram for the Heating System
CHARON offers several modelling features, in particular modularity and hierarchy which correspond
to our modelling approach. To simulate the models, we must model the environment, e.g., the behaviour
193
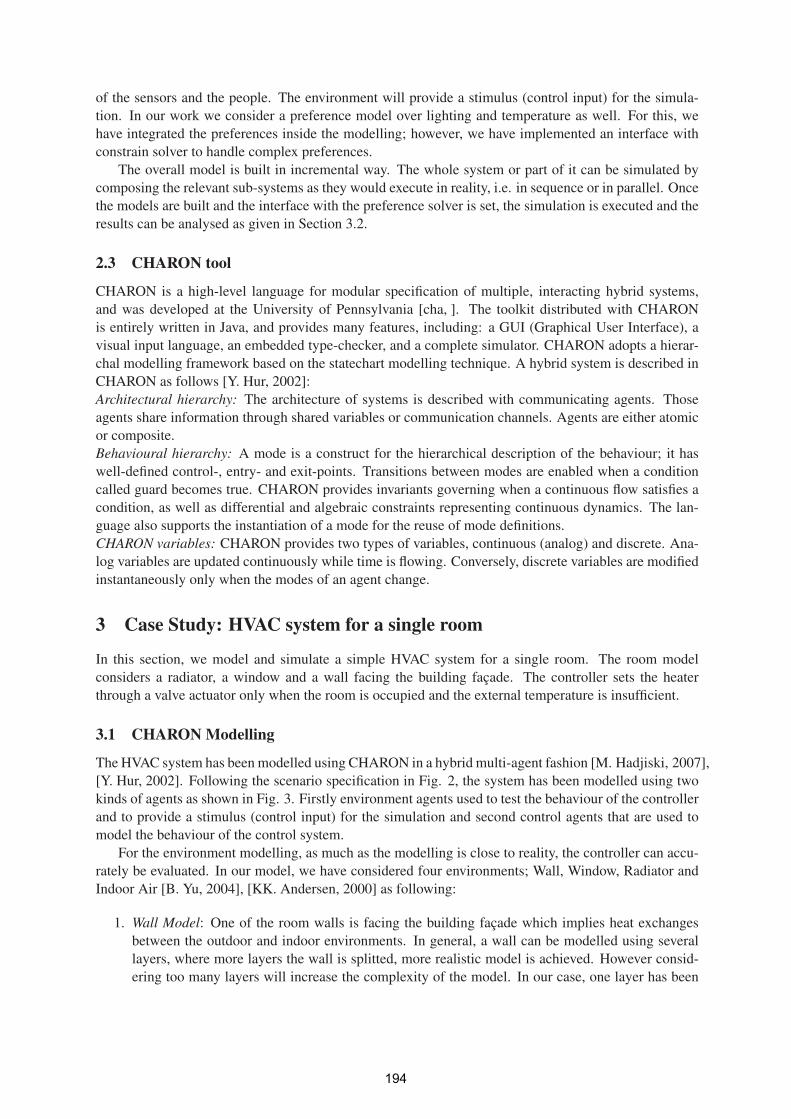
of the sensors and the people. The environment will provide a stimulus (control input) for the simula-
tion. In our work we consider a preference model over lighting and temperature as well. For this, we
have integrated the preferences inside the modelling; however, we have implemented an interface with
constrain solver to handle complex preferences.
The overall model is built in incremental way. The whole system or part of it can be simulated by
composing the relevant sub-systems as they would execute in reality, i.e. in sequence or in parallel. Once
the models are built and the interface with the preference solver is set, the simulation is executed and the
results can be analysed as given in Section 3.2.
2.3 CHARON tool
CHARON is a high-level language for modular specification of multiple, interacting hybrid systems,
and was developed at the University of Pennsylvania [cha, ]. The toolkit distributed with CHARON
is entirely written in Java, and provides many features, including: a GUI (Graphical User Interface), a
visual input language, an embedded type-checker, and a complete simulator. CHARON adopts a hierar-
chal modelling framework based on the statechart modelling technique. A hybrid system is described in
CHARON as follows [Y. Hur, 2002]:
Architectural hierarchy: The architecture of systems is described with communicating agents. Those
agents share information through shared variables or communication channels. Agents are either atomic
or composite.
Behavioural hierarchy: A mode is a construct for the hierarchical description of the behaviour; it has
well-defined control-, entry- and exit-points. Transitions between modes are enabled when a condition
called guard becomes true. CHARON provides invariants governing when a continuous flow satisfies a
condition, as well as differential and algebraic constraints representing continuous dynamics. The lan-
guage also supports the instantiation of a mode for the reuse of mode definitions.
CHARON variables: CHARON provides two types of variables, continuous (analog) and discrete. Ana-
log variables are updated continuously while time is flowing. Conversely, discrete variables are modified
instantaneously only when the modes of an agent change.
3 Case Study: HVAC system for a single room
In this section, we model and simulate a simple HVAC system for a single room. The room model
considers a radiator, a window and a wall facing the building facade. The controller sets the heater
through a valve actuator only when the room is occupied and the external temperature is insufficient.
3.1 CHARON Modelling
The HVAC system has been modelled using CHARON in a hybrid multi-agent fashion [M. Hadjiski, 2007],
[Y. Hur, 2002]. Following the scenario specification in Fig. 2, the system has been modelled using two
kinds of agents as shown in Fig. 3. Firstly environment agents used to test the behaviour of the controller
and to provide a stimulus (control input) for the simulation and second control agents that are used to
model the behaviour of the control system.
For the environment modelling, as much as the modelling is close to reality, the controller can accu-
rately be evaluated. In our model, we have considered four environments; Wall, Window, Radiator and
Indoor Air [B. Yu, 2004], [KK. Andersen, 2000] as following:
1. Wall Model: One of the room walls is facing the building facade which implies heat exchanges
between the outdoor and indoor environments. In general, a wall can be modelled using several
layers, where more layers the wall is splitted, more realistic model is achieved. However consid-
ering too many layers will increase the complexity of the model. In our case, one layer has been
194
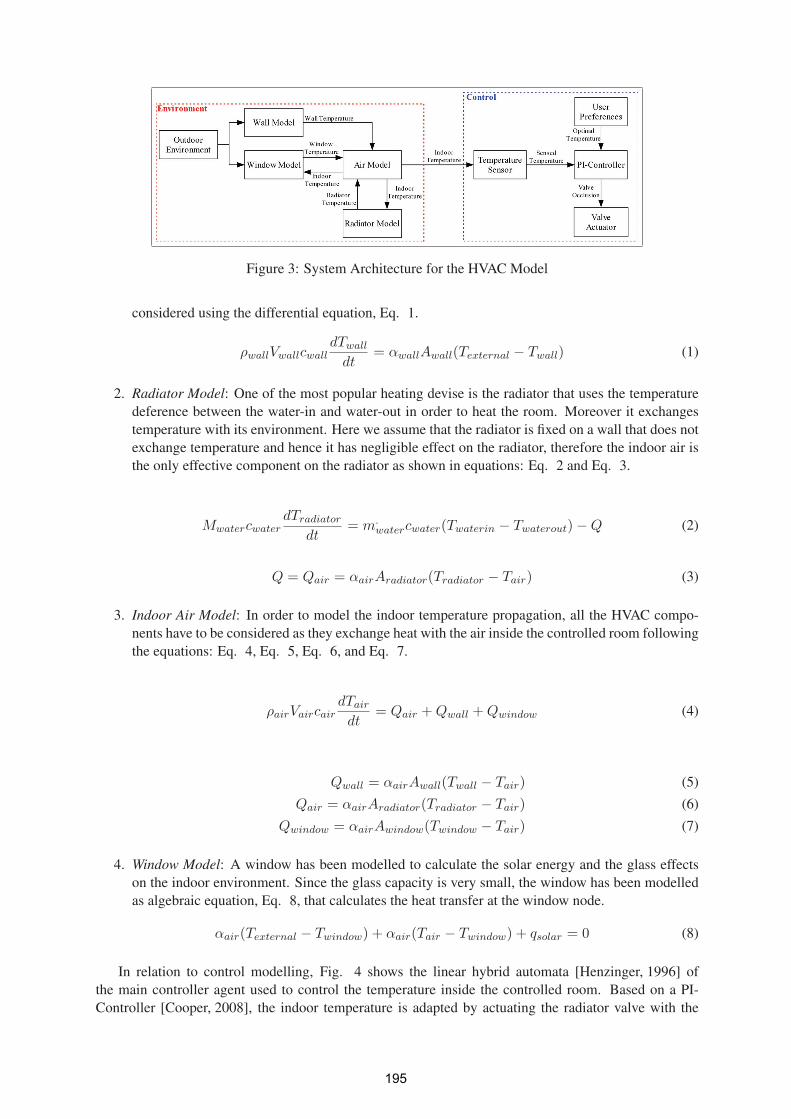
Figure 3: System Architecture for the HVAC Model
considered using the differential equation, Eq. 1.
ρwallVwallcwalldTwall
dt= αwallAwall(Texternal − Twall) (1)
2. Radiator Model: One of the most popular heating devise is the radiator that uses the temperature
deference between the water-in and water-out in order to heat the room. Moreover it exchanges
temperature with its environment. Here we assume that the radiator is fixed on a wall that does not
exchange temperature and hence it has negligible effect on the radiator, therefore the indoor air is
the only effective component on the radiator as shown in equations: Eq. 2 and Eq. 3.
MwatercwaterdTradiator
dt= m.
watercwater(Twaterin − Twaterout) − Q (2)
Q = Qair = αairAradiator(Tradiator − Tair) (3)
3. Indoor Air Model: In order to model the indoor temperature propagation, all the HVAC compo-
nents have to be considered as they exchange heat with the air inside the controlled room following
the equations: Eq. 4, Eq. 5, Eq. 6, and Eq. 7.
ρairVaircairdTair
dt= Qair + Qwall + Qwindow (4)
Qwall = αairAwall(Twall − Tair) (5)
Qair = αairAradiator(Tradiator − Tair) (6)
Qwindow = αairAwindow(Twindow − Tair) (7)
4. Window Model: A window has been modelled to calculate the solar energy and the glass effects
on the indoor environment. Since the glass capacity is very small, the window has been modelled
as algebraic equation, Eq. 8, that calculates the heat transfer at the window node.
αair(Texternal − Twindow) + αair(Tair − Twindow) + qsolar = 0 (8)
In relation to control modelling, Fig. 4 shows the linear hybrid automata [Henzinger, 1996] of
the main controller agent used to control the temperature inside the controlled room. Based on a PI-
Controller [Cooper, 2008], the indoor temperature is adapted by actuating the radiator valve with the
195
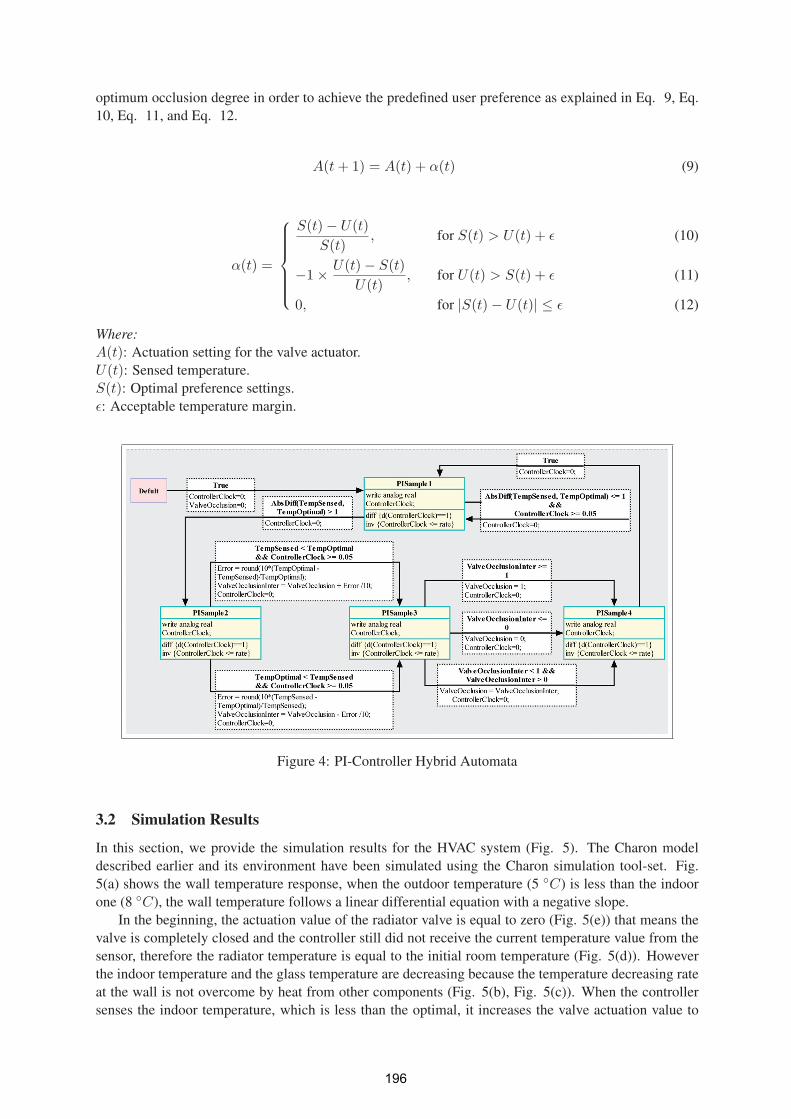
optimum occlusion degree in order to achieve the predefined user preference as explained in Eq. 9, Eq.
10, Eq. 11, and Eq. 12.
A(t + 1) = A(t) + α(t) (9)
α(t) =
⎧⎪⎪⎪⎪⎪⎨⎪⎪⎪⎪⎪⎩
S(t) − U(t)
S(t), for S(t) > U(t) + ε (10)
−1 × U(t) − S(t)
U(t), for U(t) > S(t) + ε (11)
0, for |S(t) − U(t)| ≤ ε (12)
Where:A(t): Actuation setting for the valve actuator.
U(t): Sensed temperature.
S(t): Optimal preference settings.
ε: Acceptable temperature margin.
Figure 4: PI-Controller Hybrid Automata
3.2 Simulation Results
In this section, we provide the simulation results for the HVAC system (Fig. 5). The Charon model
described earlier and its environment have been simulated using the Charon simulation tool-set. Fig.
5(a) shows the wall temperature response, when the outdoor temperature (5 ◦C) is less than the indoor
one (8 ◦C), the wall temperature follows a linear differential equation with a negative slope.
In the beginning, the actuation value of the radiator valve is equal to zero (Fig. 5(e)) that means the
valve is completely closed and the controller still did not receive the current temperature value from the
sensor, therefore the radiator temperature is equal to the initial room temperature (Fig. 5(d)). However
the indoor temperature and the glass temperature are decreasing because the temperature decreasing rate
at the wall is not overcome by heat from other components (Fig. 5(b), Fig. 5(c)). When the controller
senses the indoor temperature, which is less than the optimal, it increases the valve actuation value to
196
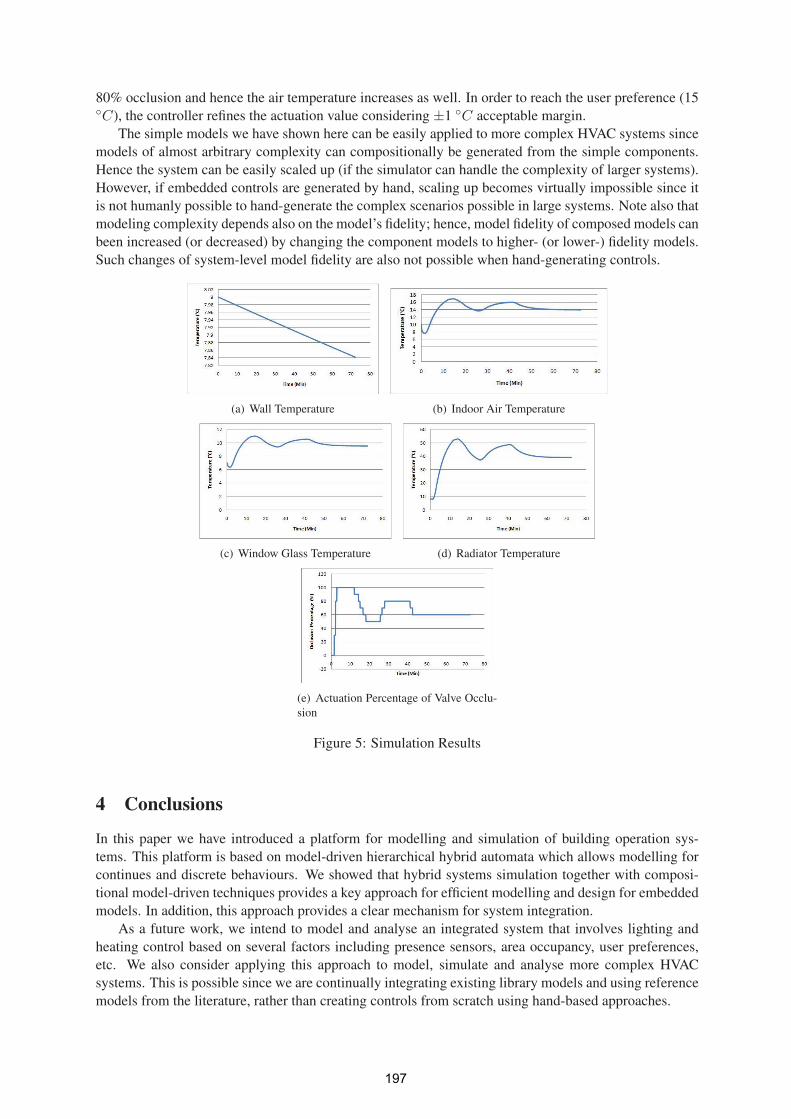
80% occlusion and hence the air temperature increases as well. In order to reach the user preference (15◦C), the controller refines the actuation value considering ±1 ◦C acceptable margin.
The simple models we have shown here can be easily applied to more complex HVAC systems since
models of almost arbitrary complexity can compositionally be generated from the simple components.
Hence the system can be easily scaled up (if the simulator can handle the complexity of larger systems).
However, if embedded controls are generated by hand, scaling up becomes virtually impossible since it
is not humanly possible to hand-generate the complex scenarios possible in large systems. Note also that
modeling complexity depends also on the model’s fidelity; hence, model fidelity of composed models can
been increased (or decreased) by changing the component models to higher- (or lower-) fidelity models.
Such changes of system-level model fidelity are also not possible when hand-generating controls.
(a) Wall Temperature (b) Indoor Air Temperature
(c) Window Glass Temperature (d) Radiator Temperature
(e) Actuation Percentage of Valve Occlu-
sion
Figure 5: Simulation Results
4 Conclusions
In this paper we have introduced a platform for modelling and simulation of building operation sys-
tems. This platform is based on model-driven hierarchical hybrid automata which allows modelling for
continues and discrete behaviours. We showed that hybrid systems simulation together with composi-
tional model-driven techniques provides a key approach for efficient modelling and design for embedded
models. In addition, this approach provides a clear mechanism for system integration.
As a future work, we intend to model and analyse an integrated system that involves lighting and
heating control based on several factors including presence sensors, area occupancy, user preferences,
etc. We also consider applying this approach to model, simulate and analyse more complex HVAC
systems. This is possible since we are continually integrating existing library models and using reference
models from the literature, rather than creating controls from scratch using hand-based approaches.
197

The benefit of model-based development for energy efficient controls constitutes an important re-
search topic that we intend to pursue in future work. We plan to demonstrate the overall platform in the
UCC Environmental Research Institute (ERI) building, which is the ITOBO Living Laboratory [ERI, ]
[ERI, ].
5 NomenclatureSymbol Discerption UnitTwall Wall temperature ◦CTexternal Outdoor temperature ◦CTradiator Radiator temperature ◦CTair Indoor temperature ◦CTwindow Glass temperature ◦CTwaterin Water-In temperature to the radiator ◦CTwaterout Water-Out temperature from the radiator ◦Cρwall Wall density kg/m3
Vwall Wall geometric volume m3
αwall Wall thermal conductance W/(m2.K)αair Indoor air thermal conductance W/(m2.K)Mwater Water mass Kgcwater Water specific heat capacity J/Kg.Kcair Indoor air specific heat capacity J/Kg.Kcwall Wall specific heat capacity J/Kg.Km.
water Water mass flow rate throw the radiator valve Kg/sQ Pseudo-thermal state heat for the components attached to the radiator JQair Indoor air pseudo-thermal state heat JQwall Wall pseudo-thermal state heat JQwindow Glass pseudo-thermal state heat Jqsolar Solar energy w/m2
Aradiator Radiator geometric area m2
Awall Wall geometric area m2
Acknowledgment
This work was funded by SFI grant 06-SRC-I1091.
References
[cha, ] Charon: Modular specification of hybrid systems. Website.
http://rtg.cis.upenn.edu/mobies/charon/.
[ERI, ] Environmental research institute. Website. http://www.ucc.ie/en/ERI/.
[MAT, ] Matlab. Website. http://www.mathworks.com/.
[A. Mady, 2009a] A. Mady, M. Boubekeur, G. P. (2009a). Compositional model-driven design of em-
bedded code for energy-efficient buildings. 7th IEEE International Conference on Industrial Infor-
matics (INDIN 2009), Cardiff, UK.
[A. Mady, 2009b] A. Mady, M. Boubekeur, G. P. (2009b). Integrated simulation platform for optimized
building operations. Proc. International Conference on Intelligent Building and Management (ICIBM
2009), Singapore.
198
[B. Yu, 2004] B. Yu, A. v. P. (2004). Simulink and bond graph modeling of an air-conditioned room.
Simulation Modelling Practice and Theory, Elsevier.
[Cooper, 2008] Cooper, D. J. (2008). Practical process control, proven methods and best practices for
automatic pid control. e-textbook.
[G. Booch, 1998] G. Booch, J. Rumbaugh, I. J. (1998). The unified modeling language user guide.
Addison Wesley.
[G. Gssler, 2003] G. Gssler, J. S. (2003). Composition for component-based modeling. Formal Methods
for Components and Objects, Springer Lecture Notes in Computer Science.
[G. Labinaz, 1996] G. Labinaz, M.M. Bayoumi, K. R. (1996). Modeling and control of hybrid systems:
A survey. Proc. of the 13th Triennal World Congress, San Francisco, USA.
[Henzinger, 1996] Henzinger, T. (1996). The theory of hybrid automata. Proc. 11th Annual IEEESymposium on Logic in Computer Science (LICS 96), pages 278–292.
[J. Keppens, 2001] J. Keppens, Q. S. (2001). On compositional modeling. The Knowledge Engineering
Review.
[K. Romer, 2002] K. Romer, O. Kasten, F. (2002). Middleware challenges for wireless sensor networks.
ACM SIGMOBILE Mobile Computing and Communications Review.
[KK. Andersen, 2000] KK. Andersen, H. Madsen, L. H. (2000). Modelling the heat dynamics of a
building using stochastic differential equations. Energy & Buildings, Elsevier.
[L. Gomes, 2007] L. Gomes, A. Costa, J. B. R. P. T. R. R. F. (2007). Petri net based building automation
and monitoring system. Industrial Informatics, 2007 5th IEEE International Conference, 1:57–62.
[M. Hadjiski, 2007] M. Hadjiski, V. Sgurev, V. B. (2007). Hvac control via hybrid intelligent systems.
CYBERNETICS AND INFORMATION TECHNOLOGIES.
[P.E. Miyagi, 2002] P.E. Miyagi, E. Villani, G. G. N. M. (2002). Petri net approach for modelling system
integration in intelligent buildings. Journal of the Brazilian Society of Mechanical Sciences.
[Y. Hur, 2002] Y. Hur, I. L. (2002). Distributed simulation of multi-agent hybrid systems. IEEE Inter-national Symposium on Object-Oriented Realtime distributed Computing (ISORC).
199
Beyond Home Automation: Designing More Effective Smart Home Systems
Paolo Carner Dublin Institute of Technology,
ABSTRACT
This paper outlines a Smart Home Proof-of-Concept system that uses a Bayesian Network to predict the likelihood of a monitored event to occur. Firstly, this paper will provide an introduction to the concept of a smart home system; then it will outline how Artificial Intelligence concepts can be used to make such systems more effective. Finally, it will detail the implementation of a smart home system, which uses an inference engine to determine the likelihood of a fire. The system prototype has implemented using a LonWorks™ hardware kit and a Netica™ Bayesian Network engine from Norsys.
Keywords: Smart Home, Home Automation, Bayesian Networks, AI.
1. Introduction to Smart Homes A common definition of “Smart Home” is of an “electronic networking technology to integrate devices and appliances so that the entire home can be monitored and controlled centrally as a single machine” [1]. Another term that describe the same technology is “domotics”, which derives from the Latin word domus, meaning home, and informatics, meaning the study of the processes involved in the collection, categorization, and distribution of data.
A Smart Home system requires the following elements to be present: an intelligent control to gather information and impart instructions, one or more home automation devices to be controlled, and an internal communication network that allows the exchange of messages among the control system and the devices. Furthermore today, increasingly more Smart Home systems connect to external resources and network via Internet.
The intelligent control is usually provided by a form of control system, usually implemented with a combination of hardware and software. This control system constantly receives information about the environment via sensors located within or in close proximity to the house, which can report information such as temperature, humidity, luminance (luminous intensity), temperature, motion, etc. A Smart Home control system operates the connected devices (e.g. appliances) either directly or via actuators and influence the environment in order to maintain settings within a certain range (e.g. temperature or humidity) or to carry out immediate or scheduled user’s commands (e.g. activate the intrusion detection system).
The home network will provide a shared communication medium and network protocol for commands and information to be exchanged between the devices and the control system and can use any of the following communication media: Powerline, Busline or Wireless. Powerline systems use the existing electrical lines to transmit the signal, Busline require new cabling (usually twisted pair) to be installed throughout the house, and Wireless take advantage of newer technologies, such as infrared, Wi-Fi, Bluetooth, etc. Communication bridges are available to allow smart home systems to utilize more than one medium or protocol when required.
Modern technology is changing the home by providing an increasingly larger number of appliances that come with embedded computing capabilities. Table 1 provides some examples of areas where Smart Home technologies can be utilized today. Smart Homes of the future will be able to integrate all heating, air conditioning, lighting, home entertainment, and security systems together and, though safety, security, and centralized control are currently the most appealing to
200
users, the result of such integration will open new possibilities and the creation of additional services that do not currently exist [2].
Table 1: Areas of application for Smart Home technologies
AREA EXAMPLES
Welfare Remote diagnosis and monitoring of in-house patients
Entertainment Movies on demand; music download; live shows
Environment Remote control of lighting, heating, air conditioning systems; remote monitoring of energy usage and optimization of resources via implementation of energy saving schemes
Safety Immediate/remote alert of problems e.g. gas leaks, fire, water leak, CO2, etc.
Communication Phone, video conferences, calendar reminders, communication inside and outside the house
Self-diagnosis, requests of assistance and automated operations (e.g. food ordering)
2. Smart Homes and Artificial Intelligence Few of today’s off-the-shelf Smart Home solutions will go much beyond providing basic home automation tasks, such as turning a controlled device on or off [3]. However, it is believed that an effective Smart Home system not only should it carry out automated actions on behalf of the user, but be asked to interpret, understand, and, if possible, anticipate the actions required to complete the user’s end goal. Furthermore, an effective Smart Home will need to be able to adapt to a continuously changing environment and cater for several different users at the same time. Due to this, designing a Smart Home system that is powerful, capable of making complex decisions, yet still be intuitive to be used by the average household user is an on-going challenge for designers and developers.
Artificial Intelligence (AI) can provide such systems with reasoning tools that facilitate decision-making in event-condition-action scenarios with uncertain or incomplete knowledge [4] that may be required in the areas reported in Table 1.
Bayesian Networks (BN), also known as belief networks, knowledge maps or probabilistic causal networks [5], provide a method of reasoning using probabilities that have already been applied successfully to problems in medical diagnosis with satisfactory results. Promedas is just one example of an off-the-shelf medical software that employs Bayesian Networks to determine a diagnosis [6].
BN can be effectively employed in a Smart Home system to detect potentially dangerous situations; when fed with the information available at the time provided by the Smart Home sensors, they can return the probability for an event to occur. The control center of a Smart Home can then be programmed to take appropriate actions, such as triggering an alarm or sending a notification should a pre-determined threshold be reached, or a sequence of events unfold according to a predetermined progression.
3. Proof-of-Concept System The Proof-of-Concept system (POC) illustrated in this section will demonstrate the integration of a Bayesian Network model into a Temperature Control (TC) system, which could be implemented in a Smart Home. The system will simulate the following real-world devices:
201
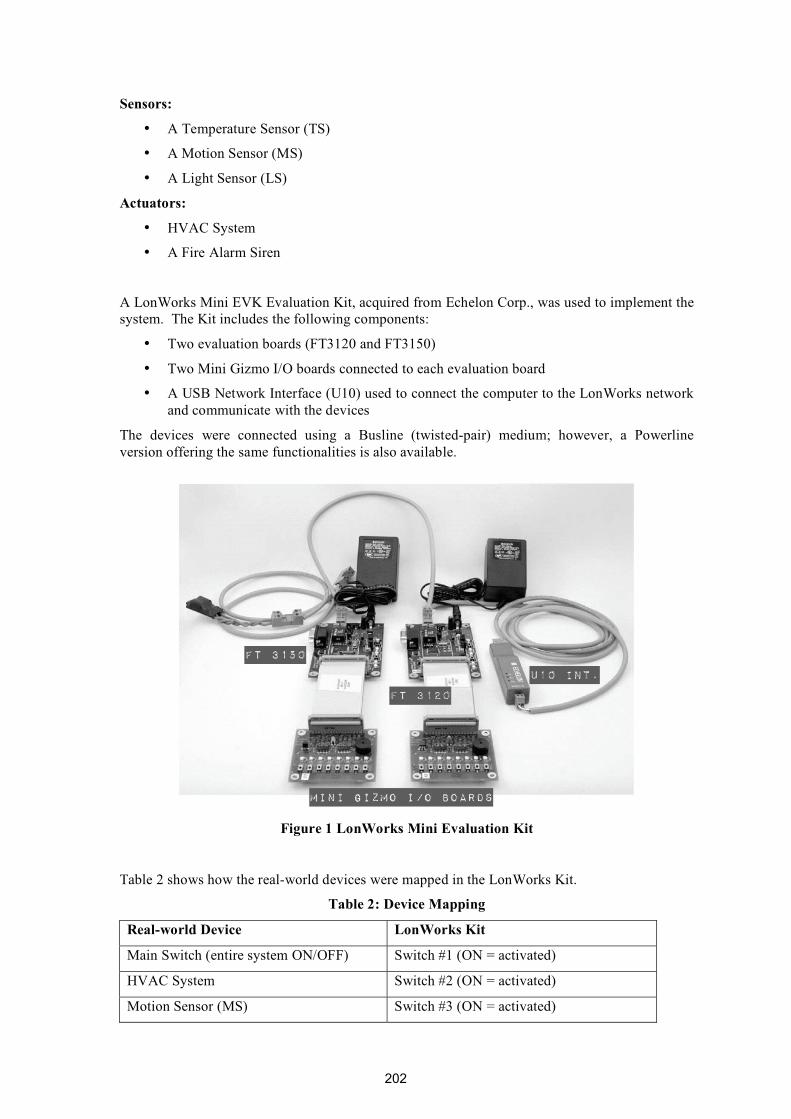
Sensors:
• A Temperature Sensor (TS)
• A Motion Sensor (MS)
• A Light Sensor (LS)
Actuators:
• HVAC System
• A Fire Alarm Siren
A LonWorks Mini EVK Evaluation Kit, acquired from Echelon Corp., was used to implement the system. The Kit includes the following components:
• Two evaluation boards (FT3120 and FT3150)
• Two Mini Gizmo I/O boards connected to each evaluation board
• A USB Network Interface (U10) used to connect the computer to the LonWorks networkand communicate with the devices
The devices were connected using a Busline (twisted-pair) medium; however, a Powerlineversion offering the same functionalities is also available.
Figure 1 LonWorks Mini Evaluation Kit
Table 2 shows how the real-world devices were mapped in the LonWorks Kit.
Table 2: Device Mapping
Real-world Device LonWorks Kit
Main Switch (entire system ON/OFF) Switch #1 (ON = activated)
HVAC System Switch #2 (ON = activated)
Motion Sensor (MS) Switch #3 (ON = activated)
202
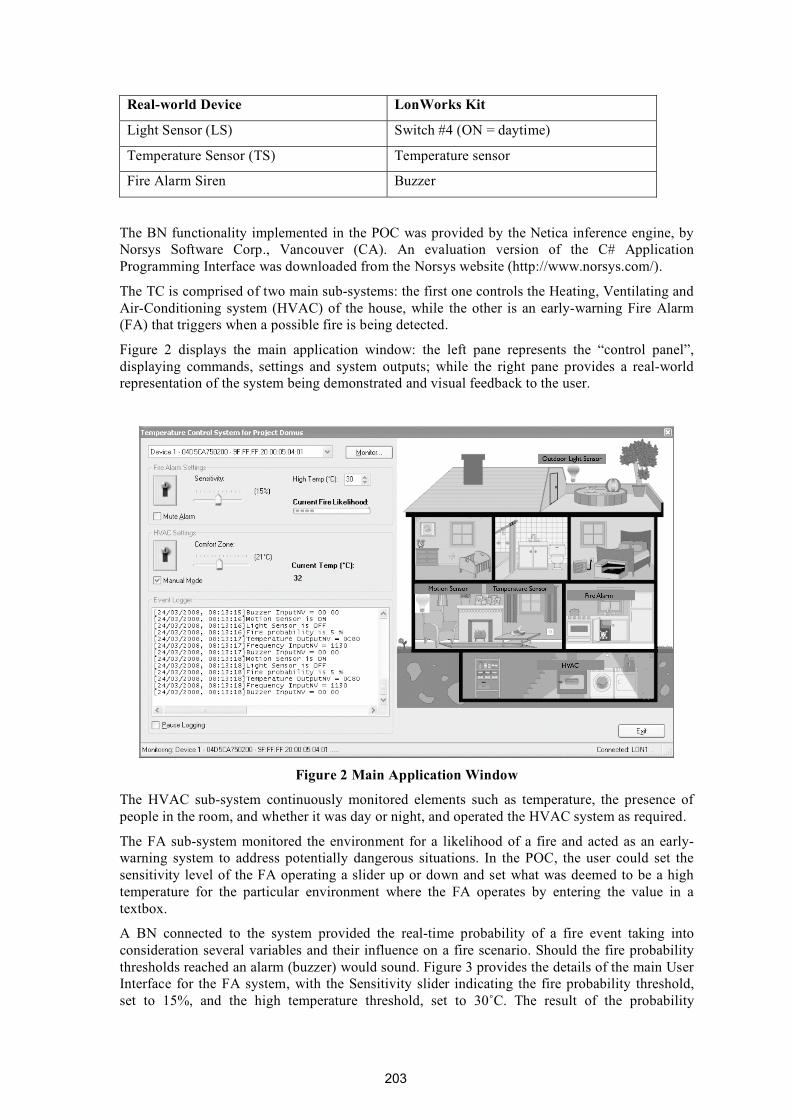
Real-world Device LonWorks Kit
Light Sensor (LS) Switch #4 (ON = daytime)
Temperature Sensor (TS) Temperature sensor
Fire Alarm Siren Buzzer
The BN functionality implemented in the POC was provided by the Netica inference engine, by Norsys Software Corp., Vancouver (CA). An evaluation version of the C# Application Programming Interface was downloaded from the Norsys website (http://www.norsys.com/).
The TC is comprised of two main sub-systems: the first one controls the Heating, Ventilating and Air-Conditioning system (HVAC) of the house, while the other is an early-warning Fire Alarm (FA) that triggers when a possible fire is being detected.
Figure 2 displays the main application window: the left pane represents the “control panel”, displaying commands, settings and system outputs; while the right pane provides a real-world representation of the system being demonstrated and visual feedback to the user.
Figure 2 Main Application Window
The HVAC sub-system continuously monitored elements such as temperature, the presence of people in the room, and whether it was day or night, and operated the HVAC system as required.
The FA sub-system monitored the environment for a likelihood of a fire and acted as an early-warning system to address potentially dangerous situations. In the POC, the user could set the sensitivity level of the FA operating a slider up or down and set what was deemed to be a high temperature for the particular environment where the FA operates by entering the value in a textbox.
A BN connected to the system provided the real-time probability of a fire event taking into consideration several variables and their influence on a fire scenario. Should the fire probability thresholds reached an alarm (buzzer) would sound. Figure 3 provides the details of the main User Interface for the FA system, with the Sensitivity slider indicating the fire probability threshold, set to 15%, and the high temperature threshold, set to 30˚C. The result of the probability
203
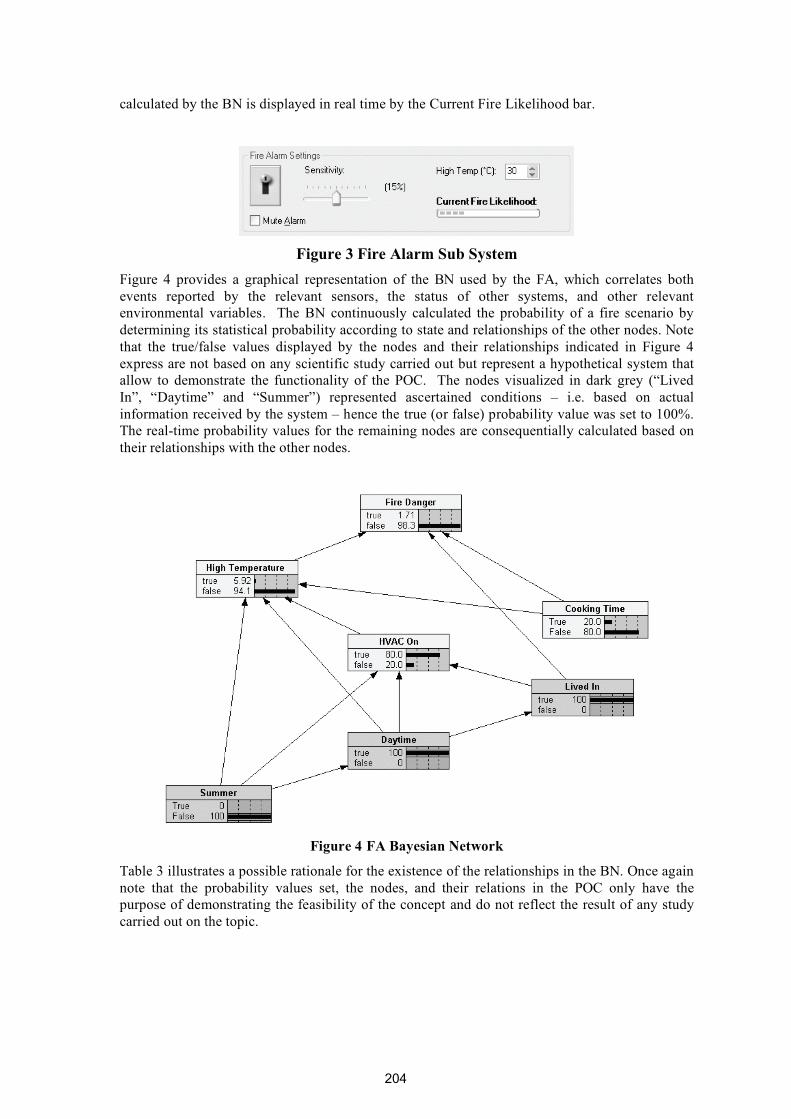
calculated by the BN is displayed in real time by the Current Fire Likelihood bar.
Figure 3 Fire Alarm Sub System Figure 4 provides a graphical representation of the BN used by the FA, which correlates bothevents reported by the relevant sensors, the status of other systems, and other relevantenvironmental variables. The BN continuously calculated the probability of a fire scenario bydetermining its statistical probability according to state and relationships of the other nodes. Notethat the true/false values displayed by the nodes and their relationships indicated in Figure 4express are not based on any scientific study carried out but represent a hypothetical system thatallow to demonstrate the functionality of the POC. The nodes visualized in dark grey (“LivedIn”, “Daytime” and “Summer”) represented ascertained conditions – i.e. based on actualinformation received by the system – hence the true (or false) probability value was set to 100%.The real-time probability values for the remaining nodes are consequentially calculated based ontheir relationships with the other nodes.
Figure 4 FA Bayesian Network
Table 3 illustrates a possible rationale for the existence of the relationships in the BN. Once againnote that the probability values set, the nodes, and their relations in the POC only have the purpose of demonstrating the feasibility of the concept and do not reflect the result of any studycarried out on the topic.
204

Table 3: Bayesian Network Details
Node (values) Relationship with Rationale
Fire Danger (true/false)
None (root node) Fire Danger is the outcome scenario sought by this BN.
Cooking Time (true/false)
• High Temperature
• Fire Danger
High Temperature: the temperature might raise above normal values while cooking.
Fire Danger: The risk of a fire is somewhat greater when cooking.
NOTE: Not implemented by the application. It could be gathered out of evidence such as the oven/cooker being switched on etc.
Daytime (true/false)
• HVAC
• High Temperature
• Lived In
HVAC: A longer day or shorter night will influence how the HVAC system will operate.
High Temperature: Longer summer days are likely warmer; longer winter nights are likely colder.
Lived In: The Motion Sensor is likely to be more often ON during the day (people moving around) than at night.
High Temperature (true/false)
• Fire Danger Causal connection between high temperature in the room and the likelihood of a fire.
HVAC On (true/false)
• High Temperature
It is less likely to have a high temperature when the air conditioning is on (so a high temperature developing in this circumstance might be more suspicious).
Lived In (true/false)
• HVAC On
• Fire Danger
HVAC On: This is a direct consequence of the HVAC logic, which is to turn on when the motion sensor is activated.
Fire Danger: Here an assumption was made that when there are people in the house there is a minor probability for fire to be developed.
Summer (true/false)
• High temperature
• Daytime
• HVAC
High Temperature: It is likely to be hotter in summer than winter.
Daytime: Days are shorter in winter than in summertime.
HVAC: Air conditioning might be turned on more often in summertime (and the heating system in winter time).
NOTE: Not implemented in the application. The information might be gathered from a calendar or by other type of evidence.
205
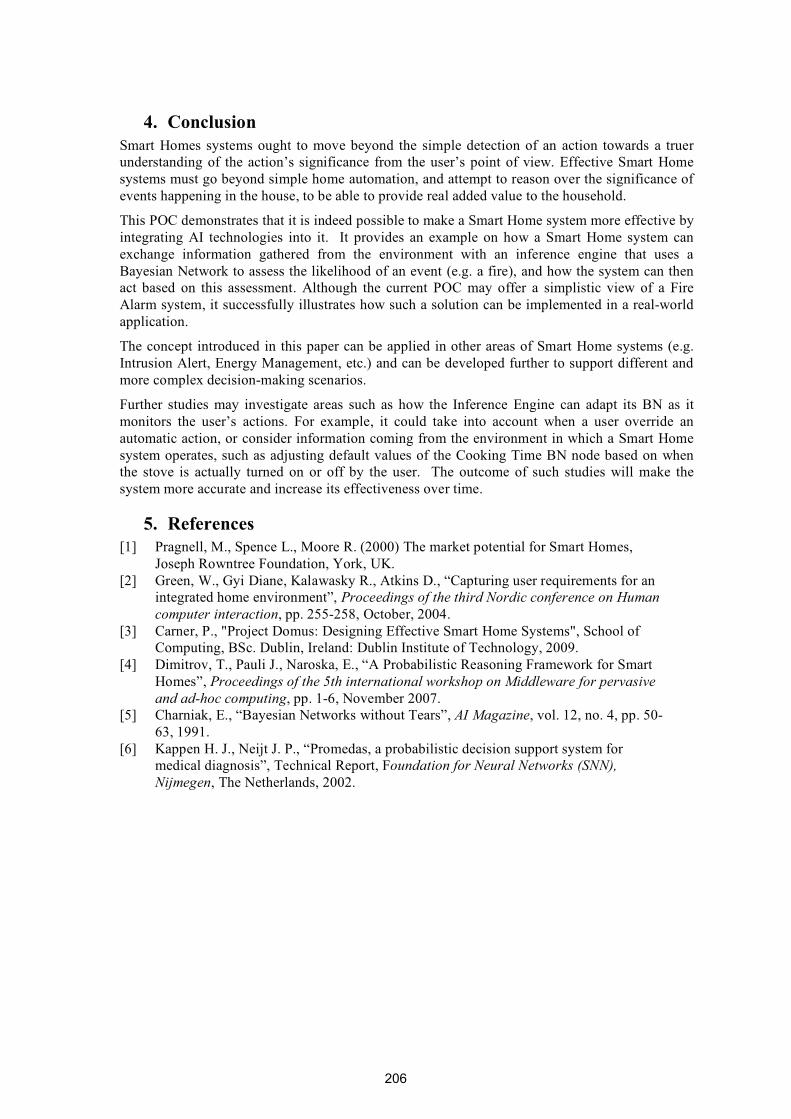
4. Conclusion Smart Homes systems ought to move beyond the simple detection of an action towards a truer understanding of the action’s significance from the user’s point of view. Effective Smart Home systems must go beyond simple home automation, and attempt to reason over the significance of events happening in the house, to be able to provide real added value to the household.
This POC demonstrates that it is indeed possible to make a Smart Home system more effective by integrating AI technologies into it. It provides an example on how a Smart Home system can exchange information gathered from the environment with an inference engine that uses a Bayesian Network to assess the likelihood of an event (e.g. a fire), and how the system can then act based on this assessment. Although the current POC may offer a simplistic view of a Fire Alarm system, it successfully illustrates how such a solution can be implemented in a real-world application.
The concept introduced in this paper can be applied in other areas of Smart Home systems (e.g. Intrusion Alert, Energy Management, etc.) and can be developed further to support different and more complex decision-making scenarios.
Further studies may investigate areas such as how the Inference Engine can adapt its BN as it monitors the user’s actions. For example, it could take into account when a user override an automatic action, or consider information coming from the environment in which a Smart Home system operates, such as adjusting default values of the Cooking Time BN node based on when the stove is actually turned on or off by the user. The outcome of such studies will make the system more accurate and increase its effectiveness over time.
5. References [1] Pragnell, M., Spence L., Moore R. (2000) The market potential for Smart Homes,
Joseph Rowntree Foundation, York, UK. [2] Green, W., Gyi Diane, Kalawasky R., Atkins D., “Capturing user requirements for an
integrated home environment”, Proceedings of the third Nordic conference on Human computer interaction, pp. 255-258, October, 2004.
[3] Carner, P., "Project Domus: Designing Effective Smart Home Systems", School of Computing, BSc. Dublin, Ireland: Dublin Institute of Technology, 2009.
[4] Dimitrov, T., Pauli J., Naroska, E., “A Probabilistic Reasoning Framework for Smart Homes”, Proceedings of the 5th international workshop on Middleware for pervasive and ad-hoc computing, pp. 1-6, November 2007.
[5] Charniak, E., “Bayesian Networks without Tears”, AI Magazine, vol. 12, no. 4, pp. 50- 63, 1991.
[6] Kappen H. J., Neijt J. P., “Promedas, a probabilistic decision support system for medical diagnosis”, Technical Report, Foundation for Neural Networks (SNN), Nijmegen, The Netherlands, 2002.
206

���
-�����'�)������4��������� ��������:.&;�4��<������
=���������"�������!�>����9/�3��������
(����� �+�����"�����(�� ��)�����������.���� ����)�� ����������� ����� ��&��K������ ���������
��
%��������
����9��$ �����:�SS$ 9S$ 90�:�9�9�0$ �S$ �$ ���$ �������$ U�$ �U0���S$ 8U�9��$ 0��9T�S�$ $ ��9��$ U��0UU�$:��9���9U:$��S$���:$�TT�SS9���$�:0$��U�0��$�S�0$�U�$SU8�$�98�$�����0�$�9��$���$����$U�$���-$9:0UU�$ �US9�9U:9:�$ ��S$ :U�$ ���$ 8�0�$ 9�$ 9:�U$ 8�9:S����8$ �9���$ ���$ �:0$ U����$ ����$ S�S��8S$U����$ �TT���T�$ U�$ �$ ST���$ 09�����:�$ �U$ ����$ ����9��0$ �U�$ ���9T9�:�$ 9:0UU�$ :��9���9U:�$ ��9S$��S���T�$�98S$�U$9:��S�9����$�U�$�$:�8���$U�$S�:SU�S$S�T�$�S$�$�9�9���$�U8��SS-$�����UU��$�:0$ TT����U8����$8��$��$TU8�9:�0$�U$T��T�����$0��9T�$�US9�9U:$�:0$U�9�:���9U:$�U$����U�8$09��T�9U:��$ �����9:�$ 9:$ �$ S���9��$ 0�����S��$ ���S�$ �����$ ��T�:U�U�9�S$ ����$ T�US�:$ ��T��S�$����$ ������$ 9:$ SU8�$ 8U�9��$ 0��9T�S$ ���9�����$ �U0��$ �:0$ ���$ �9����$ �U$ ��TU8�$ ���:$ 8U��$�90�S����0$9:$���$:����S�$�������$�
&������'�������������������������� ��������� ������������������������(� :.&;�4��<���.�������.��� D*R;� �����$� ���K���� ��� ������ ��� -����� )))� ��� ���� ��� � ��� ��� ������� �� ��� ��� �������������������������8���������������������/����D*R;����������� ������ �������������������� ������������������������������������������������������� �������������������������������������%������� � ���������� %�����$��� � ��� ���� ����� �� �������� �������� �������� �� ���� ����=���������������������E������� ������ �������������������������������� ������������������������������������ �����L��������������� ���������������������� ������������� ���������������������.������ �� ���G����8��8����H���������������������D*R;���������.���D*R;���������� ��� ��������������������������������������������8��������������������������������� ���������������������������=��������)�������������������������K����������� ������������������������=������ �������������� ��������&���������� ��������������� ��������� ����� ����� �����8����������������E ������ �� ������� � ��� ������ ����������8�����������������������������8G������ �����H�������������*� -������.�������.���&������� ���������������&������������������D*R;���������)�� ������������������������������������������������������������������������������=�����������������������������.����������������&������������������� ���������.���&��������������A�����������'���������������������������������&���������=�� �����������������������������=�������������������������������������������������������������D*R;���������!��������+��� ���������������������������������������0�������������������� �������� ���������������������������K���������������� ��-����� �T��������������������������� ���� ��������� ����������������������� �������������K������� ���������������� ������������� ��� ����.���� ������� ���� ���� J��� ).V.� ��������� �������0��� ���� ���&� ��������� ��� :��� )�������� �-�����������D2-�V�.� �"�����������597���
207
,� ������+�����.�������������������� ����������������������������������� ������ �������$���� ������������� ����������#'-����#D*3%--���������&������������ ������������� ���������������������� ������.�������=�����&��������������� �������������������������������������������������������������9>������������������������� 5@7��.��� �����=��%��������#'-� %8#'-$������� ��������� ������������G���H� �������� ��������� �� ����� ���������� ��� ��������� ����� ������ ���������� ��� ����� �� ���� �������������� ��������������$���������#'1-��"� ������������� ��������� ����������������������)����������������������������� ����������>B����ABB�������������������������������������������������������������������5A7����%��������������������������+%"����������������������������� �������������� ������� ���������� ��/���� ������� ������ ��� �� �� ���� �������� �������� ��� ���������� .���� �������� ��� ������ �� ����������������� �� ��� 3���0�� ��� -&����&� ��� ��� ����� �� � ������ ������ ����� ��� ������ �� #'-�5A67��.��������������������������������������� ����#'-���������� �������� ������������������#'-����������� ��� ������ ���� ��������� �� ����� ����������� ,������� ���� ���� ���� ��������� ��� ��� ������ ��������9B8@B������������������ ��������� �������� ������ �� ��� ������ ������ ���� ����� ����� �������� ������� ������� ��� � ������������ ����� ������ ����� � ���8����� ���������� .��� 2��� ��� .��� "���&��� ����� ���� � �������� ��������� ����������������������������������� �������������� ��������������������������������������5>:7�� )��������� ����2��� ����������� ����������� ������������������ ���������� ��� ���� ����8��8� ������������������������������������������������&�������������������������2��������������������������������������&������������������������������������������������ �� ���������������������� �� ������������������������������������������������������� �����������
5� 4��������� ��.�� � ��� -����� � T������� ���� ������� ���� ��� ��� ������ ����� ��� ���� ������� ��� ���� ����� ��� ��=��������������)����������� ����������������������������������� �������������������������� �������� ��L������ ������� ��������������������� �����C��������� �������� �������0�������������'������������ �������������������������� �� ��� ��������� ��������������������������$�����������������������������������W����� ��$������������������������������3����� ���$������������������ �������9$���.���������������������� ��������������������������� ���������������������������������������������� ������ ���� �� ��������� E�������� �� ���� ���������� ��=�� ��������� ���� U� �������� �� ��������0��� �� ��� ��������� ���� ���������������������$����� ���������������������������������������0�����������3������,������������� �������������������������� �������������������.���������X�������������������� ������������������������ ����������%� �����������������������&������������� ���� ��� ������� ����������� ����� �� �� � ������� � ����������� ��� ������ ����$� ����� ������������ �������������������� ����� ��������������������5<7��%�2 ���������������� ����� ������������������������������������������������������������*�������������� ����� ����������������������)�������������������� �������������� ������� ����� �������@$�����9����������������������������������������� ����������������������.��������������������������������
������������������������������������������� ������������������������������������������������������������������������@��-��� ������������2���!��������������������������� ����������������� �� ���������������-��� ��
����� ������� ����� ���� �� ������ ������ ���� ���� �� ���������� ��� ������� ��� ����� ���� ����� ���� ����������� ���������������������������������������������������
���A��%� ��� ������������������� �������� ����� �� ������������������� �� ������ ��� ����&���������������������������������������������������������������������������
208

���6��.��� ��� ����������������������>��'��� � ����2 ���������������
�������&�������=����������������������������������
�$���������
� ��8� ���������������.������� � ��� �� ����� � ������ � ������������������������=�� )(����������������)(��%��������������� �������� ����� ��.���������� ��������������&������������������?� ��������$����� ��%����������������������������������������������������������.���������/���� ������������������� �U���������������������������������������������������������������� ����������������������)�������������K�������������������� ���������������������� ������ �������������� ���������������@� 3������+�����"����� ��� ������D*R;����� �.���� ���� �� ��� ��� ���� ���� �����������������������.������� �������&��� ���� ����� ���������� �����.���&������� ������� ��������� ���� ���� ����� �� ���� ����� ��&����������������������������������;� 3������������.���������������������������&������� ���������������������
��������������������������� ��������������������������� ������������ ����&������������������)����������� ����������������� �������� ������������
���������� ����������������������
��
��������� �������� �� ��������2 ���������.���������0������������������������������������ ����������������������K����� ��������&���������������
���� ��K������� � ������ �������� ��������� ������������������������������$����
���������������������������������������� ������.������ �� �����������������������������������������������������������������������������������������������������������������K������������� �������������������� ����������� ������ �������������)������K������������������������ ���
����� ��������������������8������ ������������ ��������������� ���8������ ��������������� ������������������������������������A(�5;7��
�������� �������������������������G/�0�������*�������� �������� ��� ���� ������� ��� ���� ��������� ������� ��������������������������������������� �������� �����������L�������&�� ��� ����������������� ��� ��������������������������������
��� �������� ��� ����� ������ ����������� ����� ���������5J7��
&�������������� �������������������������2 ������������-����������������������������������
�������������������������������������&�������
� � ��� �� ����� �� ������������������ �����$��� ������������������������ �����������
����������������K�������������������������
������� ���������������������*��������������� ��� ���������&����������� ���������
�����A(��������.��������������� ������ ����
*0H������������������ ��� �� �0�� ����=��
������������������������� )� �������� ��� ����������� ����������� ��� ������ %� ����� ���
������������������������������������
209
�������������������������������������� �� ��������������������������������*��������������������������������������)������������������ ��� ���������������������������"�������������������������� ���� ������� ������� � ����������A(���������� ����������A� ������� ������.��� ������������� ��� ���&� ����,.���� ����� � -������ 1���������������������&�������������������������
$$$$$$$$$$
���������� �
���������597� �� ��&��4��"����� �S�
E����������+��� ��(�����V�.� �"�����������3����
5@7� +��������+��R������1�� ����������� �8���H��
5A7� 3���0��.������ �'���������CLL�������0�����L3
567� -&����&���%������������CL5>7� .���2���E ��������D������
����CLL����� ���������&L��5:7� "���&����@�E����+��� �@B5<7� R� ��0��K�R��,K� ��S��D5;7� /� �����%��2������-��+
� ��������H�S���� ����#��5J7� -��Y����3��R� �����S��+
2�������������H�����������
������������������������������������������������ �� ��� �� ��������� ��������&��������� ���������������������������������� ����������������������������������������������������������������
��������������������������� �������������������������������������������� ������������������������ ��� �������� ���� ��������� ������ �� ����
,������ !��������%��������� ,!%$� �� )�� ��� �-����� )))C� "���� 1�������� -�������� !�����
���(�� ��)�����������.���� ����������D�&;���
��������������� �������������� !"#���$����%��
��G,������)�����'������������(�������� �T���H���� ����������������������:���)�������� �-����ER�@BBJ�1��R ����,��G��� ������ ���#'-�%�������������
@BB<��3���0�Q����Q���Q��Q�� Q�����Q������������LL�����&����&���� �������L������L���-������/���������������L���L����������L���L�BB>������CLL����&������� ��������L�@�������D��� �'���������-�������.�� ���V��������#���+�� ���R��-��� ���'��G%��������������������1��������.�� ��%�R�'����������6J8>6�@BB>�
+���3�����2��G%�+��� ��+� ������ �(�� �����-���� ���������).V.�@BBJ������������
����=������������ ��� ������D�&;������� ���������������������
��� ���������� ��������������������������������������������� ��������� ���������� ����
��� ��������� �� ���������� '��������� ������K�����
����
����������-�����������D2-�
���������0������C�.���
���
���@BB:�����82��������������
-����������D�������
210
Intelligent Virtual Agent: Creating a Multi-Modal 3D Avatar Interface
Mark Dunne, Brian Mac Namee and John Kelleher
DIT AI Group, Dublin Institute of Technology, Dublin, Ireland [email protected]
Abstract
Human-computer interactions can be greatly enhanced by the use of 3D avatars, representing both human users and computer systems in 3D virtual spaces. This allows the human user to interface with the computer system in a natural and intuitive human-to-human dialog (human face-to-face conversation). Hence, continuing to blur the boundaries between the real and virtual worlds. This proposed avatar system will go a step further and will use a camera to track the user’s head and eye movements during the dialog. This information will help to build rapport between the user and computer system by registering the user’s emotional state and level of interest. The system will adjust the dialog according to this information paying special attention to the user’s feedback. For example, one obvious benefit for head and eye tracking will be to allow the avatar to make and keep realistic eye contact with the user, but there is lots of room to expand on these techniques in this research.
Keywords: Avatar, IVA, Interface. 1 Introduction to the LOK8 and Avatar Module 1.1 LOK8
The goal of the LOK8 (pronounced locate) project is to create a new and innovative approach to human-computer interactions. With LOK8 a person will be able to engage in meaningful interaction with a computer interface in a much more natural and intuitive way than we are used to. A virtual character will be displayed in numerous locations depending on the user’s position and context. Users will be able to communicate with this virtual character through speech and gestural input/output, which will be processed and controlled by the dialog management component of the system. This will allow “face-to-face” interactions with the LOK8 system. The LOK8 system will deliver content to the user in a variety of context-specific ways with the aim of tailoring content to suit the user’s needs. In addition to screens and projectors displaying the avatar, the user’s mobile device, as well as speakers within the environment, will be used to deliver focus-independent content. Ultimately the goal is to replace a human-computer interface with a human-virtual human interface. (See Figure 1) 1.2 Avatar Module The use of avatars as visual computer interfaces is long been established and the Avatar Module will continue researching in this area. Done well, they contribute to human-computer interactions. Done badly, the interaction becomes tedious, leading the user to switch them off, for example, the infamous Microsoft Clippy [1]. Avatars should be used to enrich the user’s experience, not frustrate it. The interaction style should be intuitive and natural, contributing to the overall immersive experience. Computer game technology has been wide spread over the past decade, so people are familiar with avatars. In games, avatars tend to be user-controlled, embodying the user in a virtual world. Also being
211
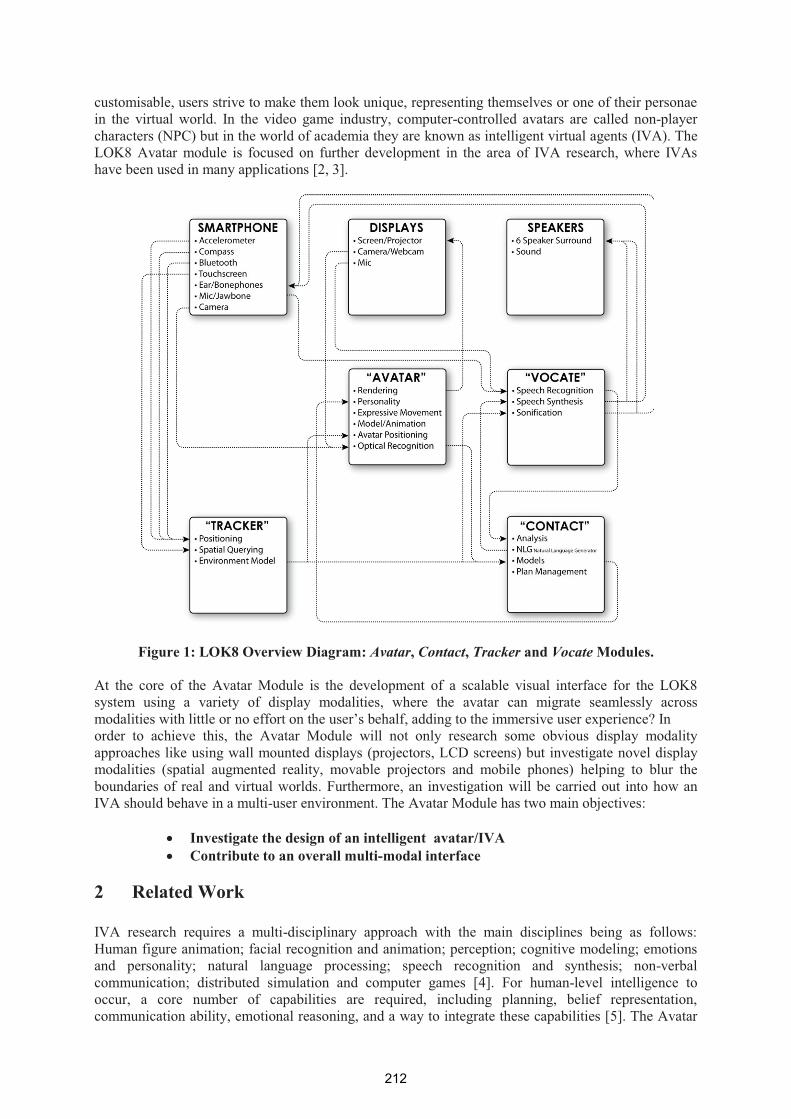
customisable, users strive to make them look unique, representing themselves or one of their personae in the virtual world. In the video game industry, computer-controlled avatars are called non-player characters (NPC) but in the world of academia they are known as intelligent virtual agents (IVA). The LOK8 Avatar module is focused on further development in the area of IVA research, where IVAs have been used in many applications [2, 3].
Figure 1: LOK8 Overview Diagram: Avatar, Contact, Tracker and Vocate Modules.
At the core of the Avatar Module is the development of a scalable visual interface for the LOK8 system using a variety of display modalities, where the avatar can migrate seamlessly across modalities with little or no effort on the user’s behalf, adding to the immersive user experience? In order to achieve this, the Avatar Module will not only research some obvious display modality approaches like using wall mounted displays (projectors, LCD screens) but investigate novel display modalities (spatial augmented reality, movable projectors and mobile phones) helping to blur the boundaries of real and virtual worlds. Furthermore, an investigation will be carried out into how an IVA should behave in a multi-user environment. The Avatar Module has two main objectives:
� Investigate the design of an intelligent avatar/IVA � Contribute to an overall multi-modal interface
2 Related Work IVA research requires a multi-disciplinary approach with the main disciplines being as follows: Human figure animation; facial recognition and animation; perception; cognitive modeling; emotions and personality; natural language processing; speech recognition and synthesis; non-verbal communication; distributed simulation and computer games [4]. For human-level intelligence to occur, a core number of capabilities are required, including planning, belief representation, communication ability, emotional reasoning, and a way to integrate these capabilities [5]. The Avatar
212
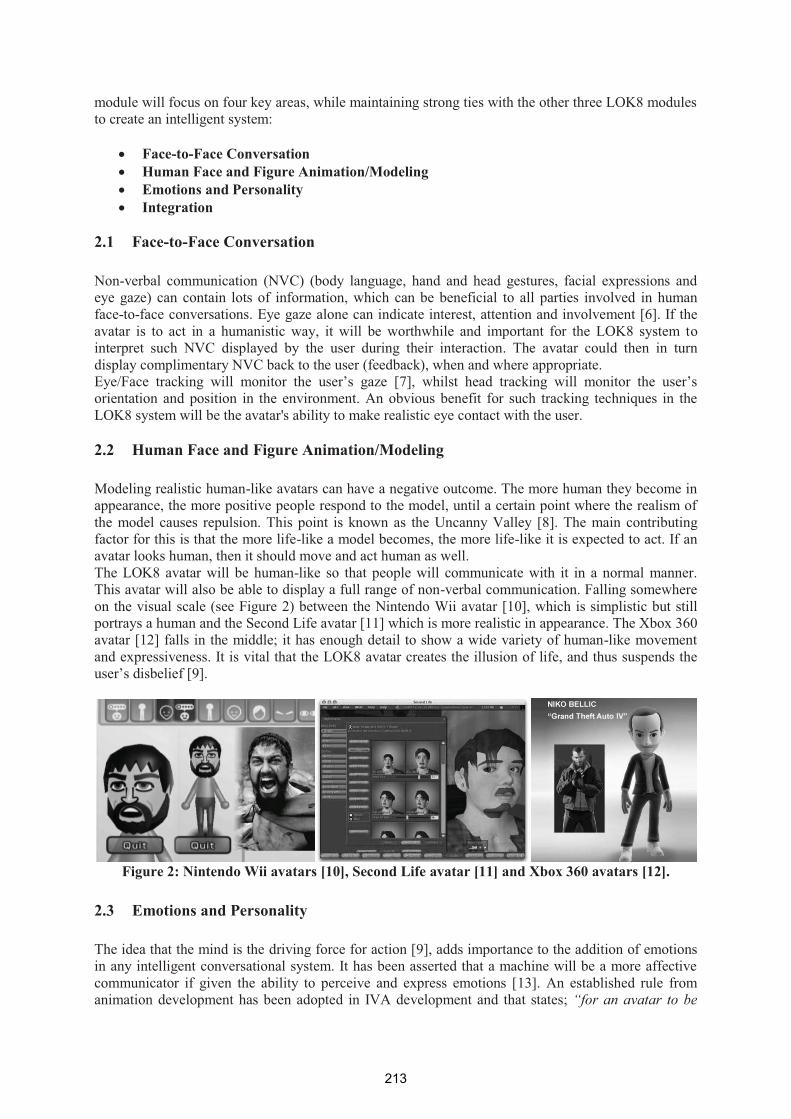
module will focus on four key areas, while maintaining strong ties with the other three LOK8 modules to create an intelligent system:
� Face-to-Face Conversation � Human Face and Figure Animation/Modeling � Emotions and Personality � Integration
2.1 Face-to-Face Conversation Non-verbal communication (NVC) (body language, hand and head gestures, facial expressions and eye gaze) can contain lots of information, which can be beneficial to all parties involved in human face-to-face conversations. Eye gaze alone can indicate interest, attention and involvement [6]. If the avatar is to act in a humanistic way, it will be worthwhile and important for the LOK8 system to interpret such NVC displayed by the user during their interaction. The avatar could then in turn display complimentary NVC back to the user (feedback), when and where appropriate. Eye/Face tracking will monitor the user’s gaze [7], whilst head tracking will monitor the user’s orientation and position in the environment. An obvious benefit for such tracking techniques in the LOK8 system will be the avatar's ability to make realistic eye contact with the user. 2.2 Human Face and Figure Animation/Modeling Modeling realistic human-like avatars can have a negative outcome. The more human they become in appearance, the more positive people respond to the model, until a certain point where the realism of the model causes repulsion. This point is known as the Uncanny Valley [8]. The main contributing factor for this is that the more life-like a model becomes, the more life-like it is expected to act. If an avatar looks human, then it should move and act human as well. The LOK8 avatar will be human-like so that people will communicate with it in a normal manner. This avatar will also be able to display a full range of non-verbal communication. Falling somewhere on the visual scale (see Figure 2) between the Nintendo Wii avatar [10], which is simplistic but still portrays a human and the Second Life avatar [11] which is more realistic in appearance. The Xbox 360 avatar [12] falls in the middle; it has enough detail to show a wide variety of human-like movement and expressiveness. It is vital that the LOK8 avatar creates the illusion of life, and thus suspends the user’s disbelief [9].
Figure 2: Nintendo Wii avatars [10], Second Life avatar [11] and Xbox 360 avatars [12].
2.3 Emotions and Personality The idea that the mind is the driving force for action [9], adds importance to the addition of emotions in any intelligent conversational system. It has been asserted that a machine will be a more affective communicator if given the ability to perceive and express emotions [13]. An established rule from animation development has been adopted in IVA development and that states; “for an avatar to be
213
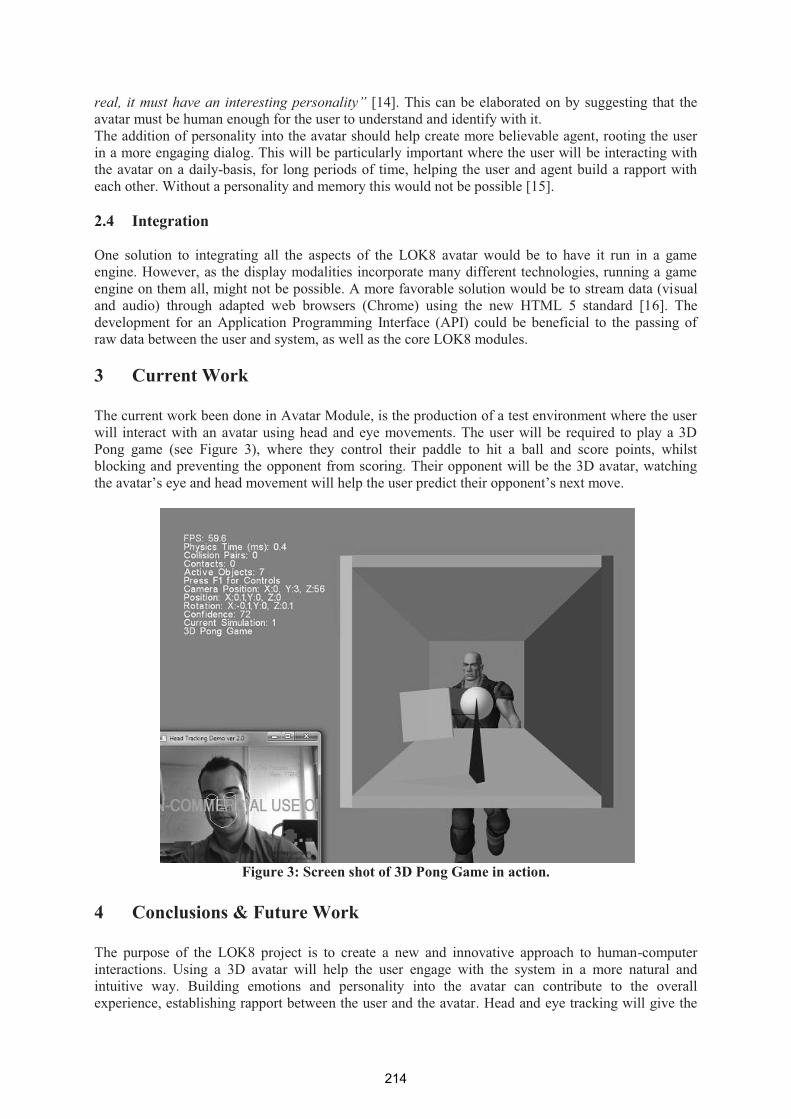
real, it must have an interesting personality” [14]. This can be elaborated on by suggesting that the avatar must be human enough for the user to understand and identify with it. The addition of personality into the avatar should help create more believable agent, rooting the user in a more engaging dialog. This will be particularly important where the user will be interacting with the avatar on a daily-basis, for long periods of time, helping the user and agent build a rapport with each other. Without a personality and memory this would not be possible [15]. 2.4 Integration One solution to integrating all the aspects of the LOK8 avatar would be to have it run in a game engine. However, as the display modalities incorporate many different technologies, running a game engine on them all, might not be possible. A more favorable solution would be to stream data (visual and audio) through adapted web browsers (Chrome) using the new HTML 5 standard [16]. The development for an Application Programming Interface (API) could be beneficial to the passing of raw data between the user and system, as well as the core LOK8 modules. 3 Current Work The current work been done in Avatar Module, is the production of a test environment where the user will interact with an avatar using head and eye movements. The user will be required to play a 3D Pong game (see Figure 3), where they control their paddle to hit a ball and score points, whilst blocking and preventing the opponent from scoring. Their opponent will be the 3D avatar, watching the avatar’s eye and head movement will help the user predict their opponent’s next move.
Figure 3: Screen shot of 3D Pong Game in action.
4 Conclusions & Future Work The purpose of the LOK8 project is to create a new and innovative approach to human-computer interactions. Using a 3D avatar will help the user engage with the system in a more natural and intuitive way. Building emotions and personality into the avatar can contribute to the overall experience, establishing rapport between the user and the avatar. Head and eye tracking will give the
214
effect of realistic eye contact between avatar and user, immersing the user even more into the interactive experience. The main focus of the Avatar Module will be developing a scalable visual interface for the LOK8 system on variety of display modalities, many of which are novel. A key feature being the seamless migration of the avatar across these display modalities, i.e., the avatar will migrate from the user’s mobile device to a large wall mounted display and then maybe to a mobile robotic platform. Integrating all of the findings and solutions into the LOK8 test environment will be the key stone of the LOK8 project (Avatar, Contact, Tracker and Vocate Modules). Future work for the Avatar Module will entail gathering data from the 3D Pong game, which will help in the analysis of this novel interaction style with an avatar discussed above. The ability to adjust the gameplay, game logic and enforce a set of rules will help to create a control experiment and multiple combinations of head and eye, or head only and eye only movement experiments. Test subjects will be required to play a series of these experiments and rate their experiences using a survey/questionnaire. Acknowledgements: This work is funded by the Higher Education Authority (HEA) in Ireland, Technological Sector Research Strand III: Core Research Strengths Enhancement Programme. References [1] USA Today. "Microsoft banks on anti-Clippy sentiment". The Associated Press, 2/6/2002.
http://www.usatoday.com/tech/news/2001-05-03-clippy-campaign.htm, 29/7/09 [2] Lim, Mei Yii, and Ruth Aylett. "Feel the Difference: A Guide with Attitude." Intelligent Virtual
Agents - 7th International Conference, IVA 2007. Paris, France, September 2007: Springer, 2007. 317-330.
[3] Hung-Hsuan Huang, Aleksandra Cerekovic, Igor S. Pandzic, Yukiko Nakano and Toyoaki Nishida. “Toward a multi-culture adaptive virtual tour guide agent with a modular approach.” AI & Society, June 2009, Springer, London.
[4] Gratch, Jonathan, Jeff Rickel, Elisabeth André, Justine Cassell, Eric Petajan, and Norman Badler. "Creating Interactive Virtual, Humans: Some Assembly, Required." IEEE Intelligent Systems. 2002.
[5] Swartout, William, et al. "Toward Virtual Humans." AI Magazine - Volume 27 , Issue 2, 2006: 96-108.
[6] Knapp, Mark L., & Hall, Judith A. (2007) "Nonverbal Communication in Human Interaction. (5th ed.)" Wadsworth: Thomas Learning. ISBN 0-15-506372-3
[7] Eicher, Tobias, Helmut Prendinger, Elisabeth Andre, and Mitsuru Ishizuku. "Attentive Presentation Agents." Intelligent Virtual Agents - 7th International Conference, IVA 2007. Paris, France, September 2007: Springer, 2007. 283-295.
[8] Mori, Masahiro. "The Uncanny Valley." Energy, 7(4), 1970: 33-35. [9] Martinho, Carlos, and Ana Paiva. "It's All in Anticipation." Intelligent Virtual Agents - 7th
International Conference, IVA 2007. Paris, France, September 2007: Springer, 2007. 331-338. [10] Nintendo Wii Avatars called “Miis”, 10/08/2009, http://www.crunchgear.com/wp- content/pbucket/450-300- scale-117364755138.jpg. [11] Customisation of a Second Life Avatar, 10/08/2009, http://i.gleeson.us/gb/0607/2nd_life/Avatar_creation.jpg. [12] Microsoft's Xbox 360 Avatars, 10/08/2009, http://scrawlfx.com/wp- content/uploads/2008/11/niko- Avatar-360.jpg. [13] Picard, R. W. "Affective Computing." MIT Press, Cambridge, 1997. [14] Thomas, Frank, and Ollie Johnston. Disney Animation: The Illusion of Life. New York:
Abbeville Press, 1981. [15] Ho, Wan Ching, and Kerstin Dautenhahn. "Towards a Narrative Mind: The Creation of
Coherent Life Stories for Believable Virtual Agents." Intelligent Virtual Agents 8th International Conference, IVA 2008. Tokyo, Japan, September 2008: Springer, 2008. 59-72.
[16] HTML 5 - "A vocabulary and associated APIs for HTML and XHTML". Editor's Draft 29 July 2009. Latest Published Version: http://www.w3.org/TR/html5/
215
Keywords: Location-based Services, Auditory Interfaces, Auditory User Interfaces, Speech Interfaces, Sonification
Abstract
The auditory modality has a number of unique advantages over other modalities, such as a fast neural processing rate and focus-independence. As part of the LOK8 project’s aim to develop location-based services, the Vocate module will be seeking to exploit these advantages to augment the overall usability of the LOK8 interface and also to deliver scalable content in scenarios where the user may be in transit or requires focus-independence. This paper discusses these advantages and outlines three possible approaches that the Vocate module may take within the LOK8 project: speech interfaces, auditory user interfaces, and sonification.
John McGee, Dr. Charlie Cullen
Digital Media Centre, Dublin Institute of TechnolgyAungier St., Dublin 2, Ireland
[email protected], [email protected]
Vocate: Auditory Interfaces for the LOK8 Project
1 Introduction to LOK8
The goal of the LOK8 (pronounced locate) project is to create a new and innovative approach to human-computer interactions. With LOK8 a person will be able to engage in meaningful interaction with a computer interface in a much more natural and intuitive way than we are used to. A virtual character will be displayed in numerous locations depending on the user’s position and context. Users will be able to communicate with this virtual character through speech and gestural input/output, which will be processed and controlled by the dialog management component of the system. This will allow “face-to-face” interactions with the LOK8 system. The LOK8 system will deliver content to the user in a variety of context-specific ways with the aim of tailoring content to suit the user’s needs. In addition to screens and projectors displaying the avatar, the user’s mobile device, as well as speakers within the environment, will be used to deliver focus-independent content. Ultimately the goal is to replace a human-computer interface with a human-virtual human interface (see Figure 1).
2 The Vocate Module
The Vocate module will be in charge of the auditory aspect of the LOK8 environment and will be seeking to implement a number of features in this regard. As well as collaborating with the other LOK8 modules to develop realistic speech interaction with the LOK8 avatar, Vocate will be utilizing the contextual and spatial awareness of the user’s mobile device within the environment to deliver hands-free audio navigation and browsing systems, as well as a hands-free auditory version of the main LOK8 menu interface. Vocate will be looking at three key areas in the field of auditory interfaces in its approach to the LOK8 project: speech interfaces, auditory user interfaces, and sonification. Further discussion on the issues outlined here, from the point of view of physicality, can be found in [1].
216

2.1 Related Work
There is existing empirical evidence in relation to audio spatialisation that is of particular interest to the work of the Vocate module [2][3][4]. Previous experiments in the field of audio navigation would include the SWAN navigation system [4] and Stahl’s Roaring Navigator system [5], both of which make use of audio spatialisation to communicate information relating to a user’s environment. In terms of speech interfaces, some existing off-the-shelf products now promise much of the functionality required to implement many of Vocate’s aims for the LOK8 environment, such as Vlingo (available on Blackberry, iPhone, Nokia and Windows Mobile), Voice Control (Apple’s new speech interface system for the iPhone 3GS), and Google Mobile App (available on the iPhone).
SMARTPHONEccelerometerompass
T
a
“TRACKER”
“AVATAR”
yt
“VOCATE”
“CONTACT”
G r
t
SPEAKERSDISPLAYSrojector
c
Figure 1: Overview diagram of the LOK8 project.
3 Advantages of Auditory Interfaces Over Other Modalities
Auditory interfaces offer a number of advantages over other modalities when it comes to the delivery of certain types of information. Audio information is processed faster neurally than both haptic and visual information (2ms for audio compared with 10ms and 100ms for haptic and visual respectively [6]), it is also hands-free and largely focus-independent. When taking technology and bandwidth limitations into consideration audio also has the advantage of lower overheads in terms of processing and storage when compared with many visual information delivery systems. These kinds of qualities offer up audio as a particularly useful modality for the communication of anything that urgently needs to be brought to the user’s attention, anything that needs to be kept on the periphery of the user’s attention (and/or requires a certain level of focus-independence), or anything operating within any system that has to take processing limitations into account. The Vocate module aims to exploit the auditory modality’s unique strengths to both augment and enhance the overall realism and intuitiveness of the LOK8 system when it is at its most immersive (i.e., when the avatar is in use within the environment), and also to enable content delivery to be scalable (thus allowing the system to be user-friendly in situations where the user requires to be eyes/hands-free, when the user is in transit, or when screen size might be an issue).
217
4 Speech Interfaces
Speech interfaces make use of speech recognition and/or speech synthesis to communicate with a user, they offer the user the ability to interact with a system using natural language and as such can be incredibly effective. Speech signal processing can be applied in a variety of ways to analyse the speech input of a user and hence model an appropriate response from the system. Many modern systems acknowledge the fact that speech communication is not solely an auditory interaction and make use of multimodal input to create more natural, realistic speech interface systems. In conjunction with auditory analysis, optical recognition techniques are used to capture additional input, such as eye tracking, lip tracking, and gestural tracking, to assist in the modeling of the system’s responses. This multimodal approach can lead to the development of systems that exhibit attributes such as ‘active listening’ (a structured way of interacting whereby attention is focused on the speaker), ‘turn taking’ (the ability to know when to listen and when to interject in a conversation), and ‘synchrony’ (mirroring the intonation and/or body language of the user), thus leading to more natural human-computer interaction.
5 Auditory User Interfaces
Auditory user interfaces are defined as the use of sound to communicate information about the state of an application or computing device to a user [7]. They are less constricted than speech interfaces or sonification alone as they often leverage strengths from both of these fields. Although audio is serial in nature and lacks the ability to continuously display items of interest in the way that the visual modality can, it does still possess qualities that lend it to the design of auditory menu systems. The human auditory system has the ability to filter out salient information from multiple streams of audio, this is known as the ‘cocktail party effect’ [8]. This ability, combined with techniques such as skimming (the presentation of segments of an audio stream to give an indication of the entire stream) and audio spatialisation, could be employed to design a speech-based auditory menu system that also uses earcons (defined by Blattner et al. as non-verbal audio messages used in the user-computer interface to provide information to the user about some computer object, operation, or interaction [9]) and other auditory icons to reinforce metaphors and give enhanced feedback to the user.
6 Sonification
Sonification is defined as the use of non-speech audio to convey information [10]. One form of information that lends itself particularly well to sonification is spatial information; this is because spatial information is generally physical in nature rather than abstract. With the help of contextual and spatial awareness within an environment, the stereo spatialisation and volume/tempo modulation of an audio source signal can allow the sound designer to ‘place’ auditory information within the soundscape as if it were coming from an actual physical location relative to the user. This technique can be used to convey a number of things including target destination sounds (these can be used to guide a user through an environment), object sounds (these can be used to highlight an object when it becomes contextually relevant to the user), and surface transition sounds (these can be used to allow a user to know when they have moved from one specific area or surface to another. Studies have found that broad spectrum sounds, such as pink noise bursts, are easier to localise and have been found to encourage better performance in audio navigation. It has also been found that when using a beacon style navigation approach a moderate capture radius for each beacon is preferable to a very large or very small capture radius, e.g. greater than 9ft or only a few inches [3][4].
7 Current Work
All four LOK8 modules are currently collaborating to create a test environment in which to run Wizard of Oz experiments, the purpose being to gather data in relation to how users might react and respond to a prospective LOK8 interface. It is intended that this test environment will act as a first iteration
218
towards the final LOK8 environment. More detail regarding this Wizard of Oz environment can be found in [11]. Vocate will be looking specifically to test sonification techniques within a real-world 360° user environment. Although Vocate ultimately aims to provide audio navigation via headphones and/or bonephones, in the Wizard of Oz environment it will be using a six speaker array to run initial tests.
8 Conclusions
The LOK8 project seeks to develop location-based services across a variety of media within a user’s environment. The Vocate module will be looking to exploit the unique advantages afforded by the auditory modality to enhance the usability and user-friendliness of the LOK8 system when it is at its most immersive and also to enable content delivery to be scalable in scenarios where the user may need a certain level of focus-independence or hands-free mobility. Speech interfaces are highly effective for complex and detailed interactions because they allow for the use of natural language but they require a lot of back-end work. Several commercial products are now emerging that feature speech interfaces that promise a lot of the functionality that the Vocate module is seeking to implement within the LOK8 environment and, as such, may provide a solution should they stand up to testing within the overall LOK8 environment. Sonification is particularly useful when it comes to communicating physical information or anything that has a natural acoustic mapping, it can also often transcend many of the linguistic and cultural boundaries that speech interfaces normally face. Auditory user interfaces leverage strengths from both speech interfaces and sonification and may be of particular interest regarding the aims of the Vocate project. There is existing empirical information regarding usability thresholds for both the processing of multiple streams of audio and for audio spatialisation (for both speech and non-speech sounds), Vocate will seek to build on this work to test interface designs that utilise both speech and non-speech sounds to interact with a user.
Acknowledgements
This work is funded by the Higher Education Authority (HEA) in Ireland, Technological Sector Research Strand III: Core Research Strengths Enhancement Programme.
References
[1] McGee, J. and Cullen, C. (2009). Vocate: Auditory Interfaces for Location-based Services. In Proceedings of the Third International Workshop on Physicality (Cambridge, UK, 1 September, 2009). 25 - 29.
[2] Walker, B. N., Raymond, S. M., Nandini, I., Simpson, B. D., and Brungart, D. S. (2005). Evaluation of Bone-Conduction Headsets for use in Multitalker Communication Environments. In Proceedings of the Human Factors And Ergonomics Society 49th Annual Meeting (Orlando, Florida, September 26 - 30, 2005). Human Factors and Ergonomics Society. HFES’05. 1615 - 1619.
[3] Walker, B. N. and Lindsay, J. (2005). Navigation Performance in a Virtual Environment with Bonephones. In Proceedings of the 11th Meeting of the International Conference on Auditory Display (Limerick, Ireland, July 6 - 9, 2005). ICAD’05. 260 - 263.
[4] Walker, B. N. and Lindsay, J. (2006). Navigation Performance with a Virtual Auditory Display: Effects of Beacon Sound, Capture Radius, and Practice. Human Factors. 48, 2, (Summer 2006). Human Factors and Ergonomics Society. 265 - 278. 2005.
[5] Stahl, C. (2007). The Roaring Navigator: A Group Guide for the Zoo with Shared Auditory Landmark Display. In Proceedings of the 9th International Conference on Human Computer Interaction with Mobile Devices and Services (Singapore, September 9 - 12, 2007). Mobile HCI’07. ACM. 383 - 386.
[6] Kail, R. and Salthouse, T.A. (1994). Processing Speed as a Mental Capacity. Acta Psychologica. 86, 2 - 3 (June, 1994). 199 - 255.
219

[7] McGookin, D. (2004). Understanding and Improving the Identification of Concurrently Presented Earcons. PhD thesis, University of Glasgow. 155 - 159.
[8] Arons, B. (1992). A Review of the Cocktail Party Effect. Journal of the American Voice I/O Society.
[9] Blattner, M. M., Sumikawa, D. A., and Greenberg, R. M. (1989) Earcons and Icons: Their Structure and Common Design Principles. Human Computer Interaction, 4(1): 11 - 44.
[10] Kramer, G., Walker, B., Bonebright, T., Cook, P., Flowers, J., Miner, and Neuhoff, J. (1999). Sonification Report: Status of the Field and Research Agenda. Technical Report. ICAD, 1999.
[11] Schütte, N., Kelleher, J., and MacNamee B. (2009). A Mobile Multimodal Dialogue System for Location Based Services. Awaiting publication in proceedings for IT&T 2009.
220
A Mobile Multimodal Dialogue System for Location BasedServices
Niels Schutte, John Kelleher, Brian Mac Namee
DIT Dublin, Aungier Street, Dublin 6
[email protected], [email protected], [email protected]
Abstract
This paper describes ongoing work on the dialogue management components for LOK8, a multi-
modal dialogue system. We describe our plans for a basic architecture of the system, the rough
modules and outline the kinds of models in the project, as well as the next steps in our work.
Keywords: Dialogue Systems, Multimodal Interaction, Location Based Services
1 Introduction
The goal of the LOK8 project is to develop a mobile multimodal dialogue system that allows users to
access Location based Services (LBS) using a mobile device like an iPhone or a Google Android phone.
LBS may offer the user functionality such as supplying information about nearby objects, or giving
navigation help. We believe that such a system may benefit from having a natural language interface
since natural language allows intuitive interaction, and it also removes the need for graphical interfaces
which can be difficult to operate on a small mobile device. The use of pointing gestures as input and
output modalities will also compensate the difficulties of expressing spatial concepts in language. It has
been shown that spatial domains are especially well suited for multimodal interaction ([Oviatt, 1997]).
One possible example application scenario for the LOK8 system is a museum, where the users may
walk around with their device and point the device at exhibits to request descriptions from the system,
or ask specific questions. On the other hand the system may point out if the user is approach interesting
exhibits or give directions.
This paper describes the work that is planned for the dialogue aspects of the LOK8 system. We
describe the general architecture of the dialogue related parts of the system and the different components
and models in that architecture.
2 The system
The LOK8 system (figure 1) allows interaction in a number of modalities. The primary modality is
the use of spoken natural language. The user can engage in natural conversation with the system to
access a number of different LBS. On the other hand the system may, depending on its configuration,
take initiative and initiate conversation, for example by calling attention to points of interest the user is
passing or offering services that are available in the current context.
In conjunction with Global Localization the user will be able to use the mobile device to perform
gestures such as pointing towards objects in the environment or performing other certain gestures, such
as shaking the device as a refusing gesture.
The main output modality will again be natural language. We will employ an 3D animated virtual
agent as a primary point of interaction with the user i.e. the actions of the systems will primarily be
221
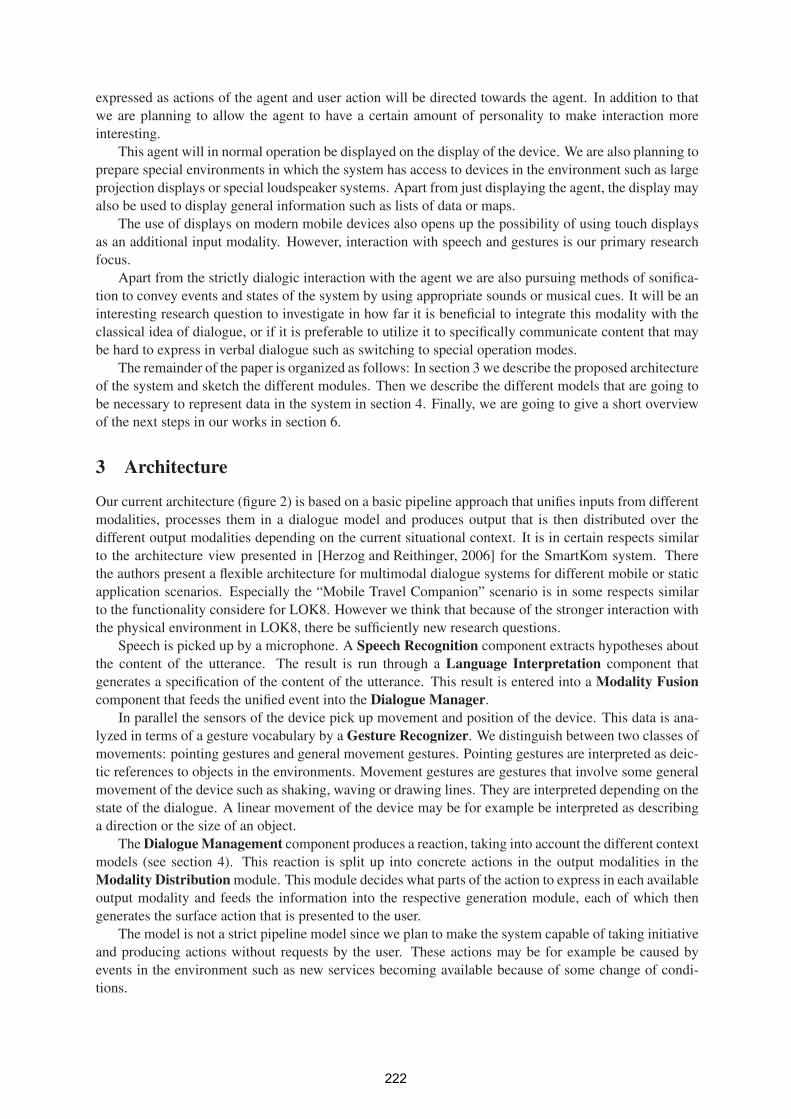
expressed as actions of the agent and user action will be directed towards the agent. In addition to that
we are planning to allow the agent to have a certain amount of personality to make interaction more
interesting.
This agent will in normal operation be displayed on the display of the device. We are also planning to
prepare special environments in which the system has access to devices in the environment such as large
projection displays or special loudspeaker systems. Apart from just displaying the agent, the display may
also be used to display general information such as lists of data or maps.
The use of displays on modern mobile devices also opens up the possibility of using touch displays
as an additional input modality. However, interaction with speech and gestures is our primary research
focus.
Apart from the strictly dialogic interaction with the agent we are also pursuing methods of sonifica-
tion to convey events and states of the system by using appropriate sounds or musical cues. It will be an
interesting research question to investigate in how far it is beneficial to integrate this modality with the
classical idea of dialogue, or if it is preferable to utilize it to specifically communicate content that may
be hard to express in verbal dialogue such as switching to special operation modes.
The remainder of the paper is organized as follows: In section 3 we describe the proposed architecture
of the system and sketch the different modules. Then we describe the different models that are going to
be necessary to represent data in the system in section 4. Finally, we are going to give a short overview
of the next steps in our works in section 6.
3 Architecture
Our current architecture (figure 2) is based on a basic pipeline approach that unifies inputs from different
modalities, processes them in a dialogue model and produces output that is then distributed over the
different output modalities depending on the current situational context. It is in certain respects similar
to the architecture view presented in [Herzog and Reithinger, 2006] for the SmartKom system. There
the authors present a flexible architecture for multimodal dialogue systems for different mobile or static
application scenarios. Especially the “Mobile Travel Companion” scenario is in some respects similar
to the functionality considere for LOK8. However we think that because of the stronger interaction with
the physical environment in LOK8, there be sufficiently new research questions.
Speech is picked up by a microphone. A Speech Recognition component extracts hypotheses about
the content of the utterance. The result is run through a Language Interpretation component that
generates a specification of the content of the utterance. This result is entered into a Modality Fusioncomponent that feeds the unified event into the Dialogue Manager.
In parallel the sensors of the device pick up movement and position of the device. This data is ana-
lyzed in terms of a gesture vocabulary by a Gesture Recognizer. We distinguish between two classes of
movements: pointing gestures and general movement gestures. Pointing gestures are interpreted as deic-
tic references to objects in the environments. Movement gestures are gestures that involve some general
movement of the device such as shaking, waving or drawing lines. They are interpreted depending on the
state of the dialogue. A linear movement of the device may be for example be interpreted as describing
a direction or the size of an object.
The Dialogue Management component produces a reaction, taking into account the different context
models (see section 4). This reaction is split up into concrete actions in the output modalities in the
Modality Distribution module. This module decides what parts of the action to express in each available
output modality and feeds the information into the respective generation module, each of which then
generates the surface action that is presented to the user.
The model is not a strict pipeline model since we plan to make the system capable of taking initiative
and producing actions without requests by the user. These actions may be for example be caused by
events in the environment such as new services becoming available because of some change of condi-
tions.
222
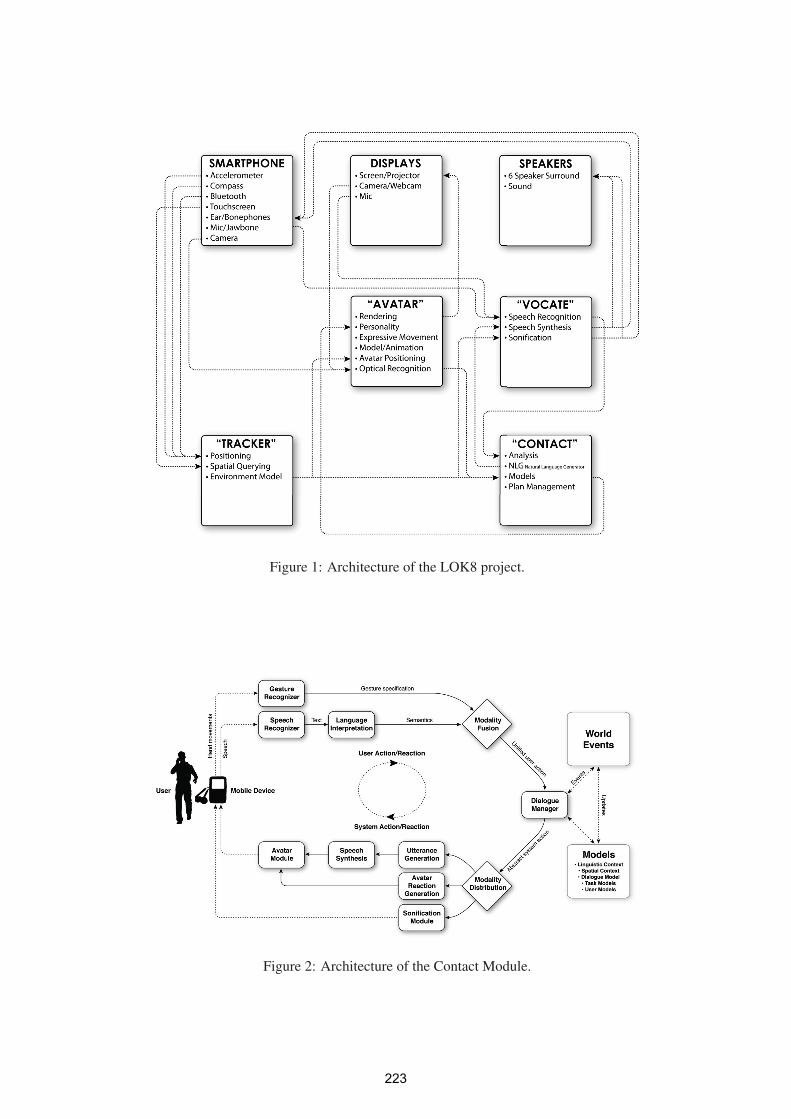
Figure 1: Architecture of the LOK8 project.
Figure 2: Architecture of the Contact Module.
223
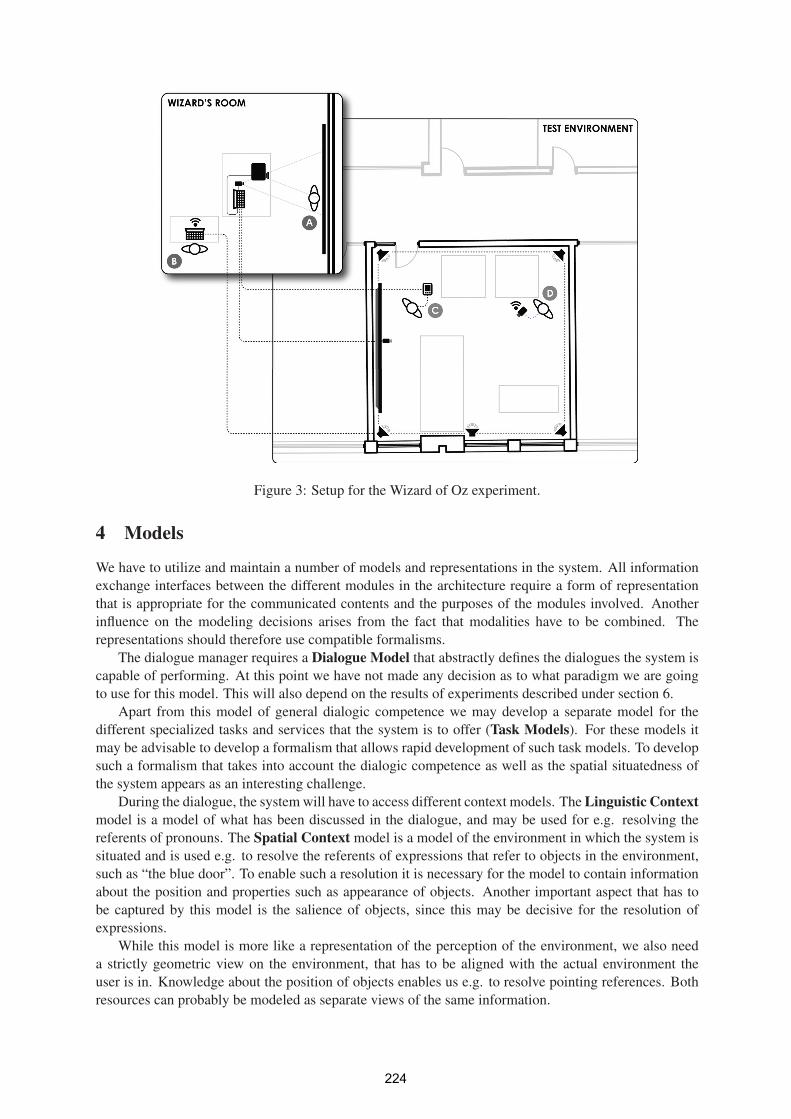
Figure 3: Setup for the Wizard of Oz experiment.
4 Models
We have to utilize and maintain a number of models and representations in the system. All information
exchange interfaces between the different modules in the architecture require a form of representation
that is appropriate for the communicated contents and the purposes of the modules involved. Another
influence on the modeling decisions arises from the fact that modalities have to be combined. The
representations should therefore use compatible formalisms.
The dialogue manager requires a Dialogue Model that abstractly defines the dialogues the system is
capable of performing. At this point we have not made any decision as to what paradigm we are going
to use for this model. This will also depend on the results of experiments described under section 6.
Apart from this model of general dialogic competence we may develop a separate model for the
different specialized tasks and services that the system is to offer (Task Models). For these models it
may be advisable to develop a formalism that allows rapid development of such task models. To develop
such a formalism that takes into account the dialogic competence as well as the spatial situatedness of
the system appears as an interesting challenge.
During the dialogue, the system will have to access different context models. The Linguistic Contextmodel is a model of what has been discussed in the dialogue, and may be used for e.g. resolving the
referents of pronouns. The Spatial Context model is a model of the environment in which the system is
situated and is used e.g. to resolve the referents of expressions that refer to objects in the environment,
such as “the blue door”. To enable such a resolution it is necessary for the model to contain information
about the position and properties such as appearance of objects. Another important aspect that has to
be captured by this model is the salience of objects, since this may be decisive for the resolution of
expressions.
While this model is more like a representation of the perception of the environment, we also need
a strictly geometric view on the environment, that has to be aligned with the actual environment the
user is in. Knowledge about the position of objects enables us e.g. to resolve pointing references. Both
resources can probably be modeled as separate views of the same information.
224
Apart from these models we are also planning on integrating a user model, that contains and collects
information about the user. This model may be useful in several stages of the system. At a very high
level this model can contain information about which services the user likes or disprefers, while at a low
level it may contain e.g. information to improve the quality of speech recognition.
5 State of work and current results
I am currently reviewing literature about the state of the art in the area. In parallel to that we are going
to perform experiments to simulate interaction with the system and collect data. These experiments
are preliminary and serve mainly to develop a robust test setup and explore interaction scenarios and
strategies.
We have set up a Wizard-of-Oz scenario that enables us to simulate the surface functions of the
system and to record the interaction with users. A schematic overview of this setup is given in figure 3.
The room with the dark outline on the right is the test environment. It contains several objects of interest
that may serve as subject of discussion with the user as well as a large display.
Participant C takes the role of the system user. She is carrying a mobile device that runs the simu-
lation software. The device displays a live video feed showing participant A who is playing the role of
the animated agent in a separate room. This participant is supplied with a live video feed from a camera
on the mobile device that is pointed at the user and picks up facial expressions and gestures. On the wall
behind participant A a projection displays data or images such as maps. This allows it to simulate the
presentation of data by the agent.
Depending on the position of the user, the agent may also be displayed on the display on the left
wall in the test environment. A camera is attached to the display that feeds a video stream to the agent
participant and allows to direct visual contact between agent and user.
The task of participant D is to observe and record the interaction with a mobile camera. This footage
is forwarded to participant B. This participant simulates the sonification system and produces audio cues
depending on the position and actions of the user.
Video and audio streams are saved and will supply us with rich data for evaluation.
6 Future work
We are shortly going to perform first experiments and then begin to evaluate the data, and then use the
results to make further design decisions. The experiment setup can later be rened and used to build cor-
pora and collect training data for components that may incorporate machine learning based approaches,
such as the dialogue management component.
The LOK8 project is scheduled to run until 2012.
References
[Herzog and Reithinger, 2006] Herzog, G. and Reithinger, N. (2006). The SmartKom architecture: A
framework for multimodal dialogue systems. In Wahlster, W., editor, SmartKom: Foundations ofMultimodal Dialogue Systems, pages 55–70. Springer, Berlin, Heidelberg.
[McTear, 2002] McTear, M. F. (2002). Spoken dialogue technology: enabling the conversational user
interface. ACM Comput. Surv., 34(1):90–169.
[Oviatt, 1997] Oviatt, S. (1997). Multimodal interactive maps: designing for human performance.
Hum.-Comput. Interact., 12(1):93–129.
225
PERFORMANCE OPTIMISATION OF THE AIT CAMPUS WIRELESS MESH NETWORK DEPLOYMENT
Eduardo Brito, Robert Stewart, John Allen, MN Hassan
Athlone Institute of Technology
Abstract
The deployment of an 802.11x wireless mesh network in urban areas is a complex task and is traditionally based on an exhaustive site survey, rules-of-thumb or past experiences. In this research we propose exploring the spatial distribution of the clients, the topology and the clutter using software tools from Motorola in a VoWiFi mesh network before deployment. The objective is to obtain the optimal position for the wireless access points that allows an increase in the overall capacity and performance. The cost savings inherent in running real-time applications over IP based wireless mesh networks will be of interest to industry, especially as AIT is the first in Ireland to utilize the Motorola Mesh Planner software. Initial results are presented from the recently installed mesh network on the AIT campus.
Introduction
The 802.11 technology has become an ubiquitous solution for wireless LAN’s in the home and offices. Using the two-tier mesh network technology the WLANs have been considered as a practical solution to wide area coverage. A two-tier mesh network has an access tier that integrates the clients, and a backhaul tier which forwards the clients packages in a multi-hop architecture to a wired gateway. A two-tier mesh network compared with wired access points network has a lower deployment cost, is easily scalable, better coverage and is robust to general individual node failure [1].
The deployment of an 802.11x wireless mesh network in urban areas is a complex task and traditionally based on exhaustive site survey, rules-of-thumb or past experiences. The topology, foliage and architectural characteristics of the buildings are all sources of uncertainty in terms of the range and capacity of these mesh networks. With ever increasing constraints on network infrastructure budgets efficient methods of planning and performance evaluation in advance of deployment are now required. The utilization of software tools such as the Motorola Mesh planner can reduce the deployment time, and enable network optimization through pre deployment evaluations of performance. For example in [4] by properly exploring the client’s spatial distribution information in allocating the access points, an increase in the overall voice capacity is achieved.
Initial results are presented from the deployed wireless mesh network at the AIT campus. The main wireless network will be integrated with a secondary 802.11n wireless network for use with a Real Time Location System (RTLS) from Ekahau. An evaluation of the capacity and resilience of the deployed network will be of interest for health and safety applications, emergency services support and routine campus communication.
226
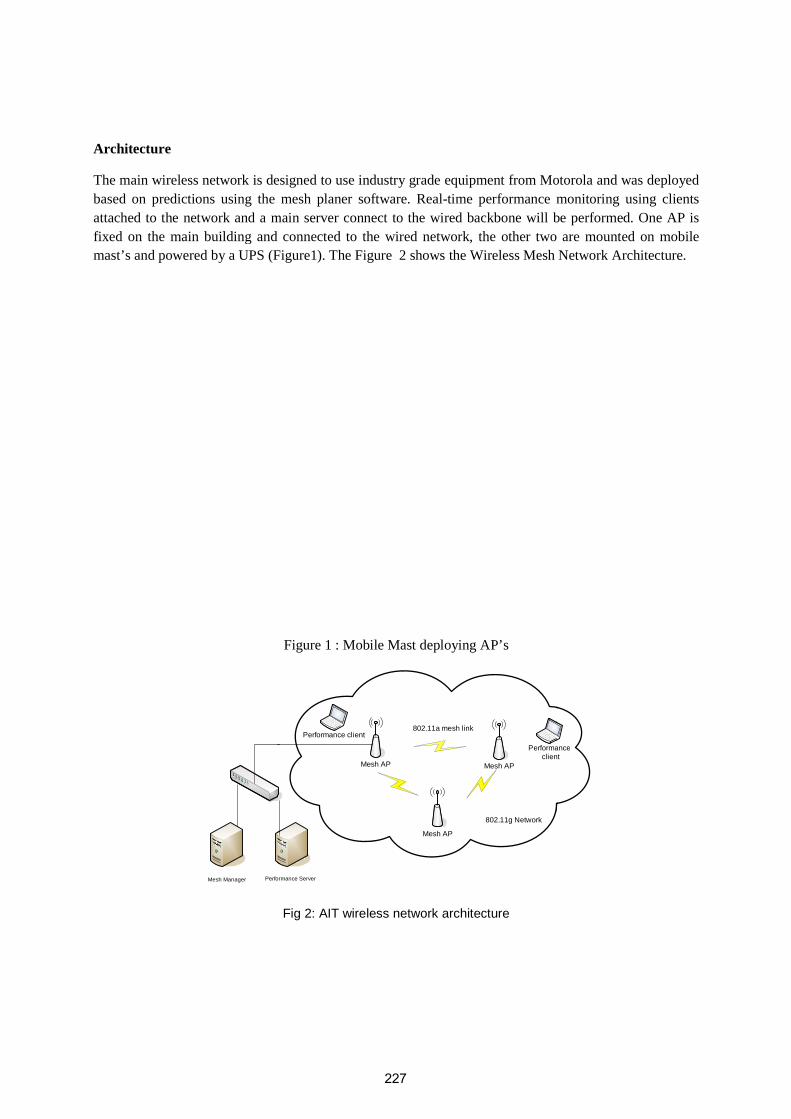
Architecture
The main wireless network is designed to use industry grade equipment from Motorola and was deployed based on predictions using the mesh planer software. Realattached to the network and a main server connect to the wired backbone will be performed. One AP is fixed on the main building and connected to the wired network, the other two are mounted on mobile mast’s and powered by a UPS (Figure1)
Mesh Manager Performance Server
The main wireless network is designed to use industry grade equipment from Motorola and was deployed based on predictions using the mesh planer software. Real-time performance monitoring using clientattached to the network and a main server connect to the wired backbone will be performed. One AP is fixed on the main building and connected to the wired network, the other two are mounted on mobile
(Figure1). The Figure 2 shows the Wireless Mesh Network Architecture.
Figure 1 : Mobile Mast deploying AP’s
Mesh AP Mesh AP
Mesh AP
802.11g Network
802.11a mesh link
Performance Server
Performanceclient
Performance client
Fig 2: AIT wireless network architecture
The main wireless network is designed to use industry grade equipment from Motorola and was deployed time performance monitoring using clients
attached to the network and a main server connect to the wired backbone will be performed. One AP is fixed on the main building and connected to the wired network, the other two are mounted on mobile
less Mesh Network Architecture.
Performanceclient
227

Mesh Planner tool
Motorola provides a software package for designing outdoor wireless mesh networks efficiently and cost-effectively. Optimized to work with Motorola Motomesh products, MeshPlanner allows designers to create networks on their PC and validate performance with the software's measurement functionality, eliminating the costly on-site work that accompanies traditional site survey-based design methods. This reduces labour and planning costs and enables quicker implementation of a high-performance network. The aim of this research is to use the software to plan the deployment of the Motorola Mesh Network on the AIT campus.
Figure 3 : Meshplanner RF-Intelligent map
The planning software creates an RF-intelligent map by importing the following:
• A digital elevation model in GeoTIFF format
• Deployment drawing via satellite image
• Scanned image or digital photograph • Buildings, structures or foliage in ESRI shape file format
• Clutter data in GeoTIFF format;
Rate adaptive MAC
Rate adaption is the process of dynamically switching data rates to match the channel conditions and therefore provide optimum throughput. The channel conditions are influenced by the carrier frequency, client speed, interference, etc. In 802.11 networks the adaptation occurs at the MAC layer [2].
AP1AP2
AP1 AP3
228
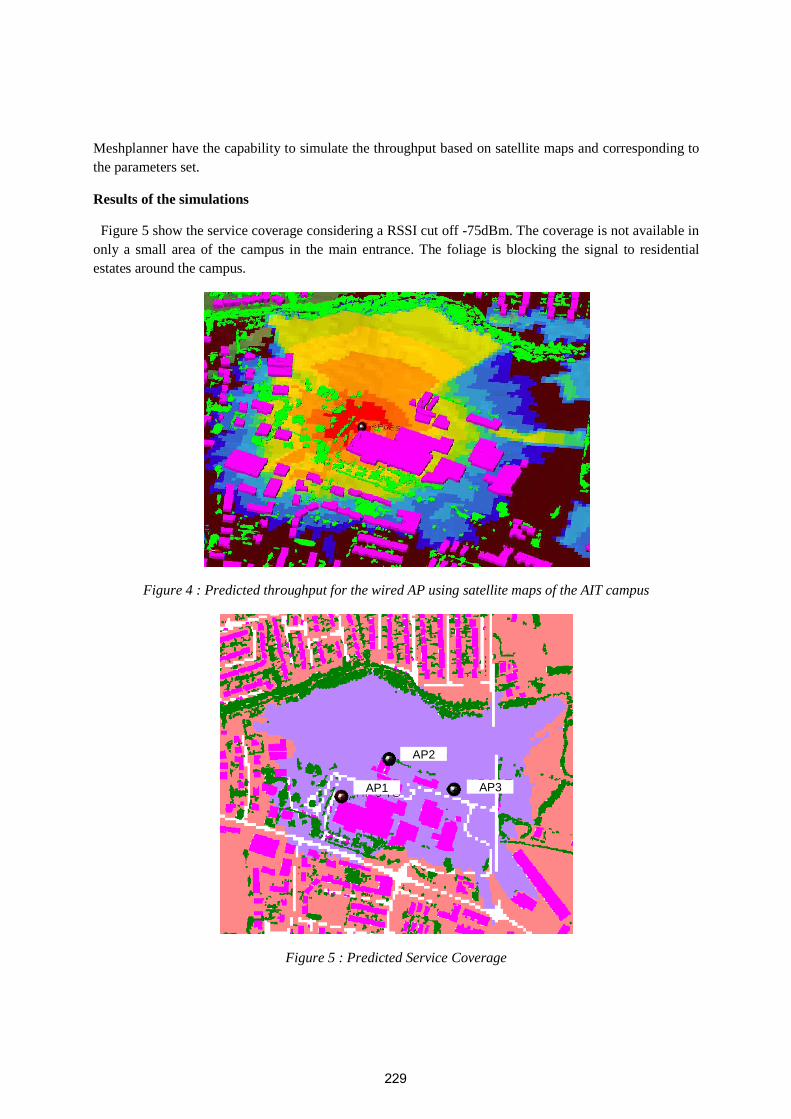
Meshplanner have the capability to simulate the throughput based on satellite maps and corresponding to the parameters set.
Results of the simulations
Figure 5 show the service coverage considering a RSSI cut off -75dBm. The coverage is not available in only a small area of the campus in the main entrance. The foliage is blocking the signal to residential estates around the campus.
Figure 4 : Predicted throughput for the wired AP using satellite maps of the AIT campus
Figure 5 : Predicted Service Coverage
AP2
AP1 AP3
229
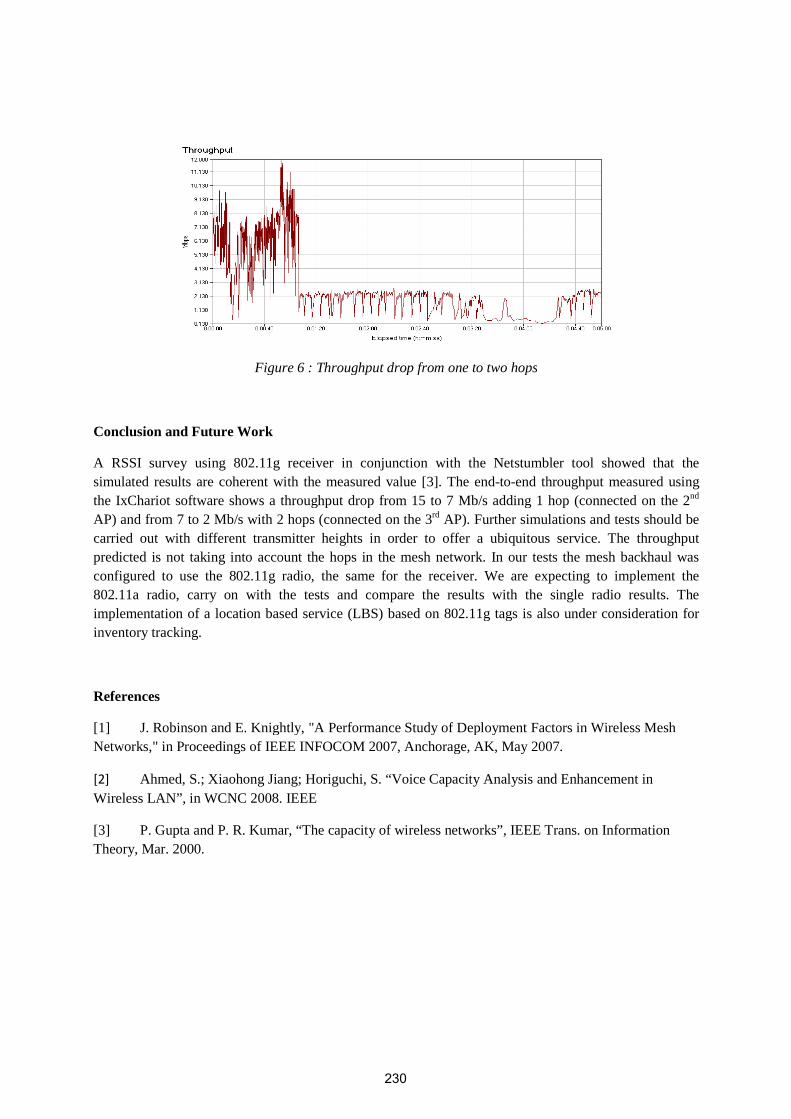
Figure 6 : Throughput drop from one to two hops
Conclusion and Future Work
A RSSI survey using 802.11g receiver in conjunction with the Netstumbler simulated results are coherent with the measured valuethe IxChariot software shows a throughput drop from 15 to 7 Mb/s adding 1 hop (connected on the 2AP) and from 7 to 2 Mb/s with 2 hops (carried out with different transmitter heights in order to offer a ubiquitous service. The throughput predicted is not taking into account the hops in the mesh network. In our tests the meshconfigured to use the 802.11g radio, the same for the receiver. We are expecting to implement the 802.11a radio, carry on with the tests and compare the results with the single radio results. The implementation of a location based service (LBinventory tracking.
References
[1] J. Robinson and E. Knightly, "Networks," in Proceedings of IEEE INFOCOM 2007
[2] Ahmed, S.; Xiaohong Jiang; Horiguchi, S. Wireless LAN”, in WCNC 2008. IEEE
[3] P. Gupta and P. R. Kumar, “The caTheory, Mar. 2000.
Figure 6 : Throughput drop from one to two hops
A RSSI survey using 802.11g receiver in conjunction with the Netstumbler simulated results are coherent with the measured value [3]. The end-to-end throughput measured using the IxChariot software shows a throughput drop from 15 to 7 Mb/s adding 1 hop (connected on the 2AP) and from 7 to 2 Mb/s with 2 hops (connected on the 3rd AP). Further simulations and tests should be carried out with different transmitter heights in order to offer a ubiquitous service. The throughput predicted is not taking into account the hops in the mesh network. In our tests the meshconfigured to use the 802.11g radio, the same for the receiver. We are expecting to implement the 802.11a radio, carry on with the tests and compare the results with the single radio results. The implementation of a location based service (LBS) based on 802.11g tags is also under consideration for
J. Robinson and E. Knightly, "A Performance Study of Deployment Factors in Wireless Mesh Proceedings of IEEE INFOCOM 2007, Anchorage, AK, May 2007.
Ahmed, S.; Xiaohong Jiang; Horiguchi, S. “Voice Capacity Analysis and Enhancement in WCNC 2008. IEEE
P. Gupta and P. R. Kumar, “The capacity of wireless networks”, IEEE Trans. on Information
A RSSI survey using 802.11g receiver in conjunction with the Netstumbler tool showed that the end throughput measured using
the IxChariot software shows a throughput drop from 15 to 7 Mb/s adding 1 hop (connected on the 2nd AP). Further simulations and tests should be
carried out with different transmitter heights in order to offer a ubiquitous service. The throughput predicted is not taking into account the hops in the mesh network. In our tests the mesh backhaul was configured to use the 802.11g radio, the same for the receiver. We are expecting to implement the 802.11a radio, carry on with the tests and compare the results with the single radio results. The
S) based on 802.11g tags is also under consideration for
A Performance Study of Deployment Factors in Wireless Mesh , Anchorage, AK, May 2007.
ty Analysis and Enhancement in
pacity of wireless networks”, IEEE Trans. on Information
230

�
231

�
232