Embed Size (px)
Citation preview

1 © Nokia 2016
Q2 2019Conference call
July 25, 2019
15:00 / Helsinki
08:00 / New York

2 © 2019 Nokia
Disclaimer
It should be noted that Nokia and its business are exposed to various risks and uncertainties and certain statements herein that are not historical facts are forward-looking statements. These forward-looking statements reflect Nokia’s current expectations and views of future developments and include statements preceded by “believe”, “expect”, “expectations”, “commit”, “anticipate”, “foresee”, “see”, “target”, “estimate”, “designed”, “aim”, “plan”, “intend”, “influence”, “assumption”, “focus”, “continue”, “project”, “should", "is to", "will” or similar expressions. These statements are based on management's best assumptions and beliefs in light of the information currently available to it. Because they involve risks and uncertainties, actual results may differ materially from the results that we currently expect. Factors, including risks and uncertainties that could cause such differences can be both external, such as general, economic and industry conditions, as well as internal operating factors. We have identified these in more detail on pages 60 to 75 of our annual report on Form 20-F for the year ended December 31, 2018 under “Operating and Financial Review and Prospects—Risk
Factors“, and in our other filings or documents furnished with the U.S. Securities and Exchange Commission, including Nokia’s financial results reports. Other unknown or unpredictable factors or underlying assumptions subsequently proven to be incorrect could cause actual results to differ materially from those in the forward-looking statements. We do not undertake any obligation to publicly update or revise forward-looking statements, whether as a result of new information, future events or otherwise, except to the extent legally required.Nokia presents financial information on reported, non-IFRS and constant currency basis. Non-IFRS measures presented in this document exclude costs related to the acquisition of Alcatel-Lucent and related integration, goodwill impairment charges, intangible asset amortization and other purchase price fair value adjustments, restructuring and associated charges and certain other items that may not be indicative of Nokia's underlying business performance. In order to allow full visibility on determining non-IFRS results, information on non-IFRS exclusions is presented separately for each of the components of profit or loss.
Constant currency reporting provides additional information on change in financial measures on a constant currency basis in order to better reflect the underlying business performance. Therefore, change in financial measures at constant currency excludes the impact of changes in exchange rates in comparison to euro, our reporting currency. Non-IFRS or constant currency financial measures should not be considered in isolation from, or as a substitute for, financial information presented in compliance with IFRS, and either of these financial measures as used by Nokia may not be comparable to similarly titled measures used by other companies or persons. Please see our complete financial report for more information on our results and financial performance for the indicated periods as well as our operating and reporting structure.
Nokia is a registered trademark of Nokia Corporation. Other product and company names mentioned herein may be trademarks or trade names of their respective owners.

3 © 2019 Nokia
Presented by
Rajeev Suri
President and CEO
Kristian Pullola
CFO

4 © 2019 Nokia
Contents
Summary 5 – 7
Outlook 8 – 10
Nokia in Q2 2019 11 – 20
Reportable Segments in Q2 2019 21 – 29
Financial Statements 30 – 33

5 © 2019 Nokia
Strong Q2 driven by end-to-end 5G demand and improved operational execution; Full year 2019 guidance maintained
Rajeev Suri, President and CEO, on Q2 2019 results
Nokia delivered a strong second quarter, driven by 5G demand, a competitive end-to-end portfolio and strengthened operational execution. Given these compelling results, we are confirming our full-year 2019 guidance.
In the quarter, we saw good year-on-year growth, meaningful improvements in profitability, robust progress in our strategic expansion areas of Software and Enterprise and excellent momentum in our IP Routing business. We also continued to enhance our position in 5G, and now have 45 commercial 5G deals and 9 live networks.
Risks remain in the year, including execution demands in the second half, trade-related uncertainty and challenges in the China market. Given these risks, we will continue to focus on tight operational discipline, delivering on our EUR 700 million cost-savings program, improving working capital management and advancing the implementation of our strategy.
Overall, I am pleased with Nokia’s performance in the second quarter and our continued progress in executing our strategy.

6 © 2019 Nokia
DividendBeginning with the distribution for the financial year 2018, Nokia has started paying dividends in quarterly instalments. Under the authorization by the Annual General Meeting held on May 21, 2019, the Board of Directors may resolve an aggregate maximum annualdistribution of EUR 0.20 per share to be paid quarterly during the authorization period, unless the Board decides otherwise for a justified reason. On the same day, the Board resolved to distribute EUR 0.05 per share as the first instalment of the dividend.
On July 25, 2019, the Board resolved to distribute EUR 0.05 per share as the second instalment of the dividend. The dividend record date is on July 30, 2019 and the dividend is expected to be paid on or around August 8, 2019. The actual dividend payment date outside Finland will be determined by the practices of the intermediary banks transferring the dividend payments. Following thisannounced distribution, the Board’s remaining distribution authorization for the financial year 2018 is a maximum of EUR 0.10 per share.
The payment of the second instalment of the dividend, as well as the payment of the withholding taxes related to the first instalment of the dividend, are expected to total approximately EUR 300 million in Q3 2019.

7 © 2019 Nokia
Financial Summary
EUR million (except for EPS in EUR) Q2'19 Q2'18 YoY change
Constant
currency
YoY change Q1-Q2'19 Q1-Q2'18 YoY change
Constant
currency
YoY
change
Net sales 5 694 5 313 7% 5% 10 726 10 237 5% 2%
Operating profit/(loss) (57) (221) (581) (557)
Operating margin % (1.0)% (4.2)% 320bps (5.4)% (5.4)% 0bps
EPS, diluted (0.03) (0.05) (0.11) (0.11)
Operating profit/(loss) (non-IFRS) 451 334 35% 391 573 (32)%
Operating margin % (non-IFRS) 7.9% 6.3% 160bps 3.6% 5.6% (200)bps
EPS, diluted (non-IFRS) 0.05 0.03 67% 0.02 0.04 (50)%
Net cash and current financial investments1 502 2 146 (77)% 502 2 146 (77)%
Q2 2019 and January-June 2019 reported and non-IFRS results. Refer to note 1, “Basis of Preparation”, note 2, "Non-IFRS to reported
reconciliation" and note 13, "Performance measures", in the "Financial statement information" section for details.
1Net cash and current financial investments does not include lease liabilities.

8 © 2019 Nokia
Outlook

9 © 2019 Nokia
Outlook metrics

10 © 2019 Nokia
Key drivers of Nokia’s outlookNet sales and operating margin for Networks and Nokia Software are expected to be influenced by factors including:
• Our expectation that we will outperform our primary addressable market in full year 2019 and over the longer-term, driven by our strategy, which includes competing in 5G more effectively due to our strong end-to-end portfolio, focusing on targeted growth opportunities in attractive adjacent markets and building a strong network agnostic software business. On a constant currency basis, we expect our primary addressable market to grow slightly in full year 2019, and for growth to continue in full year 2020. (This is an update to our earlier commentary for our primary addressable market to be flattish in full year 2019 and to grow in full year 2020.);
• The slow start to 2019 and weak overall first half puts significant pressure on execution in the second half;• The timing of completions and acceptances of certain projects, particularly related to 5G. Based on the evolving readiness of the 5G ecosystem and the staggered nature of 5G
rollouts in lead countries, we expect full year 2019 will have seasonality characterized by a particularly weak first quarter, a strong second quarter, an expected soft third quarter and an expected particularly strong fourth quarter (This is an update, providing additional quarterly details);
• Competitive intensity could increase in some accounts as some competitors seek to take share in the early phases of 5G;• Some customers are reassessing their vendors in light of security concerns, creating near-term pressure to invest in order to secure long-term benefits;• Our expectation that we will improve our R&D productivity and reduce support function costs through the successful execution of our cost savings program;• Potential mergers or acquisitions by our customers; • Our product and regional mix; and• Macroeconomic, industry and competitive dynamics.
Net sales and operating margin for Nokia Technologies is expected to be influenced by factors including:
• The timing and value of new and existing patent licensing agreements with smartphone vendors, automotive companies and consumer electronics companies;• Results in brand and technology licensing;• Costs to protect and enforce our intellectual property rights; and • The regulatory landscape.
Additionally, our outlook is based on the following assumptions:
• Nokia’s recurring free cash flow is expected to improve over the longer-term due to lower cash outflows related to restructuring and network equipment swaps and improved operational results over time;
• Non-IFRS financial income and expenses to be an expense of approximately EUR 350 million in full year 2019 and over the longer-term (This is an update to earlier commentary for non-IFRS financial income and expenses to be an expense of approximately EUR 300 million.);
• Non-IFRS income taxes at a rate of approximately 28% in full year 2019 and approximately 25% over the longer-term, subject to the absolute level of profits, regional profit mix and changes to our operating model;
• Cash outflows related to income taxes of approximately EUR 450 million in full year 2019 and over the longer term until our US or Finnish deferred tax assets are fully utilized; and• Capital expenditures of approximately EUR 700 million in full year 2019 and approximately EUR 600 million over the longer-term.

11 © 2019 Nokia
Nokia in Q2 2019

12 © 2019 Nokia
Nokia financial results
Networks
Nokia Technologies Operating margin %
Operating margin % (non-IFRS)
Group Common and Other
Nokia Software
Net sales Operating margin Components of operating profit EPS
(20)%
(10)%
0%
10%
20%
30%
40%
0M
€2 000M
€4 000M
€6 000M
€8 000M
Q2'18 Q3'18 Q4'18 Q1'19 Q2'19 €(0.10)
€(0.05)
0
€0.05
€0.10
€0.15
€ (1000)M
€ (500)M
0M
€500M
€1000M
€1500M
Q2'18 Q3'18 Q4'18 Q1'19 Q2'19
Nokia Technologies
Networks
Group Common and Other
Non-IFRS exclusions
EPS, diluted
EPS, diluted (non-IFRS)Nokia Software

13 © 2019 Nokia
Nokia financial results, Q2 2019 compared to Q2 2018Nokia non-IFRS net sales grew 7%. On a constant currency basis, Nokia non-IFRS net sales grew 5%.
Nokia non-IFRS net sales, excluding approximately EUR 30 million of one-time licensing net sales in Q2 2019 and EUR 10 million in Q2 2018, grew 7%, as our customers added network capacity in preparation for the continued rise in broadband traffic driven by 5G. Our strong topline performance in Q2 2019 reflected improved industry demand and the competitiveness of our end-to-end portfolio, with growth across four out of six regions and all customer types. In Q2 2019, we continued to make progress with our strategy to diversify and grow, with strong results in Nokia Software and continued solid performance with enterprise customers.
The strong growth in Nokia Software net sales was due to both applications and core networks benefitting from its improved go-to-market capabilities, as well as the timing of completions and acceptances of certain projects.
The growth in net sales to enterprise customers was primarily due to strong demand for our market-leading IP routing and optical networks portfolio and, to a lesser extent, strong percentage growth in private wireless networks for industrial and public sector applications. We continue to see strong momentum in industries like utilities, transportation, mining, manufacturing, as well as the public sector.
The increase in Nokia non-IFRS gross profit was driven by strong net sales and operational execution that was solid and broad-based across Networks, Nokia Software and Nokia Technologies, partially offset by lower gross profit in Group Common and other.
The increase in Nokia non-IFRS operating profit was driven by the higher non-IFRS gross profit, as well as continued progress related to Nokia’s cost savings program, partially offset by lower gains in Nokia’s venture fund investments and a net negative impact related to foreign exchange hedging.
EUR million (except for EPS in EUR) Q2'19 Q2'18
YoY
change
Constant
currency
YoY change
Net sales 5 694 5 313 7% 5%
Networks 4 393 4 081 8% 5%
Nokia Software 678 612 11% 8%
Nokia Technologies 383 361 6% 4%
Group Common and Other 263 280 (6)% (6)%
Non-IFRS exclusions (2) (5) (60)%
Gross profit 2 065 1 860 11%
Operating profit/(loss) (57) (221) (74)%
Networks 119 34 250%
Nokia Software 137 40 243%
Nokia Technologies 324 292 11%
Group Common and Other (129) (33)
Non-IFRS exclusions (508) (555)
Operating margin % (1.0)% (4.2)% 320bps
Gross profit (non-IFRS) 2 117 2 038 4%
Operating profit/(loss) (non-IFRS) 451 334 35%
Operating margin % (non-IFRS) 7.9% 6.3% 160bps
Financial income and expenses (173) (56) 209%
Income taxes 46 10 360%
Profit/(loss) for the period (191) (271) (30)%
EPS, diluted (0.03) (0.05) (40)%
Financial income and expenses (non-IFRS) (86) (84) 2%
Income taxes (non-IFRS) (101) (106) (5)%
Profit/(loss) for the period (non-IFRS) 258 139 86%
EPS, diluted (non-IFRS) 0.05 0.03 67%

14 © 2019 Nokia
Nokia financial results, January-June 2019 compared to January-June 2018Nokia net sales grew 5% in the first six months of 2019 as our customers added network capacity in preparation for the continued rise in broadband traffic driven by 5G. On a constant currency basis, Nokia net sales grew 2% in the first six months of 2019.
Nokia net sales, excluding approximately EUR 70 million of one-time licensing net sales in the first six months of 2019 and EUR 20 million in the first six months of 2018, grew 4%.
Our strong topline performance in the first six months 2019 reflected improved industry demand and the competitiveness of our end-to-end portfolio, with growth across four out of six regions and all customer types. In the first six months of 2019, we continued to make progress with our strategy to diversify and grow, with strong results in Nokia Software and continued solid performance with enterprise customers.
The decrease in Nokia gross profit in the first six months of 2019 was driven by a particularly weak Q1 2019, partially offset by improved operational execution in Q2 2019.
The slight increase in Nokia operating loss in the first six months of 2019 was driven by lower gross profit and higher restructuring and associated charges, partially offset by continued progress related to Nokia’s cost savings program.
EUR million (except for EPS in EUR) Q1-Q2'19 Q1-Q2'18
YoY
change
Constant
currency
YoY
change
Net sales 10 726 10 237 5% 2%
Networks 8 336 7 864 6% 3%
Nokia Software 1 221 1 153 6% 3%
Nokia Technologies 753 726 4% 2%
Group Common and Other 484 532 (9)% (9)%
Non-IFRS exclusions (27) (9) 200%
Gross profit 3 646 3 666 (1)%
Operating profit/(loss) (581) (557) 4%
Networks (135) 80 (269)%
Nokia Software 130 42 210%
Nokia Technologies 626 566 11%
Group Common and Other (230) (116)
Non-IFRS exclusions (972) (1 129)
Operating margin % (5.4)% (5.4)% 0bps
Gross profit (non-IFRS) 3 758 3 979 (6)%
Operating profit/(loss) (non-IFRS) 391 573 (32)%
Operating margin % (non-IFRS) 3.6% 5.6% (200)bps
Financial income and expenses (228) (164) 39%
Income taxes 188 104 81%
Profit/(loss) for the period (632) (625) 1%
EPS, diluted (0.11) (0.11) 0%
Financial income and expenses (non-IFRS) (178) (200) (11)%
Income taxes (non-IFRS) (60) (143) (58)%
Profit/(loss) for the period (non-IFRS) 142 223 (36)%
EPS, diluted (non-IFRS) 0.02 0.04 (50)%

15 © 2019 Nokia
18%
28%
9%6%
8%
31%
Asia-Pacific Europe Greater China
Latin America Middle East & Africa North America0M
€ 200M
€ 400M
€ 600M
€ 800M
€1 000M
€1 200M
€1 400M
€1 600M
€1 800M
€2 000M
€2 200M
Net sales by region
Q2 2019 Q2/2018-Q2/2019
Asia-Pacific
Europe North America
GreaterChina
LatinAmerica
MiddleEast & Africa
16 © 2019 Nokia
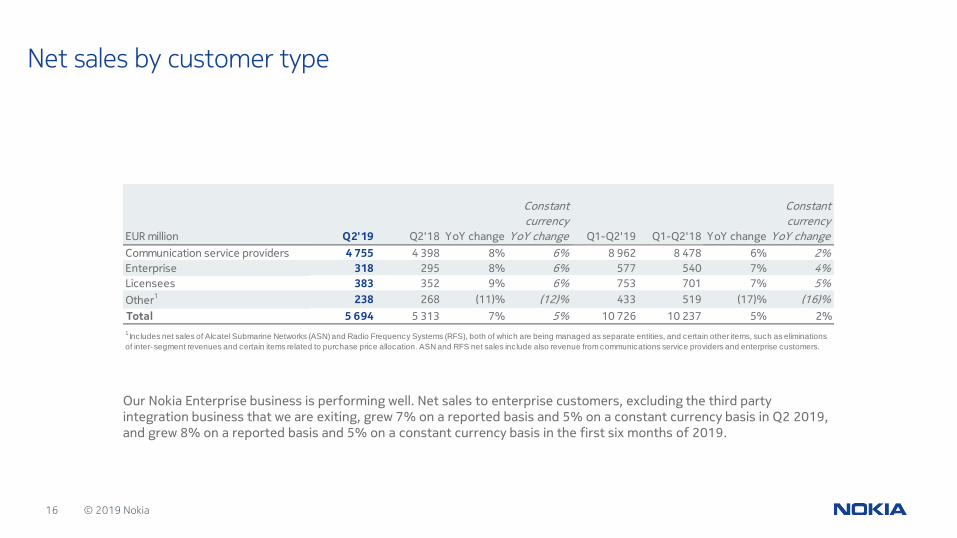
Net sales by customer type
Our Nokia Enterprise business is performing well. Net sales to enterprise customers, excluding the third party integration business that we are exiting, grew 7% on a reported basis and 5% on a constant currency basis in Q2 2019, and grew 8% on a reported basis and 5% on a constant currency basis in the first six months of 2019.
EUR million Q2'19 Q2'18 YoY change
Constant
currency
YoY change Q1-Q2'19 Q1-Q2'18 YoY change
Constant
currency
YoY change
Communication service providers 4 755 4 398 8% 6% 8 962 8 478 6% 2%
Enterprise 318 295 8% 6% 577 540 7% 4%
Licensees 383 352 9% 6% 753 701 7% 5%
Other1 238 268 (11)% (12)% 433 519 (17)% (16)%
Total 5 694 5 313 7% 5% 10 726 10 237 5% 2%
1 Includes net sales of Alcatel Submarine Networks (ASN) and Radio Frequency Systems (RFS), both of which are being managed as separate entities, and certain other items, such as eliminations
of inter- segment revenues and certain items related to purchase price allocation. ASN and RFS net sales include also revenue from communications service providers and enterprise customers.

17 © 2019 Nokia
Amounts related to licensing and Nokia Bell Labs allocated 85% to Networks and 15% to Nokia Software
Q2'19 Q2'19 Q2'18
Before allocations Licensing Nokia Bell Labs After allocations After allocationsNet sales (EUR million)
Networks 4 393 326 3 4 721 4 382
Nokia Software 678 57 736 665
Nokia Technologies 383 (383) 0 9
Group Common and Other 263 (3) 260 278
Eliminations (21) (21) (15)
Non-IFRS total 5 696 0 0 5 696 5 318
Operating Profit (EUR million)
Networks 119 275 (46) 348 244
Nokia Software 137 49 (8) 178 77
Nokia Technologies 324 (324) 0 (5)
Group Common and Other (129) 54 (75) 17
Non-IFRS total 451 0 0 451 334
Operating Margin %
Networks 2.7% 7.4% 5.6%Nokia Software 20.2% 24.2% 11.6%
Nokia Technologies 84.6%
Group Common and Other (49.0)% (28.8)% 6.1%
Non-IFRS total 7.9% 7.9% 6.3%
Allocations
Nokia is providing additional adjusted financial disclosure for its Networks and Nokia Software reportable segments, with amounts related to licensing and Nokia Bell Labs allocated 85% to Networks and 15% to Nokia Software. In addition to Nokia’s primary financial disclosures, this reflects Nokia’s strategy, organizational structure and the way it evaluates operational performance and allocates resources, is in accordance with industry practice and improves comparability with peer companies.
If we would report amounts related to licensing and Nokia Bell Labs as part of Networks and Nokia Software, our Q2 2019 Networks operating margin would have been 7.4% instead of 2.7%, and our Q2 2019 Nokia Software operating margin would have been 24.2% instead of 20.2%.

18 © 2019 Nokia
Change in net cash and current financial investments(EUR billion)
19 © 2019 Nokia
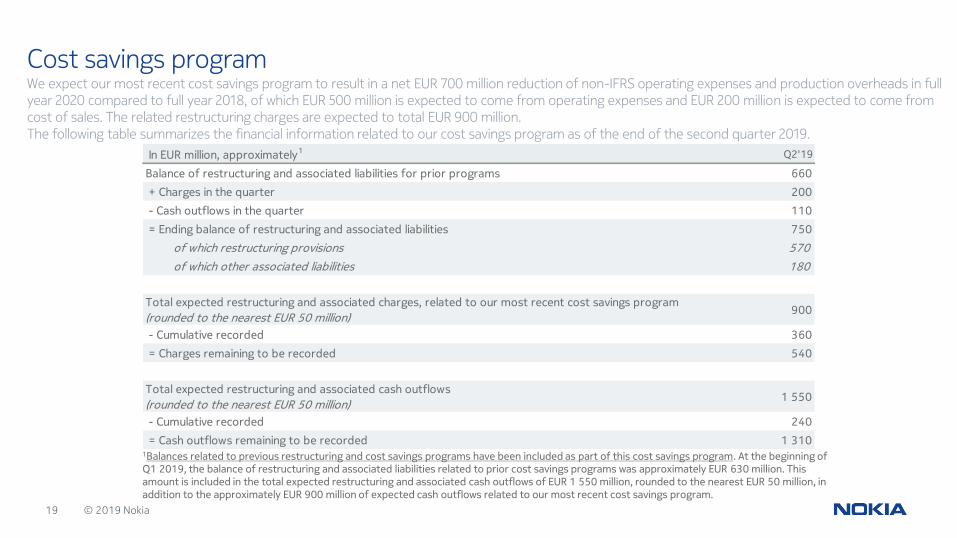
Cost savings programWe expect our most recent cost savings program to result in a net EUR 700 million reduction of non-IFRS operating expenses and production overheads in full year 2020 compared to full year 2018, of which EUR 500 million is expected to come from operating expenses and EUR 200 million is expected to come from cost of sales. The related restructuring charges are expected to total EUR 900 million.The following table summarizes the financial information related to our cost savings program as of the end of the second quarter 2019.
~
In EUR million, approximately1 Q2'19
Balance of restructuring and associated liabilities for prior programs 660
+ Charges in the quarter 200
- Cash outflows in the quarter 110
= Ending balance of restructuring and associated liabilities 750
of which restructuring provisions 570
of which other associated liabilities 180
900
- Cumulative recorded 360
= Charges remaining to be recorded 540
1 550
- Cumulative recorded 240
= Cash outflows remaining to be recorded 1 310
Total expected restructuring and associated charges, related to our most recent cost savings program
(rounded to the nearest EUR 50 million)
Total expected restructuring and associated cash outflows
(rounded to the nearest EUR 50 million)
1Balances related to previous restructuring and cost savings programs have been included as part of this cost savings program. At the beginning of Q1 2019, the balance of restructuring and associated liabilities related to prior cost savings programs was approximately EUR 630 million. This amount is included in the total expected restructuring and associated cash outflows of EUR 1 550 million, rounded to the nearest EUR 50 million, in addition to the approximately EUR 900 million of expected cash outflows related to our most recent cost savings program.

20 © 2019 Nokia
Cost savings programThe below table includes future expectations related to our most recent cost savings program, as well as the remaining cash outflows related to our previous programs and network equipment swaps.
~In EUR million, approximately
rounded to the nearest EUR 50 million
Recurring annual cost savings 200 500 - 700
- operating expenses 150 350 - 500
- cost of sales 50 150 - 200
Restructuring and associated charges 550 350 - 900
Restructuring and associated cash outflows 700 350 500 1 550
Charges related to network equipment swaps 150 - - 150
Cash outflows related to network equipment swaps 150 - - 150
FY 2019 FY 2020Beyond
FY 2020Total
Expected amounts for

21 © 2019 Nokia
Reportable Segments in Q2 2019

22 © 2019 Nokia
Net sales and marginsNetworks
(10)%
0%
10%
20%
30%
40%
50%
0M
€1 000M
€2 000M
€3 000M
€4 000M
€5 000M
€6 000M
Q2'18 Q3'18 Q4'18 Q1'19 Q2'19
Optical Networks
IP Routing
Fixed Access
Mobile Access
Gross margin %
Operating margin %

23 © 2019 Nokia
NetworksNetworks net sales grew 8%. On a constant currency basis, Networks net sales grew 5%.
The growth in Networks net sales was primarily due to Mobile Access, IP Routing and, to a lesser extent, Optical Networks, partially offset by a decrease in Fixed Access.
The growth in Mobile Access was primarily due to network deployment services and 5G radio technologies, partially offset by decreases in legacy radio technologies. The growth in IP Routing and Optical Networks was primarily due to our market-leading portfolio. In IP routing, growth was also driven by significantly improved supply chain execution. The decrease in Fixed Access was primarily due to broadband access and digital home.
The increase in Networks gross profit was primarily due to IP Routing and Optical Networks, partially offset by Fixed Access and Mobile Access. The increase in IP Routing gross profit was due to higher net sales and higher gross margin. The increase in Optical Networks gross profit was due to higher gross margin and higher net sales. The decrease in Fixed Access gross profit was due to lower gross margin and lower net sales. The decrease in Mobile Access gross profit was primarily due to lower gross margin, partially offset by higher net sales.
The decrease in Networks R&D expenses was primarily due to continued progress related to Nokia’s cost savings program, partially offset by higher 5G investments in Mobile Access.
The decrease in Networks SG&A expenses was primarily due to Mobile Access, reflecting continued progress related to Nokia’s cost savings program.
The net negative fluctuation in other income and expenses was primarily due to foreign exchange hedging, partially offset by lower loss allowances on trade receivables.
EUR million Q2'19 Q2'18 YoY change
Constant
currency YoY
change
Net sales 4 393 4 081 8% 5%
Mobile Access 2 824 2 634 7% 5%
Fixed Access 447 490 (9)% (11)%
IP Routing 715 592 21% 18%
Optical Networks 407 365 12% 9%
Gross profit 1 367 1 350 1%
Gross margin % 31.1% 33.1% (200)bps
R&D (746) (784) (5)%
SG&A (474) (516) (8)%
Other income and expenses (28) (16)
Operating profit/(loss) 119 34 250%
Operating margin % 2.7% 0.8% 190bps

24 © 2019 Nokia
Net sales and marginsNokia Software
(10)%
0%
10%
20%
30%
40%
50%
60%
0M
€ 200M
€ 400M
€ 600M
€ 800M
€1 000M
Q2'18 Q3'18 Q4'18 Q1'19 Q2'19
Net sales
Gross margin %
Operating margin %

25 © 2019 Nokia
Nokia SoftwareNokia Software net sales grew 11%. On a constant currency basis, Nokia Software net sales grew 8%.
The strong growth in Nokia Software net sales was due to both applications and core networks benefitting from improved go-to-market capabilities, as well as the timing of completions and acceptances of certain projects. In applications, growth was driven by broad-based strength across our market-leading cloud-native digital experience, digital operations and digital intelligence portfolios. In core networks, growth was primarily driven by several projects going live. From a regional perspective, growth was particularly driven by strong execution in North America, Asia-Pacific and Europe.
The increase in Nokia Software gross profit was primarily due to higher gross margin in both core networks and applications, as well as higher net sales.
The decrease in Nokia Software R&D expenses was primarily due to an increase in R&D productivity, achieved through our investments in a Common Software Foundation.
The decrease in Nokia Software SG&A expenses was primarily due to the integration and streamlining of core networks into our existing specialized software salesforce.
Having completed the integration of core networks into Nokia Software, we are in the process of transforming the core networks business to support growth and higher returns. As we drive this, we expect overall operating expenses for Nokia Software to continue at similar or slightly higher levels as in Q2 2019.
The net positive fluctuation in other income and expenses was primarily due to foreign exchange.
EUR million Q2'19 Q2'18 YoY change
Constant
currency YoY
change
Net sales 678 612 11% 8%
Gross profit 357 282 27%
Gross margin % 52.7% 46.1% 660bps
R&D (117) (123) (5)%
SG&A (100) (104) (4)%
Other income and expenses (3) (14) (79)%
Operating profit/(loss) 137 40 243%
Operating margin % 20.2% 6.5% 1 370bps

26 © 2019 Nokia
Net sales and marginsNokia Technologies
0%
20%
40%
60%
80%
100%
0M
€ 50M
€ 100M
€ 150M
€ 200M
€ 250M
€ 300M
€ 350M
€ 400M
€ 450M
Q2'18 Q3'18 Q4'18 Q1'19 Q2'19
Net Sales
Gross margin %
Operating margin %

27 © 2019 Nokia
Nokia Technologies Nokia Technologies net sales grew 6%. On a constant currency basis, Nokia Technologies net sales grew 4%.
The EUR 383 million of net sales in the second quarter 2019 related entirely to licensing. Of the EUR 361 million of net sales in the second quarter 2018, EUR 352 million related to licensing and EUR 9 million related to digital health products. We sold our digital health business in May 2018.
The growth in Nokia Technologies net sales was primarily due to higher one-time and recurring licensing net sales, partially offset by the sale of our digital health business in May 2018. One-time net sales amounted to approximately EUR 30 million in the second quarter 2019 and approximately EUR 10 million in the second quarter 2018.
The decrease in Nokia Technologies R&D expenses was primarily due to the absence of costs related to digital health, following the sale of our digital health business in May 2018.
EUR million Q2'19 Q2'18 YoY change
Constant
currency YoY
change
Net sales 383 361 6% 4%
Gross profit 378 354 7%
Gross margin % 98.7% 98.1% 60bps
R&D (30) (36) (17)%
SG&A (25) (25) 0%
Other income and expenses 0 (1)
Operating profit/(loss) 324 292 11%
Operating margin % 84.6% 80.9% 370bps
28 © 2019 Nokia
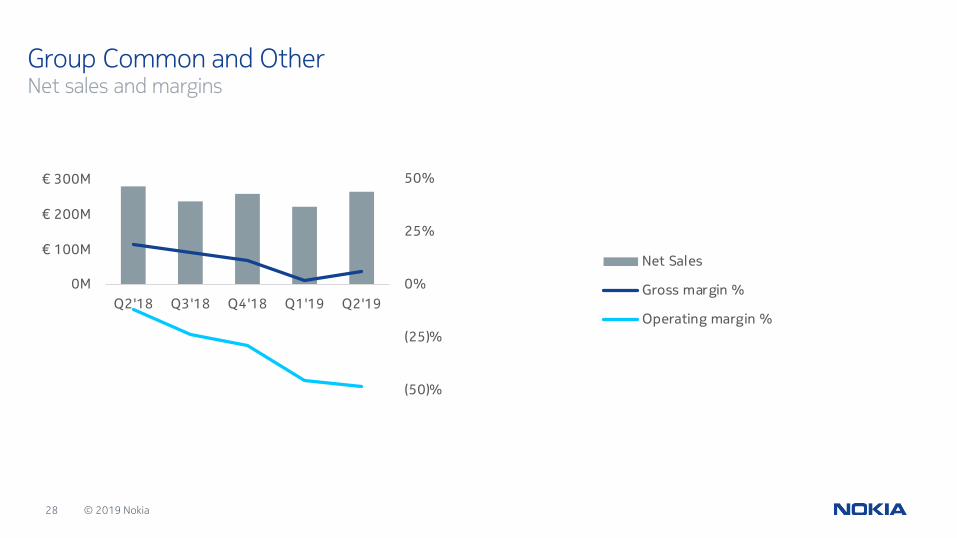
Net sales and marginsGroup Common and Other
(50)%
(25)%
0%
25%
50%
0M
€ 100M
€ 200M
€ 300M
Q2'18 Q3'18 Q4'18 Q1'19 Q2'19
Net Sales
Gross margin %
Operating margin %

29 © 2019 Nokia
Group Common and Other Group Common and Other net sales decreased 6% on both a reported and constant currency basis.
The decrease in Group Common and Other net sales was primarily due to Radio Frequency Systems, partially offset by growth in Alcatel Submarine Networks. The decrease in Radio Frequency Systems was primarily due to the absence of a large customer roll-out which benefitted the year-ago quarter. The increase in Alcatel Submarine Networks was primarily due to the ramp-up of new projects.
The decrease in Group Common and Other gross profit was primarily due to lower gross margin in Radio Frequency Systems and Alcatel Submarine Networks and, to a lesser extent, lower net sales in Radio Frequency Systems.
The increase in Group Common and Other R&D and SG&A expenses was primarily due to longer-term investments to drive digitalization for the future.
The net negative fluctuation in other income and expenses was primarily due to lower gains in Nokia’s venture fund investments.
EUR million Q2'19 Q2'18 YoY change
Constant
currency YoY
change
Net sales 263 280 (6)% (6)%
Gross profit 15 52 (71)%
Gross margin % 5.7% 18.6% (1 290)bps
R&D (85) (73) 16%
SG&A (70) (50) 40%
Other income and expenses 11 38
Operating profit/(loss) (129) (33)
Operating margin % (49.0)% (11.8)% (3 720)bps

30 © 2019 Nokia
Financial Statements
31 © 2019 Nokia
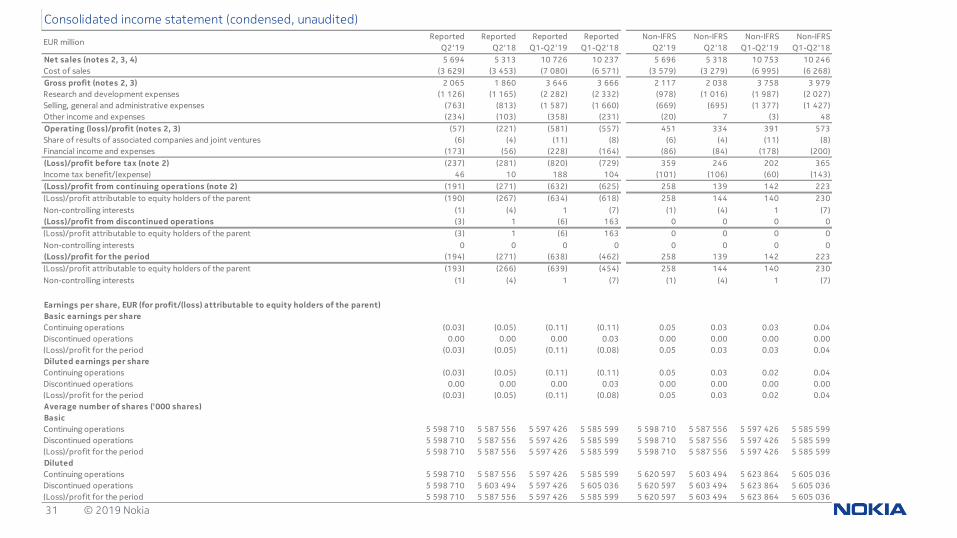
Reported Reported Reported Reported Non-IFRS Non-IFRS Non-IFRS Non-IFRS
Q2'19 Q2'18 Q1-Q2'19 Q1-Q2'18 Q2'19 Q2'18 Q1-Q2'19 Q1-Q2'18
Net sales (notes 2, 3, 4) 5 694 5 313 10 726 10 237 5 696 5 318 10 753 10 246
Cost of sales (3 629) (3 453) (7 080) (6 571) (3 579) (3 279) (6 995) (6 268)
Gross profit (notes 2, 3) 2 065 1 860 3 646 3 666 2 117 2 038 3 758 3 979
Research and development expenses (1 126) (1 165) (2 282) (2 332) (978) (1 016) (1 987) (2 027)
Selling, general and administrative expenses (763) (813) (1 587) (1 660) (669) (695) (1 377) (1 427)
Other income and expenses (234) (103) (358) (231) (20) 7 (3) 48
Operating (loss)/profit (notes 2, 3) (57) (221) (581) (557) 451 334 391 573
Share of results of associated companies and joint ventures (6) (4) (11) (8) (6) (4) (11) (8)
Financial income and expenses (173) (56) (228) (164) (86) (84) (178) (200)
(Loss)/profit before tax (note 2) (237) (281) (820) (729) 359 246 202 365
Income tax benefit/(expense) 46 10 188 104 (101) (106) (60) (143)
(Loss)/profit from continuing operations (note 2) (191) (271) (632) (625) 258 139 142 223
(Loss)/profit attributable to equity holders of the parent (190) (267) (634) (618) 258 144 140 230
Non-controlling interests (1) (4) 1 (7) (1) (4) 1 (7)
(Loss)/profit from discontinued operations (3) 1 (6) 163 0 0 0 0
(Loss)/profit attributable to equity holders of the parent (3) 1 (6) 163 0 0 0 0
Non-controlling interests 0 0 0 0 0 0 0 0
(Loss)/profit for the period (194) (271) (638) (462) 258 139 142 223
(Loss)/profit attributable to equity holders of the parent (193) (266) (639) (454) 258 144 140 230
Non-controlling interests (1) (4) 1 (7) (1) (4) 1 (7)
Earnings per share, EUR (for profit/(loss) attributable to equity holders of the parent)
Basic earnings per share
Continuing operations (0.03) (0.05) (0.11) (0.11) 0.05 0.03 0.03 0.04
Discontinued operations 0.00 0.00 0.00 0.03 0.00 0.00 0.00 0.00
(Loss)/profit for the period (0.03) (0.05) (0.11) (0.08) 0.05 0.03 0.03 0.04
Diluted earnings per share
Continuing operations (0.03) (0.05) (0.11) (0.11) 0.05 0.03 0.02 0.04
Discontinued operations 0.00 0.00 0.00 0.03 0.00 0.00 0.00 0.00
(Loss)/profit for the period (0.03) (0.05) (0.11) (0.08) 0.05 0.03 0.02 0.04
Average number of shares ('000 shares)
Basic
Continuing operations 5 598 710 5 587 556 5 597 426 5 585 599 5 598 710 5 587 556 5 597 426 5 585 599
Discontinued operations 5 598 710 5 587 556 5 597 426 5 585 599 5 598 710 5 587 556 5 597 426 5 585 599
(Loss)/profit for the period 5 598 710 5 587 556 5 597 426 5 585 599 5 598 710 5 587 556 5 597 426 5 585 599
Diluted
Continuing operations 5 598 710 5 587 556 5 597 426 5 585 599 5 620 597 5 603 494 5 623 864 5 605 036
Discontinued operations 5 598 710 5 603 494 5 597 426 5 605 036 5 620 597 5 603 494 5 623 864 5 605 036
(Loss)/profit for the period 5 598 710 5 587 556 5 597 426 5 585 599 5 620 597 5 603 494 5 623 864 5 605 036
Consolidated income statement (condensed, unaudited)
EUR million

32 © 2019 Nokia
EUR millionJune 30,
2019
June 30,
2018
December
31, 2018
June 30,
2019
June 30,
2018
December
31, 2018ASSETS SHAREHOLDERS' EQUITY AND LIABILITIESGoodwill 5 477 5 384 5 452 Share capital 246 246 246Other intangible assets 2 889 3 646 3 353 Share issue premium 428 417 436Property, plant and equipment 1 782 1 782 1 790 Treasury shares (368) (417) (408)Right-of-use assets (note 12) 864 0 0 Translation differences (506) (704) (592)Investments in associated companies and joint ventures 142 122 145 Fair value and other reserves 891 1 062 1 063Non-current financial investments (note 8) 748 673 690 Reserve for invested unrestricted equity 15 596 15 589 15 606Deferred tax assets (note 6) 5 266 4 875 4 911 Accumulated deficit (1 988) (1 174) (1 062)Other non-current financial assets (note 8) 409 345 373 Total capital and reserves attributable to equity holders of the 14 298 15 020 15 289Defined benefit pension assets (note 5) 4 400 4 248 4 224 Non-controlling interests 79 70 82Other non-current assets 265 307 308 Total equity 14 377 15 089 15 371Non-current assets 22 242 21 383 21 246 Long-term interest-bearing liabilities (notes 8, 10) 3 949 2 768 2 826Inventories 3 606 2 937 3 168 Long-term lease liabilities (note 12) 748 3 2Trade receivables (note 8) 4 777 4 847 4 856 Deferred tax liabilities (note 6) 294 399 350Contract assets 1 712 1 727 1 875 Defined benefit pension and post-retirement liabilities (note 5) 4 755 4 275 4 327Prepaid expenses and accrued income 1 138 1 109 1 024 Contract liabilities 1 007 1 168 1 113
Social security, VAT and other indirect taxes 652 575 514 Deferred revenue and other long-term liabilities 787 1 667 852Divestment related receivables 47 75 67 Deferred revenue 692 847 770Other 439 460 443 Other (note 8) 95 820 82
Current income tax assets 364 492 227 Provisions (note 9) 592 688 572Other current financial assets (note 8) 287 245 243 Non-current liabilities 12 133 10 967 10 042Current financial investments (note 8) 95 867 612 Short-term interest-bearing liabilities (notes 8, 10) 337 946 994Cash and cash equivalents (note 8) 4 693 4 993 6 261 Short-term lease liabilities (note 12) 223 0 0Current assets 16 673 17 218 18 266 Other financial liabilities (note 8) 819 249 891Assets held for sale 8 40 5 Current income tax liabilities 207 288 268Total assets 38 923 38 642 39 517 Trade payables (note 8) 3 894 3 900 4 773
Contract liabilities 2 606 2 454 2 383Accrued expenses, deferred revenue and other liabilities 3 488 3 764 3 940
Deferred revenue 155 155 155Salaries, wages and social charges 1 213 1 215 1 426Other 2 120 2 394 2 359
Provisions (note 9) 838 985 855Current liabilities 12 412 12 585 14 104Total shareholders' equity and liabilities 38 923 38 642 39 517
Interest-bearing liabilities, EUR million 4 286 3 714 3 820Shareholders' equity per share, EUR 2.55 2.69 2.73Number of shares (1 000 shares, excluding treasury shares) 5 598 710 5 587 554 5 593 162
Consolidated statement of financial position (condensed, unaudited)

33 © 2019 Nokia
Consolidated statement of cash flows (condensed, unaudited)EUR million Q2'19 Q2'18 Q1-Q2'19 Q1-Q2'18
Cash flow from operating activities
Loss for the period (194) (271) (638) (462)
Adjustments 747 525 1 198 886
Depreciation and amortization 413 360 820 732
Restructuring charges 193 24 319 155
Financial income and expenses 174 70 228 84
Income tax benefit (46) (12) (187) (177)
Other 13 83 18 92
Change in net working capital
(Increase)/decrease in receivables1 (255) (179) 126 372
Increase in inventories (113) (135) (392) (303)
Decrease in non-interest-bearing liabilities1 (932) (665) (1 567) (1 075)
Cash used in operations (747) (725) (1 273) (582)
Interest received 10 18 26 42
Interest paid (15) (27) (75) (116)
Income taxes paid, net (164) (100) (341) (288)
Net cash used in operating activities (916) (834) (1 663) (944)
Cash flow from investing activities
Purchase of property, plant and equipment and intangible assets (131) (104) (306) (364)
Proceeds from sale of property, plant and equipment and intangible assets 11 8 11 20
Acquisition of businesses, net of cash acquired 0 (19) 0 (31)
Proceeds from disposal of businesses, net of disposed cash 10 0 19 0
Purchase of current financial investments (44) (343) (349) (1 179)
Proceeds from maturities and sale of current financial investments 477 799 869 1 219
Purchase of non-current financial investments (57) (29) (77) (48)
Proceeds from sale of non-current financial investments 52 32 81 61
Payment of other long-term loans receivable (22) 0 (22) 0
Other 3 (2) 3 0
Net cash from/(used in) investing activities 299 342 229 (322)
Cash flow from financing activities
Purchase of equity instruments of subsidiaries 0 0 (1) 0
Proceeds from long-term borrowings 250 45 999 75
Repayment of long-term borrowings (534) (5) (765) (17)
Proceeds/(repayment of) short-term borrowings 104 (99) 85 (100)
Payment of lease liabilities (63) 0 (127) 0
Dividends paid (248) (935) (249) (950)
Net cash used in financing activities (491) (994) (58) (992)
Translation differences (61) (76) (76) (118)
Net decrease in cash and cash equivalents (1 169) (1 562) (1 568) (2 376)
Cash and cash equivalents at beginning of period 5 862 6 555 6 261 7 369
Cash and cash equivalents at end of period 4 693 4 993 4 693 4 993