Embed Size (px)
Citation preview

Conference Call on Q3/2019 results
Hannover, 6 November 2019

2 Conference Call on Q3/2019 results
23Appendix 6
18Outlook 20195
14Investments4
12Life & Health reinsurance3
7Property & Casualty reinsurance2
2Group overview1
Agenda

3 Conference Call on Q3/2019 results
Group net income increase of 38% outpaces top-line growth
RoE well above target, notwithstanding the increase in equity by 22%
Figures in EUR millions, unless otherwise stated
GWP NPE EBIT Group net income F/x-adj. +13.3% F/x-adj. +10.3%
Growth driven by increased demand for reinsurance Supported by strong investment income and significantly increased result in L&H
• Satisfying EBIT margin (9.9%) supported
by strong investment result
• C/R of 98.6% above maximum target of 97% due to
higher losses and conservative reserving
• Strong premium growth (f/x-adj. +17.5%) driven by
diversified growth in traditional business and
Structured R/I
• Strong earnings contribution based on overall
favourable underlying profitability as well as positive
one-off effect in Q2/2019 and absence of recapture
charges for US mortality business in Q3/2019 lead
to an EBIT increase of 207%
• Premium growth (f/x-adj. +5.8%) mainly from Asia
• RoI from AuM: 3.5% exceeds minimum target
(≥ 2.8%)
• Ordinary investment income increased by 4.8%
• AuM up by 13.3% to more than EUR 47 bn.
P&C R/I L&H R/I Investments
13.7%Return on Equity
Well above minimum target of 9.4%
EUR 88.97Book value per share
+22.3% driven by strong earnings
and increased valuation reserves
245%Solvency II ratio
30.06.2019
NII: 1,332 m.EBIT: 478 m.EBIT: 919 m.
12,77414,391
Q1-3/2018 Q1-3/2019
1,1571,395
Q1-3/2018 Q1-3/2019
7251,003
Q1-3/2018 Q1-3/2019
14,99217,393
Q1-3/2018 Q1-3/2019
+16.0% +12.7% +20.6% +38.3%
| 1 Group overview | 2 | 3 | 4 | 5 | 6 |
4 Conference Call on Q3/2019 results
Increased result from Life & Health and favourable investment income
Tax ratio supported by one-off tax-privileged investment gains
Group figures in m. EUR Q3/2018 Q3/2019 Δ Q1-3/2018 Q1-3/2019 Δ
Gross written premium 5,007 5,699 +13.8% 14,992 17,393 +16.0%
Net premium earned 4,428 5,036 +13.7% 12,774 14,391 +12.7%
Net underwriting result (204) (145) -29.0% (104) (181) +75.0%
- Incl. funds withheld (155) (91) -41.2% 60 (33) -156.0%
Net investment income 412 466 +13.2% 1,155 1,332 +15.3%
- From assets under own mgmt. 362 412 +13.8% 992 1,184 +19.4%
- From funds withheld 49 54 +8.9% 163 148 -9.5%
Other income and expenses 42 132 - 105 245 +132.4%
Operating profit/loss (EBIT) 250 453 +81.4% 1,157 1,395 +20.6%
Financing costs (20) (21) +4.5% (58) (64) +9.7%
Net income before taxes 229 432 +88.2% 1,099 1,332 +21.2%
Taxes (37) (59) +61.2% (310) (266) -14.3%
Net income 193 373 +93.4% 789 1,066 +35.1%
- Non-controlling interests 23 32 +41.1% 64 63 -1.1%
Group net income 170 341 +100.4% 725 1,003 +38.3%
Retention 89.7% 90.2% 90.8% 90.5%
EBIT margin (EBIT/Net premium earned) 5.6% 9.0% 9.1% 9.7%
Tax ratio 16.1% 13.8% 28.2% 20.0%
Earnings per share (in EUR) 1.41 2.82 6.01 8.32
| 1 Group overview | 2 | 3 | 4 | 5 | 6 |

5 Conference Call on Q3/2019 results
Very strong operating cash flow fuels growth of AuM (+13.3%)
AuM growth further supported by increase in valuation reserves and currency effects
39,347
41,79340,057
42,197
47,803
2015 2016 2017 2018 Q1-3/2019
Operating cash flow in m. EUR
689
284 389627 709
159
463519
390
821
952910 561
692
941
1,305
674
225
515
2015 2016 2017 2018 2019Q1 Q2 Q3 Q4
3,105
2,331
1,694
2,225
Assets under own management (AuM) in m. EUR
2,470
| 1 Group overview | 2 | 3 | 4 | 5 | 6 |

6 Conference Call on Q3/2019 results
Shareholders' equity up by 22%
Driven by profits and asset valuation
Policyholders' surplus in m. EUR
8,0688,997
8,528 8,777
10,730
709
743758
765
826
1,490
1,4911,492
1,493
1,494
2015 2016 2017 2018 Q1-3/2019
Shareholders' equity Non-controlling interests Hybrid
Change in shareholders' equity in m. EUR
10,26710,779
11,231 11,035
13,050
10,730
8,777
1,003
(633)
1,280303
Shareholders'equity
31.12.2018
Netincome
Dividendpayment
Change inunrealised
gains/losses
Currencytranslationand other
Shareholders'equity
30.09.2019
| 1 Group overview | 2 | 3 | 4 | 5 | 6 |

7 Conference Call on Q3/2019 results
23Appendix 6
18Outlook 20195
14Investments4
12Life & Health reinsurance3
7Property & Casualty reinsurance2
2Group overview1
Agenda

8 Conference Call on Q3/2019 results
Strong growth based on increasing demand for reinsurance worldwide
Satisfactory results despite high large loss experience in Q3
Property & Casualty R/I in m. EUR Q3/2018 Q3/2019 Q1-3/2018 Q1-3/2019
Gross written premium 3,190 3,806 9,658 11,653
Net premium earned 2,842 3,318 8,017 9,282
Net underwriting result
incl. funds withheld38 (70) 259 125
Combined ratio
incl. interest on funds withheld98.7% 102.1% 96.8% 98.6%
Net investment income from
assets under own management271 292 757 768
Other income and expenses 6 40 (13) 26
Operating profit/loss (EBIT) 315 262 1,004 919
Tax ratio 17.6% 8.3% 26.8% 23.6%
Group net income 238 209 672 640
Earnings per share (in EUR) 1.97 1.73 5.58 5.31
YTD
• GWP f/x-adjusted +17.5%, growth from traditional reinsurance as well as
Structured R/I
• NPE f/x-adjusted +13.1%
• After heavy losses in Q3/2019 we are still within the budget for Q1-3/2019 of
EUR 665 m.; large losses totalled EUR 546 m. (5.9% of NPE)
• High loss burden, negative development of Typhoon Jebi and conservative
reserving impacted the combined ratio
• Increase in net investment income driven by strong ordinary investment result
• EBIT margin of 9.9% slightly below target of 10%
• Tax ratio slightly lower due to tax-privileged disposal gains from real estate and
disposal of participation
| 1 | 2 Property & Casualty reinsurance | 3 | 4 | 5 | 6 |

9 Conference Call on Q3/2019 results
291
863
1,730
662724
559
714
846
1,7901,722
740
240
662
981
478
578
426573 627
1,127
850
546
2009 2010 2011 2012 2013 2014 2015 2016 2017 2018 Q1-3/2019
Gross
Net
Large loss budget (net)
Significantly increased large-loss experience in Q3/2019…
…after a very benign 1H/2019
Natural and man-made catastrophe losses1) in m. EUR
1) Up to 2011 claims over EUR 5 m. gross, from 2012 onwards claims over EUR 10 m. gross
Natural and man-made catastrophe losses in % of Property & Casualty premium
5% 5% 14% 12% 25% 16% 9% 7% 9% 8% 7% 6% 8% 7% 9% 8% 17% 12% 14% 8% 6% 6%
Large loss budget (net) in m. EUR
450 500 530 560 625 670 690 825 825 825 875
| 1 | 2 Property & Casualty reinsurance | 3 | 4 | 5 | 6 |
10 Conference Call on Q3/2019 results
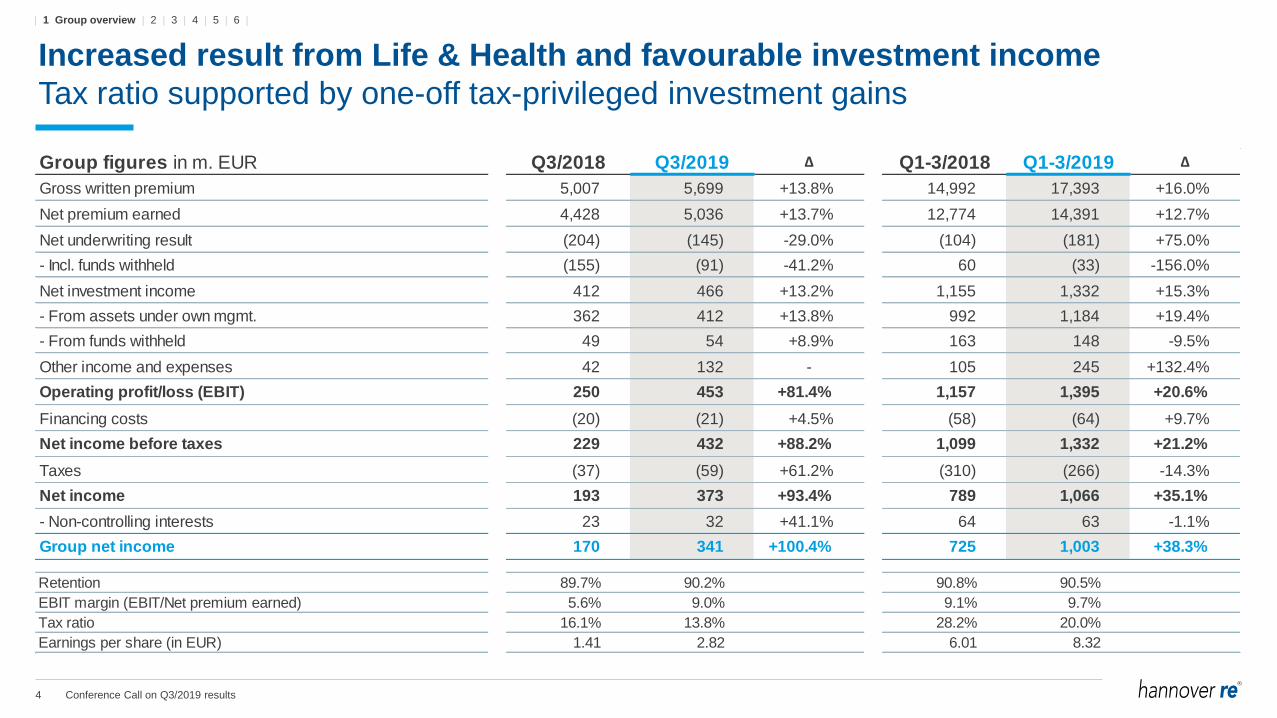
1) Natural catastrophes and other major losses in excess of EUR 10 m. gross
Catastrophe losses1)
in m. EUR Date Gross Net
Earthquake, Chile 19 - 20 Jan 10.6 10.6
Flood, Australia 26 Jan - 7 Feb 37.2 28.3
Storm "Eberhard", Germany 10 - 11 Mar 17.3 11.3
Storm / flood, USA 12 - 13 Mar 15.2 14.1
Hailstorm "Jörn", Germany 10 Jun 15.5 10.7
Hurricane "Dorian", Bahamas, USA 1 Sep 207.7 186.6
Typhoon "Faxai", Japan 8 Sep 167.2 75.9
7 Natural catastrophes 470.8 337.5
1 Marine claim 16.1 7.8
2 Aviation claims 87.7 39.0
3 Property claims 52.6 49.2
1 Credit claim 112.4 112.4
14 Major losses 739.7 545.9
Remaining budget for the 4th quarter: 330 m. EUR
| 1 | 2 Property & Casualty reinsurance | 3 | 4 | 5 | 6 |

11 Conference Call on Q3/2019 results
98.6%
78.0%
109.4%
106.0%
87.0%
98.2%
123.3%
96.1%
96.9%
90.4%
104.6%
96.8%
0% 20% 40% 60% 80% 100% 120%
Total
Aviation and Marine
UK, Ireland, London market
Credit, surety and political risks
Latin America, Iberian Peninsula
Continental Europe, Africa
Cat XL
Facultative R/I and direct
Asia, Australia, Middle East
Germany
North America
Structured R/I and ILS
Higher loss experience and conservative reserving…
…lead to a Combined Ratio above target
1) All lines of Property & Casualty reinsurance except those stated separately
Lines of business ordered by GWP
EBIT marginQ1-3/2019: Combined Ratio vs. Target Combined Ratio
5.0%
8.8%
17.5%
11.4%
15.3%
-8.9%
13.8%
1.4%
1.3%
35.9%
9.9%
Target Combined RatioCombined Ratio
1)
1)
1)
1)
1)
1)
19.9%
| 1 | 2 Property & Casualty reinsurance | 3 | 4 | 5 | 6 |

12 Conference Call on Q3/2019 results
23Appendix 6
18Outlook 20195
14Investments4
12Life & Health reinsurance3
7Property & Casualty reinsurance2
2Group overview1
Agenda

13 Conference Call on Q3/2019 results
Strong earnings contribution from Life & Health reinsurance…
…US mortality performance is slightly better than expected
Life & Health R/I in m. EUR Q3/2018 Q3/2019 Q1-3/2018 Q1-3/2019
Gross written premium 1,817 1,894 5,335 5,740
Net premium earned 1,586 1,717 4,757 5,109
Net underwriting result
incl. funds withheld(193) (20) (199) (159)
Net investment income from
assets under own management91 119 232 414
Other income and expenses 38 93 122 222
Operating profit/loss (EBIT) (64) 192 155 478
EBIT margin (4.0%) 11.2% 3.3% 9.4%
Tax ratio 18.0% 23.8% 39.3% 15.1%
Group net income (54) 145 93 403
Earnings per share (in EUR) -0.45 1.20 0.77 3.34
YTD
• GWP f/x-adjusted +5.8%, mainly from Asia
• NPE f/x-adjusted growth +5.6%
• Result from US mortality improved significantly due to in-force management
actions. Technical result still negatively impacted by Australian disability
business and UK mortality business in 1H/2019
• Extraordinary gain from restructuring of participation in Q2/2019 (EUR 99.5 m.).
Favourable ordinary investment income and change in fair value of financial
instruments
• Other income and expenses mainly the result of strong contribution from deposit
accounted treaties in US Financial Solutions in amount of EUR 211 m. (Q1-
3/2018: EUR 144 m.)
• EBIT growth far above target
• Low tax ratio due to tax-reduced investment gains
| 1 | 2 | 3 Life & Health reinsurance | 4 | 5 | 6 |
14 Conference Call on Q3/2019 results
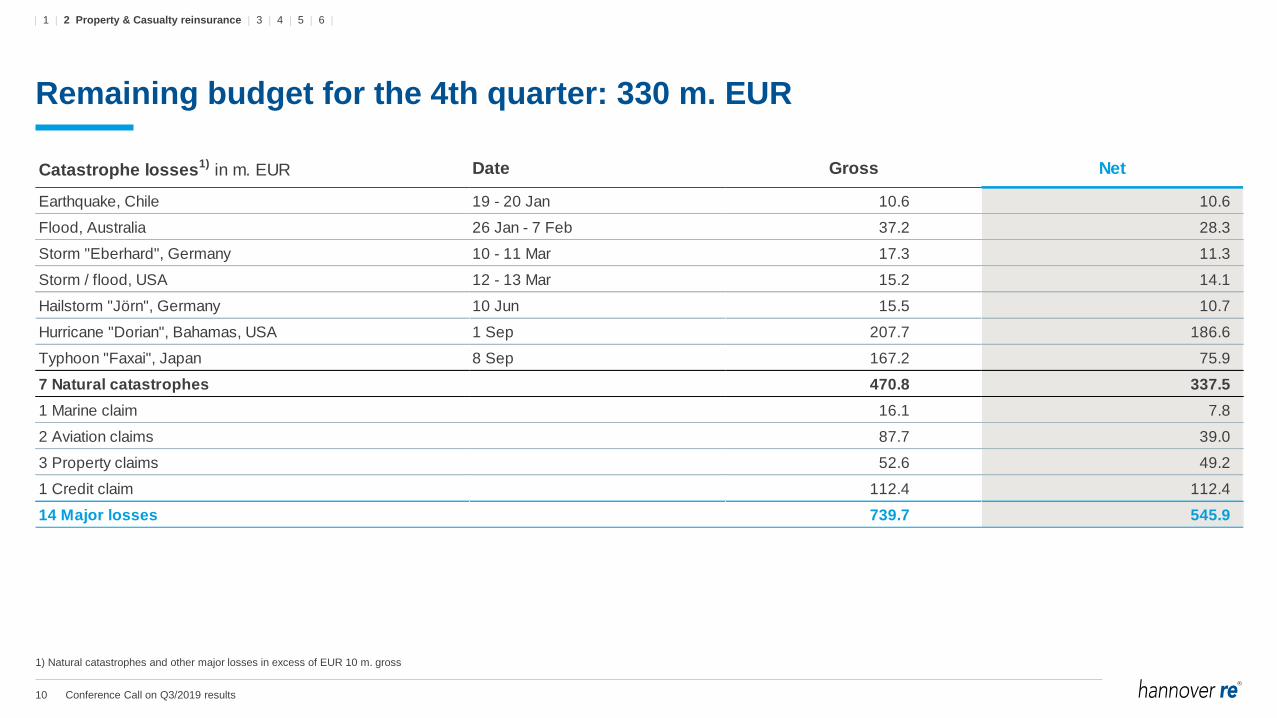
23Appendix 6
18Outlook 20195
14Investments4
12Life & Health reinsurance3
7Property & Casualty reinsurance2
2Group overview1
Agenda

15 Conference Call on Q3/2019 results
Very pleasing ordinary investment income
Realisations driven by one-off in L&H and profitable real estate transactions
1) Incl. results from associated companies
in m. EUR Q3/2018 Q3/2019 Q1-3/2018 Q1-3/2019 RoI
Ordinary investment income1) 360 349 994 1,051 3.1%
Realised gains/losses 47 72 101 200 0.6%
Impairments/appreciations & depreciations (16) (12) (37) (53) -0.2%
Change in fair value of financial
instruments (through P&L)0 33 20 77 0.2%
Investment expenses (29) (30) (86) (90) -0.3%
NII from assets under own management 362 412 992 1,184 3.5%
NII from funds withheld 49 54 163 148
Total net investment income 412 466 1,155 1,332
31 Dec 18 30 Sep 19
On-balance sheet 500 2,281
thereof Fixed income AFS 91 1,808
Off-balance sheet 498 500
thereof Fixed income HTM, L&R 227 287
Total 998 2,781
Unrealised gains/losses of investments
YTD
• Rise in ordinary income from fixed-income securities and real estate
as well as strong results from private equity investments
• Realised gains driven by restructuring of participation in L&H and
disposals of two real estate objects
• RoI excl. L&H one-off effect still at a pleasing 3.2%
• Positive development of fair value changes through P&L mostly due to
financial derivatives
• Significant rise in valuation reserves due to lower EUR, USD and GBP
yields as well as lower credit spreads on corporates
| 1 | 2 | 3 | 4 Investments | 5 | 6 |

16 Conference Call on Q3/2019 results
Ordinary investment income well supported by alternative asset classes
Slightly more defensive credit quality offset by shifts towards emerging markets
1) Economic view based on market values without outstanding commitments for Private Equity and Alternative Real Estate as well as fixed-income investments of EUR 1,427.1 m. (EUR 1,326.4 m.) as at 30 September 2019
2) Of which Pfandbriefe and Covered Bonds = 68.6%
3) Before real estate-specific costs. Economic view based on market values as at 30 September 2019
Ordinary investment income split
Governments21%
Semi-governments
13%
Corporates33%
Pfandbriefe, Covered
Bonds, ABS6%
Private Equity10%
Real estate3)
13%
Others2%
Short-term investments &
cash2%
EUR 1,051 m.
Asset allocation1)
Investment category 2015 2016 2017 2018 30 Sep 2019
Fixed-income securities 87% 87% 87% 87% 86%
- Governments 26% 28% 30% 35% 34%
- Semi-governments 17% 18% 17% 16% 16%
- Corporates 34% 33% 32% 29% 30%
Investment grade 30% 28% 27% 25% 26%
Non-investment grade 4% 4% 5% 4% 4%
- Pfandbriefe, Covered bonds, ABS 10% 9% 8% 7% 7%
Equities 3% 4% 2% 2% 2%
- Listed equity 1% 2% <1% <1% <1%
- Private equity 2% 2% 2% 2% 2%
Real estate/real estate funds 4% 5% 5% 6% 5%
Others 1% 1% 1% 1% 2%
Short-term investments & cash 5% 4% 4% 4% 4%
Total market values in bn. EUR 39.8 42.3 40.5 42.7 48.3
2)
| 1 | 2 | 3 | 4 Investments | 5 | 6 |

17 Conference Call on Q3/2019 results
Business group Key figures Targets for 2019 Q1-3/2019
Group Return on investment1) ≥ 2.8% 3.5%
Return on equity2) ≥ 9.4% 13.7%
Earnings per share growth (y-o-y) ≥ 5% 38.3%
Economic value creation3) ≥ 6.4% n.a.
Solvency ratio4) ≥ 200% 245.0%
Property & Casualty R/I Gross premium growth5) 3 - 5% 17.5%
Combined ratio6) ≤ 97% 98.6%
EBIT margin7) ≥ 10% 9.9%
xRoCA8) ≥ 2% n.a.
Life & Health R/I Gross premium growth9) 3 - 5% 5.8%
Value of New Business (VNB)10) ≥ EUR 220 m. n.a.
EBIT growth11) ≥ 5% 207.7%
xRoCA8) ≥ 2% n.a.
Target Matrix
Most targets achieved in Q1-3/2019
1) Excl. effects from ModCo derivatives 2) After tax; target: 900 bps above 5-year average return of 10-year German government bonds
3) Growth in economic equity + paid dividend; target: 600 bps above 5-year average return of 10-year German government bonds 4) According to our internal capital model and Solvency II requirements as of 30 June 2019
5) On average throughout the R/I cycle at constant f/x rates 6) Incl. large loss budget of EUR 875 m.
7) EBIT/net premium earned 8) Excess return on allocated economic capital
9) Organic growth only; target: annual average growth over a 3-year period, at constant f/x rates 10) Based on Solvency II principles; pre-tax reporting
11) Annual average growth over a 3-year period
| 1 | 2 | 3 | 4 Investments | 5 | 6 |

18 Conference Call on Q3/2019 results
23Appendix 6
18Outlook 20195
14Investments4
12Life & Health reinsurance3
7Property & Casualty reinsurance2
2Group overview1
Agenda

19 Conference Call on Q3/2019 results
Improved Guidance for 2019
Hannover Re Group
• Gross written premium1) ~ 10% growth
• Return on investment2) 3) 5) at least 3.2%
• Group net income2) 5) > EUR 1.25 bn.
• Ordinary dividend payout ratio4) 35% - 45%
• Special dividend additional payout if profit target is reached and capitalisation remains comfortable
1) At unchanged f/x rates
2) Subject to no major distortions in capital markets and/or major losses in 2019 not exceeding the large loss budget of EUR 875 m.
3) Excluding effects from ModCo derivatives
4) Relative to group net income according to IFRS
5) Including positive one-off effect in L&H of ~EUR 100 million
| 1 | 2 | 3 | 4 | 5 Outlook 2019 | 6 |

20 Conference Call on Q3/2019 results
Reporting categories Volume1)
Profitability2)
Structured reinsurance and ILS +/-
North America3) +/-
Germany3) +
Asia, Australia, Middle East3) +/-
Facultative reinsurance and direct +
Cat XL -
Continental Europe, Africa3) +/-
Latin America, Iberian Peninsula3) +
Credit, surety and political risks +/-
UK, Ireland, London market3) -
Aviation and Marine +/-
Overall profitability in line with margin requirements in Property & Casualty
Financial year 2019
1) In EUR, development in original currencies can be different
2) ++ = well above CoC; + = above CoC; +/- = CoC earned; - = below Cost of Capital (CoC)
3) All lines of business except those stated separately
Lines of business ordered by GWP
| 1 | 2 | 3 | 4 | 5 Outlook 2019 | 6 |

21 Conference Call on Q3/2019 results
Improved profitability in L&H due to reduced burden from US mortality business
Financial year 2019
1) In EUR, development in original currencies can be different
2) ++ = well above CoC; + = above CoC; +/- = CoC earned; - = below Cost of Capital (CoC)
Reporting categories Volume1)
Profitability2)
Financial solutions ++
Longevity +
Mortality +/-
Morbidity +/-
| 1 | 2 | 3 | 4 | 5 Outlook 2019 | 6 |

22 Conference Call on Q3/2019 results
Guidance for 2020
Hannover Re Group
• Gross written premium1) ~ 5% growth
• Return on investment2) 3) ~ 2.7%
• Group net income2) ~ EUR 1.2 bn.
• Ordinary dividend payout ratio4) 35% - 45%
• Special dividend additional payout if profit target is reached and capitalisation remains comfortable
1) At unchanged f/x rates
2) Subject to no major distortions in capital markets and/or major losses in 2020 not exceeding the large loss budget of EUR 975 m.
3) Excluding effects from ModCo derivatives
4) Relative to group net income according to IFRS
| 1 | 2 | 3 | 4 | 5 Outlook 2019 | 6 |

23 Conference Call on Q3/2019 results
23Appendix 6
18Outlook 20195
14Investments4
12Life & Health reinsurance3
7Property & Casualty reinsurance2
2Group overview1
Agenda

24 Conference Call on Q3/2019 results
Our strategic business groups at a glance
Q1-3/2019 vs. Q1-3/2018
in m. EUR Q1-3/2018 Q1-3/2019 Q1-3/2018 Q1-3/2019 Q1-3/2018 Q1-3/2019
Gross written premium 9,658 11,653 5,335 5,740 14,992 17,393
Change in GWP - +20.7% - +7.6% - +16.0%
Net premium earned 8,017 9,282 4,757 5,109 12,774 14,391
Net underwriting result 233 92 (336) (272) (104) (181)
Net underwriting result incl. funds withheld 259 125 (199) (159) 60 (33)
Net investment income 784 802 369 528 1,155 1,332
From assets under own management 757 768 232 414 992 1,184
From funds withheld 27 34 137 114 163 148
Other income and expenses (13) 26 122 222 105 245
Operating profit/loss (EBIT) 1,004 919 155 478 1,157 1,395
Financing costs (0) (2) 0 (1) (58) (64)
Net income before taxes 1,004 917 155 477 1,099 1,332
Taxes (269) (216) (61) (72) (310) (266)
Net income 735 701 94 405 789 1,066
Non-controlling interest 62 61 1 2 64 63
Group net income 672 640 93 403 725 1,003
Retention 90.9% 90.8% 90.6% 89.9% 90.8% 90.5%
Combined ratio (incl. interest on funds withheld) 96.8% 98.6% - - - -
EBIT margin (EBIT / Net premium earned) 12.5% 9.9% 3.3% 9.4% 9.1% 9.7%
Tax ratio 26.8% 23.6% 39.3% 15.1% 28.2% 20.0%
Earnings per share (in EUR) 5.58 5.31 0.77 3.34 6.01 8.32
Property & Casualty R/I Life & Health R/I Total
| 1 | 2 | 3 | 4 | 5 | 6 Appendix |

25 Conference Call on Q3/2019 results
Our strategic business groups at a glance
Q3/2019 vs. Q3/2018
in m. EUR Q3/2018 Q3/2019 Q3/2018 Q3/2019 Q3/2018 Q3/2019
Gross written premium 3,190 3,806 1,817 1,894 5,007 5,699
Change in GWP - +19.3% - +4.2% - +13.8%
Net premium earned 2,842 3,318 1,586 1,717 4,428 5,036
Net underwriting result 28 (81) (232) (63) (204) (145)
Net underwriting result incl. funds withheld 38 (70) (193) (20) (155) (91)
Net investment income 281 303 130 162 412 466
From assets under own management 271 292 91 119 362 412
From funds withheld 10 11 39 43 49 54
Other income and expenses 6 40 38 93 42 132
Operating profit/loss (EBIT) 315 262 (64) 192 250 453
Financing costs (0) (1) 0 0 (20) (21)
Net income before taxes 315 262 (64) 191 229 432
Taxes (55) (22) 12 (45) (37) (59)
Net income 259 240 (53) 146 193 373
Non-controlling interest 21 31 1 1 23 32
Group net income 238 209 (54) 145 170 341
Retention 89.9% 89.4% 89.4% 91.8% 89.7% 90.2%
Combined ratio (incl. interest on funds withheld) 98.7% 102.1% - - - -
EBIT margin (EBIT / Net premium earned) 11.1% 7.9% (4.0%) 11.2% 5.6% 9.0%
Tax ratio 17.6% 8.3% 18.0% 23.8 % 16.1% 13.8%
Earnings per share (in EUR) 1.97 1.73 (0.45) 1.20 1.41 2.82
Property & Casualty R/I Life & Health R/I Total
| 1 | 2 | 3 | 4 | 5 | 6 Appendix |

26 Conference Call on Q3/2019 results
Stress tests on assets under own management
Unchanged focus on yields and credit risks
As at 30 September 2019
Portfolio Scenario
Change in market
value
in m. EUR
Change in OCI before
tax
in m. EUR
-10% -109 -109
-20% -218 -218
+50 bps -1,158 -1,092
+100 bps -2,249 -2,120
Credit spreads +50% -824 -815
Equity (listed and private equity)
Fixed-income securities
| 1 | 2 | 3 | 4 | 5 | 6 Appendix |

27 Conference Call on Q3/2019 results
High-quality fixed income book well balanced
Geographical allocation mainly in accordance with our broad business diversification
IFRS figures as at 30 September 2019
GovernmentsSemi-
governmentsCorporates
Pfandbriefe,
Covered bonds,
ABS
Short-term
investments,
cash
Total
AAA 77% 56% 1% 59% - 46%
AA 13% 26% 13% 24% - 16%
A 6% 6% 29% 11% - 14%
BBB 3% 1% 48% 5% - 18%
<BBB 2% 10% 9% 1% - 6%
Total 100% 100% 100% 100% - 100%
Germany 21% 39% 4% 19% 22% 18%
UK 8% 3% 7% 10% 10% 7%
France 1% 2% 8% 5% 1% 4%
GIIPS 0% 2% 6% 6% 0% 3%
Rest of Europe 3% 12% 12% 21% 2% 9%
USA 51% 9% 34% 14% 16% 34%
Australia 2% 13% 4% 6% 6% 5%
Asia 13% 20% 15% 12% 37% 16%
Rest of World 2% 0% 10% 6% 7% 5%
Total 100% 100% 100% 100% 100% 100%
Total b/s values in m. EUR 16,273 7,391 13,700 3,291 2,103 42,759
| 1 | 2 | 3 | 4 | 5 | 6 Appendix |

28 Conference Call on Q3/2019 results
Currency allocation matches liability profile of balance sheet
Duration-neutral strategy continued; slightly longer reserve profiles
Currency split of investments
EUR30%
USD45%
GBP8%
AUD6%
CAD3%
Others9%
6.5
5.7
2.5
Modified duration
of portfolio
4.9
7.7
5.3
• Modified duration of fixed-income mainly congruent with
liabilities and currencies
• GBP’s higher modified duration predominantly due to life
business
Q3/2019 5.4
2018 4.8
2017 4.8
2016 5.0
2015 4.4
2014 4.6
Modified duration
| 1 | 2 | 3 | 4 | 5 | 6 Appendix |

29 Conference Call on Q3/2019 results
Solvency II ratio (regulatory view)
Hannover Re Group
Development of the Solvency II ratio (regulatory view)
230%
260%
246% 245%
Q4/2016 Q4/2017 Q4/2018 Q2/2019
200%
180%
Threshold
Limit
| 1 | 2 | 3 | 4 | 5 | 6 Appendix |

30 Conference Call on Q3/2019 results
This presentation does not address the investment objectives or financial situation of any particular person or legal entity.
Investors should seek independent professional advice and perform their own analysis regarding the appropriateness of
investing in any of our securities.
While Hannover Re has endeavoured to include in this presentation information it believes to be reliable, complete and up-to-
date, the company does not make any representation or warranty, express or implied, as to the accuracy, completeness or
updated status of such information.
Some of the statements in this presentation may be forward-looking statements or statements of future expectations based on
currently available information. Such statements naturally are subject to risks and uncertainties. Factors such as the
development of general economic conditions, future market conditions, unusual catastrophic loss events, changes in the capital
markets and other circumstances may cause the actual events or results to be materially different from those anticipated by
such statements.
This presentation serves information purposes only and does not constitute or form part of an offer or solicitation to acquire,
subscribe to or dispose of, any of the securities of Hannover Re.
© Hannover Rück SE. All rights reserved.
Hannover Re is the registered service mark of Hannover Rück SE.
Disclaimer
| 1 | 2 | 3 | 4 | 5 | 6 Appendix |