Embed Size (px)
Citation preview

Hannover, 4 November 2015
Conference Call on Interim Report 3/2015
Group Property & Casualty R/I Life & Health R/I Investments Outlook 2015 Appendix
Strong nine-month result
1
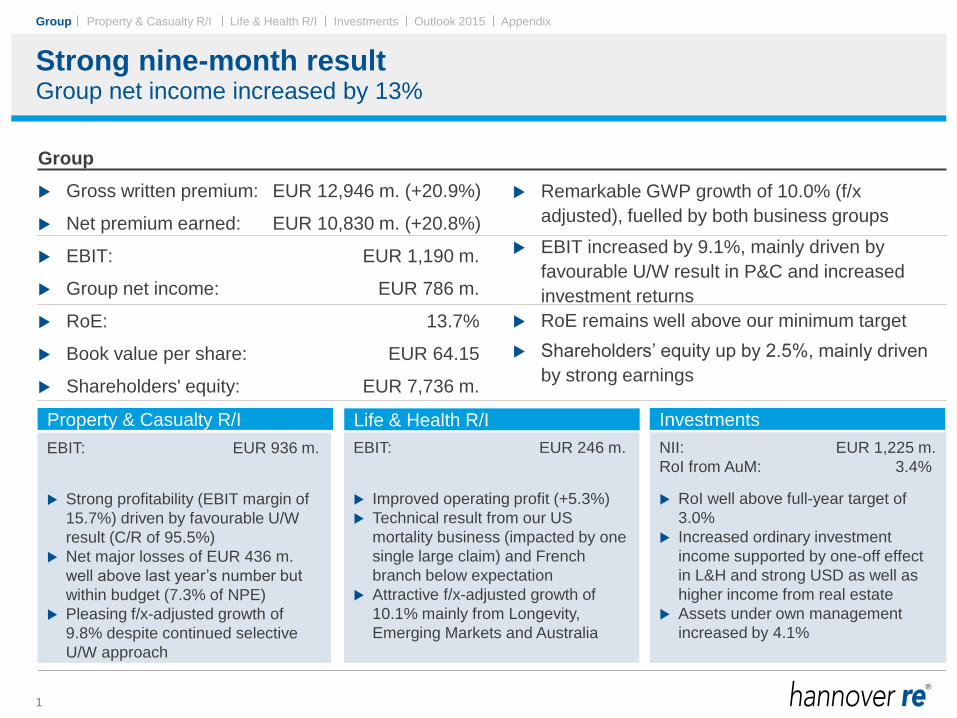
Remarkable GWP growth of 10.0% (f/x
adjusted), fuelled by both business groups
EBIT increased by 9.1%, mainly driven by
favourable U/W result in P&C and increased
investment returns
RoE remains well above our minimum target
Shareholders’ equity up by 2.5%, mainly driven
by strong earnings
Group net income increased by 13%
Property & Casualty R/I Life & Health R/I
NII: EUR 1,225 m.
RoI from AuM: 3.4%
RoI well above full-year target of
3.0%
Increased ordinary investment
income supported by one-off effect
in L&H and strong USD as well as
higher income from real estate
Assets under own management
increased by 4.1%
Investments
EBIT: EUR 936 m.
Strong profitability (EBIT margin of
15.7%) driven by favourable U/W
result (C/R of 95.5%)
Net major losses of EUR 436 m.
well above last year’s number but
within budget (7.3% of NPE)
Pleasing f/x-adjusted growth of
9.8% despite continued selective
U/W approach
EBIT: EUR 246 m.
Improved operating profit (+5.3%)
Technical result from our US
mortality business (impacted by one
single large claim) and French
branch below expectation
Attractive f/x-adjusted growth of
10.1% mainly from Longevity,
Emerging Markets and Australia
Group
Gross written premium: EUR 12,946 m. (+20.9%)
Net premium earned: EUR 10,830 m. (+20.8%)
EBIT: EUR 1,190 m.
Group net income: EUR 786 m.
RoE: 13.7%
Book value per share: EUR 64.15
Shareholders' equity: EUR 7,736 m.
Group

Group Property & Casualty R/I Life & Health R/I Investments Outlook 2015 Appendix
Pleasing operating result fuelled by both business groups
2
Remarkable increase in premiums and earnings
Group figures in m. EUR Q3/2014 Q3/2015 Q1-3/2014 Q1-3/2015
Gross written premium 3,640 4,359 10,704 12,946
Net premium earned 3,127 3,811 8,966 10,830
Net underwriting result (26) (33) (12) (73)
- Incl. funds withheld 84 63 273 220
Net investment income 414 426 1,121 1,225
- From assets under own mgmt. 303 330 836 932
- From funds withheld 110 95 285 293
Other income and expenses 20 8 (19) 38
Operating profit/loss (EBIT) 407 401 1,091 1,190
Interest on hybrid capital (22) (18) (70) (66)
Net income before taxes 385 383 1,020 1,124
Taxes (105) (114) (260) (298)
Net income 281 269 760 826
- Non-controlling interests 30 15 65 40
Group net income 251 254 695 786
Retention 85.7% 87.3% 87.0% 87.9%
EBIT margin (EBIT/Net premium earned) 13.0% 10.5% 12.2% 11.0%
Tax ratio 27.1% 29.7% 25.5% 26.5%
Earnings per share (in EUR) 2.08 2.11 5.77 6.52
YTD
GWP f/x-adjusted growth +10.0%
NPE f/x-adjusted growth +10.0%
Other income and expenses, y-o-y
improvement mainly due to positive currency
effects
EPS growth of 13.0% exceeds target of 6.5%
Group

Group Property & Casualty R/I Life & Health R/I Investments Outlook 2015 Appendix
7,736 7,551
786
(513) (302)
214
Shareholders'equity
31.12.2014
Netincome
Dividendpayment
Change inunrealised
gains / losses
Currencytranslationand other
Shareholders'equity
30.09.2015
3
Shareholders' equity increased despite dividend payment
Policyholders' surplus in m. EUR in m. EUR
Driven by strong earnings and weakening of EUR
Change in shareholders' equity
4,971 6,032 5,888
7,551 7,736
636
682 642
702 692
1,732
2,233 2,238
1,986 1,490
7,338
8,947 8,768
10,239 9,918
2011 2012 2013 2014 Q1-3/2015
Shareholders' equity Non-controlling interests Hybrid
Group

Group Property & Casualty R/I Life & Health R/I Investments Outlook 2015 Appendix
Strong cash flow driven by premium growth
4
Operating cash flow in m. EUR in m. EUR
Increase of 4.1% in AuM helped by strong USD
Assets under own management (AuM)
473 737
415 296
689
822
608
612
363
159
705 799
649
718
952
523 493
550
554
2,523 2,637
2,225
1,931 1,800
2011 2012 2013 2014 2015
Q1 Q2 Q3 Q4
28,341
31,874 31,875
36,228 37,703
2011 2012 2013 2014 Q1-3/2015
Group

Group Property & Casualty R/I Life & Health R/I Investments Outlook 2015 Appendix
Property & Casualty R/I in m. EUR Q3/2014 Q3/2015 Q1-3/2014 Q1-3/2015
Gross written premium 1,982 2,347 6,060 7,319
Net premium earned 1,734 2,071 5,104 5,965
Net underwriting result
incl. funds withheld73 87 241 268
Combined ratio
incl. interest on funds withheld95.8% 95.8% 95.3% 95.5%
Net investment income from assets
under own management243 242 632 657
Other income and expenses 10 25 (26) 12
Operating profit/loss (EBIT) 326 353 847 936
Tax ratio 25.9% 30.0% 27.5% 26.4%
Group net income 213 233 561 651
Earnings per share (in EUR) 1.77 1.93 4.65 5.40
Favourable underwriting result in a competitive environment
5
YTD
GWP f/x-adjusted growth +9.8%; mainly from
US, Asia, Speciality lines and Agro business
NPE f/x-adjusted growth +6.7%
Major losses of EUR 436 m. (7.3% of NPE)
below budget of EUR 519 m. for Q1-3/2015
Expected run-off reserves without
extraordinary effects
Increased ordinary investment income despite
low yield environment
Other income & expenses improved due to
positive currency effects
Favourable EBIT margin of 15.7%
(Q1-3/2014: 16.6%), well above target
Net income increased by 16.1%
Attractive top line growth despite continued selective underwriting approach
Property & Casualty R/I

Group Property & Casualty R/I Life & Health R/I Investments Outlook 2015 Appendix
Diversified portfolio outperforms the MtCR
6
95.3%
101.9%
71.8
111.0%
93.0%
91.1%
96.3%
97.4%
59.9%
96.4%
95.5%
0% 20% 40% 60% 80% 100% 120% 140% 160%
North America*
Continental Europe*
Marine
Aviation
Credit, surety and political risks
UK, Ireland, London market and direct
Facultative R/I
Worldwide Treaty* R/I
Cat XL
Structured R/I and ILS
Combined Ratio Q1-3/2015 vs. MtCR in %
MtCR
Target
markets
Specialty
lines
worldwide
Global
R/I
Combined Ratio
MtCR = Maximum tolerable Combined Ratio
* All lines of Property & Casualty reinsurance except those stated separately
Total
Property & Casualty R/I

Group Property & Casualty R/I Life & Health R/I Investments Outlook 2015 Appendix
2,373
121
410
672
291
863
1,730
662 724
559 568
1,070
107
285
458
240
662
981
478
578
426 436
2005 2006 2007 2008 2009 2010 2011 2012 2013 2014 Q1-3/2015
Gross Net Expected large losses (net)
Major losses below budget for Q1-3/2015
7
Remaining large loss budget (EUR 254 m.) provides comfortable cushion for Q4/15
Natural and man-made catastrophe losses1) in m. EUR
1) Up to 2011 claims over EUR 5 m. gross, from 2012 onwards claims over EUR 10 m. gross
2) 2005 - 2006 adjusted to new segmentation
Natural and man-made catastrophe losses in % of Property & Casualty premium2)
34% 2% 8% 13% 5% 14% 25% 9% 9% 7% 8%
20% 2% 6% 11% 5% 12% 16% 7% 8% 6% 7%
Expected large losses (net) in m. EUR
314 377 360 428 450 500 530 560 625 670 690
Property & Casualty R/I

Group Property & Casualty R/I Life & Health R/I Investments Outlook 2015 Appendix
High level of man-made large losses
8
Catastrophe losses* in m. EUR Date Gross Net
Storm, Northern Europe 08 - 11 Jan 10.5 7.4
Winter storm, USA 1 - 22 Feb 17.7 12.8
Cyclone "Marcia", Australia 20 Feb 12.1 8.2
Storm "Niklas", Germany, Switzerland, Austria 31 Mar - 1 Apr 37.3 28.5
Storm, Australia 19 - 25 Apr 21.8 13.7
Storm/floods, USA 24 May - 14 Jun 10.3 7.0
Storm "Siegfried", Germany 5 - 6 Jul 20.4 14.2
Storm "Erika", Caribbean 25 - 31 Aug 11.1 11.1
Earthquake, Chile 16 Sep 43.6 43.6
9 Natural catastrophes 184.8 146.5
5 Aviation claims 68.8 49.4
4 Marine claims 134.9 77.1
5 Property claims 67.6 67.6
Tianjin port explosions, China 112.4 95.9
24 Major losses 568.5 436.4
Benign large loss experience in Q1-3/2015 from NatCat
* Natural catastrophes and other major losses in excess of EUR 10 m. gross
Property & Casualty R/I
Group Property & Casualty R/I Life & Health R/I Investments Outlook 2015 Appendix
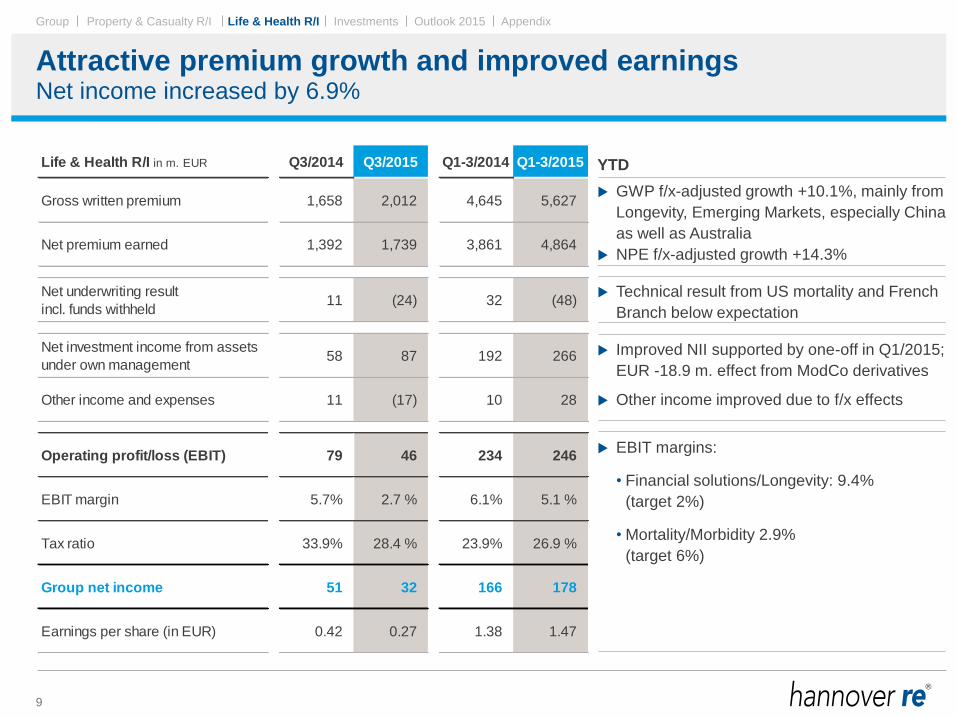
Life & Health R/I in m. EUR Q3/2014 Q3/2015 Q1-3/2014 Q1-3/2015
Gross written premium 1,658 2,012 4,645 5,627
Net premium earned 1,392 1,739 3,861 4,864
Net underwriting result
incl. funds withheld11 (24) 32 (48)
Net investment income from assets
under own management58 87 192 266
Other income and expenses 11 (17) 10 28
Operating profit/loss (EBIT) 79 46 234 246
EBIT margin 5.7% 2.7 % 6.1% 5.1 %
Tax ratio 33.9% 28.4 % 23.9% 26.9 %
Group net income 51 32 166 178
Earnings per share (in EUR) 0.42 0.27 1.38 1.47
Attractive premium growth and improved earnings
9
YTD
GWP f/x-adjusted growth +10.1%, mainly from
Longevity, Emerging Markets, especially China
as well as Australia
NPE f/x-adjusted growth +14.3%
Technical result from US mortality and French
Branch below expectation
Improved NII supported by one-off in Q1/2015;
EUR -18.9 m. effect from ModCo derivatives
Other income improved due to f/x effects
EBIT margins:
• Financial solutions/Longevity: 9.4%
(target 2%)
• Mortality/Morbidity 2.9%
(target 6%)
Net income increased by 6.9%
Life & Health R/I

Group Property & Casualty R/I Life & Health R/I Investments Outlook 2015 Appendix
Return on Investments clearly above target
10
Pleasing rise in ordinary income boosts net investment income
YTD
Significant rise in ordinary income
due to higher results from fixed-
income securities, real estate and
one-off effect from L&H business as
well as f/x effects
Realised gains driven by preparation
for change of balance sheet
currency at our Irish subsidiary
effective 1.1.2016 as well as slight
adjustments to asset allocation
Increase in regular depreciations
due to higher real estate volume
Change in fair value of financial
instruments impacted by ModCo
derivatives (EUR -18.9 m)
Valuation reserves lower than year-
end levels due to higher credit
spreads and realizations
* Incl. results from associated companies
in m. EUR Q3/2014 Q3/2015 Q1-3/2014 Q1-3/2015 RoI
Ordinary investment income* 303 318 797 921 3.3%
Realised gains/losses 49 58 137 124 0.4%
Impairments/appreciations &
depreciations(6) (9) (16) (24) -0.1%
Change in fair value of financial
instruments (through P&L)(19) (8) (9) (9) 0.0%
Investment expenses (24) (28) (74) (80) -0.3%
NII from assets under own mgmt. 304 330 836 932 3.4%
NII from funds withheld 110 95 285 293
Total net investment income 414 426 1,121 1,225
31 Dec 14 30 Sep 15
On Balance-sheet 1,724 1,336
thereof Fixed income AFS 1,246 828
Off Balance-sheet 558 505
thereof Fixed income HTM, L&R 497 430
Total 2,282 1,841
Unrealised gains/losses of investments
Investments

Group Property & Casualty R/I Life & Health R/I Investments Outlook 2015 Appendix
Increase in Governments and HY-bonds at expense of covereds
11
Moderate re-entry into listed equity
Tactical asset allocation1)
Investment category 2011 2012 2013 2014 30 Sep 15
Fixed-income securities 90% 92% 90% 90% 87%
- Governments 19% 19% 19% 21% 25%
- Semi-governments 23% 23% 20% 19% 17%
- Corporates 31% 33% 36% 36% 34%
Investment grade 29% 30% 33% 33% 30%
Non-investment grade3) 3% 3% 3% 3% 4%
- Pfandbriefe, Covered Bonds, ABS 16% 17% 15% 14% 11%
Equities 2% 2% 2% 2% 3%
- Listed <1% <1% <1% < 1 % 1%
- Private Equity 2% 2% 2% 2% 2%
Real estate/real estate funds 2% 2% 4% 4% 4%
Others3) <1% 1% 1% 1% 1%
Short-term investments & cash 5% 3% 4% 4% 5%
Total balance sheet values in bn. EUR 28.3 31.9 31.9 36.2 37.7
2)
1) Economic view based on market values without outstanding commitments for Private Equity and Alternative Real Estate as well as fixed-income investments
of EUR 864,4 m. (EUR 716.3 m.) as at 30 September 2015
2) Of which Pfandbriefe and Covered Bonds = 79.9%
3) Reallocation of High Yield Funds from Others to Corporates – Non-investment grade retrospective from 2011 onwards
Investments
Group Property & Casualty R/I Life & Health R/I Investments Outlook 2015 Appendix
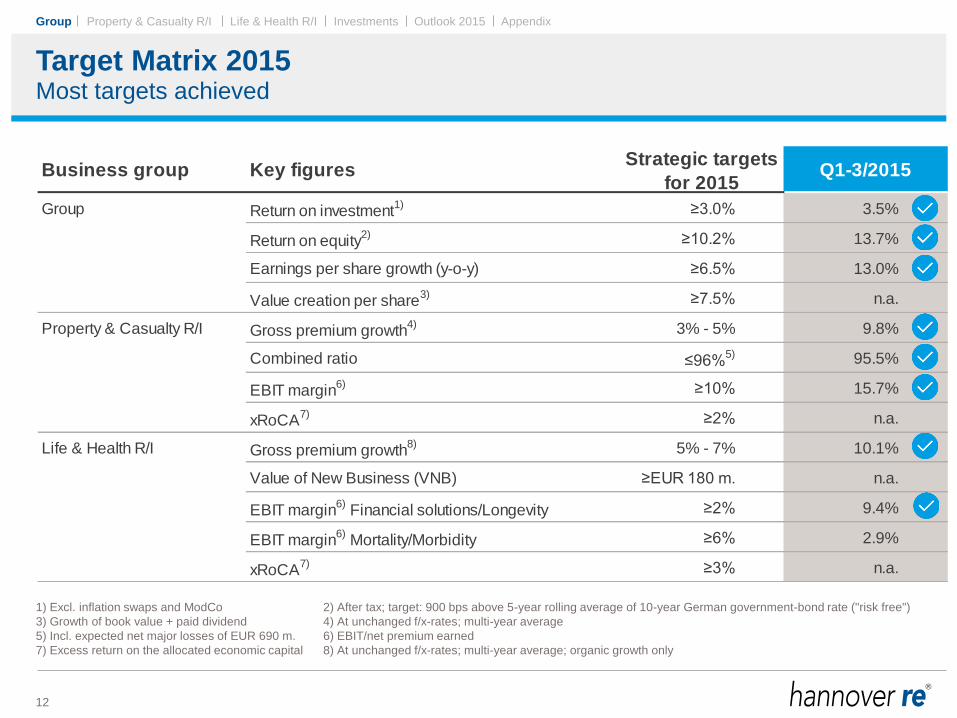
Target Matrix 2015
12
Most targets achieved
1) Excl. inflation swaps and ModCo 2) After tax; target: 900 bps above 5-year rolling average of 10-year German government-bond rate ("risk free")
3) Growth of book value + paid dividend 4) At unchanged f/x-rates; multi-year average
5) Incl. expected net major losses of EUR 690 m. 6) EBIT/net premium earned
7) Excess return on the allocated economic capital 8) At unchanged f/x-rates; multi-year average; organic growth only
Business group Key figuresStrategic targets
for 2015Q1-3/2015
Group Return on investment1) ≥3.0% 3.5%
Return on equity2) ≥10.2% 13.7%
Earnings per share growth (y-o-y) ≥6.5% 13.0%
Value creation per share3) ≥7.5% n.a.
Property & Casualty R/I Gross premium growth4) 3% - 5% 9.8%
Combined ratio ≤96%5) 95.5%
EBIT margin6) ≥10% 15.7%
xRoCA7) ≥2% n.a.
Life & Health R/I Gross premium growth8) 5% - 7% 10.1%
Value of New Business (VNB) ≥EUR 180 m. n.a.
EBIT margin6)
Financial solutions/Longevity ≥2% 9.4%
EBIT margin6)
Mortality/Morbidity ≥6% 2.9%
xRoCA7) ≥3% n.a.
Group

Outlook 2015

Group Property & Casualty R/I Life & Health R/I Investments Outlook 2015 Appendix
Guidance for 2015
13
Hannover Re Group
Gross written premium 5% - 10% premium growth
at unchanged f/x-rates
Return on investment1) 2) ~ 3.0%
Group net income1) ~ EUR 950 m.
Dividend payout ratio3) 35% - 40%
(The ratio may increase in light of capital management considerations)
1) Subject to no major distortions in capital markets and/or major losses in 2015 not exceeding the large loss budget of EUR 690 m.
2) Excluding effects from derivatives (ModCo/inflation swaps)
3) Relative to Group net income according to IFRS
Outlook 2015

Group Property & Casualty R/I Life & Health R/I Investments Outlook 2015 Appendix
Property & Casualty R/I overall profitable
14
Financial year 2015e
Lines of business Volume1)
Profitability2)
North America3) +
Continental Europe3) -
Marine ++
Aviation -
Credit, surety and political risks +
UK, Ireland, London market and direct +
Facultative R/I +/-
Worldwide Treaty R/I3) +/-
Cat XL +
Structured R/I and ILS +
Target
markets
Specialty
lines
worldwide
Global
R/I
1) In EUR; premium growth supported by strengthening of foreign currencies
2) ++ = well above CoC; + = above CoC; +/- = CoC earned; - = below Cost of Capital (CoC)
3) All lines of business except those stated separately
Outlook 2015

Group Property & Casualty R/I Life & Health R/I Investments Outlook 2015 Appendix
Increasing earnings expected for Life & Health R/I
15
Financial year 2015e
1) In EUR; premium growth supported by strengthening of foreign currencies
2) ++ = well above CoC; + = above CoC; +/- = CoC earned; - = below Cost of Capital (CoC)
Reporting categories Volume1)
Profitability2)
Financial solutions ++
Longevity +/-
Mortality +
Morbidity +/-
Financial
solutions
Risk
solutions
Outlook 2015

Group Property & Casualty R/I Life & Health R/I Investments Outlook 2015 Appendix
Guidance for 2016
16
Hannover Re Group
Gross written premium1) stable to small reduction
Return on investment2) 3) ~ 2.9%
Group net income2) ~ EUR 950 m.
Dividend pay-out ratio4) 35% - 40%
(The ratio may increase in light of capital management considerations)
New large loss budget: EUR 825 m. driven by currencies and model changes
1) At unchanged f/x rates
2) Subject to no major distortions in capital markets and/or major losses in 2016 not exceeding the large loss budget
3) Excluding effects from ModCo derivatives
4) Related to group net income according to IFRS
Outlook 2015
Appendix

Group Property & Casualty R/I Life & Health R/I Investments Outlook 2015 Appendix
Our strategic business groups at a glance
17
Q1-3/2015 vs. Q1-3/2014
in m. EUR Q1-3/2014 Q1-3/2015 Δ Q1-3/2014 Q1-3/2015 Δ Q1-3/2014 Q1-3/2015 Δ
Gross written premium 6,060 7,319 +20.8% 4,645 5,627 +21.1% 10,704 12,946 +20.9%
Net premium earned 5,104 5,965 +16.9% 3,861 4,864 +26.0% 8,966 10,830 +20.8%
Net underwriting result 225 251 +11.6% (237) (325) +36.7% (12) (73) -
Net underwritung result incl. funds withheld 241 268 +11.2% 32 (48) - 273 220 -19.5%
Net investment income 648 673 +3.9% 462 543 +17.6% 1,121 1,225 +9.2%
From assets under own management 632 657 +3.9% 192 266 +38.8% 836 932 +11.5%
From funds withheld 15 16 +5.2% 270 277 +2.5% 285 293 +2.7%
Other income and expenses (26) 12 - 10 28 +189.2% (19) 38 -
Operating profit/loss (EBIT) 847 936 +10.6% 234 246 +5.3% 1,091 1,190 +9.1%
Interest on hybrid capital (0) (0) - (0) 0 - (70) (66) -5.7%
Net income before taxes 847 936 +10.6% 234 246 +5.3% 1,020 1,124 +10.1%
Taxes (233) (247) +6.2% (56) (66) +18.4% (260) (298) +14.4%
Net income 614 689 +12.2% 178 180 +1.2% 760 826 +8.7%
Non-controlling interest 53 38 -28.5% 12 2 -81.1% 65 40 -38.0%
Group net income 561 651 +16.1% 166 178 +6.9% 695 786 +13.0%
Retention 89.6% 88.8% 83.7% 86.8% 87.0% 87.9%
Combined ratio (incl. interest on funds withheld) 95.3% 95.5% 99.2% 101.0% 97.0% 98.0%
EBIT margin (EBIT / Net premium earned) 16.6% 15.7% 6.1% 5.1% 12.2% 11.0%
Tax ratio 27.5% 26.4% 23.9% 26.9% 25.5% 26.5%
Earnings per share (in EUR) 4.65 5.40 1.38 1.47 5.77 6.52
Property & Casualty R/I Life & Health R/I Total
Appendix

Group Property & Casualty R/I Life & Health R/I Investments Outlook 2015 Appendix
Our strategic business groups at a glance
18
Q3 stand-alone
in m. EUR Q3/2014 Q3/2015 Δ Q3/2014 Q3/2015 Δ Q3/2014 Q3/2015 Δ
Gross written premium 1,982 2,347 +18.4% 1,658 2,012 +21.4% 3,640 4,359 +19.8%
Net premium earned 1,734 2,071 +19.4% 1,392 1,739 +24.9% 3,127 3,811 +21.9%
Net underwriting result 67 80 +20.2% (94) (113) +21.2% (26) (33) +25.0%
Net underwritung result incl. funds withheld 73 87 +18.7% 11 (24) - 84 63 -25.5%
Net investment income 249 248 -0.5% 162 176 +8.6% 414 426 +2.9%
From assets under own management 243 242 -0.5% 58 87 +50.1% 303 330 +8.9%
From funds withheld 6 6 +2.0% 104 89 -14.4% 110 95 -13.5%
Other income and expenses 10 25 +143.1% 11 (17) - 20 8 -60.1%
Operating profit/loss (EBIT) 326 353 +8.2% 79 46 -41.6% 407 401 -1.5%
Interest on hybrid capital (0) 0 - 0 (0) - (22) (18) -16.8%
Net income before taxes 326 353 +8.2% 79 46 -41.6% 385 383 -0.7%
Taxes (84) (106) +25.3% (27) (13) -51.2% (105) (114) +8.7%
Net income 241 247 +2.3% 52 33 -36.6% 281 269 -4.1%
Non-controlling interest 28 14 -49.9% 1 1 -33.2% 30 15 -49.1%
Group net income 213 233 +9.3% 51 32 -36.7% 251 254 +1.2%
Retention 86.6% 87.3% 84.7% 87.2% 85.7% 87.3%
Combined ratio (incl. interest on funds withheld) 95.8% 95.8% 99.2% 101.4% 97.3% 98.4%
EBIT margin (EBIT / Net premium earned) 18.8% 17.0% 5.7% 2.7% 13.0% 10.5%
Tax ratio 25.9% 30.0% 33.9% 28.4% 27.1% 29.7%
Earnings per share (in EUR) 1.77 1.93 0.42 0.27 2.08 2.11
Property & Casualty R/I Life & Health R/I Total
Appendix

Group Property & Casualty R/I Life & Health R/I Investments Outlook 2015 Appendix
Stress tests on assets under own management
19
Unchanged focus on yields and spreads while relevance of equities rises
As at 30 September 2015
Portfolio ScenarioChange in market value
in m. EUR
Change in shareholders'
equity before tax
in m. EUR
-10% -122 -122
-20% -244 -244
+50 bps -757 -657
+100 bps -1,480 -1,283
Credit spreads +50% -848 -804
-10% -148 -89
+10% 148 34
Equity (listed and private equity)
Yield curves
Real estate
Appendix

Group Property & Casualty R/I Life & Health R/I Investments Outlook 2015 Appendix
Fixed-income book well balanced
20
More than 80% rated A or better
As at 30 September 2015
GovernmentsSemi-
governmentsCorporates
Pfandbriefe,
Covered Bonds,
ABS
Short-term
investments,
cash
Total
AAA 72.0% 60.2% 1.7% 65.7% - 41.9%
AA 14.3% 35.1% 15.5% 14.4% - 18.8%
A 8.0% 3.0% 41.6% 7.5% - 19.8%
BBB 4.9% 1.3% 33.8% 7.7% - 15.6%
<BBB 0.9% 0.5% 7.4% 4.8% - 3.8%
Total 100.0% 100.0% 100.0% 100.0% - 100.0%
Germany 12.1% 42.5% 4.4% 25.9% 16.4% 16.9%
UK 7.7% 3.4% 8.2% 9.3% 5.6% 7.2%
France 3.0% 3.3% 6.6% 6.7% 1.2% 4.7%
GIIPS 1.6% 1.0% 4.3% 11.4% 0.0% 3.6%
Rest of Europe 6.3% 20.9% 16.9% 21.6% 5.9% 14.7%
USA 53.5% 7.3% 37.6% 5.2% 20.2% 31.5%
Australia 3.2% 7.7% 7.7% 10.4% 8.5% 6.8%
Asia 8.2% 2.3% 4.7% 0.0% 33.2% 6.1%
Rest of World 4.5% 11.6% 9.7% 9.5% 9.1% 8.6%
Total 100.0% 100.0% 100.0% 100.0% 100.0% 100.0%
Total b/s values in m. EUR 9,429 6,323 12,389 4,215 1,729 34,085
Appendix

Group Property & Casualty R/I Life & Health R/I Investments Outlook 2015 Appendix
Currency allocation matches liability profile of balance sheet
21
Active asset/liability management ensures durational match to a large extent
Currency split of investments
Modified duration of fixed-
income mainly congruent with
liabilities
GBP’s higher modified duration
predominantly due to life
business
Modified duration as at 30 September 2015: 4.5
Modified duration
2014 4.6
2013 4.4
2012 4.5
2011 4.2
EUR 32.1%
USD 46.2%
GBP 8.6%
AUD 5.0%
CAD 2.5%
Others 5.6%
5.2
5.1 2.0
Modified
duration of
portfolio
3.9
6.6
4.0
Appendix

Group Property & Casualty R/I Life & Health R/I Investments Outlook 2015 Appendix
Market sensitivity of inflation hedges
22
Inflation-linked bonds held as inflation hedges with volume of EUR 1,433 m
(thereof EUR 348 m.; 1,085 m. EUR of USD)
Average time to maturity 5.4 years (thereof 6.0 years EUR; 5.3 years USD)
Average hedged inflation level of 1.46 % EUR and 2.14 % USD p.a.
OCI effect of the inflation component YTD EUR -34.8 m.
(thereof EUR -1.8 m.; -33.1 m. EUR of USD)
Sensitivity to inflation risk:
* CPI - Consumer Price Index (US inflation index)
HICP - Harmonised Indices of Consumer Prices (EU inflation index; actually traded is the sub-index HICP ex tobacco)
in m. EUR
Change in market value of the
inflation component through OCI
Inflation expectation*: +100 bps +79
Inflation expectation*: -100 bps -75
Inflation expectation*: +400 bps +339
Appendix

Group Property & Casualty R/I Life & Health R/I Investments Outlook 2015 Appendix
Disclaimer
23
This presentation does not address the investment objectives or financial situation of any particular person or
legal entity. Investors should seek independent professional advice and perform their own analysis regarding
the appropriateness of investing in any of our securities.
While Hannover Re has endeavoured to include in this presentation information it believes to be reliable,
complete and up-to-date, the company does not make any representation or warranty, express or implied, as
to the accuracy, completeness or updated status of such information.
Some of the statements in this presentation may be forward-looking statements or statements of future
expectations based on currently available information. Such statements naturally are subject to risks and
uncertainties. Factors such as the development of general economic conditions, future market conditions,
unusual catastrophic loss events, changes in the capital markets and other circumstances may cause the
actual events or results to be materially different from those anticipated by such statements.
This presentation serves information purposes only and does not constitute or form part of an offer or
solicitation to acquire, subscribe to or dispose of, any of the securities of Hannover Re.
© Hannover Rück SE. All rights reserved.
Hannover Re is the registered service mark of Hannover Rück SE.