Embed Size (px)
Citation preview
Conference call First nine months of fiscal year 2014 »
Karlsruhe, 11 November 2014Thomas Kusterer, Chief Financial OfficerIngo Peter Voigt, Senior Vice President, Head of Finance / Investor Relations
EnBW EnergieBaden-Württemberg AG
Important note
2Conference Call on the first nine months of fiscal year 2014, 11 November 2014
Unless indicated otherwise, all data contained hereinafter refers to the EnBW group and is calculated according to IFRS.
No offer or investment recommendation
This presentation has been prepared for information purposes only. It does not constitute an offer, an invitation or a recommendation to purchase or sell securities issued by EnBW Energie Baden-Württemberg AG (EnBW), a company of the EnBW group or any other company. This presentation does not constitute a request, instruction or recommendation to vote or give consent. All descriptions, examples and calculations are included in this presentation for illustration purposes only.
Future-oriented statements
This presentation contains future-oriented statements that are based on current assumptions, plans, estimates and forecasts of the management of EnBW. Such future-oriented statements are therefore only valid at the time at which they are published for the first time. Future-oriented statements are indicated by the context, but may also be
identified by the use of the words “may”, “will”, “should”, “plans”, “intends”, “expects”, “believes”, “assumes”, “forecasts”, “potentially” or “continued” and similar expressions.
By nature, future-oriented statements are subject to risks and uncertainties that cannot be controlled or accurately predicted by EnBW. Actual events, future results, the financial position, development or performance of EnBWand the companies of the EnBW group may therefore diverge considerably from the future-oriented statements made in this presentation. Therefore it cannot be guaranteed nor can any liability be assumed otherwise that these future-oriented statements will prove complete, correct or precise or that expected and forecast results will actually occur in the future.
No obligation to update the information
EnBW assumes no obligation of any kind to update the information contained in this presentation or to adjust or update future-oriented statements to future events or developments.
Opening remarks
3Conference Call on the first nine months of fiscal year 2014, 11 November 2014
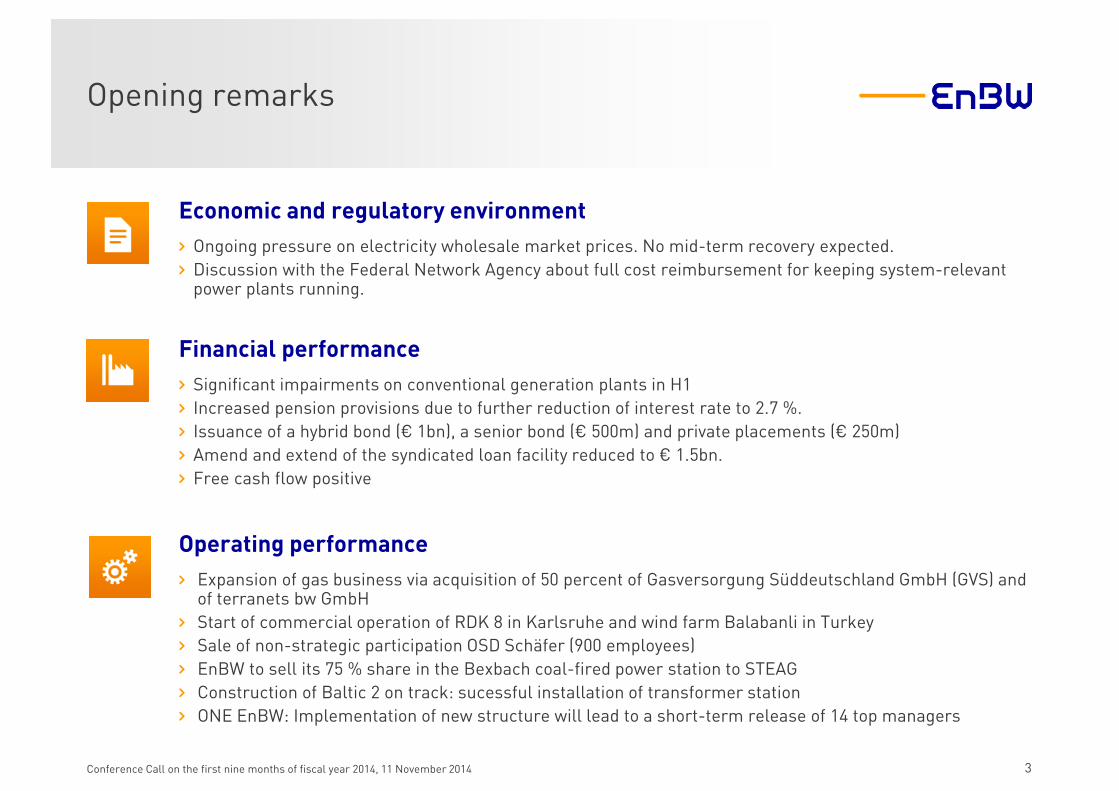
Economic and regulatory environment
› Ongoing pressure on electricity wholesale market prices. No mid-term recovery expected.
› Discussion with the Federal Network Agency about full cost reimbursement for keeping system-relevant power plants running.
Financial performance
› Significant impairments on conventional generation plants in H1
› Increased pension provisions due to further reduction of interest rate to 2.7 %.
› Issuance of a hybrid bond (€ 1bn), a senior bond (€ 500m) and private placements (€ 250m)
› Amend and extend of the syndicated loan facility reduced to € 1.5bn.
› Free cash flow positive
Operating performance
› Expansion of gas business via acquisition of 50 percent of Gasversorgung Süddeutschland GmbH (GVS) andof terranets bw GmbH
› Start of commercial operation of RDK 8 in Karlsruhe and wind farm Balabanli in Turkey
› Sale of non-strategic participation OSD Schäfer (900 employees)
› EnBW to sell its 75 % share in the Bexbach coal-fired power station to STEAG
› Construction of Baltic 2 on track: sucessful installation of transformer station
› ONE EnBW: Implementation of new structure will lead to a short-term release of 14 top managers
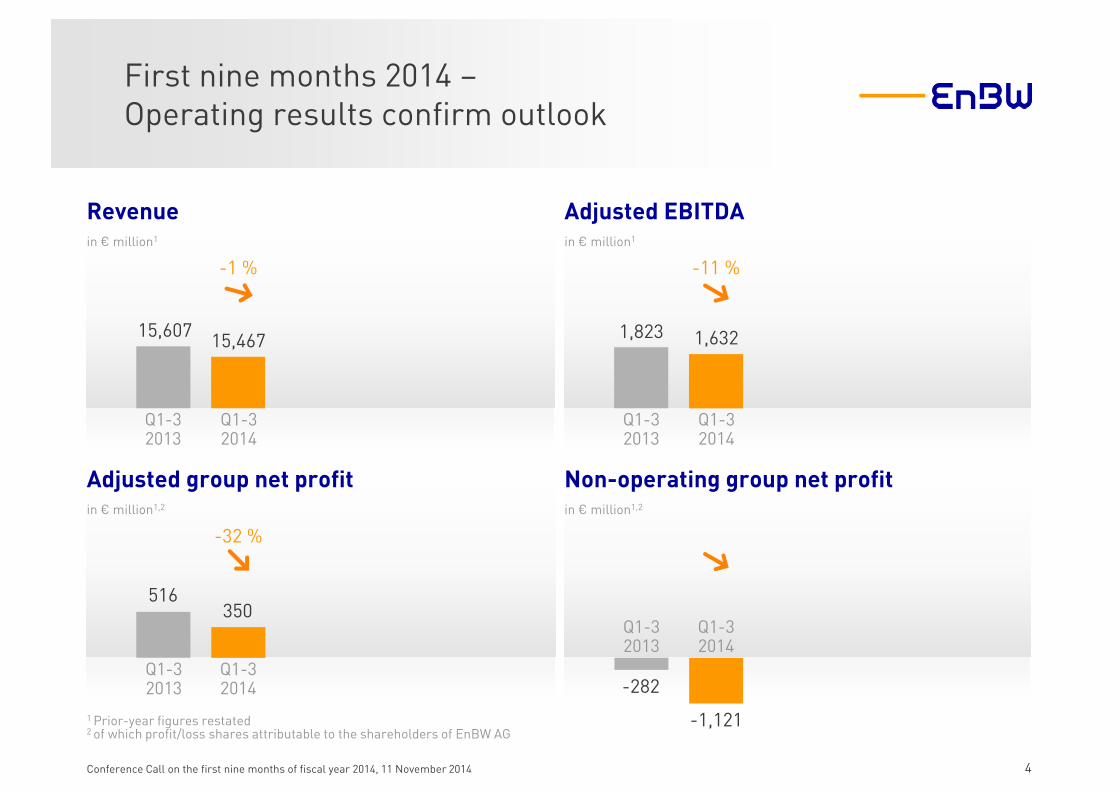
Non-operating group net profit in € million1,2
Revenue in € million1
Adjusted EBITDA in € million1
Adjusted group net profitin € million1,2
First nine months 2014 –Operating results confirm outlook
4Conference Call on the first nine months of fiscal year 2014, 11 November 2014
-32 %
Q1-32014
Q1-32013
Q1-3 2014
Q1-3 2013
-282
-1,1211 Prior-year figures restated2 of which profit/loss shares attributable to the shareholders of EnBW AG
Q1-3 2014
Q1-3 2013
15,60715,467 1,823 1,632
516350
Q1-3 2014
Q1-32013
-1 % -11 %
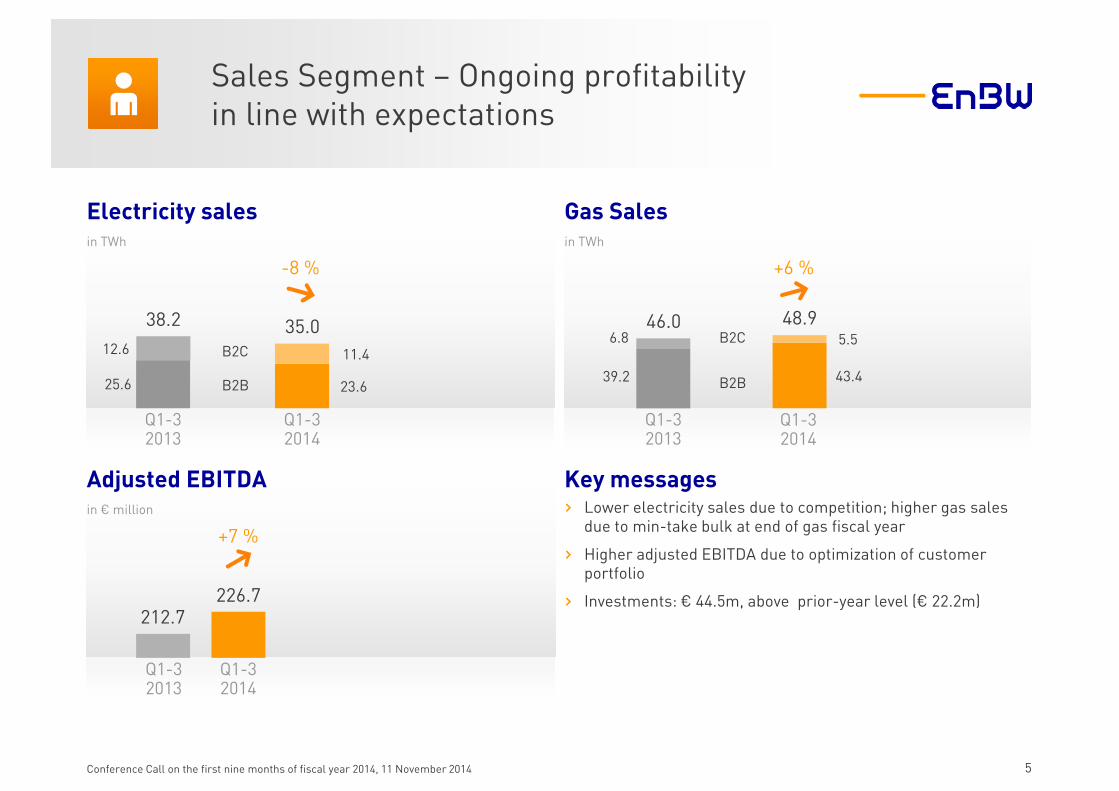
Electricity sales in TWh
Gas Salesin TWh
Adjusted EBITDA in € million
Sales Segment – Ongoing profitabilityin line with expectations
5Conference Call on the first nine months of fiscal year 2014, 11 November 2014
38.2 35.0
212.7226.7
46.0 48.9
12.6
25.6
11.4
23.639.2
6.8
43.4
5.5
Q1-32014
Q1-3 2014
B2C
B2B
B2C
B2B
› Lower electricity sales due to competition; higher gas sales due to min-take bulk at end of gas fiscal year
› Higher adjusted EBITDA due to optimization of customer portfolio
› Investments: € 44.5m, above prior-year level (€ 22.2m)
Key messages
Q1-32014
Q1-32013
+7 %
-8 %
Q1-3 2013
+6 %
Q1-3 2013
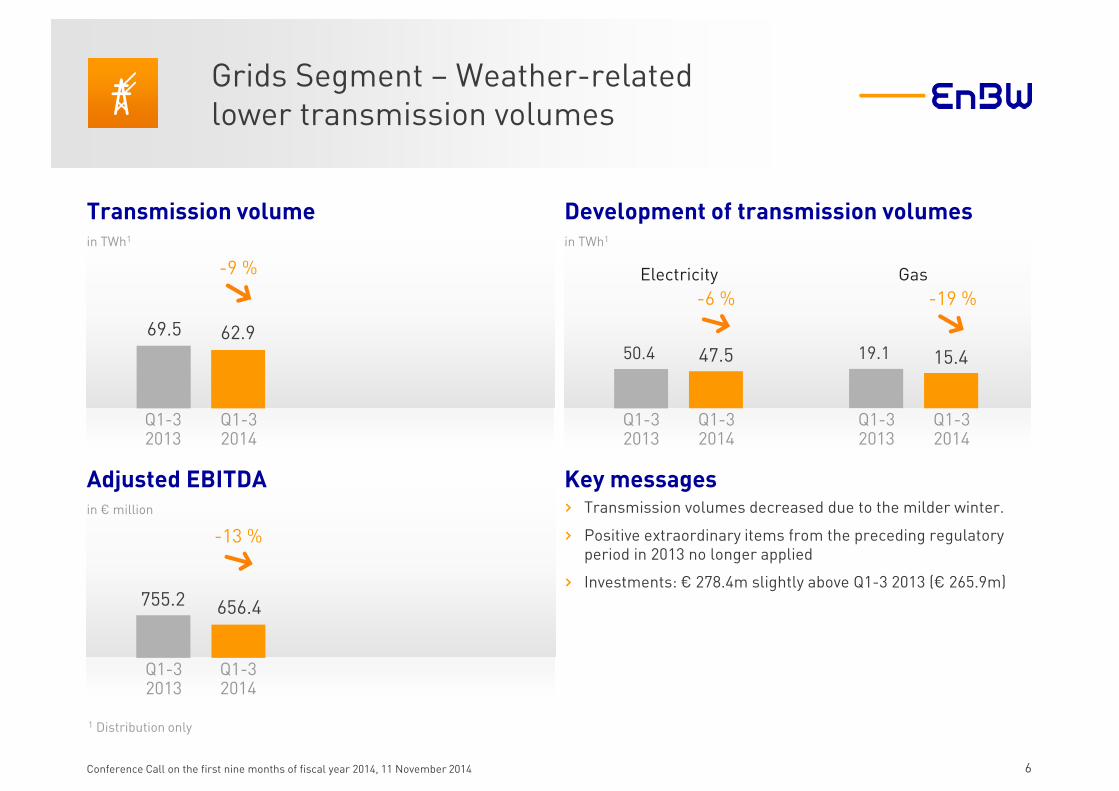
Transmission volume in TWh1
Development of transmission volumesin TWh1
Adjusted EBITDA in € million
1 Distribution only
69.5 62.9
Grids Segment – Weather-related lower transmission volumes
6Conference Call on the first nine months of fiscal year 2014, 11 November 2014
755.2 656.4
19.150.4 15.447.5
Electricity Gas
› Transmission volumes decreased due to the milder winter.
› Positive extraordinary items from the preceding regulatory period in 2013 no longer applied
› Investments: € 278.4m slightly above Q1-3 2013 (€ 265.9m)
Key messages
Q1-32014
Q1-32013
Q1-3 2014
Q1-3 2013
Q1-3 2014
Q1-3 2013
-9 %
-6 % -19 %
Q1-3 2014
Q1-3 2013
-13 %
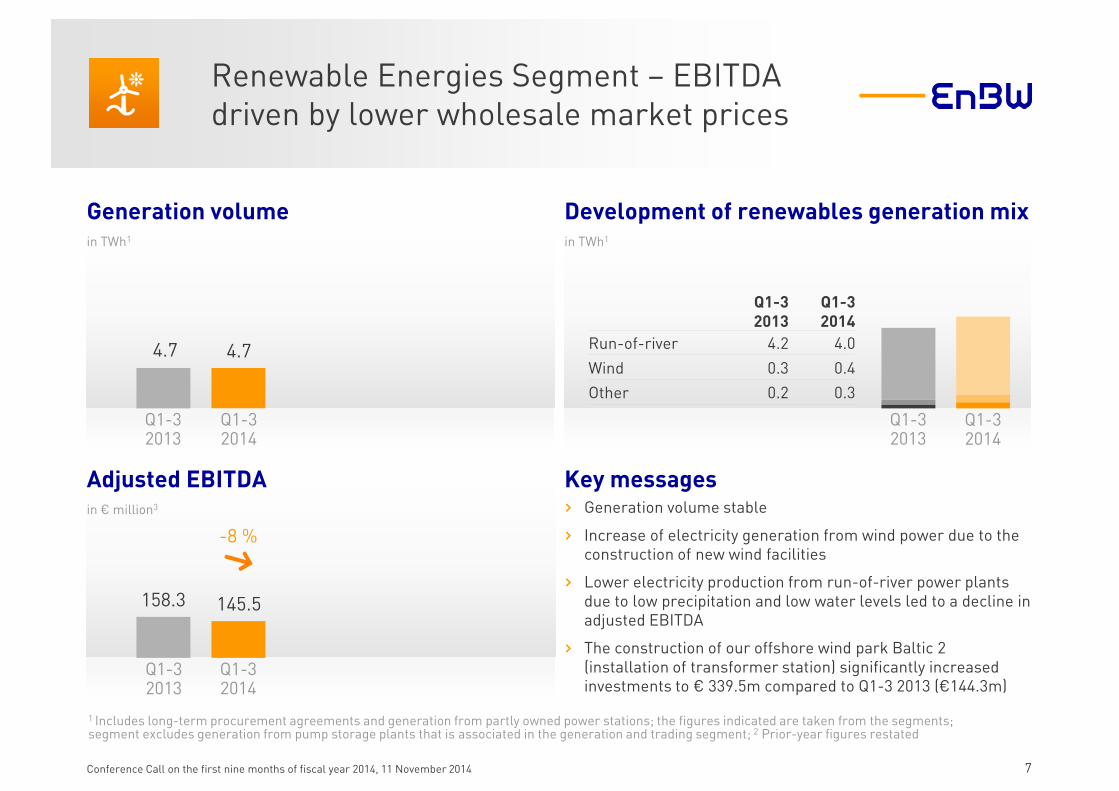
Generation volume in TWh1
Development of renewables generation mixin TWh1
Adjusted EBITDA in € million3
1 Includes long-term procurement agreements and generation from partly owned power stations; the figures indicated are taken from the segments;segment excludes generation from pump storage plants that is associated in the generation and trading segment; 2 Prior-year figures restated
4.7 4.7
Renewable Energies Segment – EBITDA driven by lower wholesale market prices
7Conference Call on the first nine months of fiscal year 2014, 11 November 2014
158.3 145.5
Q1-32014
Q1-32013
› Generation volume stable
› Increase of electricity generation from wind power due to the construction of new wind facilities
› Lower electricity production from run-of-river power plants due to low precipitation and low water levels led to a decline in adjusted EBITDA
› The construction of our offshore wind park Baltic 2 (installation of transformer station) significantly increased investments to € 339.5m compared to Q1-3 2013 (€144.3m)
Key messages
Q1-32014
Q1-32013
-8 %
Q1-3 2014
Q1-3 2013
Q1-3 2013
Q1-3 2014
Run-of-river 4.2 4.0
Wind 0.3 0.4
Other 0.2 0.3
1 Includes long-term procurement agreements and generation from partly owned power stations; the figures indicated are taken from the segments2 Segment includes pump storage plants; 3 Prior-year figures restated
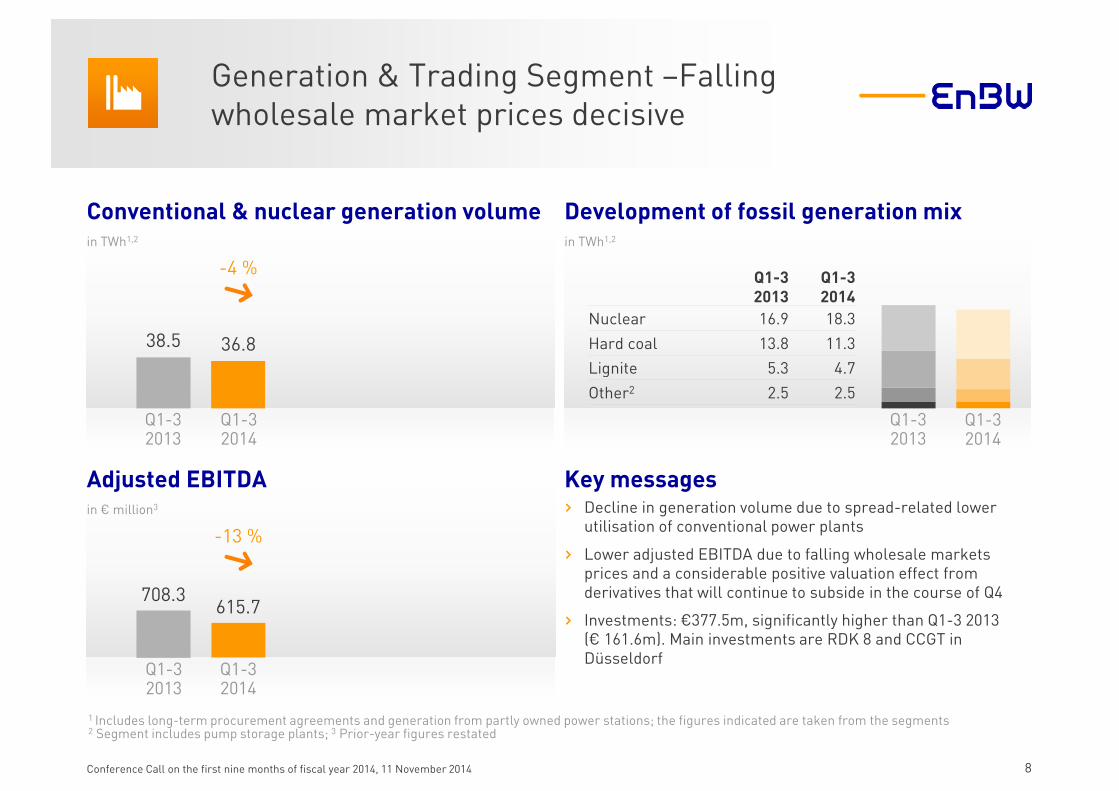
38.5 36.8
Generation & Trading Segment –Fallingwholesale market prices decisive
8Conference Call on the first nine months of fiscal year 2014, 11 November 2014
› Decline in generation volume due to spread-related lower utilisation of conventional power plants
› Lower adjusted EBITDA due to falling wholesale markets prices and a considerable positive valuation effect from derivatives that will continue to subside in the course of Q4
› Investments: €377.5m, significantly higher than Q1-3 2013(€ 161.6m). Main investments are RDK 8 and CCGT in Düsseldorf
708.3615.7
Q1-3 2013
Q1-3 2014
Nuclear 16.9 18.3
Hard coal 13.8 11.3
Lignite 5.3 4.7
Other2 2.5 2.5
Conventional & nuclear generation volume in TWh1,2
Development of fossil generation mixin TWh1,2
Adjusted EBITDA in € million3
Key messages
Q1-3 2014
Q1-3 2013
-4 %
Q1-32014
Q1-32013
Q1-32014
Q1-32013
-13 %
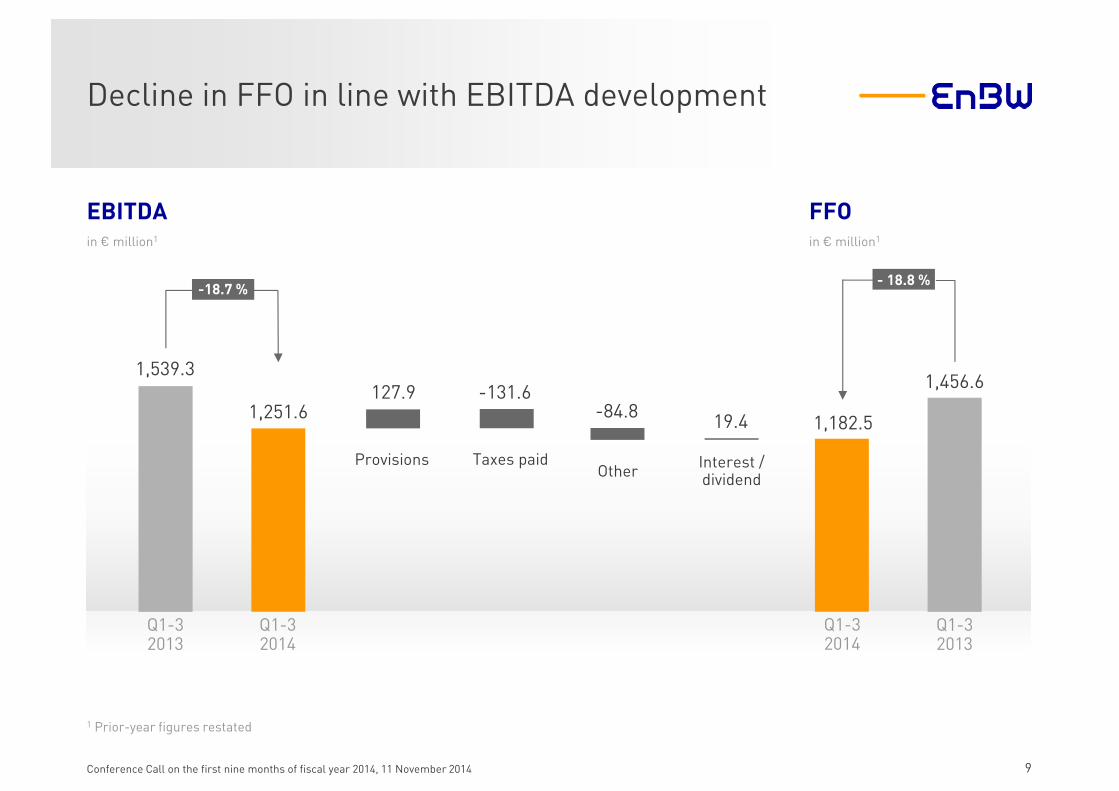
1 Prior-year figures restated
1,539.3
1,251.6
Decline in FFO in line with EBITDA development
9Conference Call on the first nine months of fiscal year 2014, 11 November 2014
Q1-3 2013
Q1-32014
ProvisionsOther
Interest /dividend
Taxes paid
1,182.5
1,456.6
- 18.8 %-18.7 %
127.9 -131.6-84.8
19.4
Q1-3 2014
Q1-3 2013
EBITDAin € million1
FFOin € million1
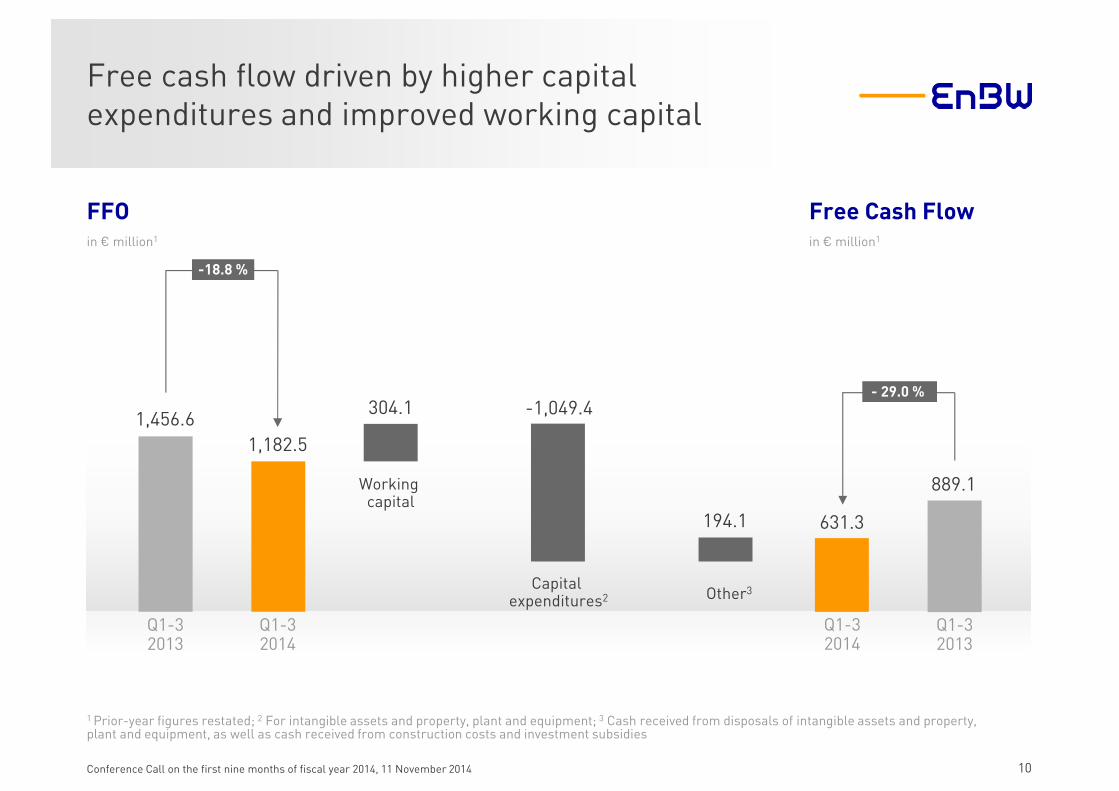
1 Prior-year figures restated; 2 For intangible assets and property, plant and equipment; 3 Cash received from disposals of intangible assets and property, plant and equipment, as well as cash received from construction costs and investment subsidies
1,456.6
1,182.5
Free cash flow driven by higher capital expenditures and improved working capital
10Conference Call on the first nine months of fiscal year 2014, 11 November 2014
Working capital
Capital expenditures2 Other3
631.3
889.1
-18.8 %
304.1 -1,049.4
194.1
- 29.0 %
Q1-3 2013
Q1-3 2014
Q1-3 2014
Q1-3 2013
FFOin € million1
Free Cash Flowin € million1
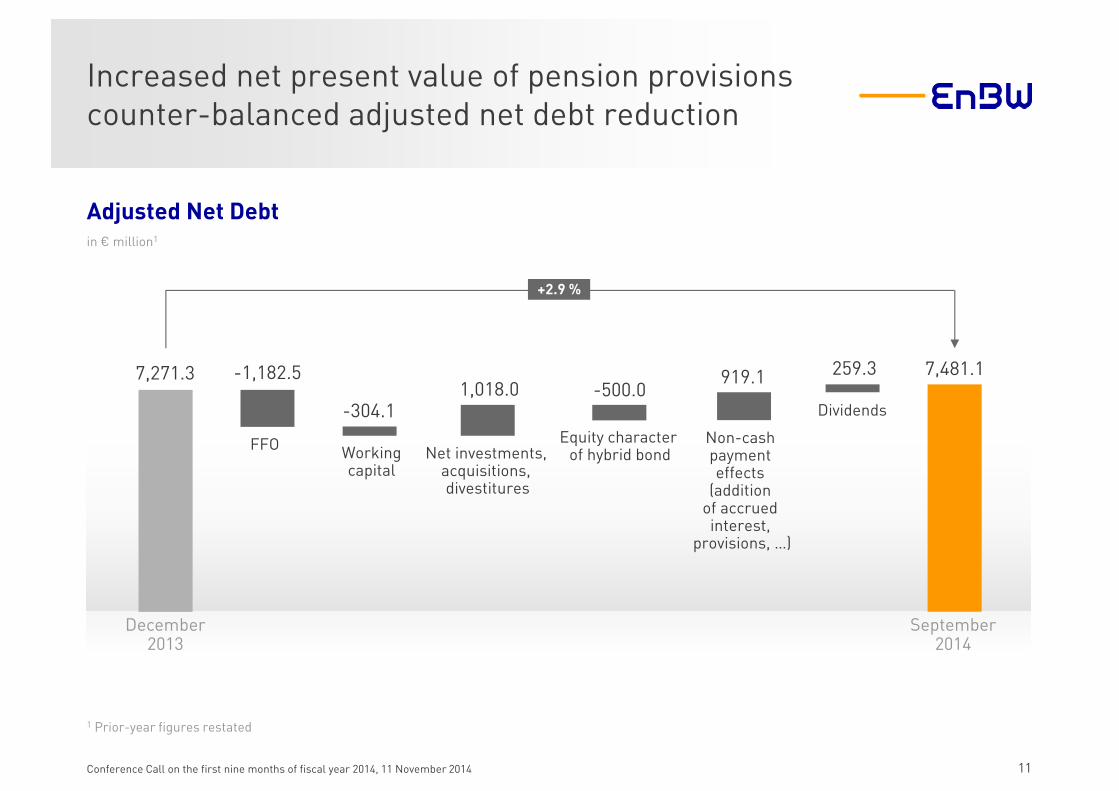
1 Prior-year figures restated
7,271.3 -1,182.5
Increased net present value of pension provisions counter-balanced adjusted net debt reduction
11Conference Call on the first nine months of fiscal year 2014, 11 November 2014
Workingcapital
Net investments, acquisitions, divestitures
Equity character of hybrid bond
919.1 7,481.1
+2.9 %
-304.11,018.0 -500.0
FFO Non-cash payment effects
(addition of accrued interest,
provisions, …)
December2013
September2014
Dividends
259.3
Adjusted Net Debtin € million1
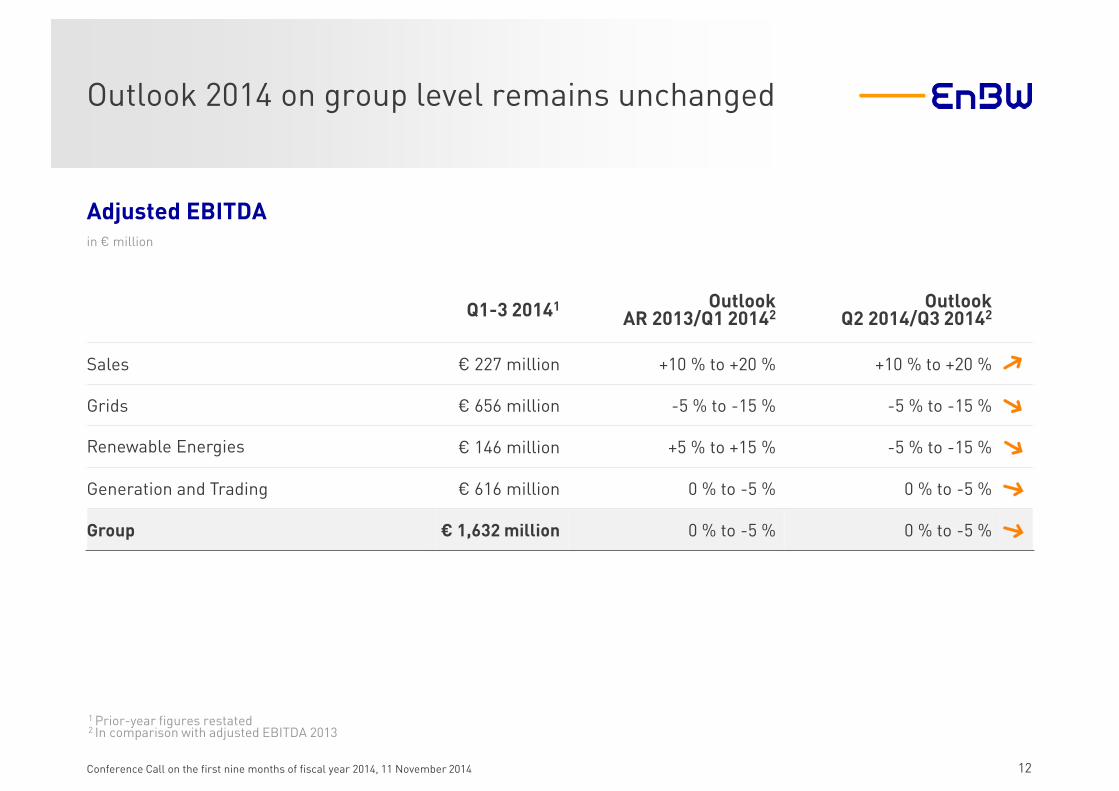
Outlook 2014 on group level remains unchanged
12Conference Call on the first nine months of fiscal year 2014, 11 November 2014
1 Prior-year figures restated 2 In comparison with adjusted EBITDA 2013
Q1-3 20141 Outlook AR 2013/Q1 20142
Outlook Q2 2014/Q3 20142
Sales € 227 million +10 % to +20 % +10 % to +20 %
Grids € 656 million -5 % to -15 % -5 % to -15 %
Renewable Energies € 146 million +5 % to +15 % -5 % to -15 %
Generation and Trading € 616 million 0 % to -5 % 0 % to -5 %
Group € 1,632 million 0 % to -5 % 0 % to -5 %
Adjusted EBITDAin € million
Conference Call on the first nine months of fiscal year 2014, 11 November 2014
Questions& Answers »
Appendix
14Conference Call on the first nine months of fiscal year 2014, 11 November 2014
› Additional information.................................................................... page 15
› Financial calendar............................................................................. page 23
› IR contacts ............................................................................................. page 24
Non-operating result
15Conference Call on the first nine months of fiscal year 2014, 11 November 2014
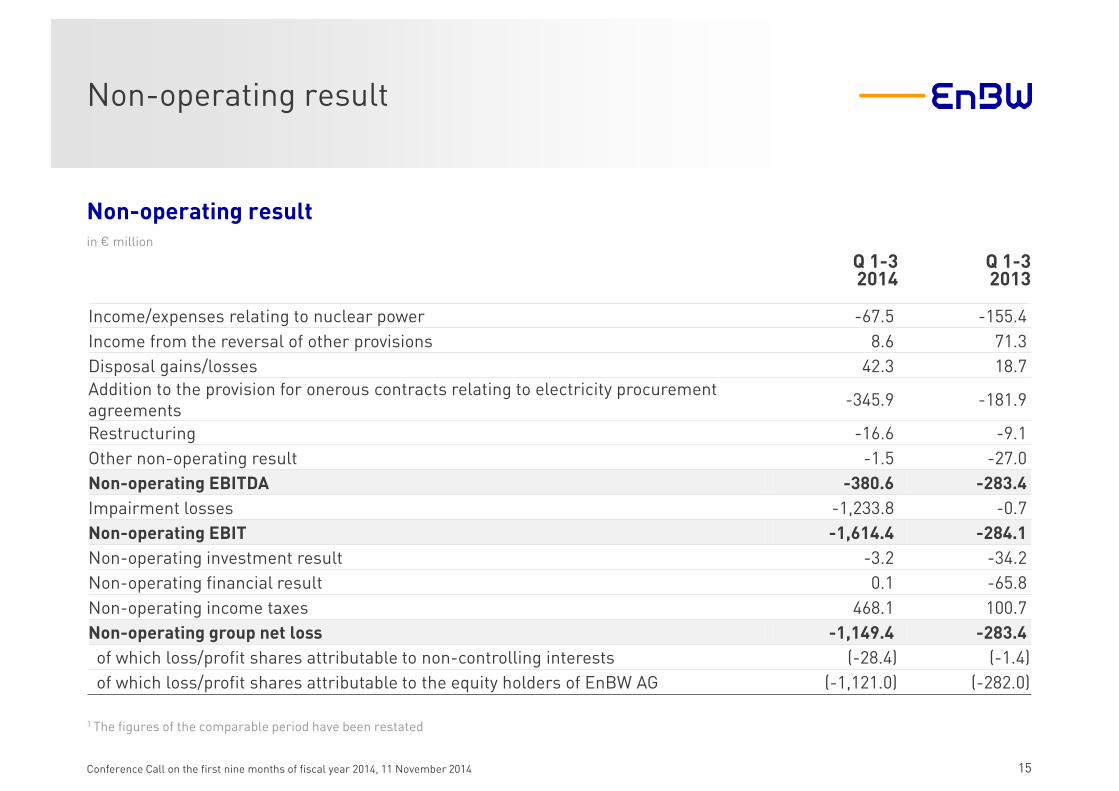
1 The figures of the comparable period have been restated
Q 1-3 2014
Q 1-32013
Income/expenses relating to nuclear power -67.5 -155.4
Income from the reversal of other provisions 8.6 71.3
Disposal gains/losses 42.3 18.7
Addition to the provision for onerous contracts relating to electricity procurement agreements
-345.9 -181.9
Restructuring -16.6 -9.1
Other non-operating result -1.5 -27.0
Non-operating EBITDA -380.6 -283.4
Impairment losses -1,233.8 -0.7
Non-operating EBIT -1,614.4 -284.1
Non-operating investment result -3.2 -34.2
Non-operating financial result 0.1 -65.8
Non-operating income taxes 468.1 100.7
Non-operating group net loss -1,149.4 -283.4
of which loss/profit shares attributable to non-controlling interests (-28.4) (-1.4)
of which loss/profit shares attributable to the equity holders of EnBW AG (-1,121.0) (-282.0)
Non-operating resultin € million
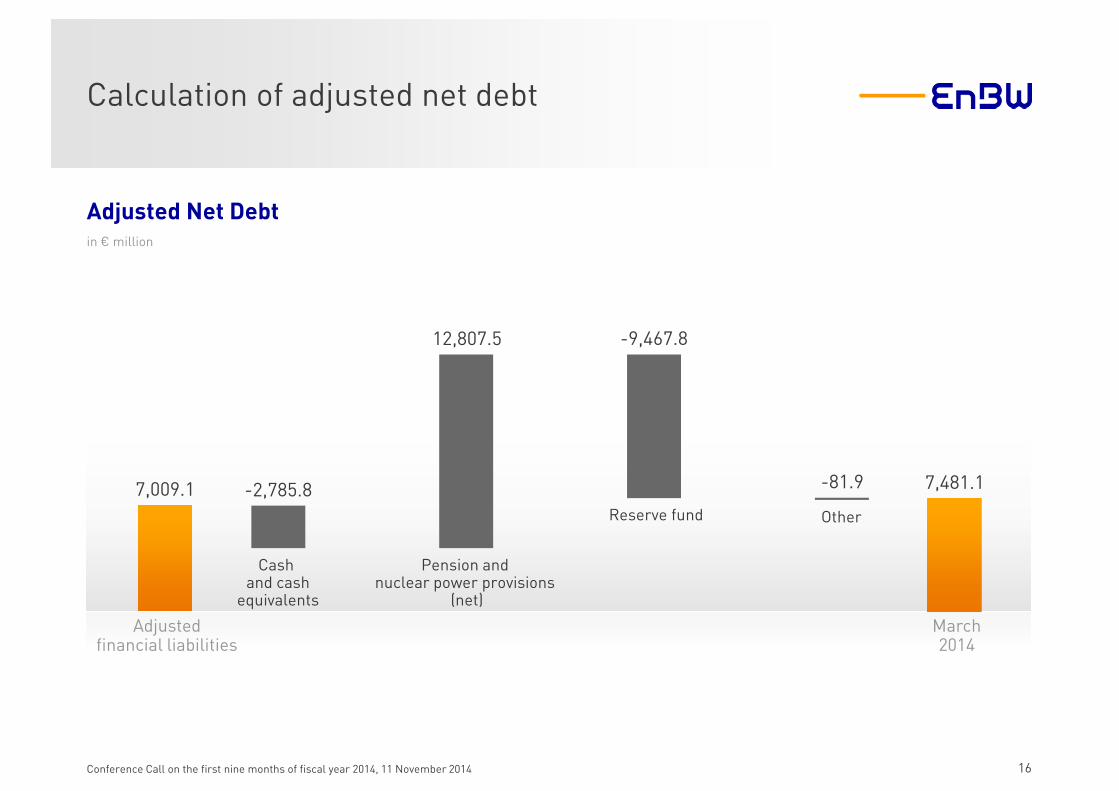
Other
7,009.1 -2,785.8
Calculation of adjusted net debt
16Conference Call on the first nine months of fiscal year 2014, 11 November 2014
Pension and nuclear power provisions
(net)
Reserve fund
-81.9 7,481.1
12,807.5 -9,467.8
Cash and cash
equivalents
Adjustedfinancial liabilities
March2014
Adjusted Net Debtin € million
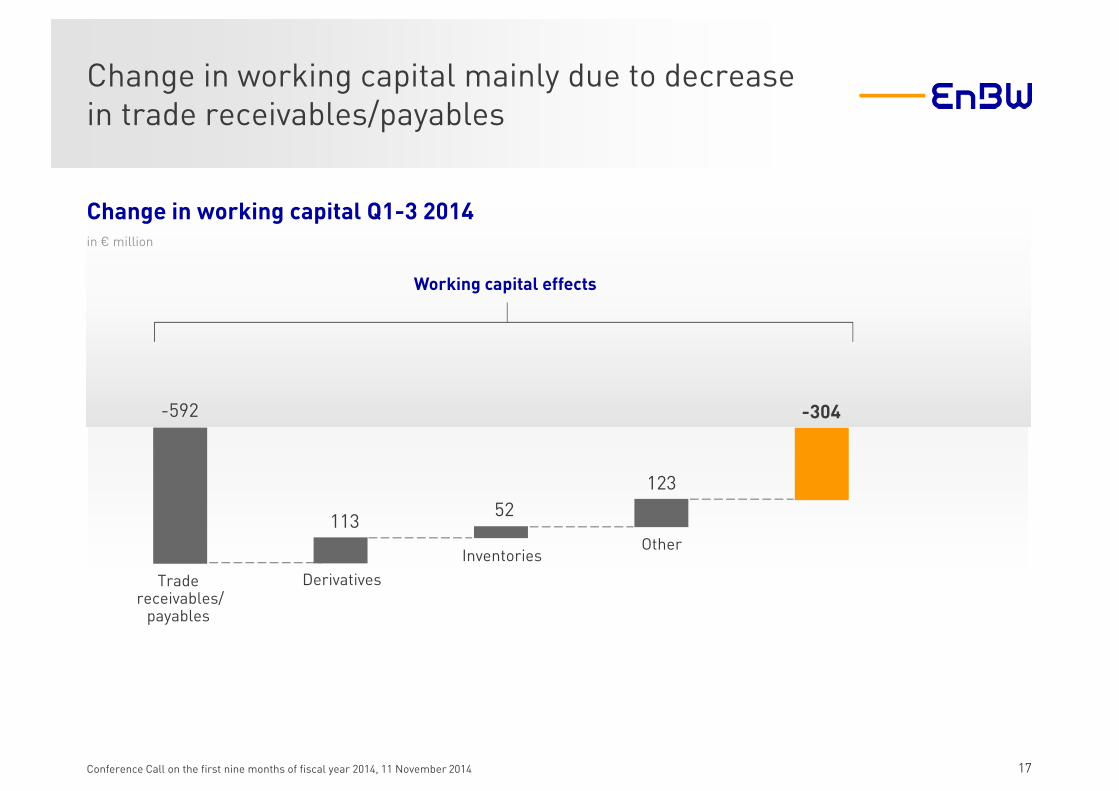
Change in working capital mainly due to decrease in trade receivables/payables
17Conference Call on the first nine months of fiscal year 2014, 11 November 2014
Working capital effects
Inventories
113
Derivatives
52
-304-592
Trade receivables/
payables
Other
123
Change in working capital Q1-3 2014in € million
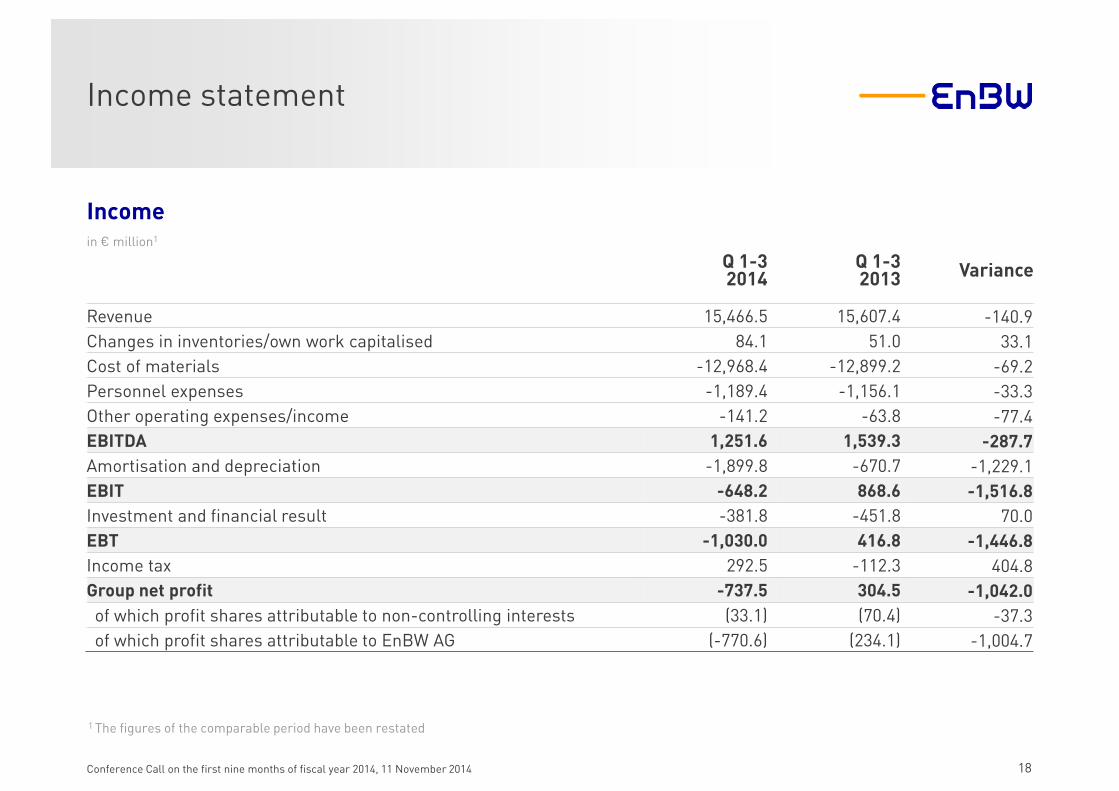
Income statement
18Conference Call on the first nine months of fiscal year 2014, 11 November 2014
1 The figures of the comparable period have been restated
Q 1-32014
Q 1-32013 Variance
Revenue 15,466.5 15,607.4 -140.9
Changes in inventories/own work capitalised 84.1 51.0 33.1
Cost of materials -12,968.4 -12,899.2 -69.2
Personnel expenses -1,189.4 -1,156.1 -33.3
Other operating expenses/income -141.2 -63.8 -77.4
EBITDA 1,251.6 1,539.3 -287.7
Amortisation and depreciation -1,899.8 -670.7 -1,229.1
EBIT -648.2 868.6 -1,516.8
Investment and financial result -381.8 -451.8 70.0
EBT -1,030.0 416.8 -1,446.8
Income tax 292.5 -112.3 404.8
Group net profit -737.5 304.5 -1,042.0
of which profit shares attributable to non-controlling interests (33.1) (70.4) -37.3
of which profit shares attributable to EnBW AG (-770.6) (234.1) -1,004.7
Incomein € million1
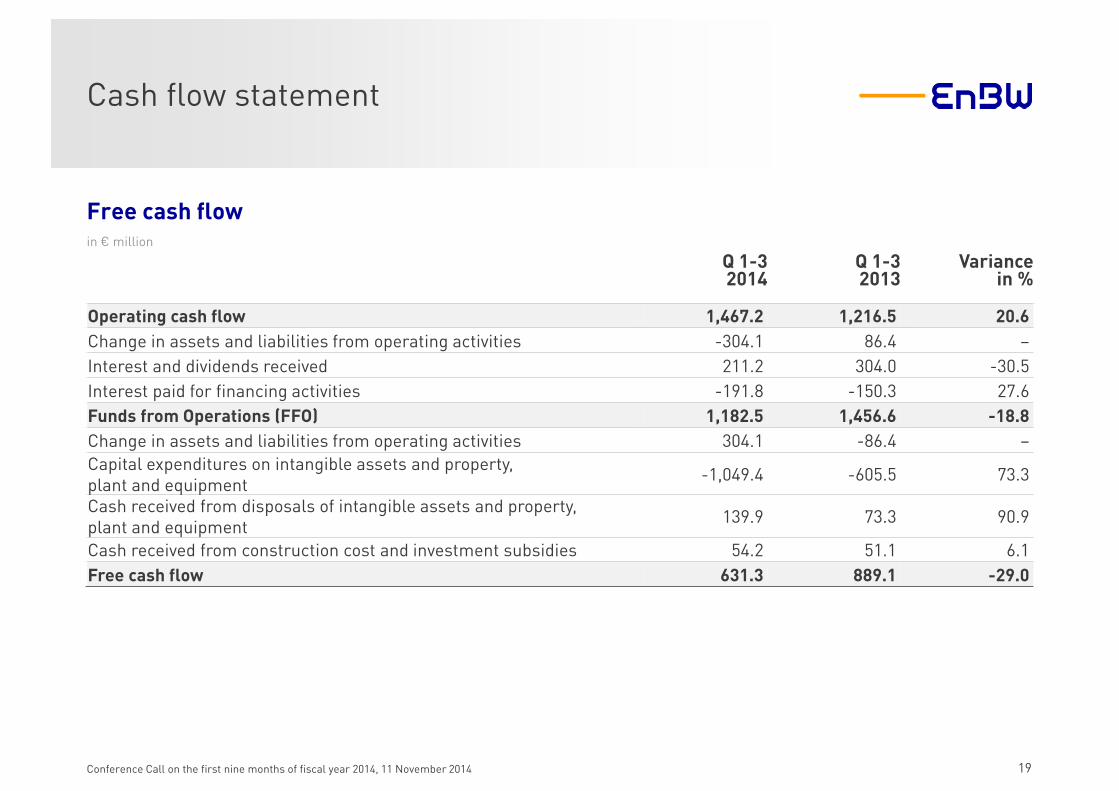
Cash flow statement
19Conference Call on the first nine months of fiscal year 2014, 11 November 2014
Q 1-32014
Q 1-32013
Variancein %
Operating cash flow 1,467.2 1,216.5 20.6
Change in assets and liabilities from operating activities -304.1 86.4 –
Interest and dividends received 211.2 304.0 -30.5
Interest paid for financing activities -191.8 -150.3 27.6
Funds from Operations (FFO) 1,182.5 1,456.6 -18.8
Change in assets and liabilities from operating activities 304.1 -86.4 –
Capital expenditures on intangible assets and property, plant and equipment
-1,049.4 -605.5 73.3
Cash received from disposals of intangible assets and property, plant and equipment
139.9 73.3 90.9
Cash received from construction cost and investment subsidies 54.2 51.1 6.1
Free cash flow 631.3 889.1 -29.0
Free cash flow in € million
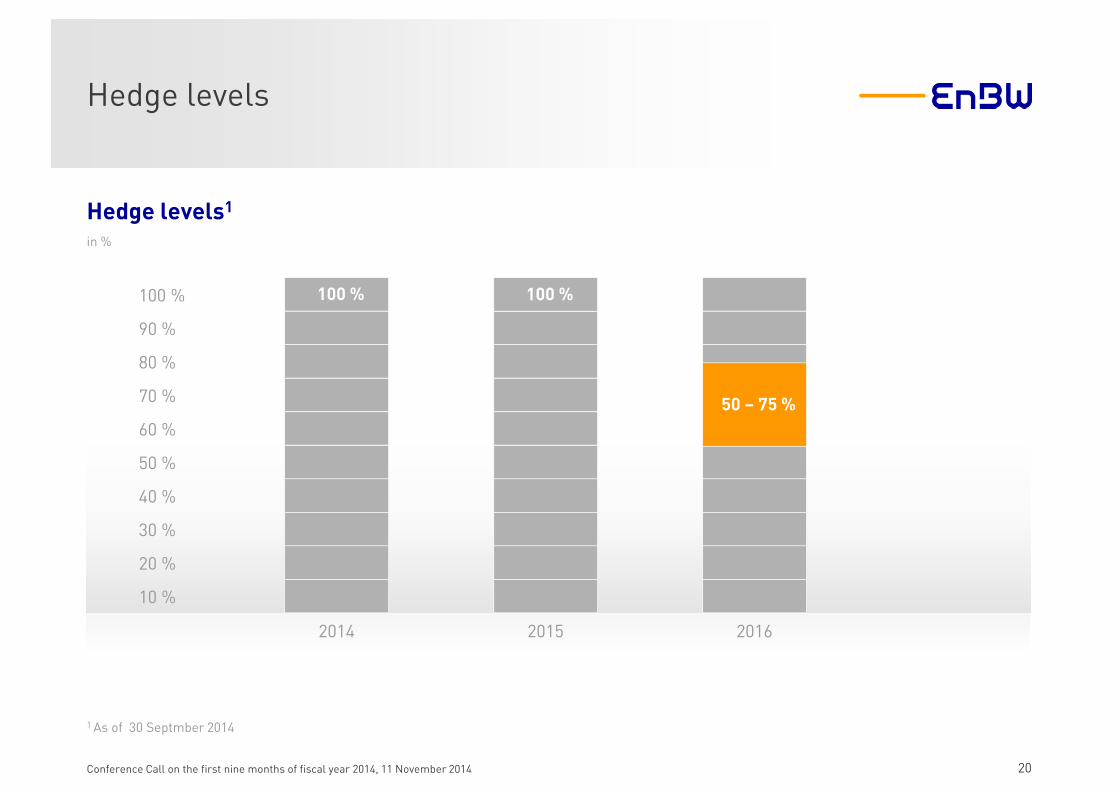
1 As of 30 Septmber 2014
Hedge levels
20Conference Call on the first nine months of fiscal year 2014, 11 November 2014
10 %
20 %
30 %
40 %
50 %
60 %
70 %
80 %
90 %
100 %
2014
100 %
2015 2016
50 – 75 %
100 %
Hedge levels1
in %
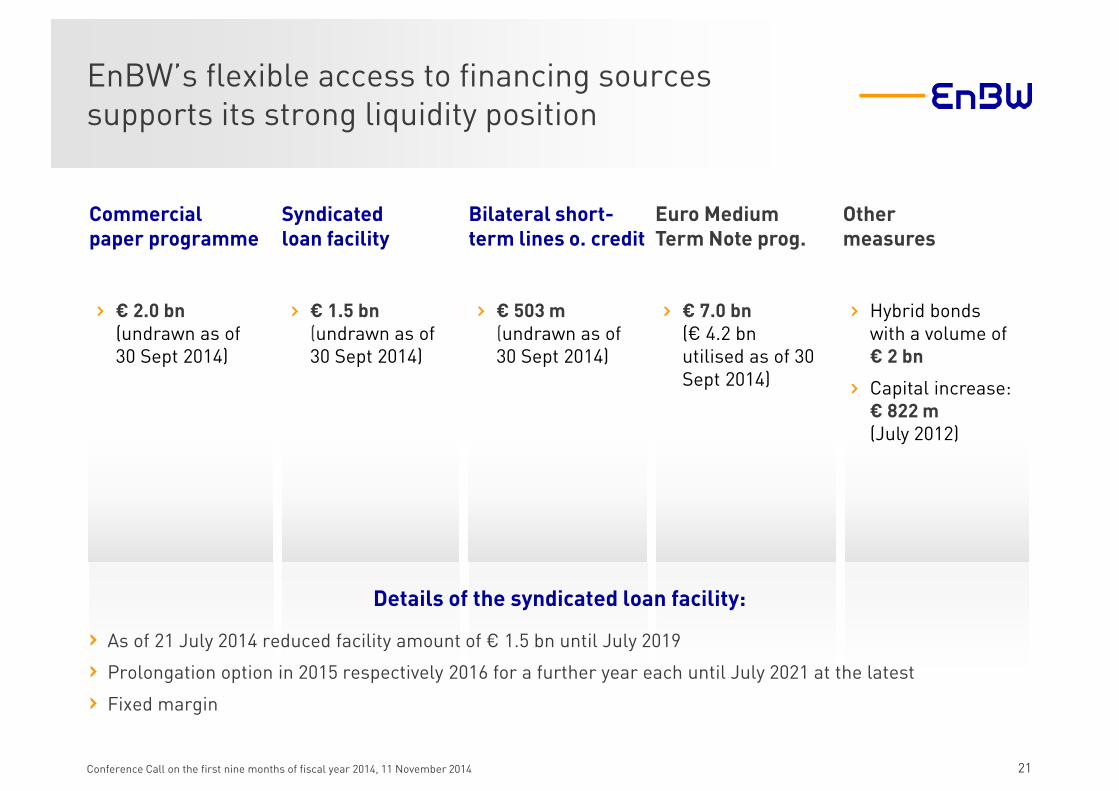
EnBW’s flexible access to financing sourcessupports its strong liquidity position
21Conference Call on the first nine months of fiscal year 2014, 11 November 2014
Commercial paper programme
Details of the syndicated loan facility:
› As of 21 July 2014 reduced facility amount of € 1.5 bn until July 2019
› Prolongation option in 2015 respectively 2016 for a further year each until July 2021 at the latest
› Fixed margin
Syndicatedloan facility
Bilateral short-term lines o. credit
Euro Medium Term Note prog.
Other measures
› € 2.0 bn(undrawn as of 30 Sept 2014)
› € 1.5 bn(undrawn as of 30 Sept 2014)
› € 503 m (undrawn as of 30 Sept 2014)
› € 7.0 bn(€ 4.2 bnutilised as of 30 Sept 2014)
› Hybrid bondswith a volume of € 2 bn
› Capital increase: € 822 m(July 2012)
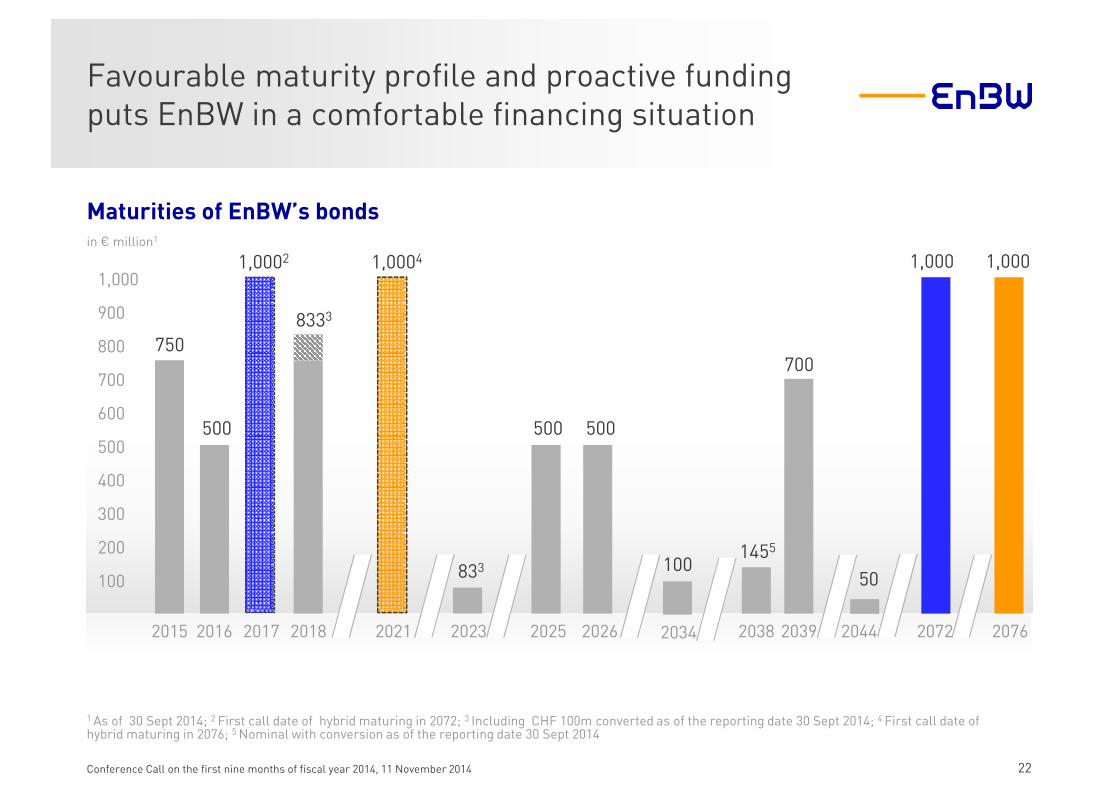
Favourable maturity profile and proactive funding puts EnBW in a comfortable financing situation
22Conference Call on the first nine months of fiscal year 2014, 11 November 2014
1 As of 30 Sept 2014; 2 First call date of hybrid maturing in 2072; 3 Including CHF 100m converted as of the reporting date 30 Sept 2014; 4 First call date of hybrid maturing in 2076; 5 Nominal with conversion as of the reporting date 30 Sept 2014
100
200
300
400
500
600
700
800
900
1,000
750
2015
500
2016
1,0002
2017
8333
2018
833
2023 2025
1455
2038
700
2039
1,000
2072
500
1,0004
2021 2076
1,000
2026
500
100
2034
50
2044
Maturities of EnBW’s bondsin € million1
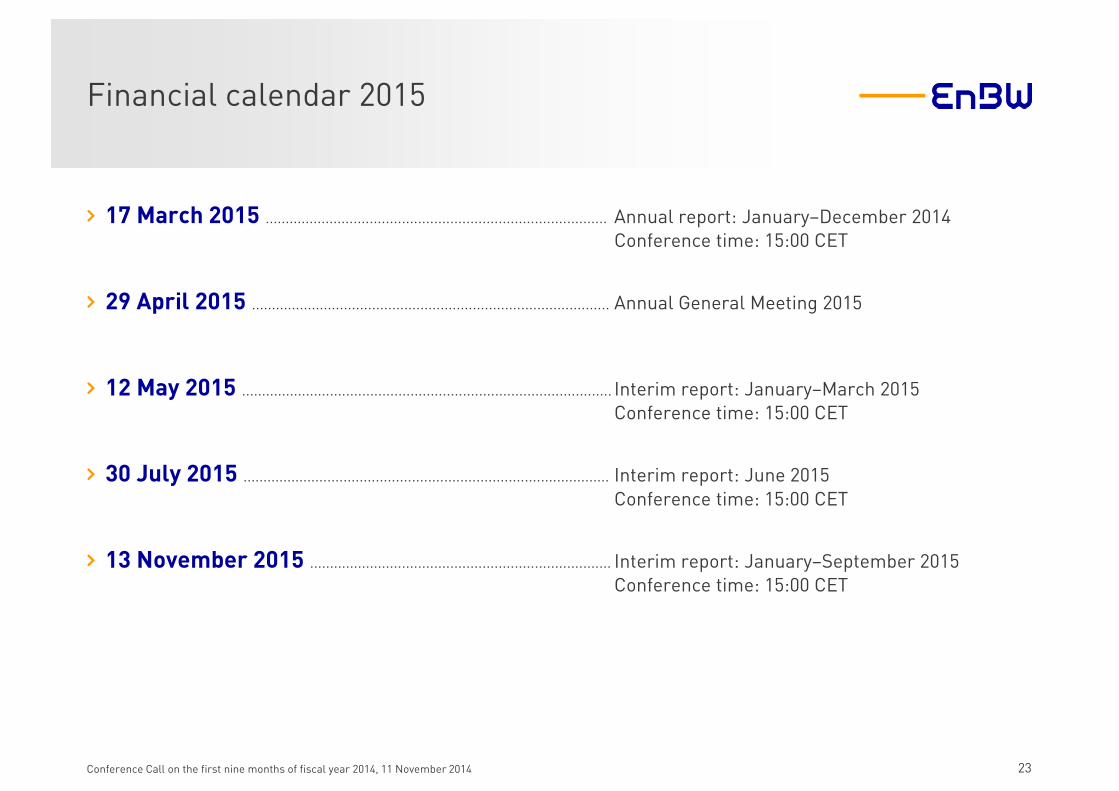
Financial calendar 2015
23Conference Call on the first nine months of fiscal year 2014, 11 November 2014
› 17 March 2015 ..................................................................................... Annual report: January–December 2014Conference time: 15:00 CET
› 29 April 2015 ......................................................................................... Annual General Meeting 2015
› 12 May 2015 ............................................................................................ Interim report: January–March 2015Conference time: 15:00 CET
› 30 July 2015 ........................................................................................... Interim report: June 2015Conference time: 15:00 CET
› 13 November 2015 ........................................................................... Interim report: January–September 2015Conference time: 15:00 CET
EnBW IR contacts
24Conference Call on the first nine months of fiscal year 2014, 11 November 2014
› Ingo Peter VoigtSenior Vice PresidentHead of Finance/Investor Relations
› Julia v. WietersheimSenior Manager Investor Relations
› Julia MingesManager Investor Relations
T +49 [email protected]
T +49 [email protected]
T +49 721 - [email protected]