Embed Size (px)
Citation preview

CONFERENCE CALL – Q1 /2016 RESULTS
Frankfurt stock exchange (DAX30): FRE │ US ADR program (OTC): FSNUY │ www.fresenius.com/investors

Page 2Conference Call – Q1/2016 Results, Fresenius SE & Co. KGaA, Investor Relations © Copyright, May 3, 2016
SAFE HARBOR STATEMENTThis presentation contains forward-looking statements that are subject to various risks and uncertainties. Future results could differ materially from those described in these forward-looking statements due to certain factors, e.g. changes in business, economic and competitive conditions, regulatory reforms, results of clinical trials, foreign exchange rate fluctuations, uncertainties in litigation or investigative proceedings, and the availability of financing. Fresenius does not undertake any responsibility to update the forward-looking statements contained in this presentation.
Page 3
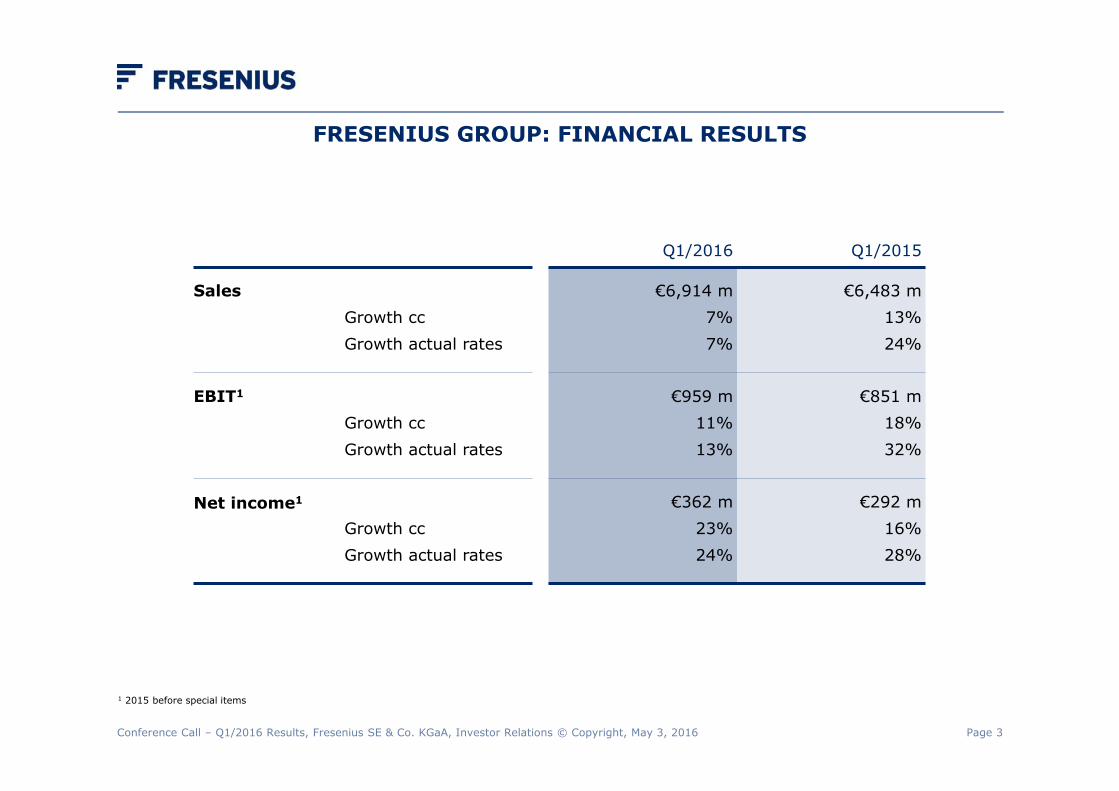
FRESENIUS GROUP: FINANCIAL RESULTS
Conference Call – Q1/2016 Results, Fresenius SE & Co. KGaA, Investor Relations © Copyright, May 3, 2016
1 2015 before special items
Q1/2016 Q1/2015
SalesGrowth ccGrowth actual rates
€6,914 m7%7%
€6,483 m13%24%
EBIT1
Growth ccGrowth actual rates
€959 m11%13%
€851 m18%32%
Net income1
Growth ccGrowth actual rates
€362 m23%24%
€292 m16%28%
Page 4
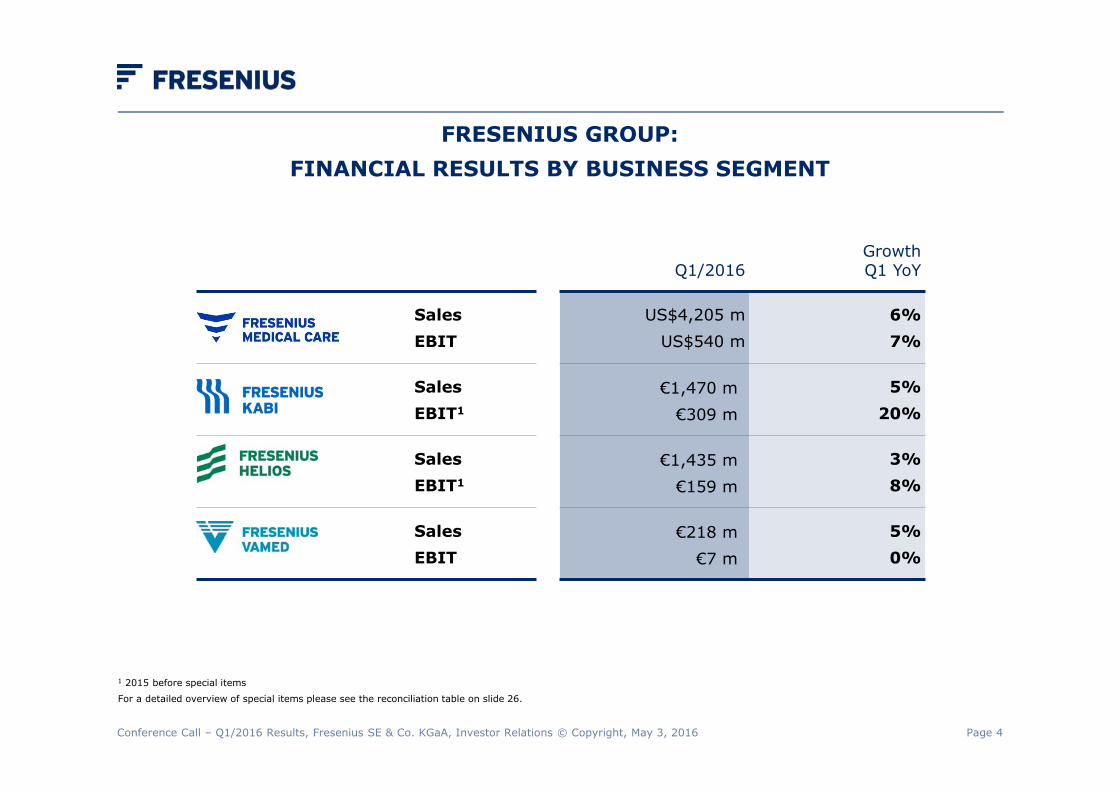
Q1/2016GrowthQ1 YoY
SalesEBIT
US$4,205 m US$540 m
6%7%
SalesEBIT1
€1,470 m€309 m
5%20%
SalesEBIT1
€1,435 m€159 m
3%8%
SalesEBIT
€218 m€7 m
5%0%
FRESENIUS GROUP: FINANCIAL RESULTS BY BUSINESS SEGMENT
Conference Call – Q1/2016 Results, Fresenius SE & Co. KGaA, Investor Relations © Copyright, May 3, 2016
1 2015 before special items
For a detailed overview of special items please see the reconciliation table on slide 26.

Page 5
36%
Q1 BUSINESS SEGMENT UPDATE
Conference Call – Q1/2016 Results, Fresenius SE & Co. KGaA, Investor Relations © Copyright, May 3, 2016
Regional development
North America- IV drug shortages continue; 20 Kabi-marketed products currently designated in shortage
- 3 product launches YTD
- Confirm roughly flat FY/16 organic sales growth expectation, based on tough comps starting Q2/16
Europe- Lower contract manufacturing sales volume expected until later in 2016
- Confirm FY/16 outlook of low to mid single-digit organic sales growth
Emerging Markets- China: 8% organic sales growth; fewer tenders completed than anticipated; continued
double-digit volume growth still expected
- Asia Pacific ex China: Ongoing recovery, 5% organic sales growth
- Latin America/Africa standing out with 21% organic sales growth
- Fully on track to meet FY/16 outlook of mid to high single-digit organic sales growth
Strong start into fiscal year 2016

Page 6
36%
Q1 BUSINESS SEGMENT UPDATE
Conference Call – Q1/2016 Results, Fresenius SE & Co. KGaA, Investor Relations © Copyright, May 3, 2016
- Organic sales (+3%) and EBIT growth (+8%) fully in line with Q1 expectations
- Acquisition of 500-bed municipal hospital in Velbert closed; consolidation as of May 1, 2016
- First university hospital (Munich) joining ‘Wir für Gesundheit’ network
- Fully on track to meet FY/16 outlook
Hospital business fully on track
- Project and service businesses contributing equally (both +6%) to organic sales growth
- Strong order intake of €237 m in Q1/16 (Q1/15: €192 m)
- Fully on track to meet FY/16 outlook
Organic sales growth in line with expectations

Page 7
GROUP FINANCIALS Q1/2016 OUTLOOK 2016
Conference Call – Q1/2016 Results, Fresenius SE & Co. KGaA, Investor Relations © Copyright, May 3, 2016

Page 8
FRESENIUS GROUP: PROFIT AND LOSS STATEMENT
Conference Call – Q1/2016 Results, Fresenius SE & Co. KGaA, Investor Relations © Copyright, May 3, 2016
1 2015 before special items2 Net income attributable to shareholders of Fresenius SE & Co. KGaA; 2015 before special itemsFor a detailed overview of special items please see the reconciliation table on slide 26.
Growth Q1 YoY
€m Q1/2016 Q1/2015actualrates
constantrates
Sales 6,914 6,483 7% 7%
EBIT1 959 851 13% 11%
Net interest -152 -165 8% 8%
Income taxes1 -229 -207 -11% -10%
Net income2 362 292 24% 23%

Page 9
FRESENIUS KABI: STRONG EBIT GROWTH
Conference Call – Q1/2016 Results, Fresenius SE & Co. KGaA, Investor Relations © Copyright, May 3, 2016
€m Q1/2016 Q1/2015
Growth Q1 YoY
constant rates
EuropeMargin
7815.2%
8316.0%
-4%-80 bps
North AmericaMargin
23340.5%
17637.2%
30%330 bps
Asia-Pacific/Latin America/AfricaMargin
6918.1%
6315.6%
14%250 bps
Corporate and Corporate R&D -71 -65 -14%
Total EBITMargin
30921.0%
25718.5%
19%250 bps
2015 before special itemsFor a detailed overview of special items please see the reconciliation table on slide 26.

Page 10
FRESENIUS HELIOS: STRONG EBIT MARGIN INCREASE
Conference Call – Q1/2016 Results, Fresenius SE & Co. KGaA, Investor Relations © Copyright, May 3, 2016
2015 before special itemsFor a detailed overview of special items please see the reconciliation table on slide 26.
€m Q1/2016 Q1/2015 Growth Q1 YoY
Total sales 1,435 1,391 3%
EBITEstablished clinic portfolioMargin
Acquisitions / Divestitures(consolidation / deconsolidation <1 yr) Margin
15911.1%
00.0%
14710.6%
8%50 bps
Total EBITMargin
15911.1%
14710.6%
8%50 bps

Page 11
CASH FLOW DEVELOPMENT
Conference Call – Q1/2016 Results, Fresenius SE & Co. KGaA, Investor Relations © Copyright, May 3, 2016
1 Before acquisitions and dividends2 Margin incl. FMC dividend3 Understated: 6.0% excluding €46 million of capex commitments from acquisitions
Operating CF Capex (net) Free Cash Flow1
€m Q1/2016 LTM Margin Q1/2016 LTM Margin Q1/2016 LTM Margin
124 15.8% -67 -5.4% 57 10.4%
66 10.1% -37 -4.9% 29 5.2%3
-18 6.4% -2 -1.1% -20 5.3%
Corporate/Other -1 n.a. -3 n.a. -4 n.a.
excl. FMC 171 13.1%2 -109 -4.9% 62 8.2%2
Group 334 11.2% -332 -5.5% 2 5.7%

Page 12
FRESENIUS GROUP: 2016 FINANCIAL OUTLOOK BY BUSINESS SEGMENT
Conference Call – Q1/2016 Results, Fresenius SE & Co. KGaA, Investor Relations © Copyright, May 3, 2016
FreseniusKabi
Sales growth organic
EBIT constant currency
low single-digitroughly flat
FreseniusHelios
Sales growth organic
EBIT3% – 5%€670 – 700 m
FreseniusVamed
Sales growth organic
EBIT growth 5% – 10%5% – 10%

Page 13
FRESENIUS GROUP: 2016 FINANCIAL GUIDANCE
Conference Call – Q1/2016 Results, Fresenius SE & Co. KGaA, Investor Relations © Copyright, May 3, 2016
Sales growthconstant currency
6% ‒ 8%
Net income growth1
constant currency
8% ‒ 12%
1 Net income attributable to shareholders of Fresenius SE & Co. KGaA; 2015 before special items

Page 14
ATTACHMENTS
Conference Call – Q1/2016 Results, Fresenius SE & Co. KGaA, Investor Relations © Copyright, May 3, 2016

Page 15
FRESENIUS GROUP: OVERVIEW – CALCULATION OF NONCONTROLLING INTEREST
Conference Call – Q1/2016 Results, Fresenius SE & Co. KGaA, Investor Relations © Copyright, May 3, 2016
€m Q1/2016 FY/2015
Earnings before tax and noncontrolling interest 807 3,262
Taxes -229 -965
Noncontrolling interest, thereofFresenius Medical Care net income not attributable to Fresenius (Q1/16: ~69%)
Noncontrolling interest holders in Fresenius Medical Care(Q1/16: US$69 m according to Fresenius Medical Care’s Financial Statements)
Noncontrolling interest holders in Fresenius Kabi (-€9 m), Fresenius Helios (€0 m), Fresenius Vamed (€0 m) and due to Fresenius Vamed’s 23% external ownership (-€1 m)
-216-144
-62
-10
-939-641
-256
-42
Net income attributable to Fresenius SE & Co. KGaA 362 1,358

Page 16
FRESENIUS GROUP: CASH FLOW
Conference Call – Q1/2016 Results, Fresenius SE & Co. KGaA, Investor Relations © Copyright, May 3, 2016
€m Q1/2016 LTM Margin Q1/2015 LTM Margin Growth YoY
Operating Cash FlowCapex (net)
334-332
11.2%-5.5%
531-273
12.1%-5.5%
-37%-22%
Free Cash Flow(before acquisitions and dividends)
Acquisitions (net)
Dividends
2
-196
-47
5.7% 258
45
-47
6.6% -99%
--
0%
Free Cash Flow(after acquisitions and dividends)
-241 2.5% 256 -0.4% -194%

Page 17
CASH FLOW DEVELOPMENT LTM
Conference Call – Q1/2016 Results, Fresenius SE & Co. KGaA, Investor Relations © Copyright, May 3, 2016
1 Before acquisitions and dividends2 Margin incl. FMC dividend3 Understated: 6.0% excluding €46 million of capex commitments from acquisitions
Operating CF Capex (net) Free Cash Flow1
€m LTM Q1/2016
LTM Margin LTM Q1/2016
LTM Margin LTM Q1/2016
LTM Margin
954 15.8% -326 -5.4% 628 10.4%
570 10.1% -278 -4.9% 292 5.2%3
72 6.4% -12 -1.1% 60 5.3%
Corporate/Other 1 n.a. -13 n.a. -12 n.a.
excl. FMC 1,671 13.1%2 -629 -4.9% 1,042 8.2%2
Group 3,130 11.2% -1,521 -5.5% 1,609 5.7%
Page 18
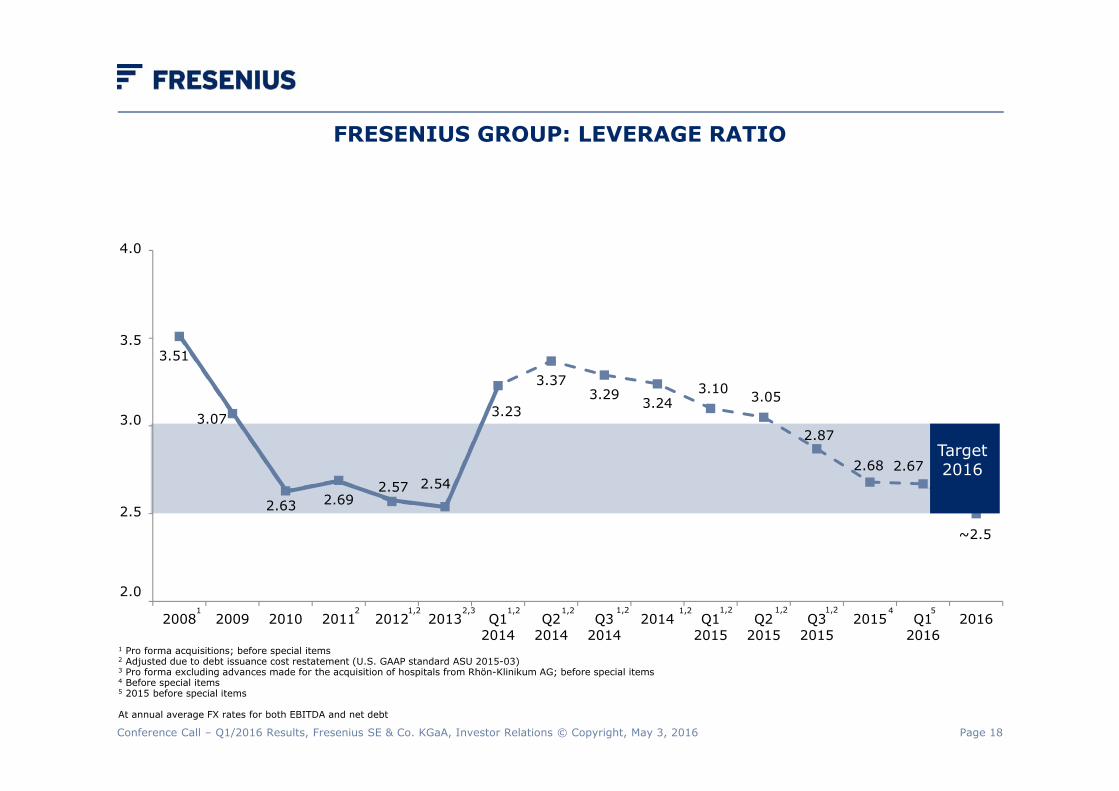
FRESENIUS GROUP: LEVERAGE RATIO
3.51
3.07
2.63 2.692.57 2.54
3.23
3.373.29 3.24
3.10 3.05
2.87
2.68 2.67
~2.5
2008 2009 2010 2011 2012 2013 Q12014
Q22014
Q32014
2014 Q12015
Q22015
Q32015
2015 Q12016
20161,2 1,21,2 1,2 1,2 42 2,31 1,2 1,2 1,2 5
Conference Call – Q1/2016 Results, Fresenius SE & Co. KGaA, Investor Relations © Copyright, May 3, 2016
1 Pro forma acquisitions; before special items2 Adjusted due to debt issuance cost restatement (U.S. GAAP standard ASU 2015-03)3 Pro forma excluding advances made for the acquisition of hospitals from Rhön-Klinikum AG; before special items4 Before special items5 2015 before special items
At annual average FX rates for both EBITDA and net debt
4.0
3.5
3.0
2.5
2.0
Target 2016

Page 19
FRESENIUS KABI: STRONG ORGANIC SALES GROWTH
Conference Call – Q1/2016 Results, Fresenius SE & Co. KGaA, Investor Relations © Copyright, May 3, 2016
€m Q1/2016 Q1/2015OrganicGrowth
IV Drugs 645 545 18%
Infusion Therapy 202 231 5%
Clinical Nutrition 378 372 8%
Medical Devices/Transfusion Technology 245 246 2%
Total sales 1,470 1,394 10%

Page 20
FRESENIUS KABI: STRONG ORGANIC SALES GROWTH
Conference Call – Q1/2016 Results, Fresenius SE & Co. KGaA, Investor Relations © Copyright, May 3, 2016
€m Q1/2016 Q1/2015OrganicGrowth
Europe 512 518 1%
North America 576 473 20%
Asia-Pacific 254 268 7%
Latin America/Africa 128 135 21%
Total sales 1,470 1,394 10%

Page 21
FRESENIUS HELIOS: ORGANIC SALES GROWTH FULLY IN LINE WITH EXPECTATION
Conference Call – Q1/2016 Results, Fresenius SE & Co. KGaA, Investor Relations © Copyright, May 3, 2016
€m Q1/2016 Q1/2015 Growth
Established clinic portfolio 1,433 1,391 3%
Acquisitions(consolidation <1 yr)
2 - -
Total sales 1,435 1,391 3%

Page 22
FRESENIUS HELIOS: PERFORMANCE INDICATORS
Conference Call – Q1/2016 Results, Fresenius SE & Co. KGaA, Investor Relations © Copyright, May 3, 2016
Q1/2016 Q1/2015 Change
No. of hospitals1
- Acute care clinics- Post-acute care clinics
1118724
1118724
0%0%0%
No. of beds1
- Acute care clinics- Post-acute care clinics
34,01128,8995,112
34,07628,9145,162
0%0%
-1%
Admissions - Acute care (inpatient) 308,586 305,905 1%
Occupancy- Post-acute care 76% 78%
Average length of stay (days)- Acute care2
- Post-acute care6.4
25.36.6
26.8
1 December 31, 20152 German average (2014): 7.4

Page 23
FRESENIUS HELIOS: ACQUISITIONS / DIVESTITURES – CONSOLIDATION EFFECTS
Conference Call – Q1/2016 Results, Fresenius SE & Co. KGaA, Investor Relations © Copyright, May 3, 2016
Acquisitions Annualized sales
Diekholzen ~€8 m consolidated as of April 1, 2015
Velbert/Niederberg ~€69 m (2015) consolidated as of May 1, 2016

Page 24
FRESENIUS VAMED: STRONG ORDER INTAKE
Conference Call – Q1/2016 Results, Fresenius SE & Co. KGaA, Investor Relations © Copyright, May 3, 2016
1 Project business only2 December 31, 2015
€m Q1/2016 Q1/2015 Growth
Project business 85 80 6%
Service business 133 128 4%
Total sales 218 208 5%
Total EBITMargin
73.2%
73.4%
0%-20 bps
Order intake1 237 192 23%
Order backlog1 1,803 1,6502 9%

Page 25
FRESENIUS GROUP: KEY FIGURES ACCORDING TO IFRS
Conference Call – Q1/2016 Results, Fresenius SE & Co. KGaA, Investor Relations © Copyright, May 3, 2016
1 Net income attributable to shareholders of Fresenius SE & Co. KGaA
For a detailed overview of special items please see the reconciliation table on slide 26.
Q1/2016 U.S. GAAP
Q1/2016IFRS
Sales 6,914 7,015
EBIT 959 959
Net interest -152 -152
Net income1 362 358
Operating cash flow 334 336
Balance sheet total 42,445 42,712

Page 26
RECONCILIATION ACCORDING TO U.S. GAAPQ1 2016 / Q1 2015
The Group’s U.S. GAAP financial results as of March 31, 2016 do not include special items, whereas the U.S. GAAP financial results as of March 31, 2015 include special items. Net income attributable to shareholders of Fresenius SE & Co. KGaA was adjusted for these special items. The table below shows the special items and the reconciliation from net income (before specialitems) to earnings according to U.S. GAAP.
The special items are reported in the Group Corporate/Other segment.
Conference Call – Q1/2016 Results, Fresenius SE & Co. KGaA, Investor Relations © Copyright, May 3, 2016
€mQ1/2015 before
special itemsefficiency program
KABI
integration costs for acquired Rhön
hospitals
disposal gains from two HELIOS
hospitals
Q1/2015 according to U.S. GAAP (incl.
special items)
Sales 6,483 6,483
EBITInterest result
851-165
-10 -2 34 873-165
Net income before taxesIncome taxes
686-207
-103
-2 34 708-204
Net incomeNoncontrolling interest
479-187
-7 -2 34 504-187
Net income attributableto shareholders of Fresenius SE & Co. KGaA 292 -7 -2 34 317

Page 27
SHARE INFORMATION
Share key factsNumber of shares1 545,810,836WKN / ISIN 578560 / DE0005785604Ticker symbol FREBloomberg symbol FRE GRReuters symbol FREG.de
ADR key factsRatio 4 ADRs = 1 ordinary shareADR CUSIP / ISIN 35804M105 / US35804M1053 Ticker symbol FSNUYExchange OTCQX International PremierStructure Sponsored Level I ADRDepositary bank Deutsche Bank
1 As of March 31, 2016
Conference Call – Q1/2016 Results, Fresenius SE & Co. KGaA, Investor Relations © Copyright, May 3, 2016

Page 28
FINANCIAL CALENDAR 2016
13.05.2016 Annual General Meeting, Frankfurt/Main
02.08.2016 Report on 2nd quarter 2016
27.10.2016 Report on 3rd quarter 2016Please note that these dates could be subject to change.
CONTACT
Investor RelationsFresenius SE & Co. KGaA
phone: +49 6172 608-2485e-mail: [email protected]
For further information and current news: www.fresenius.com
Conference Call – Q1/2016 Results, Fresenius SE & Co. KGaA, Investor Relations © Copyright, May 3, 2016