Embed Size (px)
Citation preview

Conference Call
2th Quarter 2014
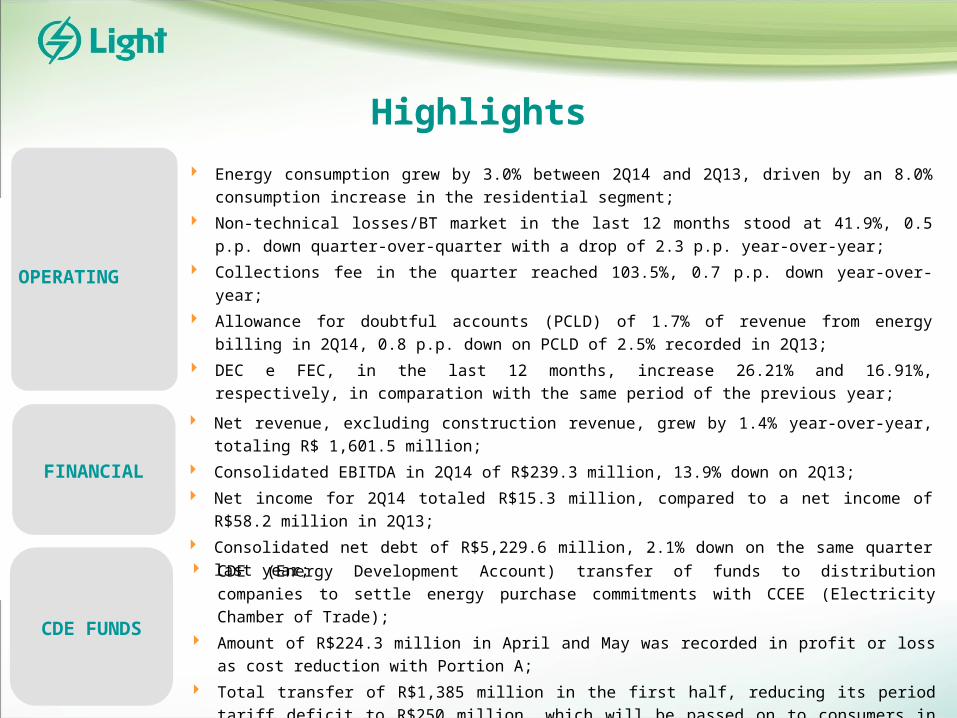
Highlights
Energy consumption grew by 3.0% between 2Q14 and 2Q13, driven by an 8.0% consumption increase in the residential segment;
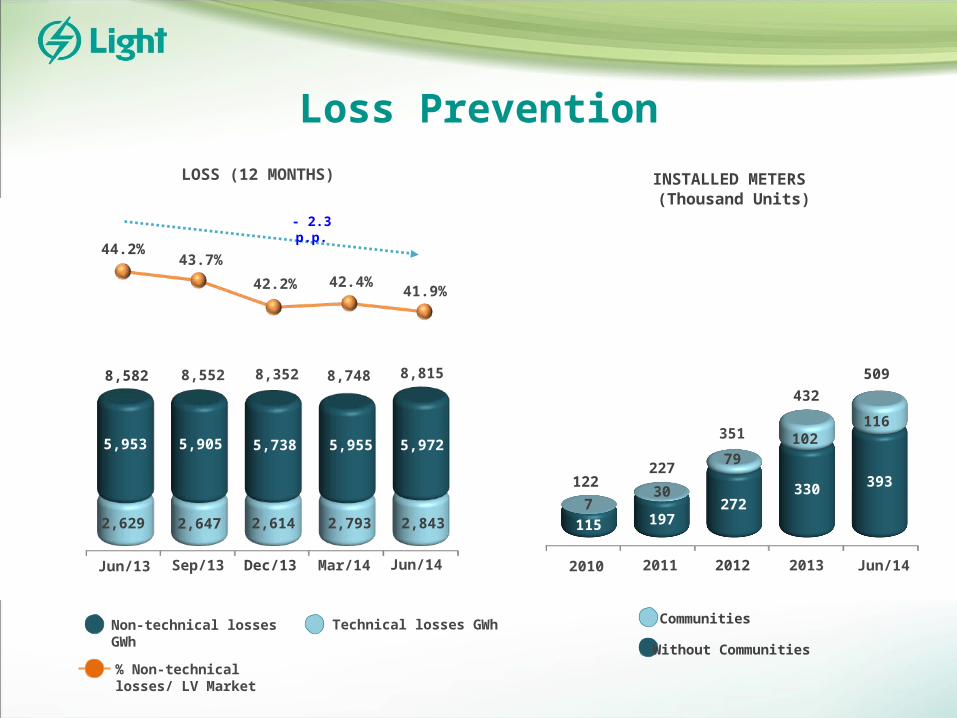
Non-technical losses/BT market in the last 12 months stood at 41.9%, 0.5 p.p. down quarter-over-quarter with a drop of 2.3 p.p. year-over-year;
Collections fee in the quarter reached 103.5%, 0.7 p.p. down year-over-year;
Allowance for doubtful accounts (PCLD) of 1.7% of revenue from energy billing in 2Q14, 0.8 p.p. down on PCLD of 2.5% recorded in 2Q13;
DEC e FEC, in the last 12 months, increase 26.21% and 16.91%, respectively, in comparation with the same period of the previous year;
OPERATING
Net revenue, excluding construction revenue, grew by 1.4% year-over-year, totaling R$ 1,601.5 million;
Consolidated EBITDA in 2Q14 of R$239.3 million, 13.9% down on 2Q13;
Net income for 2Q14 totaled R$15.3 million, compared to a net income of R$58.2 million in 2Q13;
Consolidated net debt of R$5,229.6 million, 2.1% down on the same quarter last year;
FINANCIAL
CDE FUNDS
CDE (Energy Development Account) transfer of funds to distribution companies to settle energy purchase commitments with CCEE (Electricity Chamber of Trade);
Amount of R$224.3 million in April and May was recorded in profit or loss as cost reduction with Portion A;
Total transfer of R$1,385 million in the first half, reducing its period tariff deficit to R$250 million, which will be passed on to consumers in the next tariff adjustment through the CVA.
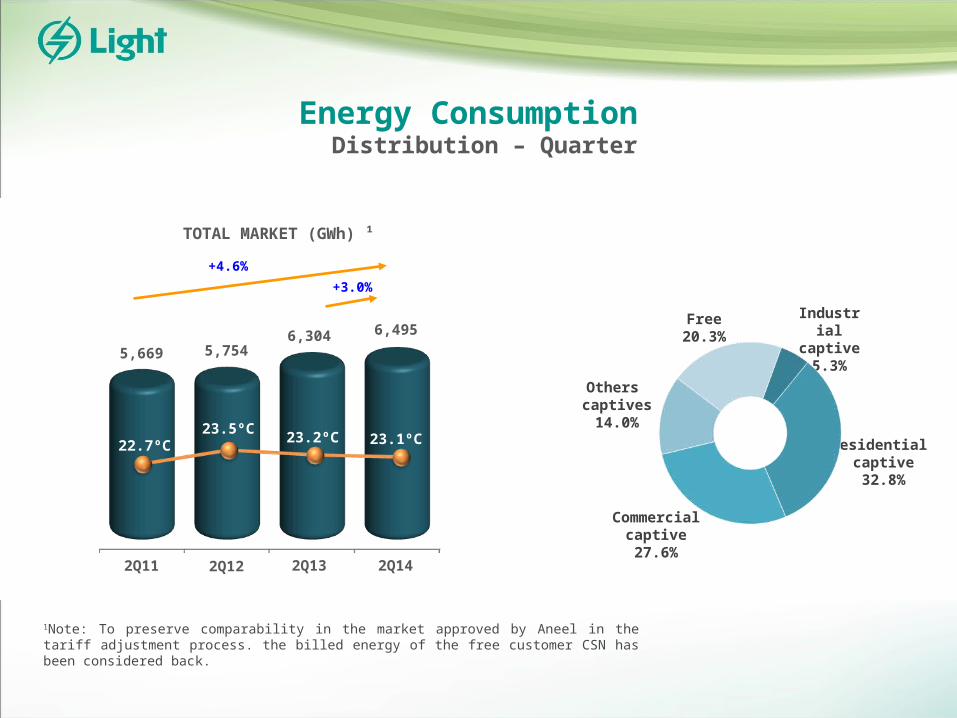
Energy Consumption Distribution – Quarter
1Note: To preserve comparability in the market approved by Aneel in the tariff adjustment process. the billed energy of the free customer CSN has been considered back.
TOTAL MARKET (GWh) ¹
Industrial captive
5.3%
Free20.3%
Others captives
14.0%
Commercialcaptive27.6%
Residential captive32.8%
2Q122Q11 2Q13 2Q14
+3.0%
6,3045,754
23.2ºC
23.1ºC
5,669
6,495
23.5ºC22.7º
C
+4.6%
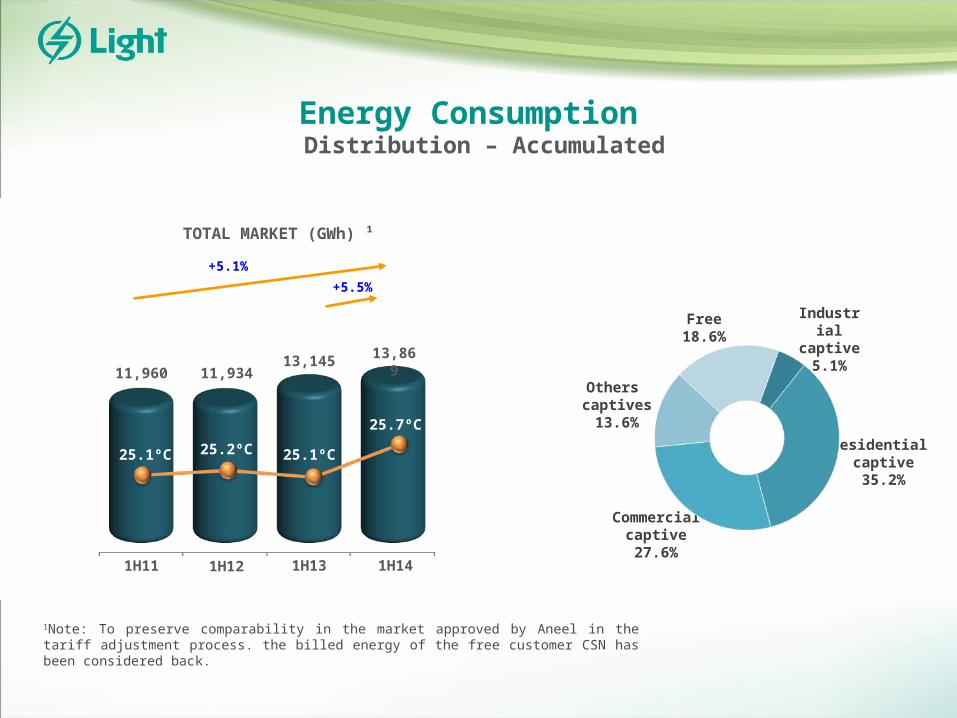
Energy Consumption Distribution – Accumulated
1Note: To preserve comparability in the market approved by Aneel in the tariff adjustment process. the billed energy of the free customer CSN has been considered back.
TOTAL MARKET (GWh) ¹
Industrial captive
5.1%
Free18.6%
Others captives
13.6%
Commercialcaptive27.6%
Residential captive35.2%
+5.5%
1H121H11
+5.1%
1H13 1H14
13,14511,93
4
25.7ºC
11,960
13,869
25.2ºC25.1ºC
25.1ºC
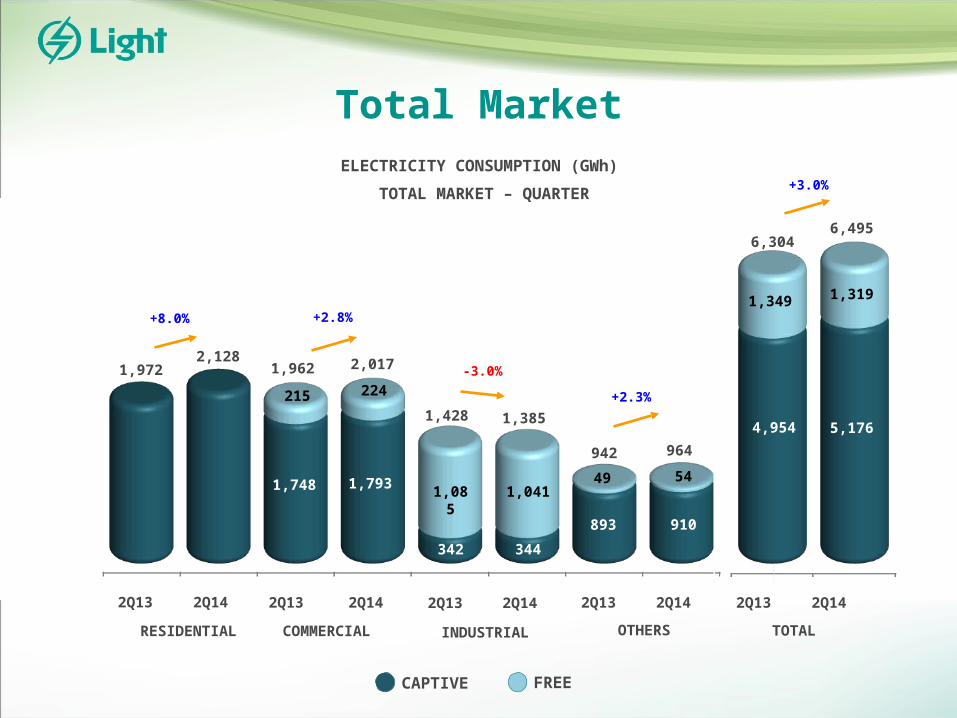
Total Market
RESIDENTIAL INDUSTRIALCOMMERCIAL OTHERS TOTAL
2Q13 2Q14
ELECTRICITY CONSUMPTION (GWh)
TOTAL MARKET – QUARTER
2Q13 2Q14 2Q13 2Q14 2Q13 2Q14 2Q13 2Q14
FREECAPTIVE
4,954 5,176
6,304
1,349 1,319
+2.3%
893 910
942
49 54
964
+2.8%
1,962
215 224
2,017
1,428
1,085
1,041
1,385
+8.0%
1,9722,128
-3.0%
1,748 1,793
+3.0%
342 344
6,495
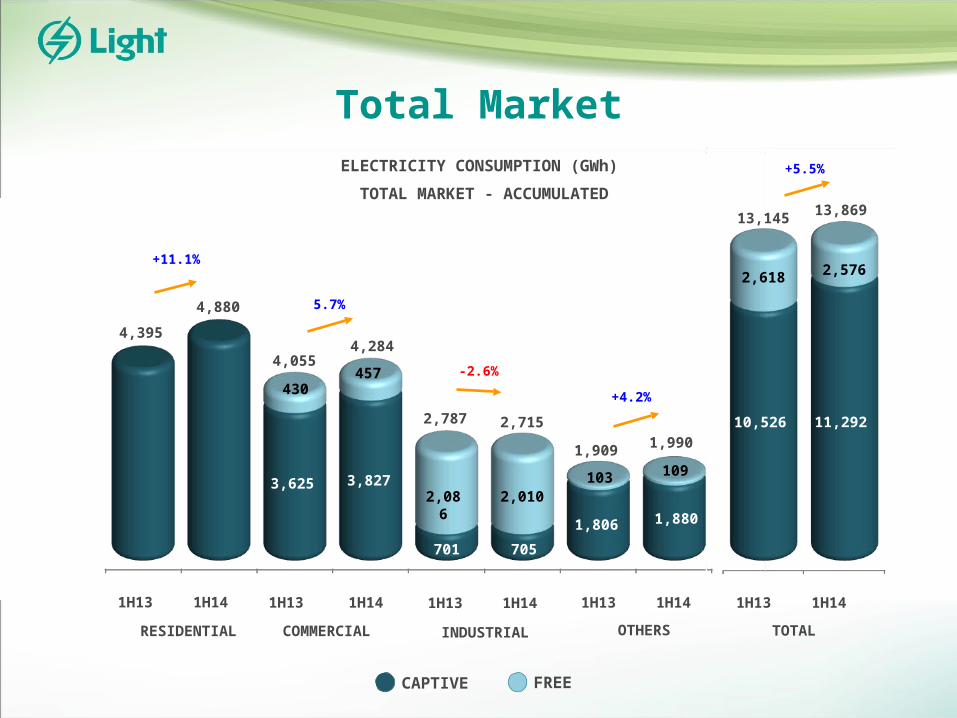
Total Market
RESIDENTIAL INDUSTRIALCOMMERCIAL OTHERS TOTAL
1H13 1H14
ELECTRICITY CONSUMPTION (GWh)
TOTAL MARKET - ACCUMULATED
1H13 1H14 1H13 1H14 1H13 1H14 1H13 1H14
FREECAPTIVE
5,176
893 910
1,748
342 344
+5.5%
10,526 11,292
13,145
2,618 2,576
13,869
+4.2%
1,806 1,880
1,909
103 109
1,990
5.7%
4,055
430457
4,284
701 705
2,787
2,086
2,010
2,715
+11.1%
4,395
4,880
-2.6%
3,625 3,827
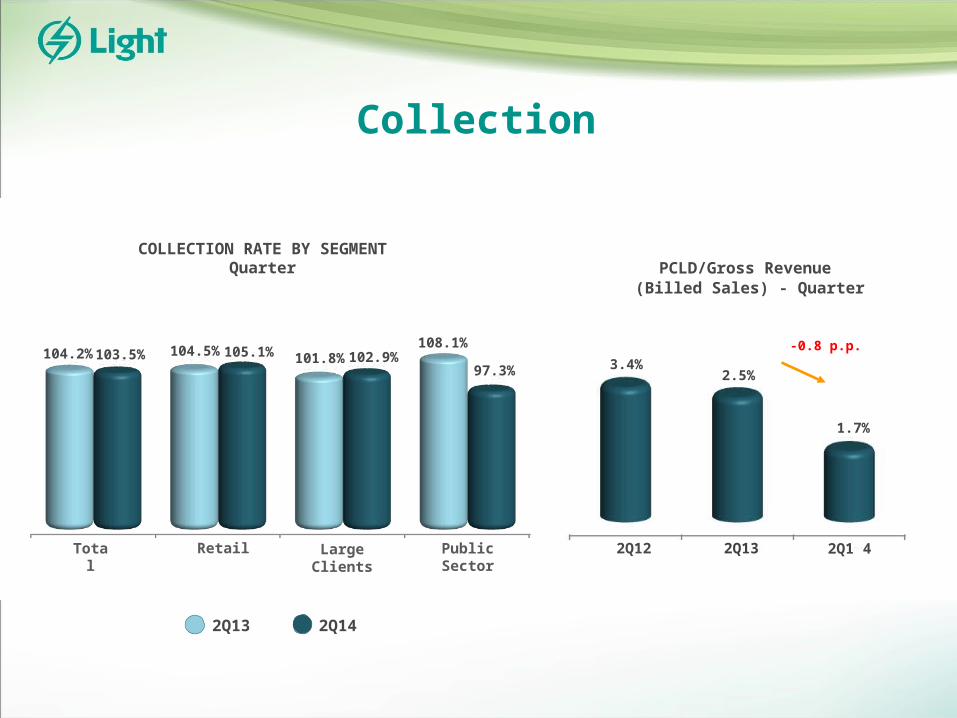
Collection
PCLD/Gross Revenue (Billed Sales) - Quarter
COLLECTION RATE BY SEGMENTQuarter
2Q13
2Q14
103.5%
104.5%
105.1% 101.8%
102.9%
108.1%
Total Retail Large Clients
Public Sector
104.2% 97.3%
2Q12 2Q1 42Q13
3.4%2.5%
1.7%
-0.8 p.p.
2009 2010 2011 2012 2013
Loss Prevention
LOSS (12 MONTHS)
% Non-technical losses/ LV Market
Non-technical losses GWh
Technical losses GWh
Jun/13 Sep/13 Mar/14 Jun/14Dec/13
INSTALLED METERS (Thousand Units)
Communities
Without Communities
2010 2011 20132012
115
Jun/14
43.7%
5,738
2,614
8,552
44.2%
5,972
2,843
8,352
41.9%
5,953
2,629
8,815
5,905
2,647
8,582
- 2.3 p.p.
42.2%
42.4%
5,955
2,793
8,748
351
30
79102
227
432
272330
7
122
116
509
197
393
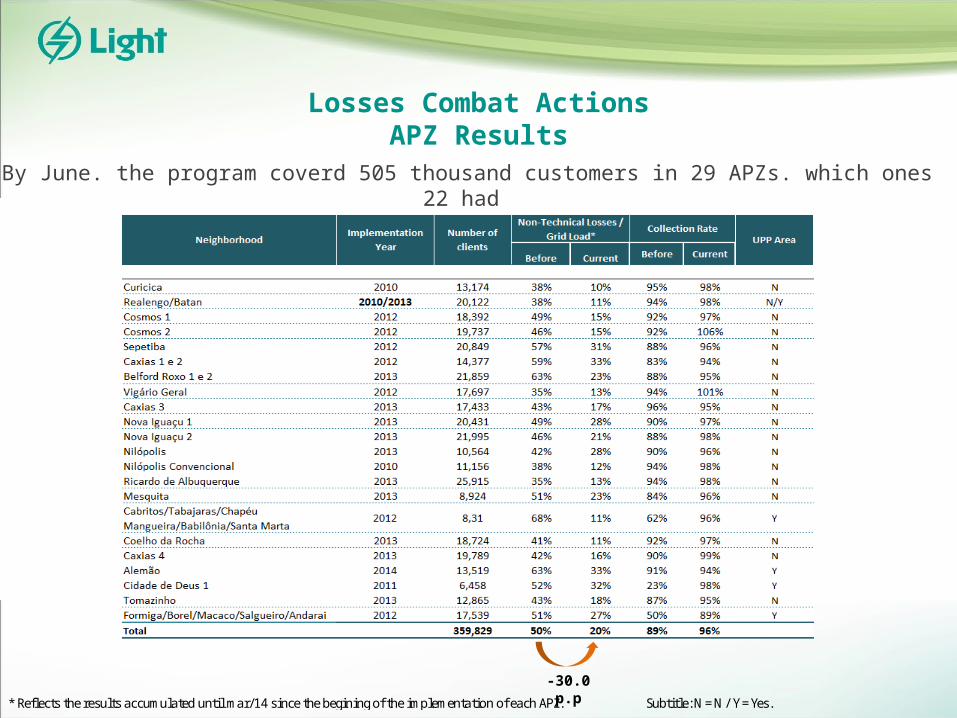
Losses Combat ActionsAPZ Results
By June. the program coverd 505 thousand customers in 29 APZs. which ones 22 had the results calculated:
* Reflects the results accumulated until mar/14 since the begining of the implementation of each APZ. Subtitle: N = N / Y = Yes.-30.0 p.p
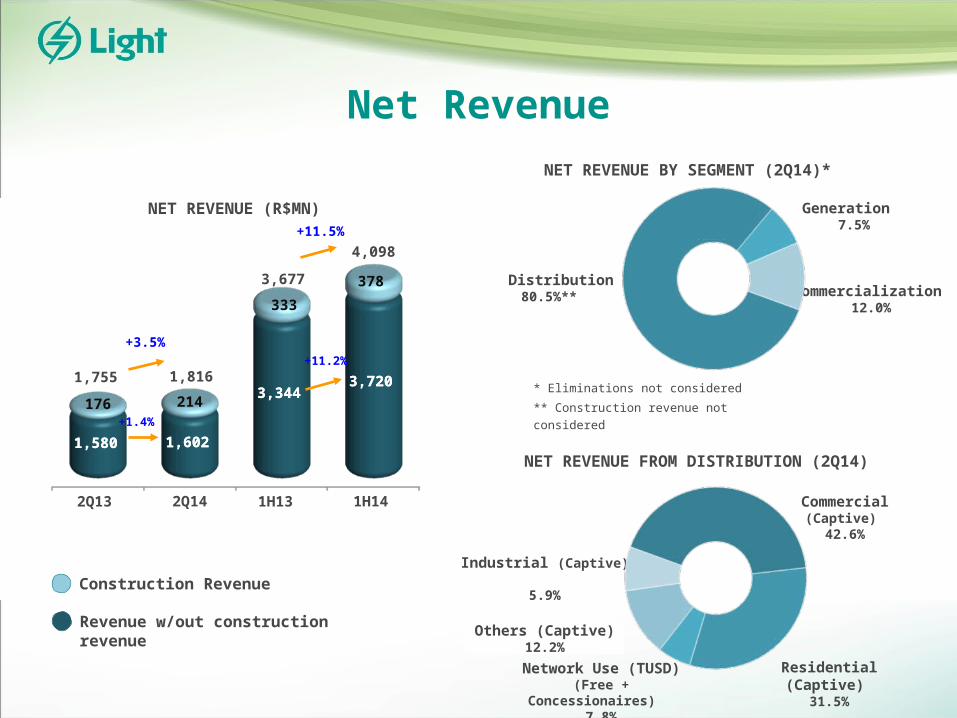
Net Revenue
Industrial (Captive) 5.9%
NET REVENUE (R$MN) Generation 7.5%
Distribution 80.5%**
NET REVENUE BY SEGMENT (2Q14)*
Commercialization 12.0%
* Eliminations not considered
** Construction revenue not considered
NET REVENUE FROM DISTRIBUTION (2Q14)
Commercial (Captive)
42.6%
Others (Captive) 12.2%
Network Use (TUSD)(Free +
Concessionaires)
7.8%
Residential (Captive)
31.5%
Construction RevenueRevenue w/out construction revenue
+3.5%
1.580 1.602
378
333
1,755
3,677
2Q14
+1.4%
1H13
3.3443.720
+11.2%
214176
1,816
4,098
2Q13 1H14
1,580 1,602
3,3443,720
+11.5%
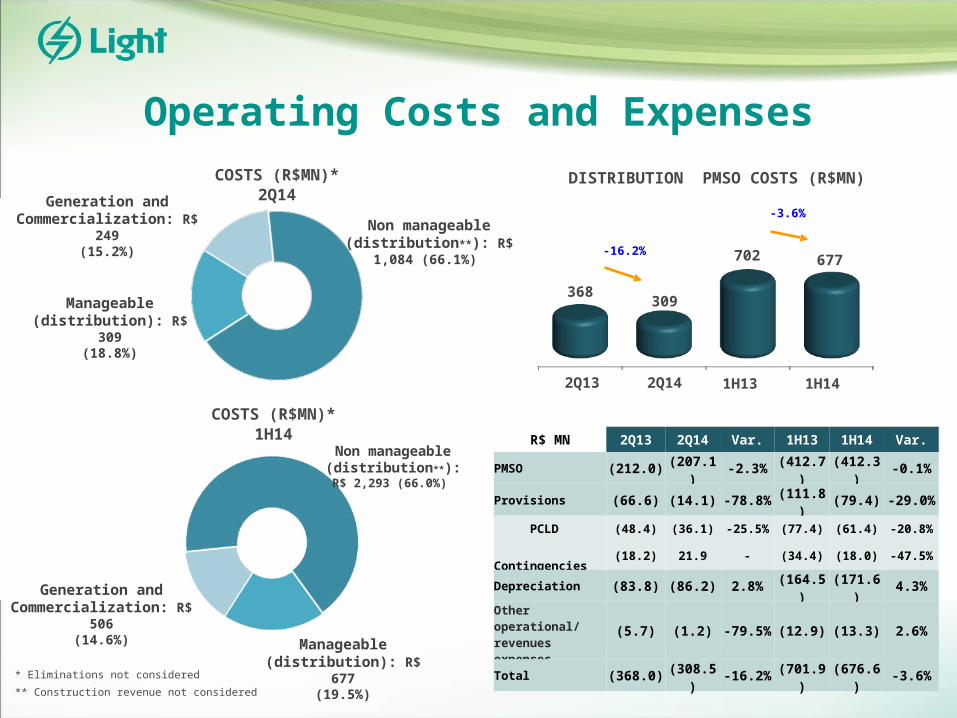
Operating Costs and Expenses
Manageable (distribution): R$
309(18.8%)
Generation and Commercialization: R$
249(15.2%)
Non manageable (distribution**): R$
1,084 (66.1%)
* Eliminations not considered
** Construction revenue not considered
DISTRIBUTION PMSO COSTS (R$MN)COSTS (R$MN)*2Q14
COSTS (R$MN)*1H14
Non manageable (distribution**): R$ 2,293 (66.0%)
Generation and Commercialization: R$
506(14.6%) Manageable
(distribution): R$ 677
(19.5%)
R$ MN 2Q13 2Q14 Var. 1H13 1H14 Var.
PMSO (212.0) (207.1) -2.3% (412.7) (412.3) -0.1%
Provisions (66.6) (14.1) -78.8% (111.8) (79.4) -29.0%
PCLD (48.4) (36.1) -25.5% (77.4) (61.4) -20.8%
Contingencies (18.2) 21.9 - (34.4) (18.0) -47.5%
Depreciation (83.8) (86.2) 2.8% (164.5) (171.6) 4.3%
Other operational/revenues expenses (5.7) (1.2) -79.5% (12.9) (13.3) 2.6%
Total (368.0) (308.5) -16.2% (701.9) (676.6) -3.6%
368309
-16.2% 702 677
1H141H13
-3.6%
2Q142Q13
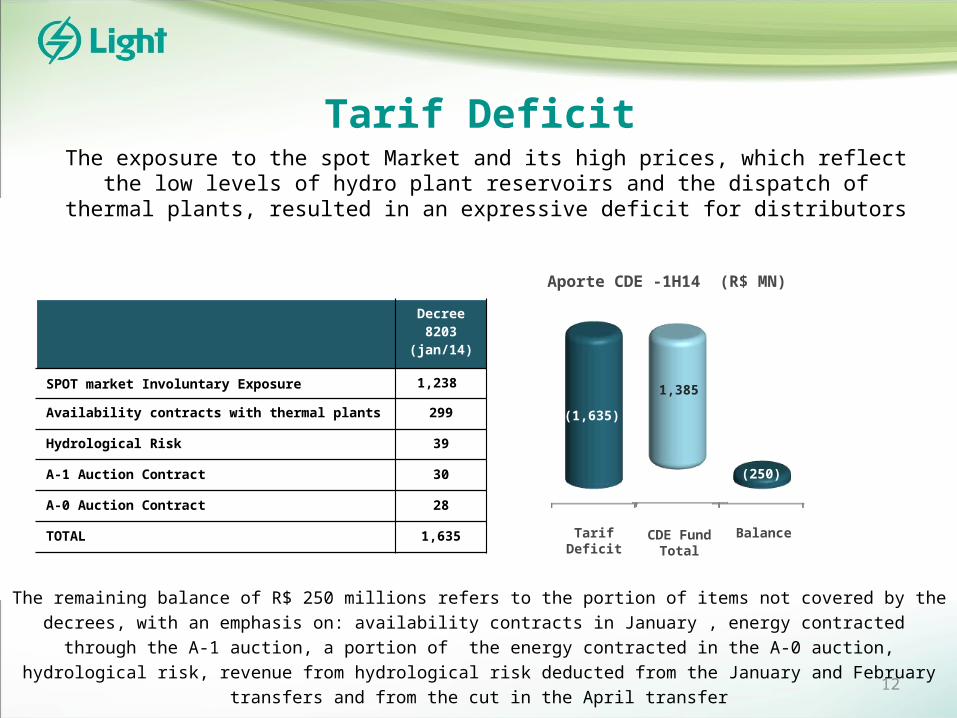
Tarif Deficit
12
Tarif Deficit BalanceCDE FundTotal
Aporte CDE -1H14 (R$ MN)
Decree8203
(jan/14)
SPOT market Involuntary Exposure 1,238
Availability contracts with thermal plants 299
Hydrological Risk 39
A-1 Auction Contract 30
A-0 Auction Contract 28
TOTAL 1,635
(250)
(1,635)
1,385
The remaining balance of R$ 250 millions refers to the portion of items not covered by the decrees, with an emphasis on: availability contracts in January , energy contracted through the A-1 auction, a portion of the
energy contracted in the A-0 auction, hydrological risk, revenue from hydrological risk deducted from the January and February transfers and from the cut in the April transfer
The exposure to the spot Market and its high prices, which reflect the low levels of hydro plant reservoirs and the dispatch of thermal plants, resulted in an expressive deficit for
distributors
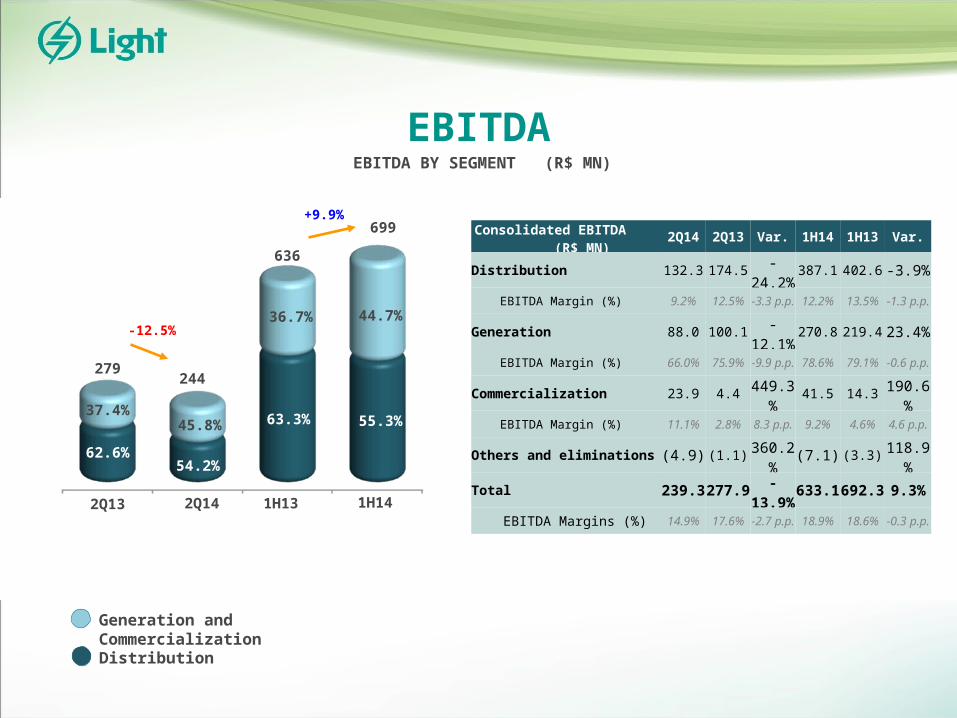
EBITDAEBITDA BY SEGMENT (R$ MN)
Generation and CommercializationDistribution
56.0%244
-12.5%
279
45.8%
54.2%
37.4%
62.6%
2Q13 2Q14 1H13 1H14
63.3%
36.7% 44.7%
+9.9%
636
55.3%
699 Consolidated EBITDA (R$ MN)
2Q14 2Q13 Var. 1H14 1H13 Var.
Distribution 132.3 174.5 -24.2% 387.1 402.6 -3.9%
EBITDA Margin (%) 9.2% 12.5% -3.3 p.p. 12.2% 13.5% -1.3 p.p.
Generation 88.0 100.1 -12.1% 270.8 219.4 23.4%
EBITDA Margin (%) 66.0% 75.9% -9.9 p.p. 78.6% 79.1% -0.6 p.p.
Commercialization 23.9 4.4 449.3% 41.5 14.3 190.6%
EBITDA Margin (%) 11.1% 2.8% 8.3 p.p. 9.2% 4.6% 4.6 p.p.
Others and eliminations (4.9) (1.1) 360.2% (7.1) (3.3) 118.9%
Total 239.3 277.9 -13.9% 633.1 692.3 9.3%
EBITDA Margins (%) 14.9% 17.6% -2.7 p.p. 18.9% 18.6% -0.3 p.p.
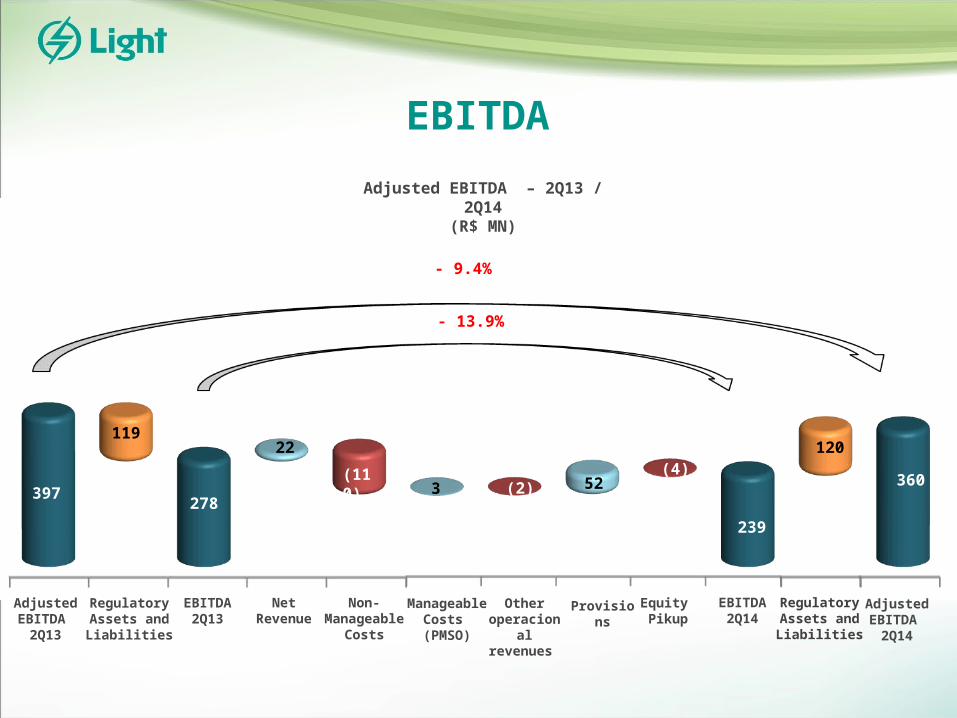
EBITDA
EBITDA2Q13
EBITDA2Q14
Net Revenu
e
Non-Manageabl
e Costs
Manageable Costs (PMSO)
Provisions
Regulatory Assets and Liabilities
Regulatory Assets and Liabilities
Adjusted EBITDA
2Q13
Adjusted EBITDA
2Q14
Adjusted EBITDA – 2Q13 / 2Q14(R$ MN)
Other operacion
al revenues
Equity Pikup
- 9.4%
- 13.9%
397278
(110)(2)
(4)
239
360
11922
3 52
120
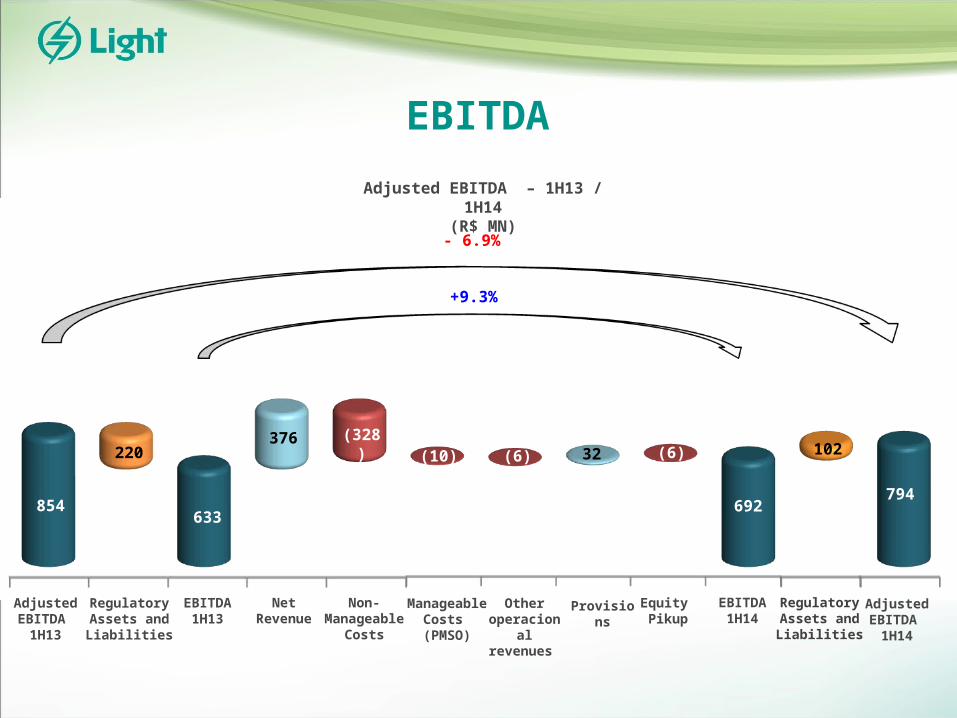
EBITDA
EBITDA1H13
EBITDA1H14
Net Revenu
e
Non-Manageabl
e Costs
Manageable Costs (PMSO)
Provisions
Regulatory Assets and Liabilities
Regulatory Assets and Liabilities
Adjusted EBITDA
1H13
Adjusted EBITDA
1H14
Adjusted EBITDA – 1H13 / 1H14(R$ MN)
Other operacion
al revenues
Equity Pikup
- 6.9%
+9.3%
854
220
633
376 (328)(10) (6) 32 (6)
692
102
794
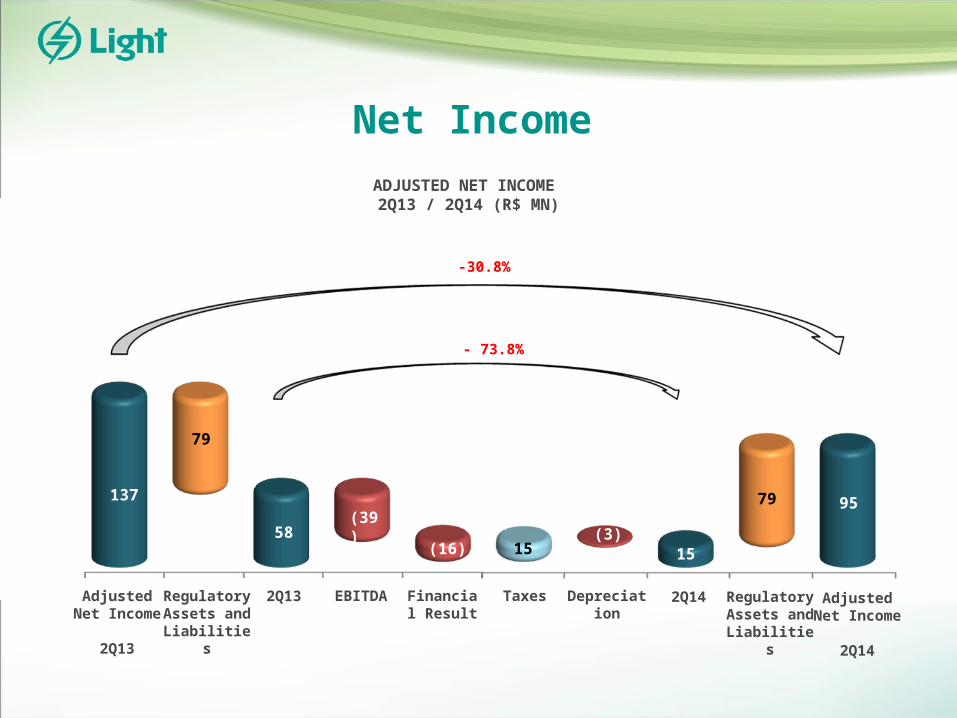
Net Income
2Q13 2Q14EBITDA
Financial Result
Taxes Depreciation
ADJUSTED NET INCOME 2Q13 / 2Q14 (R$ MN)
Regulatory Assets and Liabilities
Regulatory Assets and Liabilities
Adjusted Net Income
2Q13
Adjusted Net Income
2Q14
58
95
- 73.8%
-30.8%
137(39)
(16)(3)
15
79
15
79
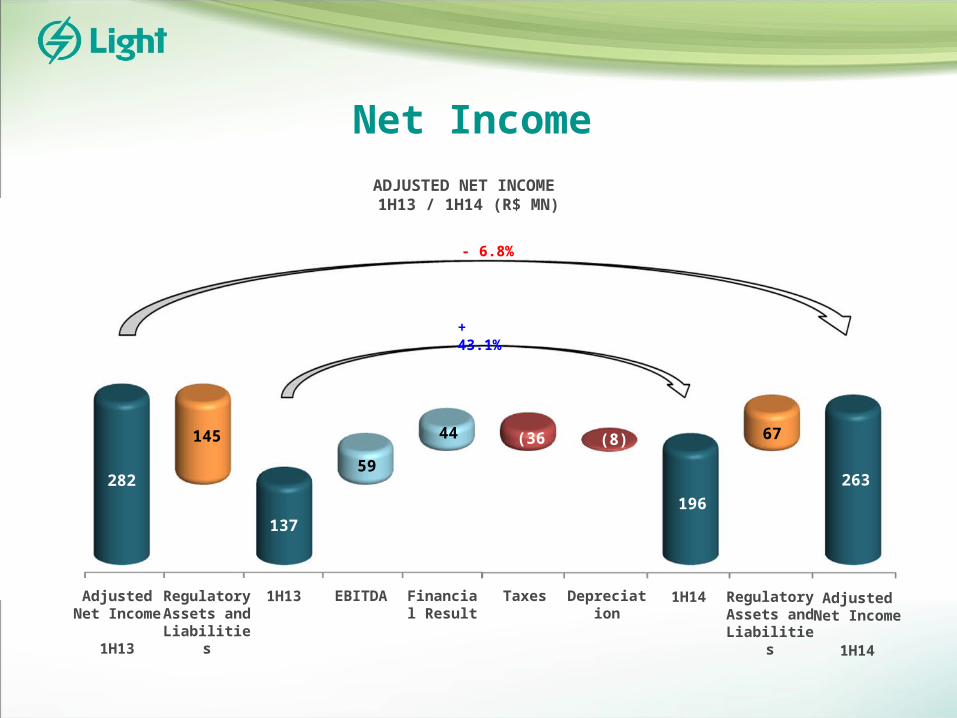
Net Income
1H13 1H14EBITDA
Financial Result
Taxes Depreciation
ADJUSTED NET INCOME 1H13 / 1H14 (R$ MN)
Regulatory Assets and Liabilities
Regulatory Assets and Liabilities
Adjusted Net Income
1H13
Adjusted Net Income
1H14
(16) (3)
+ 43.1%
- 6.8%
282
145
137
59
44 (36) (8)
196
67
263
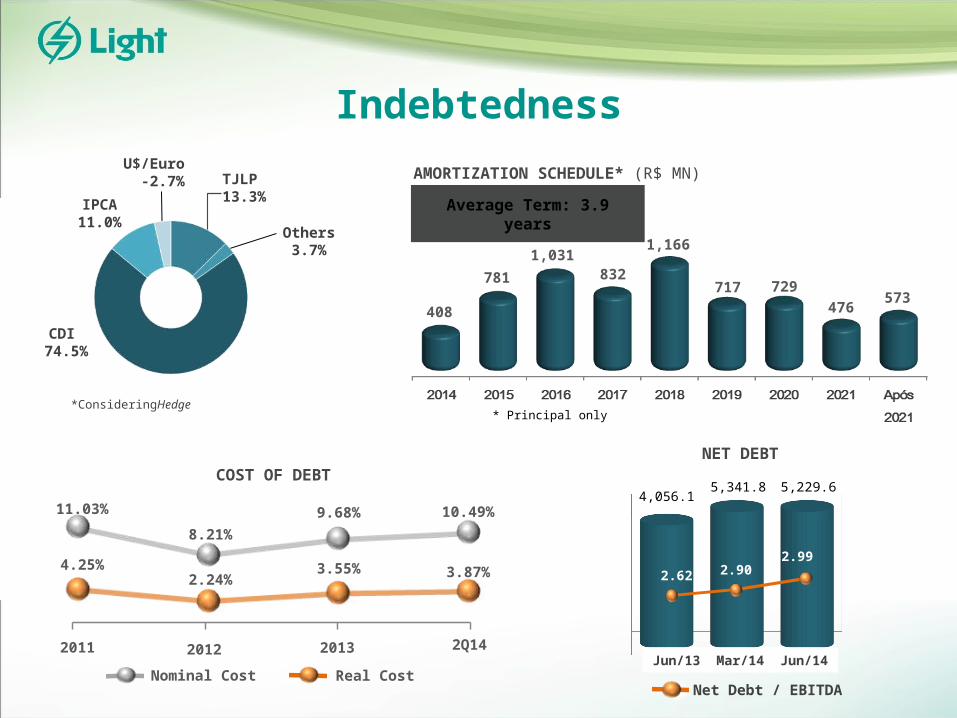
Indebtedness
Average Term: 3.9 years
AMORTIZATION SCHEDULE* (R$ MN)
Nominal Cost Real Cost
NET DEBT
*ConsideringHedge* Principal only
COST OF DEBT
20122011 2Q142007 2008 2009 set/10
Custo Real Custo Nominal
2013
Net Debt / EBITDA
2009 2010 2011 2012
Custo Nominal Custo Real
2009 2010 2011 2012
Custo Nominal Custo Real
2009 2010 2011 2012
Custo Nominal Custo Real
2.24%
8.21%
3.87%
10.49%
4.25%
11.03% 9.68%
3.55%
TJLP13.3%
CDI 74.5%
IPCA 11.0%
Others 3.7%
U$/Euro -2.7%
408
781
1,031832
1,166
717 729476
573
4,056.15,341.8 5,229.6
Jun/13
20092010
Custo Real
Custo Real
2.902.99
Jun/14Mar/14
2.62
20092010
Custo Real
Custo Real
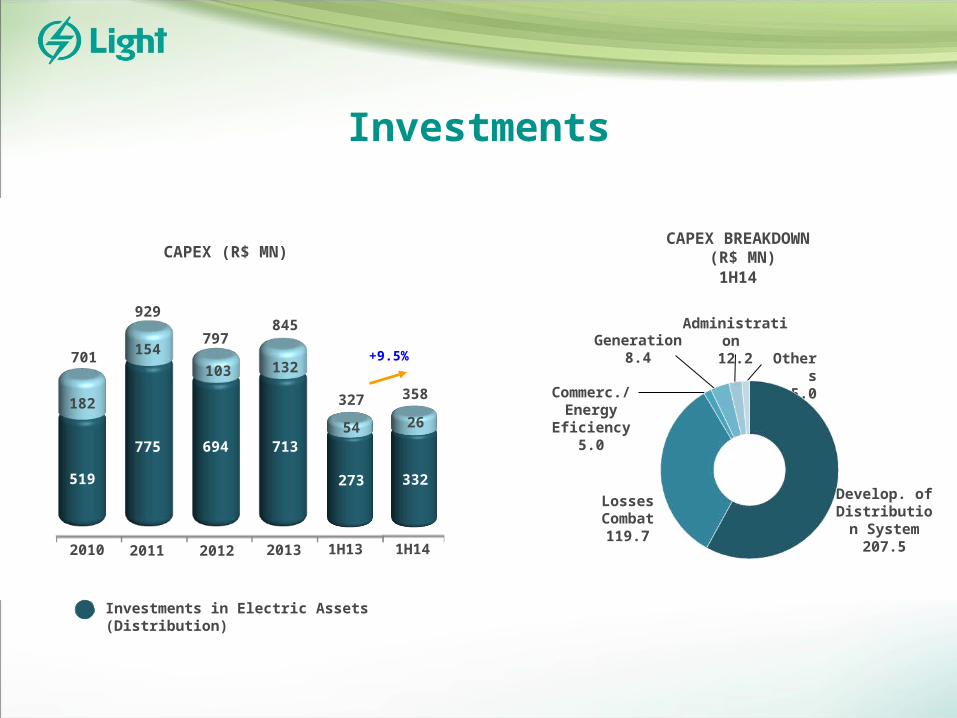
Investments
CAPEX (R$ MN)CAPEX BREAKDOWN
(R$ MN)1H14
Generation8.4
Administration
12.2 Others
5.0
Develop. of Distribution System
207.5
Losses Combat119.7
Investments in Electric Assets (Distribution)
Commerc./Energy
Eficiency5.0
519
2010
701
2011
2012
797
694
103
519
182
775
154
713
132
845
+9.5%
2013
327
1H13
1H14
54 26
273 332
358
929
Important Notice
This presentation may include declarations that represent forward-looking statements according to Brazilian regulations and international movable values. These declarations are based on certain assumptions and analyses made by the Company in accordance with its experience. the economic environment. market conditions and future events expected. many of which are out of the Company’s control. Important factors that can lead to significant differences between the real results and the future declarations of expectations on events or business-oriented results include the Company’s strategy. the Brazilian and international economic conditions. technology. financial strategy. developments of the public service industry. hydrological conditions. conditions of the financial market. uncertainty regarding the results of its future operations. plain. goals. expectations and intentions. among others. Because of these factors. the Company’s actual results may significantly differ from those indicated or implicit in the declarations of expectations on events or future results.
The information and opinions herein do not have to be understood as recommendation to potential investors. and no investment decision must be based on the veracity. the updated or completeness of this information or opinions. None of the Company’s assessors or parts related to them or its representatives will have any responsibility for any losses that can elapse from the use or the contents of this presentation.
This material includes declarations on future events submitted to risks and uncertainties. which are based on current expectations and projections on future events and trends that can affect the Company’s businesses. These declarations include projections of economic growth and demand and supply of energy. in addition to information on competitive position. regulatory environment. potential growth opportunities and other subjects. Various factors can adversely affect the estimates and assumptions on which these declarations are based on.
Contacts
João Batista Zolini CarneiroCFO and IRO
Gustavo WerneckSuperintendent of Finance and Investor Relations
+55 21 2211 [email protected]
Mariana da Silva RochaIR Manager
+ 55 21 2211 [email protected]
ri.light.com.br www.facebook.com/lightri twitter.com/LightRI