Embed Size (px)
Citation preview
Ca
Borderless Science Publishing 292
Canadian Chemical Transactions Year 2013 | Volume 1 | Issue 4 | Page 292-304
ISSN 2291-6458 (Print), ISSN 2291-6466 (Online)
Research Article DOI:10.13179/canchemtrans.2013.01.04.0047
Conductometric Titration Method for Determination of
Alfuzosin Hydrochloride and Fexofenadine Hydrochloride
Using Sodium Tetraphenylborate
Safwan Ashour*and Mouhammed Khateeb
Analytical Biochemistry Laboratory, Department of Chemistry, Faculty of Sciences, University of Aleppo,
Aleppo, Syria
*Corresponding Author: E-mail: [email protected]
Received: October 13, 2013 Revised: November 1, 2013 Accepted: November1, 2013 Published: November 2, 2013
Abstract: A simple, precise and low cost conductometric method for the determination of alfuzosin
hydrochloride and fexofenadine hydrochloride in pure form and pharmaceutical formulations using
sodium tetraphenylborate has been described. The method is based on the formation of ion association
complex of cations coming from the cited drugs with tetraphenylborate anions and the conductance of the
solution is measured as a function of the volume of titrant. Various experimental conditions were
evaluated. The described procedures allowed the determination of the studied drugs in double distilled
water in the range of 2.13 – 10.65 and 2.50 – 13.45 mg of alfuzosin hydrochloride and fexofenadine
hydrochloride, respectively. Statistical treatment of the experimental results indicates that the method is
precise and accurate. The accuracy of the method is indicated by the excellent recovery 99.85-102.49 and
99.80-100.48% for alfuzosin hydrochloride and fexofenadine hydrochloride, respectively, and the
precision is supported by the low relative standard deviation < 3.04%. The method was further applied
successively to pharmaceutical formulations, the proposed method offering a high degree of accuracy and
precision when compared to potentiometric pharmacopoeial methods.
Keywords: Alfuzosin Hydrochloride, Fexofenadine Hydrochloride, Sodium Tetraphenylborate,
Conductometry
1. INTRODUCTION
Alfuzosin hydrochloride is an alpha1-adrenoreceptor blocker. It is used in the symptomatic
treatment of urinary obstruction caused by benign prostatic hyperplasia and has been tried in the treatment
of hypertension. Alfuzosin hydrochloride is chemically designated as N-{3-[(4-Amino-6,7-
dimethoxyquinazolin-2-yl(methyl)amino]propyl}tetrahydro-2-furamide hydrochloride [1]. Several
methods have been reported for determination of alfuzosin hydrochloride in pharmaceutical formulations
Ca
Borderless Science Publishing 293
Canadian Chemical Transactions Year 2013 | Volume 1 | Issue 4 | Page 292-304
ISSN 2291-6458 (Print), ISSN 2291-6466 (Online)
include RP-HPLC [2-6], HPLC and HPTLC [7,8], conductometry [9], spectrophotometry [10-16],
colorimetry [17] and voltammetry [18]. Alfuzosin hydrochloride was also determined in biological fluids
by HPLC [19-23] and voltammetric methods [18,24].
Fexofenadine, ( )-4-[1-Hydroxy-4-[4-(hydroxyl diphenylmethyl)-1-piperidinyl]butyl]-alpha,
alpha-dimethyl benzene acetic acid, an active metabolite of terfenadine, is a selective histamine H1-
receptor antagonist, and is clinically effective in the treatment of seasonal allergic rhinitis and chronic
idiopathic urticaria as a first-line therapeutic agent, such as loratadine and cetirizine [1]. Literature survey
reveals several methods that have been used for the quantitative determination of fexofenadine
hydrochloride in pharmaceutical dosage such as HPLC with ultra violet detection [25-33], HPTLC [34],
potentiometry [35] and capillary electrophoresis [36,37]. Spectrophotometric methods have been reported
for the determination of fexofenadine hydrochloride [28,38-46] from its individual and combined
formulations with other active ingredients. Fexofenadine has been determined in human plasma by HPLC
with UV detection [31,32,47], fluorescence detection [48] and tandem mass spectrometry detection [49-
51].
The aim of this work was to report new condutometric methods that are simple, time-saving and
accurate for the determination of alfuzosin hydrochloride and fexofenadine hydrochloride as a raw
material and in some pharmaceutical preparations with no interference of other constituents in their
formulations.
2. EXPERIMENTAL
2.1. Apparatus
A conductometer – pH meter Consort C830 (Belgium) equipped with conductivity cell (cell
constant of 1.00) and combined glass pH electrode was used. The measurement ranges were 1.0-2000
μs/cm and 1.0-200 ms/cm with a precision 0.01 μs/cm. The temperature was maintained at 20 0.1 oC
with circulating water-bath thermostat connected to a jacket around the analysis vessel.
2.2. Chemicals
All chemicals and reagents used throughout this work were of analytical-reagent grade and
solutions were made with double distilled water. Alfuzosin hydrochloride (AFZ) was obtained from
Farmak, Czech, its purity was found to be 99.84% according to BP [52] and fexofenadine hydrochloride
(FEX) was obtained from Ind-SWIFT Laboratories Limited, India, its purity was found to be 100.15%
according to BP [52]. Sodium tetraphenylborate (NaTPB) was obtained from Aldrich. Methanol and
ethanol (Merck) were also used. Pharmaceutical preparations containing AFZ and FEX were purchased
from commercial sources in the local market.
2.3. Solutions
Solution of 0.01 M NaTPB was prepared by dissolving appropriate weight in 100 mL of double
distilled water. The solution was standardized and kept in light-resistant, well-closed container. Stock
standard solutions, 1.0 mg/mL of AFZ and FEX were prepared in double distilled water, stored in dark
bottles and kept in the refrigerator for not more than 10 days. Other concentrations of working solutions
were then prepared by suitable dilution of the stock solution with double distilled water.
2.4. General procedure
Aliquots of standard solution containing 2.13 – 10.65 mg of AFZ and 2.50 – 13.45 mg of FEX
were transferred to a 25 mL calibrated flasks and made up to the mark with double distilled water. The
Ca
Borderless Science Publishing 294
Canadian Chemical Transactions Year 2013 | Volume 1 | Issue 4 | Page 292-304
ISSN 2291-6458 (Print), ISSN 2291-6466 (Online)
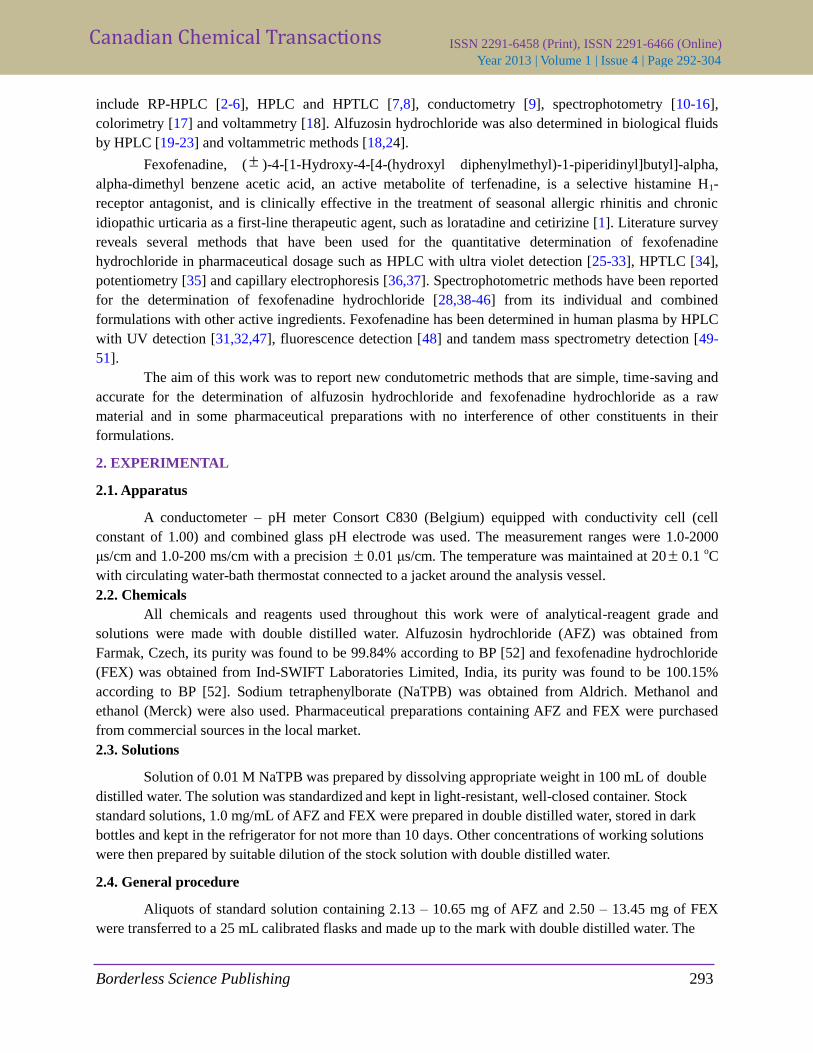
Figure 1. Effect of solvent on the end point of the conductometric titration
of 25 mL of AFZ 1.0×10⁻³
M with 10-2
M NaTPB at 20 oC.
contents of the calibrated flask were transferred quantitatively to a conductometric titration cell, the
conductivity cell was immersed in the sample solution, the solution was then titrated conductometrically
against 10-2
M NaTPB and the conductance was measured subsequent to each addition of the reagent
solution and after thorough stirring for one min. The conductance was corrected for dilution [53] by
means of the equation (1), assuming that conductivity is a linear function of dilution.
Ω‐1correct = Ω‐1
obs [V1+V2/V1] (1)
where Ω‐1correct is the corrected electrolytic conductivity, Ω‐1
obs is the observed electrolytic conductivity, V1
is the initial volume and V2 is the volume of reagent added.
A graph of corrected conductivity versus the volume of added titrant was constructed and the endpoint
was determined conductomerically.
The amount of drugs under study was calculated according to the equation (2),
Amount of drug = V.M.R / N (2)
where V is volume (mL) of titrant, M is molecular weight of drug, R is molar concentration of titrant and
N is number of moles of titrant consumed by one mole of drug.
2.5. Procedure for the pharmaceutical formulations
Twenty tablets or the contents of 20 capsules were weighed and finely powdered. An accurately
Ca
Borderless Science Publishing 295
Canadian Chemical Transactions Year 2013 | Volume 1 | Issue 4 | Page 292-304
ISSN 2291-6458 (Print), ISSN 2291-6466 (Online)
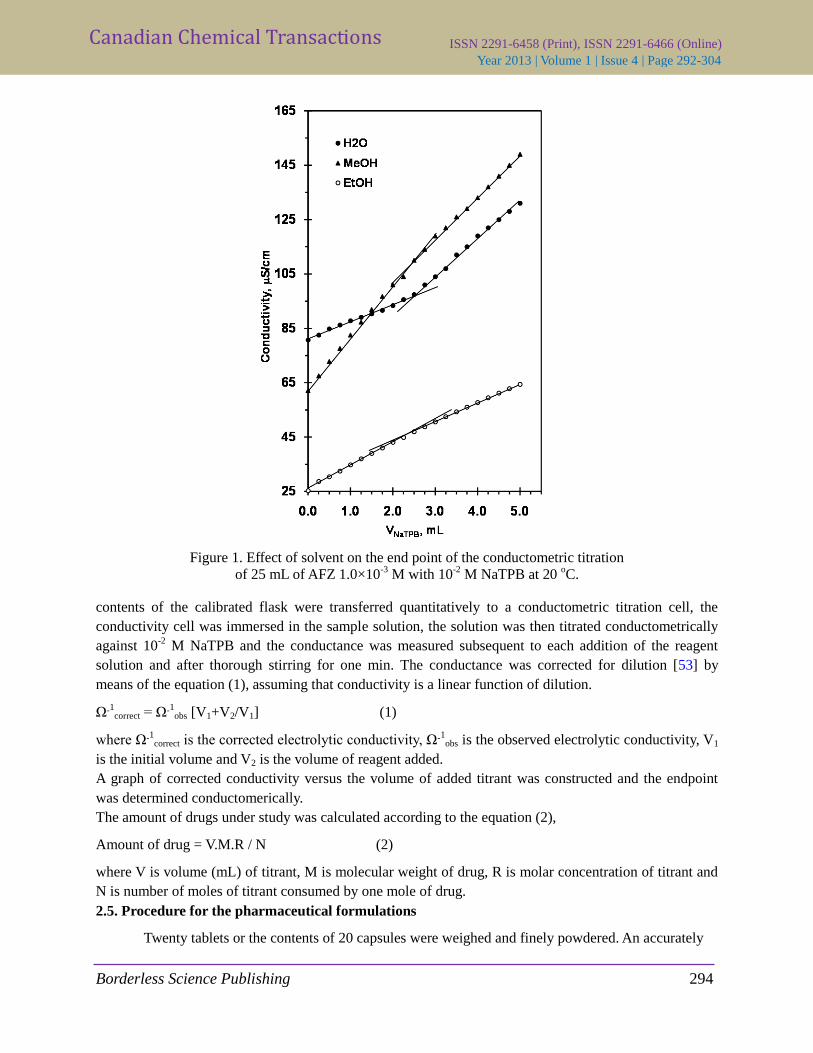
Figure 2. Effect of solvent on the end point of the conductometric titration
of 25 mL of FEX 1.0×10⁻³
M with 10-2
M NaTPB at 20 oC.
weighed quantity of the powder equivalent to 100 mg of drug was dissolved in a 100 mL of methanol and
sonicated for 5 minutes and then filtered. The combined filtrate was evaporated to the dryness. The
remaining portion of the solution was dissolving in a 100 mL volumetric flask to the volume with double
distilled water, and the resulting solution was used for analysis by the recommended procedures in the
concentration ranges mentioned above.
3. RESULTS AND DISCUSSION
Conductometric measurements can be used in quantitative titrations of ionic solutions in which
the conductance of the solution varies before and after the equivalence point, so that two intersecting lines
can be drawn to indicate the end-point. The shape of the titration curve depends on all the species present
during the titration process and other factors such as viscosity, dielectric constant of the solvent used,
solvation, ion-pair association and proton transfer.
Alfuzosin hydrochloride and fexofenadine hydrochloride are able to form precipitates with
sodium tetraphenylborate so the applicability of conductometric titration of these drugs with the
mentioned reagent, was tested. The different parameters affecting the end point, such as solvent,
temperature and concentration of both titrant and titrand, were studied.
3.1. Effect of solvent
Three different titrations were described for each drug: (i) aqueous solutions of both drug and
Ca
Borderless Science Publishing 296
Canadian Chemical Transactions Year 2013 | Volume 1 | Issue 4 | Page 292-304
ISSN 2291-6458 (Print), ISSN 2291-6466 (Online)
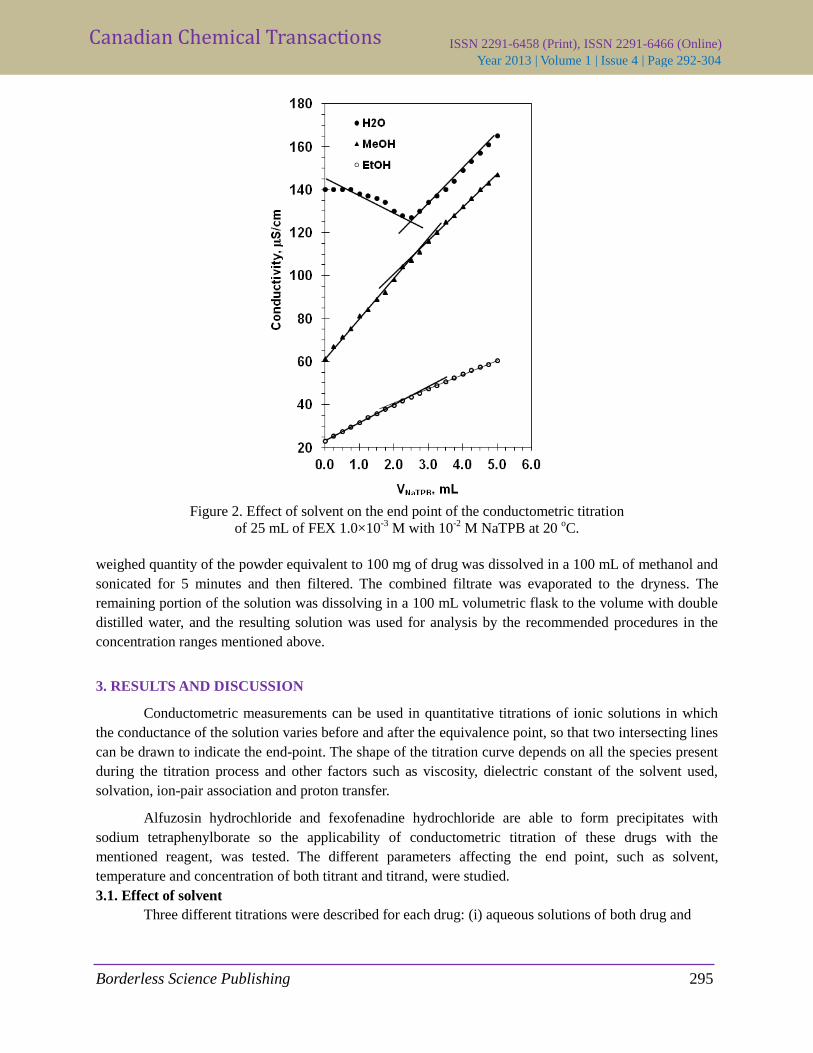
Figure 3. Effect of temperature on the end point of the conductometric titration of 25 mL of AFZ
and FEX 1.0×10⁻³
M with 10-2
M NaTPB in aqueous medium at 20 -60 oC.
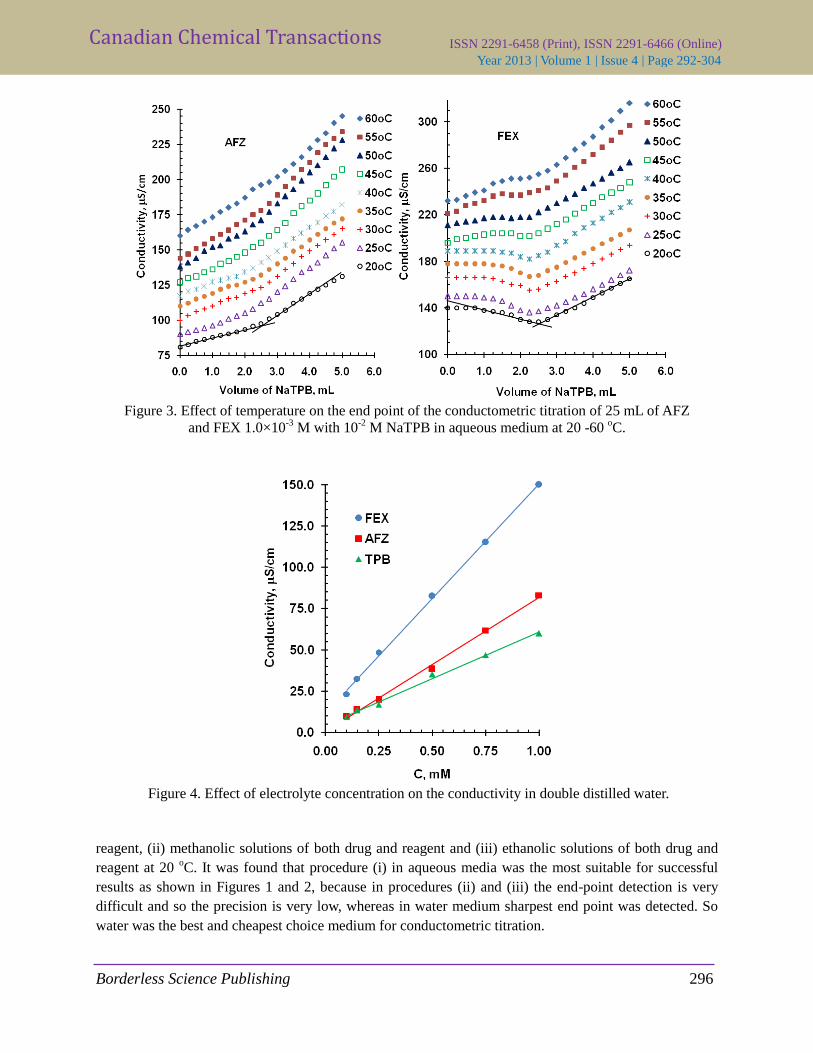
Figure 4. Effect of electrolyte concentration on the conductivity in double distilled water.
reagent, (ii) methanolic solutions of both drug and reagent and (iii) ethanolic solutions of both drug and
reagent at 20 oC. It was found that procedure (i) in aqueous media was the most suitable for successful
results as shown in Figures 1 and 2, because in procedures (ii) and (iii) the end-point detection is very
difficult and so the precision is very low, whereas in water medium sharpest end point was detected. So
water was the best and cheapest choice medium for conductometric titration.
Ca
Borderless Science Publishing 297
Canadian Chemical Transactions Year 2013 | Volume 1 | Issue 4 | Page 292-304
ISSN 2291-6458 (Print), ISSN 2291-6466 (Online)
3.2. Effect of temperature
The relation between the conductance values and temperature of the solutions of AFZ, FEX and
NaTPB was linear increasing in aqueous media in the range of 20-60 ºC. The effect of temperature on the
end point of the conductometric titration was tested by carrying out titrations at 20 - 60 oC. The results
showed that as the temperature increases, the conductivity of the whole solution increases, and no effect
was observed on the shape of the titration curve and the position of the end point up to 40 oC, then 20
oC
was used for carrying out the other variables (Figure. 3).
3.3. Effect of reagent concentration
The relationship between the conductance values and the concentration of AFZ, FEX and NaTPB
solutions was linear increasing in the range of 0.1-10 mM for AFZ and FEX, and 0.1-20 mM For NaTPB.
Figure 4 shows this relationship in the range of 0.1-1.0 mM. The conductance value of AFZ and FEX
solution was greater than that for NaTPB solution at the same concentration with about two and three
times, respectively. The effect of electrolyte concentration on the specific electrical conductivity was
studied and indicated that the values were decreased as follows FEX > AFZ > NaTPB in aqueous medium
and the order becomes NaTPB > AFZ > FEX in alcoholic media.
A weight of the investigated drugs 6.38 mg of AFZ and 8.07 mg of FEX were dissolved in 25 mL
double distilled water was titrated against 1 × 10⁻³
, 5 × 10⁻³
and 1 × 10⁻²
M NaTPB solution. The results
indicated that, titrant solutions lower than 10-2
M are not suitable for conductometric titrations as the
conductance readings were unstable and the inflection at the end point was very poor. So, The reagent
concentration in each titration must be not less than ten times that of the drug solution in order to
minimize the dilution effect on the conductivity throughout the titration. The optimum concentration of
NaTPB was 1 × 10⁻²
M to achieve a constant and highly stable conductance reading after 1 minute
mixing. On the other hand, when the same above mentioned amounts of the investigated drug were
dissolved and diluted up to 25, 50 and 75 mL with distilled water and titrated against 10-2
M NaTPB
solution (optimum titrant concentration). The results showed that, dilution of the titrand up to 75 mL has
no effect on the position of the end point and the shape of the titration curve.
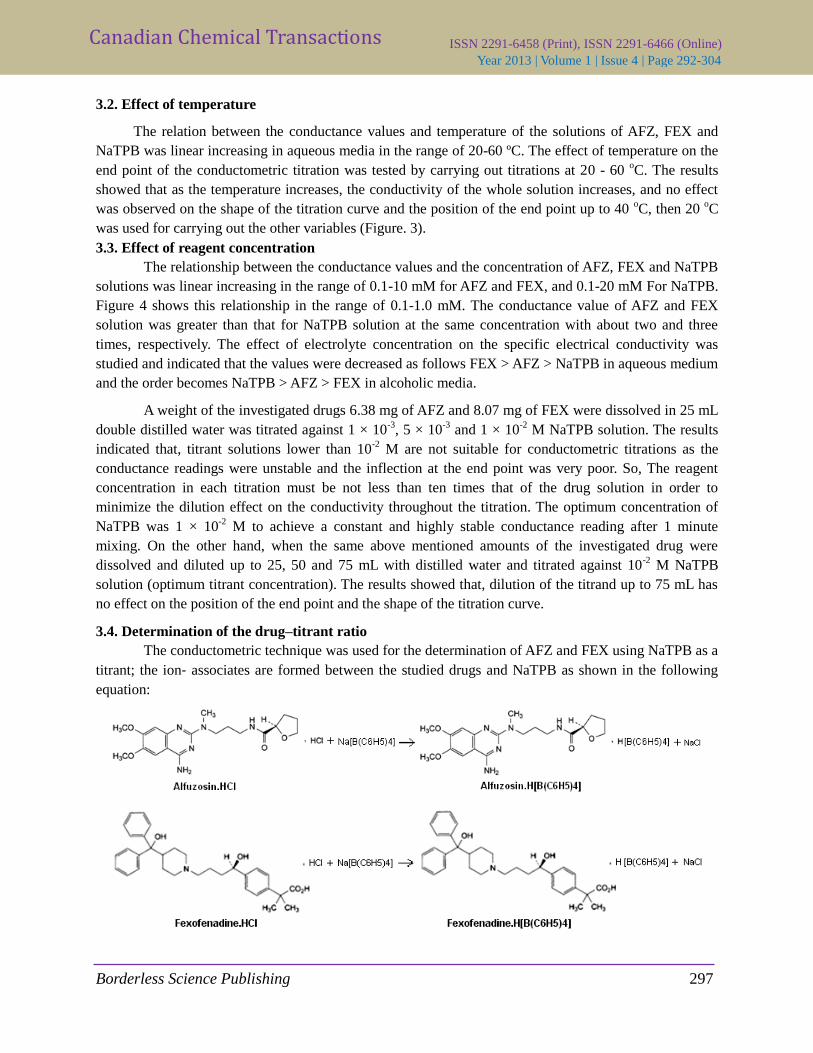
3.4. Determination of the drug–titrant ratio
The conductometric technique was used for the determination of AFZ and FEX using NaTPB as a
titrant; the ion‐ associates are formed between the studied drugs and NaTPB as shown in the following
equation:
Ca
Borderless Science Publishing 298
Canadian Chemical Transactions Year 2013 | Volume 1 | Issue 4 | Page 292-304
ISSN 2291-6458 (Print), ISSN 2291-6466 (Online)
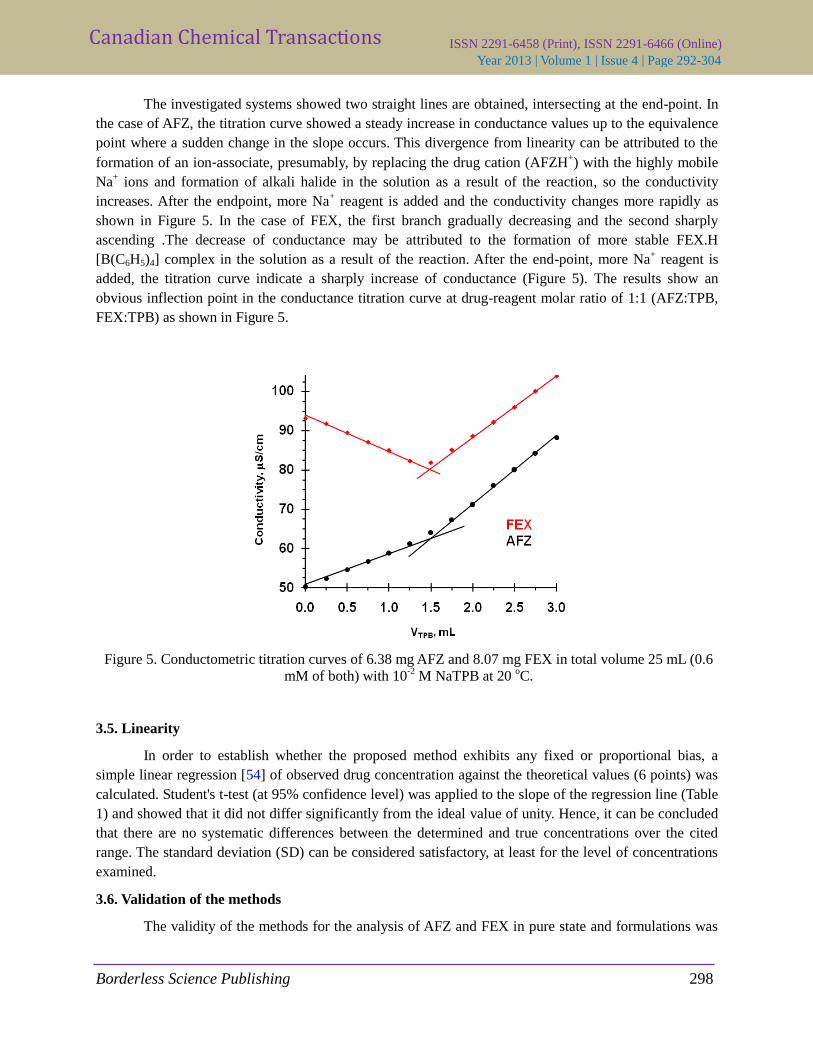
The investigated systems showed two straight lines are obtained, intersecting at the end-point. In
the case of AFZ, the titration curve showed a steady increase in conductance values up to the equivalence
point where a sudden change in the slope occurs. This divergence from linearity can be attributed to the
formation of an ion‐associate, presumably, by replacing the drug cation (AFZH+) with the highly mobile
Na+ ions and formation of alkali halide in the solution as a result of the reaction, so the conductivity
increases. After the endpoint, more Na+ reagent is added and the conductivity changes more rapidly as
shown in Figure 5. In the case of FEX, the first branch gradually decreasing and the second sharply
ascending .The decrease of conductance may be attributed to the formation of more stable FEX.H
[B(C6H5)4] complex in the solution as a result of the reaction. After the end-point, more Na+ reagent is
added, the titration curve indicate a sharply increase of conductance (Figure 5). The results show an
obvious inflection point in the conductance titration curve at drug-reagent molar ratio of 1:1 (AFZ:TPB,
FEX:TPB) as shown in Figure 5.
Figure 5. Conductometric titration curves of 6.38 mg AFZ and 8.07 mg FEX in total volume 25 mL (0.6
mM of both) with 10-2
M NaTPB at 20 oC.
3.5. Linearity
In order to establish whether the proposed method exhibits any fixed or proportional bias, a
simple linear regression [54] of observed drug concentration against the theoretical values (6 points) was
calculated. Student's t-test (at 95% confidence level) was applied to the slope of the regression line (Table
1) and showed that it did not differ significantly from the ideal value of unity. Hence, it can be concluded
that there are no systematic differences between the determined and true concentrations over the cited
range. The standard deviation (SD) can be considered satisfactory, at least for the level of concentrations
examined.
3.6. Validation of the methods
The validity of the methods for the analysis of AFZ and FEX in pure state and formulations was
Ca
Borderless Science Publishing 299
Canadian Chemical Transactions Year 2013 | Volume 1 | Issue 4 | Page 292-304
ISSN 2291-6458 (Print), ISSN 2291-6466 (Online)
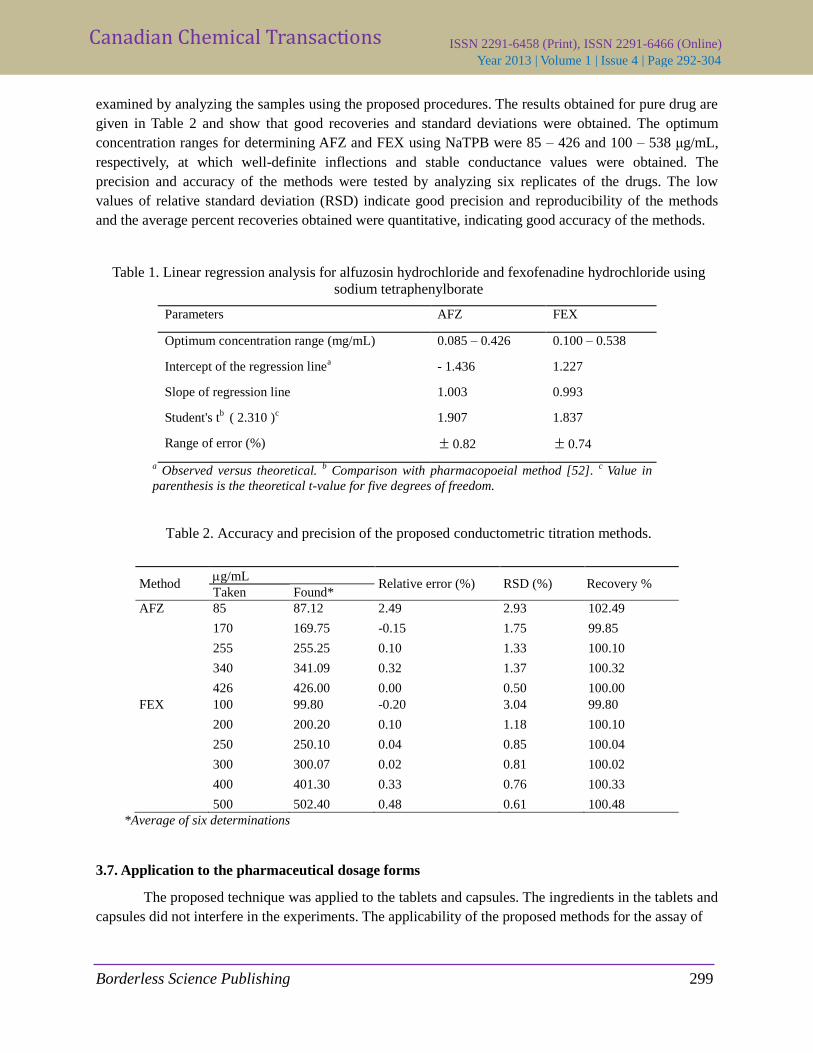
examined by analyzing the samples using the proposed procedures. The results obtained for pure drug are
given in Table 2 and show that good recoveries and standard deviations were obtained. The optimum
concentration ranges for determining AFZ and FEX using NaTPB were 85 – 426 and 100 – 538 μg/mL,
respectively, at which well-definite inflections and stable conductance values were obtained. The
precision and accuracy of the methods were tested by analyzing six replicates of the drugs. The low
values of relative standard deviation (RSD) indicate good precision and reproducibility of the methods
and the average percent recoveries obtained were quantitative, indicating good accuracy of the methods.
Table 1. Linear regression analysis for alfuzosin hydrochloride and fexofenadine hydrochloride using
sodium tetraphenylborate
Parameters AFZ FEX
Optimum concentration range (mg/mL)
Intercept of the regression linea
Slope of regression line
Student's tb ( 2.310 )
c
Range of error (%)
0.085 – 0.426
- 1.436
1.003
1.907
0.82
0.100 – 0.538
1.227
0.993
1.837
0.74
a Observed versus theoretical.
b Comparison with pharmacopoeial method [52].
c Value in
parenthesis is the theoretical t-value for five degrees of freedom.
Table 2. Accuracy and precision of the proposed conductometric titration methods.
Method g/mL
Relative error (%) RSD (%) Recovery % Taken Found*
AFZ 85 87.12 2.49 2.93 102.49
170 169.75 -0.15 1.75 99.85
255 255.25 0.10 1.33 100.10
340 341.09 0.32 1.37 100.32
426 426.00 0.00 0.50 100.00
FEX 100 99.80 -0.20 3.04 99.80
200 200.20 0.10 1.18 100.10
250 250.10 0.04 0.85 100.04
300 300.07 0.02 0.81 100.02
400 401.30 0.33 0.76 100.33
500 502.40 0.48 0.61 100.48
*Average of six determinations
3.7. Application to the pharmaceutical dosage forms
The proposed technique was applied to the tablets and capsules. The ingredients in the tablets and
capsules did not interfere in the experiments. The applicability of the proposed methods for the assay of
Ca
Borderless Science Publishing 300
Canadian Chemical Transactions Year 2013 | Volume 1 | Issue 4 | Page 292-304
ISSN 2291-6458 (Print), ISSN 2291-6466 (Online)
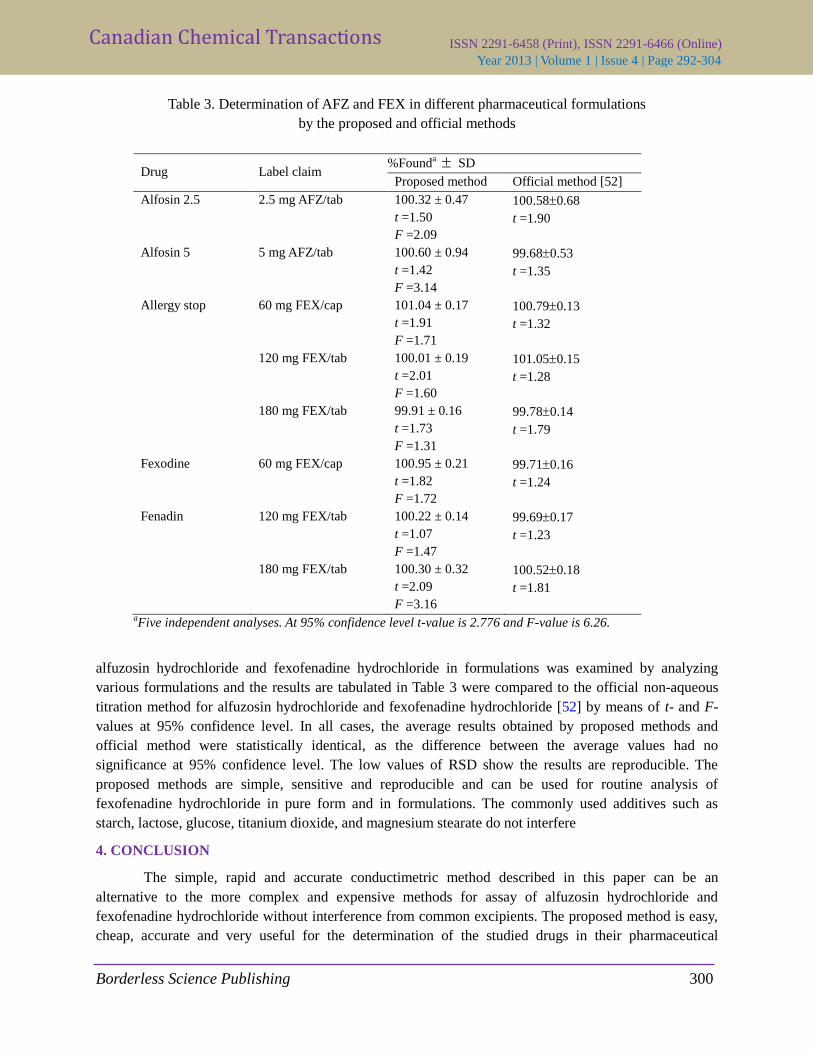
Table 3. Determination of AFZ and FEX in different pharmaceutical formulations
by the proposed and official methods
Drug Label claim %Found
a SD
Proposed method Official method [52]
Alfosin 2.5 2.5 mg AFZ/tab 100.32 ± 0.47
t =1.50
F =2.09
100.580.68
t =1.90
Alfosin 5 5 mg AFZ/tab 100.60 ± 0.94
t =1.42
F =3.14
99.680.53
t =1.35
Allergy stop 60 mg FEX/cap 101.04 ± 0.17
t =1.91
F =1.71
100.790.13
t =1.32
120 mg FEX/tab 100.01 ± 0.19
t =2.01
F =1.60
101.050.15
t =1.28
180 mg FEX/tab 99.91 ± 0.16
t =1.73
F =1.31
99.780.14
t =1.79
Fexodine 60 mg FEX/cap 100.95 ± 0.21
t =1.82
F =1.72
99.710.16
t =1.24
Fenadin 120 mg FEX/tab 100.22 ± 0.14
t =1.07
F =1.47
99.690.17
t =1.23
180 mg FEX/tab 100.30 ± 0.32
t =2.09
F =3.16
100.520.18
t =1.81
aFive independent analyses. At 95% confidence level t-value is 2.776 and F-value is 6.26.
alfuzosin hydrochloride and fexofenadine hydrochloride in formulations was examined by analyzing
various formulations and the results are tabulated in Table 3 were compared to the official non-aqueous
titration method for alfuzosin hydrochloride and fexofenadine hydrochloride [52] by means of t- and F-
values at 95% confidence level. In all cases, the average results obtained by proposed methods and
official method were statistically identical, as the difference between the average values had no
significance at 95% confidence level. The low values of RSD show the results are reproducible. The
proposed methods are simple, sensitive and reproducible and can be used for routine analysis of
fexofenadine hydrochloride in pure form and in formulations. The commonly used additives such as
starch, lactose, glucose, titanium dioxide, and magnesium stearate do not interfere
4. CONCLUSION
The simple, rapid and accurate conductimetric method described in this paper can be an
alternative to the more complex and expensive methods for assay of alfuzosin hydrochloride and
fexofenadine hydrochloride without interference from common excipients. The proposed method is easy,
cheap, accurate and very useful for the determination of the studied drugs in their pharmaceutical
Ca
Borderless Science Publishing 301
Canadian Chemical Transactions Year 2013 | Volume 1 | Issue 4 | Page 292-304
ISSN 2291-6458 (Print), ISSN 2291-6466 (Online)
formulations and can be applied in laboratories for routine analysis. The developed method for AFZ is
higher sensitivity as compared to similar reported method [9].
REFERENCES AND NOTES
[1] The Merck Index: An Encyclopedia of Chemicals, Drugs, and Biologicals, 15th
ed., Maryadele J O'Neil,
Royal Society of Chemistry, Cambridge, UK, 2013.
[2] Patil, V. P.; Devdhe, S. J.; Kale, S. H.; Nagmoti, V.J.; Kurhade, S.D.; Girbane, Y.R.; Gaikwad, M.T.
Development and validation of new rp-hplc method for the estimation of alfuzosin hydrochloride in bulk
and tablet dosage form. Am. J. Anal. Chem. 2013, 4, 34-43.
[3] Kumar, K.S.B.; Ranjani, V.A.; Sathyavathi, D. New RP-HPLC method development and validation for
assay of alfuzosin hydrochloride in tablet dosage form. Int. J. Pharm. Pharm. Sci. 2010, 2, 90-92.
[4] Mani, G.; Uppatyay, S.; Tivari, R.; Kalliappan, K.; Govindasamy, R.; Gangully, S.; Thangavel, S.
Quantitation of alfuzosin hydrochloride in pharmaceutical formulations by RP-HPLC. Pakistan J. Pharm.
Sci. 2009, 22, 263-266.
[5] Raju, S.A.; Karadi, A.B.; Manjunath, S. Reverse phase HPLC method for the analysis of alfuzosin
hydrochloride in pharmaceutical dosage forms. Int. J. Chem. Sci. 2008, 6, 399-404
[6] Deshmukh, S.S.; Havele, S.S.; Musale, V.V.; Dhaneshwar, S.R. Development and validation of RP-HPLC
method for simultaneous estimation of alfuzosin hydrochloride and dutasteride in pharmaceutical dosage
form. Der Pharmacia Lettre, 2010, 2, 342-349.
[7] Fayed, A.S.; Shehata, M.A.; Hassan, N.Y.; Elweshahy, S.A. Validated HPLC and HPTLC stability-
indicating methods for determination of alfuzosin hydrochloride in bulk powder and pharmaceutical
formulations. J. Sep. Sci. 2006, 29, 2716-2724.
[8] Patel, D.B.; Patel, N.J. Development and validation of reverse phase high performance liquid
chromatography and high performance thin layer chromatography methods for estimation of alfuzosin
hydrochloride in bulk and in pharmaceutical formulations. Int. J. ChemTech Res. 2009, 1, 985-990.
[9] Abdel-Moety, M.M.; Hassan, N.Y.M.; Abdel-Aleem, A.A.; Abdel-Hamid, S.G. Determination of alfuzosin
hydrochloride and tamsulosin hydrochloride in pure state and pharmaceutical preparations by
conductimetric methods. J. Chem. Pharm. Res. 2012, 4, 3740-3748.
[10] Al-Tamimi, S.A.; Aly, F.A.; Almutairi, A.M. Kinetic spectrophotometric methods for the determination of
alfuzosin hydrochloride in bulk and pharmaceutical formulations. J. Anal. Chem. 2013, 68, 313-320.
[11] Fayed, A.S.; Shehata, M.A.; Hassan. N.Y.; Weshahy, S.A. Stability-indicating spectrophotometric and
spectrofluorimetric methods for determination of alfuzosin hydrochloride in the presence of its degradation
products. Pharmazie. 2007, 62, 830-835.
[12] Elarfaj, N.; Abdel-Razeq, S.; Eldosary, S. Spectrophotometric methods determination of alfuzosin HCl and
carvedilol in their formulation. Egypt. J. Anal. Chem. 2009, 18, 80-91.
[13] Krishna, M.V.; Sankar, D.G. Oxidative coupling, complex formation and internal salt formation reactions
for visible spectrophotometric determination of alfuzosin hydrochloride in pharmaceutical formulations.
The Pharma Review. 2007, 143-145.
[14] Krishna, M.V.; Sankar, D.G. Optimization and validation of quantitative spectrophotometric methods for
the determination of alfuzosin in pharmaceutical formulations. E. J. Chem. 2007, 4, 397-407.
Ca
Borderless Science Publishing 302
Canadian Chemical Transactions Year 2013 | Volume 1 | Issue 4 | Page 292-304
ISSN 2291-6458 (Print), ISSN 2291-6466 (Online)
[15] Krishna, M.V.; Sankar, D.G. New diazo coupling reactions for visible spectrometric determination of
alfuzosin in pharmaceutical preparations. E. J. Chem. 2007, 4, 496-501.
[16] Ashour, S.; Chehna, F.; Bayram, R. Spectrophotometric determination of alfuzosin hydrochloride in
pharmaceutical preparations with some sulphonepthelein dyes. Int. J. Biomed. Sci. 2006, 2, 273-278.
[17] Ishaq, B.M.; Prakash, K.V.; Kumar, C.H.; Rani, G.U.; Ramakrishna, P. Colorimetric determination of
alfuzosin HCl in pharmaceutical formulations. J. Pharm. Res. 2011, 4, 226-228.
[18] Uslu, B. Voltammetric analysis of alfuzosin HCl in pharmaceuticals, human serum and simulated gastric
juice. Electroanalysis. 2002, 14, 866-870.
[19] Wiesner, J.L.; Sutherland, F.C.W.; Van Essen, G.H.; Hundt, H.K.L.; Swart, K.J.; Hundt, F. Selective,
sensitive and rapid liquid chromatography-tandem mass spectrometry method for the determination of
alfuzosin in human plasma. J. Chromatogr B. 2003, 788, 361-368.
[20] Carlucci, G.; Di-Giuseppe, E.; Mazzeo, P. Determination of alfuzosin in human plasma by high-
performance liquid chromatography with column-switching. J. Liq. Chromatogr. 1994, 17, 3989-3997.
[21] Rouchouse, A.; Manoha, M.; Durand, A.; Thénot, J.P. Direct high-performance liquid chromatographic
determination of the enantiomers of alfuzosin in plasma on a second-generation alpha1-acid glycoprotein
chiral stationary phase. J. Chromatogr. A. 1990, 506, 601-610.
[22] Krstulovic, A.M.; Vende, J.L. Improved performance of the second generation alpha1-AGP columns:
applications to the routine assay of plasma levels of alfuzosin hydrochloride. Chirality. 1989, 1, 243-245.
[23] Guinebault, P.; Broquaire, M.; Colafranceschi, C.; Thénot, J.P. High-performance liquid-chromatographic
determination of alfuzosin in biological fluids with fluorimetric detection and large-volume injection. J.
Chromatogr. A. 1986, 353, 361-369.
[24] Rashedi, H.; Norouzi, P.; Ganjali, M.R. Determination of alfuzosin by hybrid of ionic liquid-graphenenano-
composite film using coulometric FFT linear sweep voltammetry. Int. J. Electrochem. Sci. 2013, 8, 2479-
2490.
[25] Zarapkar, S.S.; Bhandari, N.P.; Halkar, U.P. Simultaneous determination of fexofenadine hydrochloride
and pseudoephedrine sulfate in pharmaceutical dosage by reverse phase high performance liquid
chromatography. Indian Drugs. 2000, 37, 421-425.
[26] Radhakrishna, T.; Reddy, G.O. Simultaneous determination of fexofenadine and its related compounds by
HPLC. J. Pharm. Biomed. Anal. 2002, 29, 681-690.
[27] Breier, A.R.; Paim, S.C.; Menegola, J.; Steppe, M.; Schapoval, E.E. Development and validation of a liquid
chromatographic method for fexofenadine hydrochloride in capsules. J. AOAC Int. 2004, 87, 1093-1097.
[28] Kozan, I.; Palabiyik, L.M.; Karacan, E.; Onur, F. Spectrophotometric and high performance liquid
chromatographic determination of fexofenadine hydrochloride in pharmaceutical formulations. Turk J.
Pharm. Sci. 2008, 5, 175-189.
[29] Vekaria, H.; Limbasiya, V.; Patel, P. Development and validation of RP-HPLC method for simultaneous
estimation of montelukast sodium and fexofenadine hydrochloride in combined dosage form. J. Pharm.
Res. 2013, 6, 134-139.
[30] Karakuş, S.; Küçükgüzel, İ.; Güniz Küçükgüzel, Ş. Development and validation of a rapid RP-HPLC
method for the determination of cetirizine or fexofenadine with pseudoephedrine in binary pharmaceutical
dosage forms. J. Pharm. Biomed. Anal. 2008, 46, 295-302.
[31] Arayne, M.S.; Shehnaz, H.; Sultana, N.; Haider, A. RP-HPLC method for the quantitative determination of
fexofenadine hydrochloride in coated tablets and human serum. Med. Chem. Res. 2011, 20, 55-61.
[32] Arayne, M.S.; Sultana, N.; Zeeshan, M.A.; Siddiqui, F.A. Simultaneous determination of gliquidone,
fexofenadine, buclizine, and levocetirizine in dosage formulation and human serum by RP-HPLC. J.
Chromatogr. Sci. 2010, 48, 382-385.
Ca
Borderless Science Publishing 303
Canadian Chemical Transactions Year 2013 | Volume 1 | Issue 4 | Page 292-304
ISSN 2291-6458 (Print), ISSN 2291-6466 (Online)
[33] Maher, H.M.; Sultan, M.A.; Olah, I.V. Development of validated stability-indicating chromatographic
method for the determination of fexofenadine hydrochloride and its related impurities in pharmaceutical
tablets. Chem. Cent. J. 2011, 5, 1-10.
[34] Tandulwadkar, S.S.; More, S.J.; Rathore, A.S.; Nikam, A.R.; Sathiyanarayanan, L.; Kakasaheb, R. Method
development and validation for the simultaneous determination of fexofenadine hydrochloride and
montelukast sodium in drug formulation using normal phase high-performance thin-layer chromatography.
ISRN Anal. Chem. 2012, 1-7.
[35] Abbas, M.N.; Abdel Fattah, A.A.; Zahran, E. A novel membrane sensor for histamine H1-receptor
antagonist fexofenadine. Anal. Sci. 2004, 20, 1137-1142.
[36] Mikuš, P.; Valášková, I.; Havránek, E. Determination of fexofenadine in tablets by capillary
electrophoresis in free solution and in solution with cyclodextrins as analyte carriers. Drug Dev. Ind.
Pharm. 2005, 31, 795-801.
[37] Breier, A.R.; Garcia, S.S.; Jablonski, A.; Steppe, M.; Schapoval, E.E.S. Capillary electrophoresis method
for fexofenadine hydrochloride in capsules. J. AOAC Int. 2005, 88, 1059-1063.
[38] Gazy, A.A.; Mahgoub, H.; El-Yazbi, F.A.; El-Sayed, M.A.; Youssef, R.M. Determination of some
histamine H1-receptor antagonists in dosage forms. J. Pharm. Biomed. Anal. 2002, 30, 859-867.
[39] Srinivas, L.D.; Kumar, R.P.; Sastry, B.S. Ion association methods for the determination of fexofenadine in
pharmaceutical preparations. E. J. Chem. 2005, 2, 199-201.
[40] Suresh Kumar, K.; Ravichandran, V.; Mohan Maruga Raja, M.K.; Thyagu, R.; Dharamsi, A.
Spectrophotometric determination of fexofenadine hydrochloride. Indian J. Pharm. Sci. 2006, 68, 841-842.
[41] Mahgoub, H.; Gazy, A.A.; El-Yazbi, F.A.; El-Sayed, M.A.; Youssef, R.M. Spectrophotometric
determination of binary mixtures of pseudoephedrine with some histamine H1-receptor antagonists using
derivative ratio spectrum method. J. Pharm. Biomed. Anal. 2003, 31, 801-809.
[42] Rajput, S.J.; Parekh, P.R. Spectrophotometric determination of fexofenadine hydrochloride in bulk drug
and in its dosage form. Eastern Pharmacist. 2001, 44, 101-103.
[43] Maggio, R.M.; Castellano, P.M.; Vignaduzzo, S.E.; Kaufman, T.S. Alternative and improved method for
the simultaneous determination of fexofenadine and pseudoephedrine in their combined tablet formulation.
J. Pharm. Biomed. Anal. 2007, 45, 804-810.
[44] Polawar, P.V.; Shivhare, U.D.; Bhusari, K.P.; Mathur, V.B. Development and validation of
spectrophotometric method of analysis for fexofenadine. Res. J. Pharm. Technol. 2008, 1, 539-541.
[45] Alothman, Z.A.; Bukhari, N.; Haider, S.; Wabaidur, S.M.; Alwarthan, A.A. Spectrofluorimetric
determination of fexofenadine hydrochloride in pharmaceutical preparation using silver nanoparticles.
Arabian J. Chem. 2010, 3, 251-255.
[46] Vekaria, H.J.; Muralikrishna, K.S.; Patel, G.F. Development and validation of spectrophotometric method
for estimation of fexofenadine hydrochloride and montelukast sodium in combined dosage form. Pharm
Anal. Qual. Assur. 2011, 4, 197-199.
[47] Miura, M.; Uno, T.; Tateishi, T.; Suzuki, T. Determination of fexofenadine enantiomers in human plasma
with high-performance liquid chromatography. J. Pharm. Biomed. Anal. 2007, 43, 741-745.
[48] Uno, T.; Furukori, N.Y.; Takahata, T.; Sugawara, K.; Tateishi, T. Liquid chromatographic determination of
fexofenadine in human plasma with fluorescence detection. J. Pharm. Biomed. Anal. 2004, 35, 937-942.
[49] İşleyen, E.A.Ö.; Özden, T.; Özilhan, S.; Toptan, S. Quantitative determination of fexofenadine in human
plasma by HPLC-MS. Chromatographia. 2007, 66, 109-113.
[50] Yamane, N.; Tozuka, Z.; Sugiyama, Y.; Tanimoyo, T.; Yamazaki, A.; Kumagai, Y. Microdose clinical
trial: quantitative determination of fexofenadine in human plasma using liquid
chromatography/electrospray ionization tandem mass spectrometry. J. Chromatogr. B. 2007, 858, 118-128.
[51] Nirogi, R.V.; Kandikere, V.N.; Shukla, M.; Mudigonda, K.; Maurya, S.; Komarneni, P. Quantification of
fexofenadine in human plasma by liquid chromatography coupled to electrospray tandem mass
spectrometry using mosapride as internal standard. Biomed. Chromatogr. 2007, 21, 209-216.
Ca
Borderless Science Publishing 304
Canadian Chemical Transactions Year 2013 | Volume 1 | Issue 4 | Page 292-304
ISSN 2291-6458 (Print), ISSN 2291-6466 (Online)
[52] British Pharmacopoeia, The Stationary Office, London, 2013.
[53] Lingane, J.J. Electroanalytical chemistry, 2nd
Ed., Interscience, New York, 90, 1958.
[54] Miller, J.C.; Miller, J.N. Statistics in analytical chemistry, 3rd
ed., Ellis Horwood, Chichester 119, 1993.
The authors declare no conflict of interest
© 2013 By the Authors; Licensee Borderless Science Publishing, Canada. This is an open access article
distributed under the terms and conditions of the Creative Commons Attribution license
http://creativecommons.org/licenses/by/3.0/