Embed Size (px)
Citation preview

Ecole Nationale Supérieure d’Agronomie de Rennes
Institut de recherche pour le développement – Indonésie
Conditions and perspectives of rural breeding of Pangasius hypophthalmus in Jambi
(Sumatra, Indonesia) Comparison between two production systems:
floating cages and ponds
September 2002
Johanna Herfaut

Acknowledgements
My most sincere thanks to:
RCA - RIFF for welcoming me, BBAT Jambi and Bapak Maskur for their collaboration,
Jacques Slembrouck for his management, Patrice Levang and Marc Legendre for their help,
My ENSAR teachers, Dafzel, excellent counterpart,
Ramadhani, CIFOR statistician, Bambang, the wizard with pictures,
All Indonesian people who have been so hospitable.
Abstract The breeding of Pangasius hypophthalmus has known a very important development these last five years. At the Jambi’s market around 2 tons of Pangasius hypophthalmus are sold every day. In ponds, the techniques are mastered and results are good, but producers have to face marketing problems. During the dry season, lots of ponds and cages in Jambi’s area become dry and the fish farmers are obliged to sell their production, resulting in market saturation and low prices. In cages, there is a problem of mortality; the mortality rate is very high with an average of 37%. Consequently, fish farmers lose a lot of money. The mortality seems to be due to water quality. Since the economic crisis the price of feed has been increasing steadily. Thus, the profitability of aquaculture has been decreasing. Some farmers have even been obliged to abandon the production. But the number of exploitations still grows. Solutions must be found to ensure the sustainability of aquaculture. Two different paths can be considered: the reduction of the production cost and the research of new markets.
2

Contents
INTRODUCTION................................................................................................................................................. 4 1. GENERAL PRESENTATION OF THE STUDY AREA.......................................................................... 6
1.1. VILLAGE DETAILS .................................................................................................................................... 6 1.2. HISTORY OF AQUACULTURE DEVELOPMENT ............................................................................................ 6 1.3. PRODUCTION TOOLS................................................................................................................................. 7 1.4. PHYSICO-CHEMICAL ANALYSES ............................................................................................................... 7
2. GROSS RESULTS........................................................................................................................................ 9 2.1. REARING TECHNIQUES ............................................................................................................................. 9
2.1.1. Pond maintenance........................................................................................................................... 9 2.1.2. Fingerlings, rearing density and cycle duration ............................................................................. 9 2.1.3. Feeding.......................................................................................................................................... 10 2.1.4. Pathology and treatment ............................................................................................................... 10
2.2 TECHNICAL RESULTS ................................................................................................................................... 11 2.2. ECONOMIC RESULTS............................................................................................................................... 12
2.2.1. Returns .......................................................................................................................................... 12 2.2.2. Commercialisation ........................................................................................................................ 13
3. ANALYSIS OF THE RESULTS ............................................................................................................... 14 3.1. IMPACT OF TECHNIQUES ON YIELDS ....................................................................................................... 14 3.2. ECONOMIC RETURN................................................................................................................................ 15
3.2.1. Factors which affect economic return........................................................................................... 15 3.2.2. Profitability ................................................................................................................................... 16 3.2.3. Aquaculture: one activity among others........................................................................................ 16
4. IDENTIFIED PROBLEMS AND RECOMMENDATIONS .................................................................. 17 4.1. INTEGRATION AND MANAGEMENT SUPPORT FOR AQUACULTURE ........................................................... 17 4.2. TECHNICAL PROBLEMS AND RECOMMENDED IMPROVEMENTS ............................................................... 17
4.2.1. Fingerlings size and initial density ............................................................................................... 17 4.2.2. Water quality control in ponds...................................................................................................... 17 4.2.3. Feeding.......................................................................................................................................... 17 4.2.4. Diseases and treatments identification.......................................................................................... 18
4.3. ENVIRONMENTAL PROBLEM................................................................................................................... 18 4.4. ECONOMIC PROBLEMS AND MARKET IMPROVEMENT.............................................................................. 18
CONCLUSION.................................................................................................................................................... 19
3
IntroductionIntroduction
0
10000
20000
30000
40000
50000
60000
70000
1993
1994
1995
1996
1997
1998
1999
2000
2001
in to
ns
marine catchesfreshwater catchesshrimpaquaculture in rice fieldcagesponds
0
10000
20000
30000
40000
50000
60000
70000
1993
1994
1995
1996
1997
1998
1999
2000
2001
in to
ns
marine catchesfreshwater catchesshrimpaquaculture in rice fieldcagesponds
4
In the province of Jambi, freshwater productions represented 7 800 tons in 2001. Aquaculture has had a very fast extension in the last few years, particularly catfish rearing, but only little data is available. So it raises the following question: “According to the success of the aquaculture in Indonesia, what are the problems, which still hinder the development of a sustainable aquaculture in the province of Jambi?” Figure 1: Evolution of halieutic production in Jambi province To answer this question, we have chosen the example of the breeding of Pangasius hypophthalmus in the province of Jambi in Sumatra. Five villages have been studied Tankit, Lubuk Ruso, Senaning, Kuap and Kubu Kandang. Two systems of production are present: floating cages in the Batang Hari river (Lubuk Ruso, Senaning, Kuap and Kubu Kandang) and ponds in Tankit. Figure 2: Map of the study area
4

Data collected concerned: - history of the development of aquaculture, - breeding system, production method, - technical and economic performances, - transfer and adaptation of new technology by the fish farmers, - origin of fingerling, - organisation of aquaculture and its importance in different villages, - marketing problems.
The study has been carried out in collaboration with IRD (French Research Institute for Development), the RCA-RIFF (Research Centre for Aquaculture – Research Institute for Freshwater Fisheries) and the BBAT-Jambi (Centre for freshwater aquaculture development) In Tankit, among 415 families in the village, 111 own ponds. During this survey, 29,7 % of fish farmers have been interviewed. Data concerning 110 cycles have been collected. On the Batang Hari site, there were 198 fish farmers, but only 101 families (35%) reared Pangasius hypophthalmus. Data concerning 40 fish producers have been collected. Physico-chemical analyses have also been carried out, pH, temperature, dissolved oxygen, conductivity and ammonia nitrogen, in 19 ponds and every morning in the river.
5

1. General presentation of the study area
1.1. Village details General information about the villages where the survey has taken place is summarised in table 1. Table 1: Village presentation
Village name Lubuk Ruso Senaning Kuap Kubu Kandang Tankit
Inhabitants
Number of families
3 126
788
700
148
1 126
411
679
117
2 000
415
Surface area (ha) 53 000 25 000 21 000 3 896 1 611
Number of fish farmers 57 27-36 34 75 111 Number of rearing
structures 211 cages 103 cages 78 cages 315 cages 303 ponds
Average number of rearing structures per
fish farmer 3.7 3.2 2.3 4.2 3
Percentage of Pangasius hypophthalmus
All farmers 10% of cages
with "Red Tilapia"
All fish farmers
30% of fish farmers
15 cages (1 fish farmer)
Other activities in the villages
Sawmill, rice field, vegetables, fruits: durian et duku, rubber tree, livestock farming, workers, gold-digging
Pineapple cultivation
1.2. History of aquaculture development Pond site: Tankit Since the first ponds were created in1998, the expansion of aquaculture has been considerable. The first fish farmer wanted to make use of chicken scraps from his chicken trade (mainly intestines). He received assistance from the Dinas Perikanan (Fisheries Service of the district) and the BBAT-Jambi (Jambi Centre for freshwater aquaculture development). Afterwards, many other farmers followed this pioneer. A training and consultation network between fish farmers has generated knowledge and ability.
Fast development… already a lot of ponds
6
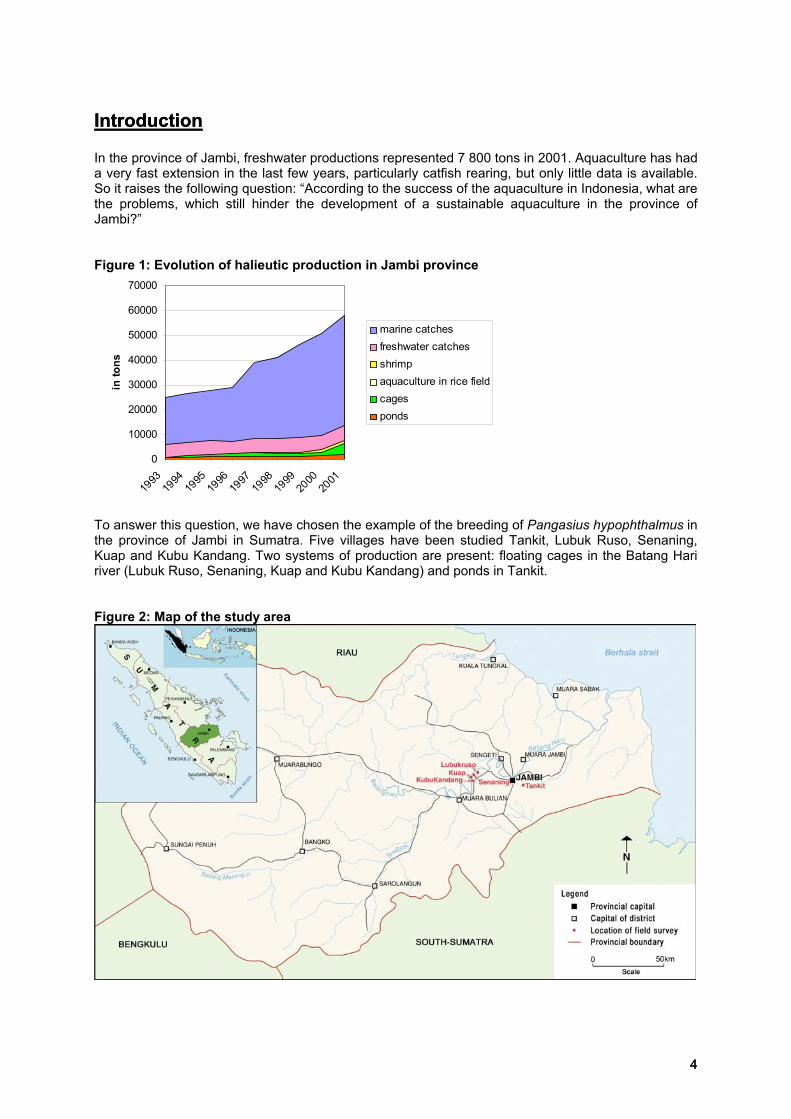
Cage site: villages on the Batang Hari river Pangasius hypophthalmus rearing began in 1992. Chinese investors employed a farmer to take care of their cages and feed the fish. They divided the benefits in two equal parts. In 1997, the economic crisis forced the Chinese to stop this activity eventually taken over by local farmers. In 1997, the government also provided financial help in Senaning and Kubu Kandang to incite farmers to build cages. In 2000, the Dinas Perikanan helped the fish farmers to obtain loans from a development bank. An active training and consultation network among fish farmers generated knowledge and ability.
Floating cages in Lubuk Ruso
1.3. Production tools Pond site: Tankit 15,9 x 8,5 m ; depth : 1.5 m Surface: 136.8 m²; estimated volume: 208 m3 Investment: Rp. 1 130 000 Cage site: villages on the Batang Hari river Cages 3,8 x 2,0 m; depth: 1.7 m Volume: 11.3 m3 Investment: Rp. 740 000
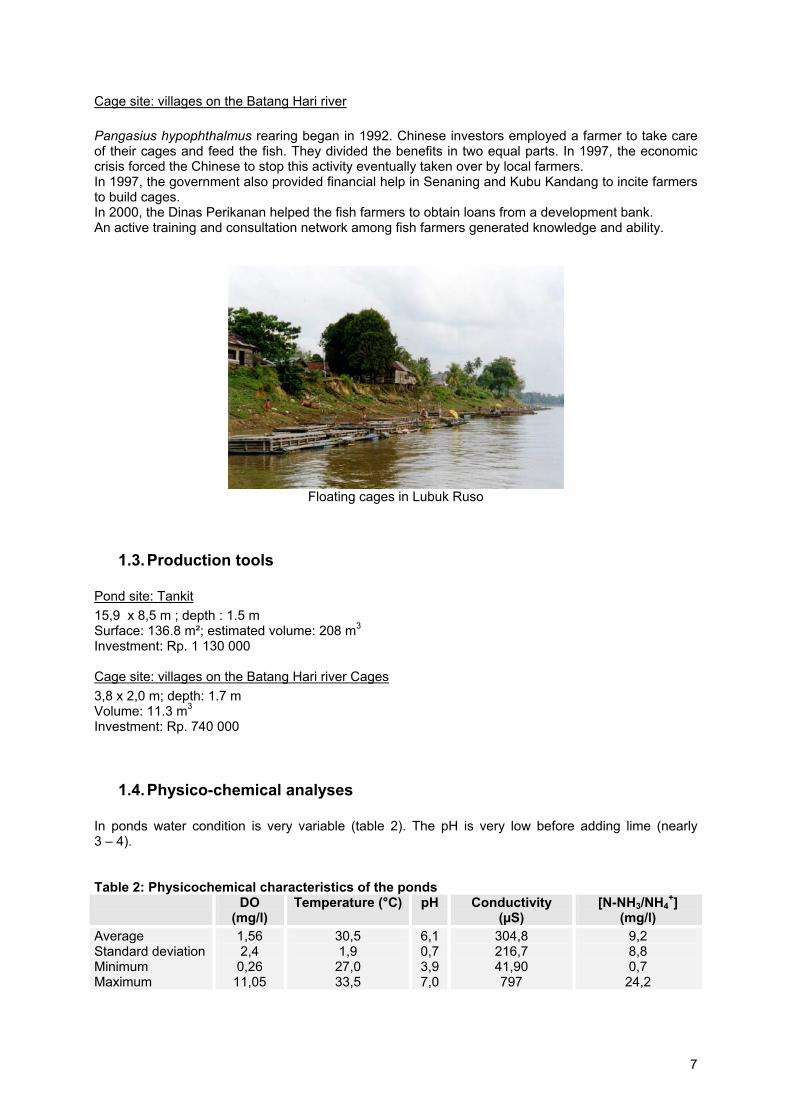
1.4. Physico-chemical analyses In ponds water condition is very variable (table 2). The pH is very low before adding lime (nearly 3 – 4). Table 2: Physicochemical characteristics of the ponds DO
(mg/l) Temperature (°C) pH Conductivity
(µS) [N-NH3/NH4
+] (mg/l)
Average Standard deviation Minimum Maximum
1,56 2,4 0,26
11,05
30,5 1,9
27,0 33,5
6,1 0,7 3,9 7,0
304,8 216,7 41,90 797
9,2 8,8 0,7 24,2
7

The dissolved oxygen concentration is very low too, and decreases during the cycle (figure 3). At the same time, ammonia nitrogen concentration increases a lot, and can be very high at the end of the cycle. If the pH is too high (above 7), NH3 concentration could become toxic to the fish (figure 4). Figure 3: Evolution of dissolved oxygen concentration in ponds
y = 4,7448e-0,0168x
R2 = 0,6083
0
2
4
6
8
10
12
0 20 40 60 80 100 120 140 160
Cycle duration (day)
DO a
t 17h
mg/
L
y = 0,0008x2 + 0,0174x + 1,8049R2 = 0,9501
0
5
10
15
20
25
30
0 20 40 60 80 100 120 140 160
Cycle duration (day)
conc
entra
tion
mg/
L
Figure 4: Evolution of ammonia nitrogen concentration in ponds Water quality in the river is better (table 3) than in ponds. The pH is very stable. Dissolved oxygen concentration is always between 5 and 6. The quality can change at the transition between dry and rainy seasons, but it is considered as stable in short time. But in the river the pathology transmission and pollution threat is more frequent. Table 3: Physicochemical characteristics of the Batang Hari River
DO (mg/L) Temperature (°C) Conductivity (µS) pH 5,45 +/- 0,54 [4,53 ; 6,42]
28,9 +/- 0,7 [27,2 ; 29,8]
68,4 +/- 9,3 [52,2 ;86,2]
6-7
8

2. Gross results
2.1. Rearing techniques
2.1.1. Pond maintenance After every harvest, ponds have to be emptied and cleaned. The farmers treat new water, which comes from the ground, with fertilisers (chemical or organic), salt and quicklime. Doses are summarised in table 4. Table 4: Treatment and average doses for pond maintenance CaO quantity
(kg/m3) Salt quantity
(kg/m3) Chicken manure quantity (kg/m3)
Chemical manure quantity (kg/m3)
Average Standard deviation Minimum Maximum
0,217 0,138 0,023 0,625
0,042 0,037
0 0,143
1,485 1,019
0 4,167
0,038 0,019
0 0,083
2.1.2. Fingerlings, rearing density and cycle duration At the beginning of the cycle, fingerlings spread in ponds or in cages range between 1,5 and 3 inches of length. Produced by different suppliers, they mainly come from Java. In Tankit most of fingerlings come from the BBAT-Jambi. A part of this stock is reared in recycling water systems before being moved to the ponds.
Mustari40%
Arifin16% Java
24%
BBAT Jambi20%
Java12%
BBAT Jambi2%
Jambi47%
Sukabumi28%
Jakarta11%
Figure 5 : Pangasius hypophthalmus fingerlings suppliers For ponds in Tankit For Cages in Batang Hari river * Mustari and Arifin: fish farmers who grow larvae in recycling water systems ** Sukabumi: main producing area in West-Java *** Java: unknown origin In ponds the stocking density ranges from 2,6 to 19,8 fingerlings per m3, with an average of 8,5 fingerlings per m3. In cages the density is higher, on average 125,7 fingerlings per m3 and ranges from 76,9 to 192,3 fingerlings per m3. The cycle duration is the same in ponds and in cages: more or less 5 months.
9
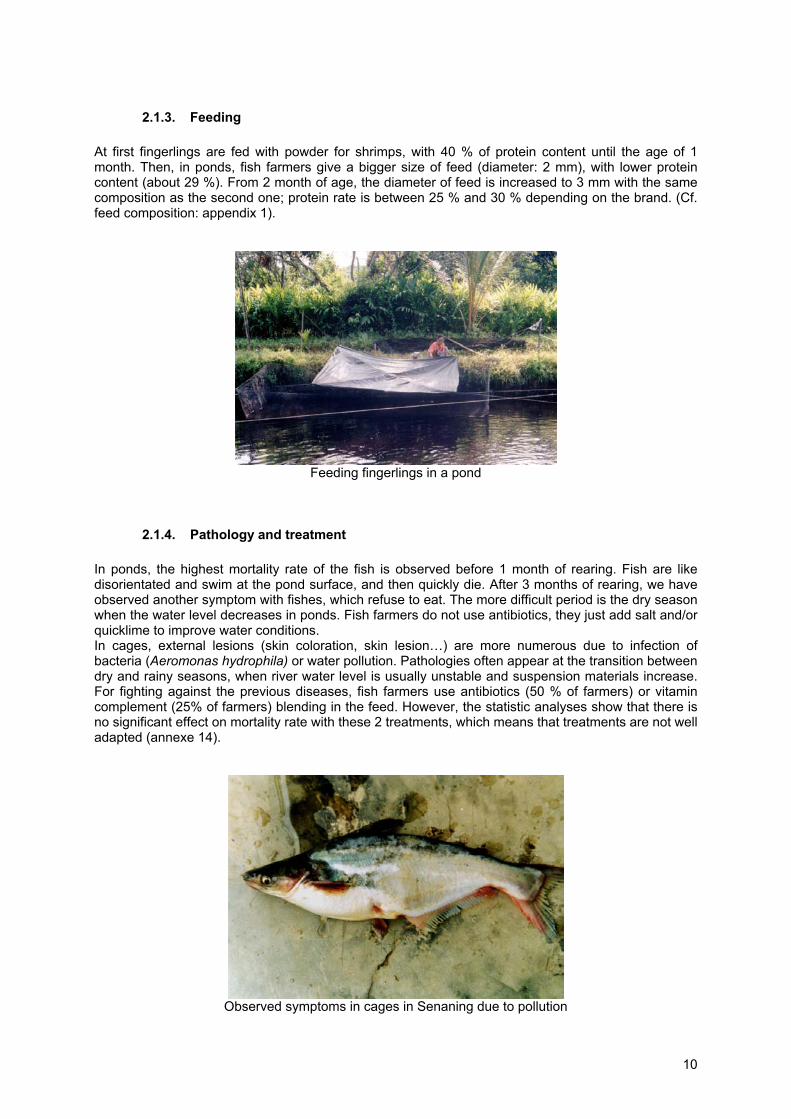
2.1.3. Feeding At first fingerlings are fed with powder for shrimps, with 40 % of protein content until the age of 1 month. Then, in ponds, fish farmers give a bigger size of feed (diameter: 2 mm), with lower protein content (about 29 %). From 2 month of age, the diameter of feed is increased to 3 mm with the same composition as the second one; protein rate is between 25 % and 30 % depending on the brand. (Cf. feed composition: appendix 1).
Feeding fingerlings in a pond
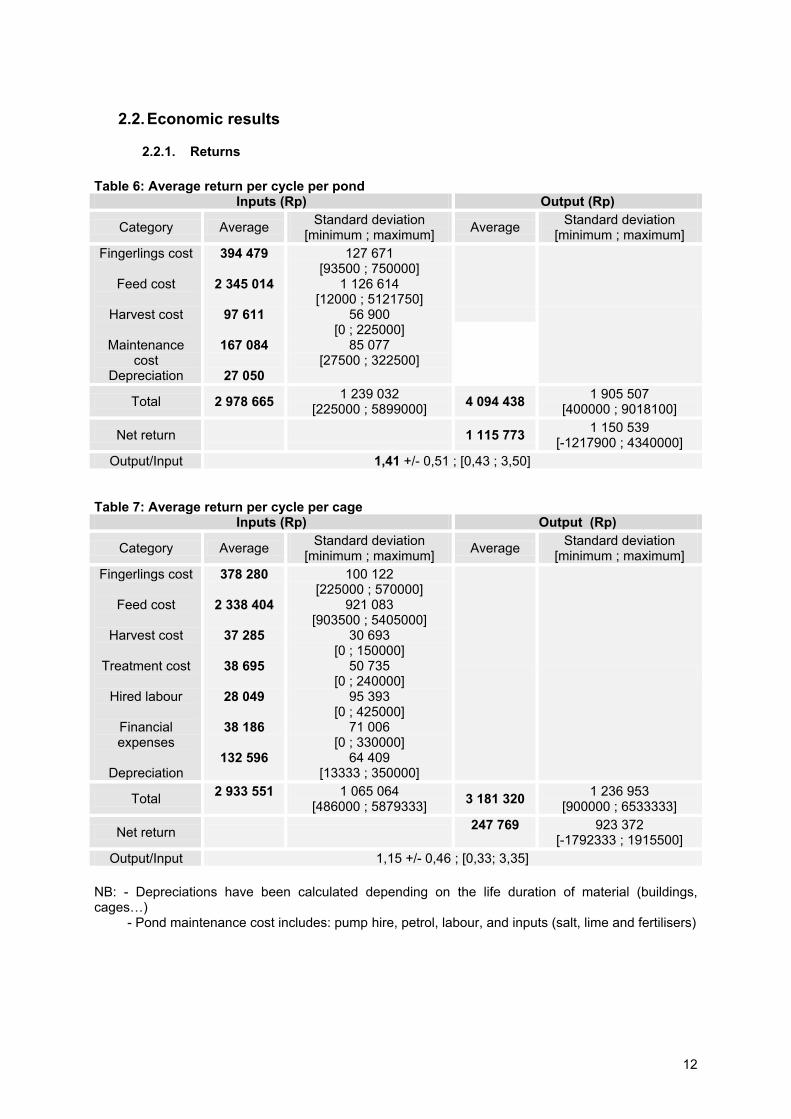
2.1.4. Pathology and treatment In ponds, the highest mortality rate of the fish is observed before 1 month of rearing. Fish are like disorientated and swim at the pond surface, and then quickly die. After 3 months of rearing, we have observed another symptom with fishes, which refuse to eat. The more difficult period is the dry season when the water level decreases in ponds. Fish farmers do not use antibiotics, they just add salt and/or quicklime to improve water conditions. In cages, external lesions (skin coloration, skin lesion…) are more numerous due to infection of bacteria (Aeromonas hydrophila) or water pollution. Pathologies often appear at the transition between dry and rainy seasons, when river water level is usually unstable and suspension materials increase. For fighting against the previous diseases, fish farmers use antibiotics (50 % of farmers) or vitamin complement (25% of farmers) blending in the feed. However, the statistic analyses show that there is no significant effect on mortality rate with these 2 treatments, which means that treatments are not well adapted (annexe 14).
Observed symptoms in cages in Senaning due to pollution
10

2.2 Technical results The results are summarised in table 5. Table 5: Main production characteristics Ponds in Tankit Cages in the Batang Hari river Average Standard deviation Average Standard deviation Initial density (fingerlings
number /m3) 8,5
3,0
[2,6 ;19,8] 127,1
29,1
[76,92 ; 192,31]
Fingerlings size (inches) 2,35
0,43 [1,50 ; 3,00]
2,28
0,45 [1 ; 3]
Cycle duration (month) 148,4
17,8 [120 ; 210]
147
18 [105 ; 180]
Food conversion ratio 1,53
0,37 [0,64 ;2,78]
1,84
0,82 [1,02 ; 5,93]
Final weight (kg) 0,492
0,103 [0,261;0,877]
0,478
0,116 [0,300 ;0,750]
Mortality rate (en %) 12,6
19,6 [0,7;100,0]
37,1
16,3 [8% ; 75%]
Production (kg/m3)
3,56
1,41 [0,66 ;7,5]
37,72
12,47 [12,30 ; 62,80]
Fingerlings price (Rp) 279 54 [90 ; 375] 257 29
[175 ; 350]
Feed price (Rp/kg) 2 564 376 [1400 ; 3000] 3 015 240
[2500 ; 3400] Average selling price
(Rp/kg) 6 559 499 [5250 ; 7200] 7 288 362
[5700 ; 7800] Profit per fingerling (Rp) 788 395
In Tankit, production results are good and transfer of technology has been very well accepted. We can see that results are better in Tankit even if water conditions are less favourable than in the Batang Hari River. The mortality seems to be due to water quality, particularly to oxygen, which is always very low. In the Batang Hari River, the main problem is fish mortality, which is very high. It shows a problem of diseases and water quality. The mortality seems to be due to pollution. The losses are considerable, and for the moment the farmers do not get enough technical information about diseases and treatments.
11
2.2. Economic results
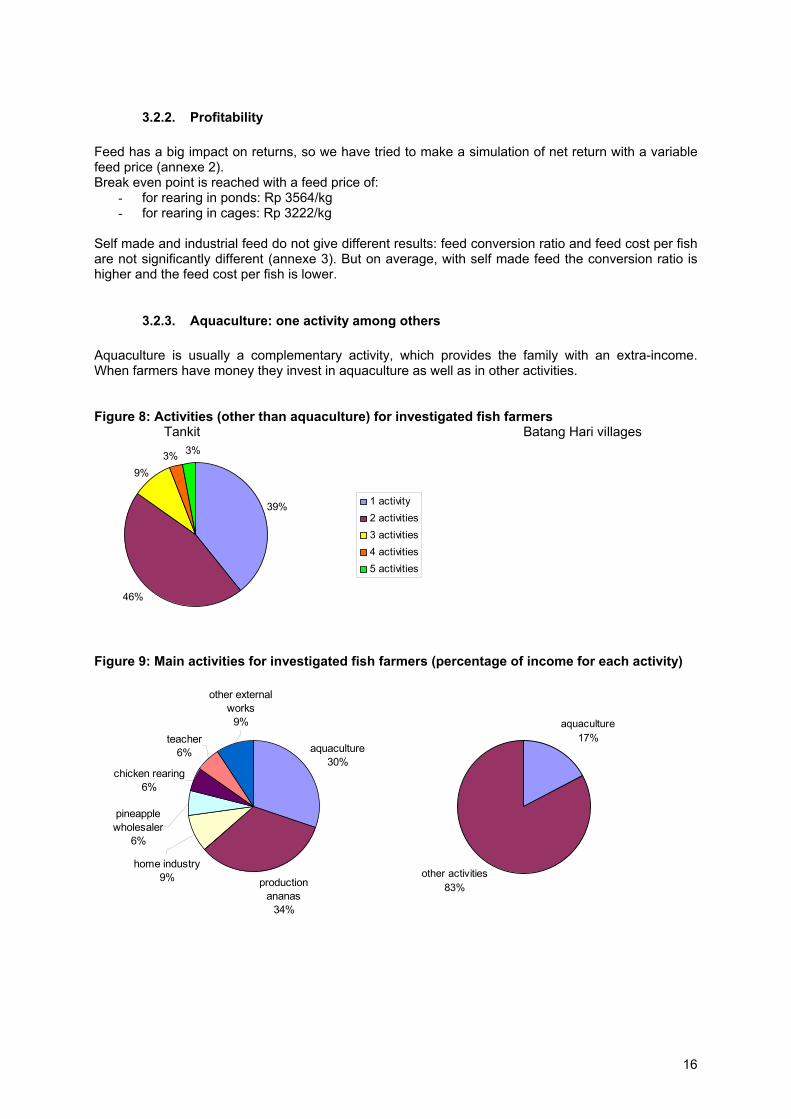
2.2.1. Returns Table 6: Average return per cycle per pond
Inputs (Rp) Output (Rp)
Category Average Standard deviation [minimum ; maximum] Average Standard deviation
[minimum ; maximum] Fingerlings cost
Feed cost
Harvest cost
Maintenance
cost Depreciation
394 479
2 345 014
97 611
167 084
27 050
127 671 [93500 ; 750000]
1 126 614 [12000 ; 5121750]
56 900 [0 ; 225000]
85 077 [27500 ; 322500]
Total 2 978 665 1 239 032 [225000 ; 5899000] 4 094 438 1 905 507
[400000 ; 9018100]
Net return 1 115 773 1 150 539 [-1217900 ; 4340000]
Output/Input 1,41 +/- 0,51 ; [0,43 ; 3,50] Table 7: Average return per cycle per cage
Inputs (Rp) Output (Rp)
Category Average Standard deviation [minimum ; maximum] Average Standard deviation
[minimum ; maximum] Fingerlings cost
Feed cost
Harvest cost
Treatment cost
Hired labour
Financial expenses
Depreciation
378 280
2 338 404
37 285
38 695
28 049
38 186
132 596
100 122 [225000 ; 570000]
921 083 [903500 ; 5405000]
30 693 [0 ; 150000]
50 735 [0 ; 240000]
95 393 [0 ; 425000]
71 006 [0 ; 330000]
64 409 [13333 ; 350000]
Total 2 933 551
1 065 064 [486000 ; 5879333] 3 181 320 1 236 953
[900000 ; 6533333]
Net return 247 769
923 372 [-1792333 ; 1915500]
Output/Input 1,15 +/- 0,46 ; [0,33; 3,35] NB: - Depreciations have been calculated depending on the life duration of material (buildings, cages…) - Pond maintenance cost includes: pump hire, petrol, labour, and inputs (salt, lime and fertilisers)
12

2.2.2. Commercialisation Pond site : Tankit Purchasers come directly from Jambi’s market with their own cars. Usually 3 buyers come every night to Tankit to buy between 800 and 1 200 kg. Fish farmers have only to pay the harvesters. During the dry season, lots of ponds and cages in this area become dry and the fish farmers have to sell their production. Therefore the market in saturated and the prices plummet. Since the economic crisis the price of feed has been increasing regularly and fish farmers’ net return has been steadily decreasing. Cage site : villages on the Batang Hari river The marketing system is quite different. There is a group of 30 buyers from the villages, who work with motorcycles. They directly sell to restaurants and to small markets in the province. They do not yet experience overproduction problems. The prices are higher than in Tankit, but the farmers have also to tackle with harsh increases in feed prices.
13

3. Analysis of the results
3.1. Impact of techniques on yields Pond site: Tankit Statistical analyses show that production per m3 is significantly correlated:
- positively to: • cycle duration, • lime quantity, • final fish weight, • initial density of fingerlings (number/m3), • total feed distributed (quantity per m3),
- negatively to: • pond volume, • mortality rate.
Using linear multiple regression with SPAD the best model obtained is: Production = - 2,2 + 0,3 Fingerlings/m3 + 6,2 Final weight – 5,4 Mortality + 0,1 feed/ m3 And R²= 0,9408 Other relations have been found such as:
- Initial density is negatively correlated with pond volume that means fish farmers do not use big enough ponds; the density in small ponds is higher than in big ones.
- Mortality is negatively correlated to initial density. - Lime quantity influences mortality rate.
quantité de CaO (kg/m3)
,7,6,5,4,3,2,10,0
mor
talit
é (e
n%)
1,2
1,0
,8
,6
,4
,2
0,0
-,2
Observed
Exponential
Figure 6: Relation between mortality rate and lime quantity in pond
Mortality = exp(-9,93 CaO) R² = 0,64943 Sigf = 0,0000 Optimum for: 0,4 kg/ m
Cage site : villages on Batang Hari river Statistic analyses show that production per m3 is significantly correlated:
- positively with: • initial density (fingerlings number/m3), • final fish weight, • total food distributed (quantity per m3),
- negatively with: • food conversion ratio, • mortality rate.
14

Another relation has been found: feed conversion ratio and mortality rate are positively correlated. That confirms that most fishes die at the end of the production cycle and have consumed a lot of feed.
Taux de mortalité (en %)
80706050403020100
6
5
4
3
2
0
Observed
Logarithmic
Figure 7: Relation between mortality rate and feed conversion ratio in cages
IC = 0,53 ln (Mortality) R² = 0,863 Sigf = 0,000
Indi
ce d
e co
nver
sion
1
Using linear multiple regressions with SPAD the best model obtained is: Production = 24,5 - 7,2 IC + 0,1 Initial density – 20,4 Mortality + 0,3 Feed quantity And R² = 0.8640
3.2. Economic return
3.2.1. Factors which affect economic return Table 8: Average production cost per cycle In ponds In cages en Rp/kg % en Rp/kg % Fingerlings 646.68 13 905.41 13 Feed 3 791.22 77 5 693.30 79 Medicines 0.00 0 91.05 1 Harvest cost 158.20 3 87.73 1 Employee cost 0.00 0 132.00 2 Maintenance 270.80 6 0.00 0 Depreciation 43.84 1 275.18 4 Total 4 910.75 100 7 184.67 100 The main cost comes from feed, it is the biggest spending during the cycle, even higher than investment. But for this year feed price constantly increased, and the fish-selling price decreased, thus considerably reducing the profitability of aquaculture.
15
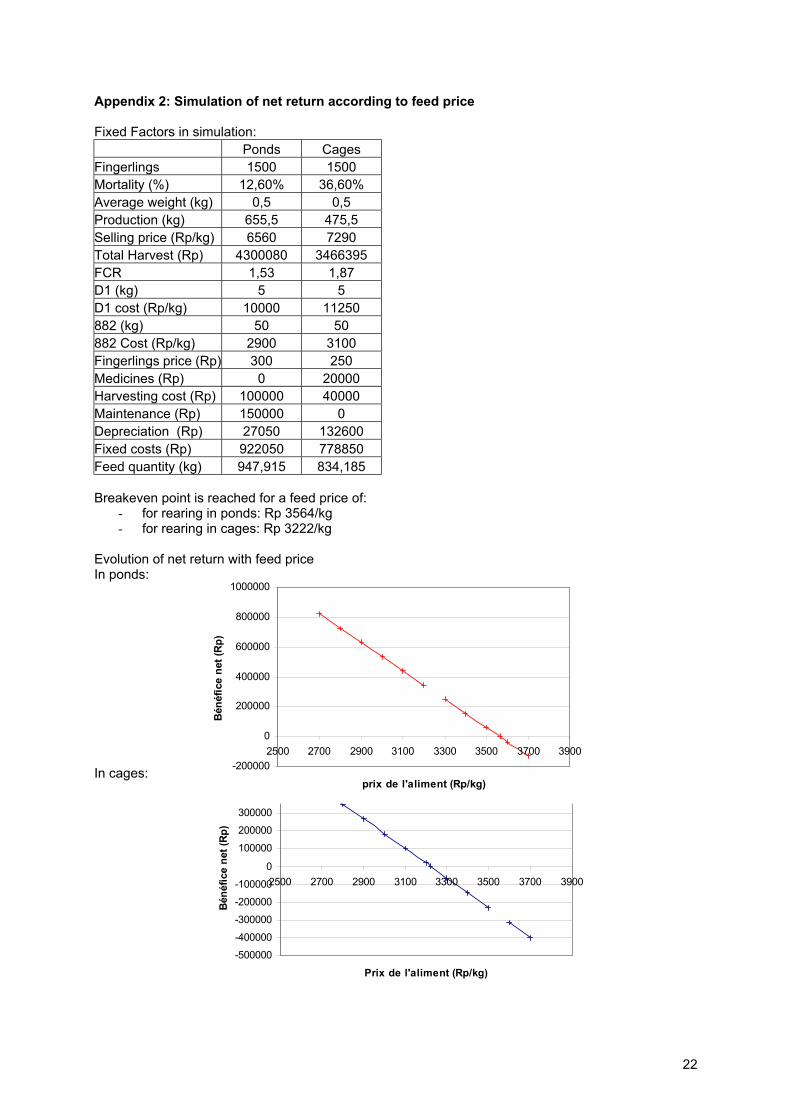
3.2.2. Profitability Feed has a big impact on returns, so we have tried to make a simulation of net return with a variable feed price (annexe 2). Break even point is reached with a feed price of:
- for rearing in ponds: Rp 3564/kg - for rearing in cages: Rp 3222/kg
Self made and industrial feed do not give different results: feed conversion ratio and feed cost per fish are not significantly different (annexe 3). But on average, with self made feed the conversion ratio is higher and the feed cost per fish is lower.
3.2.3. Aquaculture: one activity among others Aquaculture is usually a complementary activity, which provides the family with an extra-income. When farmers have money they invest in aquaculture as well as in other activities.
39%
46%
3%3%9%
1 activity2 activities3 activities4 activities5 activities
34%
25%
28%
10%3%
Figure 8: Activities (other than aquaculture) for investigated fish farmers Tankit Batang Hari villages Figure 9: Main activities for investigated fish farmers (percentage of income for each activity)
aquaculture30%
production ananas
34%
teacher6%
chicken rearing6%
other external works
9%
pineapple wholesaler
6%
home industry9%
aquaculture17%
other activities83%
16

4. Identified problems and recommendations
4.1. Integration and management support for aquaculture Integration has been very good. The structures and the rearing techniques are easy and accessible (low investment…). Management support, by the Dinas Perikanan and the BBAT-Jambi, is very important, even more for the technical help. In Tankit, where fishfarmers have more contacts with the BBAT-Jambi, results seem better than on the river site. In Kuap a lot of farmers have stopped their activities. Half of the cages are empty or neglected. Farmers got financial help to begin the breeding, but motivation, knowledge and management support were not sufficient. Contrary to the others villages, there were a lot of insolvencies.
4.2. Technical problems and recommended improvements There are hardly technical problems, however a few points can still be improved. All technical improvements can be done very quickly, but not without support and previous research.
4.2.1. Fingerlings size and initial density The results of statistical analyses have shown that the ponds of big volume are underused and the maximal density is not attained in the cages. At the same time, we have seen that initial size of fingerlings has a significant impact on the production per m3. From these results, in order to optimise the production yield, farmers should be encouraged to use bigger fingerlings for initialising each cycle and research should provide farmers with optimal density figures for every rearing structure.
4.2.2. Water quality control in ponds In the Tankit ponds, the water quality is not optimal with a very low oxygen concentration and very high ammonia concentration. In this area, diseases seem directly linked to the bad water quality. It has been shown that high ammonia and low oxygen concentrations can be responsible for reducing the growth, lack of appetite and weakening fish (De Kinkelin et al., 1985). We suggest:
- to increase dissolved oxygen concentration with pumps, after having tested efficiency and profitability for fishfarmers.
- to follow precisely ammonia nitrogen evolution, to study the link between pathologies and water quality.
4.2.3. Feeding In every studied site fishes are fed ad libitum, which is not always optimal. Researchers may optimise formulation, daily ration and distribution methods. It has been shown that catfish have better assimilation during the night (Hung et al., 1998). If fishfarmers instituted a fasting day, feed conversion ratio would be ameliorated. It is usually advised in fish rearing and it is also a way to reduce ammonia waste in pond and feed cost.
17

4.2.4. Diseases and treatments identification Most of fishfarmers do not know how to treat diseases; they do not get enough information and training. In most cases the drugs used are not well adapted to the disease. To improve this problem, farmers must be trained to identify pathogens and to find efficient preventive and curative treatments.
4.3. Environmental problem Mortality rate in river is very high (37 %) and no infection cause has been found. Mortality in Batang Hari River seems to be due to the waste from a wood factory upstream the studied villages. First pollutants measurements reveal a high concentration of phenols (2,18 ppm when usual safety standard for fish breeding is 0,001 ppm). The problems clearly started with the opening of the factory. This mortality causes a huge loss of income to fishfarmers. If this problem is not solved quickly aquaculture is in jeopardy and might even disappear on the river in a very short time.
4.4. Economic problems and market improvement Different kinds of problems have been identified:
- Fish farmers’ incomes decrease because of the increase in feed cost and the decrease in fish selling price,
- Capital availability, - Commercialisation and market saturation.
Feed price may be improved with formulation research to use vegetal proteins (which reduce cost production). That sort of research already exists and has to be carried on; it can also help fish farmers who make the feed themselves. To facilitate the access to capital, loans should be made accessible to farmers. Up to now, only very few farmers could benefit from loans (in Kubu Kandang for example). The Dinas Perikanan could play a decisive part in linking farmers to banks. But for other problems there is only one solution: enhance the fish market. There are several ways:
- extend the marketing area : • export to the other Indonesian areas that do not produce catfish, • invest in processing units in order to penetrate foreign markets (like shrimps in
Indonesia or Pangasiidae in Vietnam), - diversify the production :
• produce bigger fishes, • incite fish farmers to make multi-specific breeding not to depend on one species,
- diversify the products with fish processing: smoked and salted fishes, or cooked dishes. The marketing problems may take longer to solve but they are key to the sustainability of aquaculture in the province of Jambi.
18

Conclusion In the province of Jambi the development of aquaculture has been a real success story. In only a few years, the number of fish farmers and production have reached unexpected levels. But nowadays this activity already slows down. Profitability decreases, mainly because of excessive production costs and of marketing problems. Concerning the technique, there is no real problem, it has been well adopted by farmers and performances are good. Only a few little things can still be improved. However, technical aid by local institutions will be determining to solve existing and forthcoming problems. Fish farmers proved their ability to adopt new techniques and to produce in large quantities. Today, this incredible success is in jeopardy because of excessive feed prices and because of marketing problems. Research is urgently needed to solve these new problems fish farmers are facing.
19

List of figures Figure 1: Evolution of halieutic production in Jambi province........................................... 4 Figure 2: Map of the study area.............................................................................................. 4 Figure 3: Evolution of dissolved oxygen concentration in ponds......................................... 8 Figure 4: Evolution of ammonia nitrogen concentration in ponds...................................... 8 Figure 5 : Pangasius hypophthalmus fingerlings suppliers................................................... 9 Figure 6: Relation between mortality rate and lime quantity in pond.............................. 14 Figure 7: Relation between mortality rate and feed conversion ratio in cages ................ 15 Figure 8: Activities (other than aquaculture) for investigated fish farmers..................... 16 Figure 9: Main activities for investigated fish farmers (percentage of income for each
activity) ............................................................................................................................ 16 List of tables Table 1: Village presentation .................................................................................................. 6 Table 2: Physicochemical characteristics of the ponds ......................................................... 7 Table 3: Physicochemical characteristics of the Batang Hari River ................................... 8 Table 4: Treatment and average doses for pond maintenance ............................................ 9 Table 5: Main production characteristics ............................................................................ 11 Table 6: Average return per cycle per pond........................................................................ 12 Table 7: Average return per cycle per cage ......................................................................... 12 Table 8: Average production cost per cycle......................................................................... 15 List of appendices Appendix 1: Feed composition Appendix 2: Simulation of net return according to feed price Appendix 3: Comparison of feed conversion ratio and feed cost per fish between industrial and self made feed.
20

Appendix 1 : Feed composition
Self made feed by Bapak Mustari Proteins : 22,29 % Fat : 10,12 % Mineral : 8, 16 % Humidity : 7,1 % Composition : dry fishes 35%, rice powder 35%, chicken intestine 10%, mineral 2%, palm oil 4%, corn 10%, wheat flour 4%, vitamins 0,5%. by Bapak Ambo Undru Proteins : 21,79 % Fat : 9,86 % Mineral : 10,26 % Humidity : 11,7 % Composition : dry fishes 40%, rice powder 35%, chicken intestine 10%, banana 5%, palm oil 5%.
D1 (from shrimps) Proteins: 42 % min. Fat: 6% min. Fibres: 3% max. Mineral: 16 % Humidity: 11 % Laju Proteins: 23 à 26 % Fat: 3 % Fibres: 7 % Mineral: 12 % Humidity: 12 % Note traduction : Lemak = fat Serat = fibre Abu = ashes Kadar air = water content
21
Appendix 2: Simulation of net return according to feed price Fixed Factors in simulation: Ponds Cages Fingerlings 1500 1500 Mortality (%) 12,60% 36,60% Average weight (kg) 0,5 0,5 Production (kg) 655,5 475,5 Selling price (Rp/kg) 6560 7290 Total Harvest (Rp) 4300080 3466395 FCR 1,53 1,87 D1 (kg) 5 5 D1 cost (Rp/kg) 10000 11250 882 (kg) 50 50 882 Cost (Rp/kg) 2900 3100 Fingerlings price (Rp) 300 250 Medicines (Rp) 0 20000 Harvesting cost (Rp) 100000 40000 Maintenance (Rp) 150000 0 Depreciation (Rp) 27050 132600 Fixed costs (Rp) 922050 778850 Feed quantity (kg) 947,915 834,185 Breakeven point is reached for a feed price of:
- for rearing in ponds: Rp 3564/kg - for rearing in cages: Rp 3222/kg
Evolution of net return with feed price In ponds:
-500000-400000-300000-200000-100000
0
100000200000300000400000500000
2500 2700 2900 3100 3300 3500 3700 3900
Prix de l'aliment (Rp/kg)
Béné
fice
net (
Rp)
-200000
0
200000
400000
600000
800000
1000000
2500 2700 2900 3100 3300 3500 3700 3900
prix de l'aliment (Rp/kg)
Béné
fice
net (
Rp)
In cages:
22

Appendix 3: Comparison of feed conversion ratio and feed cost per fish between industrial and self made feed
Variance analysis: one factor DETAILS
Groups Sampling Amount Average Variance FCR self made feed 8 12,8428705 1,60535882 0,01477407 FCR industrial feed 101 153,776963 1,52254419 0,15392082 VARIANCE ANALYSIS
Variations source Squares amount Liberty degree
Squares average F Probability F critic
Between groups 0,05083923 1 0,05083923 0,35105659 0,5547657 3,92984134 Intra-group 15,4955 107 0,14481776 Total 15,5463393 108 Variance analysis: one factor DETAILS
Groups Sampling Amount Average Variance Self made feed cost per fish 8 13203,7097 1650,46371 80345,9142 Industrial feed cost per fish 101 182793,553 1809,83716 552408,918 VARIANCE ANALYSIS
Variations source Squares amount Liberty degree
Squares average F Probability F critic
Between Groups 188285,481 1 188285,481 0,36102778 0,54920667 3,92984134 Intra-group 55803313,2 107 521526,291 Total 55991598,7 108
23

![Francis Murray Institute of Aquaculture, University of ... Basa [Pangasius bocourti] Pangasius Tra [P. hypophthalmus] Rainbow trout [Oncorhynchus mykiss] Red Porgy [Pagrus pagrus]](https://img.pdfslide.us/doc/110x75/5af259657f8b9aa916903c17/francis-murray-institute-of-aquaculture-university-of-basa-pangasius-bocourti.jpg)


![10 - Nguyen Huu Dzung Vietnam Pangasius 2013[E] FINALantigua.conxemar.com/ponencias2/whitefish/10-NguyenHuu.pdf · •More modern farming technology applied, ... Pangasius production](https://img.pdfslide.us/doc/110x75/5aac529c7f8b9a693f8ce7c9/10-nguyen-huu-dzung-vietnam-pangasius-2013e-more-modern-farming-technology.jpg)