Embed Size (px)
Citation preview
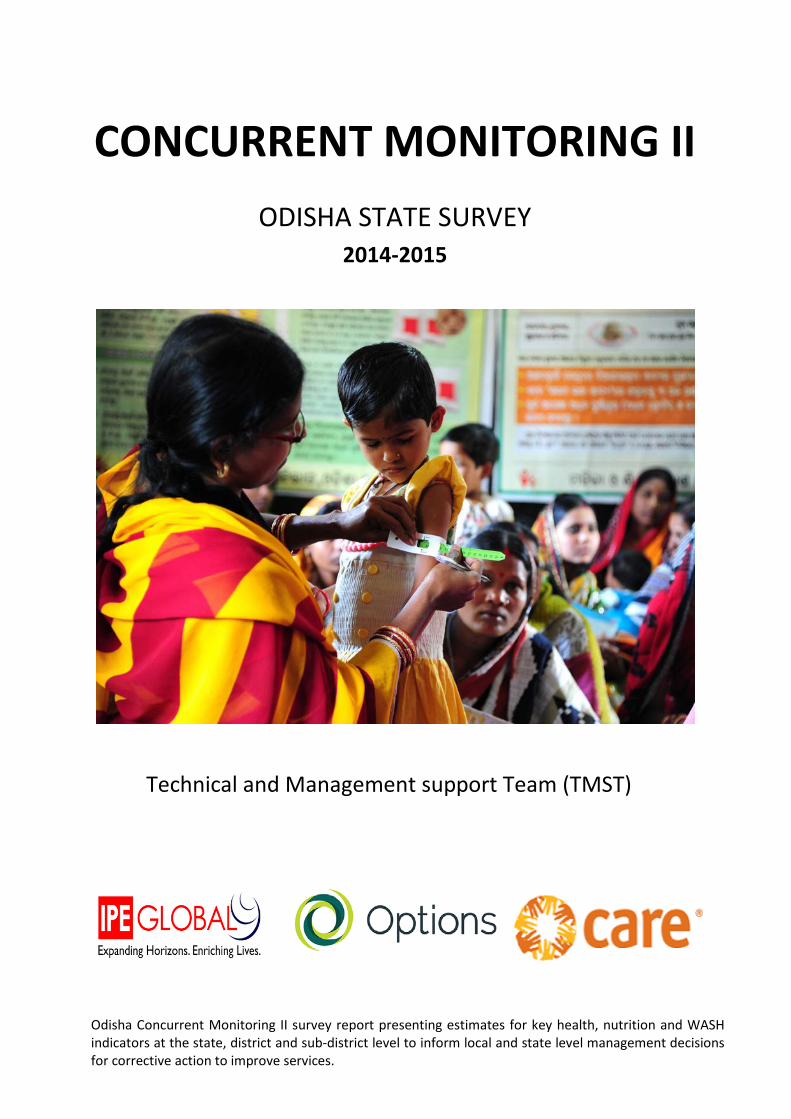
Odisha Concurrent Monitoring II survey report presenting estimates for key health, nutrition and WASH indicators at the state, district and sub-district level to inform local and state level management decisions for corrective action to improve services.
CONCURRENT MONITORING II ODISHA STATE SURVEY
2014-2015
Technical and Management support Team (TMST)
Concurrent Monitoring II Survey Report
2 Technical and Management Support Team (TMST)
Citation: Odisha Technical and Management Support Team. (2015). Concurrent Monitoring II: Odisha state survey 2014-15. Options Consultancy Services LTD, IPE Global, CARE India.
The work has been funded by UK aid from the UK Government and has been conducted on behalf of the Government of Odisha.
Concurrent Monitoring II Survey Report
3 Technical and Management Support Team (TMST)
Acronyms
AHS Annual Health Survey
ANM Auxiliary Nurse Mid-wife
ARI Acute Respiratory Infection
ASHA Accredited Social Health Activist
AWC AnganWadi Centre
AWW AnganWadi Worker
BMI Body Mass Index
CAPI Computer Assisted Personal Interview
CCM Concurrent Monitoring
CHC Community Health Centres
CI Confidence Interval
CSR Child Sex Ratio
CBR Crude Birth Rate
CLS Community Led Sanitation
CPR Contraceptive Prevalence Rate
DE Design Effect
DFID Department for International Development
DHS Demographic Health Survey
DLHS District Level Household Survey
EAG Empowered Action Group
ENC Essential Newborn Care
ESS Effective Sample Size
FLW Frontline Health Worker
GAM Global Acute Malnutrition
GOO Government of Odisha
GP Gram Panchayat
HBD High Burden Districts
HNWASH Health,Nutrition,Water and Sanitation
IFA Iron Folic Acid
IMR Infant Mortality Rate
Concurrent Monitoring II Survey Report
4 Technical and Management Support Team (TMST)
ITN Insecticide Treated Net
IYCF Infant and Young Child Feeding
KBK Kalahandi,Balangir,Koraput
LLIN Long-Lasting Insecticide Treated Nets
MCP Mother Child Protection
MMR Maternal Mortality Ratio
MUAC Mid to Upper Arm Circumference
MAM Moderate Acute Malnutrition
NHBD Non-high Burden districts
NMR Neonatal Mortality Rate
NFHS National Family Health Survey
OBC Other Backward Caste
PCA Primary Census Abstract
PD PustikarDiwas
PLA Participatory Learning and Action
PSU Primary Sampling Unit
SBA Skilled Birth Attendance
SC Scheduled Caste
ST Scheduled Tribe
SPSS Statistical Package for Social Science
SLI Standard of Living
QA Quality Assurance
THR Take Home Ration
TMST Technical and Management Support Team
TOT Training of Trainers
U5MR Under-five Mortality Rate
VHND Village Health and Nutrition Days
WHO World Health Organization
Concurrent Monitoring II Survey Report
5 Technical and Management Support Team (TMST)
CONTENTS PAGE
TABLES ........................................................................................................................................ 8 FIGURES ...................................................................................................................................... 9 2. EXECUTIVE SUMMARY ...................................................................................................... 11 3. BACKGROUND ................................................................................................................... 21 3.1. LOCATION AND POPULATION CHARACTERISTICS ........................................................................ 21 3.2. THE NEED FOR DATA SURVEILLANCE -AT BLOCK LEVEL ................................................................ 22 4. STRUCTURE OF THE REPORT ............................................................................................. 23 5. METHODS .......................................................................................................................... 25 5.1. SURVEY LOCATION ............................................................................................................. 25 5.2. SAMPLE SIZE ..................................................................................................................... 25 5.3. SAMPLING SCHEME ............................................................................................................ 27 5.4. RESPONDENT GROUPS OF INTEREST ....................................................................................... 29 5.5. CCM II QUESTIONNAIRE ..................................................................................................... 29 5.6. AGENCY SELECTION ............................................................................................................ 31 5.7. TRAINING OF DATA COLLECTORS ........................................................................................... 32 5.8. SURVEY EQUIPMENT ........................................................................................................... 33 5.9. DATA COLLECTION ............................................................................................................. 33 5.10. QUALITY ASSURANCE CONSULTANTS ...................................................................................... 34 5.11. DATA MANAGEMENT .......................................................................................................... 34 5.12. DATA PREPARATION AND ANALYSIS ........................................................................................ 35 5.13. GIS MAPS ........................................................................................................................ 36 6. DESCRIPTION OF CCM II SAMPLE ...................................................................................... 37 6.1. RESPONSE RATE ................................................................................................................. 37 6.2. HOUSEHOLD-LEVEL CHARACTERISTICS .................................................................................... 37 6.3. RESPONDENT GROUP CHARACTERISTICS .................................................................................. 41 6.4. FLW CHARACTERISTICS ....................................................................................................... 43 7. MORTALITY ........................................................................................................................ 44 7.1. RESPONDENTS AND SURVEY QUESTIONS ................................................................................. 44 7.2. INDICATOR ESTIMATES ........................................................................................................ 45 7.2.1. MATERNAL MORTALITY RATIO (MMR) ................................................................................ 45 7.2.2. UNDER-FIVE MORTALITY RATE (U5MR) ................................................................................ 45 7.2.3. INFANT MORTALITY RATE (IMR) .......................................................................................... 46 7.2.4. NEONATAL MORTALITY RATE (NMR) .................................................................................... 48 7.2.5. STILLBIRTH RATE ............................................................................................................... 49 8. ANTHROPOMETRY: ........................................................................................................... 50 8.1. INDICATOR DEFINITIONS AND COMPUTATION ........................................................................... 50 8.2. UNDER NUTRITION ESTIMATES .............................................................................................. 51 8.2.1. STUNTING IN CHILDREN UNDER-FIVE ..................................................................................... 51 8.2.2. WASTING IN CHILDREN UNDER-FIVE ...................................................................................... 52
Concurrent Monitoring II Survey Report
6 Technical and Management Support Team (TMST)
8.2.3. UNDERWEIGHT IN CHILDREN UNDER-FIVE............................................................................... 53 8.2.4. MID TO UPPER ARM CIRCUMFERENCE (MUAC) IN CHILDREN 6 MONTHS-5 YEARS ......................... 53 8.3. UNDERWEIGHT AND OVERWEIGHT AMONGST MOTHERS OF CHILDREN UNDER-FIVE ......................... 54 8.4. COVERAGE OF UNDER NUTRITION PROGRAMMES ...................................................................... 55 9. FAMILY PLANNING ............................................................................................................ 58 9.1. RESPONDENTS, SURVEY QUESTIONS AND DEFINITIONS ............................................................... 58 9.2. INDICATOR ESTIMATES ........................................................................................................ 59 9.2.1. KNOWLEDGE OF MODERN METHODS OF FAMILY PLANNING ........................................................ 59 9.2.2. CPR, UNMET NEED, AND EARLY PREGNANCY .......................................................................... 60 10. PREGNANCY..................................................................................................................... 62 10.1. RESPONDENTS, SURVEY QUESTIONS AND INDICATOR DEFINITIONS ................................................ 62 10.2. INDICATOR ESTIMATES ........................................................................................................ 64 10.2.1. ANC LOCATION .............................................................................................................. 64 10.2.2. COVERAGE OF ANC SERVICES ............................................................................................ 65 10.2.3. BIRTH PLANS AND ANAEMIA TESTING ................................................................................... 66 10.2.4. ANC QUALITY INDICATORS ................................................................................................ 66 10.2.5. KNOWLEDGE OF DANGER SIGNS IN PREGNANCY ..................................................................... 67 11. DELIVERY AND PNC ......................................................................................................... 67 11.1. RESPONDENTS, QUESTIONS AND INDICATOR DEFINITIONS ........................................................... 67 11.2. INDICATOR ESTIMATES ........................................................................................................ 68 11.2.1. INSTITUTIONAL DELIVERY .................................................................................................. 68 11.2.2. C-SECTION RATE ............................................................................................................. 69 11.2.3. POSTNATAL CHECKS WITHIN 24 HOURS ............................................................................... 69 11.2.4. SKILLED BIRTH ATTENDANCE .............................................................................................. 70 11.2.5. KNOWLEDGE OF DANGER SIGNS IN WOMEN DURING DELIVERY AND POSTPARTUM PERIOD .............. 71 12. ESSENTIAL NEWBORN CARE AND INFANT AND YOUNG CHILD FEEDING: ...................... 71 12.1. RESPONDENTS, SURVEY QUESTIONS AND INDICATOR DEFINITIONS ................................................ 71 12.2. INDICATOR ESTIMATES ........................................................................................................ 73 12.2.1. KNOWLEDGE OF NEWBORN DANGER SIGNS ........................................................................... 73 12.2.2. ESSENTIAL NEWBORN CARE PRACTICES................................................................................. 73 12.2.3. INFANT AND YOUNG CHILD FEEDING INDICATORS ................................................................... 75 12.2.4. KNOWLEDGE OF IYCF AMONGST WOMEN 15-49 .................................................................. 76 12.2.5. TAKE HOME RATIONS ....................................................................................................... 76 13. PREVENTION AND MANAGEMENT OF CHILDHOOD AND ADOLESCENT ILLNESSES ....... 77 13.1. RESPONDENTS, SURVEY QUESTIONS AND INDICATOR DEFINITIONS ................................................ 77 13.2. INDICATOR ESTIMATES ........................................................................................................ 79 13.2.1. VITAMIN A, DEWORMING, MEASLES AND FULL IMMUNIZATION ................................................ 79 13.2.2. COVERAGE OF IRON FOLIC ACID (IFA) FOR UNMARRIED ADOLESCENT GIRLS 10-19 ....................... 80 13.2.3. DIARRHOEA PREVALENCE AND MANAGEMENT ....................................................................... 82 13.2.4. FEVER AND MALARIA PREVALENCE AND MANAGEMENT; USE OF BED NETS ................................... 83 13.2.5. ACUTE RESPIRATORY INFECTION PREVALENCE AND MANAGEMENT ............................................. 85
Concurrent Monitoring II Survey Report
7 Technical and Management Support Team (TMST)
14. HYGIENE .......................................................................................................................... 86 14.1. RESPONDENTS, SURVEY QUESTIONS AND INDICATOR DEFINITIONS ................................................ 86 14.2. INDICATOR ESTIMATES ........................................................................................................ 88 14.2.1. HAND WASHING AT CRITICAL MOMENTS IN THE DAY, AND CLEANSING AGENTS USED ..................... 88 14.2.2. KNOWLEDGE OF ADOLESCENT GIRLS ABOUT MENSTRUATION .................................................... 90 14.2.3. SCHOOL FACILITIES FOR SANITATION AND MENSTRUAL HYGIENE MANAGEMENT ........................... 91 14.2.4. MENSTRUAL HYGIENE PRACTICES OF ADOLESCENT GIRLS .......................................................... 91 14.2.5. DAYS OF SCHOOL MISSED LAST MONTH DUE TO MENSTRUATION ............................................... 92 15. WATER AND SANITATION: .............................................................................................. 94 15.1. RESPONDENTS, SURVEY QUESTIONS AND INDICATOR DEFINITIONS ................................................ 94 15.2. INDICATOR ESTIMATES ........................................................................................................ 95 15.2.1. IMPROVED AND RELIABLE DRINKING WATER SOURCES ............................................................. 95 15.2.2. SAFE STORAGE OF DRINKING WATER .................................................................................... 96 15.2.3. HOUSEHOLDS WITH IMPROVED SANITATION FACILITIES ........................................................... 96 15.2.4. SAFE DISPOSAL OF CHILD FAECES ........................................................................................ 97 16. WOMEN’S EMPOWERMENT AND AGENCY, AND ATTITUDES TO VIOLENCE AGAINST WOMEN ................................................................................................................................... 98 16.1. RESPONDENTS, SURVEY QUESTIONS AND INDICATOR DEFINITIONS ................................................ 98 16.2. INDICATOR ESTIMATES ...................................................................................................... 100 16.2.1. FINANCIAL AUTONOMY INDICATORS .................................................................................. 100 16.2.2. WOMEN’S INVOLVEMENT IN DECISION MAKING ................................................................... 102 16.2.3. PERCEIVED CONTROL OVER PERSONAL DECISIONS, AND ATTITUDES TO VIOLENCE AGAINST WOMEN 103 16.2.4. ACCESS TO MEDICAL ADVICE AND TREATMENT ..................................................................... 105 17. CCM II DATA AT BLOCK LEVEL ....................................................................................... 106 17.1. BLOCK LEVEL INDICATORS .................................................................................................. 106 17.2. EXAMPLE DISTRICT AND BLOCK LEVEL DATA: BOUDH DISTRICT ................................................... 106 17.3. POTENTIAL USE OF BLOCK LEVEL DATA .................................................................................. 107 18. FRONTLINE HEALTH WORKER SURVEY ......................................................................... 109 18.1. TRAINING ....................................................................................................................... 109 18.2. MOST COMMON CONSTRAINTS FACED IN CARRYING OUT DUTIES ............................................... 111 18.3. FREQUENCY ASHAS WORK WITH AWWS AND ANMS ........................................................... 112 18.4. INFRASTRUCTURE AT SUB-CENTRES AND AWCS ..................................................................... 113 18.5. HNWASH KNOWLEDGE ................................................................................................... 114 19. DISCUSSION AND CONCLUSION .................................................................................... 116 19.1. HNWASH SERVICE COVERAGE AND OUTCOMES FOR ADOLESCENT GIRLS .................................... 118 19.2. HNWASH SERVICE COVERAGE AND OUTCOMES FOR PREGNANT WOMEN. .................................. 119 19.3. HNWASH SERVICE COVERAGE AND OUTCOMES DURING DELIVERY AND POSTPARTUM PERIOD ........ 121 19.4. HNWASH SERVICE COVERAGE AND OUTCOMES FOR ESSENTIAL NEWBORN CARE .......................... 123 19.5. HNWASH SERVICE COVERAGE AND OUTCOMES FOR CHILDREN UNDER TWO ............................... 123 19.6. HNWASH SERVICE COVERAGE AND OUTCOMES FOR CHILDREN UNDER FIVE ................................ 126 19.7. HNWASH SERVICE COVERAGE AND OUTCOMES FOR WATER AND SANITATION ............................. 130
Concurrent Monitoring II Survey Report
8 Technical and Management Support Team (TMST)
19.8. HNWASH SERVICE COVERAGE AND OUTCOMES FOR FLW AND EMPOWERMENT ......................... 131 19.9. MORTALITY - COMPARISON OF CCM II ESTIMATES WITH OTHER DATA SOURCES ........................... 133
TABLES
TABLE 1: OVERVIEW OF CCM II HOUSEHOLD QUESTIONNAIRE ........................................................................... 30 TABLE 2: OVERVIEW OF FLW QUESTIONNAIRE .................................................................................................... 31 TABLE 3: WITHIN HOUSEHOLD CCM II RESPONSE RATE FOR RESPONDENT GROUPS OF INTEREST .................... 37 TABLE 4: QUESTIONS USED TO CREATE THE STANDARD OF LIVING (SLI) INDEX .................................................. 38 TABLE 5: WOMEN 15-49 BY LITERACY GROUP ..................................................................................................... 41 TABLE 6: ADOLESCENT GIRLS 10-14, BY EDUCATION GROUP .............................................................................. 42 TABLE 7: NUMBER AND WEIGHTED PERCENTAGE (95% CIS) BY FLW CADRE, SOCIAL GROUP AND EDUCATION 43 TABLE 8: INDICATOR DEFINITIONS AND COMPUTATION FOR MORTALITY .......................................................... 44 TABLE 9: NEONATAL MORTALITY RATE (NMR) PER 1000 LIVE BIRTHS IN ODISHA 2013 (CCM II SURVEY 2014) . 48 TABLE-10: NEONATAL, POST-NEONATAL, CHILD (1-4 YRS) AND UNDER 5 MORTALITY RATES ............................ 48 TABLE 11: INDICATOR DEFINITIONS AND COMPUTATION OF ANTHROPOMETRIC ESTIMATES ........................... 50 TABLE 12: INDICATOR DEFINITIONS AND WEIGHTED COVERAGE ESTIMATES (95%CIS) FOR UNDER NUTRITION PROGRAMMES ...................................................................................................................................................... 55 TABLE: 13 CHILDREN <5 YEARS WHO ATTENDED THE VHND THE PREVIOUS MONTH (ALL CHILDREN <5; INCLUDES VILLAGES WHERE VHND MAY NOT HAVE BEEN HELD) ........................................................................ 56 TABLE 14: INDICATOR DEFINITIONS AND COMPUTATION FOR FAMILY PLANNING INDICATORS ........................ 58 TABLE 15: CONTRACEPTIVE PREVALENCE, EARLY PREGNANCY AND UNMET NEED FOR FAMILY PLANNING ...... 61 TABLE 16: INDICATOR DEFINITIONS AND COMPUTATION FOR ANC PRACTICE INDICATORS .............................. 62 TABLE 17: INDICATOR DEFINITIONS AND COMPUTATION FOR OTHER ANC INDICATORS AND KNOWLEDGE..... 63 TABLE 18: INDICATOR DEFINITIONS AND COMPUTATION FOR DELIVERY AND PNC ............................................ 67 TABLE 19: INSTITUTIONAL DELIVERY, C-SECTION RATES AND POSTNATAL CHECKS WITHIN 24 HOURS ............. 70 TABLE 20: INDICATOR DEFINITIONS AND COMPUTATION FOR ENC AND IYCF .................................................... 72 TABLE 21: IYCF KNOWLEDGE INDICATORS AMONGST WOMEN 15-49 ................................................................ 76 TABLE 22: INDICATOR DEFINITIONS AND COMPUTATION FOR THE PREVENTION AND MANAGEMENT OF CHILDHOOD AND ADOLESCENT ILLNESS .............................................................................................................. 78 TABLE 23: PREVALENCE AND MANAGEMENT OF DIARRHOEA ............................................................................. 82 TABLE 24: FEVER AND MALARIA PREVALENCE AND TREATMENT OF CHILDREN UNDER-FIVE ............................ 83 TABLE 25: ARI PREVALENCE AND TREATMENT IN CHILDREN UNDER-FIVE WITH A FEVER IN THE LAST 2 WEEKS .............................................................................................................................................................................. 86 TABLE 26: INDICATOR DEFINITIONS AND COMPUTATION FOR HYGIENE INDICATORS ........................................ 87 TABLE 27: INDICATOR DEFINITIONS AND COMPUTATION FOR WATER AND SANITATION INDICATORS ............. 94 TABLE 28 INDICATOR DEFINITIONS AND COMPUTATION FOR EMPOWERMENT AND AGENCY .......................... 99 TABLE 29: BANK ACCOUNT OWNERSHIP, PAYMENT FOR WORK, AND DECISIONS OVER THE SPENDING OF WOMEN’S EARNINGS ......................................................................................................................................... 101 TABLE 30: WOMEN’S DECISION MAKING WITHIN THE HOUSEHOLD ................................................................. 103 TABLE 31: BLOCK LEVEL HNWASH INDICATORS FOR BOUDH DISTRICT ............................................................. 106 TABLE 32: PROPORTION OF AWCS WITH IMPROVED SANITATION AND DRINKING WATER AVAILABLE ........... 114 TABLE 33: PROPORTION OF ANM SUB-CENTRES WITH IMPROVED SANITATION AND DRINKING WATER AVAILABLE .......................................................................................................................................................... 114 TABLE 34: PROPORTION OF FLWS AWARE OF DANGER SIGNS IN PREGNANCY AND POSTPARTUM ................. 115 TABLE 35: PROPORTION OF FLWS AWARE OF ANC AND YOUNG CHILD FEEDING RECOMMENDATIONS ......... 116 TABLE 36: A COMPARISON OF UNDER NUTRITION ESTIMATES FROM THE NFHS-3, UNICEF RSOC, AHS-CAB CCM II AND SURVEYS, IN RURAL AND MIXED URBAN/RURAL SAMPLES .................................................................... 128 TABLE-37: MALARIA SITUATION IN ODISHA ....................................................................................................... 130
Concurrent Monitoring II Survey Report
9 Technical and Management Support Team (TMST)
FIGURES
FIGURE 1: STATE MAP OF ODISHA ........................................................................................................................ 21 FIGURE 2: CONTINUUM OF MATERNAL, NEWBORN AND CHILD HEALTH ........................................................... 24 FIGURE 3: DISTRICT MAP OF ODISHA INDICATING THE SHAKTI VARTA (PLA) IMPLEMENTATION PLAN. ............ 25 FIGURE 4: SAMPLING SCHEME FOR CCM II .......................................................................................................... 27 FIGURE 5: NUMBER AND PERCENTAGE OF HOUSEHOLDS BY STANDARD OF LIVING CATEGORY ........................ 39 FIGURE 6: NUMBER AND PERCENTAGE OF HOUSEHOLDS BY SOCIAL GROUP/CASTE ......................................... 40 FIGURE 7: PERCENTAGE OF HOUSEHOLDS BY MAIN OCCUPATION ..................................................................... 40 FIGURE 8: PERCENTAGE OF WOMEN 15-49 IN DIFFERENT EDUCATION GROUPS ............................................... 42 FIGURE 9: UNDER-FIVE MORTALITY IN ODISHA IN 2013, DISAGGREGATED BY SOCIO-DEMOGRAPHIC FACTORS .............................................................................................................................................................................. 46 FIGURE 10: INFANT MORTALITY IN ODISHA IN 2013, DISAGGREGATED BY SOCIO-DEMOGRAPHIC FACTORS .... 47 FIGURE 11: INFANT MORTALITY RATE (PER 1000 LIVE BIRTHS) IN ODISHA IN 2013 ............................................ 47 FIGURE 12: STILLBIRTH RATES IN ODISHA, DISAGGREGATED BY SOCIO-DEMOGRAPHIC FACTORS ..................... 49 FIGURE 13: STUNTING ESTIMATES FOR ODISHA IN CHILDREN 0-5 YEARS, DISAGGREGATED BY SOCIO-DEMOGRAPHIC CHARACTERISTICS. ...................................................................................................................... 52 FIGURE 14: WASTING ESTIMATES FOR ODISHA IN CHILDREN 0-5 YEARS, DISAGGREGATED BY SOCIO-DEMOGRAPHIC CHARACTERISTICS. ...................................................................................................................... 52 FIGURE 15: UNDERWEIGHT IN CHILDREN 0-5 YEARS, BY DISTRICT ...................................................................... 53 FIGURE 16: GLOBAL ACUTE MALNUTRITION IN CHILDREN 6 MONTHS-5 YEARS ................................................. 54 FIGURE 17: PREVALENCE OF UNDERWEIGHT AND OVERWEIGHT AMONGST MOTHERS OF CHILDREN UNDER-FIVE ....................................................................................................................................................................... 55 FIGURE 18: DISTRICT-WISE VARIATION IN VHND ATTENDANCE BY CHILDREN UNDER-FIVE YEARS .................... 57 FIGURE 19: KNOWLEDGE OF MODERN FAMILY PLANNING METHODS AMONGST WOMEN 15-49 YEARS IN ODISHA ................................................................................................................................................................. 60 FIGURE 20: LOCATION OF LAST ANC CHECK UP ................................................................................................... 65 FIGURE 21: ANC AND PREGNANCY RELATED INDICATORS AT STATE LEVEL ........................................................ 65 FIGURE 22: PROPORTION OF WOMEN RECEIVING AT LEAST 3 OR 4 ANC CHECKS IN THEIR LAST PREGNANCY, BY SOCIO-DEMOGRAPHIC FACTORS. ......................................................................................................................... 66 FIGURE-23: INSTITUTIONAL DELIVERY BY BACKGROUND CHARACTERISTICS ...................................................... 69 FIGURE 24: SBA FOR HOME DELIVERIES, DISAGGREGATED BY SOCIO-DEMOGRAPHIC FACTORS ....................... 71 FIGURE 25: ESSENTIAL NEWBORN CARE PRACTICES, STATE-LEVEL ..................................................................... 74 FIGURE 26: INFANT AND YOUNG CHILD FEEDING INDICATORS AT STATE-LEVEL ................................................ 75 FIGURE 27: DISTRICT VARIATION IN THR PROVISION FOR CHILDREN 6-23 MONTHS OF AGE ............................. 77 FIGURE 28: STATE LEVEL COVERAGE OF VITAMIN A, DEWORMING, MEASLES VACCINATION AND FULL IMMUNIZATION .................................................................................................................................................... 80 FIGURE 29: DISTRICT COVERAGE OF IFA TO UNMARRIED ADOLESCENT GIRLS 10-19 IN THE PREVIOUS WEEK .. 81 FIGURE 30: DISTRICT CONSUMPTION OF IFA BY UNMARRIED ADOLESCENT GIRLS 10-19 IN THE PREVIOUS WEEK .............................................................................................................................................................................. 81 FIGURE 31: DISTRICT PREVALENCE OF CHILD DIARRHOEA IN THE LAST 2 WEEKS (CHILDREN UNDER-FIVE YEARS) .............................................................................................................................................................................. 82 FIGURE 32: CHILDREN UNDER-FIVE SLEEPING UNDER MOSQUITO NETS, BY TYPE OF NET, THE PREVIOUS NIGHT .............................................................................................................................................................................. 84 FIGURE 33: DISTRICT PREVALENCE OF ACUTE RESPIRATORY INFECTION IN CHILDREN UNDER-FIVE .................. 85 FIGURE 34: DISTRICT ESTIMATES FOR MOTHERS OF UNDER-FIVES WASHING THEIR HANDS AT FIVE CRITICAL MOMENTS IN THE DAY ......................................................................................................................................... 89
Concurrent Monitoring II Survey Report
10 Technical and Management Support Team (TMST)
FIGURE 35: MOTHERS OF CHILDREN UNDER-FIVE HAND WASHING WITH SOAP, ASH OR DETERGENT, BY SOCIO-DEMOGRAPHIC FACTORS ..................................................................................................................................... 89 FIGURE 36: AWARENESS ABOUT MENSTRUATION AND MENSTRUAL HYGIENE AMONGST UNMARRIED ADOLESCENT GIRLS 10-19 .................................................................................................................................... 90 FIGURE 37: SCHOOL FACILITIES FOR SANITATION AND MENSTRUAL HYGIENE MANAGEMENT REPORTED BY ADOLESCENT GIRLS 10-19 .................................................................................................................................... 91 FIGURE 38: MATERIALS USED BY ADOLESCENT GIRLS FOR MANAGING MENSTRUATION .................................. 92 FIGURE 39: ADOLESCENT GIRLS REPORTING PRIVACY AND SAFETY IN DISPOSING OF/CLEANING MATERIALS FOR MENSTRUAL MANAGEMENT (ERROR BARS SHOW 95%CIS) ......................................................................... 92 FIGURE 40: DAYS OF SCHOOL MISSED LAST MONTH DUE TO MENSTRUATION (UNMARRIED ADOLESCENT GIRLS 10-19). .................................................................................................................................................................. 93 FIGURE 41: HOUSEHOLDS WITH ACCESS TO IMPROVED DRINKING WATER SOURCES, BY DISTRICT .................. 95 FIGURE 42: PROPORTION OF HOUSEHOLDS WITH IMPROVED SANITATION FACILITIES, BY SOCIO-DEMOGRAPHIC GROUP ........................................................................................................................................ 96 FIGURE 43: DISTRICT VARIATION IN THE PROPORTION OF HOUSEHOLDS WITH IMPROVED SANITATION FACILITIES ............................................................................................................................................................. 97 FIGURE 44: DISTRICT-WISE VARIATION IN SAFE DISPOSAL OF CHILD FAECES BY MOTHERS OF CHILDREN UNDER-FIVE ....................................................................................................................................................................... 98 FIGURE 45: STATE-LEVEL FINANCIAL AUTONOMY INDICATORS ......................................................................... 100 FIGURE 46: WOMEN’S INVOLVEMENT IN DECISION-MAKING ........................................................................... 102 FIGURE 47: PERCEIVED CONTROL OVER PERSONAL DECISIONS AFFECTING DAILY LIFE (WOMEN 15-49) ......... 104 FIGURE 48: PERCEIVED EASE WITH WHICH WOMEN FEEL THEY CAN CHANGE THINGS IN THEIR COMMUNITY (WOMEN 15-49) ................................................................................................................................................. 105 FIGURE 49: EXTENT TO WHICH DIFFERENT FACTORS THAT CAN INHIBIT WOMEN’S ACCESS TO MEDICAL ADVICE AND SERVICES ARE FELT AS A PROBLEM IN ODISHA .......................................................................................... 105 FIGURE : 50 HOUSEHOLDS USING IODIZED SALT, BY BLOCK .............................................................................. 108 FIGURE 51: PROPORTION OF FLWS TRAINED IN 1000 DAYS, BY HIGH BURDEN AND NON-HIGH BURDEN DISTRICTS ............................................................................................................................................................ 109 FIGURE 52: THE PROPORTION OF AWWS WHO HAVE HAD INDUCTION TRAINING, BY SOCIO-DEMOGRAPHIC GROUP ................................................................................................................................................................ 110 FIGURE 53: PROPORTION OF AWWS WHO HAVE RECEIVED JOB TRAINING, BY SOCIO-DEMOGRAPHIC GROUP ............................................................................................................................................................................ 110 FIGURE 54: PROPORTION OF AWWS WHO HAVE HAD REFRESHER TRAINING, BY SOCIO-DEMOGRAPHIC GROUP ............................................................................................................................................................................ 111 FIGURE 55: TOP THREE MOST COMMONLY CITED WORK CONSTRAINTS: AWWS ............................................. 111 FIGURE 56: TOP THREE MOST COMMONLY CITED WORK CONSTRAINTS: ASHAS ............................................. 112 FIGURE 57: TOP THREE MOST COMMONLY CITED WORK CONSTRAINTS: ANMS .............................................. 112 FIGURE 58: FREQUENCY OF ASHA AND AWW INTERACTIONS (REPORTED BY ASHAS) ...................................... 113 FIGURE 59: FREQUENCY OF ASHA AND ANM INTERACTIONS (REPORTED BY ASHAS) ....................................... 113 FIGURE 60: INSTITUTIONAL DELIVERY AND POST-NATAL CHECK UP WITHIN 48 HOURS OF DELIVERY ............. 122 FIGURE 61: % OF CHILDREN 6-35 MONTHS RECEIVING AT LEAST ONE DOSE OF VITAMIN A ............................ 129 FIGURE 62: MATERNAL MORTALITY ESTIMATES, ODISHA 2010-2013 (ERROR BARS SHOW 95% CONFIDENCE INTERVALS) ......................................................................................................................................................... 134 FIGURE 63: UNDER-FIVE, INFANT AND NEONATAL MORTALITY RATES, PER 1000 LIVE BIRTHS IN ODISHA USING NFHS-3 AND CCM II DATA (ERROR BARS SHOW 95%CIS) ................................................................................... 135 FIGURE 64: UNDER-FIVE MORTALITY RATE (PER 1000 LIVE BIRTHS) BETWEEN 2000 AND 2013 IN RURAL AND SCHEDULED TRIBE POPULATIONS ...................................................................................................................... 136
Concurrent Monitoring II Survey Report
11 Technical and Management Support Team (TMST)
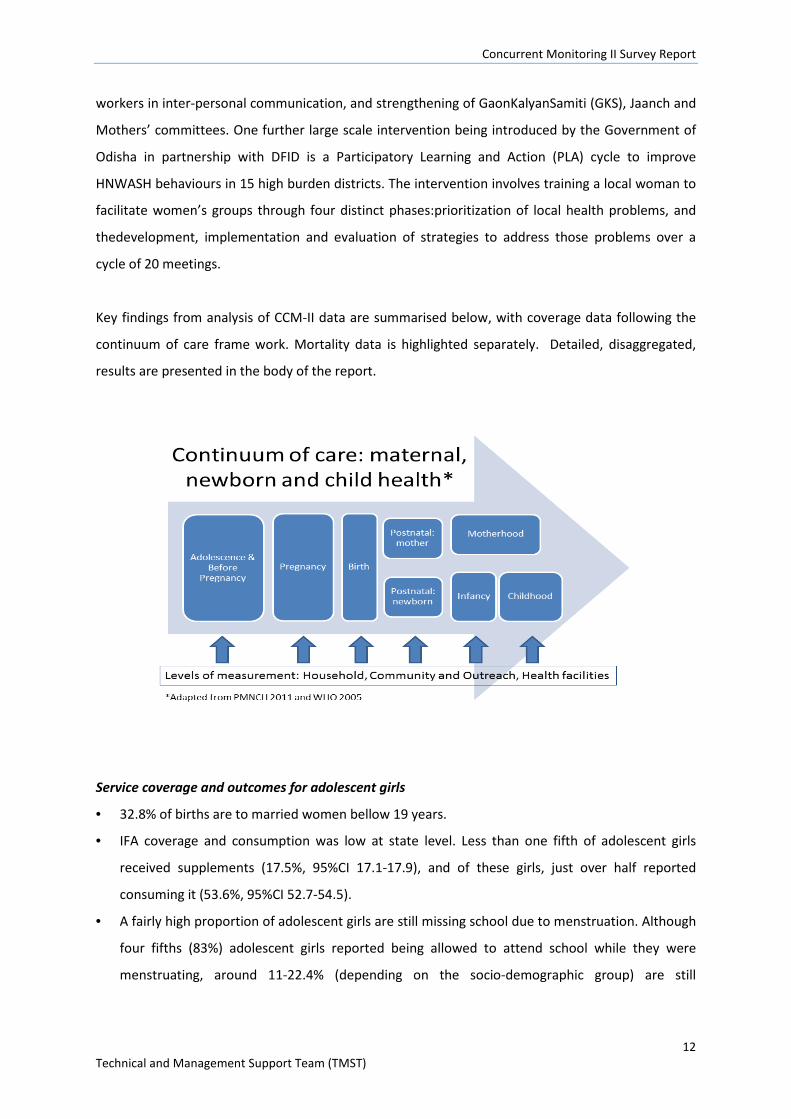
1. Executive summary
Better data on service utilisation and outcomes is needed to inform government departments about
the impact of their programmes on the health and nutritional status of communities. Although
existing surveys like the Annual Health Survey, National Family Health Survey and the District Level
Household Survey are undertaken intermittently, they do not provide sub-district estimates which
can hide block-level disparities, nor do they include indicators on Water, Sanitation and Hygiene
(WASH), important determinants of health and nutrition. In response, Government of Odisha, with
support from the Technical and Management Support Team (TMST), funded by the UK Department
for International Development (DFID), have introduced a method for independent feedback on
service utilisation, quality and outcomes, known as Concurrent Monitoring (CCM). CCM findings are
used to assess progress and steer management decisions at state, district and blocks levels.
CCM collects data on key health, nutrition and WASH indicators through two instruments, a
household survey and Frontline Health Worker (FLW) survey. Key CCM target groupsfor the
household survey to allow comparison of key indicators with other national and state-level surveys
are currently pregnant women, women who have given birth in the reference period(the pre-ceding
year to data collection), children under-five and their mothers, and adolescent girls both married
and un-married. Data is also stratified to examine equity of intervention coverage, and includes
indicators for children under-two in line with the ‘1000 days’ focus1.CCM also includes
questionnaires for FLWs, specifically ASHAs, ANMs and AWWs.
The first round (Round-I) of the CCM survey took place in 2011 and covered all 314 blocks of Odisha
over 11-months.Round II took place between March 2014 and February 2015 and again covered all
314 blocks.CCM-II is the largest ever state wide household survey covering 4,81,611 households
(with a 90.6% response rate) from all 314 blocks, spread across 30 districts of Odisha. The total
number of unique interviews is 5,21,227. The survey focused on rural areas (covering remote to peri-
urban areas) and urban centres were excluded. The method ensures proportionate representation
of remote and vulnerable households which may be missed in other surveys.
In addition to providing state, district, and sub-district level indicator estimates, CCM II will serve a
second purpose: to monitor and evaluate a number of community process interventions which are
being introduced to Odisha at varying levels of scale. These include state-wide training of frontline
1The first 1000 days from conception to the age of two has been highlighted as a critical window for intervention to significantly reduce child under nutrition (http://www.thousanddays.org)
Concurrent Monitoring II Survey Report
12 Technical and Management Support Team (TMST)
workers in inter-personal communication, and strengthening of GaonKalyanSamiti (GKS), Jaanch and
Mothers’ committees. One further large scale intervention being introduced by the Government of
Odisha in partnership with DFID is a Participatory Learning and Action (PLA) cycle to improve
HNWASH behaviours in 15 high burden districts. The intervention involves training a local woman to
facilitate women’s groups through four distinct phases:prioritization of local health problems, and
thedevelopment, implementation and evaluation of strategies to address those problems over a
cycle of 20 meetings.
Key findings from analysis of CCM-II data are summarised below, with coverage data following the
continuum of care frame work. Mortality data is highlighted separately. Detailed, disaggregated,
results are presented in the body of the report.
Service coverage and outcomes for adolescent girls
• 32.8% of births are to married women bellow 19 years.
• IFA coverage and consumption was low at state level. Less than one fifth of adolescent girls
received supplements (17.5%, 95%CI 17.1-17.9), and of these girls, just over half reported
consuming it (53.6%, 95%CI 52.7-54.5).
• A fairly high proportion of adolescent girls are still missing school due to menstruation. Although
four fifths (83%) adolescent girls reported being allowed to attend school while they were
menstruating, around 11-22.4% (depending on the socio-demographic group) are still
Concurrent Monitoring II Survey Report
13 Technical and Management Support Team (TMST)
missingthree or more days of school each month due to menstruation, and 10-17.8% missing 1-2
days monthly.
• The majority of schools attended by interviewed girls had separate male and female toilets
(80%) however other facilities supporting menstrual management were limited. Only half have
soap available (47.6%), two thirds of schools (62.9%) had facilities to dispose of menstrual
materials, and three quarters (76.6%) reported that schools provided adequate safety and
privacy to change a cloth.
• Knowledge of materials to manage menstruation was low, and socio-demographic gradients
existed in use of appropriate materials; nearly half (44.6%) of girls were aware that sanitary pads
could be used to manage menstruation, and just over half (58.2%) were aware that cloths could
be used. Nearly double the proportion of girls used sanitary pads in the high standard of living
(sli) group (66.1%) compared to low sli groups (34.5%). Only 15.1% (95%CI 14.7-15.5) of girls
were aware of the scheme to provide subsidized sanitary napkins via ASHAs.
Service coverage and outcomes for pregnant women
• ANC attendance has not changed much since recent years and shows room for improvement.
Nearly two thirds of women interviewed had three (63.7%, 95%CI 62.9-64.6) but less than half
had four ANC checks during their last pregnancy (42.7%, 95%CI41.9-43.6).
• The equity gap between women from different socio-demographic backgrounds receiving three
or more ANC checks has reduced compared to previous years, however significant disparities
persist; a significantly lower proportion of women from HBD, ST and SC groups, and lower sli
groups received three or four ANC checks compared to more advantaged groups.
• Coverage and consumption of at least 90 IFA tablets was extremely low and only 63.0% (95%CI
62.2-63.9) received tablets, and just 28.8% (95%CI 28.1-29.5) reported to consume them.
• Women’s reported knowledge of danger signs during pregnancy was extremely low at 1.7%
suggesting a lack of pregnancy related counseling and that the quality of ANC falls short for most
women.
• The majority (92.3%, 95%CI 91.9-92.7) of women received at least two TT injections during their
last pregnancy.
Service coverage and outcomes during delivery and postpartum period
• The state level prevalence of institutional delivery was high (82.1%, 95% CI 81.5-82.6), as was
skilled birth attendance rate (83.5%, 95%CI 83.0-84.0), which was largely driven by the high
uptake of institutional delivery.
Concurrent Monitoring II Survey Report
14 Technical and Management Support Team (TMST)
• The prevalence of women receiving postnatal checks within 24 hours of delivery was also high at
90.3% (95% CI 89.9-90.7).
• Impressive gains have been achieved in reducing the equity gap for access to maternity and
post-natal services. Nevertheless, inequitable access to maternity and post-natal services
remains apparent shown by lower coverage estimates for women from less advantaged socio-
economic groups, for example the prevalence of institutional delivery was 90.1% (95% CI 89.7-
90.6) in non-high burden districts, compared to 73.4% (95% CI 72.4-74.3) in high burden
districts, and the prevalence of women receiving postnatal check within 24 hours of delivery was
94.9% (94.5-95.2) in non-KBK districts, compared to79.6 (78.5-80.7) in KBK districts i.e. a
difference of 16.7% and 15.3% respectively.
• C-section rates have increased to 10.5% (95% CI 10.2-10.8) from 6.1 % (NFHS 3 2005-6) at state
level, which is within the accepted range for maternal neonatal health benefit at the population
level (WHO statement on caesarean section rates, April 2015). However C-section rates differed
hugely according to sli, at 7.5% (95% CI 7.2-7.7) in the lowest sli, compared to 23.1 (95% CI 21.8-
24.5) in the highest. This warrants further investigation to understand C-section trends in
different socio-economic groups and the implications for health care costs and outcomes.
Service coverage and outcomes for essential newborn care
• ENC practices immediately after birth appeared mixed. Around 80% of women reported that
bathing of the newborn was delayed until 6 hours after birth, and just 7.2% (95%CI 6.9-7.6)
reported that the newborn’s head was shaved at birth.
• Other care practices soon after birth were poor, and only a quarter of women reported
practicing kangaroo care (26.6%, 95% CI 26.0-27.2), 65.8% reported that the newborn was wiped
within 10 minutes of birth and less than half of women reported that their baby was wrapped
within 10 minutes of birth (42.5%, 95%CI 41.9-43.1). Only half of newborns were checked by an
ASHA, ANM or AWW within 30 days of delivery (52.7%, 95% CI 52.1-53.3).
• Reasons for these inadequate practices most likely include lack of knowledge, as for example,
women’s knowledge of danger signs for newborns (convulsions/spasms/ rigidity, breathing
problems, very small baby, lethargy/unconsciousness) was extremely low at 2.0% (95% CI 1.9-
2.2).
• Over two thirds of women (67.8%, 95% CI 66.5-69.0) reported that they had to pay for
inpatient/outpatients care for newborns referred within 30 days of delivery to government
health institutions, services that should be provided free of charge.
Concurrent Monitoring II Survey Report
15 Technical and Management Support Team (TMST)
Service coverage and outcomes for children under two
• IYCF practices remain far below the desired coverage level across all districts, except for
exclusive and continued breast feeding, and results indicate that knowledge has not translated
to practice.
• Exclusive breastfeeding of children up to 6 months of age was high at 82.3% (95% CI 81.8-82.8),
and >90% of women reported continued breastfeeding up to 1-2 years.
• Less than half of women (41.5%, 95% CI 41.2-41) reported timely initiation of breastfeeding
(feeding infants 0-23 months within 1 hour of birth). However this was in contrast to the fairly
high prevalence of children <2 years of age who were given colostrums (75.4% (95% CI 74.8-
75.9), and the fact that >90% of women knew that infants should be put to the breast within 1
hour of birth. Additionally >90% of women knew that infants should only be fed breast milk in
the first 6 months of a child’s life, and that infants should be fed colostrums.
• Complementary feeding practices were extremely poor. Only 1.9% (95% CI 1.8-2.0) of women
were aware that infants should be introduced to solid, semi-solid and soft foods from 6 months.
In line with this, almost half of children 6-8.99 months were not receiving complimentary foods
at the appropriate time (46.8%, 95% CI 46.0-47.6), and were reliant only on breast milk or other
liquids. Results were slightly lower for children in high burden districts than low burden districts
at 41.3% and 52.4% respectively, as well as for other disadvantaged groups.
• Dietary diversity was poor and only 15.5% (95% CI 15.1-15.9) of children 6-23.99 months
consumed at least 4 out of 7 food groups the previous day, which may be partly explained by the
fact that more than half of children 6-8.99 months did not receive any food the previous day.
• Similarly, a slightly lower proportion of children in HBDs consumed an adequately diverse diet
(13.1%) compared to children from NHBDs (17.5%).
• Minimum feeding frequency (being fed the age appropriate number of times the previous day
and taking breastfeeding status into account) was average at 65.5%, but is still far lower than is
ideal.
• Coverage of take home rations (THR) for children 6-23 months showed room for improvement at
72.0%. THRs are especially important in this context as dietary diversity and other
complementary feeding indicators are so low, suggesting that this ration forms an important
part of a child’s diet.
• Nearly one fifth of children under two were fed by a bottle the previous day (17.6% [95% CI
17.2-17.9]) increasing vulnerability to bacterial infection and disease if unclean water and
utensils are used to prepare the bottle.
Concurrent Monitoring II Survey Report
16 Technical and Management Support Team (TMST)
• Immunization coverage shows room for improvement as three quarters of children aged 12-
23.99 months were fully immunized (75.0%, 95%CI 74.1-75.9), meaning that around 25% of
children are not receiving adequate immunization and coverage does not appear to have
improved much since 2012/13 (AHS). Social gradients in coverage have narrowed such that 71%
of ST children are fully immunized.Continued effort in this regard can further close the equity
gap.
Service coverage and outcomes for children under five
• Despite concerted efforts to re-orientate nutrition programming to priority groups, this has yet
to translate into improved nutrition outcomes for children under 5.
• The nutritional status of children in this age group was poor, and appears to have changed little
since 2005/06, with a high burden across all districts, whilst also reflecting socio-economic
inequities.
• Nearly half of children were stunted (HAZ <-2) (47.5%, 95% CI 47.2-49.9), with higher levels
found in children from more disadvantaged groups. For example, 30.0% of children were stunted
in the high sli category, compared to 52.5% in low sli category, and 56.7% in ST social
group/caste, compared to 40.3% in the general, OBC, other category.
• Of concern, a quarter of children are suffering from Global Acute Malnutrition (WHZ<-2) (25.4%,
95% CI 2.2-25.7). This may be slightly higher than previous years; the prevalence of acute
malnutrition was 20.5% in 2005/06 (NFHS-3 rural), and 18.7% in 2013/14 (RSOC – urban and
rual) but no confidence intervals were available so we cannot confirm if these differences are
significant), and as the RSOC survey included results from urban areas, lower malnutrition rates
might be expected.Nevertheless, data from the recently released CAB2-AHS 2014 results support
these findings as 20.4% (18.7-21.8)of children under five were estimated to be acutely
malnourished.
• The strikingly similar anthropometric results provided by three independent data sources from
2014 (RSOC, CAB-AHS, and CCMII) strengthen the evidence highlighting the poor nutrition
situation in Odisha state and the need for appropriate and timely action.
• According to WHO thresholds for the prevalence of malnutrition in major emergencies, the
prevalence of stunting and wasting in rural Odisha are considered of ‘critical’ public health
significance (prevalence of wasting of≥15%, and stunting ≥40% are considered critical). Mortality
rates however are not exceptionally high.
2Clinical Anthropometric and Bio-chemical (CAB) – 2014.
Concurrent Monitoring II Survey Report
17 Technical and Management Support Team (TMST)
• Prevention and management of childhood diseases, which effect nutritional status, are
suboptimal. Around two-thirds (63.8%, 95%CI 63.3-64.3) of children 6-35 months of age had
received at least one Vitamin A dose since birth, and only half of children had received de-
worming medication (52.2%, 95%CI 51.7-52.7).
• At the state level, the most common cause of morbidity was ARI (58.8%, 95%CI 56.9-60.6),
although only 27% were formally diagnosed, and of these, only half received treatment (49.5%).
Encouragingly, the lowest cause of morbidity was diarrhoea (4.0%) as this can be an important
risk factor in the development of malnutrition.
• The prevalence of malaria was quite low as out of the 29% of children with fever who were
tested, 38.5% (95% CI 37.2-39.8) were formally diagnosed. However, children infected with
malaria parasites may be asymptomatic, so these findings may underestimate the prevalence.
Prevalence varied considerably by socio-demographic group, and children from more
disadvantaged groups were more likely to be diagnosed with malaria.
Service coverage and outcomes for water and sanitation
• Water, sanitation and hygiene (WASH) coverage, an important determinant of the health and
nutritional status, is low overall and shows a clear equity gradient.
• Household access to improved drinking water sources was fairly high (85.3%) although the
proportion of households with reliable access to improved drinking water was slightly
lower(63.3%).
• The majority of households did not store drinking water safely, and out of the 91.6% (95%CI
91.3-91.9) of households who stored drinking water, it was only considered safe storage in 5%
(95%CI 4.8-5.2), suggesting a lack of knowledge of what constitutes safe water storage, or
possibly lack of materials (e.g. covered water containers) to do so.
• 64.3% of households in the high sli category had improved latrines, compared to just 1.7% in the
low sli category, and 35.6% of households where the head had completed >10 years of
education had an improved latrine, compared to 4.2% where the household head had no
education.
• At state level, less than one fifth of households were using improved excreta disposal facilities
(14.4%, 95%CI 14.0-14.8) (a slight improvement from 2005/06 (NFHS-3) at 9.0%).
• Sanitation practices such as hand washing and disposal of children’s faeces were poor and
showed socio-demographic variation.
Concurrent Monitoring II Survey Report
18 Technical and Management Support Team (TMST)
• Less than one fifth ( 17.0%) of mothers of children under five reported washing their hands at all
five critical moments in a day and less than one tenth (7.4%) reported safe disposal of child
faeces, figures which were much higher among more advantage groups.
Service coverage and outcomes for Frontline Health Workers and empowerment
Frontline health workers
• Results highlighted high coverage of on the job training for FLWs, but that this translated to
limited knowledge on key health and nutrition. Although only half of AWWs had received
induction training (51.9%, 95%CI 50.5-53.2), the majority received on the job training (93.3%,
95%CI 92.5-93.9), and just over half receive training in 1000 days. However, <20% of FLWs had
sufficient knowledge in the key areas tested important for maternal, newborn and child health,
suggesting that more formal training might be beneficial, rather than just on the job training.
Knowledge of ANC and IYCF recommendations was higher however, ranging between 71.5% and
88.8% for the different knowledge areas checked.
• The high knowledge of IYCF practices by mothers mentioned previously suggests that some of
this information may be translating to women, however as mentioned, it has not yet resulted in
improved practices.
• All FLWs cited excessive workload as one of the top three constraints to carrying out their duties.
Lack of toilets and no electricity at AWCs, low salary, and delayed incentive payments were also
mentioned.
• Only 20.8% (95% CI 19.7-22.0) of AWCs and 48.9% (95% CI 46.0-51.8) of ANM sub centres had
improved sanitation facilities.
Empowerment of women
• Although women had some control over financial decision making, empowerment was generally
low. Around 81.0% of women had either total or joint control over the spending of their own
earnings, although only two thirds (63.9%) had a say in the spending of their husbands earnings.
Only half of women were involved in major household decisions (53.7%), compared to 62.4%
involved in minor decisions.
• The majority of women felt that they had little influence, and only 28.5% felt that they could
easily change things in their community. It is hope that the Shakti Vartaprogramme and CLS
(more indirectly) may make positive improvements here.
• Results indicate that a lack of confidence in the quality of health services were a significant
barrier to women accessing these services. The biggest barriers to accessing health services were
Concurrent Monitoring II Survey Report
19 Technical and Management Support Team (TMST)
reported as ‘concern that there may not be any provider’ (85.4%) and ‘concern that there may
be no drugs available’ (83.8%). Other barriers reported were ‘getting money needed for
treatment’ (50.4%) and ‘having to take transport’ (41.2%), collectively suggesting that further
investigation and efforts to improving the quality of health services may be warranted, so as to
encourage women to access necessary services.
Mortality - comparison of CCM II estimates with other data sources
• Encouragingly, mortality rates appear to be declining since the NFHS-3 was implemented in
2005/06 reflecting some improvements in the health, nutrition and WASH situation, although
care should be taken in making such comparisons due to the different survey methodologies
used, including different reference periods, and sometimes missing confidence intervals from
previous surveys.
• MMR was 169/100,000 live births, compared to 222 in 2011-13 (SRS) and 235 in 2010-12 (SRS),
however the confidence intervals overlap therefore these differences may not be significant,
limited by small sample sizes used in SRS.
• The U5MR, IMR, and NMR were 35.2, 29.6, and 21.7 deaths per 1000 live births, appear to have
reduced. However the NFHS-3 (2005/06) used a five to six year reference period of 2000-2006
compared to the one year reference period (2013) used in the CCM II survey.
• Two thirds of death of children under- five now occur in the first month of life, so new born care
is critical period to save lives.
• The gap between the U5MR reported for all children versus ST children appear to have
decreased between 2005/06 and CCMII (2014).
Concurrent Monitoring II Survey Report
20 Technical and Management Support Team (TMST)
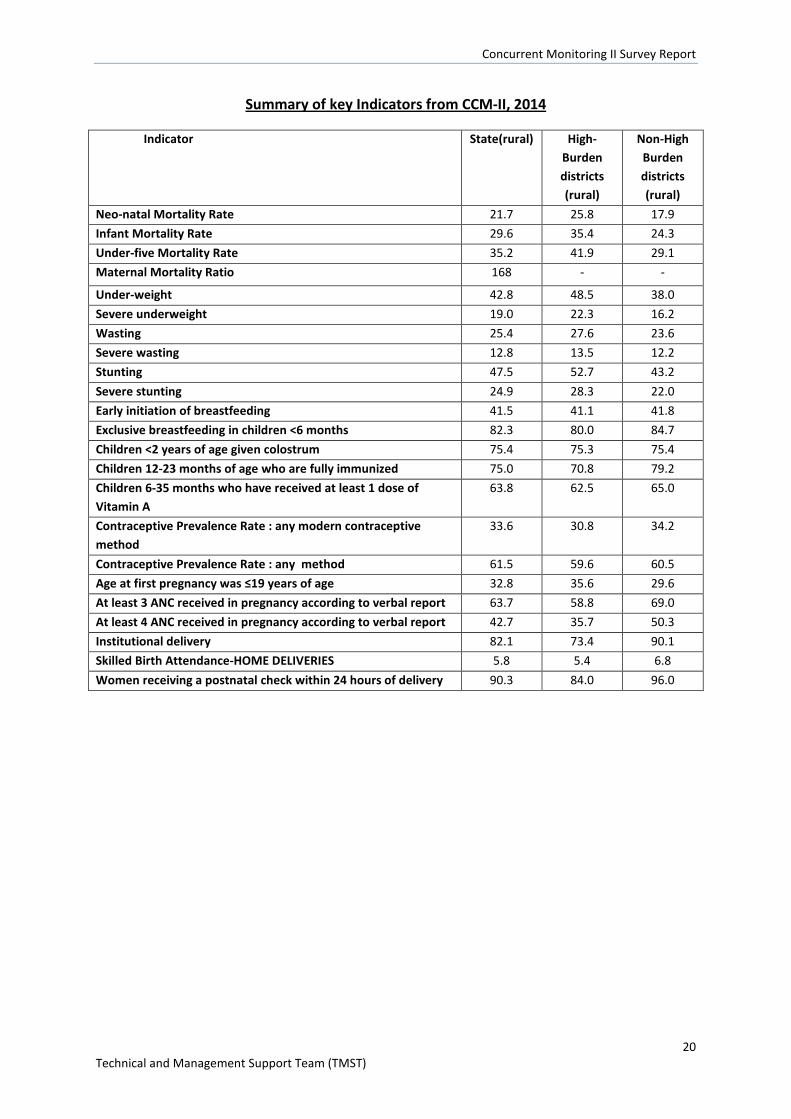
Summary of key Indicators from CCM-II, 2014
Indicator State(rural) High-Burden districts (rural)
Non-High Burden districts (rural)
Neo-natal Mortality Rate 21.7 25.8 17.9 Infant Mortality Rate 29.6 35.4 24.3 Under-five Mortality Rate 35.2 41.9 29.1 Maternal Mortality Ratio 168 - -
Under-weight 42.8 48.5 38.0 Severe underweight 19.0 22.3 16.2 Wasting 25.4 27.6 23.6 Severe wasting 12.8 13.5 12.2 Stunting 47.5 52.7 43.2 Severe stunting 24.9 28.3 22.0 Early initiation of breastfeeding 41.5 41.1 41.8 Exclusive breastfeeding in children <6 months 82.3 80.0 84.7 Children <2 years of age given colostrum 75.4 75.3 75.4 Children 12-23 months of age who are fully immunized 75.0 70.8 79.2 Children 6-35 months who have received at least 1 dose of Vitamin A
63.8 62.5 65.0
Contraceptive Prevalence Rate : any modern contraceptive method
33.6 30.8 34.2
Contraceptive Prevalence Rate : any method 61.5 59.6 60.5 Age at first pregnancy was ≤19 years of age 32.8 35.6 29.6 At least 3 ANC received in pregnancy according to verbal report 63.7 58.8 69.0 At least 4 ANC received in pregnancy according to verbal report 42.7 35.7 50.3 Institutional delivery 82.1 73.4 90.1 Skilled Birth Attendance-HOME DELIVERIES 5.8 5.4 6.8 Women receiving a postnatal check within 24 hours of delivery 90.3 84.0 96.0
Concurrent Monitoring II Survey Report
21 Technical and Management Support Team (TMST)
2. Background
2.1. Location and population characteristics
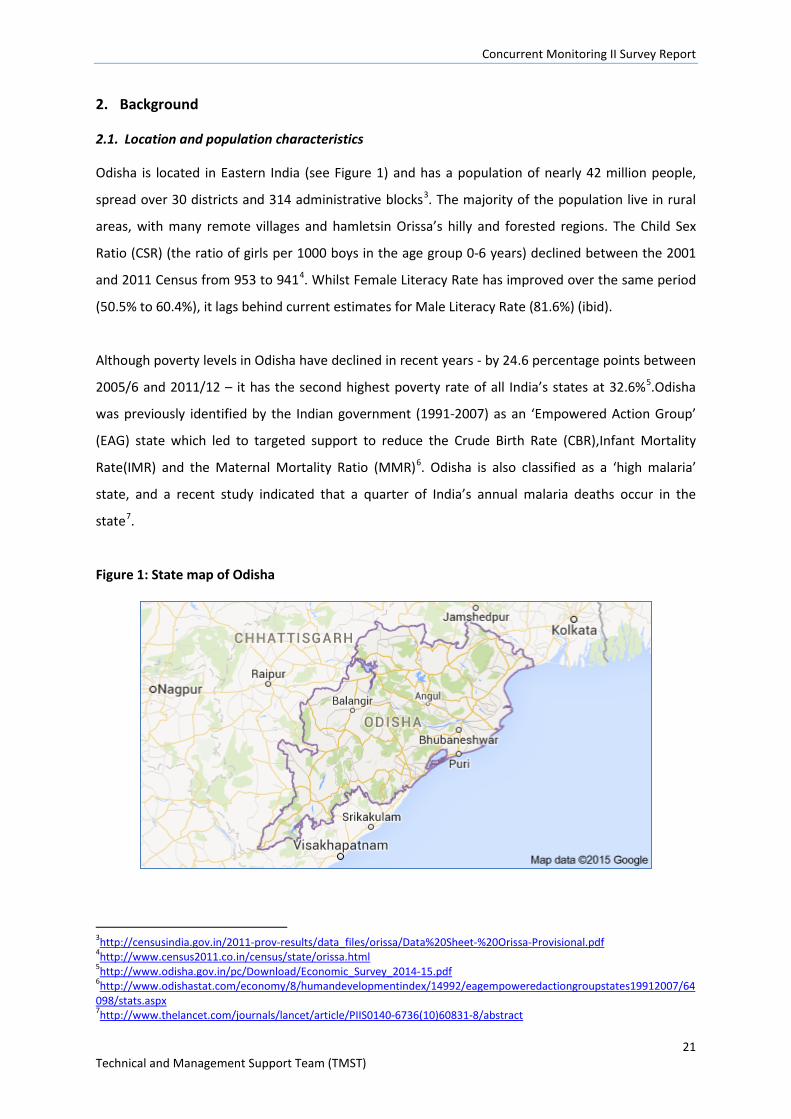
Odisha is located in Eastern India (see Figure 1) and has a population of nearly 42 million people,
spread over 30 districts and 314 administrative blocks3. The majority of the population live in rural
areas, with many remote villages and hamletsin Orissa’s hilly and forested regions. The Child Sex
Ratio (CSR) (the ratio of girls per 1000 boys in the age group 0-6 years) declined between the 2001
and 2011 Census from 953 to 9414. Whilst Female Literacy Rate has improved over the same period
(50.5% to 60.4%), it lags behind current estimates for Male Literacy Rate (81.6%) (ibid).
Although poverty levels in Odisha have declined in recent years - by 24.6 percentage points between
2005/6 and 2011/12 – it has the second highest poverty rate of all India’s states at 32.6%5.Odisha
was previously identified by the Indian government (1991-2007) as an ‘Empowered Action Group’
(EAG) state which led to targeted support to reduce the Crude Birth Rate (CBR),Infant Mortality
Rate(IMR) and the Maternal Mortality Ratio (MMR)6. Odisha is also classified as a ‘high malaria’
state, and a recent study indicated that a quarter of India’s annual malaria deaths occur in the
state7.
Figure 1: State map of Odisha
3http://censusindia.gov.in/2011-prov-results/data_files/orissa/Data%20Sheet-%20Orissa-Provisional.pdf 4http://www.census2011.co.in/census/state/orissa.html 5http://www.odisha.gov.in/pc/Download/Economic_Survey_2014-15.pdf 6http://www.odishastat.com/economy/8/humandevelopmentindex/14992/eagempoweredactiongroupstates19912007/64098/stats.aspx 7http://www.thelancet.com/journals/lancet/article/PIIS0140-6736(10)60831-8/abstract
Concurrent Monitoring II Survey Report
22 Technical and Management Support Team (TMST)
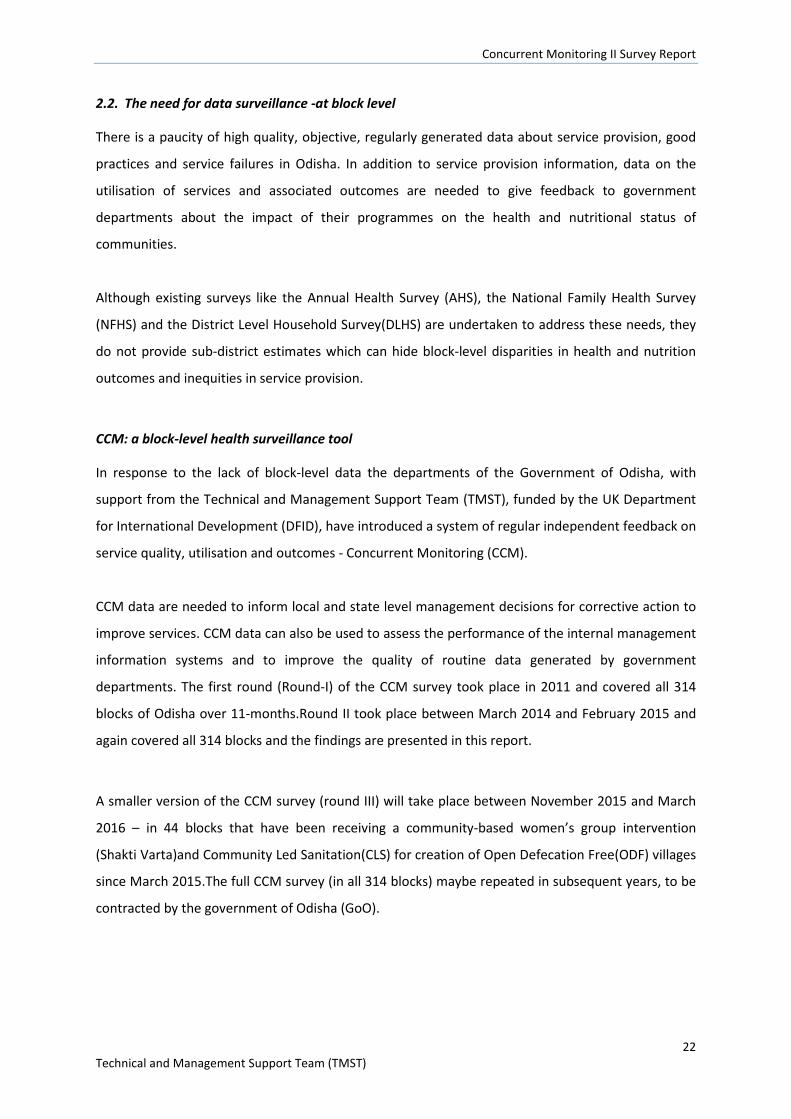
2.2. The need for data surveillance -at block level
There is a paucity of high quality, objective, regularly generated data about service provision, good
practices and service failures in Odisha. In addition to service provision information, data on the
utilisation of services and associated outcomes are needed to give feedback to government
departments about the impact of their programmes on the health and nutritional status of
communities.
Although existing surveys like the Annual Health Survey (AHS), the National Family Health Survey
(NFHS) and the District Level Household Survey(DLHS) are undertaken to address these needs, they
do not provide sub-district estimates which can hide block-level disparities in health and nutrition
outcomes and inequities in service provision.
CCM: a block-level health surveillance tool
In response to the lack of block-level data the departments of the Government of Odisha, with
support from the Technical and Management Support Team (TMST), funded by the UK Department
for International Development (DFID), have introduced a system of regular independent feedback on
service quality, utilisation and outcomes - Concurrent Monitoring (CCM).
CCM data are needed to inform local and state level management decisions for corrective action to
improve services. CCM data can also be used to assess the performance of the internal management
information systems and to improve the quality of routine data generated by government
departments. The first round (Round-I) of the CCM survey took place in 2011 and covered all 314
blocks of Odisha over 11-months.Round II took place between March 2014 and February 2015 and
again covered all 314 blocks and the findings are presented in this report.
A smaller version of the CCM survey (round III) will take place between November 2015 and March
2016 – in 44 blocks that have been receiving a community-based women’s group intervention
(Shakti Varta)and Community Led Sanitation(CLS) for creation of Open Defecation Free(ODF) villages
since March 2015.The full CCM survey (in all 314 blocks) maybe repeated in subsequent years, to be
contracted by the government of Odisha (GoO).
Concurrent Monitoring II Survey Report
23 Technical and Management Support Team (TMST)
CCM: a programme evaluation tool
As stated above, CCM surveys are able to provide estimates about service coverage and a range of
Health, Nutrition, Water and Sanitation (HNWASH) outcomes at block level. CCM II and III surveys
also provide an opportunity to evaluate two community process interventions being implemented in
Odisha: 1) Shakti Varta – a women’s group Participatory Learning and Action (PLA) cycle, and 2)
Community Led Sanitation (CLS). CCM II and III will also measure coverage of other programmes –
such as frontline worker training in 1000 days.
The original evaluation plan for Shakti Vartawas to cover 52 intervention blocks and 52 matched
control blocks to test the effectiveness of the intervention with a quasi-experimental study design.
The CCM II sample size was designed around this evaluation plan. Delays in the implementation of
the intervention since CCM II data were collected have led us to shift our evaluation efforts to the
first three districts that have been receiving Shakti Varta since March 2015; we do not have a control
group for this adapted design. We are also focusing on 7 CLS exposed blocks - again, implementation
delays mean that we have adapted our evaluation plan since CCM II was designed and carried out.
This report describes the methods and findings from CCM II, and focuses purely on HNWASH
estimates at block, district and state level rather than programme evaluation. A second report will
be available in 2016 using the combined data from CCM II and III to evaluate Shakti Varta and CLS
using the updated evaluation plans.
3. Structure of the report
The remainder of this report describes the CCM II methods (section 4) and the CCM II sample
characteristics (Section 5).
Subsequent results chapters are arranged thematically in the following order: mortality (section 6),
anthropometry and under nutrition programmes (section 7), family planning (section 8), pregnancy
(section 9), delivery and postnatal care (section 10), essential newborn care and infant and young
child feeding (section 11), prevention and management of childhood illness (section 12), hygiene
practices (section 13), water and sanitation (section 14), and women’s empowerment (section 15).
We then provide an example of CCM data at block level for a selection of indicators and using GIS
maps (section 16). Section 17 describes key findings from the Frontline Health Worker (FLW) survey.
Section 18 discusses the findings in relation to the maternal, newborn and child health continuum of
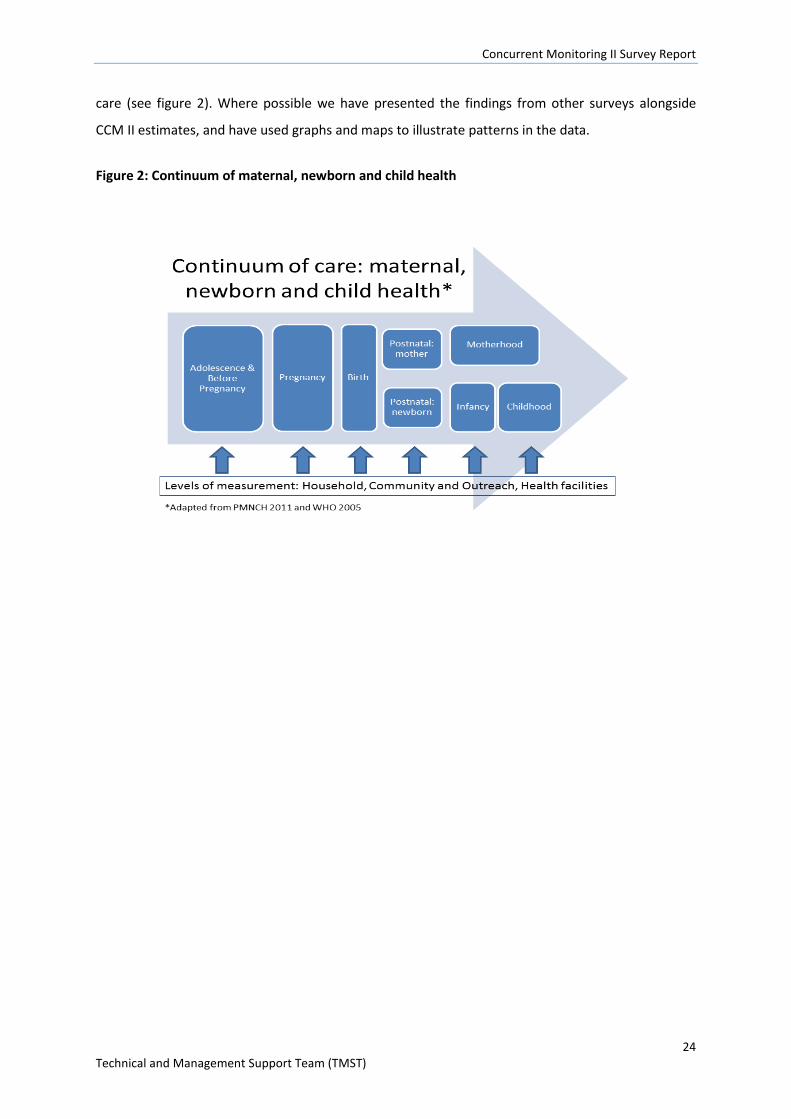
Concurrent Monitoring II Survey Report
24 Technical and Management Support Team (TMST)
care (see figure 2). Where possible we have presented the findings from other surveys alongside
CCM II estimates, and have used graphs and maps to illustrate patterns in the data.
Figure 2: Continuum of maternal, newborn and child health
Concurrent Monitoring II Survey Report
25 Technical and Management Support Team (TMST)
4. Methods
4.1. Survey location
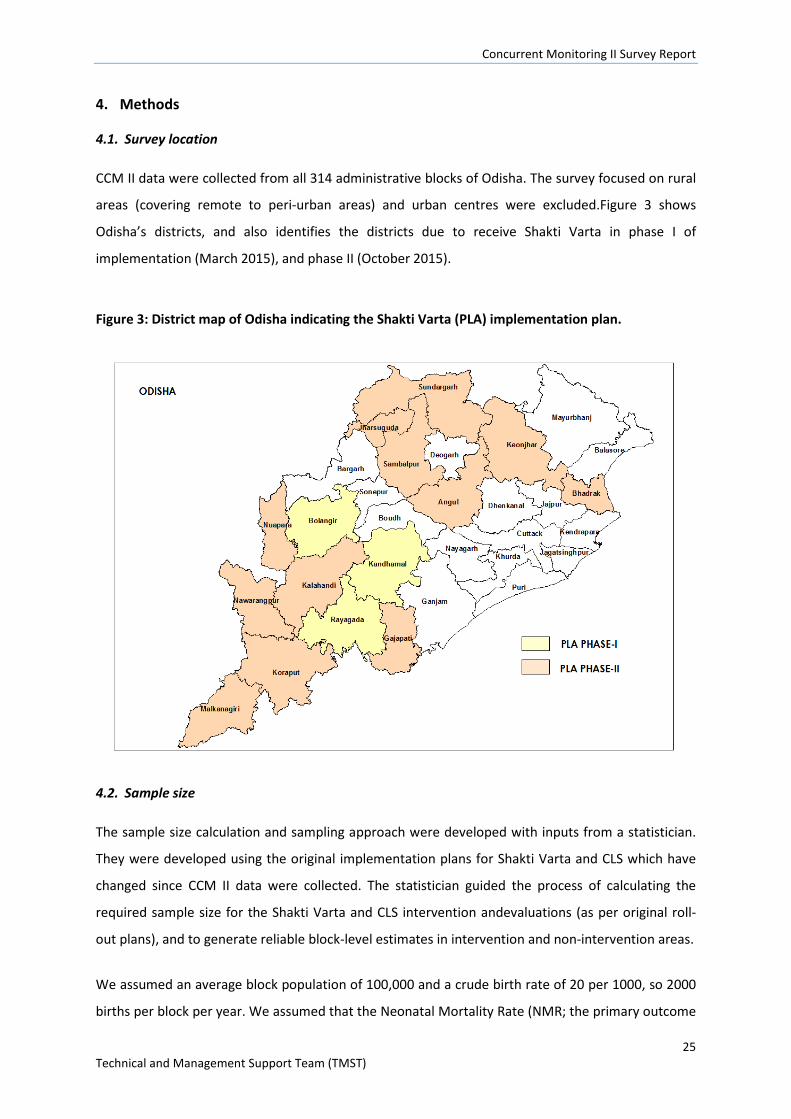
CCM II data were collected from all 314 administrative blocks of Odisha. The survey focused on rural
areas (covering remote to peri-urban areas) and urban centres were excluded.Figure 3 shows
Odisha’s districts, and also identifies the districts due to receive Shakti Varta in phase I of
implementation (March 2015), and phase II (October 2015).
Figure 3: District map of Odisha indicating the Shakti Varta (PLA) implementation plan.
4.2. Sample size
The sample size calculation and sampling approach were developed with inputs from a statistician.
They were developed using the original implementation plans for Shakti Varta and CLS which have
changed since CCM II data were collected. The statistician guided the process of calculating the
required sample size for the Shakti Varta and CLS intervention andevaluations (as per original roll-
out plans), and to generate reliable block-level estimates in intervention and non-intervention areas.
We assumed an average block population of 100,000 and a crude birth rate of 20 per 1000, so 2000
births per block per year. We assumed that the Neonatal Mortality Rate (NMR; the primary outcome
Concurrent Monitoring II Survey Report
26 Technical and Management Support Team (TMST)
of the Shakti Vartaintervention) would be measured from a one year recall period, resulting in
approximately 2000 relevant births for this outcome per block. Blocks typically have about 20 GPs,
and each GP about 8 villages.
Shakti Varta evaluation
We pre-specified 80% power to detect a difference in NMR between 30 and 25 per 1000, and equal
sampling of intervention and control blocks. The Effective Sample Size (ESS) required per arm was
thus 17190 and assuming design effect (DE) of 1.5 gave a sample size requirement of 25800 per arm,
roughly 500 births per block. A DE of 1.5 is reasonable based on GPs as the primary sampling units
(see later) and 50 births per PSUand a typical intra-cluster correlation of 0.01.
The sample size (number of blocks, villages per block) in Shakti Varta intervention and control areas
was based on detecting a 17% reduction in neonatal mortality from 30 per 1000 to 25 per 1000 with
80% power and 5% significance level.
CLS evaluation
The primary outcome of CLS is village-level ODF and is being measured through a separate
monitoring system in all CLS exposed villages. The secondary outcome for CLS is households with
improved sanitation facilities and is measured through CCM. We chose to enhance the sample size in
the CLS intervention blocks in line with the Shakti Vartaintervention blocks to ensure we could
detect a meaningful difference in proportions of households with improved sanitation facilities, if
the difference exists, post-intervention (see figure 4).
Non-intervention blocks
We wished to provide useful block level information concerning NMR and other outcomes to fit the
remit of CCM as a general HNWASH surveillance tool. Assuming an NMR of 30 per 1000 then a
sample size of 200 births per block would give a DE of 1.2 based on 20 births per PSU (i.e. GP) and so
an ESS of around 167. This gave an expected 95% confidence interval for NMR of 10-70 per 1000. At
this sample size the power to correctly rank two blocks where one has an NMR of 40 per 1000 and
the other 20 per 1000 is 86%.
The statistical precision obtained in the non- intervention blocks was lower (in line with the lower
sample size) compared to Shakti Varta and CLS intervention blocks.
Concurrent Monitoring II Survey Report
27 Technical and Management Support Team (TMST)
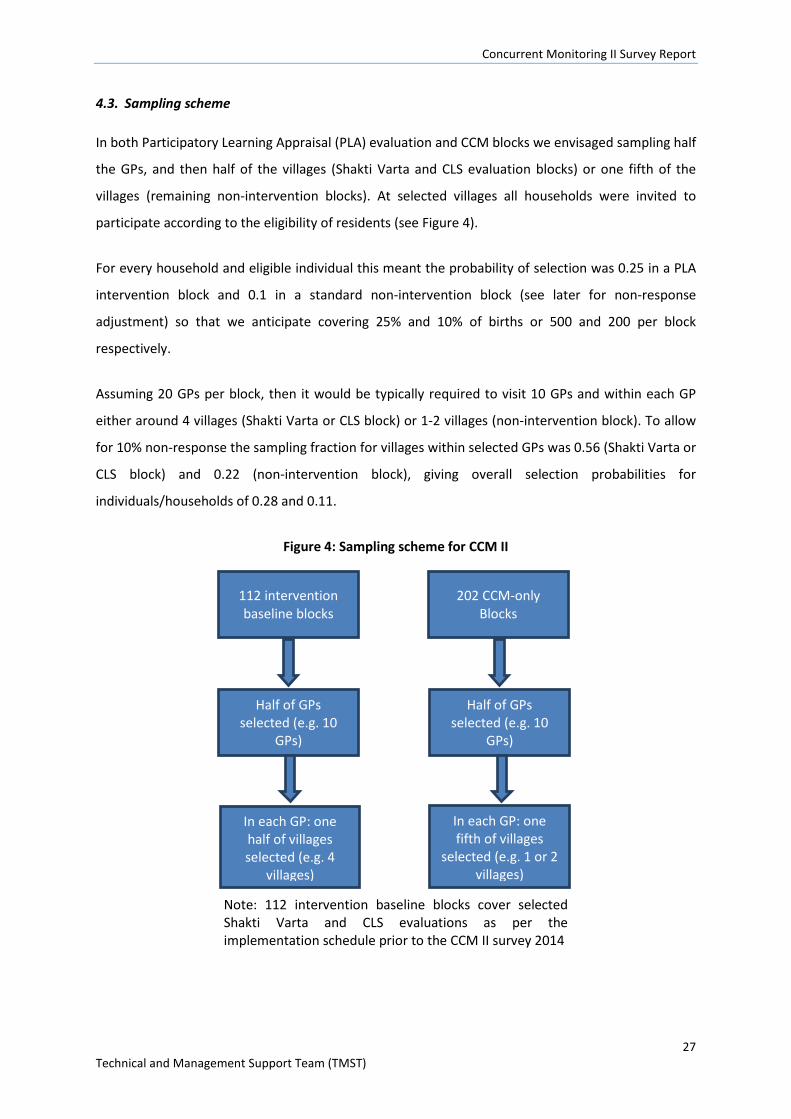
4.3. Sampling scheme
In both Participatory Learning Appraisal (PLA) evaluation and CCM blocks we envisaged sampling half
the GPs, and then half of the villages (Shakti Varta and CLS evaluation blocks) or one fifth of the
villages (remaining non-intervention blocks). At selected villages all households were invited to
participate according to the eligibility of residents (see Figure 4).
For every household and eligible individual this meant the probability of selection was 0.25 in a PLA
intervention block and 0.1 in a standard non-intervention block (see later for non-response
adjustment) so that we anticipate covering 25% and 10% of births or 500 and 200 per block
respectively.
Assuming 20 GPs per block, then it would be typically required to visit 10 GPs and within each GP
either around 4 villages (Shakti Varta or CLS block) or 1-2 villages (non-intervention block). To allow
for 10% non-response the sampling fraction for villages within selected GPs was 0.56 (Shakti Varta or
CLS block) and 0.22 (non-intervention block), giving overall selection probabilities for
individuals/households of 0.28 and 0.11.
Figure 4: Sampling scheme for CCM II
Note: 112 intervention baseline blocks cover selected Shakti Varta and CLS evaluations as per the implementation schedule prior to the CCM II survey 2014
112 intervention baseline blocks
202 CCM-only Blocks
Half of GPs selected (e.g. 10
GPs)
Half of GPs selected (e.g. 10
GPs)
In each GP: one half of villages selected (e.g. 4
villages)
In each GP: one fifth of villages
selected (e.g. 1 or 2 villages)
Concurrent Monitoring II Survey Report
28 Technical and Management Support Team (TMST)
Expected numbers with the CCM II sampling scheme
It was anticipated that in each Shakti Varta or CLS intervention block that around 500 women with
recent birth (in the reference period 1st January 2013-31st December 2013) would be identified and
interviewed, and 200 per non-intervention block, in total across all blocks 96400 women with a
recent birth. Some other target subgroups (e.g. pregnant women) were smaller, and others (e.g.
women with child under five years) were much e.g. up to 5 times bigger.To ensure the sample size
remained manageable, we restricted the number of adolescent girls (10-19 years) who were
interviewed to every third household with an adolescent girl.
Village-level CCM census
A list of villages to be visited was sampled from the Odisha Primary Census Abstract 2011 (excluding
uninhabited villages) independently by the statistician. In each selected village a detailed mapping
exercise took place in which all households spread across all the hamlets were identified and listed.
Frontline health workers and ward members (or village headmen or opinion leaders) were consulted
to confirm the initial mapping produced.
All listed households were then visited for an initial screening (a brief questionnaire taking
approximately five minutes) to identify residents in the subgroups of interest (see list of respondent
groups below). If any respondent groups were present, or it was a household where there had been
a death to a woman 15-49 or a child under-five in the reference period, then the household was
eligible for the survey, and the relevant interviews took place after appropriate consent procedures.
ALL people from ALL of the subgroups were invited to complete the relevant questionnaire, and
where a woman was a member of more than one subgroup then she completed ALL relevant
questionnaires. The only exception to this was in the case of adolescent girls where every third
household with an adolescent girl 10-19 was eligible for that component of the CCM survey.
If a woman from a subgroup of interest resided there, but was away from home at the time of visit,
then the interview team returned at a time suggested by other household other members to
attempt to obtain the interview. If there was no answer at a household, the interview team returned
at least three times before recording the household as a non-responder.
Sampling for FLW survey
The sampling for the FLW survey was linked to the sampling for thehousehold survey. In each
sampled village the interview team aimed to interview one Accredited Social Health Activist (ASHA)
Concurrent Monitoring II Survey Report
29 Technical and Management Support Team (TMST)
and one AnganWadiWorker (AWW). If there was more than one ASHA or Auxiliary Nurse Mid-wife
(ANM) in a village then they were randomly selected. In some instances, the FLW was also an eligible
household level respondent – in which case she was prioritised for the household interview and was
not included in the FLW survey.
The interview team also aimed to interview all of the ANMs linked to each sampled village. As each
ANM covers a larger catchment area than a single village there are fewer ANMs in the CCM II sample
compared to ASHAs or AWWs. Again, if an ANM was also eligible for the household survey she was
prioritised for the latter.
4.4. Respondent groups of interest
The following overlapping groups constitute our key respondents: - Currently pregnant women
- Women who gave birth in the reference period (1st January 2013-31st December 2013)
irrespective of the survival status of their child
- Mothers with living infant under 2 years
- Mother with living infants under 5 years
- Adolescent girls 10-19.
The following households were also eligible, even if there were no living respondent groups:
households where a woman 15-49 years or a child under-five years had died in the reference period
(1st January 2013-31st December 2013).
As stated previously, the separate FLW survey involved interviews with ASHAs, ANMs and AWWs.
4.5. CCM II questionnaire
We updated and expanded the CCM I household and frontline worker questionnaires for CCM II.
Indicators were selected based on: the DFID log frame, the CCM I survey, recent policy changes, and
outcomes expected to improve as a result of Shakti Varta (e.g. NMR and women’s
empowerment).From the indicator lists we developed survey questions. Where possible the wording
of indicators and corresponding questions matched existing surveys such as CCM I, the DLHS, NFHS
and AHS. We also drew upon questions that are being included in the NFHS-4 survey.
Field testing and ethical approval
The updated survey was field-tested in two phases: The first day of field-testing focused on relatively
new measures of women’s empowerment and WASH; the second round of field-testing involved
Concurrent Monitoring II Survey Report
30 Technical and Management Support Team (TMST)
piloting both surveys in their entirety.The household survey took between 30-95 minutes to
administer, depending on the number of sections the respondent was eligible for; the FLW
questionnaire took approximately 45 minutes.
Both questionnaires were translated into Odiya language. The Odiya questionnaires were again
back-translated to English to check whether the translated questionnaires retained the exact
question meanings. The questionnaires and monitoring and evaluation plans received ethical
approval from the Indian Institute of Public Health on the 25th June 2013.Questionnaire overviews
are provided in Tables 1 and 2.
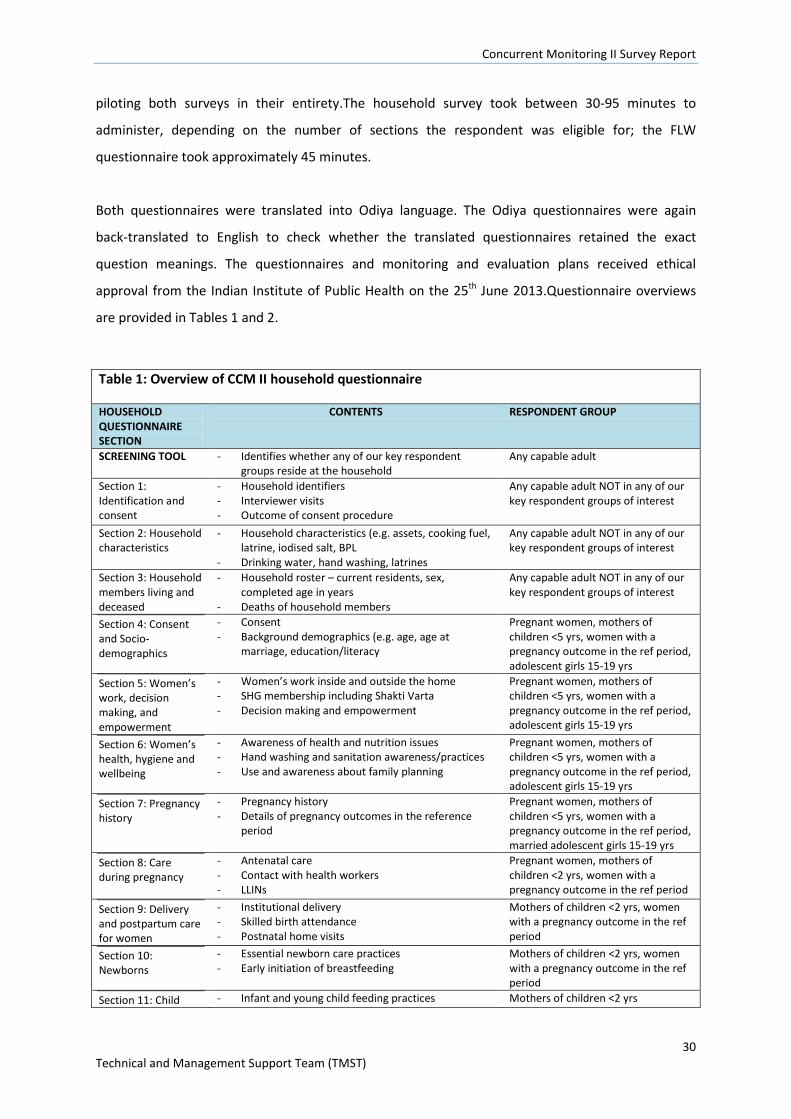
Table 1: Overview of CCM II household questionnaire
HOUSEHOLD QUESTIONNAIRE SECTION
CONTENTS RESPONDENT GROUP
SCREENING TOOL - Identifies whether any of our key respondent groups reside at the household
Any capable adult
Section 1: Identification and consent
- Household identifiers - Interviewer visits - Outcome of consent procedure
Any capable adult NOT in any of our key respondent groups of interest
Section 2: Household characteristics
- Household characteristics (e.g. assets, cooking fuel, latrine, iodised salt, BPL
- Drinking water, hand washing, latrines
Any capable adult NOT in any of our key respondent groups of interest
Section 3: Household members living and deceased
- Household roster – current residents, sex, completed age in years
- Deaths of household members
Any capable adult NOT in any of our key respondent groups of interest
Section 4: Consent and Socio-demographics
- Consent - Background demographics (e.g. age, age at
marriage, education/literacy
Pregnant women, mothers of children <5 yrs, women with a pregnancy outcome in the ref period, adolescent girls 15-19 yrs
Section 5: Women’s work, decision making, and empowerment
- Women’s work inside and outside the home - SHG membership including Shakti Varta - Decision making and empowerment
Pregnant women, mothers of children <5 yrs, women with a pregnancy outcome in the ref period, adolescent girls 15-19 yrs
Section 6: Women’s health, hygiene and wellbeing
- Awareness of health and nutrition issues - Hand washing and sanitation awareness/practices - Use and awareness about family planning
Pregnant women, mothers of children <5 yrs, women with a pregnancy outcome in the ref period, adolescent girls 15-19 yrs
Section 7: Pregnancy history
- Pregnancy history - Details of pregnancy outcomes in the reference
period
Pregnant women, mothers of children <5 yrs, women with a pregnancy outcome in the ref period, married adolescent girls 15-19 yrs
Section 8: Care during pregnancy
- Antenatal care - Contact with health workers - LLINs
Pregnant women, mothers of children <2 yrs, women with a pregnancy outcome in the ref period
Section 9: Delivery and postpartum care for women
- Institutional delivery - Skilled birth attendance - Postnatal home visits
Mothers of children <2 yrs, women with a pregnancy outcome in the ref period
Section 10: Newborns
- Essential newborn care practices - Early initiation of breastfeeding
Mothers of children <2 yrs, women with a pregnancy outcome in the ref period
Section 11: Child - Infant and young child feeding practices Mothers of children <2 yrs
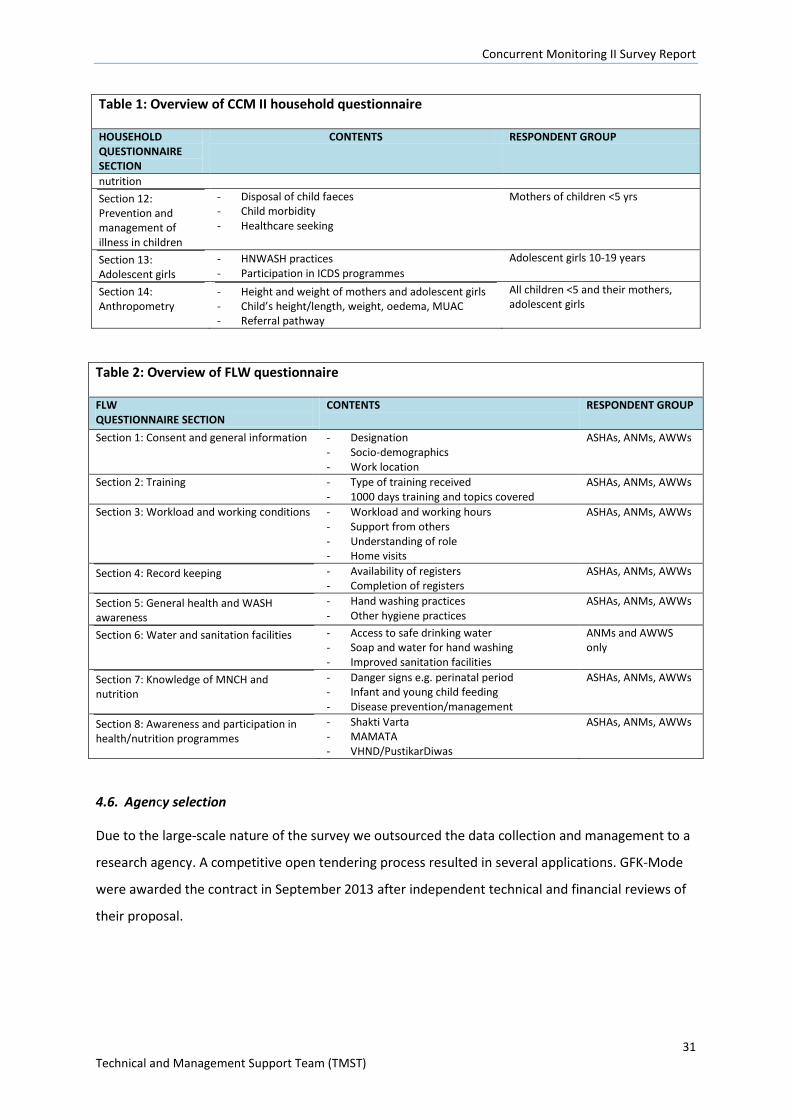
Concurrent Monitoring II Survey Report
31 Technical and Management Support Team (TMST)
Table 1: Overview of CCM II household questionnaire
HOUSEHOLD QUESTIONNAIRE SECTION
CONTENTS RESPONDENT GROUP
nutrition Section 12: Prevention and management of illness in children
- Disposal of child faeces - Child morbidity - Healthcare seeking
Mothers of children <5 yrs
Section 13: Adolescent girls
- HNWASH practices - Participation in ICDS programmes
Adolescent girls 10-19 years
Section 14: Anthropometry
- Height and weight of mothers and adolescent girls - Child’s height/length, weight, oedema, MUAC - Referral pathway
All children <5 and their mothers, adolescent girls
Table 2: Overview of FLW questionnaire
FLW QUESTIONNAIRE SECTION
CONTENTS RESPONDENT GROUP
Section 1: Consent and general information
- Designation - Socio-demographics - Work location
ASHAs, ANMs, AWWs
Section 2: Training - Type of training received - 1000 days training and topics covered
ASHAs, ANMs, AWWs
Section 3: Workload and working conditions - Workload and working hours - Support from others - Understanding of role - Home visits
ASHAs, ANMs, AWWs
Section 4: Record keeping - Availability of registers - Completion of registers
ASHAs, ANMs, AWWs
Section 5: General health and WASH awareness
- Hand washing practices - Other hygiene practices
ASHAs, ANMs, AWWs
Section 6: Water and sanitation facilities - Access to safe drinking water - Soap and water for hand washing - Improved sanitation facilities
ANMs and AWWS only
Section 7: Knowledge of MNCH and nutrition
- Danger signs e.g. perinatal period - Infant and young child feeding - Disease prevention/management
ASHAs, ANMs, AWWs
Section 8: Awareness and participation in health/nutrition programmes
- Shakti Varta - MAMATA - VHND/PustikarDiwas
ASHAs, ANMs, AWWs
4.6. Agency selection
Due to the large-scale nature of the survey we outsourced the data collection and management to a
research agency. A competitive open tendering process resulted in several applications. GFK-Mode
were awarded the contract in September 2013 after independent technical and financial reviews of
their proposal.
Concurrent Monitoring II Survey Report
32 Technical and Management Support Team (TMST)
4.7. Training of data collectors
Training manuals
Training manuals were developedand revised during the training of trainers (TOT) before the main
training of investigators and supervisors. The manuals provided explanatory text to accompany
questionnaire sections, and information about the coding and skip patterns. Guidance to ensure
accurate assessment of child age was also included in the manual, along with a tool to convert Odiya
years to the Gregorian calendar. The manuals gave details about field protocols and the use of
equipment (Computer Assisted Personal Interview devices/CAPIs and equipment for anthropometry
measurement). The manualswere translated to Odiya to ensure the investigators and supervisors
understood the instructions.
Training of Trainers
The agency conducted a 5 day training of trainers (TOT) session in advance of the investigator and
supervisor trainings. EightOdiya speaking people were trained as master trainers at the TOT. They
each had 6-10 years of experience working on large scale household surveys and were considered
capable of training the large pool of investigators and supervisors.
The training included gaining discussions to ensure master trainers had an in-depth understanding of
the questionnaire, use of the CAPI for data collection, and field protocols. There was a special
session on the measurement of anthropometry, during which the SMART method of standardising
measurements was practised, with the help of local mothers and children who attended the training.
Training of investigators and supervisors 850 investigators and supervisors were trained in17 groups (50 per group). Each training session was
delivered over 6 days by two master trainers, one IT trainer and one a quality assurance person. The
first training session was also attended by 20 district coordinators and TMST staff.
Training included classroom training to go over each survey question, mock interviews in classroom
including the use of CAPIs, dos and don’ts for interviewers, field protocols, visiting the field to
practice administering the questionnaires,and specialist training in anthropometric measurement in
accordance with the SMART training methodology8.
10 individuals within each batch of 50 participants were selected as supervisors, based on
experience and aptitude. Supervisors were given special training on assessing CAPI data completed
8http://smartmethodology.org/
Concurrent Monitoring II Survey Report
33 Technical and Management Support Team (TMST)
by investigators and on the roles of supervisors prior to data collection. Investigators werere-
briefedon their role once they reached the districts for data collection to refresh them on critical
issues.
4.8. Survey equipment
Computer Assisted Personal Interviewers (CAPIs)
Each investigator was given a CAPI tabletprogrammed with a bilingual(English and Odiya)version of
the questionnaire. The data collected through the CAPIs was directly uploaded to the server. TMST
had access to the raw data via the server and were able to conduct data quality checks.
Anthropometric measurement
Each survey team were provided with:
- Leicester height measures (measuring to the nearest 1mm)
- Infantometers (measuring to the nearest 1mm)
- Digital weighing scales (measuring to the nearest 100g)
- UNICEF colour banded measurement tapes (measuring to the nearest 1mm).
4.9. Data collection
The data collection period took place between March 2014 and February 2015. Blocks were visited
in a priority order to ensure the baseline data for CLS and Shakti Vartainterventions were collected
before implementation began. As such, the data were collected in four phases: 1) CLS
interventionblocks 2) Shakti Vartaintervention blocks 3) Other blocks receiving Shakti Varta 4) all
remaining blocks.
Data collection teams were comprised of two mappers and listers who also assisted with
anthropometric measurement, 4-5 female investigators, and one supervisor. GPS was recorded
twice within each village during data collection to enable monitoring of the location of field teams.
Before the survey began, supervisors, mappers and listers sought the help of ward members to
identify the boundaries of villages selected for CCM II, including hidden hamlets, and to draw up
village maps. All households were listed and assigned a unique household ID number, written in
white chalk on the house. The five minute screening tool was conducted to identify eligible
households; the team returned to empty households at least three times to attempt the screening
exercise before recording the household as a non-responder.
Concurrent Monitoring II Survey Report
34 Technical and Management Support Team (TMST)
Investigators were given lists of consenting households to visit each day and conducted the
interviews, including assisting with anthropometric measurement.All respondents were given
information about the survey and provided voluntary informed consent prior to interview. Girls 10-
14 years of age were interviewed in the presence of a suitable adult from the household. Children
identified as undernourished in the survey (through oedema or MUAC) were referred to the AWW.
Data were uploaded to password protected servers by supervisors at the end of each day.
4.10. Quality assurance consultants
Whilst the data collection agency had internal data quality assurance protocols in place, we felt that
additional independent monitoring was crucial given the scale and value of the survey. We recruited
10 quality assurance consultants and one Senior Quality Assurance Consultant whose main purpose
was to provide an independent appraisal of the quality of investigator data collection and to
feedback their findings to TMST. QA consultants also attended the training of data collectors to gain
a deeper understanding of the expectations of the different cadres of field staff.
QA consultants assessed sampling errors by establishing whether the agency was collecting data in
the specific villages we sampled for them to visit. Non-sampling errors were assessed in a number of
ways including: whether supervisors and interviewers were adhering to agreed team structures;
whether data collection protocols were being followed; village maps were appropriate and included
hidden hamlets; survey responses were consistent during back-checks; whether all the necessary
equipment was available and functional for use by the field teams.
A simple checklist was used to record the outcomes of the field assessments which were submitted
weekly to the senior QA consultant in Bhubaneswar. The senior QA consultant met with the TMST
point person regularly for discussion of QA issues, and fed back to the data collection agency as
appropriate.
4.11. Data management
Raw data were uploaded directly into an FTP server hosted by the data collection agency, but
accessible by the TMST team. The data collection agency wasresponsible for the majority of data
cleaning and converting the csv file to SPSS format.
Concurrent Monitoring II Survey Report
35 Technical and Management Support Team (TMST)
4.12. Data preparation and analysis
TMST created the majority of CCM II indicators in SPSS; the anthropometric z-scores were created in
ENA for SMART software9.
Data cleaning and exclusions
Some data cleaning and data exclusions were still necessary during this process. The majority of data
exclusions were due to missing data on child age and sex, which precludes the calculation of
anthropometric z-scores and created uncertainty over the appropriateness of the ‘children under-
five’ denominator for other estimates (such as neonatal, infant and child mortality).
Data cleaning was necessary in the case of implausible anthropometric measurements. The following
cleaning thresholds were applied:
- MUAC10: Plausible/extreme thresholds recommended in the literature are 85mm-200mm
- Child weight-for-age/WAZ, height-for-age/HAZ and weight-for-height/WAZ Z-scores11: There are
at least five possible methods for excluding z-scores, including fixed approaches (minimum and
maximum z-scores are pre-specified according to the WHO growth standard) and flexible
approaches (minimum and maximum z-scores are identified using the observed mean, rather
than the reference group mean). Flexible approaches are recommended for mean values<-1.5;
two out of three of our means were <-1.5 (HAZ = -1.58, WAZ = -1.7); although WHZ was -1.2, for
consistency we applied flexible cleaning criteria.
- Body Mass Index of mothers of children under-five12. Although no widely applicable single
definition of what constitutes an implausible value exists, the following criteria from previous
publications on the DHS dataset were used, excluding extreme values:
o for height (<100 cm or >200 cm)
o and/or weight (<25 kg or >200 kg).
Weighting and clustering using complex surveys analysis
When the indicators had been created in SPSS they were transferred into STATA (to enable support
from a statistician). Block weights were calculated to account for the differential sampling of villages
within GPs (e.g. 50% of villages’ vs 20% of villages). The block weights ensured that blocks with fewer
9http://smartmethodology.org/survey-planning-tools/smart-emergency-nutrition-assessment/ 10 www.cmamforum.org/resource/821en-net.org/question/233.aspx 11http://www.ncbi.nlm.nih.gov/pmc/articles/PMC4034601/ 12 http://journals.plos.org/plosmedicine/article?id=10.1371/journal.pmed.1001367
Concurrent Monitoring II Survey Report
36 Technical and Management Support Team (TMST)
villages sampled were not underrepresented in district and state level estimates, and that blocks
with a larger number of villages sampled were not over-represented.
The block weights and clustering of outcomes within villages were accounted for using complex
surveys analysis in STATA using the svyset command. Data were disaggregated in the following ways
for the individual level data: state, district, high burden and non-high burden districts, social
group/caste, KBK/non KBK districts, female literacy, standard of living index. For child-level data we
also disaggregated indicators by sex. Household level data were similarly disaggregated except
instead of female literacy we used occupation of the household head.
95% confidence intervals
Confidence intervals are an essential part of every survey estimate (it is conventional to provide 95%
confidence intervals (95%CIs)) but they are often omitted in data reports and discussion. 95%CIs
provide the lower and upper limits that we can be 95% confident that the true population value lies
within, and are thus essential to our interpretation of survey results.
Very narrow 95% CIs indicate a very precise estimate whilst very wide 95% CIs indicate low precision
of the estimate and a wide range of possible values that could be the ‘true population value’ – in the
latter case we should be wary about quoting the estimate on its own as an accurate representation
of an indicator.
95% CIs are a function of the sample size for a given indicator, the mean or proportion, and the
standard deviation. There is a separate spreadsheet of CCM II indicators that include 95% CIs, which
tend to very narrow at state and district level given the large sample sizes, but become wider at
block level and for rarer indicators with a small sample size.
Complex surveys analysis for categorical indicators (such as the % of children sleeping under a
mosquito net the previous night) and continuous indicators (such as mean height-for-age Z-score)
produced weighted confidence intervals around each estimate, when the svyset command was
used. Mortality rates were a special case (they are neither continuous nor categorical variables) so
for those indicators we used poisson regression models to generate weighted confidence intervals.
4.13. GIS maps
Key district and block level indicators were shared with the data collection agency who were
responsible for creating GIS maps. The GIS maps were constructed by linking the indicator values to
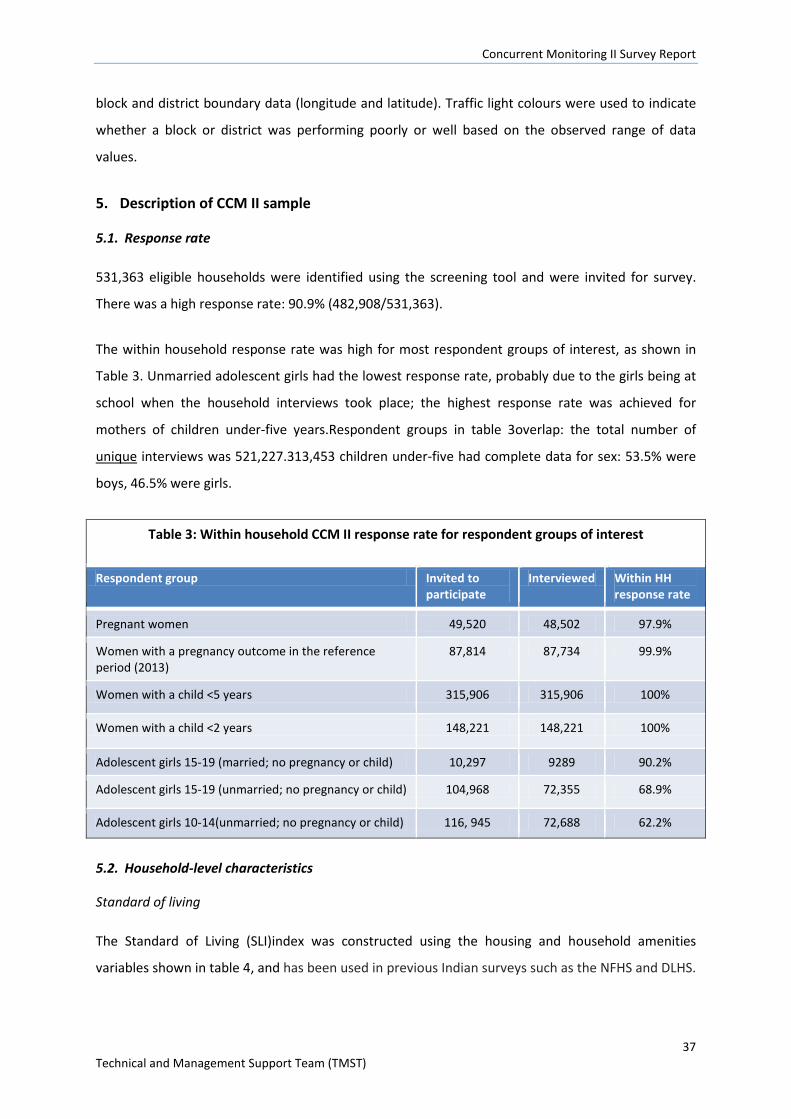
Concurrent Monitoring II Survey Report
37 Technical and Management Support Team (TMST)
block and district boundary data (longitude and latitude). Traffic light colours were used to indicate
whether a block or district was performing poorly or well based on the observed range of data
values.
5. Description of CCM II sample
5.1. Response rate
531,363 eligible households were identified using the screening tool and were invited for survey.
There was a high response rate: 90.9% (482,908/531,363).
The within household response rate was high for most respondent groups of interest, as shown in
Table 3. Unmarried adolescent girls had the lowest response rate, probably due to the girls being at
school when the household interviews took place; the highest response rate was achieved for
mothers of children under-five years.Respondent groups in table 3overlap: the total number of
unique interviews was 521,227.313,453 children under-five had complete data for sex: 53.5% were
boys, 46.5% were girls.
Table 3: Within household CCM II response rate for respondent groups of interest
Respondent group Invited to participate
Interviewed Within HH response rate
Pregnant women 49,520 48,502 97.9%
Women with a pregnancy outcome in the reference period (2013)
87,814 87,734 99.9%
Women with a child <5 years 315,906 315,906 100%
Women with a child <2 years 148,221 148,221 100%
Adolescent girls 15-19 (married; no pregnancy or child) 10,297 9289 90.2%
Adolescent girls 15-19 (unmarried; no pregnancy or child) 104,968 72,355 68.9%
Adolescent girls 10-14(unmarried; no pregnancy or child) 116, 945 72,688 62.2%
5.2. Household-level characteristics
Standard of living
The Standard of Living (SLI)index was constructed using the housing and household amenities
variables shown in table 4, and has been used in previous Indian surveys such as the NFHS and DLHS.
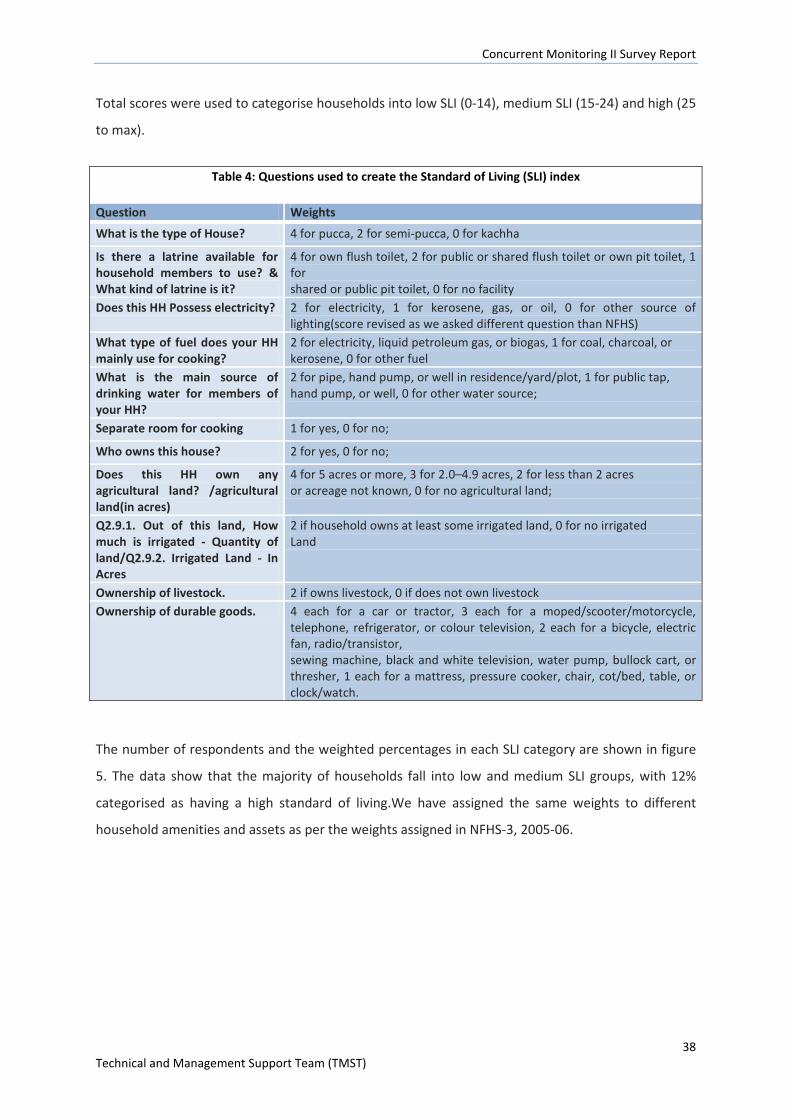
Concurrent Monitoring II Survey Report
38 Technical and Management Support Team (TMST)
Total scores were used to categorise households into low SLI (0-14), medium SLI (15-24) and high (25
to max).
Table 4: Questions used to create the Standard of Living (SLI) index
Question Weights
What is the type of House? 4 for pucca, 2 for semi-pucca, 0 for kachha
Is there a latrine available for household members to use? & What kind of latrine is it?
4 for own flush toilet, 2 for public or shared flush toilet or own pit toilet, 1 for shared or public pit toilet, 0 for no facility
Does this HH Possess electricity? 2 for electricity, 1 for kerosene, gas, or oil, 0 for other source of lighting(score revised as we asked different question than NFHS)
What type of fuel does your HH mainly use for cooking?
2 for electricity, liquid petroleum gas, or biogas, 1 for coal, charcoal, or kerosene, 0 for other fuel
What is the main source of drinking water for members of your HH?
2 for pipe, hand pump, or well in residence/yard/plot, 1 for public tap, hand pump, or well, 0 for other water source;
Separate room for cooking 1 for yes, 0 for no;
Who owns this house? 2 for yes, 0 for no;
Does this HH own any agricultural land? /agricultural land(in acres)
4 for 5 acres or more, 3 for 2.0–4.9 acres, 2 for less than 2 acres or acreage not known, 0 for no agricultural land;
Q2.9.1. Out of this land, How much is irrigated - Quantity of land/Q2.9.2. Irrigated Land - In Acres
2 if household owns at least some irrigated land, 0 for no irrigated Land
Ownership of livestock. 2 if owns livestock, 0 if does not own livestock Ownership of durable goods. 4 each for a car or tractor, 3 each for a moped/scooter/motorcycle,
telephone, refrigerator, or colour television, 2 each for a bicycle, electric fan, radio/transistor, sewing machine, black and white television, water pump, bullock cart, or thresher, 1 each for a mattress, pressure cooker, chair, cot/bed, table, or clock/watch.
The number of respondents and the weighted percentages in each SLI category are shown in figure
5. The data show that the majority of households fall into low and medium SLI groups, with 12%
categorised as having a high standard of living.We have assigned the same weights to different
household amenities and assets as per the weights assigned in NFHS-3, 2005-06.
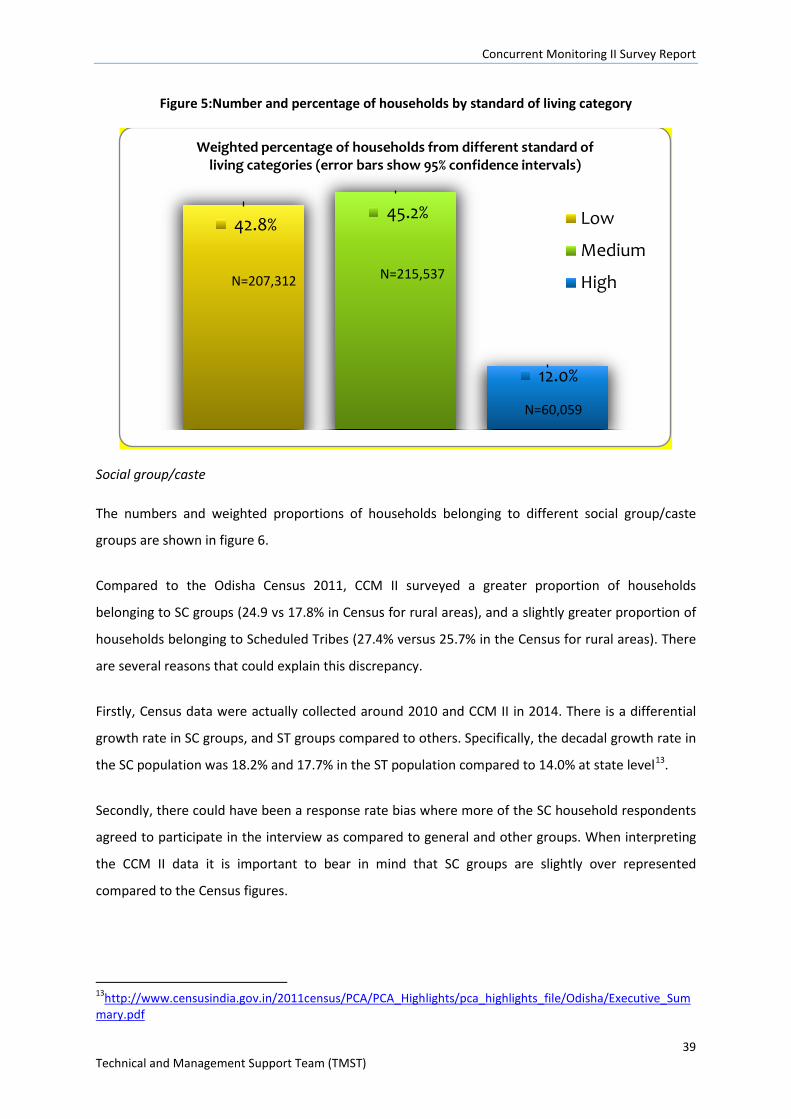
Concurrent Monitoring II Survey Report
39 Technical and Management Support Team (TMST)
Figure 5:Number and percentage of households by standard of living category
Social group/caste
The numbers and weighted proportions of households belonging to different social group/caste
groups are shown in figure 6.
Compared to the Odisha Census 2011, CCM II surveyed a greater proportion of households
belonging to SC groups (24.9 vs 17.8% in Census for rural areas), and a slightly greater proportion of
households belonging to Scheduled Tribes (27.4% versus 25.7% in the Census for rural areas). There
are several reasons that could explain this discrepancy.
Firstly, Census data were actually collected around 2010 and CCM II in 2014. There is a differential
growth rate in SC groups, and ST groups compared to others. Specifically, the decadal growth rate in
the SC population was 18.2% and 17.7% in the ST population compared to 14.0% at state level13.
Secondly, there could have been a response rate bias where more of the SC household respondents
agreed to participate in the interview as compared to general and other groups. When interpreting
the CCM II data it is important to bear in mind that SC groups are slightly over represented
compared to the Census figures.
13http://www.censusindia.gov.in/2011census/PCA/PCA_Highlights/pca_highlights_file/Odisha/Executive_Summary.pdf
42.8% 45.2%
12.0%
Weighted percentage of households from different standard of living categories (error bars show 95% confidence intervals)
Low
Medium
HighN=207,312 N=215,537
N=60,059
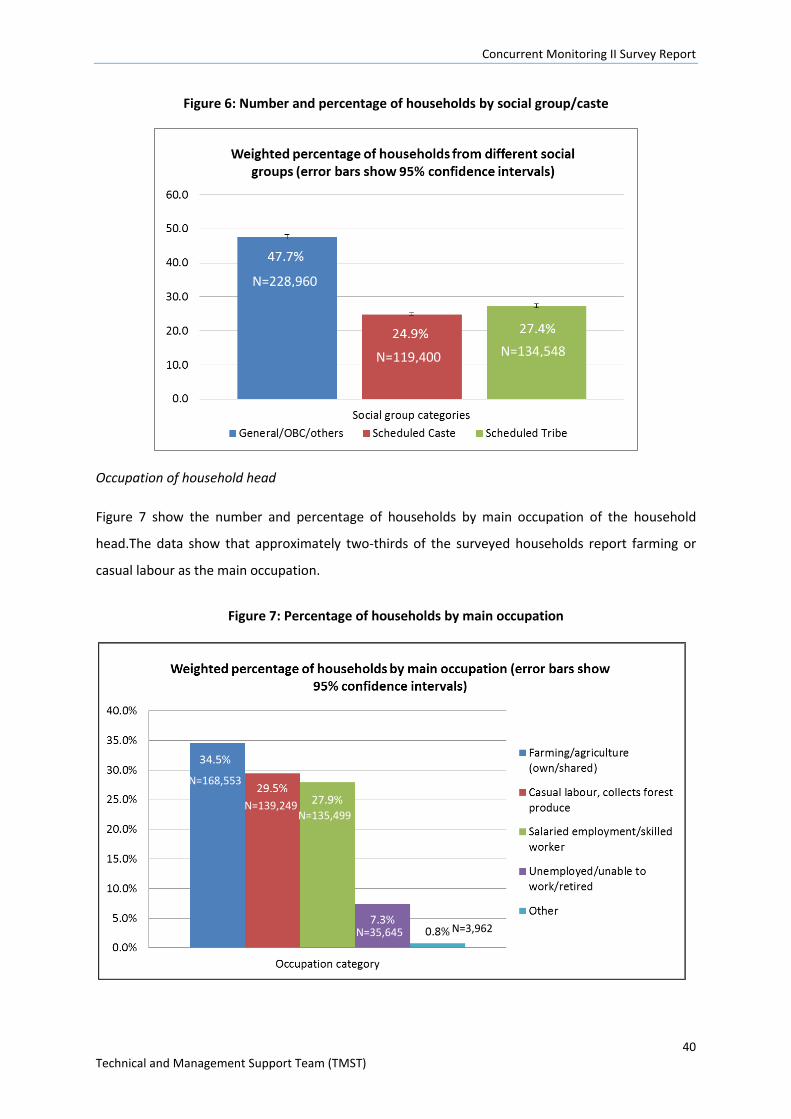
Concurrent Monitoring II Survey Report
40 Technical and Management Support Team (TMST)
Figure 6: Number and percentage of households by social group/caste
Occupation of household head
Figure 7 show the number and percentage of households by main occupation of the household
head.The data show that approximately two-thirds of the surveyed households report farming or
casual labour as the main occupation.
Figure 7: Percentage of households by main occupation
N=3,962
N=228,960
N=119,400 N=134,548
N=168,553
N=139,249 N=135,499
N=35,645
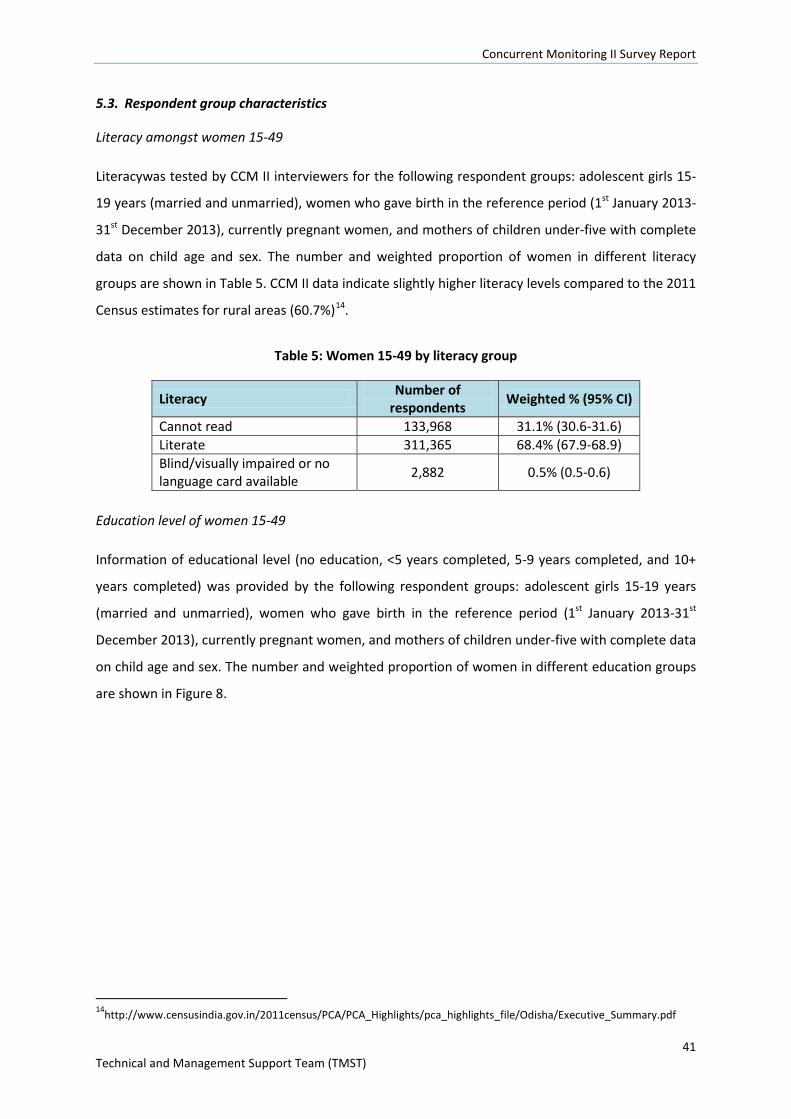
Concurrent Monitoring II Survey Report
41 Technical and Management Support Team (TMST)
5.3. Respondent group characteristics
Literacy amongst women 15-49
Literacywas tested by CCM II interviewers for the following respondent groups: adolescent girls 15-
19 years (married and unmarried), women who gave birth in the reference period (1st January 2013-
31st December 2013), currently pregnant women, and mothers of children under-five with complete
data on child age and sex. The number and weighted proportion of women in different literacy
groups are shown in Table 5. CCM II data indicate slightly higher literacy levels compared to the 2011
Census estimates for rural areas (60.7%)14.
Table 5: Women 15-49 by literacy group
Literacy Number of respondents Weighted % (95% CI)
Cannot read 133,968 31.1% (30.6-31.6) Literate 311,365 68.4% (67.9-68.9) Blind/visually impaired or no language card available 2,882 0.5% (0.5-0.6)
Education level of women 15-49
Information of educational level (no education, <5 years completed, 5-9 years completed, and 10+
years completed) was provided by the following respondent groups: adolescent girls 15-19 years
(married and unmarried), women who gave birth in the reference period (1st January 2013-31st
December 2013), currently pregnant women, and mothers of children under-five with complete data
on child age and sex. The number and weighted proportion of women in different education groups
are shown in Figure 8.
14http://www.censusindia.gov.in/2011census/PCA/PCA_Highlights/pca_highlights_file/Odisha/Executive_Summary.pdf
Concurrent Monitoring II Survey Report
42 Technical and Management Support Team (TMST)
Figure 8: Percentage of women 15-49 in different education groups
Education level of girls 10-14 years
We also asked adolescent girls 10-14 years about their educational level. We used different
groupings (no education, <5 years completed, 5-10 years completed)compared to the 15-49 age
group as not all of the younger girls would have yet had the opportunity to complete 10 or more
years of education.The numbers and weighted proportions of respondents by education group are
shown in Table 6. A far lower proportion of the 10-14 group reported having no education (5.2%)
compared to the 15-49 group (28.1%).
Table 6: Adolescent girls 10-14, by education group
Education Number of respondents
Weighted % (95% CI)
No education 3,449 5.2% (5.0-5.5) Less than 5 years completed 5,039 7.4% (7.1-7.6)
5-10 years completed 64,141 87.4% (87.0-87.8) School attendance by children 6-14 years
230,508 out of 330,522 households with children in the 6-14 age group reported that all those
children were currently attending school. The weighted percentage for this indicator was 70.2%
(95% CIs 69.7%-70.6%).
28.1%
7.3%
39.6%
25.1%
Weighted percentage of women 15-49 years by education group
No education
Less than 5 yearscompleted
5-9 yearscompleted
10 or more yearscompleted
N=119,657
N=178,736
N=116,934
N=32,888
Concurrent Monitoring II Survey Report
43 Technical and Management Support Team (TMST)
5.4. FLW characteristics
A total of 8905 FLWs were interviewed for the CCM II survey; numbers and weighted percentages by
FLW cadre, social group/caste and educational level are shown in Table 7. AWWs comprise the
largest group (46.7%), and ANMs the smallest (14.1%). Approximately one-fifth of respondents were
from ST groups and a further fifth from SC groups. Nearly 60% of all FLWs we interviewed had
completed at least 10 years of education.
We asked all FLWs how long they had been in post. On average ASHAs had been in post for the
shortest number of years (weighted mean 6.8 years; 95%CI 6.7-6.9), compared to AWWs (weighted
mean 13.9 years; 95%CI 13.7-14.2) and ANMs (weighted mean 14.9 years; 95%CI 14.4-15.4).
Table 7: Number and weighted percentage (95% CIs) by FLW cadre, social group and education
FLW characteristics Number of respondents
Weighted % (95% CI)
FLW Cadre ASHA 3,543 39.2 (38.5-39.8) AWW 4,277 46.7 (46.1-47.4) ANM 1,085 14.1 (13.5-14.7) Social group/caste General/OBC/Other 5,240 58.3 (57.3-59.3) SC 1,862 21.4(20.6-22.3) ST 1,803 20.3 (19.4-21.2) Education level (5 cases missing) No education 52 0.9 (0.7-0.11) <5 years complete 179 2.6 (2.3-3.0) 5-9 years complete 3,472 38.5 (37.6-39.4) 10+ years complete 5,197 58.0 (57.1-58.9)
Concurrent Monitoring II Survey Report
44 Technical and Management Support Team (TMST)
Results: Household survey
6. Mortality
6.1. Respondents and survey questions
Respondents:Any adult memberof the household with capacity to answersurvey questions provided
details of deaths occurring to household membersduring the reference period of 1stJanuary 2013-to
31stDecember 2013. Ideally the adult was someone other than the key respondent(s) due to answer
subsequent sections of the survey, to minimise the time burden for any one individual.
Survey questions:Household respondents provided dates of birth, and dates of death for all
household members, and whether they were male or female; stillbirths were also captured. Care
was taken to ask sensitive questions to ensure as far as possible that correct classification of deaths
was made (e.g. if a newborn had shown any initial signs of life even if only for a few seconds they
were not misclassified as being stillborn).
If a death was reported for a woman 15-49 years of age, the following additional questions were
asked, and appropriate skip patterns incorporated: 1) was the woman pregnant when she died? 2)
did the woman die at the time of or within six weeks of an abortion 3) did she die during child birth
4) did she die within six weeks of child birth or the end of a pregnancy 5) what was the cause of
death (if known).Indicator definitions and computation are shown in Table 8
Table 8: Indicator definitions and computation for mortality
Indicator Definition Computation* Maternal Mortality Ratio (MMR)
‘The ratio of the number of maternal deaths during a given time period per 100,000 live births during the same time-period’15
Number of maternal deaths / number of live births in the same year, multiplied by 100,000 (ibid)
Under-five mortality rate (U5MR)
‘The under-five mortality rate (U5MR) is the probability for a child born in a specified year to die before reaching the age of five, if subject to current age-specific mortality rate’16
Number of deaths to children under five years / number of live births in the same year, multiplied by 1,000 (ibid)
Infant mortality rate (IMR)
‘The infant mortality rate is the probability (expressed as a rate per 1,000 live births) of a child born in a specified year dying before reaching the age of one if subject to current age-specific mortality rates’17
Number of deaths to children under one year / number of live births in the same year, multiplied by 1,000 (ibid)
Newborn mortality rate (NMR)
‘The number of neonatal deaths per 1000 live births’18
Number of deaths at 0-27 days/number of live births multiplied by 1000 (ibid)
Stillbirth rate ‘A baby born with no signs of life at or after 28 Number of stillbirths/number of 15 http://mdgs.un.org/unsd/mdg/Metadata.aspx?IndicatorId=0&SeriesId=553 16 http://mdgs.un.org/unsd/mi/wiki/4-1-Under-five-mortality-rate.ashx 17 http://mdgs.un.org/unsd/mdg/Metadata.aspx?IndicatorId=0&SeriesId=562 18 http://www.cpc.unc.edu/measure/prh/rh_indicators/specific/nb/neonatal-mortality-rate-nmr
Concurrent Monitoring II Survey Report
45 Technical and Management Support Team (TMST)
Table 8: Indicator definitions and computation for mortality
Indicator Definition Computation* weeks' gestation’19 births (stillbirths+live births)
multiplied by 1000 Component definitions Maternal death
‘the death of a woman while pregnant or within 42 days of termination of pregnancy, irrespective of the duration and site of the pregnancy, from any cause related to or aggravated by the pregnancy or its management but not from accidental or incidental causes’20
Live birth ‘refers to the complete expulsion or extraction from its mother of a product of conception, irrespective of the duration of the pregnancy, which, after such separation, breathes or shows any other evidence of life – e.g. beating of the heart, pulsation of the umbilical cord or definite movement of voluntary muscles – whether or not the umbilical cord has been cut or the placenta is attached. Each product of such a birth is considered live born’ (ibid)
All births Live births and stillbirths (see definitions above) Reference period
The CCM II reference period for all births and deaths was 1st January 2013-31st December 2013
*Weighted confidence intervals for mortality and stillbirth estimates were calculated using poisson regression and complex surveys analyses 6.2. Indicator estimates
6.2.1. Maternal Mortality Ratio (MMR)
The maternal mortality estimate was 168/100,000 live births (95%CI 144-196). This represents
women aged 15-49 in rural areas of Odisha state in the calendar year 2013. MMR is only provided at
state-level because maternal deaths are a rare event requiring a very large sample size; MMR
estimates at sub-state level would be less accurate andwould have lower precision (95% confidence
intervals would be extremely wide).
6.2.2. Under-five mortality rate (U5MR)
The U5MR estimate was 35/1000 live births (95% CI 3.0-36.6) in rural areas of Odisha state in the
calendar year 2013. Disaggregated estimates are shown in Figure 9.
19 http://www.biomedcentral.com/1471-2393/10/S1/S1 20 http://www.who.int/healthinfo/statistics/indmaternalmortality/en/
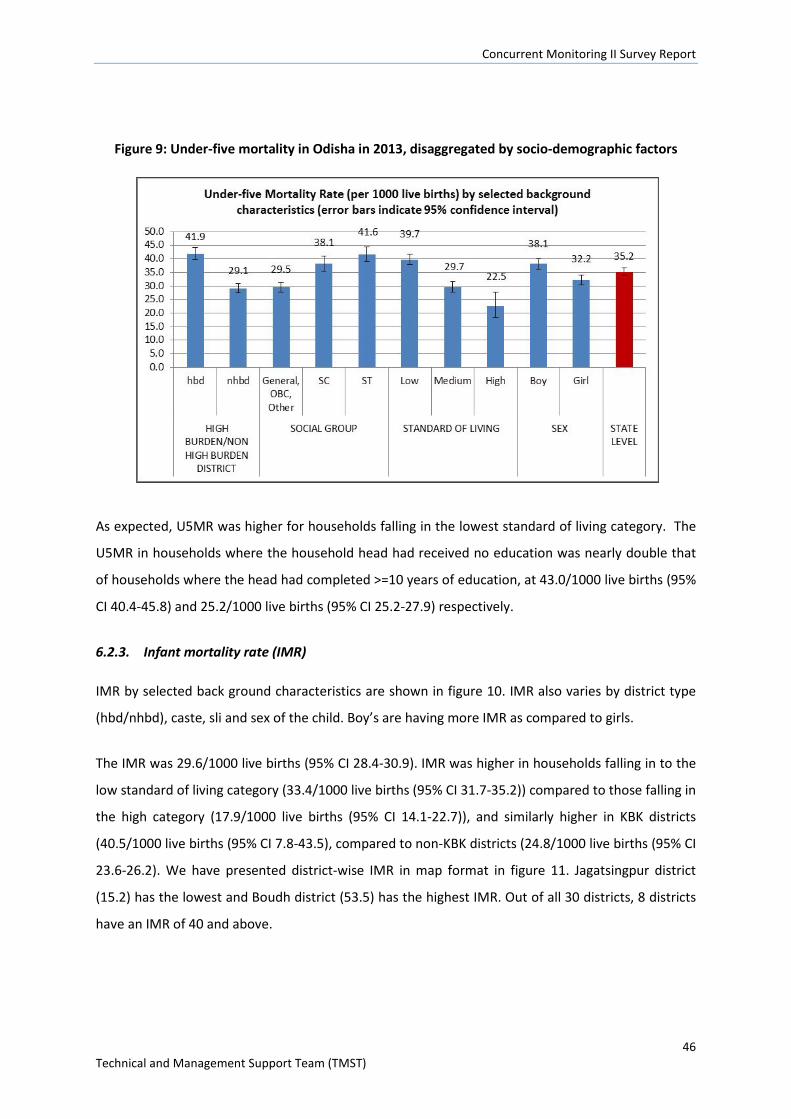
Concurrent Monitoring II Survey Report
46 Technical and Management Support Team (TMST)
Figure 9: Under-five mortality in Odisha in 2013, disaggregated by socio-demographic factors
As expected, U5MR was higher for households falling in the lowest standard of living category. The
U5MR in households where the household head had received no education was nearly double that
of households where the head had completed >=10 years of education, at 43.0/1000 live births (95%
CI 40.4-45.8) and 25.2/1000 live births (95% CI 25.2-27.9) respectively.
6.2.3. Infant mortality rate (IMR)
IMR by selected back ground characteristics are shown in figure 10. IMR also varies by district type
(hbd/nhbd), caste, sli and sex of the child. Boy’s are having more IMR as compared to girls.
The IMR was 29.6/1000 live births (95% CI 28.4-30.9). IMR was higher in households falling in to the
low standard of living category (33.4/1000 live births (95% CI 31.7-35.2)) compared to those falling in
the high category (17.9/1000 live births (95% CI 14.1-22.7)), and similarly higher in KBK districts
(40.5/1000 live births (95% CI 7.8-43.5), compared to non-KBK districts (24.8/1000 live births (95% CI
23.6-26.2). We have presented district-wise IMR in map format in figure 11. Jagatsingpur district
(15.2) has the lowest and Boudh district (53.5) has the highest IMR. Out of all 30 districts, 8 districts
have an IMR of 40 and above.
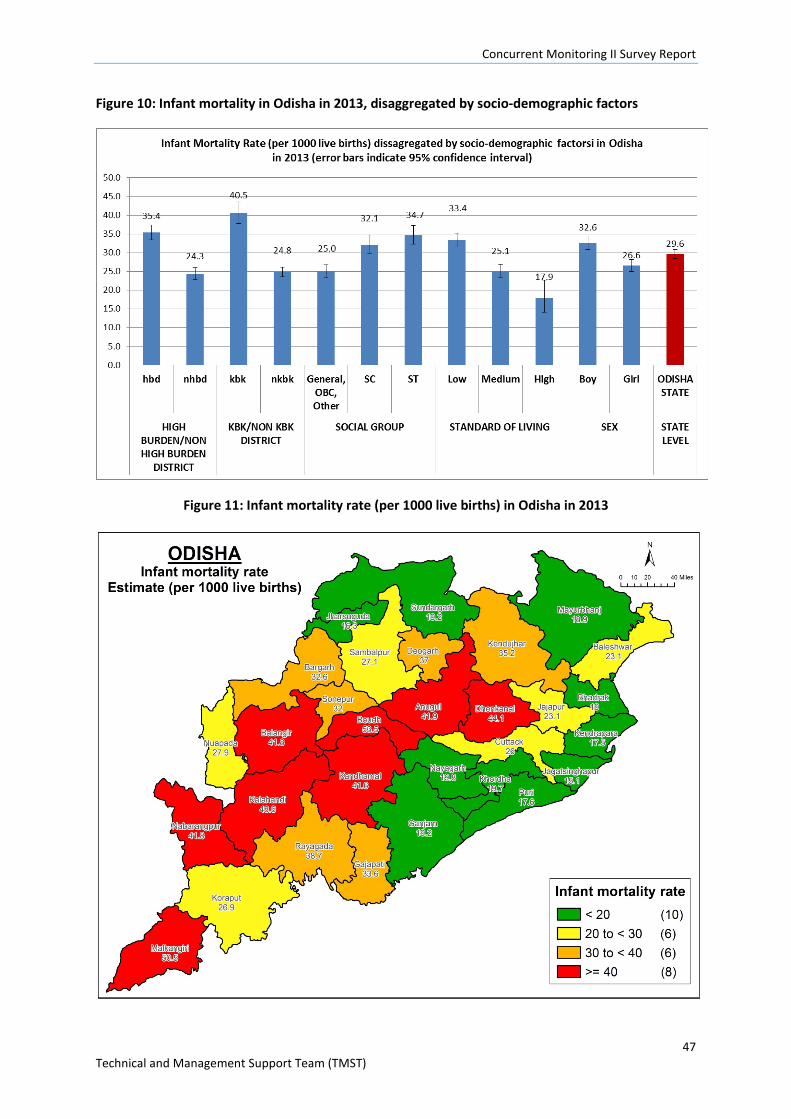
Concurrent Monitoring II Survey Report
47 Technical and Management Support Team (TMST)
Figure 10: Infant mortality in Odisha in 2013, disaggregated by socio-demographic factors
Figure 11: Infant mortality rate (per 1000 live births) in Odisha in 2013
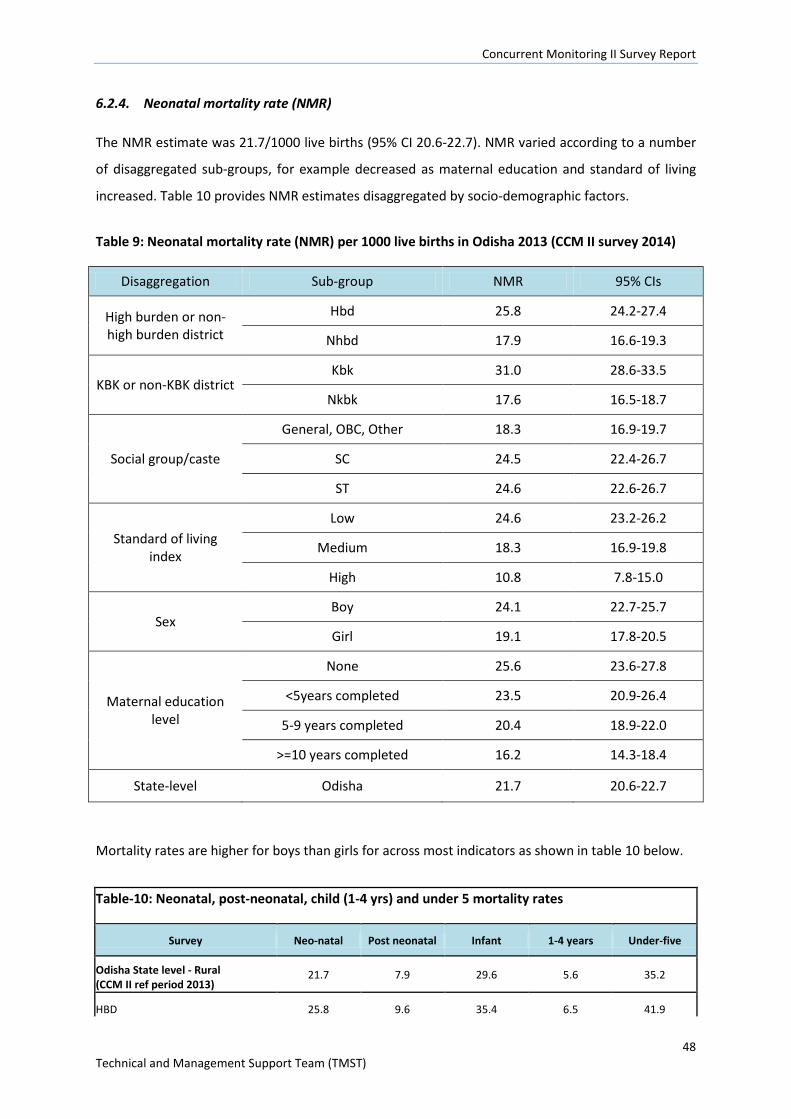
Concurrent Monitoring II Survey Report
48 Technical and Management Support Team (TMST)
6.2.4. Neonatal mortality rate (NMR)
The NMR estimate was 21.7/1000 live births (95% CI 20.6-22.7). NMR varied according to a number
of disaggregated sub-groups, for example decreased as maternal education and standard of living
increased. Table 10 provides NMR estimates disaggregated by socio-demographic factors.
Table 9: Neonatal mortality rate (NMR) per 1000 live births in Odisha 2013 (CCM II survey 2014)
Disaggregation Sub-group NMR 95% CIs
High burden or non-high burden district
Hbd 25.8 24.2-27.4
Nhbd 17.9 16.6-19.3
KBK or non-KBK district Kbk 31.0 28.6-33.5
Nkbk 17.6 16.5-18.7
Social group/caste
General, OBC, Other 18.3 16.9-19.7
SC 24.5 22.4-26.7
ST 24.6 22.6-26.7
Standard of living index
Low 24.6 23.2-26.2
Medium 18.3 16.9-19.8
High 10.8 7.8-15.0
Sex Boy 24.1 22.7-25.7
Girl 19.1 17.8-20.5
Maternal education level
None 25.6 23.6-27.8
<5years completed 23.5 20.9-26.4
5-9 years completed 20.4 18.9-22.0
>=10 years completed 16.2 14.3-18.4
State-level Odisha 21.7 20.6-22.7
Mortality rates are higher for boys than girls for across most indicators as shown in table 10 below.
Table-10: Neonatal, post-neonatal, child (1-4 yrs) and under 5 mortality rates
Survey Neo-natal Post neonatal Infant 1-4 years Under-five Odisha State level - Rural (CCM II ref period 2013) 21.7 7.9 29.6 5.6 35.2 HBD 25.8 9.6 35.4 6.5 41.9
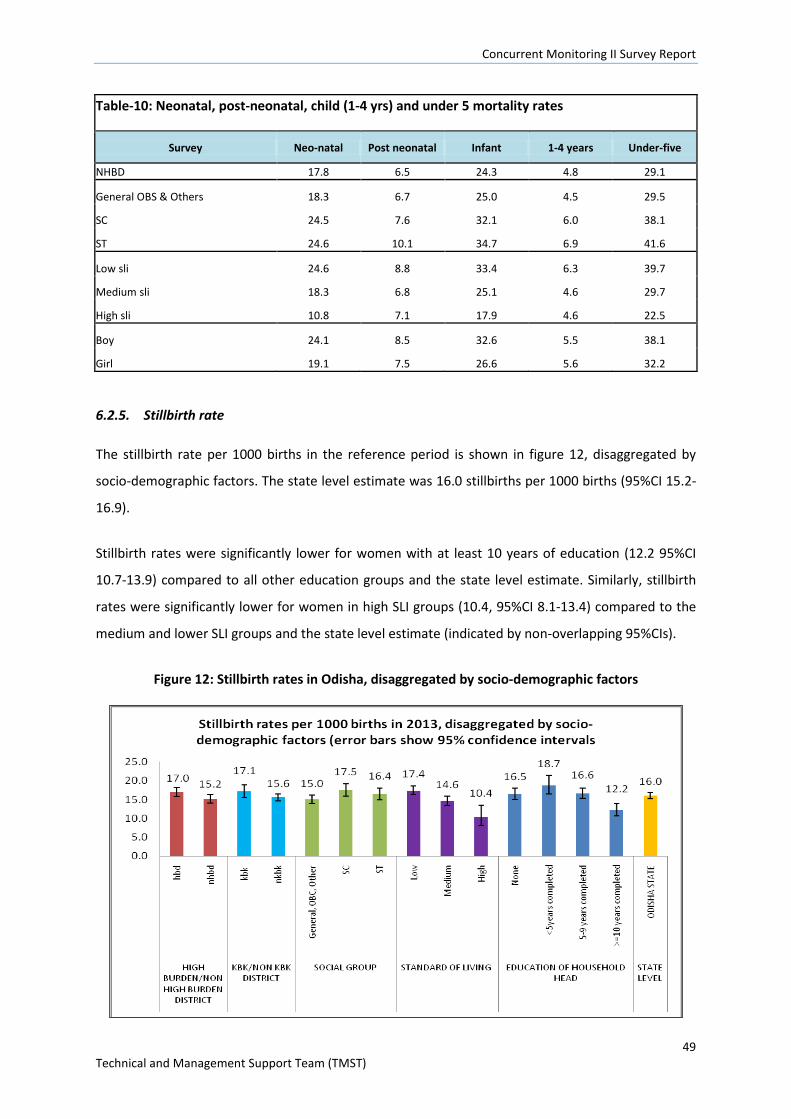
Concurrent Monitoring II Survey Report
49 Technical and Management Support Team (TMST)
Table-10: Neonatal, post-neonatal, child (1-4 yrs) and under 5 mortality rates
Survey Neo-natal Post neonatal Infant 1-4 years Under-five NHBD 17.8 6.5 24.3 4.8 29.1 General OBS & Others 18.3 6.7 25.0 4.5 29.5 SC 24.5 7.6 32.1 6.0 38.1 ST 24.6 10.1 34.7 6.9 41.6 Low sli 24.6 8.8 33.4 6.3 39.7 Medium sli 18.3 6.8 25.1 4.6 29.7 High sli 10.8 7.1 17.9 4.6 22.5 Boy 24.1 8.5 32.6 5.5 38.1 Girl 19.1 7.5 26.6 5.6 32.2
6.2.5. Stillbirth rate
The stillbirth rate per 1000 births in the reference period is shown in figure 12, disaggregated by
socio-demographic factors. The state level estimate was 16.0 stillbirths per 1000 births (95%CI 15.2-
16.9).
Stillbirth rates were significantly lower for women with at least 10 years of education (12.2 95%CI
10.7-13.9) compared to all other education groups and the state level estimate. Similarly, stillbirth
rates were significantly lower for women in high SLI groups (10.4, 95%CI 8.1-13.4) compared to the
medium and lower SLI groups and the state level estimate (indicated by non-overlapping 95%CIs).
Figure 12: Stillbirth rates in Odisha, disaggregated by socio-demographic factors
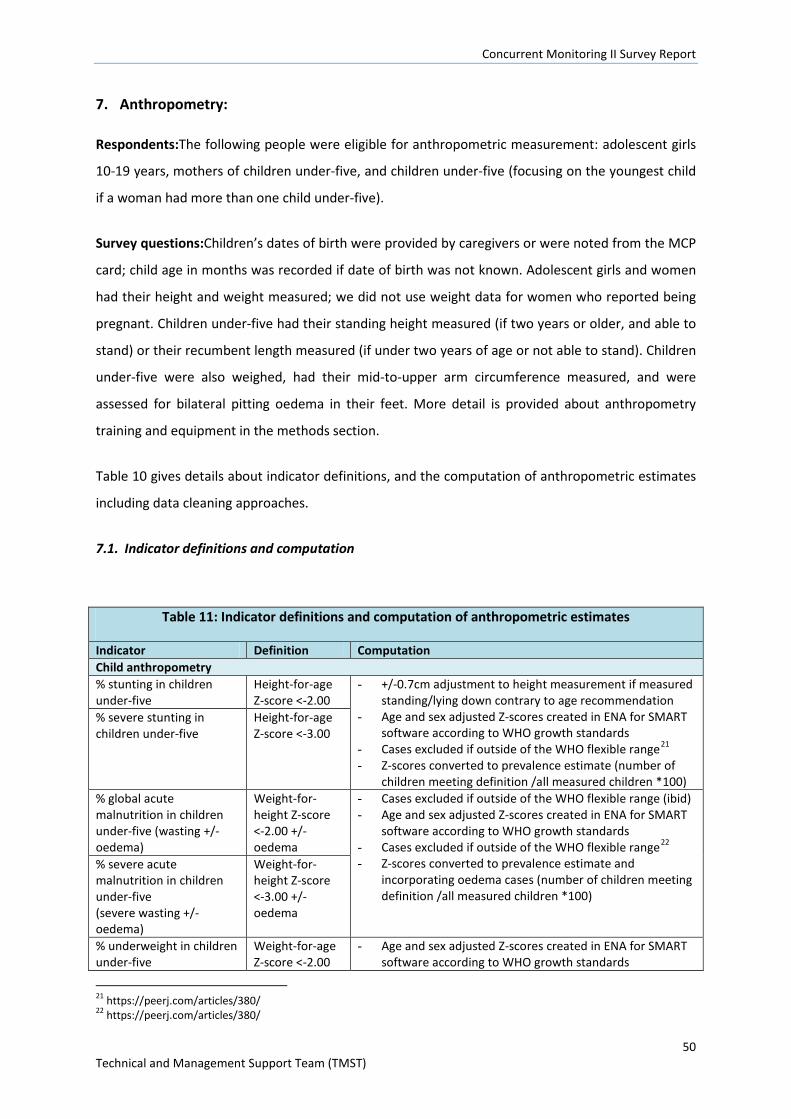
Concurrent Monitoring II Survey Report
50 Technical and Management Support Team (TMST)
7. Anthropometry:
Respondents:The following people were eligible for anthropometric measurement: adolescent girls
10-19 years, mothers of children under-five, and children under-five (focusing on the youngest child
if a woman had more than one child under-five).
Survey questions:Children’s dates of birth were provided by caregivers or were noted from the MCP
card; child age in months was recorded if date of birth was not known. Adolescent girls and women
had their height and weight measured; we did not use weight data for women who reported being
pregnant. Children under-five had their standing height measured (if two years or older, and able to
stand) or their recumbent length measured (if under two years of age or not able to stand). Children
under-five were also weighed, had their mid-to-upper arm circumference measured, and were
assessed for bilateral pitting oedema in their feet. More detail is provided about anthropometry
training and equipment in the methods section.
Table 10 gives details about indicator definitions, and the computation of anthropometric estimates
including data cleaning approaches.
7.1. Indicator definitions and computation
Table 11: Indicator definitions and computation of anthropometric estimates
Indicator Definition Computation Child anthropometry % stunting in children under-five
Height-for-age Z-score <-2.00
- +/-0.7cm adjustment to height measurement if measured standing/lying down contrary to age recommendation
- Age and sex adjusted Z-scores created in ENA for SMART software according to WHO growth standards
- Cases excluded if outside of the WHO flexible range21 - Z-scores converted to prevalence estimate (number of
children meeting definition /all measured children *100)
% severe stunting in children under-five
Height-for-age Z-score <-3.00
% global acute malnutrition in children under-five (wasting +/- oedema)
Weight-for-height Z-score <-2.00 +/- oedema
- Cases excluded if outside of the WHO flexible range (ibid) - Age and sex adjusted Z-scores created in ENA for SMART
software according to WHO growth standards - Cases excluded if outside of the WHO flexible range22 - Z-scores converted to prevalence estimate and
incorporating oedema cases (number of children meeting definition /all measured children *100)
% severe acute malnutrition in children under-five (severe wasting +/-oedema)
Weight-for-height Z-score <-3.00 +/- oedema
% underweight in children under-five
Weight-for-age Z-score <-2.00
- Age and sex adjusted Z-scores created in ENA for SMART software according to WHO growth standards
21 https://peerj.com/articles/380/ 22 https://peerj.com/articles/380/
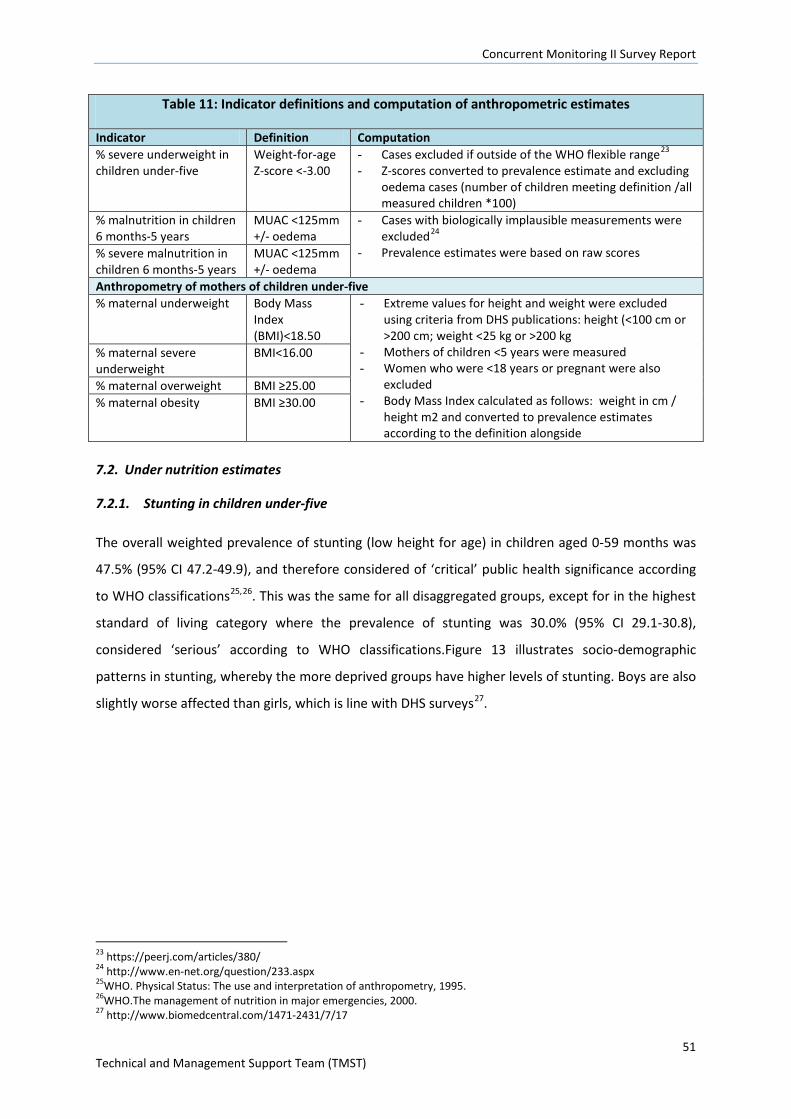
Concurrent Monitoring II Survey Report
51 Technical and Management Support Team (TMST)
Table 11: Indicator definitions and computation of anthropometric estimates
Indicator Definition Computation % severe underweight in children under-five
Weight-for-age Z-score <-3.00
- Cases excluded if outside of the WHO flexible range23 - Z-scores converted to prevalence estimate and excluding
oedema cases (number of children meeting definition /all measured children *100)
% malnutrition in children 6 months-5 years
MUAC <125mm +/- oedema
- Cases with biologically implausible measurements were excluded24
- Prevalence estimates were based on raw scores % severe malnutrition in children 6 months-5 years
MUAC <125mm +/- oedema
Anthropometry of mothers of children under-five % maternal underweight Body Mass
Index (BMI)<18.50
- Extreme values for height and weight were excluded using criteria from DHS publications: height (<100 cm or >200 cm; weight <25 kg or >200 kg
- Mothers of children <5 years were measured - Women who were <18 years or pregnant were also
excluded - Body Mass Index calculated as follows: weight in cm /
height m2 and converted to prevalence estimates according to the definition alongside
% maternal severe underweight
BMI<16.00
% maternal overweight BMI ≥25.00 % maternal obesity BMI ≥30.00
7.2. Under nutrition estimates
7.2.1. Stunting in children under-five
The overall weighted prevalence of stunting (low height for age) in children aged 0-59 months was
47.5% (95% CI 47.2-49.9), and therefore considered of ‘critical’ public health significance according
to WHO classifications25,26. This was the same for all disaggregated groups, except for in the highest
standard of living category where the prevalence of stunting was 30.0% (95% CI 29.1-30.8),
considered ‘serious’ according to WHO classifications.Figure 13 illustrates socio-demographic
patterns in stunting, whereby the more deprived groups have higher levels of stunting. Boys are also
slightly worse affected than girls, which is line with DHS surveys27.
23 https://peerj.com/articles/380/ 24 http://www.en-net.org/question/233.aspx 25WHO. Physical Status: The use and interpretation of anthropometry, 1995. 26WHO.The management of nutrition in major emergencies, 2000. 27 http://www.biomedcentral.com/1471-2431/7/17
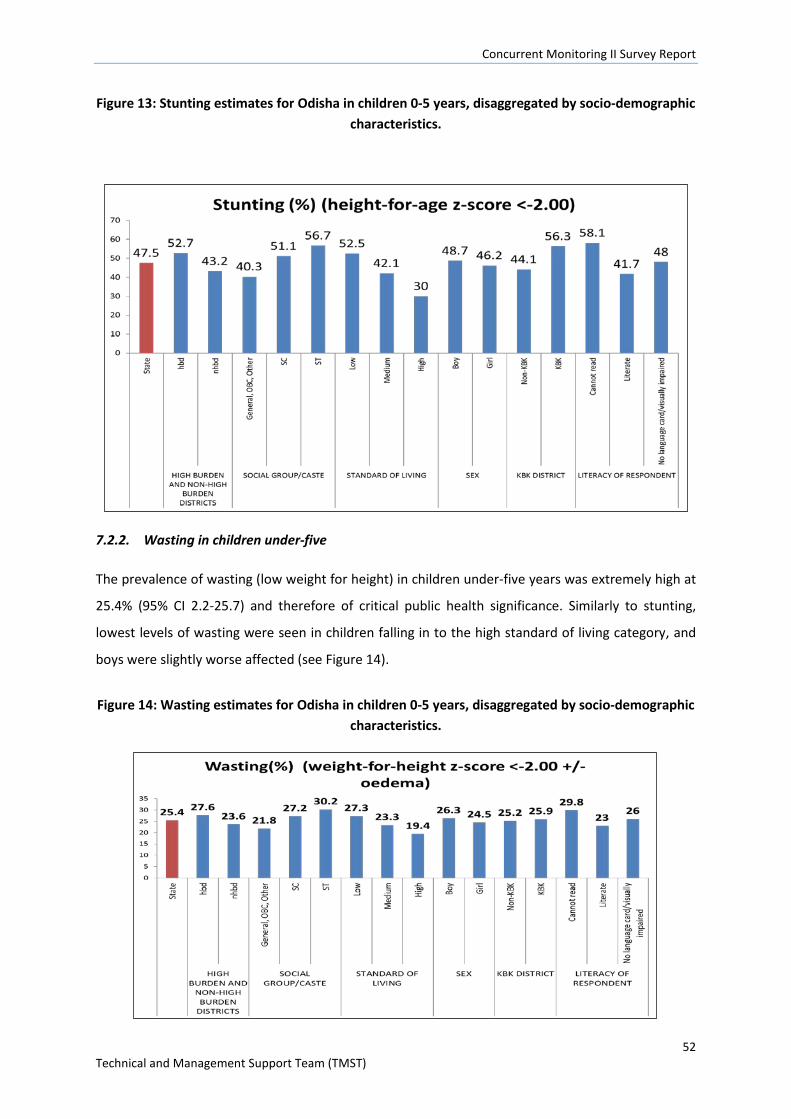
Concurrent Monitoring II Survey Report
52 Technical and Management Support Team (TMST)
Figure 13: Stunting estimates for Odisha in children 0-5 years, disaggregated by socio-demographic characteristics.
7.2.2. Wasting in children under-five
The prevalence of wasting (low weight for height) in children under-five years was extremely high at
25.4% (95% CI 2.2-25.7) and therefore of critical public health significance. Similarly to stunting,
lowest levels of wasting were seen in children falling in to the high standard of living category, and
boys were slightly worse affected (see Figure 14).
Figure 14: Wasting estimates for Odisha in children 0-5 years, disaggregated by socio-demographic characteristics.
Concurrent Monitoring II Survey Report
53 Technical and Management Support Team (TMST)
7.2.3. Underweight in children under-five
Underweight (low weight for age) is shown district-wise in map format in Figure 15. The map shows
that underweight is less of an issue in the coastal districts of Odisha compared to the majority of the
northern districts adjoining Jharkhand state, and four of the Southern districts of
Nuapada,Nabarangpur, Rayagada and Gajapati.
Figure 15: Underweight in children 0-5 years, by district
7.2.4. Mid to upper arm circumference (MUAC) in children 6 months-5 years
Figure 16 shows the district-wise distribution of global acute malnutrition (GAM) as measured by low
MUAC measurements (<125mm) and/or bilateral pitting oedema in both feet. In contrast to the previous
indicators which focus on children 0-5 years, GAMexcludes children <6 months of age who are more
vulnerable to wasting than other children.
MUAC (and its derived measures GAM, Moderate acute malnutrition/MAM, and severe acute
malnutrition/SAM) represent different measures of wasting than weight-for-height. Although both
measuredifferent types of wasting and both include oedema, they tend to identify different children,
and weight-for-height identifies a larger number of children.
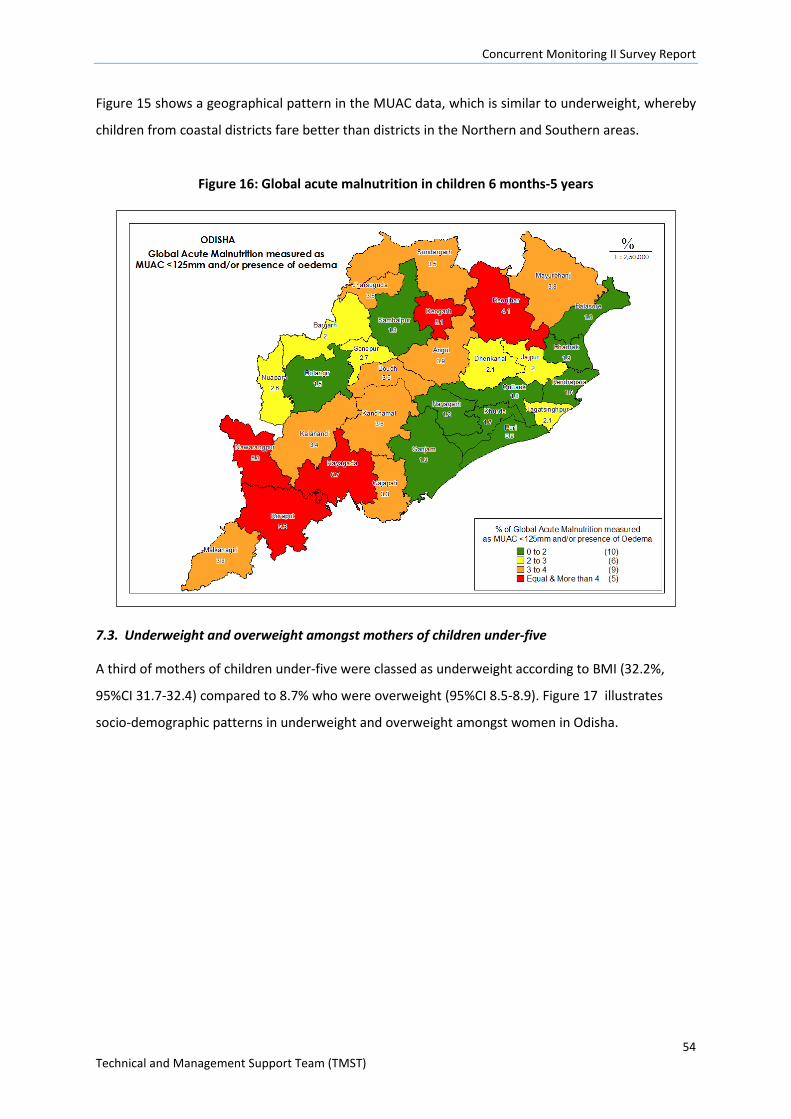
Concurrent Monitoring II Survey Report
54 Technical and Management Support Team (TMST)
Figure 15 shows a geographical pattern in the MUAC data, which is similar to underweight, whereby
children from coastal districts fare better than districts in the Northern and Southern areas.
Figure 16: Global acute malnutrition in children 6 months-5 years
7.3. Underweight and overweight amongst mothers of children under-five
A third of mothers of children under-five were classed as underweight according to BMI (32.2%,
95%CI 31.7-32.4) compared to 8.7% who were overweight (95%CI 8.5-8.9). Figure 17 illustrates
socio-demographic patterns in underweight and overweight amongst women in Odisha.
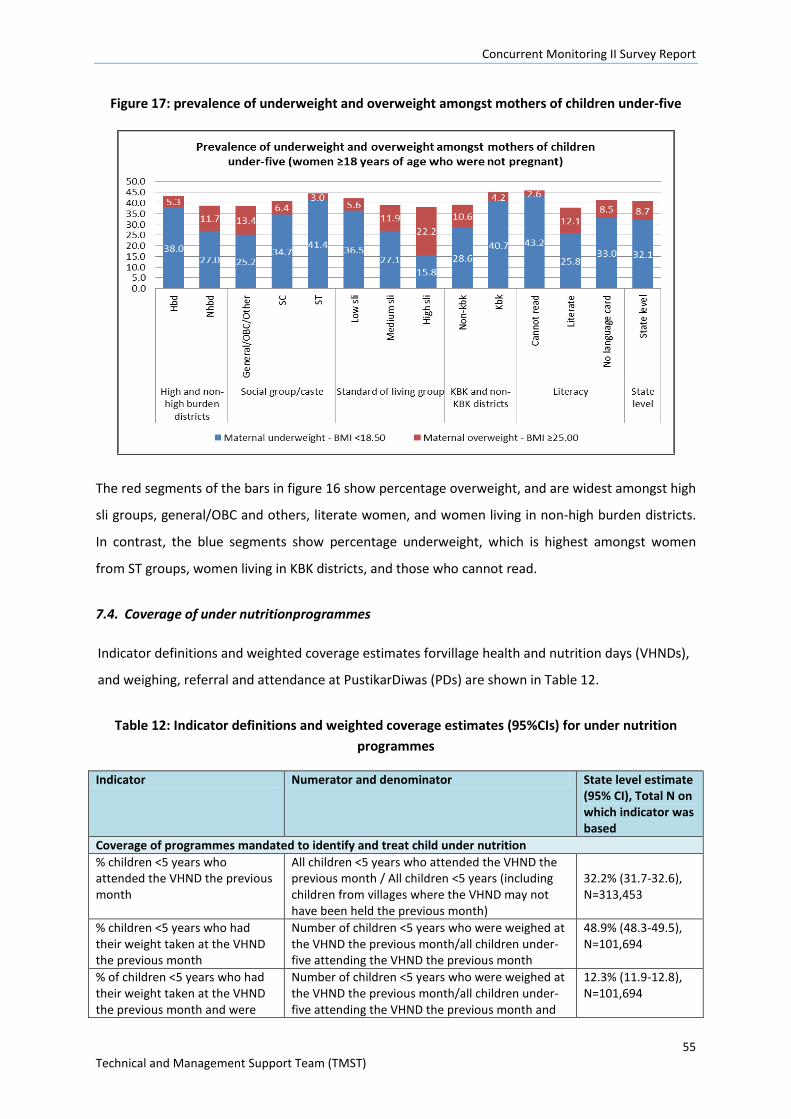
Concurrent Monitoring II Survey Report
55 Technical and Management Support Team (TMST)
Figure 17: prevalence of underweight and overweight amongst mothers of children under-five
The red segments of the bars in figure 16 show percentage overweight, and are widest amongst high
sli groups, general/OBC and others, literate women, and women living in non-high burden districts.
In contrast, the blue segments show percentage underweight, which is highest amongst women
from ST groups, women living in KBK districts, and those who cannot read.
7.4. Coverage of under nutritionprogrammes
Indicator definitions and weighted coverage estimates forvillage health and nutrition days (VHNDs),
and weighing, referral and attendance at PustikarDiwas (PDs) are shown in Table 12.
Table 12: Indicator definitions and weighted coverage estimates (95%CIs) for under nutrition programmes
Indicator Numerator and denominator State level estimate (95% CI), Total N on which indicator was based
Coverage of programmes mandated to identify and treat child under nutrition % children <5 years who attended the VHND the previous month
All children <5 years who attended the VHND the previous month / All children <5 years (including children from villages where the VHND may not have been held the previous month)
32.2% (31.7-32.6), N=313,453
% children <5 years who had their weight taken at the VHND the previous month
Number of children <5 years who were weighed at the VHND the previous month/all children under-five attending the VHND the previous month
48.9% (48.3-49.5), N=101,694
% of children <5 years who had their weight taken at the VHND the previous month and were
Number of children <5 years who were weighed at the VHND the previous month/all children under-five attending the VHND the previous month and
12.3% (11.9-12.8), N=101,694
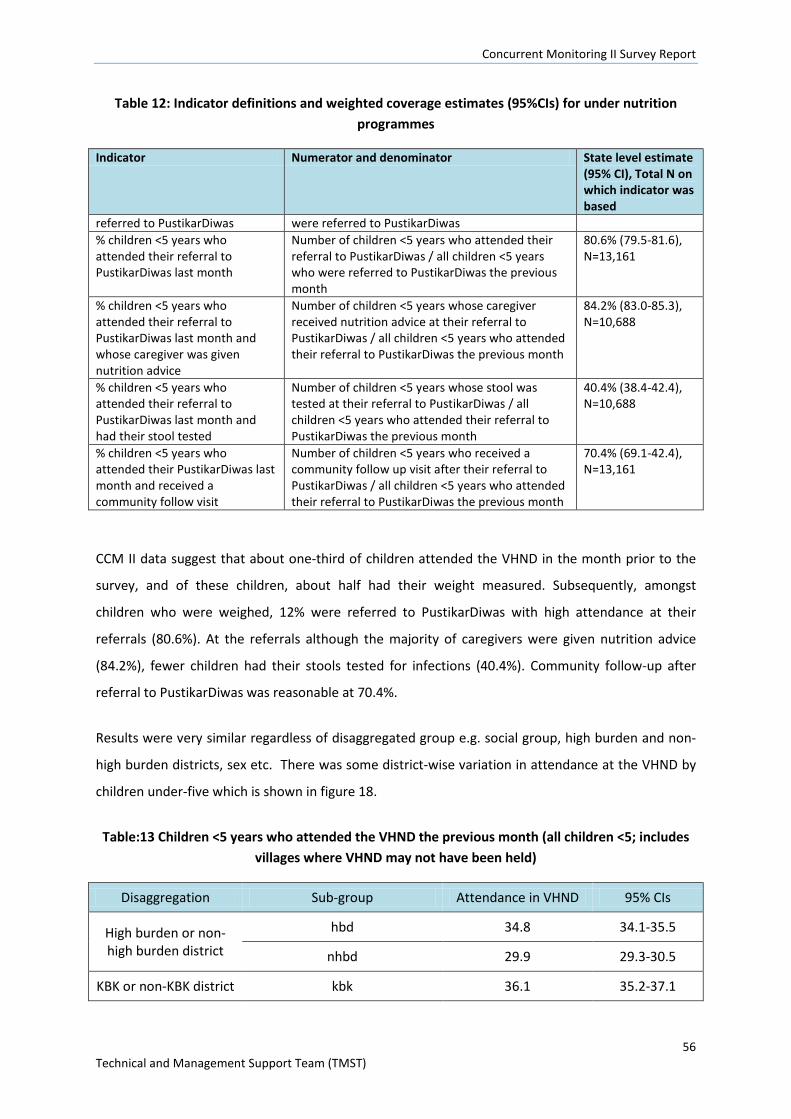
Concurrent Monitoring II Survey Report
56 Technical and Management Support Team (TMST)
Table 12: Indicator definitions and weighted coverage estimates (95%CIs) for under nutrition programmes
Indicator Numerator and denominator State level estimate (95% CI), Total N on which indicator was based
referred to PustikarDiwas were referred to PustikarDiwas % children <5 years who attended their referral to PustikarDiwas last month
Number of children <5 years who attended their referral to PustikarDiwas / all children <5 years who were referred to PustikarDiwas the previous month
80.6% (79.5-81.6), N=13,161
% children <5 years who attended their referral to PustikarDiwas last month and whose caregiver was given nutrition advice
Number of children <5 years whose caregiver received nutrition advice at their referral to PustikarDiwas / all children <5 years who attended their referral to PustikarDiwas the previous month
84.2% (83.0-85.3), N=10,688
% children <5 years who attended their referral to PustikarDiwas last month and had their stool tested
Number of children <5 years whose stool was tested at their referral to PustikarDiwas / all children <5 years who attended their referral to PustikarDiwas the previous month
40.4% (38.4-42.4), N=10,688
% children <5 years who attended their PustikarDiwas last month and received a community follow visit
Number of children <5 years who received a community follow up visit after their referral to PustikarDiwas / all children <5 years who attended their referral to PustikarDiwas the previous month
70.4% (69.1-42.4), N=13,161
CCM II data suggest that about one-third of children attended the VHND in the month prior to the
survey, and of these children, about half had their weight measured. Subsequently, amongst
children who were weighed, 12% were referred to PustikarDiwas with high attendance at their
referrals (80.6%). At the referrals although the majority of caregivers were given nutrition advice
(84.2%), fewer children had their stools tested for infections (40.4%). Community follow-up after
referral to PustikarDiwas was reasonable at 70.4%.
Results were very similar regardless of disaggregated group e.g. social group, high burden and non-
high burden districts, sex etc. There was some district-wise variation in attendance at the VHND by
children under-five which is shown in figure 18.
Table:13 Children <5 years who attended the VHND the previous month (all children <5; includes villages where VHND may not have been held)
Disaggregation Sub-group Attendance in VHND 95% CIs
High burden or non-high burden district
hbd 34.8 34.1-35.5
nhbd 29.9 29.3-30.5
KBK or non-KBK district kbk 36.1 35.2-37.1
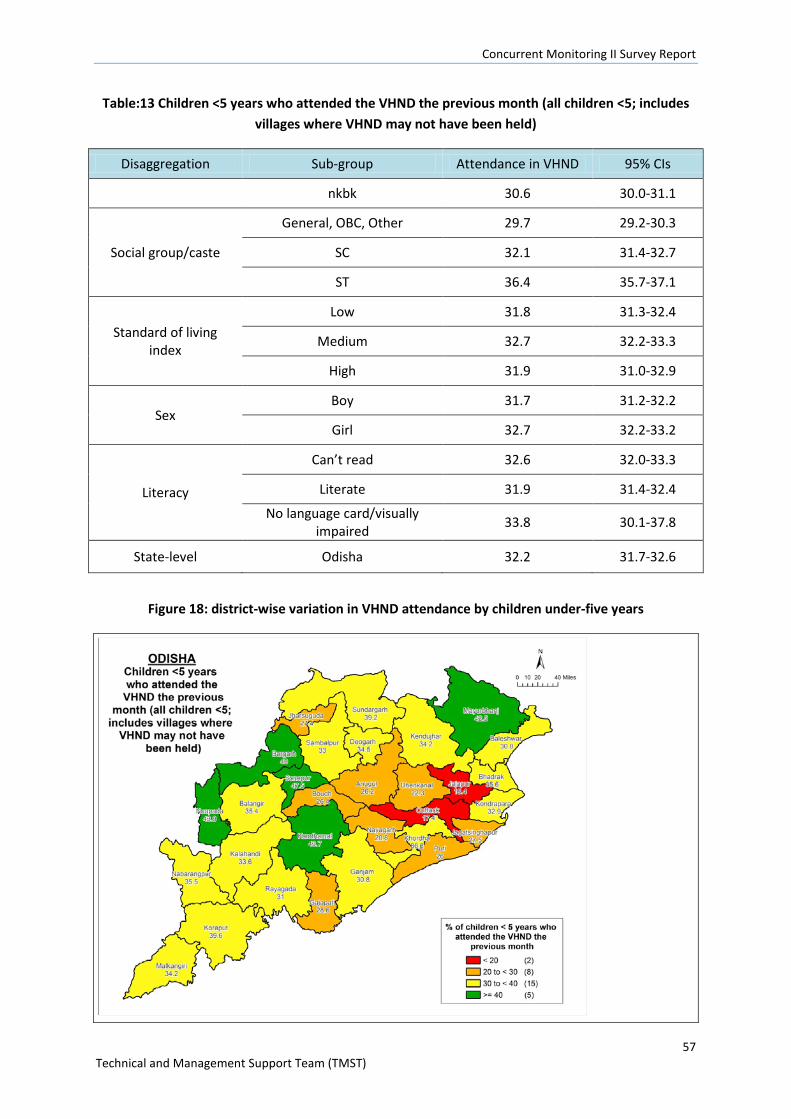
Concurrent Monitoring II Survey Report
57 Technical and Management Support Team (TMST)
Table:13 Children <5 years who attended the VHND the previous month (all children <5; includes villages where VHND may not have been held)
Disaggregation Sub-group Attendance in VHND 95% CIs
nkbk 30.6 30.0-31.1
Social group/caste
General, OBC, Other 29.7 29.2-30.3
SC 32.1 31.4-32.7
ST 36.4 35.7-37.1
Standard of living index
Low 31.8 31.3-32.4
Medium 32.7 32.2-33.3
High 31.9 31.0-32.9
Sex Boy 31.7 31.2-32.2
Girl 32.7 32.2-33.2
Literacy
Can’t read 32.6 32.0-33.3
Literate 31.9 31.4-32.4
No language card/visually impaired 33.8 30.1-37.8
State-level Odisha 32.2 31.7-32.6
Figure 18: district-wise variation in VHND attendance by children under-five years
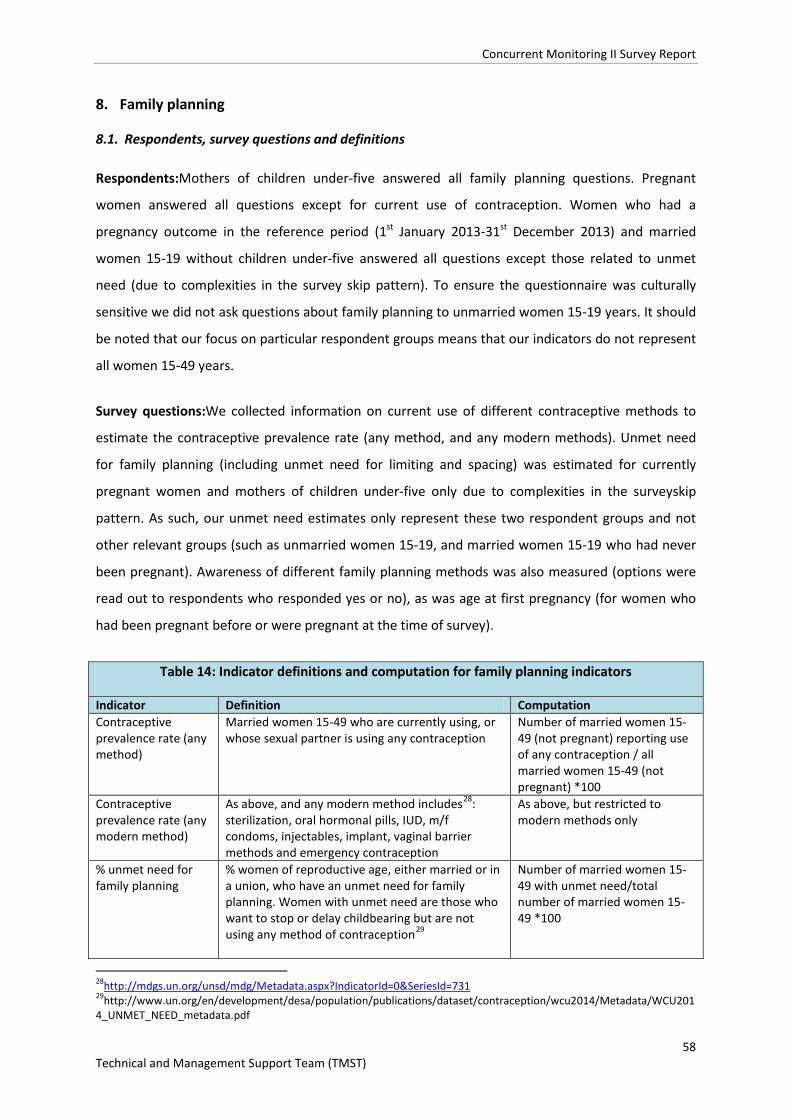
Concurrent Monitoring II Survey Report
58 Technical and Management Support Team (TMST)
8. Family planning
8.1. Respondents, survey questions and definitions
Respondents:Mothers of children under-five answered all family planning questions. Pregnant
women answered all questions except for current use of contraception. Women who had a
pregnancy outcome in the reference period (1st January 2013-31st December 2013) and married
women 15-19 without children under-five answered all questions except those related to unmet
need (due to complexities in the survey skip pattern). To ensure the questionnaire was culturally
sensitive we did not ask questions about family planning to unmarried women 15-19 years. It should
be noted that our focus on particular respondent groups means that our indicators do not represent
all women 15-49 years.
Survey questions:We collected information on current use of different contraceptive methods to
estimate the contraceptive prevalence rate (any method, and any modern methods). Unmet need
for family planning (including unmet need for limiting and spacing) was estimated for currently
pregnant women and mothers of children under-five only due to complexities in the surveyskip
pattern. As such, our unmet need estimates only represent these two respondent groups and not
other relevant groups (such as unmarried women 15-19, and married women 15-19 who had never
been pregnant). Awareness of different family planning methods was also measured (options were
read out to respondents who responded yes or no), as was age at first pregnancy (for women who
had been pregnant before or were pregnant at the time of survey).
Table 14: Indicator definitions and computation for family planning indicators
Indicator Definition Computation Contraceptive prevalence rate (any method)
Married women 15-49 who are currently using, or whose sexual partner is using any contraception
Number of married women 15-49 (not pregnant) reporting use of any contraception / all married women 15-49 (not pregnant) *100
Contraceptive prevalence rate (any modern method)
As above, and any modern method includes28: sterilization, oral hormonal pills, IUD, m/f condoms, injectables, implant, vaginal barrier methods and emergency contraception
As above, but restricted to modern methods only
% unmet need for family planning
% women of reproductive age, either married or in a union, who have an unmet need for family planning. Women with unmet need are those who want to stop or delay childbearing but are not using any method of contraception29
Number of married women 15-49 with unmet need/total number of married women 15-49 *100
28http://mdgs.un.org/unsd/mdg/Metadata.aspx?IndicatorId=0&SeriesId=731 29http://www.un.org/en/development/desa/population/publications/dataset/contraception/wcu2014/Metadata/WCU2014_UNMET_NEED_metadata.pdf
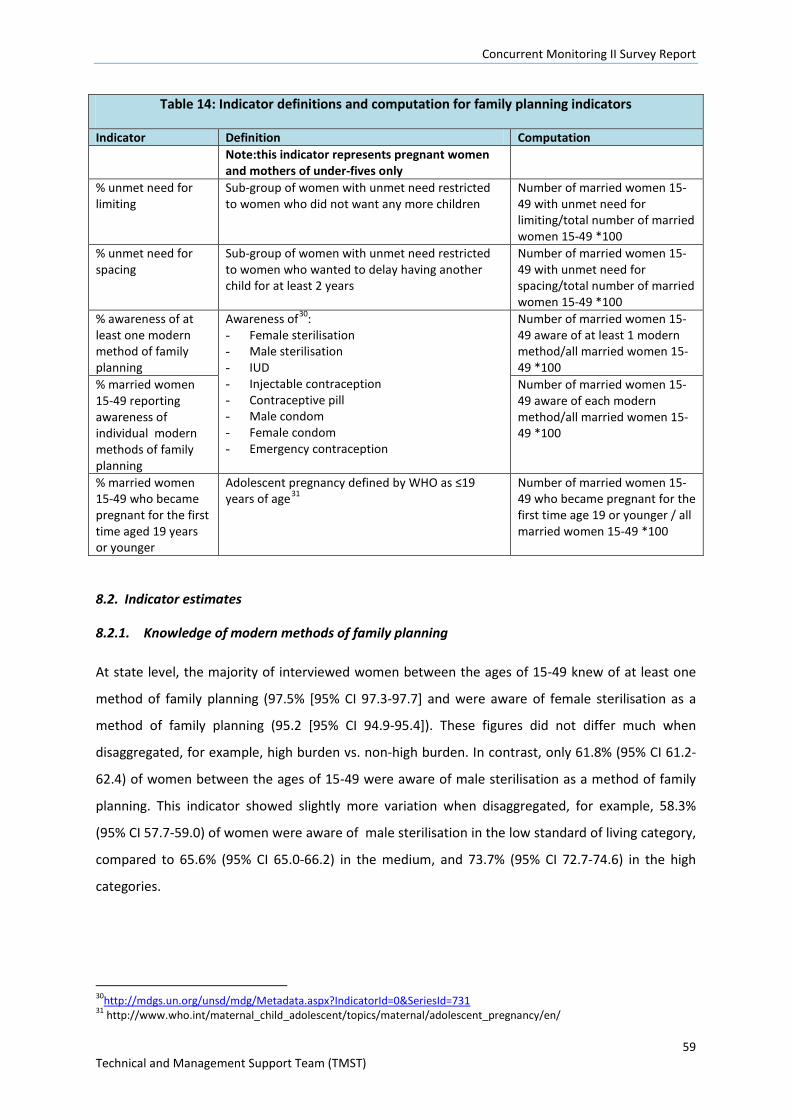
Concurrent Monitoring II Survey Report
59 Technical and Management Support Team (TMST)
Table 14: Indicator definitions and computation for family planning indicators
Indicator Definition Computation Note:this indicator represents pregnant women and mothers of under-fives only
% unmet need for limiting
Sub-group of women with unmet need restricted to women who did not want any more children
Number of married women 15-49 with unmet need for limiting/total number of married women 15-49 *100
% unmet need for spacing
Sub-group of women with unmet need restricted to women who wanted to delay having another child for at least 2 years
Number of married women 15-49 with unmet need for spacing/total number of married women 15-49 *100
% awareness of at least one modern method of family planning
Awareness of30: - Female sterilisation - Male sterilisation - IUD - Injectable contraception - Contraceptive pill - Male condom - Female condom - Emergency contraception
Number of married women 15-49 aware of at least 1 modern method/all married women 15-49 *100
% married women 15-49 reporting awareness of individual modern methods of family planning
Number of married women 15-49 aware of each modern method/all married women 15-49 *100
% married women 15-49 who became pregnant for the first time aged 19 years or younger
Adolescent pregnancy defined by WHO as ≤19 years of age31
Number of married women 15-49 who became pregnant for the first time age 19 or younger / all married women 15-49 *100
8.2. Indicator estimates
8.2.1. Knowledge of modern methods of family planning
At state level, the majority of interviewed women between the ages of 15-49 knew of at least one
method of family planning (97.5% [95% CI 97.3-97.7] and were aware of female sterilisation as a
method of family planning (95.2 [95% CI 94.9-95.4]). These figures did not differ much when
disaggregated, for example, high burden vs. non-high burden. In contrast, only 61.8% (95% CI 61.2-
62.4) of women between the ages of 15-49 were aware of male sterilisation as a method of family
planning. This indicator showed slightly more variation when disaggregated, for example, 58.3%
(95% CI 57.7-59.0) of women were aware of male sterilisation in the low standard of living category,
compared to 65.6% (95% CI 65.0-66.2) in the medium, and 73.7% (95% CI 72.7-74.6) in the high
categories.
30http://mdgs.un.org/unsd/mdg/Metadata.aspx?IndicatorId=0&SeriesId=731 31 http://www.who.int/maternal_child_adolescent/topics/maternal/adolescent_pregnancy/en/
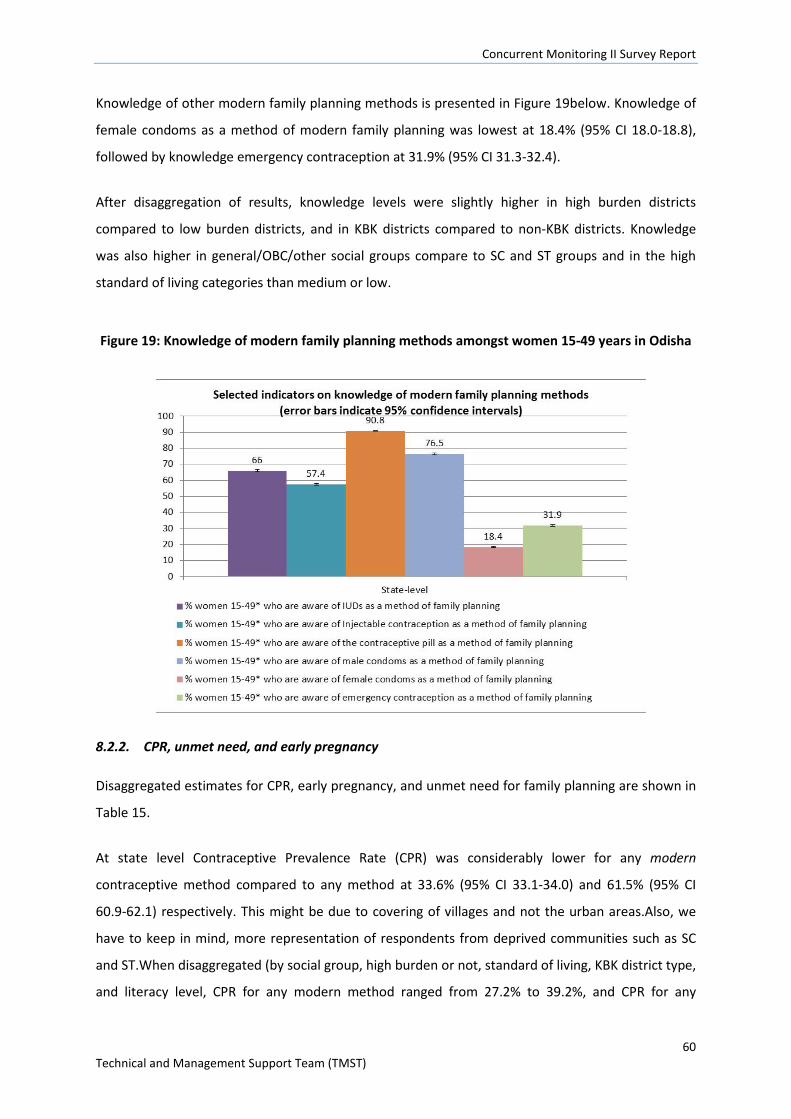
Concurrent Monitoring II Survey Report
60 Technical and Management Support Team (TMST)
Knowledge of other modern family planning methods is presented in Figure 19below. Knowledge of
female condoms as a method of modern family planning was lowest at 18.4% (95% CI 18.0-18.8),
followed by knowledge emergency contraception at 31.9% (95% CI 31.3-32.4).
After disaggregation of results, knowledge levels were slightly higher in high burden districts
compared to low burden districts, and in KBK districts compared to non-KBK districts. Knowledge
was also higher in general/OBC/other social groups compare to SC and ST groups and in the high
standard of living categories than medium or low.
Figure 19: Knowledge of modern family planning methods amongst women 15-49 years in Odisha
8.2.2. CPR, unmet need, and early pregnancy
Disaggregated estimates for CPR, early pregnancy, and unmet need for family planning are shown in
Table 15.
At state level Contraceptive Prevalence Rate (CPR) was considerably lower for any modern
contraceptive method compared to any method at 33.6% (95% CI 33.1-34.0) and 61.5% (95% CI
60.9-62.1) respectively. This might be due to covering of villages and not the urban areas.Also, we
have to keep in mind, more representation of respondents from deprived communities such as SC
and ST.When disaggregated (by social group, high burden or not, standard of living, KBK district type,
and literacy level, CPR for any modern method ranged from 27.2% to 39.2%, and CPR for any
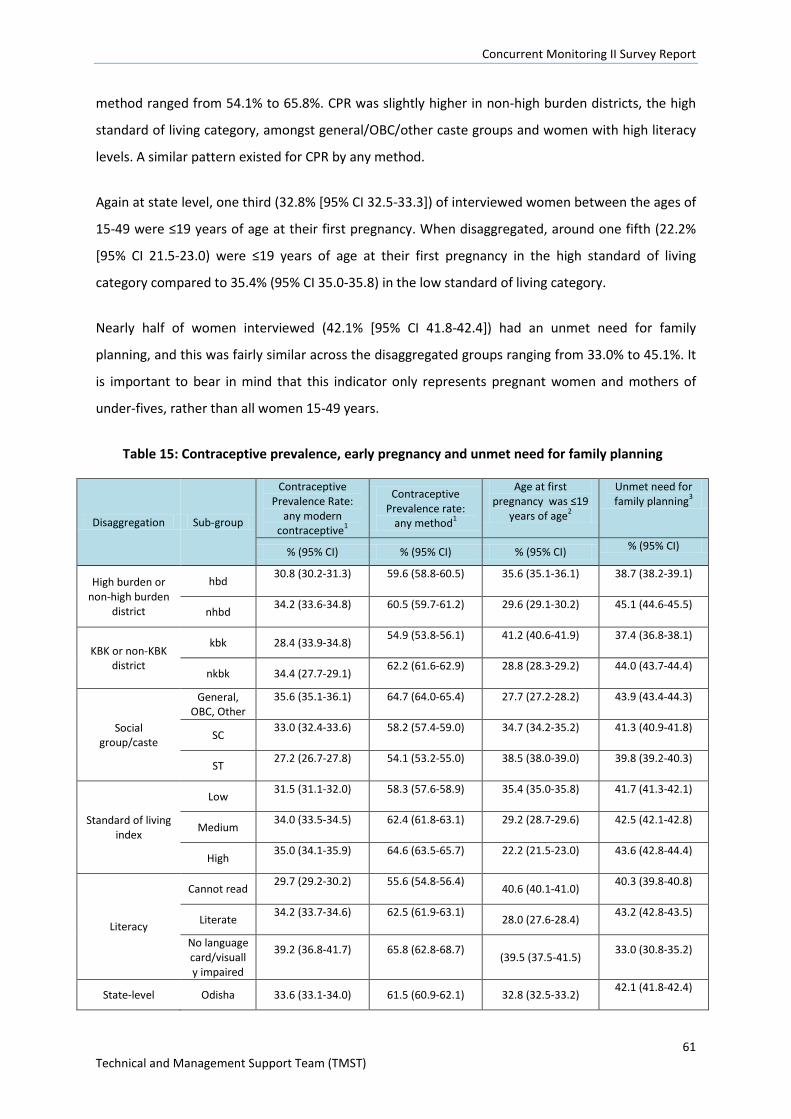
Concurrent Monitoring II Survey Report
61 Technical and Management Support Team (TMST)
method ranged from 54.1% to 65.8%. CPR was slightly higher in non-high burden districts, the high
standard of living category, amongst general/OBC/other caste groups and women with high literacy
levels. A similar pattern existed for CPR by any method.
Again at state level, one third (32.8% [95% CI 32.5-33.3]) of interviewed women between the ages of
15-49 were ≤19 years of age at their first pregnancy. When disaggregated, around one fifth (22.2%
[95% CI 21.5-23.0) were ≤19 years of age at their first pregnancy in the high standard of living
category compared to 35.4% (95% CI 35.0-35.8) in the low standard of living category.
Nearly half of women interviewed (42.1% [95% CI 41.8-42.4]) had an unmet need for family
planning, and this was fairly similar across the disaggregated groups ranging from 33.0% to 45.1%. It
is important to bear in mind that this indicator only represents pregnant women and mothers of
under-fives, rather than all women 15-49 years.
Table 15: Contraceptive prevalence, early pregnancy and unmet need for family planning
Disaggregation Sub-group
Contraceptive Prevalence Rate:
any modern contraceptive1
Contraceptive Prevalence rate:
any method1
Age at first pregnancy was ≤19
years of age2
Unmet need for family planning3
% (95% CI) % (95% CI) % (95% CI) % (95% CI)
High burden or non-high burden
district
hbd 30.8 (30.2-31.3) 59.6 (58.8-60.5) 35.6 (35.1-36.1) 38.7 (38.2-39.1)
nhbd 34.2 (33.6-34.8) 60.5 (59.7-61.2) 29.6 (29.1-30.2) 45.1 (44.6-45.5)
KBK or non-KBK district
kbk 28.4 (33.9-34.8) 54.9 (53.8-56.1) 41.2 (40.6-41.9) 37.4 (36.8-38.1)
nkbk 34.4 (27.7-29.1) 62.2 (61.6-62.9) 28.8 (28.3-29.2) 44.0 (43.7-44.4)
Social group/caste
General, OBC, Other
35.6 (35.1-36.1) 64.7 (64.0-65.4) 27.7 (27.2-28.2) 43.9 (43.4-44.3)
SC 33.0 (32.4-33.6) 58.2 (57.4-59.0) 34.7 (34.2-35.2) 41.3 (40.9-41.8)
ST 27.2 (26.7-27.8) 54.1 (53.2-55.0) 38.5 (38.0-39.0) 39.8 (39.2-40.3)
Standard of living index
Low 31.5 (31.1-32.0) 58.3 (57.6-58.9) 35.4 (35.0-35.8) 41.7 (41.3-42.1)
Medium 34.0 (33.5-34.5) 62.4 (61.8-63.1) 29.2 (28.7-29.6) 42.5 (42.1-42.8)
High 35.0 (34.1-35.9) 64.6 (63.5-65.7) 22.2 (21.5-23.0) 43.6 (42.8-44.4)
Literacy
Cannot read 29.7 (29.2-30.2) 55.6 (54.8-56.4)
40.6 (40.1-41.0) 40.3 (39.8-40.8)
Literate 34.2 (33.7-34.6) 62.5 (61.9-63.1)
28.0 (27.6-28.4) 43.2 (42.8-43.5)
No language card/visually impaired
39.2 (36.8-41.7) 65.8 (62.8-68.7) (39.5 (37.5-41.5)
33.0 (30.8-35.2)
State-level Odisha 33.6 (33.1-34.0) 61.5 (60.9-62.1) 32.8 (32.5-33.2) 42.1 (41.8-42.4)
Concurrent Monitoring II Survey Report
62 Technical and Management Support Team (TMST)
9. Pregnancy
9.1. Respondents, survey questions and indicator definitions
Respondents:Women with a child under-two years of age were the main respondents for this
section of the survey and they reported on their last pregnancy. We wanted to minimise memory
recall problems so did not ask mothers of 3-5 year olds about their last pregnancy. We asked all
married women 15-49 about pregnancy related knowledge.
Survey questions:Mothers of children under-two were asked to provide information on antenatal
care checks from their mother-child protection (MCP) cards. Information focused on the number of
ANC checks, and key services received including blood tests for anaemia and subsequent diagnoses.
If the MCP card was unavailable we asked women to provide verbal accounts. It was noted during
field work that often MCP cards were incompletely filled in, or totally blank and in most of the cases
the cards were retained by ASHA’s rather than the respondents. If a card was totally blank we
reverted to maternal report. Due to missing MCP card data most of our ANC data reporting is
restricted to verbal report only, except for: diagnosis of anaemia, privacy and comfort indicators,
and the location of last ANC check.
We further asked mothers of children <2 and currently pregnant women to provide details of any
interactions with frontline health workers e.g. whether a birthplan had been made for them. We
also asked mothers of <2s about the location of their last ANC check, and whether their privacy and
comfort was attended to.
We asked all married women 15-49 whether they were able to name any danger signs in pregnancy.
This is an indicator we might expect to see improving in areas exposed to the Shakti Varta
intervention.
We wereinterested in assessing enrolment and fulfilment of a conditional cash transfer scheme –
MAMATA – which is verified and recorded on the MCP card. These questions focused on currently
pregnant women and mothers of children <2 years. The results of this particular component of the
survey have been calculated by another agency – Weststat engaged for the evaluation of MAMATA
scheme.
Tables 16 and 17 provide details about pregnancy and ANC related indicators.
Table 16: Indicator definitions and computation for ANC practice indicators
Indicator Definition Computation
Concurrent Monitoring II Survey Report
63 Technical and Management Support Team (TMST)
Table 16: Indicator definitions and computation for ANC practice indicators
Indicator Definition Computation Number of ANC visits and components of discrete ANC components % women with a child <2 years who had at least 3 ANC check –ups in their last pregnancy
Previous guidelines for India recommended at least three ante-natal checks32; 3ANC was calculated in CCM II to assess how coverage may have changed since the NFHS-3.
Number of women with a child <2 years who had ≥3 ANC checks in their last pregnancy /all women with a child <2 years *100
% women with a child <2 years who had at least 4 ANC check –ups in their last pregnancy
The WHO recommends at least 4ANC checks33; this standard has recently been adopted in India.
Number of women with a child <2 years who had ≥4 ANC checks in their last pregnancy /all women with a child <2 years *100
% women with a child <2 years who received at least 90 IFA tablets/3 months of IFA syrup in their last pregnancy
2005 guidelines for India recommend consumption of at least 90 Iron Folic Acid tablets or 3 months of IFA syrup in pregnancy34; this indicator refers to receipt of an appropriate IFA provision by women in their last pregnancy
Number of women with a child <2 years who received ≥90 IFA tablets/3 months of IFA syrup in their last pregnancy /all women with a child <2 years *100
% women with a child <2 years who consumed at least 90 IFA tablets/3 months of IFA syrup in their last pregnancy
This indicator refers to consumption of at least 90 IFA tablets or 3 months of IFA syrup by women in their last pregnancy, in line with 2005 recommendations for India.
Number of women with a child <2 years who consumed ≥90 IFA tablets/3 months of IFA syrup in their last pregnancy /all women with a child <2 years *100
% women with a child <2 years who had their haemoglobin tested in their last pregnancy
Haemoglobin testing is a routine ANC component used to check for anaemia.
Number of women with a child <2 years who had their haemoglobin tested in their last pregnancy /all women with a child <2 years *100
% women with a child <2 years who were diagnosed with anaemia (mild, moderate or severe) in their last pregnancy
Women who had their haemoglobin tested reported either: no anaemia, mild, moderate or severe anaemia.Formal Hb units (g/dl) were not reported.
Number of women with a child <2 years who had their haemoglobin tested and were diagnosed as anaemic /all women with a child <2 years who had their haemoglobin tested in their last pregnancy *100
% women with a child <2 years who received at least 2 TT injections in their last pregnancy
WHO 2006 guidelines recommend that pregnant women are immunised against tetanus, requiring two injections35
Number of women with a child <2 years who had at least 2 TT injections in their last pregnancy /all women with a child <2 years *100
Table 17: Indicator definitions and computation for other ANC indicators and knowledge
Indicator Definition Computation Support from FLWs, location and quality of antenatal care % currently pregnant WHO 2006 guidelines recommend that Number of currently pregnant
32Maternal Health Division. Guidelines for Antenatal Care and Skilled Attendance at Birth by ANMs and LHVs. New Delhi: Maternal Health Division, Department of Family Welfare, Ministry of Health & Family Welfare, Government of India; 2005. 33 http://www.who.int/gho/urban_health/services/antenatal_care_text/en/ 34Maternal Health Division. Guidelines for Antenatal Care and Skilled Attendance at Birth by ANMs and LHVs. New Delhi: Maternal Health Division, Department of Family Welfare, Ministry of Health & Family Welfare, Government of India; 2005. 35 http://www.who.int/reproductivehealth/publications/maternal_perinatal_health/effective_antenatal_care.pdf
Concurrent Monitoring II Survey Report
64 Technical and Management Support Team (TMST)
Table 17: Indicator definitions and computation for other ANC indicators and knowledge
Indicator Definition Computation women and women with a child <2 years with a birth plan developed by an ASHA or ANM in their current or last pregnancy
women have a birth plan in place by 37 weeks of pregnancy36. Due to missing MCP card data we were not able to differentiate between women <37 weeks and ≥37 weeks pregnant, hence our indicator could underestimate birth plan coverage slightly. As mothers of <2s account for the majority of respondents for this indicator any underestimation is likely to be small.
women and women with a child <2 years who had a birth plan developed by an ANM or ASHA in their current or last pregnancy /all currently pregnant women and women with a child <2 years *100
Location of last ANC check-up (women with a child <2 years; various locations)
ANC locations included: - ANM sub-centre - AWC / MAMATA Diwas - District hospital - CHC - Private hospital or clinic - Other
Number of women with children <2 years who attended a given ANC location in their last pregnancy (most recent visit only) / all women with children <2 years *100
% of women with a child <2 years who were provided with a bed/examination table at their last ANC check up
WHO 2006 guidelines recommend that ANC is conducted in a suitable environment that ensures privacy37
Number of women with children <2 years who were provided with a bed/examination table at their last ANC check up / all women with children <2 years *100
% of women with a child <2 years who were provided with a curtain to protect their privacyat their last ANC check up
WHO 2006 guidelines recommend that ANC is conducted in a suitable environment that ensures privacy38
Number of women with children <2 years who were provided with a curtain /examination table at their last ANC check up / all women with children <2 years *100
Knowledge of danger signs in pregnancy % of women 15-49 years who know three key danger signs in pregnancy: severe vaginal bleeding, swollen legs /face, blurred vision
- Women 15-49 includes: currently pregnant, child <5 years, pregnancy outcome in the ref period, and married adolescent girls 15-19 years who are not pregnant, no pregnancy outcome or child)
- Danger signs indicate serious complications and were drawn from Jhpiego reference material39
Number of women 15-49 years able to name three danger signs in pregnancy / all women 15-49 years * 100
9.2. Indicator estimates
9.2.1. ANC location
The majority (34.4% [95% CI 33.8-35.1])) of ANC check-ups took place at the Community Health
Centres (CHC). Aside from women who reported ‘other’ for the location of their ANC check, fewest
check-ups took place at district hospitals (11.1% [95% CI 10.7-11.5]) (see Figure 20) 36 http://www.who.int/reproductivehealth/publications/maternal_perinatal_health/effective_antenatal_care.pdf 37 http://www.who.int/reproductivehealth/publications/maternal_perinatal_health/effective_antenatal_care.pdf 38 http://www.who.int/reproductivehealth/publications/maternal_perinatal_health/effective_antenatal_care.pdf 39JHPIEGO. Monitoring birth preparedness and complication readiness: tools and Indicators for maternal and newborn health. Baltimore: JHPIEGO; 2004.
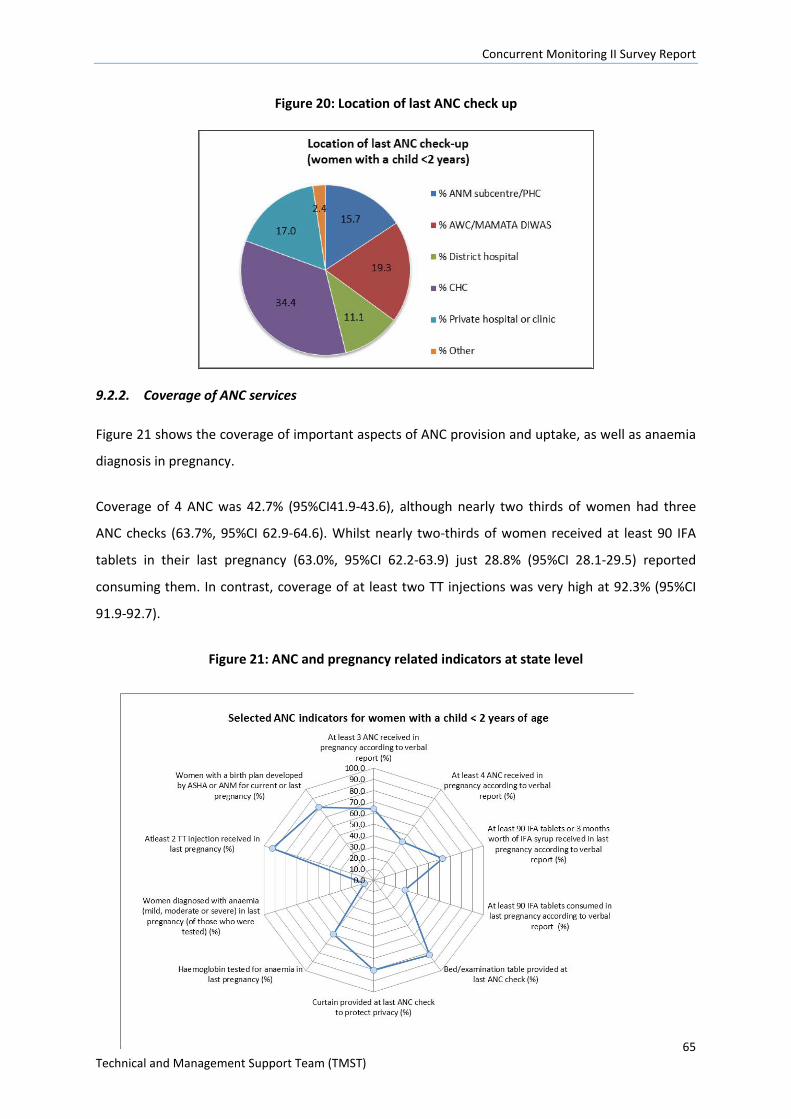
Concurrent Monitoring II Survey Report
65 Technical and Management Support Team (TMST)
Figure 20: Location of last ANC check up
9.2.2. Coverage of ANC services
Figure 21 shows the coverage of important aspects of ANC provision and uptake, as well as anaemia
diagnosis in pregnancy.
Coverage of 4 ANC was 42.7% (95%CI41.9-43.6), although nearly two thirds of women had three
ANC checks (63.7%, 95%CI 62.9-64.6). Whilst nearly two-thirds of women received at least 90 IFA
tablets in their last pregnancy (63.0%, 95%CI 62.2-63.9) just 28.8% (95%CI 28.1-29.5) reported
consuming them. In contrast, coverage of at least two TT injections was very high at 92.3% (95%CI
91.9-92.7).
Figure 21: ANC and pregnancy related indicators at state level
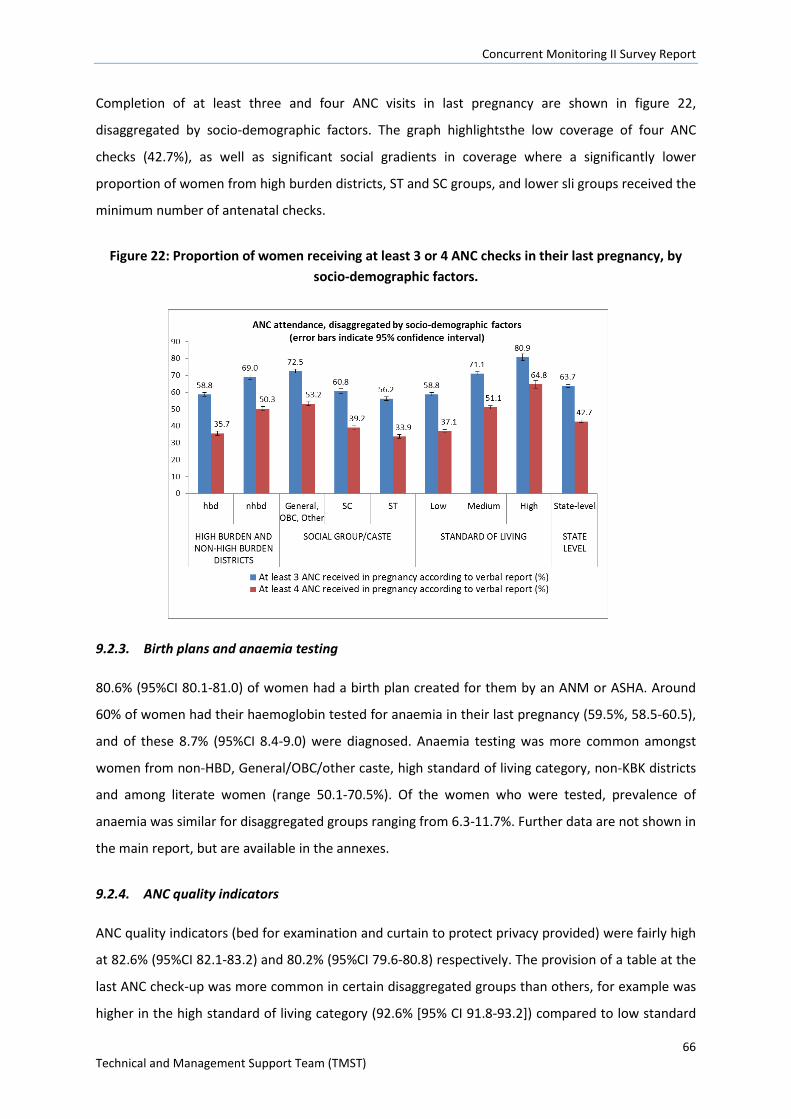
Concurrent Monitoring II Survey Report
66 Technical and Management Support Team (TMST)
Completion of at least three and four ANC visits in last pregnancy are shown in figure 22,
disaggregated by socio-demographic factors. The graph highlightsthe low coverage of four ANC
checks (42.7%), as well as significant social gradients in coverage where a significantly lower
proportion of women from high burden districts, ST and SC groups, and lower sli groups received the
minimum number of antenatal checks.
Figure 22: Proportion of women receiving at least 3 or 4 ANC checks in their last pregnancy, by socio-demographic factors.
9.2.3. Birth plans and anaemia testing
80.6% (95%CI 80.1-81.0) of women had a birth plan created for them by an ANM or ASHA. Around
60% of women had their haemoglobin tested for anaemia in their last pregnancy (59.5%, 58.5-60.5),
and of these 8.7% (95%CI 8.4-9.0) were diagnosed. Anaemia testing was more common amongst
women from non-HBD, General/OBC/other caste, high standard of living category, non-KBK districts
and among literate women (range 50.1-70.5%). Of the women who were tested, prevalence of
anaemia was similar for disaggregated groups ranging from 6.3-11.7%. Further data are not shown in
the main report, but are available in the annexes.
9.2.4. ANC quality indicators
ANC quality indicators (bed for examination and curtain to protect privacy provided) were fairly high
at 82.6% (95%CI 82.1-83.2) and 80.2% (95%CI 79.6-80.8) respectively. The provision of a table at the
last ANC check-up was more common in certain disaggregated groups than others, for example was
higher in the high standard of living category (92.6% [95% CI 91.8-93.2]) compared to low standard
Concurrent Monitoring II Survey Report
67 Technical and Management Support Team (TMST)
of loving category (79.9% [95% CI 79.3-80.5]), and higher in the non-HBD (88.5% [95% CI 87.9-89.0])
compared to HBD category (76.3% [795% CI 75.4-77.2]). Similar differences were found in the
general/OBC/other cast group compared to ST and SC groups, non-KBK compare to KBK districts and
among literate compared to illiterate women. Similar results were found for curtain provision at the
last ANC check-up. Further data are not shown in the main report, but are available in the annexes.
9.2.5. Knowledge of danger signs in pregnancy
Women’s reported knowledge of danger signs during pregnancy was extremely low and only 1.7%
(95% CI 1.6-1.8) of women knew three key danger signs during pregnancy (severe vaginal bleeding,
swollen hands/face, blurred vision). Results were similar across all disaggregated groups.Further
data are not shown in the main report, but are available in the annexes.
10. Delivery and PNC
10.1. Respondents, questions and indicator definitions
Respondents:The majority of respondents for this section of the survey were women who gave birth
in the reference period (1st January 2013-31st December 2013). Questions about delivery and
postnatal care for women included women whose child had subsequently died, as well as those
whose child was alive on the date of survey.We asked all women 15-49 years about their knowledge
of danger signs during labour and in the post-partum period.
Survey questions:Women who had given birth in the reference period provided the following
information on the delivery: location (facility or home), presence of a skilled birth attendant
(including for home deliveries only). For institutional deliveries only: distance travelled and time
taken to get there, transport (costs incurred, use of the Janani express), use of the JSY scheme,
information about caesarean sections (emergency and elective). Data on postnatal checks provided
by frontline workers within 48 hours, and 2-7 days post-partum was collected from all women giving
birth in the reference period.
Table 18: Indicator definitions and computation for delivery and PNC
Indicator Definition Computation % of women giving birth in an institution
- Institutions include: hospitals, PHCs, CHCs and ANM sub-centres
- Respondents were women with a pregnancy outcome in the reference period
Number of women who gave birth in an institution in the reference period/all women who gave birth in the reference period * 100
% of women giving birth in the presence of a skilled birth attendant (SBA)
- Skilled birth attendants include: Dr, nurse or ANM
- SBA was assumed if a woman had
Number of women giving birth in the presence of an SBA in the reference period /all women giving birth in the
Concurrent Monitoring II Survey Report
68 Technical and Management Support Team (TMST)
Table 18: Indicator definitions and computation for delivery and PNC
Indicator Definition Computation given birth in an institution reference period *100
% of women giving birth in the presence of a skilled birth attendant (home deliveries only)
- Skilled birth attendants include: Dr, nurse or ANM
Number of women giving birth at home in the presence of an SBA in the reference period /all women giving birth at home in the reference period *100
% of women delivering in an institution (in the reference period 2013) where time taken to reach facility was 30 minutes or longer
- 30 minutes or more is a commonly used threshold to define poor access to services e.g. 40
Number of women delivering in an institution in the reference period where time taken to reach facility was 30 minutes or longer/all women giving birth in an institution in the reference period *100
% of women delivering in an institution (in the reference period 2013) where distance travelled to reach facility was 5K or more
- 5K or more to reach a facility is a commonly used threshold to define poor access to services e.g.41
Number of women delivering in an institution in the reference period where distance travelled to reach facility was 5K or more /all women giving birth in an institution in the reference period *100
Caesarean section rate - Denominator is women who gave birth in the reference period
- C-sections includes emergency and elective
Number of women who gave birth in the reference period and had a c-section / all women who gave birth in the reference period*100
% of women receiving a postnatal check within 24 hours of delivery
- Denominator is women who gave birth in the reference period
- There were no restrictions on who could give the PNC check
Number of women who gave birth in the reference period who received a postnatal check within 24 hours of delivery / all women who gave birth in the reference period *100.
% of women 15-49 who know 4 key danger signs during labour: severe vaginal bleeding, prolonged labour, convulsions, retained placenta
- Women 15-49 includes: currently pregnant, child <5 years, pregnancy outcome in the ref period, and married adolescent girls 15-19 years who are not pregnant, no pregnancy outcome or child)
- Danger signs indicate serious complications and were drawn from Jhpiego reference material42
Number of women 15-49 years able to name four key danger signs in labour / all women 15-49 years * 100
% of women 15-49 who know 3 key danger signs for women during the postpartum period: severe vaginal bleeding, foul smelling discharge, high fever
Number of women 15-49 years able to name three key danger signs in for women during the post-partum period / all women 15-49 years * 100
10.2. Indicator estimates
10.2.1. Institutional delivery
At state level the prevalence of institutional delivery was high at 82.1% (95% CI 81.5-82.6), however
this varied when disaggregated (table 19 below). In non-high burden districts for example, the
prevalence of institutional delivery was 90.1% (95% CI 89.7-90.6), compared to 73.4% (95% CI 72.4-
40http://www.who.int/bulletin/volumes/87/3/08-052175/en/ 41http://bmjopen.bmj.com/content/2/4/e001196.full.pdf 42JHPIEGO. Monitoring birth preparedness and complication readiness: tools and Indicators for maternal and newborn health. Baltimore: JHPIEGO; 2004.
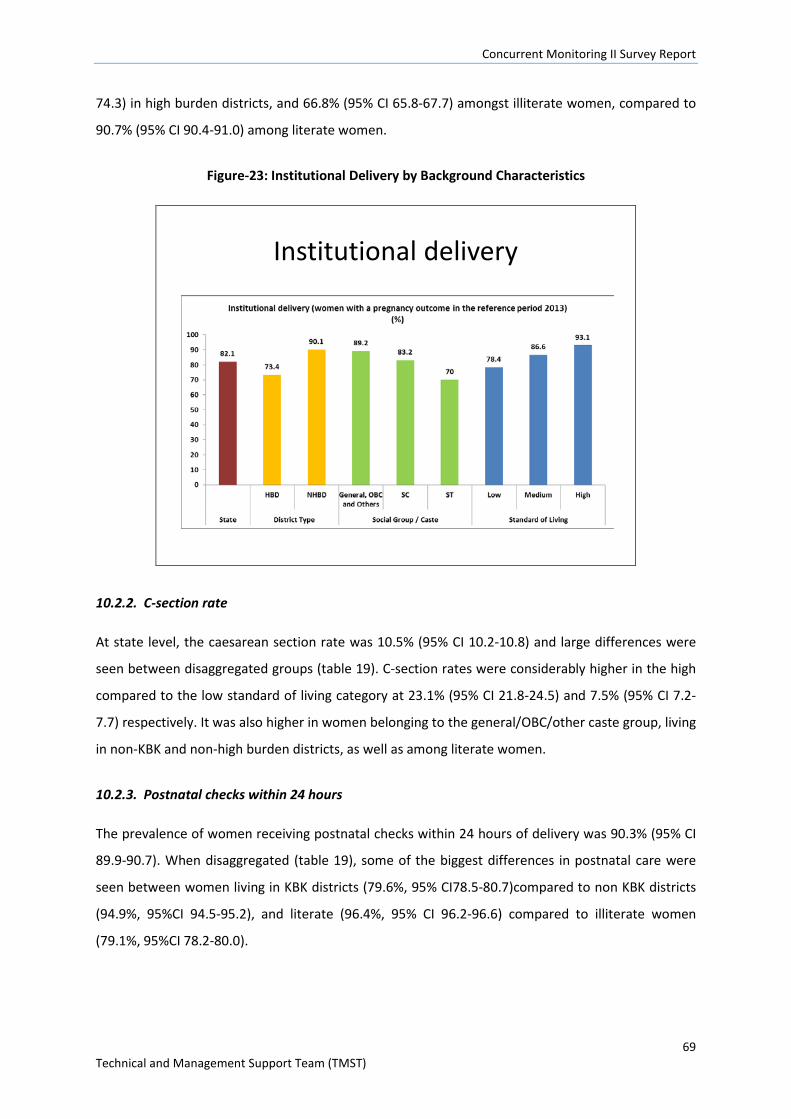
Concurrent Monitoring II Survey Report
69 Technical and Management Support Team (TMST)
74.3) in high burden districts, and 66.8% (95% CI 65.8-67.7) amongst illiterate women, compared to
90.7% (95% CI 90.4-91.0) among literate women.
Figure-23: Institutional Delivery by Background Characteristics
Institutional delivery
10.2.2. C-section rate
At state level, the caesarean section rate was 10.5% (95% CI 10.2-10.8) and large differences were
seen between disaggregated groups (table 19). C-section rates were considerably higher in the high
compared to the low standard of living category at 23.1% (95% CI 21.8-24.5) and 7.5% (95% CI 7.2-
7.7) respectively. It was also higher in women belonging to the general/OBC/other caste group, living
in non-KBK and non-high burden districts, as well as among literate women.
10.2.3. Postnatal checks within 24 hours
The prevalence of women receiving postnatal checks within 24 hours of delivery was 90.3% (95% CI
89.9-90.7). When disaggregated (table 19), some of the biggest differences in postnatal care were
seen between women living in KBK districts (79.6%, 95% CI78.5-80.7)compared to non KBK districts
(94.9%, 95%CI 94.5-95.2), and literate (96.4%, 95% CI 96.2-96.6) compared to illiterate women
(79.1%, 95%CI 78.2-80.0).
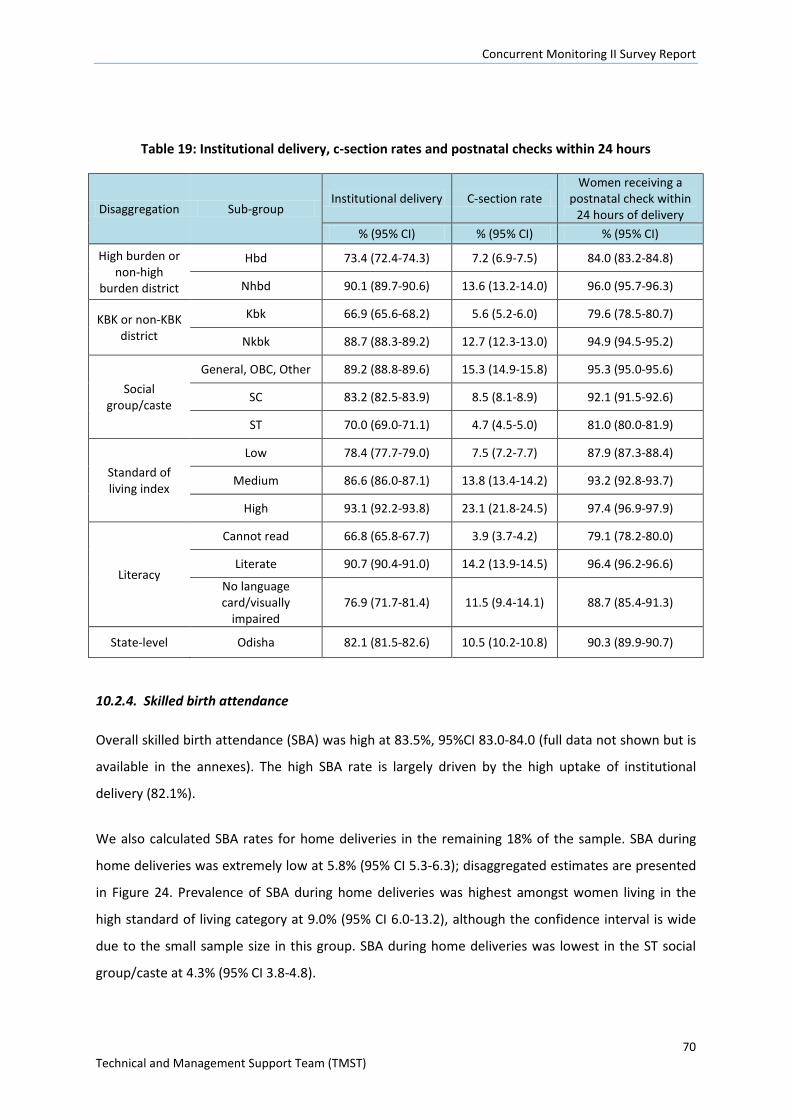
Concurrent Monitoring II Survey Report
70 Technical and Management Support Team (TMST)
Table 19: Institutional delivery, c-section rates and postnatal checks within 24 hours
Disaggregation Sub-group Institutional delivery C-section rate
Women receiving a postnatal check within
24 hours of delivery % (95% CI) % (95% CI) % (95% CI)
High burden or non-high
burden district
Hbd 73.4 (72.4-74.3) 7.2 (6.9-7.5) 84.0 (83.2-84.8)
Nhbd 90.1 (89.7-90.6) 13.6 (13.2-14.0) 96.0 (95.7-96.3)
KBK or non-KBK district
Kbk 66.9 (65.6-68.2) 5.6 (5.2-6.0) 79.6 (78.5-80.7)
Nkbk 88.7 (88.3-89.2) 12.7 (12.3-13.0) 94.9 (94.5-95.2)
Social group/caste
General, OBC, Other 89.2 (88.8-89.6) 15.3 (14.9-15.8) 95.3 (95.0-95.6)
SC 83.2 (82.5-83.9) 8.5 (8.1-8.9) 92.1 (91.5-92.6)
ST 70.0 (69.0-71.1) 4.7 (4.5-5.0) 81.0 (80.0-81.9)
Standard of living index
Low 78.4 (77.7-79.0) 7.5 (7.2-7.7) 87.9 (87.3-88.4)
Medium 86.6 (86.0-87.1) 13.8 (13.4-14.2) 93.2 (92.8-93.7)
High 93.1 (92.2-93.8) 23.1 (21.8-24.5) 97.4 (96.9-97.9)
Literacy
Cannot read 66.8 (65.8-67.7) 3.9 (3.7-4.2) 79.1 (78.2-80.0)
Literate 90.7 (90.4-91.0) 14.2 (13.9-14.5) 96.4 (96.2-96.6)
No language card/visually
impaired 76.9 (71.7-81.4) 11.5 (9.4-14.1) 88.7 (85.4-91.3)
State-level Odisha 82.1 (81.5-82.6) 10.5 (10.2-10.8) 90.3 (89.9-90.7)
10.2.4. Skilled birth attendance
Overall skilled birth attendance (SBA) was high at 83.5%, 95%CI 83.0-84.0 (full data not shown but is
available in the annexes). The high SBA rate is largely driven by the high uptake of institutional
delivery (82.1%).
We also calculated SBA rates for home deliveries in the remaining 18% of the sample. SBA during
home deliveries was extremely low at 5.8% (95% CI 5.3-6.3); disaggregated estimates are presented
in Figure 24. Prevalence of SBA during home deliveries was highest amongst women living in the
high standard of living category at 9.0% (95% CI 6.0-13.2), although the confidence interval is wide
due to the small sample size in this group. SBA during home deliveries was lowest in the ST social
group/caste at 4.3% (95% CI 3.8-4.8).
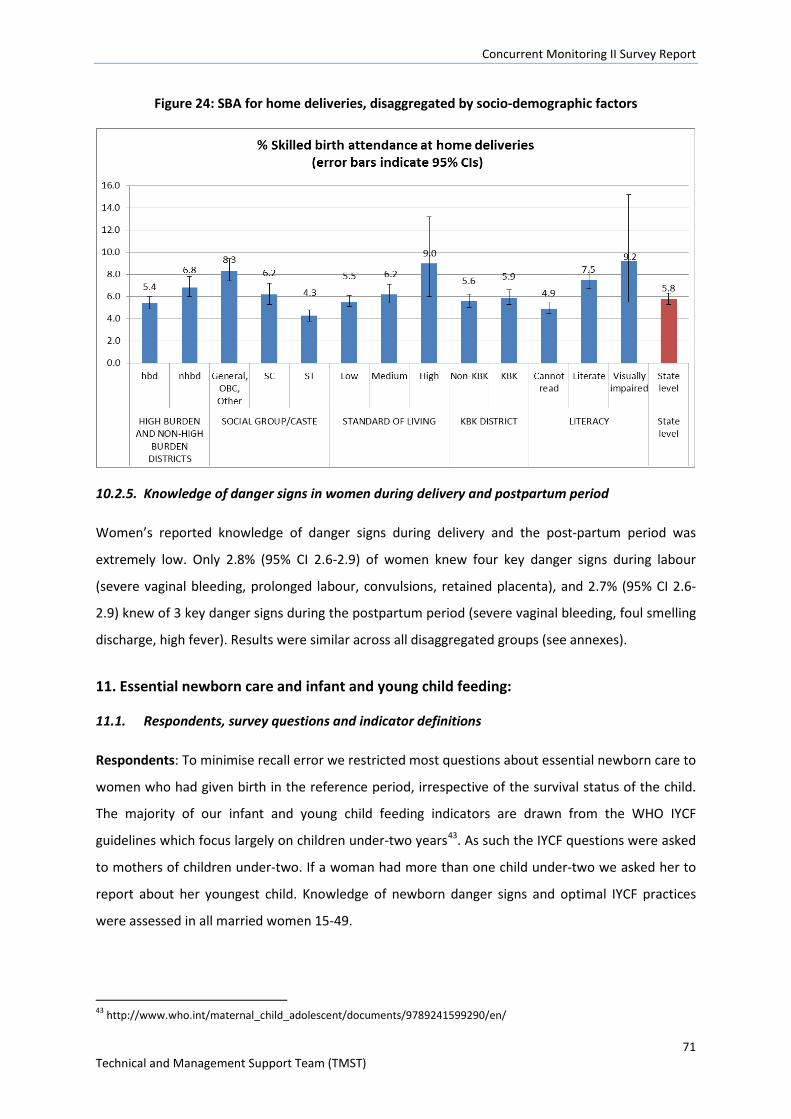
Concurrent Monitoring II Survey Report
71 Technical and Management Support Team (TMST)
Figure 24: SBA for home deliveries, disaggregated by socio-demographic factors
10.2.5. Knowledge of danger signs in women during delivery and postpartum period
Women’s reported knowledge of danger signs during delivery and the post-partum period was
extremely low. Only 2.8% (95% CI 2.6-2.9) of women knew four key danger signs during labour
(severe vaginal bleeding, prolonged labour, convulsions, retained placenta), and 2.7% (95% CI 2.6-
2.9) knew of 3 key danger signs during the postpartum period (severe vaginal bleeding, foul smelling
discharge, high fever). Results were similar across all disaggregated groups (see annexes).
11. Essential newborn care and infant and young child feeding:
11.1. Respondents, survey questions and indicator definitions
Respondents: To minimise recall error we restricted most questions about essential newborn care to
women who had given birth in the reference period, irrespective of the survival status of the child.
The majority of our infant and young child feeding indicators are drawn from the WHO IYCF
guidelines which focus largely on children under-two years43. As such the IYCF questions were asked
to mothers of children under-two. If a woman had more than one child under-two we asked her to
report about her youngest child. Knowledge of newborn danger signs and optimal IYCF practices
were assessed in all married women 15-49.
43 http://www.who.int/maternal_child_adolescent/documents/9789241599290/en/
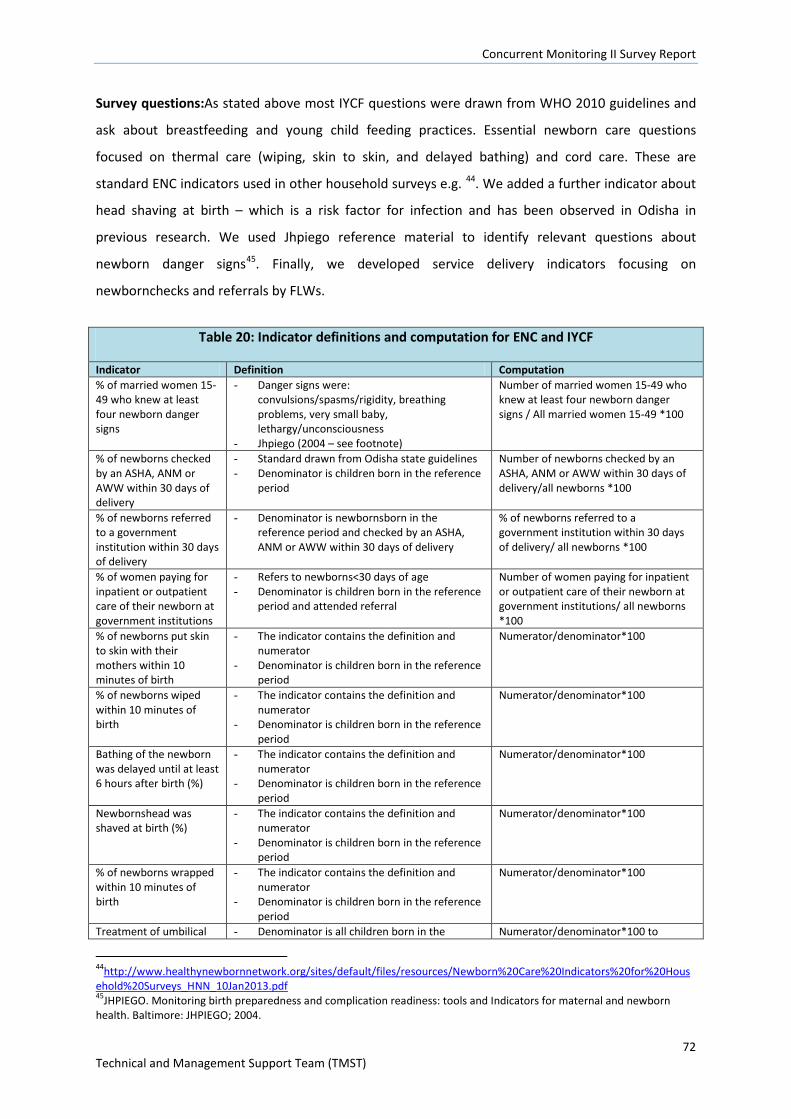
Concurrent Monitoring II Survey Report
72 Technical and Management Support Team (TMST)
Survey questions:As stated above most IYCF questions were drawn from WHO 2010 guidelines and
ask about breastfeeding and young child feeding practices. Essential newborn care questions
focused on thermal care (wiping, skin to skin, and delayed bathing) and cord care. These are
standard ENC indicators used in other household surveys e.g. 44. We added a further indicator about
head shaving at birth – which is a risk factor for infection and has been observed in Odisha in
previous research. We used Jhpiego reference material to identify relevant questions about
newborn danger signs45. Finally, we developed service delivery indicators focusing on
newbornchecks and referrals by FLWs.
Table 20: Indicator definitions and computation for ENC and IYCF
Indicator Definition Computation % of married women 15-49 who knew at least four newborn danger signs
- Danger signs were: convulsions/spasms/rigidity, breathing problems, very small baby, lethargy/unconsciousness
- Jhpiego (2004 – see footnote)
Number of married women 15-49 who knew at least four newborn danger signs / All married women 15-49 *100
% of newborns checked by an ASHA, ANM or AWW within 30 days of delivery
- Standard drawn from Odisha state guidelines - Denominator is children born in the reference
period
Number of newborns checked by an ASHA, ANM or AWW within 30 days of delivery/all newborns *100
% of newborns referred to a government institution within 30 days of delivery
- Denominator is newbornsborn in the reference period and checked by an ASHA, ANM or AWW within 30 days of delivery
% of newborns referred to a government institution within 30 days of delivery/ all newborns *100
% of women paying for inpatient or outpatient care of their newborn at government institutions
- Refers to newborns<30 days of age - Denominator is children born in the reference
period and attended referral
Number of women paying for inpatient or outpatient care of their newborn at government institutions/ all newborns *100
% of newborns put skin to skin with their mothers within 10 minutes of birth
- The indicator contains the definition and numerator
- Denominator is children born in the reference period
Numerator/denominator*100
% of newborns wiped within 10 minutes of birth
- The indicator contains the definition and numerator
- Denominator is children born in the reference period
Numerator/denominator*100
Bathing of the newborn was delayed until at least 6 hours after birth (%)
- The indicator contains the definition and numerator
- Denominator is children born in the reference period
Numerator/denominator*100
Newbornshead was shaved at birth (%)
- The indicator contains the definition and numerator
- Denominator is children born in the reference period
Numerator/denominator*100
% of newborns wrapped within 10 minutes of birth
- The indicator contains the definition and numerator
- Denominator is children born in the reference period
Numerator/denominator*100
Treatment of umbilical - Denominator is all children born in the Numerator/denominator*100 to
44http://www.healthynewbornnetwork.org/sites/default/files/resources/Newborn%20Care%20Indicators%20for%20Household%20Surveys_HNN_10Jan2013.pdf 45JHPIEGO. Monitoring birth preparedness and complication readiness: tools and Indicators for maternal and newborn health. Baltimore: JHPIEGO; 2004.
Concurrent Monitoring II Survey Report
73 Technical and Management Support Team (TMST)
Table 20: Indicator definitions and computation for ENC and IYCF
Indicator Definition Computation cord (%) reference period
- Response options: no treatment, antiseptic, other substance
provide prevalence for three possible cord care outcomes
% of infants breastfed within 1 hour of birth
- The indicator contains the definition - Denominator is all children <2 years
Numerator/denominator*100
% of infants under-six months exclusively breastfed
- Denominator is all children 0-5.99 months - Numerator is children who only consumed
breastmilk the previous day
Numerator/denominator*100
Continued breastfeeding at one year (%)
- Denominator is all children 12-15.99 months - Numerator is children 12-15.99 months
who received breastmilk the previous day
Numerator/denominator*100
Introduction of solid, semi-solid and soft food at 6-8.99 months (%)
- Denominator is all children 6-8.99 months - Numerator is all children 6-8.99 months
who consumed solid/semi-solid/soft food the previous day
Numerator/denominator*100
Minimum meal frequency in children 6-23.99 months (%)
- Denominator is all children 6-23.99 months - Numerator is children 6-23.99 months - consuming solid, semi-solid or soft foods the
minimum number of times the previous day; includes milk feeds for non-breastfed children
Numerator/denominator*100
Minimum dietary diversity in children 6-23.99 months (%)
- Denominator is all children 6-23.99 months - Numerator is children 6-23.99 months
consuming foods from at least 4 food groups the previous day
Numerator/denominator*100
Minimum acceptable diet in children 6-23.99 months (%)
- Denominator is all children 6-23.99 months - Numerator is all children 6-23.99 months who
receive a minimum acceptable diet (apart from breastmilk)-derived from dietary diversity and feeding frequency indicators.
Numerator/denominator*100
IYCF knowledge questions for married women 15-49
- When to first initiate breastfeeding, - Ideal duration of exclusive breastfeeding - If colostrum should be fed - When to introduce solid/semi-solid/soft food
Numerator/denominator*100
11.2. Indicator estimates
11.2.1. Knowledge of newborn danger signs
Overall, only 2.0% (95% CI 1.9-2.2) of women 15-49 knew of four key danger signs for newborns
(convulsions/spasms/rigidity,breathing problems, very small baby, lethargy/unconsciousness).
Results were similar across all disaggregated groups (see annexes).
11.2.2. Essential newborn care practices
Findings for Essential Newborn Care (ENC) practices in rural Odisha are presented in figure 25.
Around half of newborns (52.7% [95% CI 52.1-53.3]) were checked by an ASHA, ANM, or AWW
within 30 days of delivery, and this was similar across the disaggregated groups. Similarly, 58.8%
[95% CI 58.0-59.7] of newborns were referred to a government facility by an ASHA, ANM or AWW
within 30 days of delivery.Inpatient/outpatient payments to government health institutions were
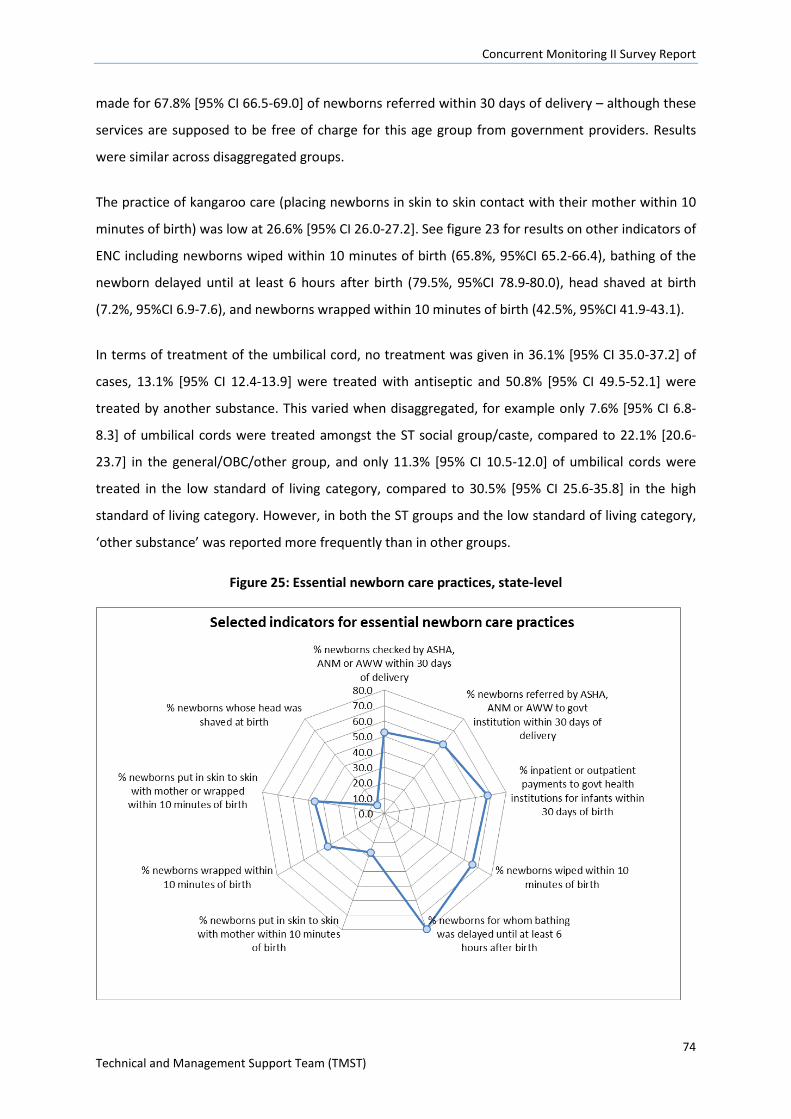
Concurrent Monitoring II Survey Report
74 Technical and Management Support Team (TMST)
made for 67.8% [95% CI 66.5-69.0] of newborns referred within 30 days of delivery – although these
services are supposed to be free of charge for this age group from government providers. Results
were similar across disaggregated groups.
The practice of kangaroo care (placing newborns in skin to skin contact with their mother within 10
minutes of birth) was low at 26.6% [95% CI 26.0-27.2]. See figure 23 for results on other indicators of
ENC including newborns wiped within 10 minutes of birth (65.8%, 95%CI 65.2-66.4), bathing of the
newborn delayed until at least 6 hours after birth (79.5%, 95%CI 78.9-80.0), head shaved at birth
(7.2%, 95%CI 6.9-7.6), and newborns wrapped within 10 minutes of birth (42.5%, 95%CI 41.9-43.1).
In terms of treatment of the umbilical cord, no treatment was given in 36.1% [95% CI 35.0-37.2] of
cases, 13.1% [95% CI 12.4-13.9] were treated with antiseptic and 50.8% [95% CI 49.5-52.1] were
treated by another substance. This varied when disaggregated, for example only 7.6% [95% CI 6.8-
8.3] of umbilical cords were treated amongst the ST social group/caste, compared to 22.1% [20.6-
23.7] in the general/OBC/other group, and only 11.3% [95% CI 10.5-12.0] of umbilical cords were
treated in the low standard of living category, compared to 30.5% [95% CI 25.6-35.8] in the high
standard of living category. However, in both the ST groups and the low standard of living category,
‘other substance’ was reported more frequently than in other groups.
Figure 25: Essential newborn care practices, state-level
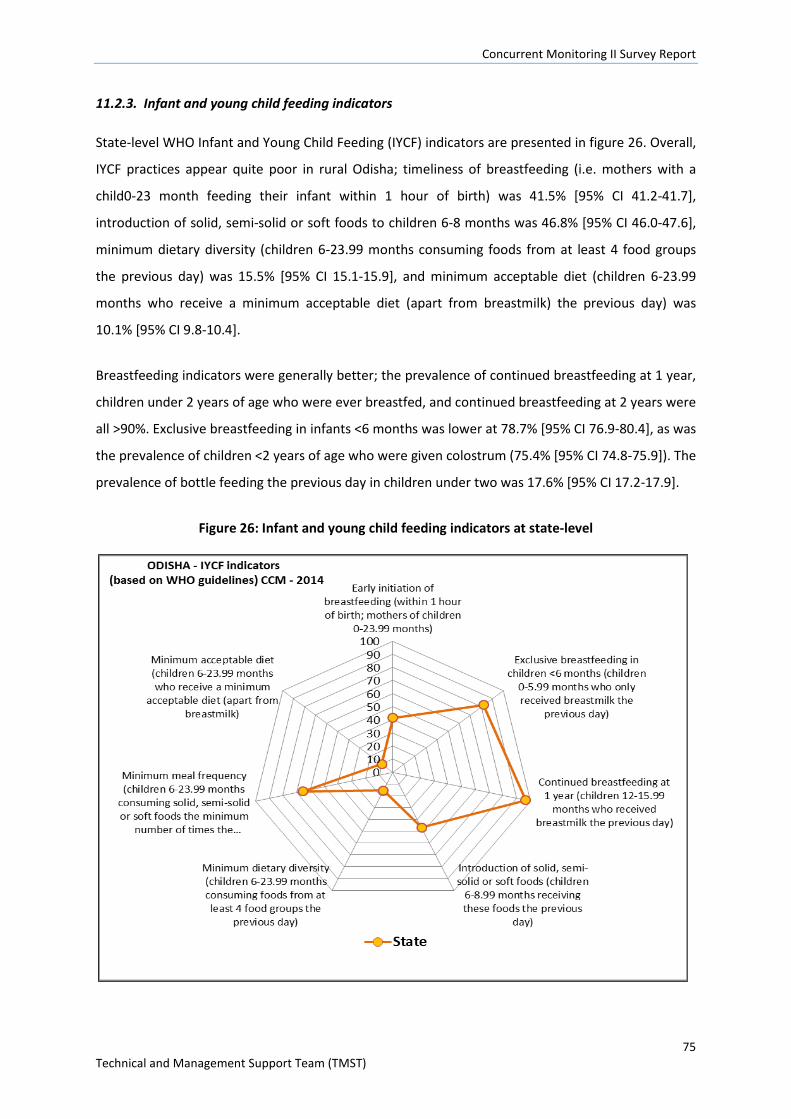
Concurrent Monitoring II Survey Report
75 Technical and Management Support Team (TMST)
11.2.3. Infant and young child feeding indicators
State-level WHO Infant and Young Child Feeding (IYCF) indicators are presented in figure 26. Overall,
IYCF practices appear quite poor in rural Odisha; timeliness of breastfeeding (i.e. mothers with a
child0-23 month feeding their infant within 1 hour of birth) was 41.5% [95% CI 41.2-41.7],
introduction of solid, semi-solid or soft foods to children 6-8 months was 46.8% [95% CI 46.0-47.6],
minimum dietary diversity (children 6-23.99 months consuming foods from at least 4 food groups
the previous day) was 15.5% [95% CI 15.1-15.9], and minimum acceptable diet (children 6-23.99
months who receive a minimum acceptable diet (apart from breastmilk) the previous day) was
10.1% [95% CI 9.8-10.4].
Breastfeeding indicators were generally better; the prevalence of continued breastfeeding at 1 year,
children under 2 years of age who were ever breastfed, and continued breastfeeding at 2 years were
all >90%. Exclusive breastfeeding in infants <6 months was lower at 78.7% [95% CI 76.9-80.4], as was
the prevalence of children <2 years of age who were given colostrum (75.4% [95% CI 74.8-75.9]). The
prevalence of bottle feeding the previous day in children under two was 17.6% [95% CI 17.2-17.9].
Figure 26: Infant and young child feeding indicators at state-level
Concurrent Monitoring II Survey Report
76 Technical and Management Support Team (TMST)
11.2.4. Knowledge of IYCF amongst women 15-49
Knowledge of breastfeeding practices were generally quite high as shown in table 21. In contrast,
awareness that infants should be introduced to solid, semi-solid or soft foods from 6 months was
very low. Results were similar across disaggregated groups e.g. standard of living, high burden or not
(see annexes).
Table 21: IYCF knowledge indicators amongst women 15-49
IYCF Knowledge Indicators % (95% CI)
Women 15-49* who know that infants should be put to the breast within 1 hour of birth 91.0 (90.8-91.2)
Women 15-49* who are aware that infants should only be fed breast milk in the first 6 months of life 93.3 (93.1-93.6)
Women 15-49* who are aware that infants should be fed colostrum 94.1 (93.9-94.3) Women 15-49* who are aware that infants should be introduced to solid, semi solid and soft foods from 6 months 1.9 (1.8-2.0)
11.2.5. Take home rations
Coverage of take home rations was acceptable. Nearly three quarters of children 6-24 months of age
received a take home ration from the AWC the previous month (72.0% [95% CI 71.4-72.6]. There was
some district-wise variation (Sonepur had the lowest coverage at 36.4% and Dhenkanal the highest
at 91.0% (see figure 27), but differences between socio-demographic groups were negligible (see
annexes). Similarly, 69.4% [95%CI 68.9-70.0] of breastfeeding women with children <2 years, and
just over half of pregnant women received a take home ration from the AWC the previous month
(58.3% [95% CI 57.7-58.9]; again, there was little difference between socio-demographic groups.
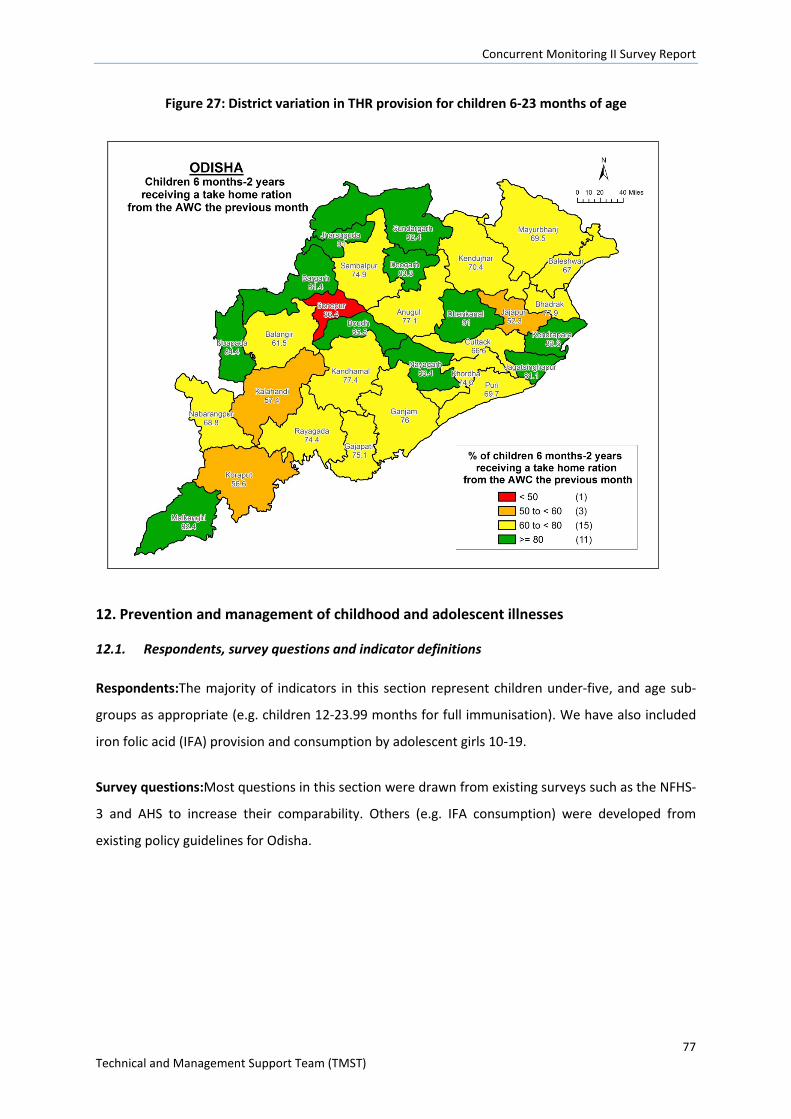
Concurrent Monitoring II Survey Report
77 Technical and Management Support Team (TMST)
Figure 27: District variation in THR provision for children 6-23 months of age
12. Prevention and management of childhood and adolescent illnesses
12.1. Respondents, survey questions and indicator definitions
Respondents:The majority of indicators in this section represent children under-five, and age sub-
groups as appropriate (e.g. children 12-23.99 months for full immunisation). We have also included
iron folic acid (IFA) provision and consumption by adolescent girls 10-19.
Survey questions:Most questions in this section were drawn from existing surveys such as the NFHS-
3 and AHS to increase their comparability. Others (e.g. IFA consumption) were developed from
existing policy guidelines for Odisha.
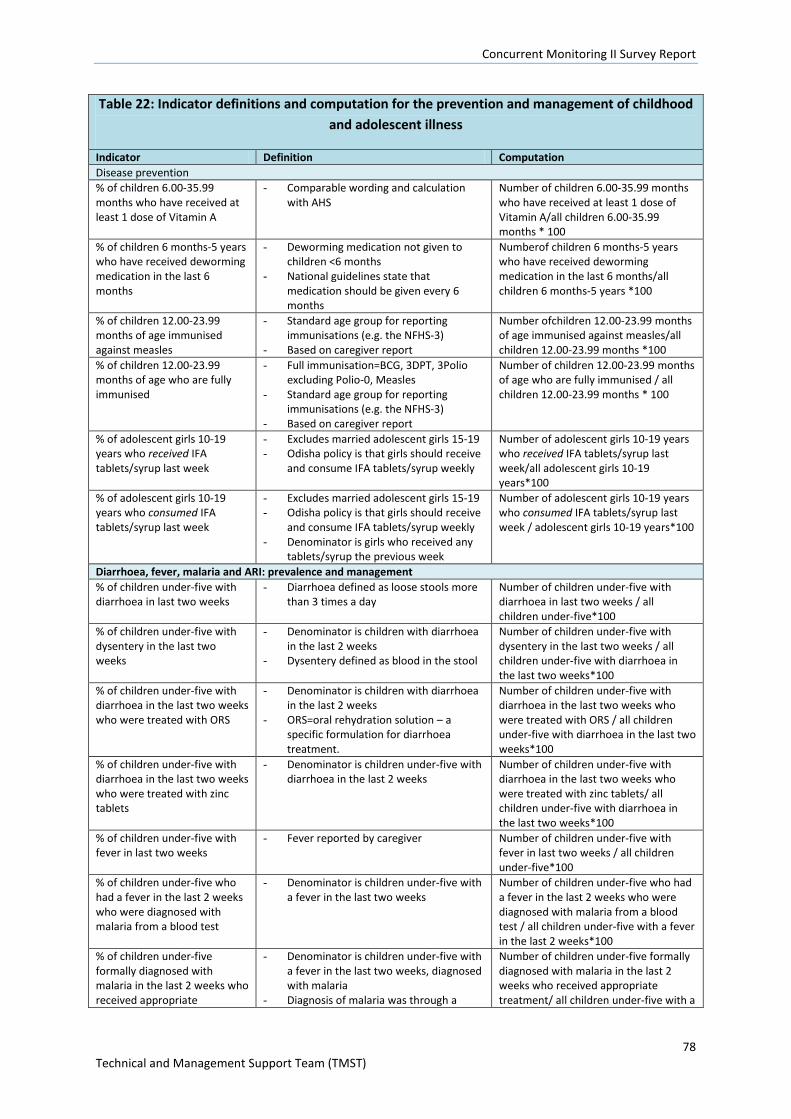
Concurrent Monitoring II Survey Report
78 Technical and Management Support Team (TMST)
Table 22: Indicator definitions and computation for the prevention and management of childhood and adolescent illness
Indicator Definition Computation Disease prevention % of children 6.00-35.99 months who have received at least 1 dose of Vitamin A
- Comparable wording and calculation with AHS
Number of children 6.00-35.99 months who have received at least 1 dose of Vitamin A/all children 6.00-35.99 months * 100
% of children 6 months-5 years who have received deworming medication in the last 6 months
- Deworming medication not given to children <6 months
- National guidelines state that medication should be given every 6 months
Numberof children 6 months-5 years who have received deworming medication in the last 6 months/all children 6 months-5 years *100
% of children 12.00-23.99 months of age immunised against measles
- Standard age group for reporting immunisations (e.g. the NFHS-3)
- Based on caregiver report
Number ofchildren 12.00-23.99 months of age immunised against measles/all children 12.00-23.99 months *100
% of children 12.00-23.99 months of age who are fully immunised
- Full immunisation=BCG, 3DPT, 3Polio excluding Polio-0, Measles
- Standard age group for reporting immunisations (e.g. the NFHS-3)
- Based on caregiver report
Number of children 12.00-23.99 months of age who are fully immunised / all children 12.00-23.99 months * 100
% of adolescent girls 10-19 years who received IFA tablets/syrup last week
- Excludes married adolescent girls 15-19 - Odisha policy is that girls should receive
and consume IFA tablets/syrup weekly
Number of adolescent girls 10-19 years who received IFA tablets/syrup last week/all adolescent girls 10-19 years*100
% of adolescent girls 10-19 years who consumed IFA tablets/syrup last week
- Excludes married adolescent girls 15-19 - Odisha policy is that girls should receive
and consume IFA tablets/syrup weekly - Denominator is girls who received any
tablets/syrup the previous week
Number of adolescent girls 10-19 years who consumed IFA tablets/syrup last week / adolescent girls 10-19 years*100
Diarrhoea, fever, malaria and ARI: prevalence and management % of children under-five with diarrhoea in last two weeks
- Diarrhoea defined as loose stools more than 3 times a day
Number of children under-five with diarrhoea in last two weeks / all children under-five*100
% of children under-five with dysentery in the last two weeks
- Denominator is children with diarrhoea in the last 2 weeks
- Dysentery defined as blood in the stool
Number of children under-five with dysentery in the last two weeks / all children under-five with diarrhoea in the last two weeks*100
% of children under-five with diarrhoea in the last two weeks who were treated with ORS
- Denominator is children with diarrhoea in the last 2 weeks
- ORS=oral rehydration solution – a specific formulation for diarrhoea treatment.
Number of children under-five with diarrhoea in the last two weeks who were treated with ORS / all children under-five with diarrhoea in the last two weeks*100
% of children under-five with diarrhoea in the last two weeks who were treated with zinc tablets
- Denominator is children under-five with diarrhoea in the last 2 weeks
Number of children under-five with diarrhoea in the last two weeks who were treated with zinc tablets/ all children under-five with diarrhoea in the last two weeks*100
% of children under-five with fever in last two weeks
- Fever reported by caregiver Number of children under-five with fever in last two weeks / all children under-five*100
% of children under-five who had a fever in the last 2 weeks who were diagnosed with malaria from a blood test
- Denominator is children under-five with a fever in the last two weeks
Number of children under-five who had a fever in the last 2 weeks who were diagnosed with malaria from a blood test / all children under-five with a fever in the last 2 weeks*100
% of children under-five formally diagnosed with malaria in the last 2 weeks who received appropriate
- Denominator is children under-five with a fever in the last two weeks, diagnosed with malaria
- Diagnosis of malaria was through a
Number of children under-five formally diagnosed with malaria in the last 2 weeks who received appropriate treatment/ all children under-five with a
Concurrent Monitoring II Survey Report
79 Technical and Management Support Team (TMST)
Table 22: Indicator definitions and computation for the prevention and management of childhood and adolescent illness
Indicator Definition Computation treatment blood test
- Appropriate treatment was from a formal health provider
malaria diagnosis in the last 2 weeks*100
% of children under-five showing signs of ARI in the last two weeks
- Denominator is children under-five with a fever in the last two weeks
- ARI=fever, plus a cough or laboured breathing/fast breathing/nasal flaring
Number of children under-five showing signs of ARI in the last two weeks / all children under-five with a fever in the last 2 weeks*100
% of children under-five diagnosed with ARI in the last 2 weeks who received appropriate treatment
- Denominator is children under-five with a fever in the last two weeks who showed signs of ARI
- ARI=fever, plus a cough or laboured breathing/fast breathing/nasal flaring
- Appropriate treatment was antibiotics
Number of children under-five diagnosed with ARI in the last 2 weeks who received appropriate treatment/All children under-five diagnosed with ARI in the last 2 weeks *100
% of children under-five sleeping under a mosquito net the previous night
- Response categories were: no net, LLIN, ITN, any other net
Number of children under-five sleeping under a mosquito net the previous night/all children under-five*100
12.2. Indicator estimates
12.2.1. Vitamin A, deworming, measles and full immunization
State level estimates for vitamin A, deworming, measles and full immunisation are shown in figure 28.
Nearly two-thirds of children 6-35 months of age had received at least one Vitamin A dose since
birth (63.8%, 95%CI 63.3-64.3). There was a small social gradient in vitamin A coverage which
favoured general caste/OBC and other groups (67.2%, 95%CI 66.6-67.8) compared to SC (62.5%,
95%CI 61.8-63.3) and ST groups (59.0%, 95%CI 58.1-59.8); differences between other groups were
negligible.
Coverage of deworming medication was slightly lower than Vitamin A at 52.2% (95%CI 51.7-52.7).
Again, there were slight differences in coverage that favoured general caste/OBC/others compared
to SC and ST groups, but there were also trend of increasing coverage with increasing standard of
living (low=49.8%, 95%CI 49.2-50.3; medium=55.1%, 95%CI 54.6-55.7, and high=59.7%, 95%CI58.7-
60.7).
Three-quarters of children were fully immunised according to caregiver reports (75.0%, 95%CI 74.1-
75.9); coverage of measles immunisation was similar at74.8% (95%CI 74.2-75.3). Social gradients in
coverage of both immunisation indicators were evident. Full immunisation coverage favoured
children from the high sli group (80.9%, 95%CI 78.3-83.3) compared to medium (77.7%, 95%CI 76.5-
78.8) and low (73.1%, 95%CI 72.1-74.1), children with literate mothers (80.0%, 95%CI 79.1-80.9)
compared to illiterate (67.7%, 95%CI 66.3-69.1), and children from general caste/OBC/Other groups
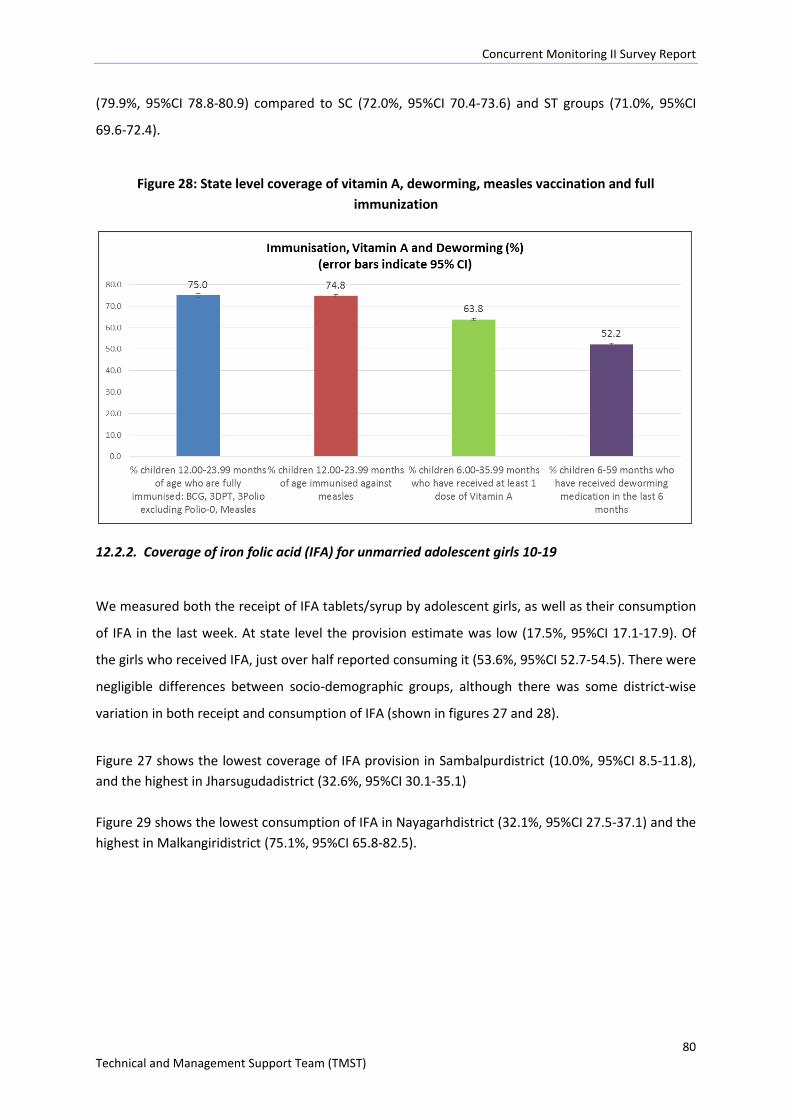
Concurrent Monitoring II Survey Report
80 Technical and Management Support Team (TMST)
(79.9%, 95%CI 78.8-80.9) compared to SC (72.0%, 95%CI 70.4-73.6) and ST groups (71.0%, 95%CI
69.6-72.4).
Figure 28: State level coverage of vitamin A, deworming, measles vaccination and full immunization
12.2.2. Coverage of iron folic acid (IFA) for unmarried adolescent girls 10-19
We measured both the receipt of IFA tablets/syrup by adolescent girls, as well as their consumption
of IFA in the last week. At state level the provision estimate was low (17.5%, 95%CI 17.1-17.9). Of
the girls who received IFA, just over half reported consuming it (53.6%, 95%CI 52.7-54.5). There were
negligible differences between socio-demographic groups, although there was some district-wise
variation in both receipt and consumption of IFA (shown in figures 27 and 28).
Figure 27 shows the lowest coverage of IFA provision in Sambalpurdistrict (10.0%, 95%CI 8.5-11.8), and the highest in Jharsugudadistrict (32.6%, 95%CI 30.1-35.1) Figure 29 shows the lowest consumption of IFA in Nayagarhdistrict (32.1%, 95%CI 27.5-37.1) and the highest in Malkangiridistrict (75.1%, 95%CI 65.8-82.5).
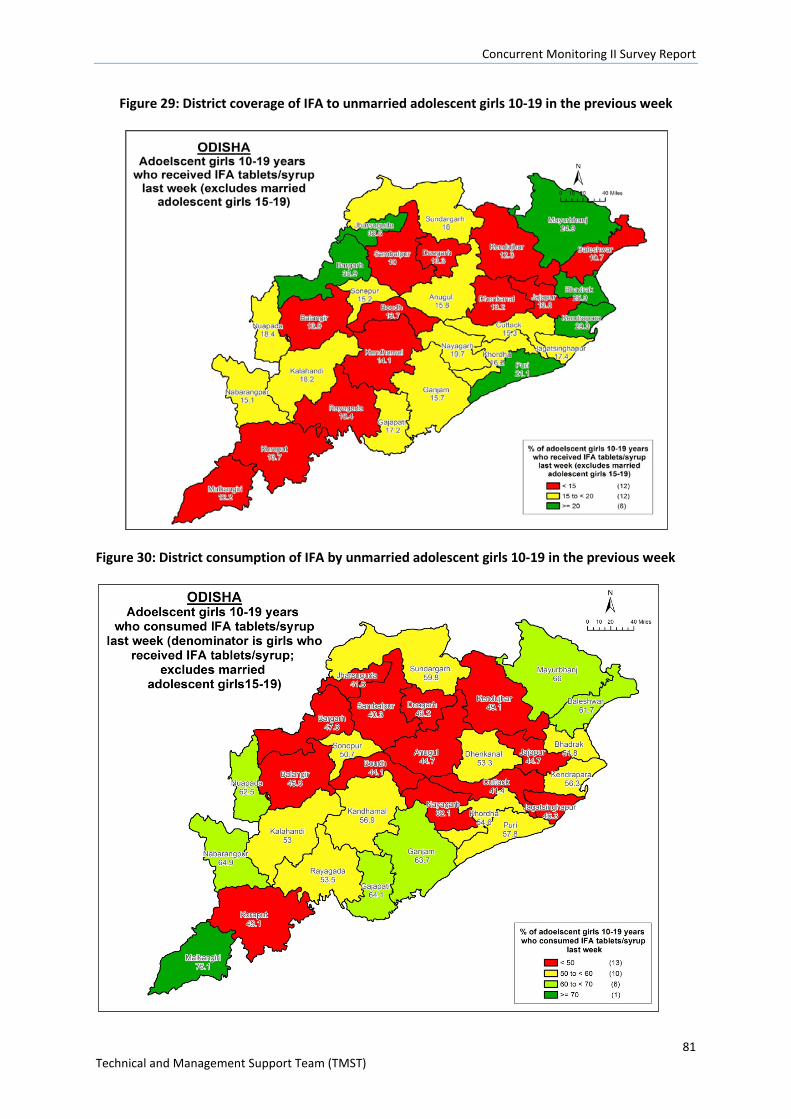
Concurrent Monitoring II Survey Report
81 Technical and Management Support Team (TMST)
Figure 29: District coverage of IFA to unmarried adolescent girls 10-19 in the previous week
Figure 30: District consumption of IFA by unmarried adolescent girls 10-19 in the previous week
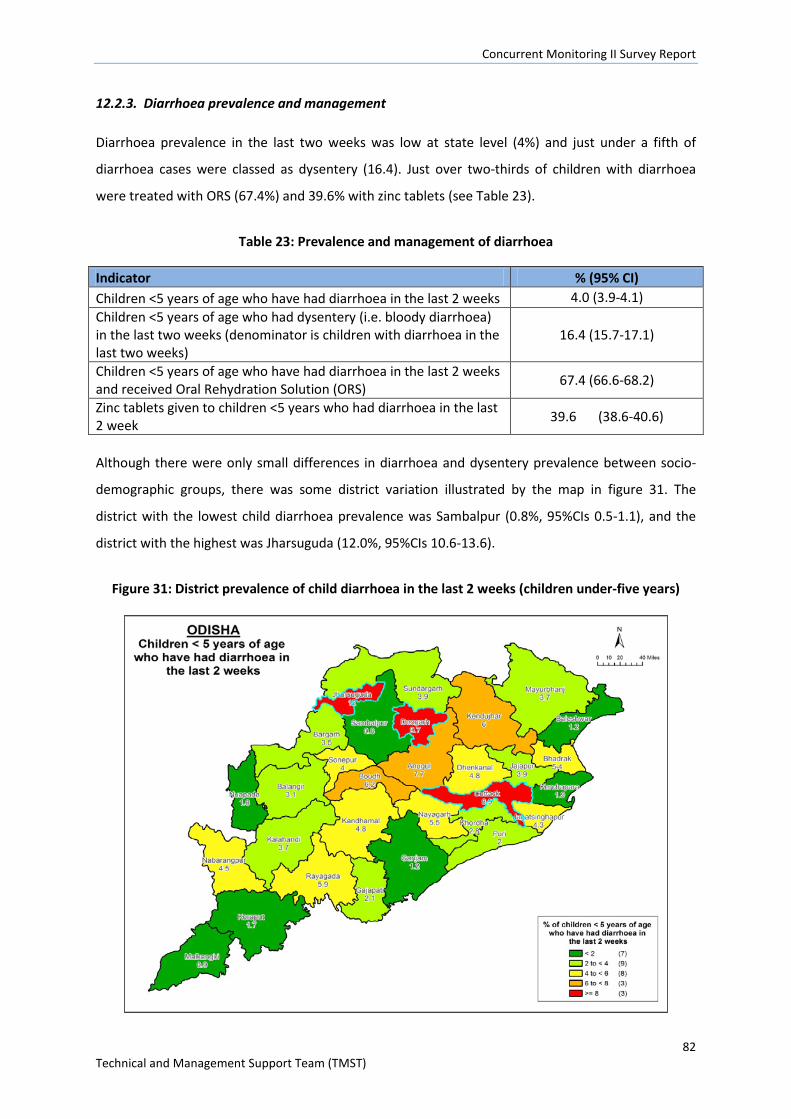
Concurrent Monitoring II Survey Report
82 Technical and Management Support Team (TMST)
12.2.3. Diarrhoea prevalence and management
Diarrhoea prevalence in the last two weeks was low at state level (4%) and just under a fifth of
diarrhoea cases were classed as dysentery (16.4). Just over two-thirds of children with diarrhoea
were treated with ORS (67.4%) and 39.6% with zinc tablets (see Table 23).
Table 23: Prevalence and management of diarrhoea
Indicator % (95% CI) Children <5 years of age who have had diarrhoea in the last 2 weeks 4.0 (3.9-4.1) Children <5 years of age who had dysentery (i.e. bloody diarrhoea) in the last two weeks (denominator is children with diarrhoea in the last two weeks)
16.4 (15.7-17.1)
Children <5 years of age who have had diarrhoea in the last 2 weeks and received Oral Rehydration Solution (ORS) 67.4 (66.6-68.2)
Zinc tablets given to children <5 years who had diarrhoea in the last 2 week 39.6 (38.6-40.6)
Although there were only small differences in diarrhoea and dysentery prevalence between socio-
demographic groups, there was some district variation illustrated by the map in figure 31. The
district with the lowest child diarrhoea prevalence was Sambalpur (0.8%, 95%CIs 0.5-1.1), and the
district with the highest was Jharsuguda (12.0%, 95%CIs 10.6-13.6).
Figure 31: District prevalence of child diarrhoea in the last 2 weeks (children under-five years)
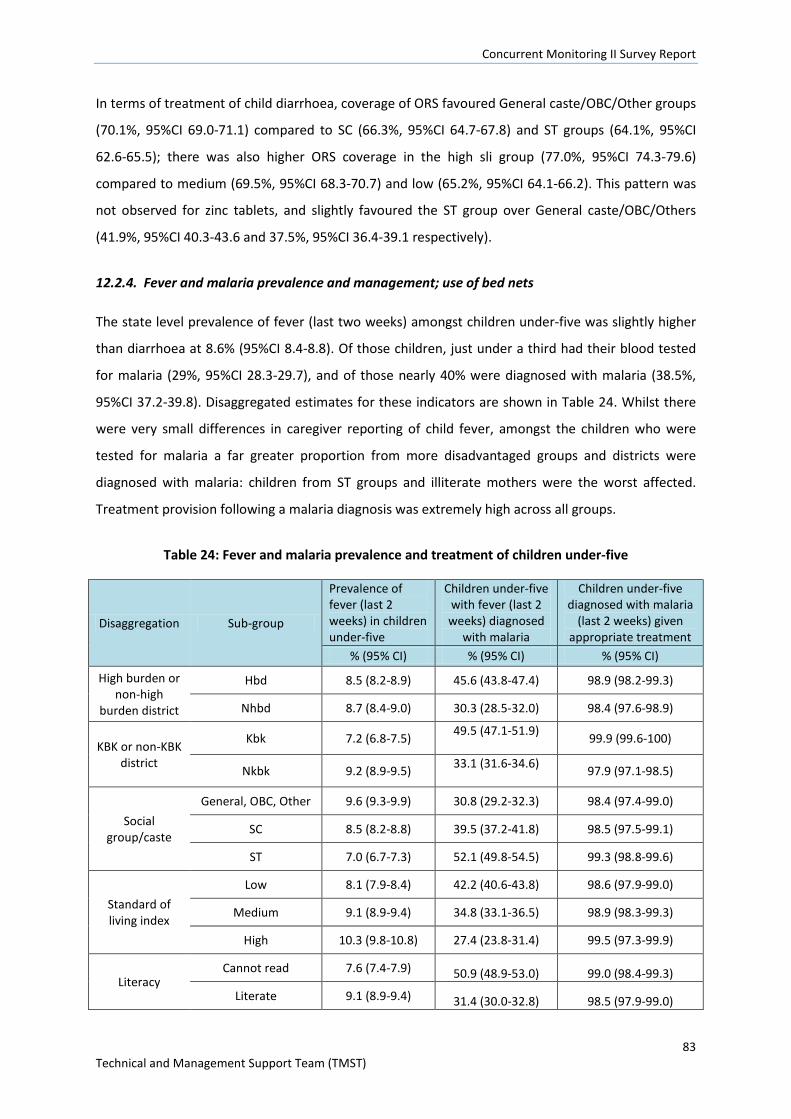
Concurrent Monitoring II Survey Report
83 Technical and Management Support Team (TMST)
In terms of treatment of child diarrhoea, coverage of ORS favoured General caste/OBC/Other groups
(70.1%, 95%CI 69.0-71.1) compared to SC (66.3%, 95%CI 64.7-67.8) and ST groups (64.1%, 95%CI
62.6-65.5); there was also higher ORS coverage in the high sli group (77.0%, 95%CI 74.3-79.6)
compared to medium (69.5%, 95%CI 68.3-70.7) and low (65.2%, 95%CI 64.1-66.2). This pattern was
not observed for zinc tablets, and slightly favoured the ST group over General caste/OBC/Others
(41.9%, 95%CI 40.3-43.6 and 37.5%, 95%CI 36.4-39.1 respectively).
12.2.4. Fever and malaria prevalence and management; use of bed nets
The state level prevalence of fever (last two weeks) amongst children under-five was slightly higher
than diarrhoea at 8.6% (95%CI 8.4-8.8). Of those children, just under a third had their blood tested
for malaria (29%, 95%CI 28.3-29.7), and of those nearly 40% were diagnosed with malaria (38.5%,
95%CI 37.2-39.8). Disaggregated estimates for these indicators are shown in Table 24. Whilst there
were very small differences in caregiver reporting of child fever, amongst the children who were
tested for malaria a far greater proportion from more disadvantaged groups and districts were
diagnosed with malaria: children from ST groups and illiterate mothers were the worst affected.
Treatment provision following a malaria diagnosis was extremely high across all groups.
Table 24: Fever and malaria prevalence and treatment of children under-five
Disaggregation Sub-group
Prevalence of fever (last 2 weeks) in children under-five
Children under-five with fever (last 2 weeks) diagnosed
with malaria
Children under-five diagnosed with malaria
(last 2 weeks) given appropriate treatment
% (95% CI) % (95% CI) % (95% CI)
High burden or non-high
burden district
Hbd 8.5 (8.2-8.9) 45.6 (43.8-47.4) 98.9 (98.2-99.3)
Nhbd 8.7 (8.4-9.0) 30.3 (28.5-32.0) 98.4 (97.6-98.9)
KBK or non-KBK district
Kbk 7.2 (6.8-7.5) 49.5 (47.1-51.9) 99.9 (99.6-100)
Nkbk 9.2 (8.9-9.5) 33.1 (31.6-34.6) 97.9 (97.1-98.5)
Social group/caste
General, OBC, Other 9.6 (9.3-9.9) 30.8 (29.2-32.3) 98.4 (97.4-99.0)
SC 8.5 (8.2-8.8) 39.5 (37.2-41.8) 98.5 (97.5-99.1)
ST 7.0 (6.7-7.3) 52.1 (49.8-54.5) 99.3 (98.8-99.6)
Standard of living index
Low 8.1 (7.9-8.4) 42.2 (40.6-43.8) 98.6 (97.9-99.0)
Medium 9.1 (8.9-9.4) 34.8 (33.1-36.5) 98.9 (98.3-99.3)
High 10.3 (9.8-10.8) 27.4 (23.8-31.4) 99.5 (97.3-99.9)
Literacy Cannot read 7.6 (7.4-7.9) 50.9 (48.9-53.0) 99.0 (98.4-99.3)
Literate 9.1 (8.9-9.4) 31.4 (30.0-32.8) 98.5 (97.9-99.0)
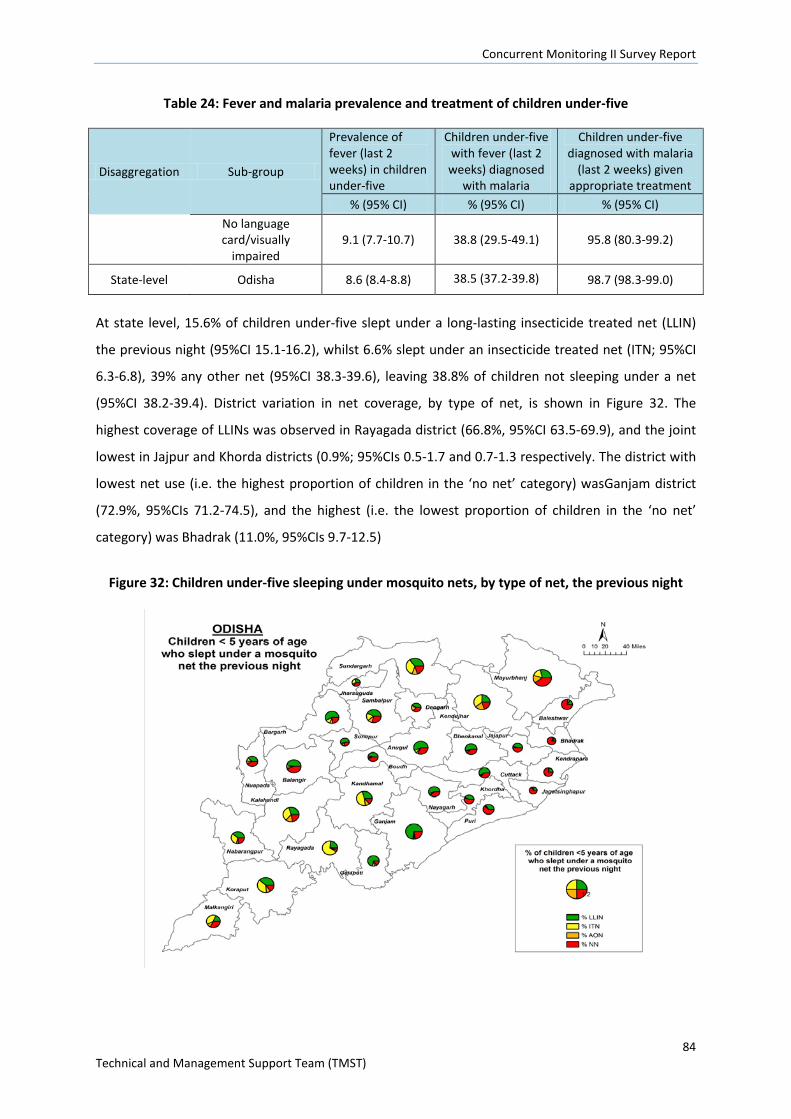
Concurrent Monitoring II Survey Report
84 Technical and Management Support Team (TMST)
Table 24: Fever and malaria prevalence and treatment of children under-five
Disaggregation Sub-group
Prevalence of fever (last 2 weeks) in children under-five
Children under-five with fever (last 2 weeks) diagnosed
with malaria
Children under-five diagnosed with malaria
(last 2 weeks) given appropriate treatment
% (95% CI) % (95% CI) % (95% CI) No language card/visually
impaired 9.1 (7.7-10.7) 38.8 (29.5-49.1) 95.8 (80.3-99.2)
State-level Odisha 8.6 (8.4-8.8) 38.5 (37.2-39.8) 98.7 (98.3-99.0)
At state level, 15.6% of children under-five slept under a long-lasting insecticide treated net (LLIN)
the previous night (95%CI 15.1-16.2), whilst 6.6% slept under an insecticide treated net (ITN; 95%CI
6.3-6.8), 39% any other net (95%CI 38.3-39.6), leaving 38.8% of children not sleeping under a net
(95%CI 38.2-39.4). District variation in net coverage, by type of net, is shown in Figure 32. The
highest coverage of LLINs was observed in Rayagada district (66.8%, 95%CI 63.5-69.9), and the joint
lowest in Jajpur and Khorda districts (0.9%; 95%CIs 0.5-1.7 and 0.7-1.3 respectively. The district with
lowest net use (i.e. the highest proportion of children in the ‘no net’ category) wasGanjam district
(72.9%, 95%CIs 71.2-74.5), and the highest (i.e. the lowest proportion of children in the ‘no net’
category) was Bhadrak (11.0%, 95%CIs 9.7-12.5)
Figure 32: Children under-five sleeping under mosquito nets, by type of net, the previous night
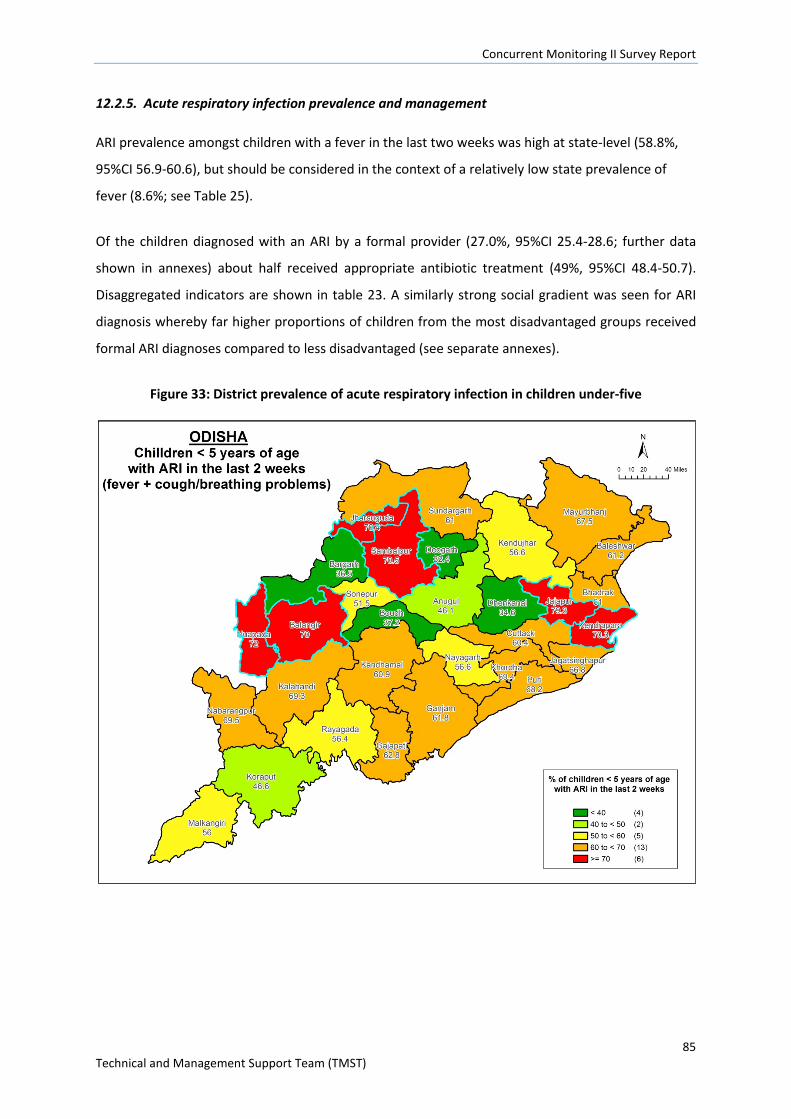
Concurrent Monitoring II Survey Report
85 Technical and Management Support Team (TMST)
12.2.5. Acute respiratory infection prevalence and management
ARI prevalence amongst children with a fever in the last two weeks was high at state-level (58.8%,
95%CI 56.9-60.6), but should be considered in the context of a relatively low state prevalence of
fever (8.6%; see Table 25).
Of the children diagnosed with an ARI by a formal provider (27.0%, 95%CI 25.4-28.6; further data
shown in annexes) about half received appropriate antibiotic treatment (49%, 95%CI 48.4-50.7).
Disaggregated indicators are shown in table 23. A similarly strong social gradient was seen for ARI
diagnosis whereby far higher proportions of children from the most disadvantaged groups received
formal ARI diagnoses compared to less disadvantaged (see separate annexes).
Figure 33: District prevalence of acute respiratory infection in children under-five
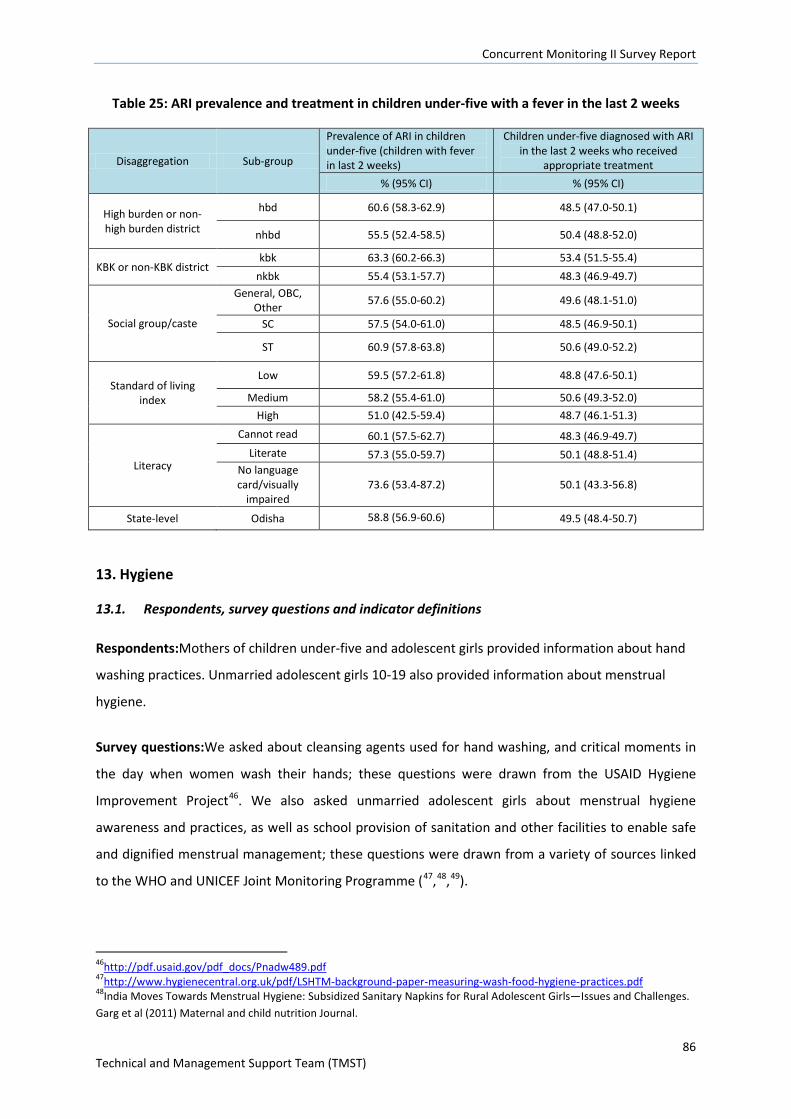
Concurrent Monitoring II Survey Report
86 Technical and Management Support Team (TMST)
Table 25: ARI prevalence and treatment in children under-five with a fever in the last 2 weeks
Disaggregation Sub-group
Prevalence of ARI in children under-five (children with fever in last 2 weeks)
Children under-five diagnosed with ARI in the last 2 weeks who received
appropriate treatment % (95% CI) % (95% CI)
High burden or non-high burden district
hbd 60.6 (58.3-62.9) 48.5 (47.0-50.1)
nhbd 55.5 (52.4-58.5) 50.4 (48.8-52.0)
KBK or non-KBK district kbk 63.3 (60.2-66.3) 53.4 (51.5-55.4)
nkbk 55.4 (53.1-57.7) 48.3 (46.9-49.7)
Social group/caste
General, OBC, Other 57.6 (55.0-60.2) 49.6 (48.1-51.0)
SC 57.5 (54.0-61.0) 48.5 (46.9-50.1)
ST 60.9 (57.8-63.8) 50.6 (49.0-52.2)
Standard of living index
Low 59.5 (57.2-61.8) 48.8 (47.6-50.1)
Medium 58.2 (55.4-61.0) 50.6 (49.3-52.0) High 51.0 (42.5-59.4) 48.7 (46.1-51.3)
Literacy
Cannot read 60.1 (57.5-62.7) 48.3 (46.9-49.7) Literate 57.3 (55.0-59.7) 50.1 (48.8-51.4)
No language card/visually
impaired 73.6 (53.4-87.2) 50.1 (43.3-56.8)
State-level Odisha 58.8 (56.9-60.6) 49.5 (48.4-50.7)
13. Hygiene
13.1. Respondents, survey questions and indicator definitions
Respondents:Mothers of children under-five and adolescent girls provided information about hand
washing practices. Unmarried adolescent girls 10-19 also provided information about menstrual
hygiene.
Survey questions:We asked about cleansing agents used for hand washing, and critical moments in
the day when women wash their hands; these questions were drawn from the USAID Hygiene
Improvement Project46. We also asked unmarried adolescent girls about menstrual hygiene
awareness and practices, as well as school provision of sanitation and other facilities to enable safe
and dignified menstrual management; these questions were drawn from a variety of sources linked
to the WHO and UNICEF Joint Monitoring Programme (47,48,49).
46http://pdf.usaid.gov/pdf_docs/Pnadw489.pdf 47http://www.hygienecentral.org.uk/pdf/LSHTM-background-paper-measuring-wash-food-hygiene-practices.pdf 48India Moves Towards Menstrual Hygiene: Subsidized Sanitary Napkins for Rural Adolescent Girls—Issues and Challenges. Garg et al (2011) Maternal and child nutrition Journal.
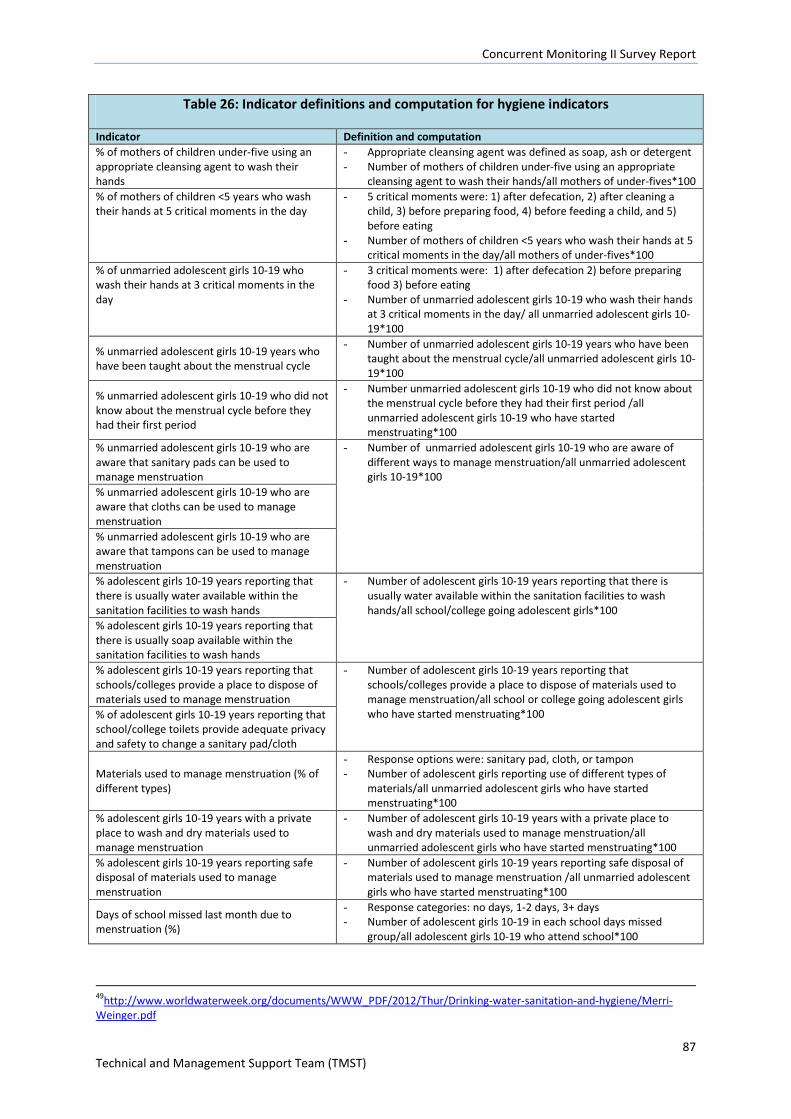
Concurrent Monitoring II Survey Report
87 Technical and Management Support Team (TMST)
Table 26: Indicator definitions and computation for hygiene indicators
Indicator Definition and computation % of mothers of children under-five using an appropriate cleansing agent to wash their hands
- Appropriate cleansing agent was defined as soap, ash or detergent - Number of mothers of children under-five using an appropriate
cleansing agent to wash their hands/all mothers of under-fives*100 % of mothers of children <5 years who wash their hands at 5 critical moments in the day
- 5 critical moments were: 1) after defecation, 2) after cleaning a child, 3) before preparing food, 4) before feeding a child, and 5) before eating
- Number of mothers of children <5 years who wash their hands at 5 critical moments in the day/all mothers of under-fives*100
% of unmarried adolescent girls 10-19 who wash their hands at 3 critical moments in the day
- 3 critical moments were: 1) after defecation 2) before preparing food 3) before eating
- Number of unmarried adolescent girls 10-19 who wash their hands at 3 critical moments in the day/ all unmarried adolescent girls 10-19*100
% unmarried adolescent girls 10-19 years who have been taught about the menstrual cycle
- Number of unmarried adolescent girls 10-19 years who have been taught about the menstrual cycle/all unmarried adolescent girls 10-19*100
% unmarried adolescent girls 10-19 who did not know about the menstrual cycle before they had their first period
- Number unmarried adolescent girls 10-19 who did not know about the menstrual cycle before they had their first period /all unmarried adolescent girls 10-19 who have started menstruating*100
% unmarried adolescent girls 10-19 who are aware that sanitary pads can be used to manage menstruation
- Number of unmarried adolescent girls 10-19 who are aware of different ways to manage menstruation/all unmarried adolescent girls 10-19*100
% unmarried adolescent girls 10-19 who are aware that cloths can be used to manage menstruation % unmarried adolescent girls 10-19 who are aware that tampons can be used to manage menstruation % adolescent girls 10-19 years reporting that there is usually water available within the sanitation facilities to wash hands
- Number of adolescent girls 10-19 years reporting that there is usually water available within the sanitation facilities to wash hands/all school/college going adolescent girls*100
% adolescent girls 10-19 years reporting that there is usually soap available within the sanitation facilities to wash hands % adolescent girls 10-19 years reporting that schools/colleges provide a place to dispose of materials used to manage menstruation
- Number of adolescent girls 10-19 years reporting that schools/colleges provide a place to dispose of materials used to manage menstruation/all school or college going adolescent girls who have started menstruating*100 % of adolescent girls 10-19 years reporting that
school/college toilets provide adequate privacy and safety to change a sanitary pad/cloth
Materials used to manage menstruation (% of different types)
- Response options were: sanitary pad, cloth, or tampon - Number of adolescent girls reporting use of different types of
materials/all unmarried adolescent girls who have started menstruating*100
% adolescent girls 10-19 years with a private place to wash and dry materials used to manage menstruation
- Number of adolescent girls 10-19 years with a private place to wash and dry materials used to manage menstruation/all unmarried adolescent girls who have started menstruating*100
% adolescent girls 10-19 years reporting safe disposal of materials used to manage menstruation
- Number of adolescent girls 10-19 years reporting safe disposal of materials used to manage menstruation /all unmarried adolescent girls who have started menstruating*100
Days of school missed last month due to menstruation (%)
- Response categories: no days, 1-2 days, 3+ days - Number of adolescent girls 10-19 in each school days missed
group/all adolescent girls 10-19 who attend school*100
49http://www.worldwaterweek.org/documents/WWW_PDF/2012/Thur/Drinking-water-sanitation-and-hygiene/Merri-Weinger.pdf
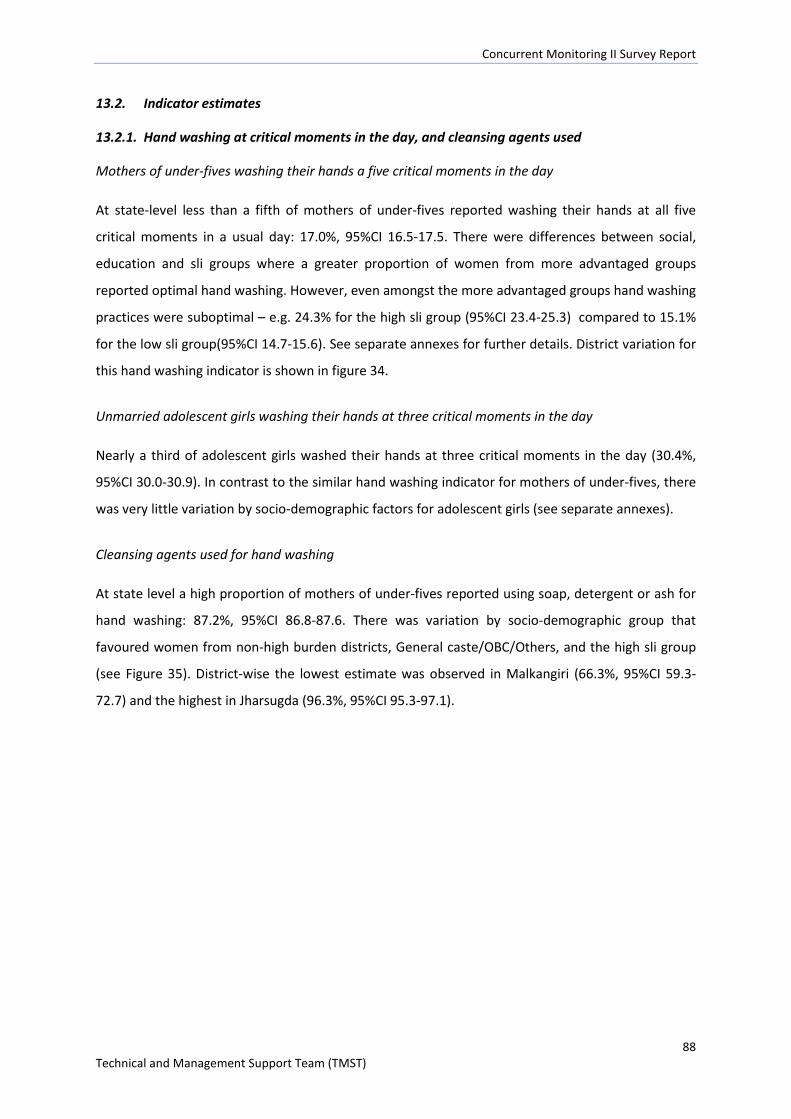
Concurrent Monitoring II Survey Report
88 Technical and Management Support Team (TMST)
13.2. Indicator estimates
13.2.1. Hand washing at critical moments in the day, and cleansing agents used
Mothers of under-fives washing their hands a five critical moments in the day
At state-level less than a fifth of mothers of under-fives reported washing their hands at all five
critical moments in a usual day: 17.0%, 95%CI 16.5-17.5. There were differences between social,
education and sli groups where a greater proportion of women from more advantaged groups
reported optimal hand washing. However, even amongst the more advantaged groups hand washing
practices were suboptimal – e.g. 24.3% for the high sli group (95%CI 23.4-25.3) compared to 15.1%
for the low sli group(95%CI 14.7-15.6). See separate annexes for further details. District variation for
this hand washing indicator is shown in figure 34.
Unmarried adolescent girls washing their hands at three critical moments in the day
Nearly a third of adolescent girls washed their hands at three critical moments in the day (30.4%,
95%CI 30.0-30.9). In contrast to the similar hand washing indicator for mothers of under-fives, there
was very little variation by socio-demographic factors for adolescent girls (see separate annexes).
Cleansing agents used for hand washing
At state level a high proportion of mothers of under-fives reported using soap, detergent or ash for
hand washing: 87.2%, 95%CI 86.8-87.6. There was variation by socio-demographic group that
favoured women from non-high burden districts, General caste/OBC/Others, and the high sli group
(see Figure 35). District-wise the lowest estimate was observed in Malkangiri (66.3%, 95%CI 59.3-
72.7) and the highest in Jharsugda (96.3%, 95%CI 95.3-97.1).
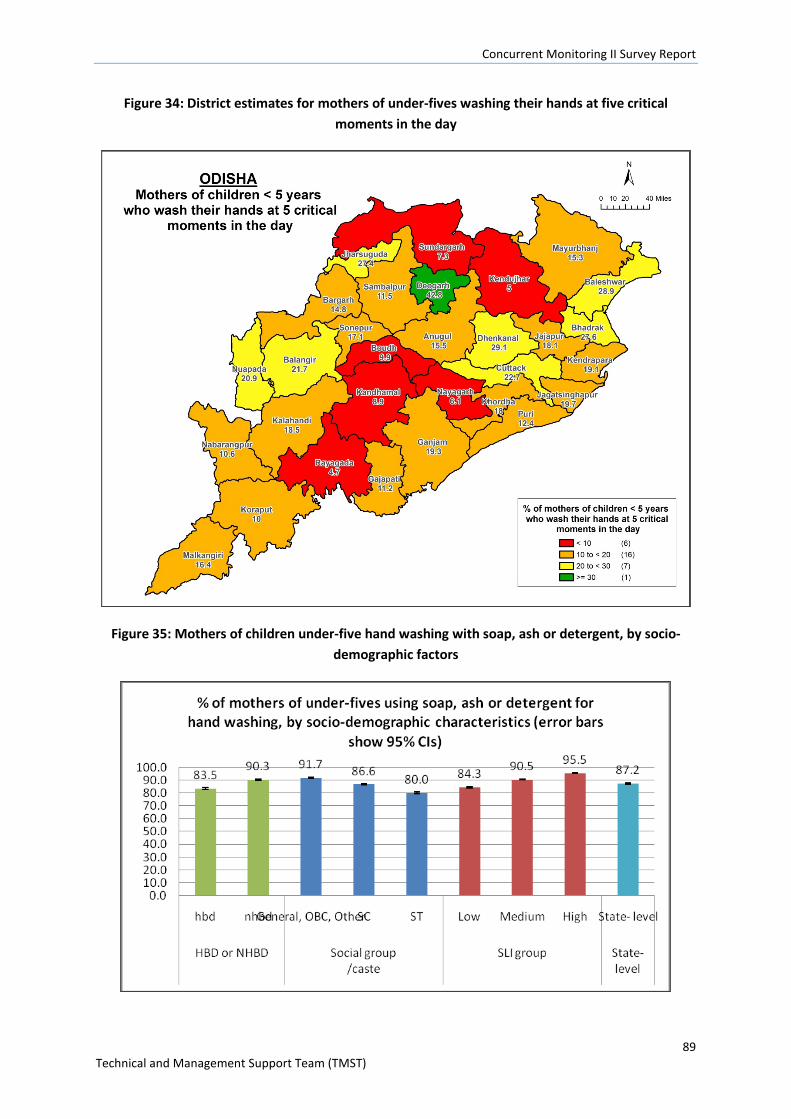
Concurrent Monitoring II Survey Report
89 Technical and Management Support Team (TMST)
Figure 34: District estimates for mothers of under-fives washing their hands at five critical moments in the day
Figure 35: Mothers of children under-five hand washing with soap, ash or detergent, by socio-demographic factors
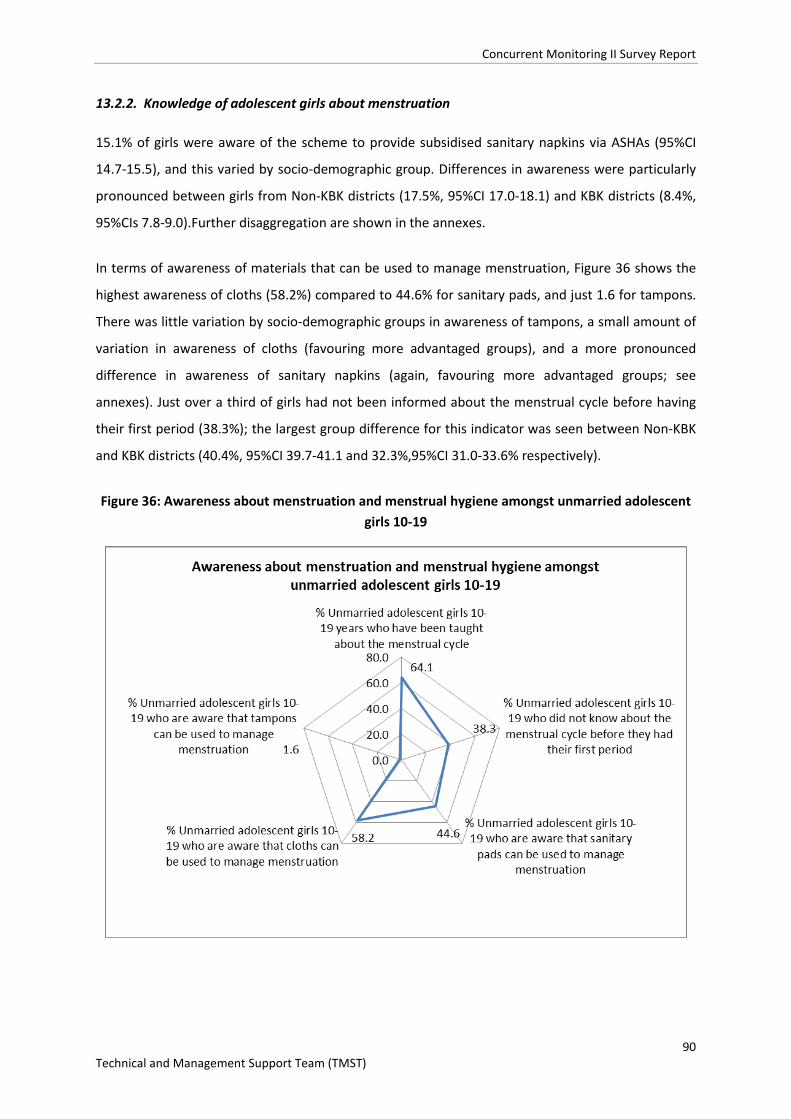
Concurrent Monitoring II Survey Report
90 Technical and Management Support Team (TMST)
13.2.2. Knowledge of adolescent girls about menstruation
15.1% of girls were aware of the scheme to provide subsidised sanitary napkins via ASHAs (95%CI
14.7-15.5), and this varied by socio-demographic group. Differences in awareness were particularly
pronounced between girls from Non-KBK districts (17.5%, 95%CI 17.0-18.1) and KBK districts (8.4%,
95%CIs 7.8-9.0).Further disaggregation are shown in the annexes.
In terms of awareness of materials that can be used to manage menstruation, Figure 36 shows the
highest awareness of cloths (58.2%) compared to 44.6% for sanitary pads, and just 1.6 for tampons.
There was little variation by socio-demographic groups in awareness of tampons, a small amount of
variation in awareness of cloths (favouring more advantaged groups), and a more pronounced
difference in awareness of sanitary napkins (again, favouring more advantaged groups; see
annexes). Just over a third of girls had not been informed about the menstrual cycle before having
their first period (38.3%); the largest group difference for this indicator was seen between Non-KBK
and KBK districts (40.4%, 95%CI 39.7-41.1 and 32.3%,95%CI 31.0-33.6% respectively).
Figure 36: Awareness about menstruation and menstrual hygiene amongst unmarried adolescent girls 10-19
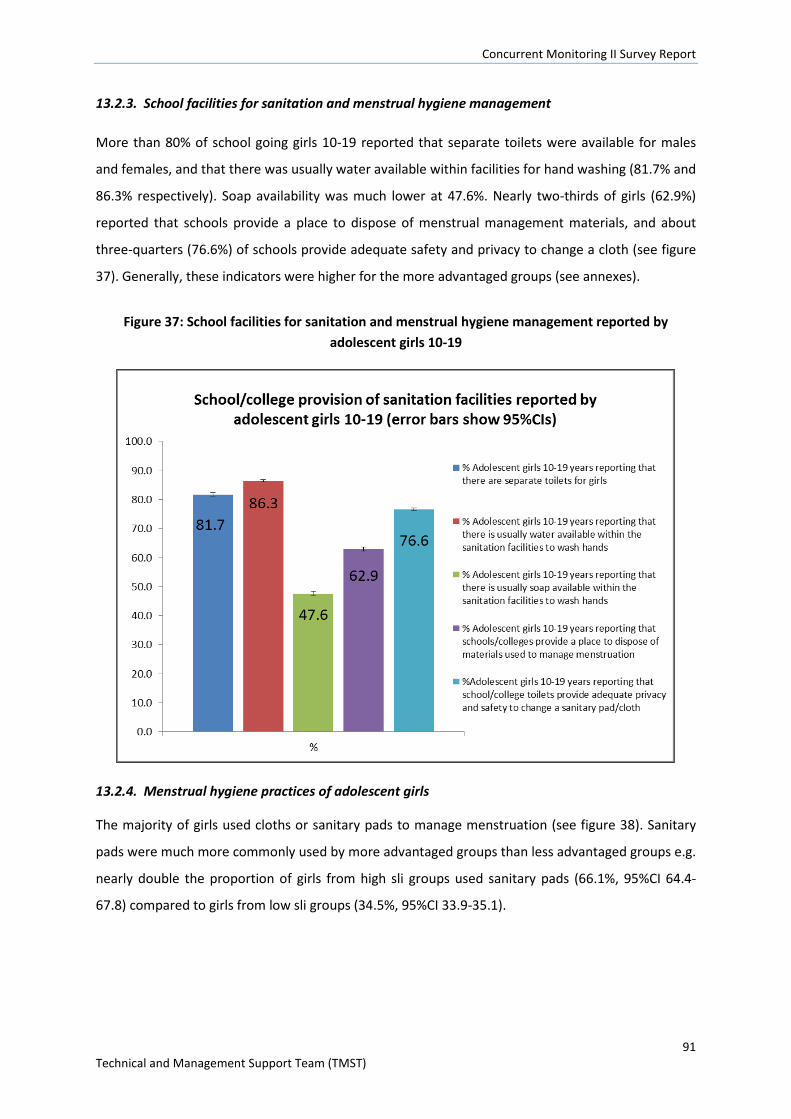
Concurrent Monitoring II Survey Report
91 Technical and Management Support Team (TMST)
13.2.3. School facilities for sanitation and menstrual hygiene management
More than 80% of school going girls 10-19 reported that separate toilets were available for males
and females, and that there was usually water available within facilities for hand washing (81.7% and
86.3% respectively). Soap availability was much lower at 47.6%. Nearly two-thirds of girls (62.9%)
reported that schools provide a place to dispose of menstrual management materials, and about
three-quarters (76.6%) of schools provide adequate safety and privacy to change a cloth (see figure
37). Generally, these indicators were higher for the more advantaged groups (see annexes).
Figure 37: School facilities for sanitation and menstrual hygiene management reported by adolescent girls 10-19
13.2.4. Menstrual hygiene practices of adolescent girls
The majority of girls used cloths or sanitary pads to manage menstruation (see figure 38). Sanitary
pads were much more commonly used by more advantaged groups than less advantaged groups e.g.
nearly double the proportion of girls from high sli groups used sanitary pads (66.1%, 95%CI 64.4-
67.8) compared to girls from low sli groups (34.5%, 95%CI 33.9-35.1).
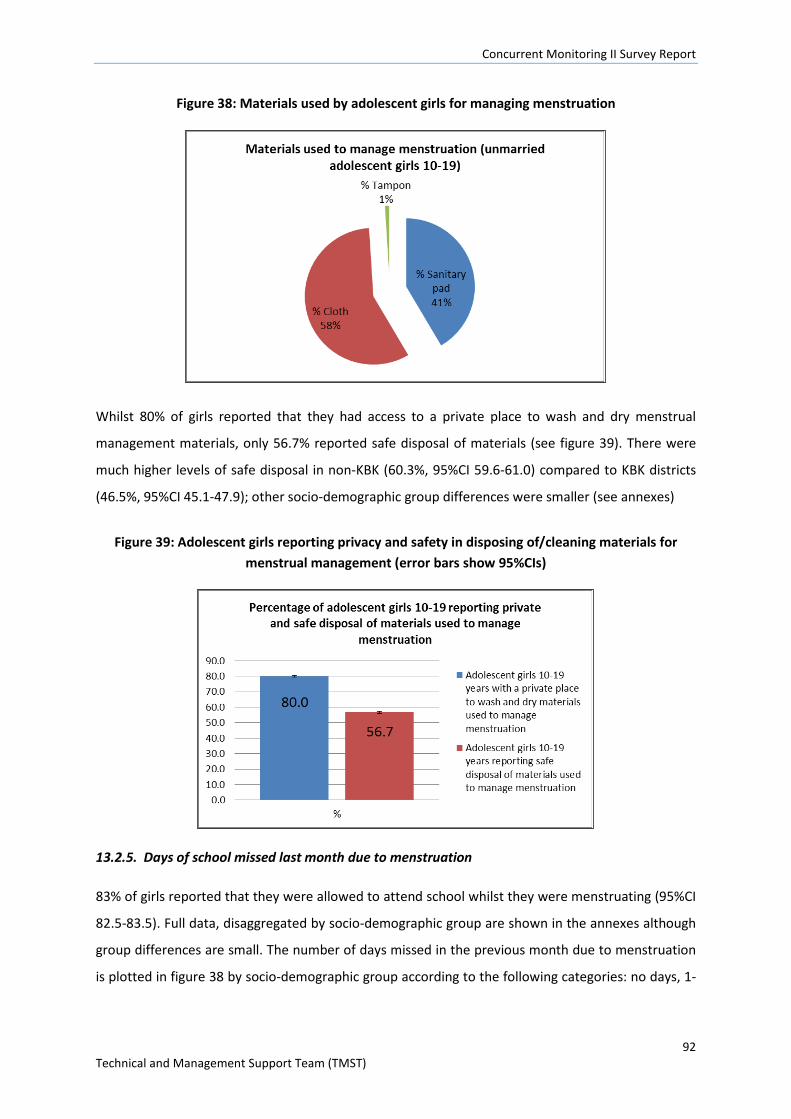
Concurrent Monitoring II Survey Report
92 Technical and Management Support Team (TMST)
Figure 38: Materials used by adolescent girls for managing menstruation
Whilst 80% of girls reported that they had access to a private place to wash and dry menstrual
management materials, only 56.7% reported safe disposal of materials (see figure 39). There were
much higher levels of safe disposal in non-KBK (60.3%, 95%CI 59.6-61.0) compared to KBK districts
(46.5%, 95%CI 45.1-47.9); other socio-demographic group differences were smaller (see annexes)
Figure 39: Adolescent girls reporting privacy and safety in disposing of/cleaning materials for menstrual management (error bars show 95%CIs)
13.2.5. Days of school missed last month due to menstruation
83% of girls reported that they were allowed to attend school whilst they were menstruating (95%CI
82.5-83.5). Full data, disaggregated by socio-demographic group are shown in the annexes although
group differences are small. The number of days missed in the previous month due to menstruation
is plotted in figure 38 by socio-demographic group according to the following categories: no days, 1-
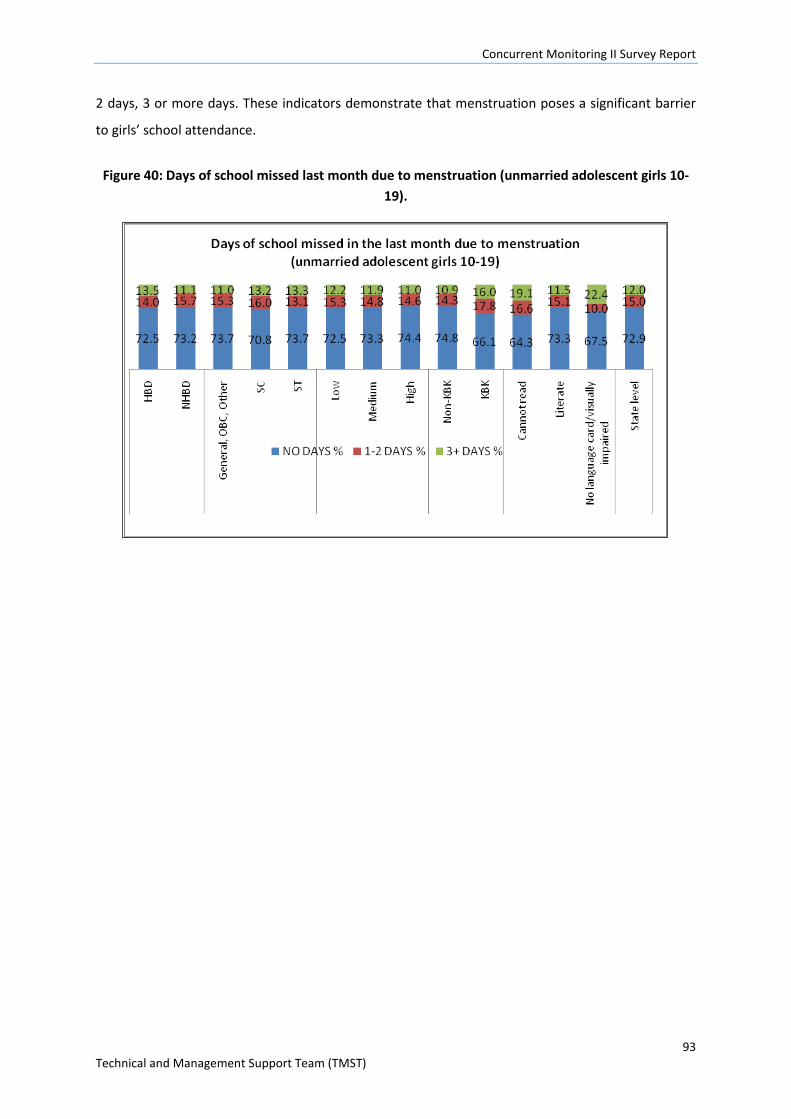
Concurrent Monitoring II Survey Report
93 Technical and Management Support Team (TMST)
2 days, 3 or more days. These indicators demonstrate that menstruation poses a significant barrier
to girls’ school attendance.
Figure 40: Days of school missed last month due to menstruation (unmarried adolescent girls 10-19).
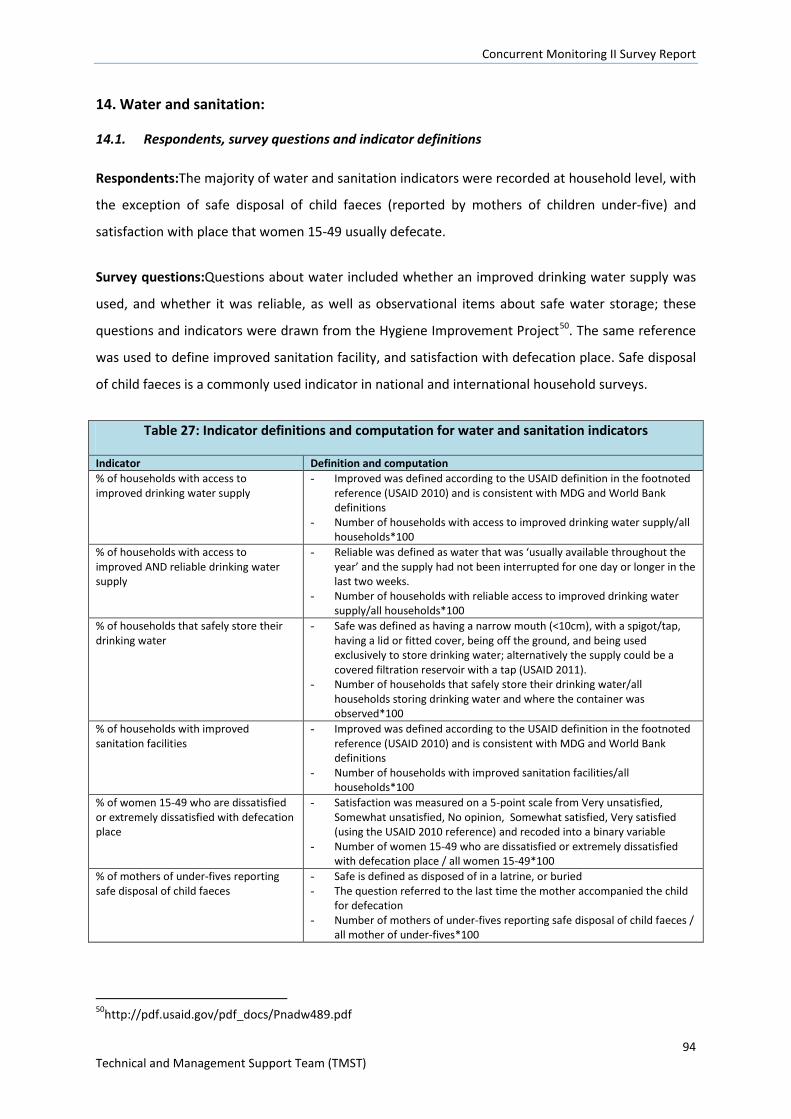
Concurrent Monitoring II Survey Report
94 Technical and Management Support Team (TMST)
14. Water and sanitation:
14.1. Respondents, survey questions and indicator definitions
Respondents:The majority of water and sanitation indicators were recorded at household level, with
the exception of safe disposal of child faeces (reported by mothers of children under-five) and
satisfaction with place that women 15-49 usually defecate.
Survey questions:Questions about water included whether an improved drinking water supply was
used, and whether it was reliable, as well as observational items about safe water storage; these
questions and indicators were drawn from the Hygiene Improvement Project50. The same reference
was used to define improved sanitation facility, and satisfaction with defecation place. Safe disposal
of child faeces is a commonly used indicator in national and international household surveys.
Table 27: Indicator definitions and computation for water and sanitation indicators
Indicator Definition and computation % of households with access to improved drinking water supply
- Improved was defined according to the USAID definition in the footnoted reference (USAID 2010) and is consistent with MDG and World Bank definitions
- Number of households with access to improved drinking water supply/all households*100
% of households with access to improved AND reliable drinking water supply
- Reliable was defined as water that was ‘usually available throughout the year’ and the supply had not been interrupted for one day or longer in the last two weeks.
- Number of households with reliable access to improved drinking water supply/all households*100
% of households that safely store their drinking water
- Safe was defined as having a narrow mouth (<10cm), with a spigot/tap, having a lid or fitted cover, being off the ground, and being used exclusively to store drinking water; alternatively the supply could be a covered filtration reservoir with a tap (USAID 2011).
- Number of households that safely store their drinking water/all households storing drinking water and where the container was observed*100
% of households with improved sanitation facilities
- Improved was defined according to the USAID definition in the footnoted reference (USAID 2010) and is consistent with MDG and World Bank definitions
- Number of households with improved sanitation facilities/all households*100
% of women 15-49 who are dissatisfied or extremely dissatisfied with defecation place
- Satisfaction was measured on a 5-point scale from Very unsatisfied, Somewhat unsatisfied, No opinion, Somewhat satisfied, Very satisfied (using the USAID 2010 reference) and recoded into a binary variable
- Number of women 15-49 who are dissatisfied or extremely dissatisfied with defecation place / all women 15-49*100
% of mothers of under-fives reporting safe disposal of child faeces
- Safe is defined as disposed of in a latrine, or buried - The question referred to the last time the mother accompanied the child
for defecation - Number of mothers of under-fives reporting safe disposal of child faeces /
all mother of under-fives*100
50http://pdf.usaid.gov/pdf_docs/Pnadw489.pdf
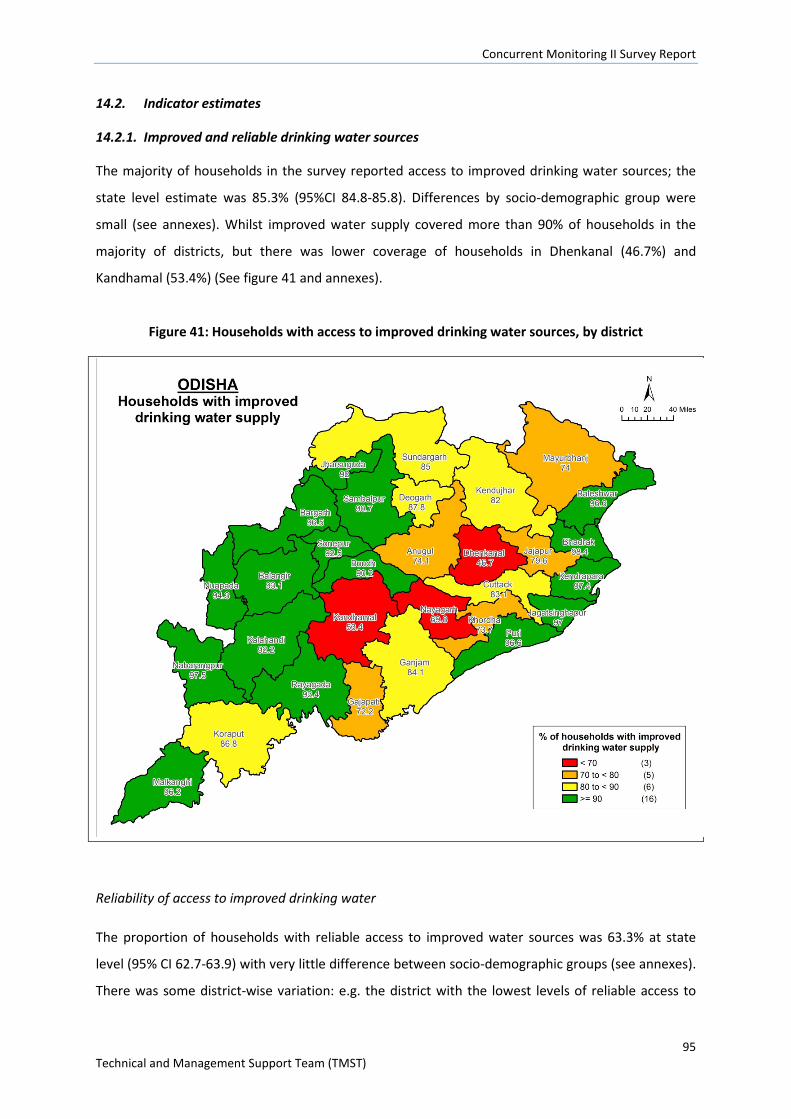
Concurrent Monitoring II Survey Report
95 Technical and Management Support Team (TMST)
14.2. Indicator estimates
14.2.1. Improved and reliable drinking water sources
The majority of households in the survey reported access to improved drinking water sources; the
state level estimate was 85.3% (95%CI 84.8-85.8). Differences by socio-demographic group were
small (see annexes). Whilst improved water supply covered more than 90% of households in the
majority of districts, but there was lower coverage of households in Dhenkanal (46.7%) and
Kandhamal (53.4%) (See figure 41 and annexes).
Figure 41: Households with access to improved drinking water sources, by district
Reliability of access to improved drinking water
The proportion of households with reliable access to improved water sources was 63.3% at state
level (95% CI 62.7-63.9) with very little difference between socio-demographic groups (see annexes).
There was some district-wise variation: e.g. the district with the lowest levels of reliable access to
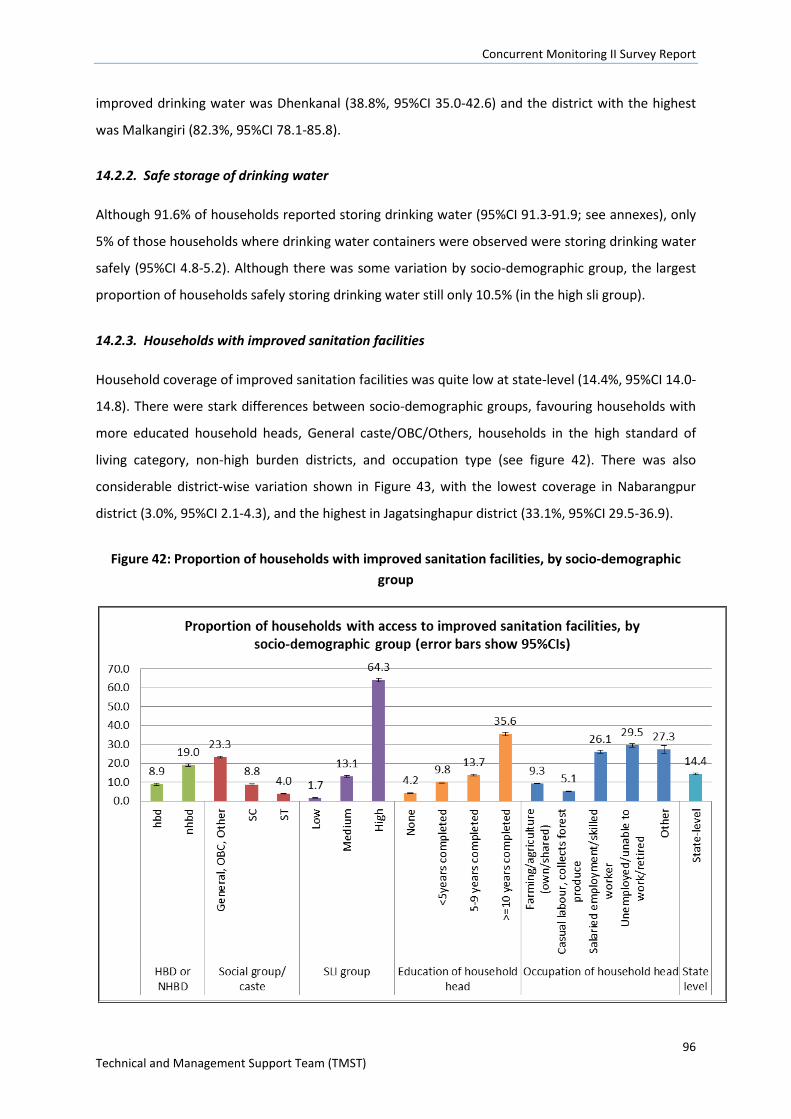
Concurrent Monitoring II Survey Report
96 Technical and Management Support Team (TMST)
improved drinking water was Dhenkanal (38.8%, 95%CI 35.0-42.6) and the district with the highest
was Malkangiri (82.3%, 95%CI 78.1-85.8).
14.2.2. Safe storage of drinking water
Although 91.6% of households reported storing drinking water (95%CI 91.3-91.9; see annexes), only
5% of those households where drinking water containers were observed were storing drinking water
safely (95%CI 4.8-5.2). Although there was some variation by socio-demographic group, the largest
proportion of households safely storing drinking water still only 10.5% (in the high sli group).
14.2.3. Households with improved sanitation facilities
Household coverage of improved sanitation facilities was quite low at state-level (14.4%, 95%CI 14.0-
14.8). There were stark differences between socio-demographic groups, favouring households with
more educated household heads, General caste/OBC/Others, households in the high standard of
living category, non-high burden districts, and occupation type (see figure 42). There was also
considerable district-wise variation shown in Figure 43, with the lowest coverage in Nabarangpur
district (3.0%, 95%CI 2.1-4.3), and the highest in Jagatsinghapur district (33.1%, 95%CI 29.5-36.9).
Figure 42: Proportion of households with improved sanitation facilities, by socio-demographic group
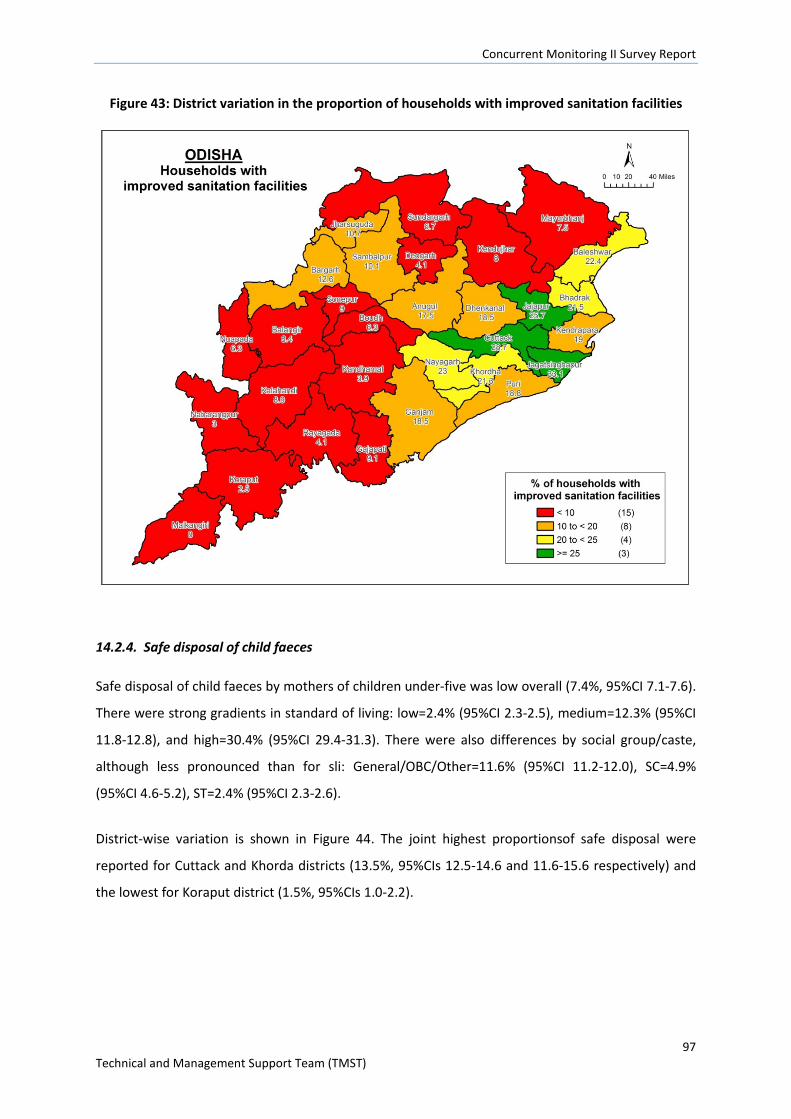
Concurrent Monitoring II Survey Report
97 Technical and Management Support Team (TMST)
Figure 43: District variation in the proportion of households with improved sanitation facilities
14.2.4. Safe disposal of child faeces
Safe disposal of child faeces by mothers of children under-five was low overall (7.4%, 95%CI 7.1-7.6).
There were strong gradients in standard of living: low=2.4% (95%CI 2.3-2.5), medium=12.3% (95%CI
11.8-12.8), and high=30.4% (95%CI 29.4-31.3). There were also differences by social group/caste,
although less pronounced than for sli: General/OBC/Other=11.6% (95%CI 11.2-12.0), SC=4.9%
(95%CI 4.6-5.2), ST=2.4% (95%CI 2.3-2.6).
District-wise variation is shown in Figure 44. The joint highest proportionsof safe disposal were
reported for Cuttack and Khorda districts (13.5%, 95%CIs 12.5-14.6 and 11.6-15.6 respectively) and
the lowest for Koraput district (1.5%, 95%CIs 1.0-2.2).
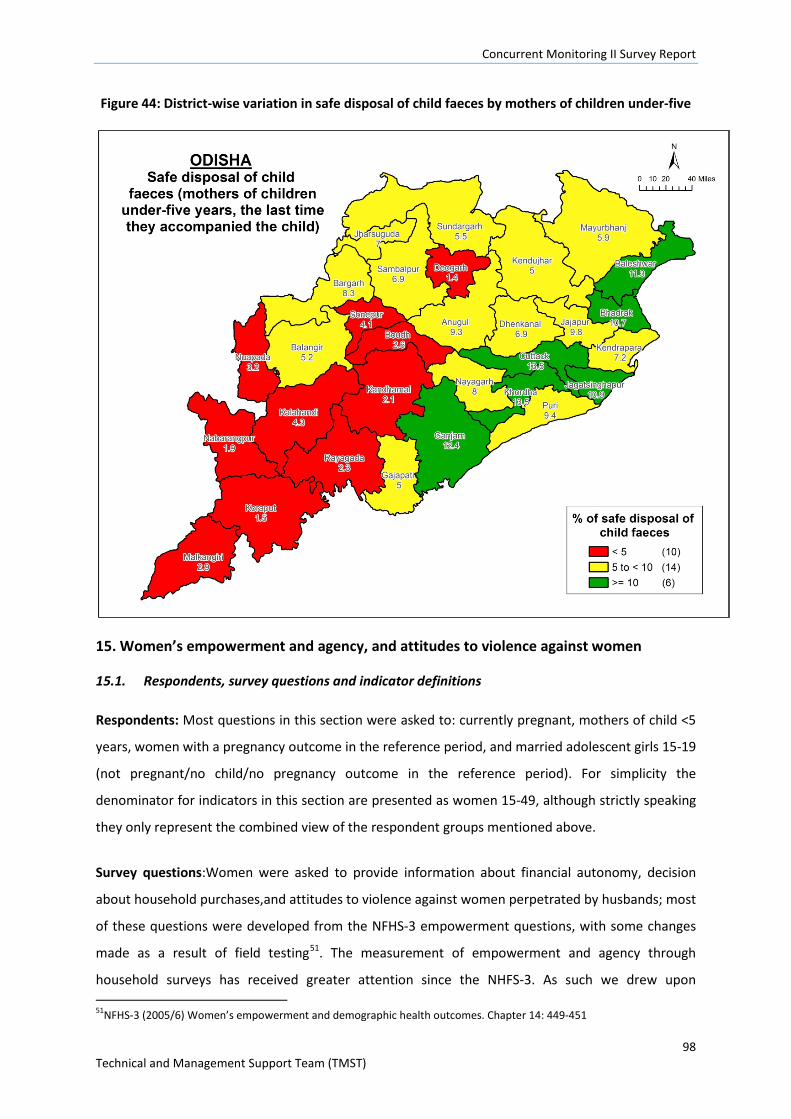
Concurrent Monitoring II Survey Report
98 Technical and Management Support Team (TMST)
Figure 44: District-wise variation in safe disposal of child faeces by mothers of children under-five
15. Women’s empowerment and agency, and attitudes to violence against women
15.1. Respondents, survey questions and indicator definitions
Respondents: Most questions in this section were asked to: currently pregnant, mothers of child <5
years, women with a pregnancy outcome in the reference period, and married adolescent girls 15-19
(not pregnant/no child/no pregnancy outcome in the reference period). For simplicity the
denominator for indicators in this section are presented as women 15-49, although strictly speaking
they only represent the combined view of the respondent groups mentioned above.
Survey questions:Women were asked to provide information about financial autonomy, decision
about household purchases,and attitudes to violence against women perpetrated by husbands; most
of these questions were developed from the NFHS-3 empowerment questions, with some changes
made as a result of field testing51. The measurement of empowerment and agency through
household surveys has received greater attention since the NHFS-3. As such we drew upon 51NFHS-3 (2005/6) Women’s empowerment and demographic health outcomes. Chapter 14: 449-451
Concurrent Monitoring II Survey Report
99 Technical and Management Support Team (TMST)
additional questions developed by the Oxford Policy Health Institute52 and the draft NFHS-4 tools
that were available to us informally at the time of developing the CCM II questionnaire53 - in
particular we have added further questions about perceived control and decision-making in
particular domains, and wider barriers (including freedom of movement) to accessing health care.
Indicator definitions and computations for women’s empowerment and agency are shown in table
28.
Table 28 Indicator definitions and computation for empowerment and agency
Indicator Definition Computation % of women 15-49 who have a bank account that only they operate
- Question source NHFS-3 - We added ‘only they
operate’ because some women do not have control over their bank account (identified in field testing)
Number of women 15-49 who have a bank account that only they operate/all women 15-49* 100
% of women 15-49 who received payment for the work they have done in the last 12 months
- Question source NHFS-3 - Denominator is women
who have worked in the last 12 months
Number of women 15-49 who received payment for the work they have done in the last 12 months/all women 15-49 who have worked in the last 12 months*100
% of women 15-49 whose spending of women’s earnings are decided by the woman herself or jointly with her husband
- Question source NHFS-3
Number of women 15-49 whose spending of women’s earnings are decided by the woman herself or jointly with her husband/ all women 15-49* 100
% of women 15-49 who have a say in the spending of their husband's earnings
- Question source NHFS-3 - Denominator excludes
women whose husbands are not working
Number of women 15-49 who have a say in the spending of their husband's earnings/ all women 15-49* 100
% of women 15-49 involved in decisions about daily/minor household purchases
- Question source NHFS-3
/Number of women 15-49 involved in decisions about daily/minor household purchases all women 15-49* 100
% of women 15-49 involved in decisions about major household purchases
- Question source NHFS-3 Number of women 15-49 involved in decisions about major household purchases / all women 15-49* 100
% of women 15-49 involved in decisions about going to visit relatives
- Question source NHFS-3 Number of women 15-49 involved in decisions about going to visit relatives / all women 15-49* 100
% of women 15-49 (married and unmarried) who believe it sometimes acceptable for a husband to hit his wife
- Question source NHFS-3 - Adapted during piloting - This question also
included unmarried women 15-49; other indicators in this section did not.
Number of women 15-49 (married and unmarried) who believe it sometimes acceptable for a husband to hit his wife/ all women 15-49* 100
% of women 15-49 reporting perceived control over personal decisions affecting daily life
- Response options: all decisions, most decisions, some decisions, no decisions
- Question source: OPHI 2007
Number of women 15-49 reporting perceived control over personal decisions affecting daily life / all women 15-49* 100
52Ibrahim,S. &Alkire,S. (2007). Agency and Empowerment: a proposal for internationally comparable indicators. OPHI Working Paper Series. 53 http://rchiips.org/NFHS/NFHS4/pdf/Final%20Pretest%20Report.pdf
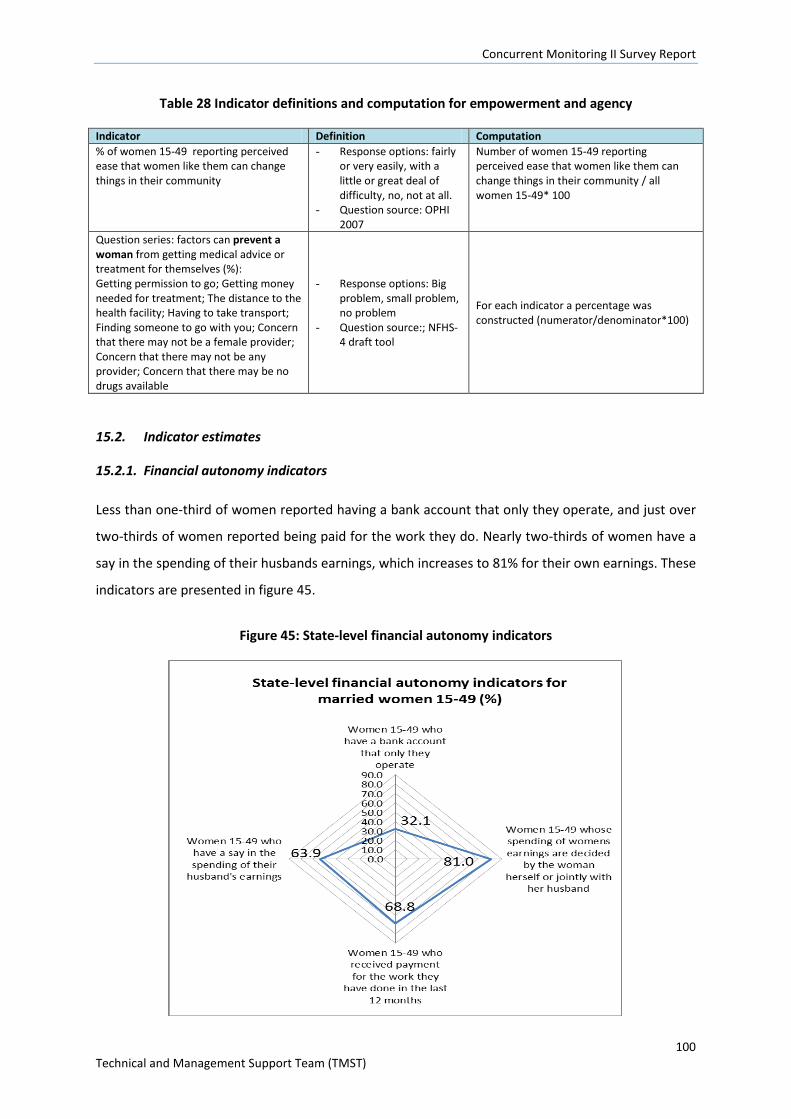
Concurrent Monitoring II Survey Report
100 Technical and Management Support Team (TMST)
Table 28 Indicator definitions and computation for empowerment and agency
Indicator Definition Computation % of women 15-49 reporting perceived ease that women like them can change things in their community
- Response options: fairly or very easily, with a little or great deal of difficulty, no, not at all.
- Question source: OPHI 2007
Number of women 15-49 reporting perceived ease that women like them can change things in their community / all women 15-49* 100
Question series: factors can prevent a woman from getting medical advice or treatment for themselves (%): Getting permission to go; Getting money needed for treatment; The distance to the health facility; Having to take transport; Finding someone to go with you; Concern that there may not be a female provider; Concern that there may not be any provider; Concern that there may be no drugs available
- Response options: Big problem, small problem, no problem
- Question source:; NFHS-4 draft tool
For each indicator a percentage was constructed (numerator/denominator*100)
15.2. Indicator estimates
15.2.1. Financial autonomy indicators
Less than one-third of women reported having a bank account that only they operate, and just over
two-thirds of women reported being paid for the work they do. Nearly two-thirds of women have a
say in the spending of their husbands earnings, which increases to 81% for their own earnings. These
indicators are presented in figure 45.
Figure 45: State-level financial autonomy indicators
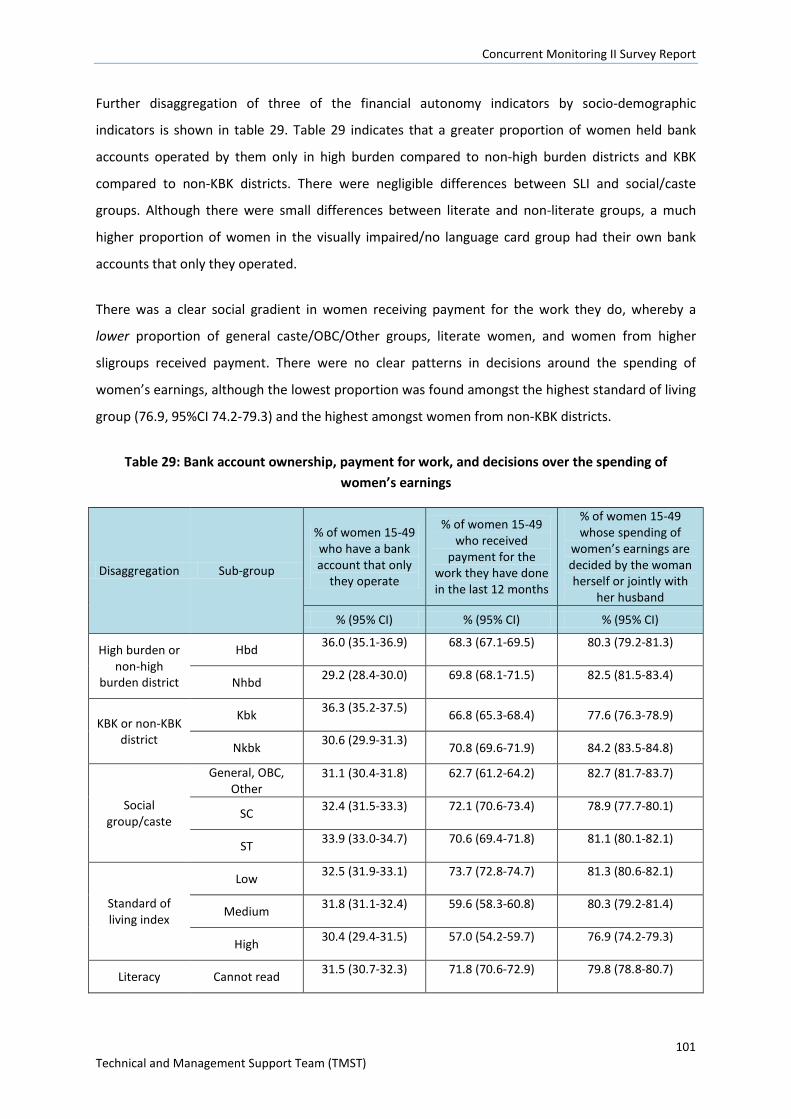
Concurrent Monitoring II Survey Report
101 Technical and Management Support Team (TMST)
Further disaggregation of three of the financial autonomy indicators by socio-demographic
indicators is shown in table 29. Table 29 indicates that a greater proportion of women held bank
accounts operated by them only in high burden compared to non-high burden districts and KBK
compared to non-KBK districts. There were negligible differences between SLI and social/caste
groups. Although there were small differences between literate and non-literate groups, a much
higher proportion of women in the visually impaired/no language card group had their own bank
accounts that only they operated.
There was a clear social gradient in women receiving payment for the work they do, whereby a
lower proportion of general caste/OBC/Other groups, literate women, and women from higher
sligroups received payment. There were no clear patterns in decisions around the spending of
women’s earnings, although the lowest proportion was found amongst the highest standard of living
group (76.9, 95%CI 74.2-79.3) and the highest amongst women from non-KBK districts.
Table 29: Bank account ownership, payment for work, and decisions over the spending of women’s earnings
Disaggregation Sub-group
% of women 15-49 who have a bank account that only
they operate
% of women 15-49 who received
payment for the work they have done in the last 12 months
% of women 15-49 whose spending of
women’s earnings are decided by the woman herself or jointly with
her husband
% (95% CI) % (95% CI) % (95% CI)
High burden or non-high
burden district
Hbd 36.0 (35.1-36.9) 68.3 (67.1-69.5) 80.3 (79.2-81.3)
Nhbd 29.2 (28.4-30.0) 69.8 (68.1-71.5) 82.5 (81.5-83.4)
KBK or non-KBK district
Kbk 36.3 (35.2-37.5) 66.8 (65.3-68.4) 77.6 (76.3-78.9)
Nkbk 30.6 (29.9-31.3) 70.8 (69.6-71.9) 84.2 (83.5-84.8)
Social group/caste
General, OBC, Other
31.1 (30.4-31.8) 62.7 (61.2-64.2) 82.7 (81.7-83.7)
SC 32.4 (31.5-33.3) 72.1 (70.6-73.4) 78.9 (77.7-80.1)
ST 33.9 (33.0-34.7) 70.6 (69.4-71.8) 81.1 (80.1-82.1)
Standard of living index
Low 32.5 (31.9-33.1) 73.7 (72.8-74.7) 81.3 (80.6-82.1)
Medium 31.8 (31.1-32.4) 59.6 (58.3-60.8) 80.3 (79.2-81.4)
High 30.4 (29.4-31.5) 57.0 (54.2-59.7) 76.9 (74.2-79.3)
Literacy Cannot read 31.5 (30.7-32.3) 71.8 (70.6-72.9) 79.8 (78.8-80.7)
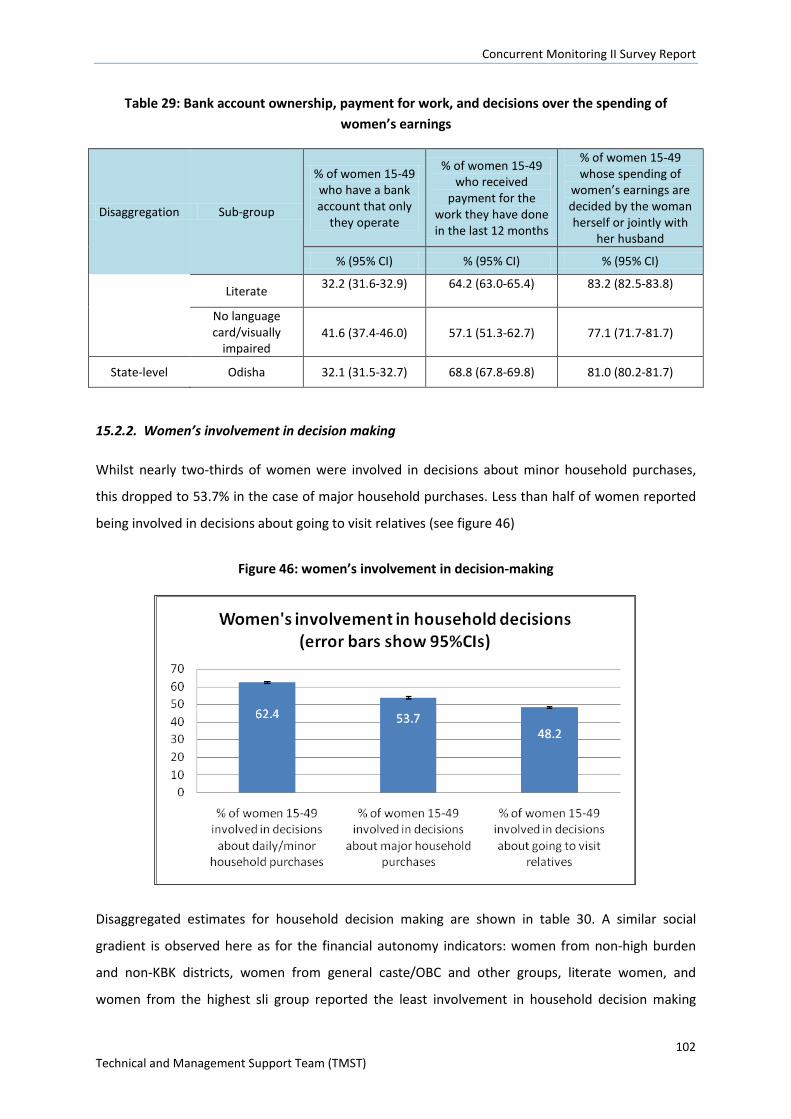
Concurrent Monitoring II Survey Report
102 Technical and Management Support Team (TMST)
Table 29: Bank account ownership, payment for work, and decisions over the spending of women’s earnings
Disaggregation Sub-group
% of women 15-49 who have a bank account that only
they operate
% of women 15-49 who received
payment for the work they have done in the last 12 months
% of women 15-49 whose spending of
women’s earnings are decided by the woman herself or jointly with
her husband
% (95% CI) % (95% CI) % (95% CI)
Literate 32.2 (31.6-32.9) 64.2 (63.0-65.4) 83.2 (82.5-83.8)
No language card/visually
impaired 41.6 (37.4-46.0) 57.1 (51.3-62.7) 77.1 (71.7-81.7)
State-level Odisha 32.1 (31.5-32.7) 68.8 (67.8-69.8) 81.0 (80.2-81.7)
15.2.2. Women’s involvement in decision making
Whilst nearly two-thirds of women were involved in decisions about minor household purchases,
this dropped to 53.7% in the case of major household purchases. Less than half of women reported
being involved in decisions about going to visit relatives (see figure 46)
Figure 46: women’s involvement in decision-making
Disaggregated estimates for household decision making are shown in table 30. A similar social
gradient is observed here as for the financial autonomy indicators: women from non-high burden
and non-KBK districts, women from general caste/OBC and other groups, literate women, and
women from the highest sli group reported the least involvement in household decision making
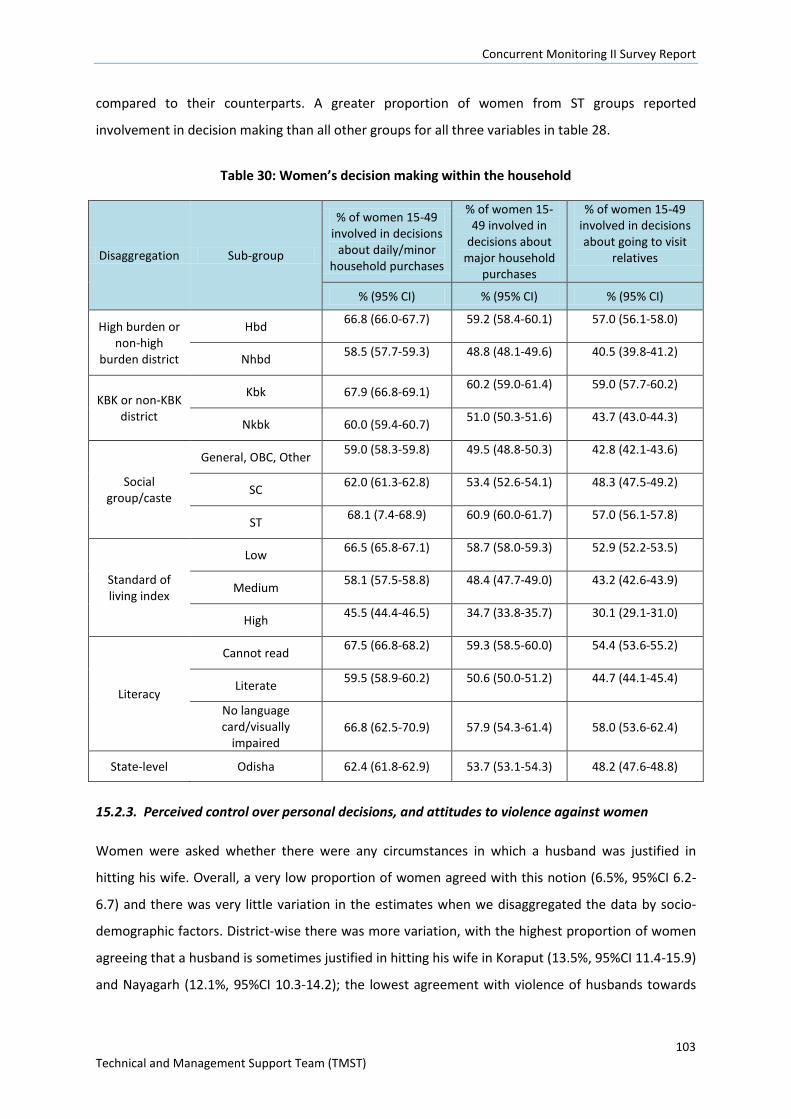
Concurrent Monitoring II Survey Report
103 Technical and Management Support Team (TMST)
compared to their counterparts. A greater proportion of women from ST groups reported
involvement in decision making than all other groups for all three variables in table 28.
Table 30: Women’s decision making within the household
Disaggregation Sub-group
% of women 15-49 involved in decisions
about daily/minor household purchases
% of women 15-49 involved in
decisions about major household
purchases
% of women 15-49 involved in decisions about going to visit
relatives
% (95% CI) % (95% CI) % (95% CI)
High burden or non-high
burden district
Hbd 66.8 (66.0-67.7) 59.2 (58.4-60.1) 57.0 (56.1-58.0)
Nhbd 58.5 (57.7-59.3) 48.8 (48.1-49.6) 40.5 (39.8-41.2)
KBK or non-KBK district
Kbk 67.9 (66.8-69.1) 60.2 (59.0-61.4) 59.0 (57.7-60.2)
Nkbk 60.0 (59.4-60.7) 51.0 (50.3-51.6) 43.7 (43.0-44.3)
Social group/caste
General, OBC, Other 59.0 (58.3-59.8) 49.5 (48.8-50.3) 42.8 (42.1-43.6)
SC 62.0 (61.3-62.8) 53.4 (52.6-54.1) 48.3 (47.5-49.2)
ST 68.1 (7.4-68.9) 60.9 (60.0-61.7) 57.0 (56.1-57.8)
Standard of living index
Low 66.5 (65.8-67.1) 58.7 (58.0-59.3) 52.9 (52.2-53.5)
Medium 58.1 (57.5-58.8) 48.4 (47.7-49.0) 43.2 (42.6-43.9)
High 45.5 (44.4-46.5) 34.7 (33.8-35.7) 30.1 (29.1-31.0)
Literacy
Cannot read 67.5 (66.8-68.2) 59.3 (58.5-60.0) 54.4 (53.6-55.2)
Literate 59.5 (58.9-60.2) 50.6 (50.0-51.2) 44.7 (44.1-45.4)
No language card/visually
impaired 66.8 (62.5-70.9) 57.9 (54.3-61.4) 58.0 (53.6-62.4)
State-level Odisha 62.4 (61.8-62.9) 53.7 (53.1-54.3) 48.2 (47.6-48.8)
15.2.3. Perceived control over personal decisions, and attitudes to violence against women
Women were asked whether there were any circumstances in which a husband was justified in
hitting his wife. Overall, a very low proportion of women agreed with this notion (6.5%, 95%CI 6.2-
6.7) and there was very little variation in the estimates when we disaggregated the data by socio-
demographic factors. District-wise there was more variation, with the highest proportion of women
agreeing that a husband is sometimes justified in hitting his wife in Koraput (13.5%, 95%CI 11.4-15.9)
and Nayagarh (12.1%, 95%CI 10.3-14.2); the lowest agreement with violence of husbands towards
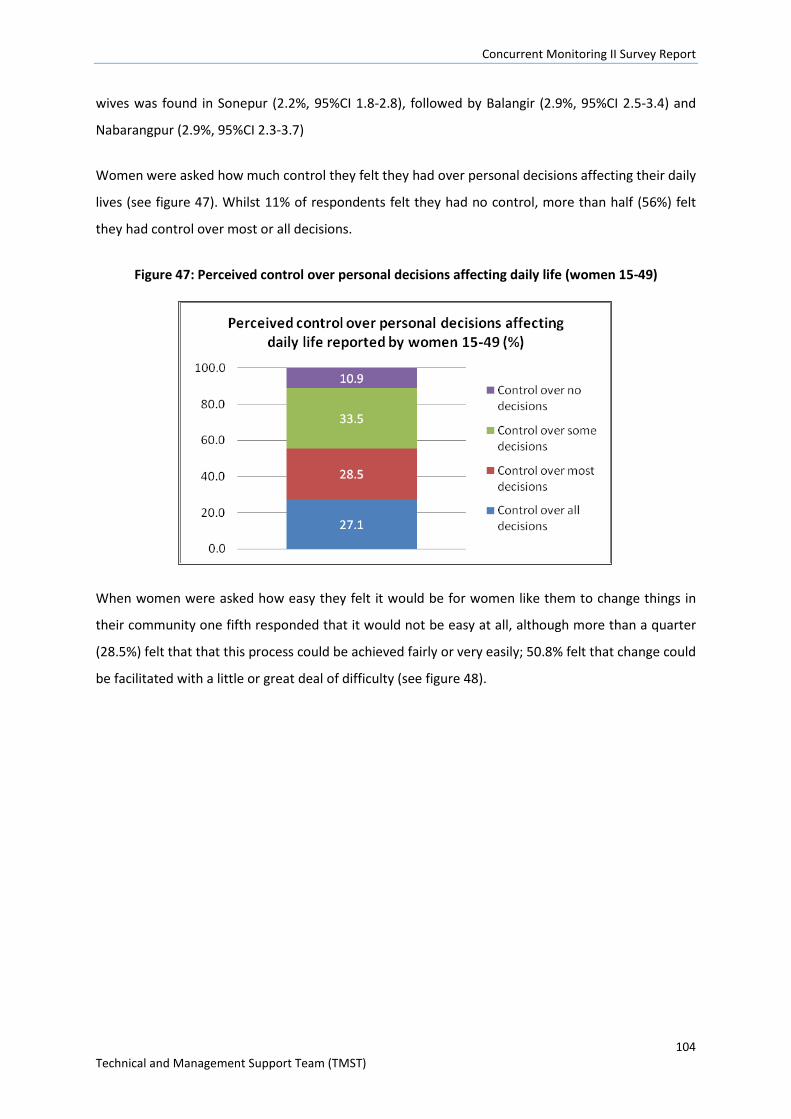
Concurrent Monitoring II Survey Report
104 Technical and Management Support Team (TMST)
wives was found in Sonepur (2.2%, 95%CI 1.8-2.8), followed by Balangir (2.9%, 95%CI 2.5-3.4) and
Nabarangpur (2.9%, 95%CI 2.3-3.7)
Women were asked how much control they felt they had over personal decisions affecting their daily
lives (see figure 47). Whilst 11% of respondents felt they had no control, more than half (56%) felt
they had control over most or all decisions.
Figure 47: Perceived control over personal decisions affecting daily life (women 15-49)
When women were asked how easy they felt it would be for women like them to change things in
their community one fifth responded that it would not be easy at all, although more than a quarter
(28.5%) felt that that this process could be achieved fairly or very easily; 50.8% felt that change could
be facilitated with a little or great deal of difficulty (see figure 48).
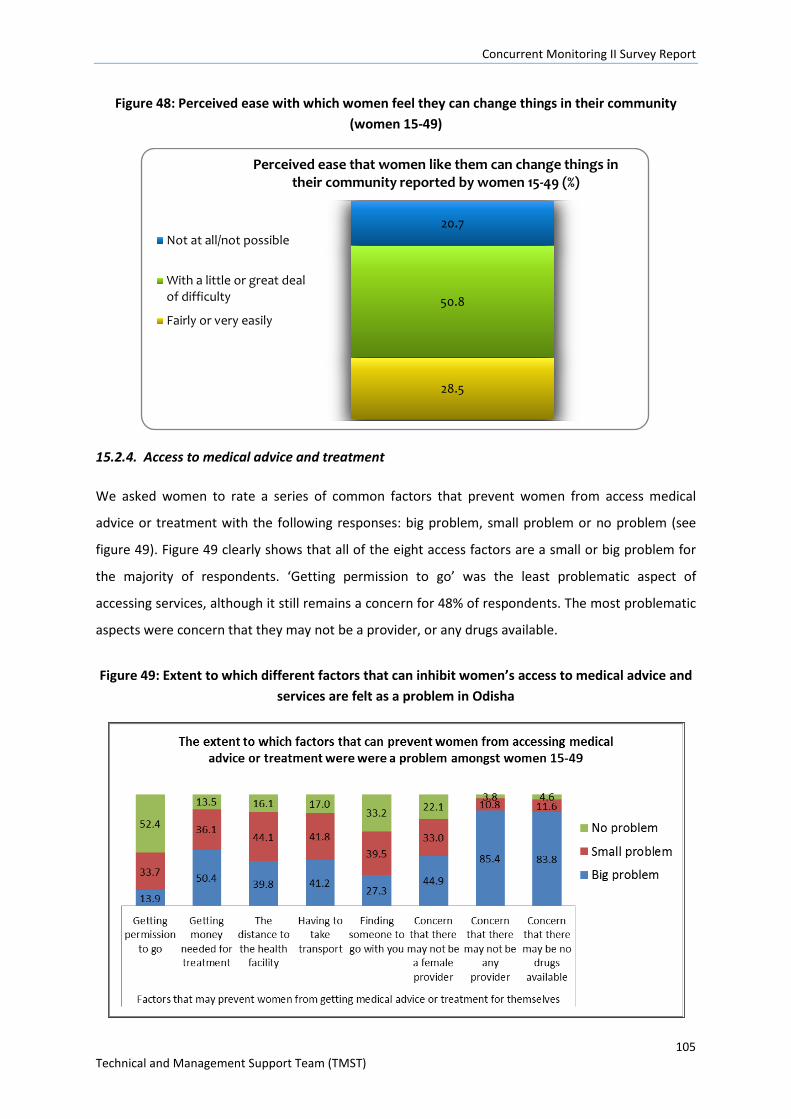
Concurrent Monitoring II Survey Report
105 Technical and Management Support Team (TMST)
Figure 48: Perceived ease with which women feel they can change things in their community (women 15-49)
15.2.4. Access to medical advice and treatment
We asked women to rate a series of common factors that prevent women from access medical
advice or treatment with the following responses: big problem, small problem or no problem (see
figure 49). Figure 49 clearly shows that all of the eight access factors are a small or big problem for
the majority of respondents. ‘Getting permission to go’ was the least problematic aspect of
accessing services, although it still remains a concern for 48% of respondents. The most problematic
aspects were concern that they may not be a provider, or any drugs available.
Figure 49: Extent to which different factors that can inhibit women’s access to medical advice and services are felt as a problem in Odisha
28.5
50.8
20.7
Perceived ease that women like them can change things in their community reported by women 15-49 (%)
Not at all/not possible
With a little or great dealof difficulty
Fairly or very easily
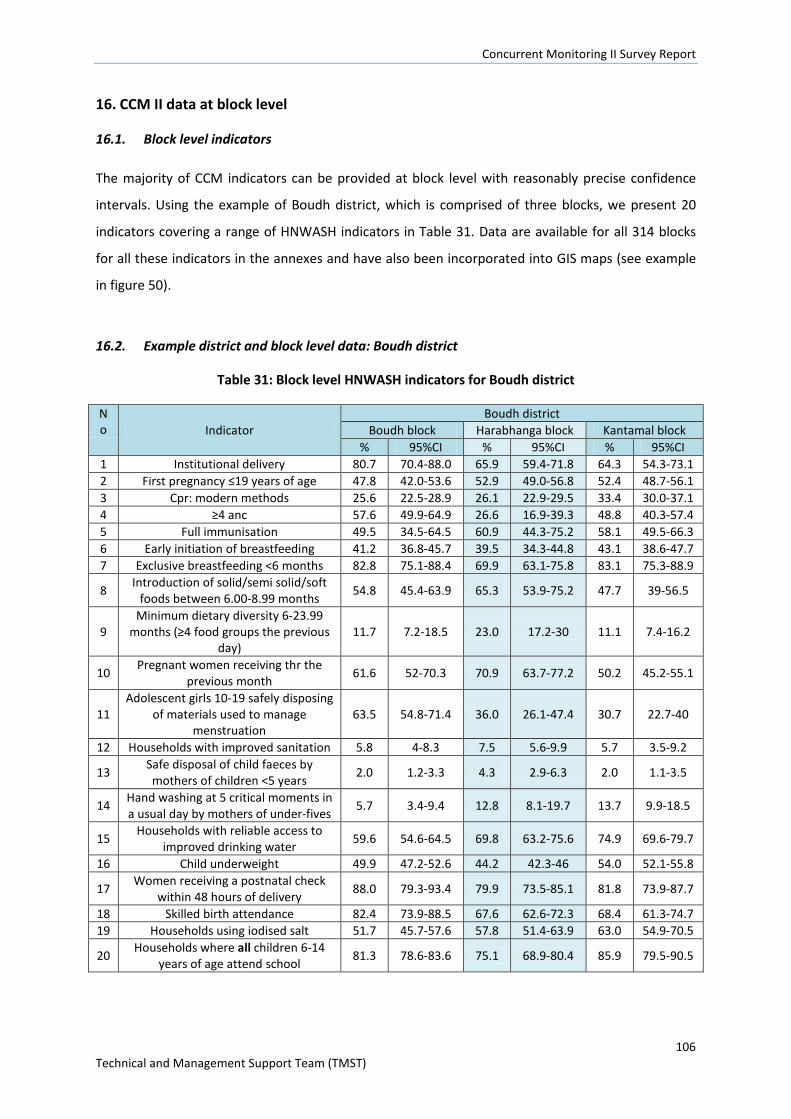
Concurrent Monitoring II Survey Report
106 Technical and Management Support Team (TMST)
16. CCM II data at block level
16.1. Block level indicators
The majority of CCM indicators can be provided at block level with reasonably precise confidence
intervals. Using the example of Boudh district, which is comprised of three blocks, we present 20
indicators covering a range of HNWASH indicators in Table 31. Data are available for all 314 blocks
for all these indicators in the annexes and have also been incorporated into GIS maps (see example
in figure 50).
16.2. Example district and block level data: Boudh district
Table 31: Block level HNWASH indicators for Boudh district
No Indicator
Boudh district Boudh block Harabhanga block Kantamal block
% 95%CI % 95%CI % 95%CI 1 Institutional delivery 80.7 70.4-88.0 65.9 59.4-71.8 64.3 54.3-73.1 2 First pregnancy ≤19 years of age 47.8 42.0-53.6 52.9 49.0-56.8 52.4 48.7-56.1 3 Cpr: modern methods 25.6 22.5-28.9 26.1 22.9-29.5 33.4 30.0-37.1 4 ≥4 anc 57.6 49.9-64.9 26.6 16.9-39.3 48.8 40.3-57.4 5 Full immunisation 49.5 34.5-64.5 60.9 44.3-75.2 58.1 49.5-66.3 6 Early initiation of breastfeeding 41.2 36.8-45.7 39.5 34.3-44.8 43.1 38.6-47.7 7 Exclusive breastfeeding <6 months 82.8 75.1-88.4 69.9 63.1-75.8 83.1 75.3-88.9
8 Introduction of solid/semi solid/soft foods between 6.00-8.99 months 54.8 45.4-63.9 65.3 53.9-75.2 47.7 39-56.5
9 Minimum dietary diversity 6-23.99
months (≥4 food groups the previous day)
11.7 7.2-18.5 23.0 17.2-30 11.1 7.4-16.2
10 Pregnant women receiving thr the previous month 61.6 52-70.3 70.9 63.7-77.2 50.2 45.2-55.1
11 Adolescent girls 10-19 safely disposing
of materials used to manage menstruation
63.5 54.8-71.4 36.0 26.1-47.4 30.7 22.7-40
12 Households with improved sanitation 5.8 4-8.3 7.5 5.6-9.9 5.7 3.5-9.2
13 Safe disposal of child faeces by mothers of children <5 years 2.0 1.2-3.3 4.3 2.9-6.3 2.0 1.1-3.5
14 Hand washing at 5 critical moments in a usual day by mothers of under-fives 5.7 3.4-9.4 12.8 8.1-19.7 13.7 9.9-18.5
15 Households with reliable access to improved drinking water 59.6 54.6-64.5 69.8 63.2-75.6 74.9 69.6-79.7
16 Child underweight 49.9 47.2-52.6 44.2 42.3-46 54.0 52.1-55.8
17 Women receiving a postnatal check within 48 hours of delivery 88.0 79.3-93.4 79.9 73.5-85.1 81.8 73.9-87.7
18 Skilled birth attendance 82.4 73.9-88.5 67.6 62.6-72.3 68.4 61.3-74.7 19 Households using iodised salt 51.7 45.7-57.6 57.8 51.4-63.9 63.0 54.9-70.5
20 Households where all children 6-14 years of age attend school 81.3 78.6-83.6 75.1 68.9-80.4 85.9 79.5-90.5
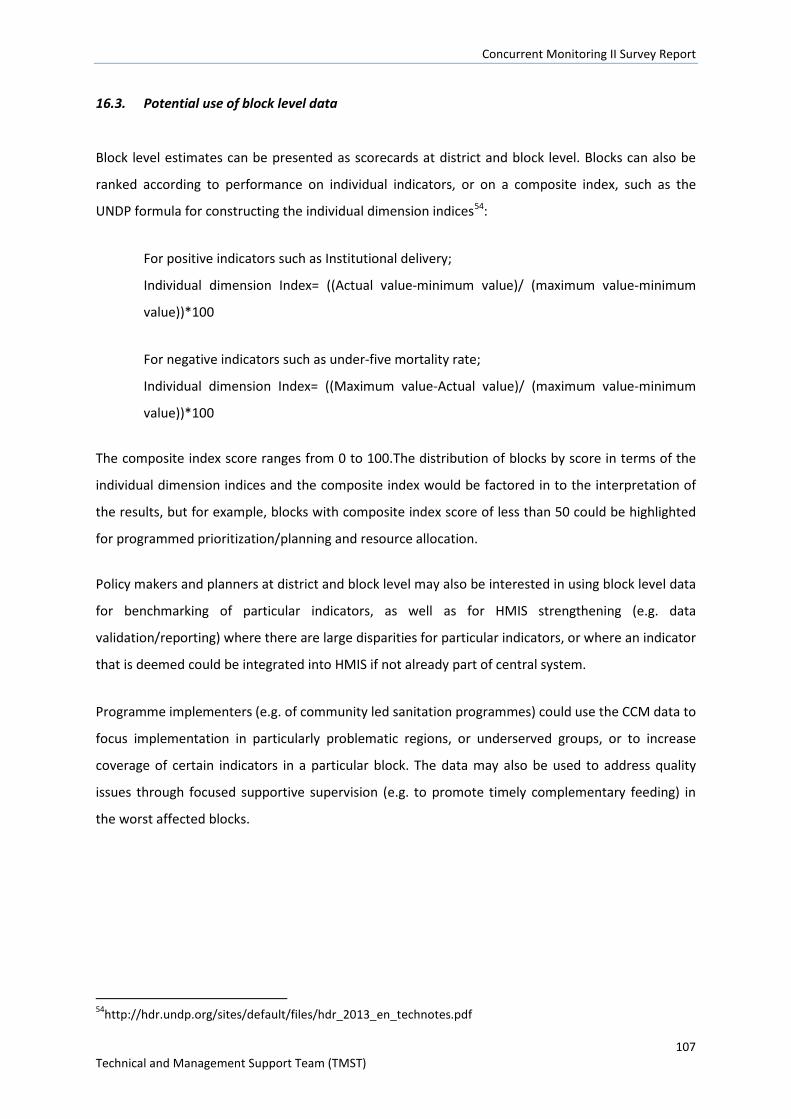
Concurrent Monitoring II Survey Report
107 Technical and Management Support Team (TMST)
16.3. Potential use of block level data
Block level estimates can be presented as scorecards at district and block level. Blocks can also be
ranked according to performance on individual indicators, or on a composite index, such as the
UNDP formula for constructing the individual dimension indices54:
For positive indicators such as Institutional delivery;
Individual dimension Index= ((Actual value-minimum value)/ (maximum value-minimum
value))*100
For negative indicators such as under-five mortality rate;
Individual dimension Index= ((Maximum value-Actual value)/ (maximum value-minimum
value))*100
The composite index score ranges from 0 to 100.The distribution of blocks by score in terms of the
individual dimension indices and the composite index would be factored in to the interpretation of
the results, but for example, blocks with composite index score of less than 50 could be highlighted
for programmed prioritization/planning and resource allocation.
Policy makers and planners at district and block level may also be interested in using block level data
for benchmarking of particular indicators, as well as for HMIS strengthening (e.g. data
validation/reporting) where there are large disparities for particular indicators, or where an indicator
that is deemed could be integrated into HMIS if not already part of central system.
Programme implementers (e.g. of community led sanitation programmes) could use the CCM data to
focus implementation in particularly problematic regions, or underserved groups, or to increase
coverage of certain indicators in a particular block. The data may also be used to address quality
issues through focused supportive supervision (e.g. to promote timely complementary feeding) in
the worst affected blocks.
54http://hdr.undp.org/sites/default/files/hdr_2013_en_technotes.pdf
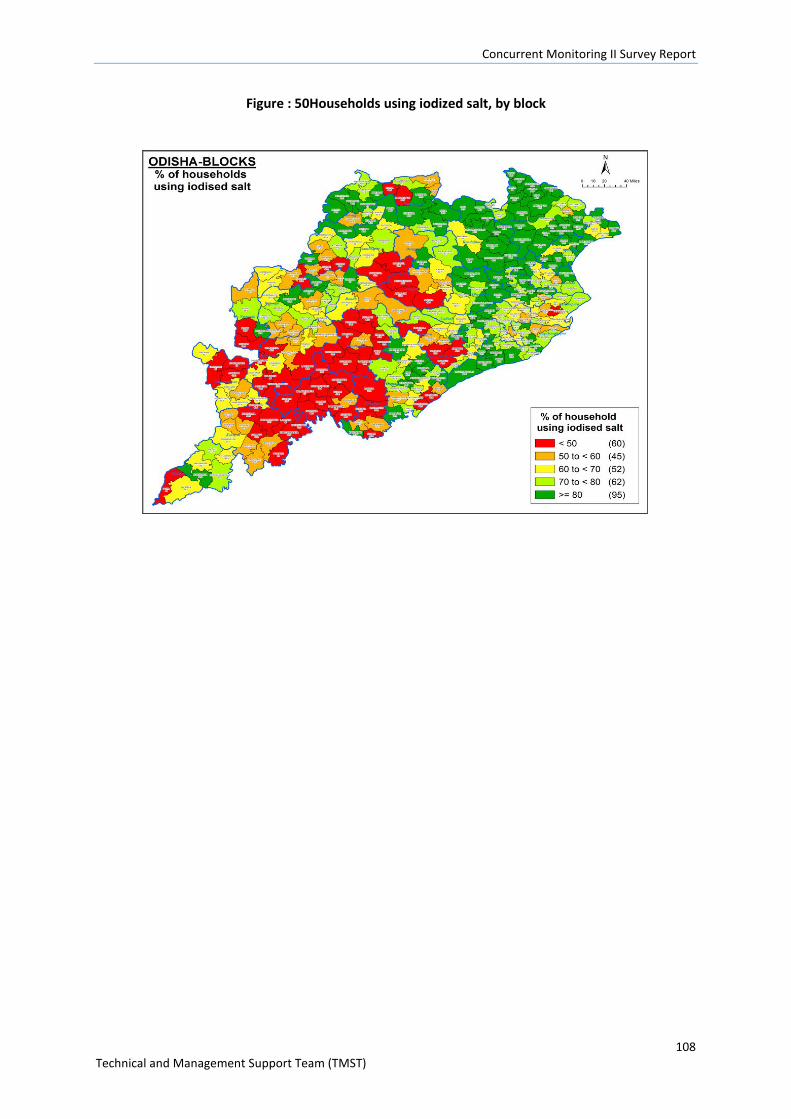
Concurrent Monitoring II Survey Report
108 Technical and Management Support Team (TMST)
Figure : 50Households using iodized salt, by block
Concurrent Monitoring II Survey Report
109 Technical and Management Support Team (TMST)
17. Frontline Health Worker survey
17.1. Training
1000 days training for all FLWS
Just over half of all FLWs had received training in 1000 days, and this did not vary substantially
between FLW cadres, although a greater proportion of FLWs in HBDs reported being trained (56.7%)
compared to NHBDs (49.7%; see figure 51).
Figure 51: Proportion of FLWs trained in 1000 days, by high burden and non-high burden districts
Induction, job and refresher training for AWWs
We further analysed the training status of AWWs, specifically in relation to induction, on the job,
and refresher training.
Just over half of AWWs had received induction training (51.9%, 95%CI 50.5-53.2), and coverage was
higher in high burden districts (58.8%, 95%CI 56.7-60.8) compared to non-high burden districts
(46.0%, 95%CI44.2-47.8). Similarly, coverage was higher in KBK districts (60%, 95%CI 57.1-62.9)
compared to non-KBK districts (48.6%, 95%CI 47.1-50.1; see Figure 51).
The majority of AWWs had received on the job training (93.3, 95%CI 92.5-93.9). The indicator did not
vary substantially by socio-demographic variables, although coverage was slightly lower for ST
groups (89.7%, 95%CI 87.6-91.4) compared to SC (93.6%, 95%CI 91.9-95.0) and General/OBC/Other
(94.3%, 95%CI 93.4-95.1; see Figure 52)
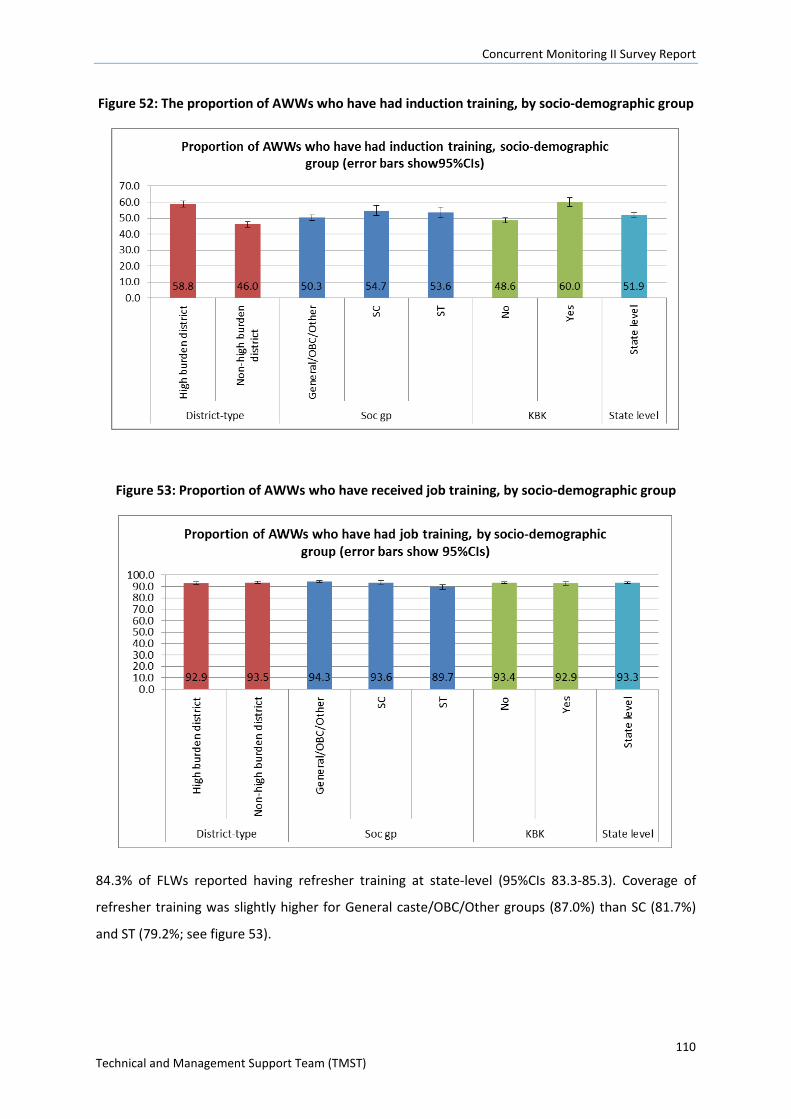
Concurrent Monitoring II Survey Report
110 Technical and Management Support Team (TMST)
Figure 52: The proportion of AWWs who have had induction training, by socio-demographic group
Figure 53: Proportion of AWWs who have received job training, by socio-demographic group
84.3% of FLWs reported having refresher training at state-level (95%CIs 83.3-85.3). Coverage of
refresher training was slightly higher for General caste/OBC/Other groups (87.0%) than SC (81.7%)
and ST (79.2%; see figure 53).
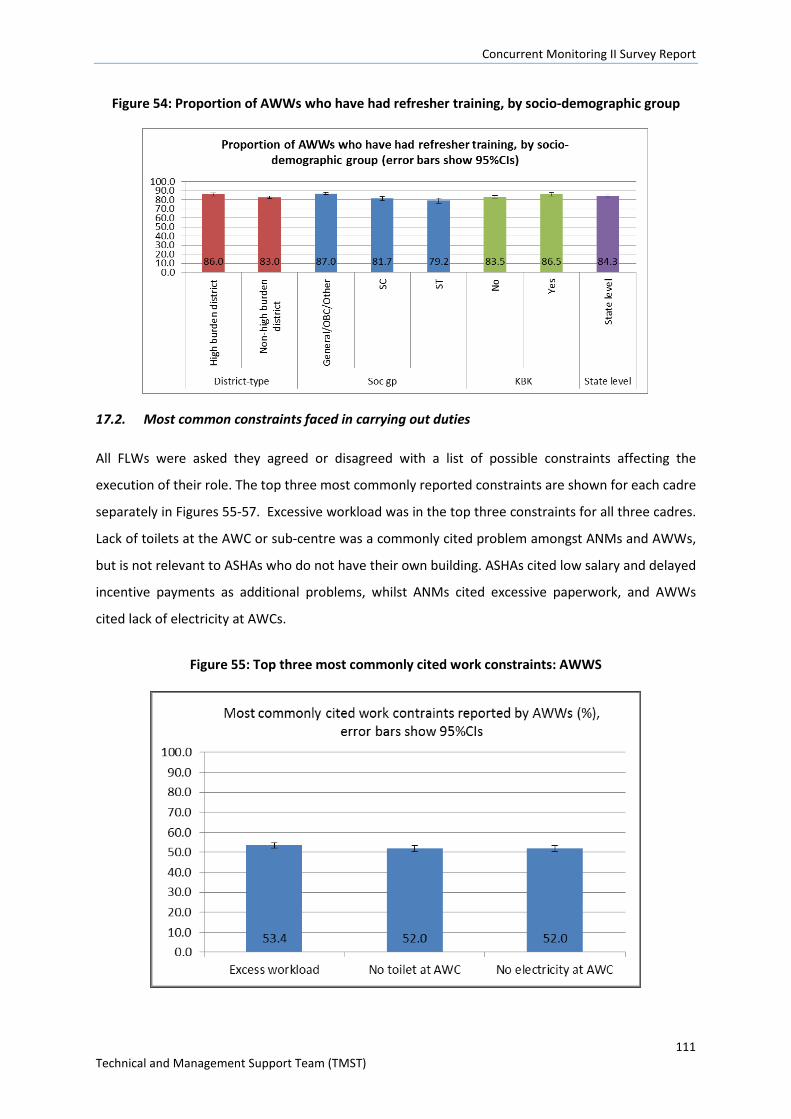
Concurrent Monitoring II Survey Report
111 Technical and Management Support Team (TMST)
Figure 54: Proportion of AWWs who have had refresher training, by socio-demographic group
17.2. Most common constraints faced in carrying out duties
All FLWs were asked they agreed or disagreed with a list of possible constraints affecting the
execution of their role. The top three most commonly reported constraints are shown for each cadre
separately in Figures 55-57. Excessive workload was in the top three constraints for all three cadres.
Lack of toilets at the AWC or sub-centre was a commonly cited problem amongst ANMs and AWWs,
but is not relevant to ASHAs who do not have their own building. ASHAs cited low salary and delayed
incentive payments as additional problems, whilst ANMs cited excessive paperwork, and AWWs
cited lack of electricity at AWCs.
Figure 55: Top three most commonly cited work constraints: AWWS
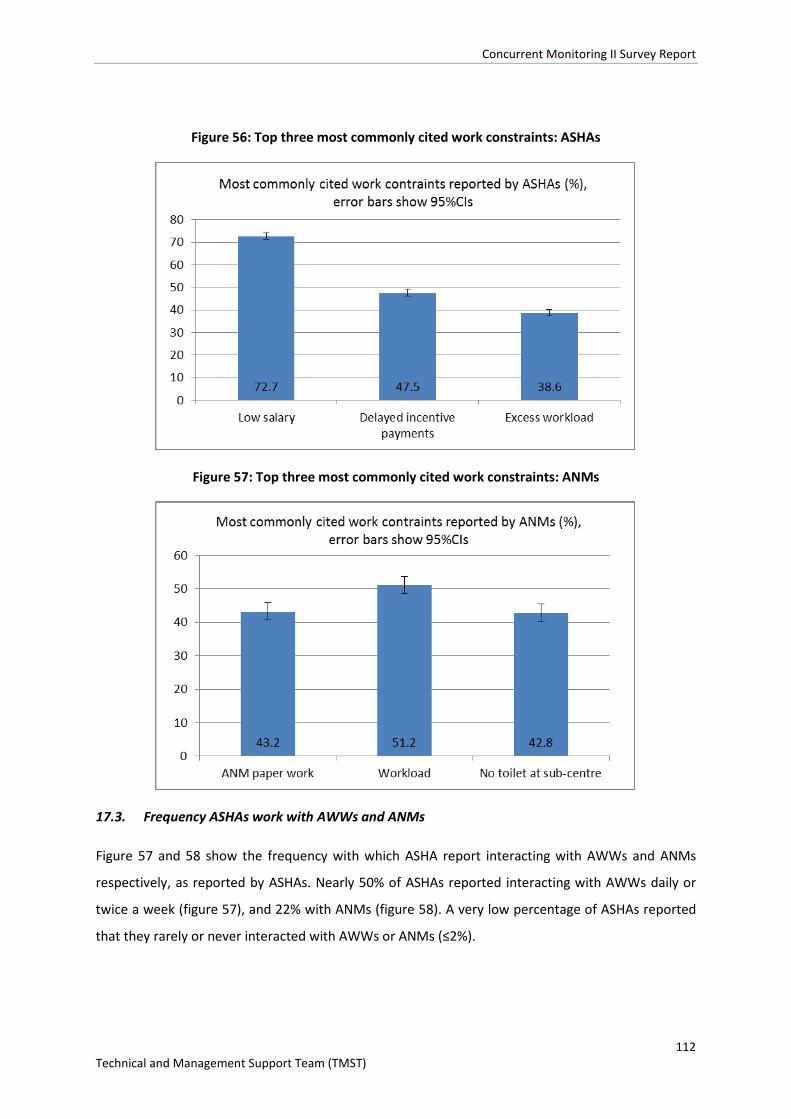
Concurrent Monitoring II Survey Report
112 Technical and Management Support Team (TMST)
Figure 56: Top three most commonly cited work constraints: ASHAs
Figure 57: Top three most commonly cited work constraints: ANMs
17.3. Frequency ASHAs work with AWWs and ANMs
Figure 57 and 58 show the frequency with which ASHA report interacting with AWWs and ANMs
respectively, as reported by ASHAs. Nearly 50% of ASHAs reported interacting with AWWs daily or
twice a week (figure 57), and 22% with ANMs (figure 58). A very low percentage of ASHAs reported
that they rarely or never interacted with AWWs or ANMs (≤2%).
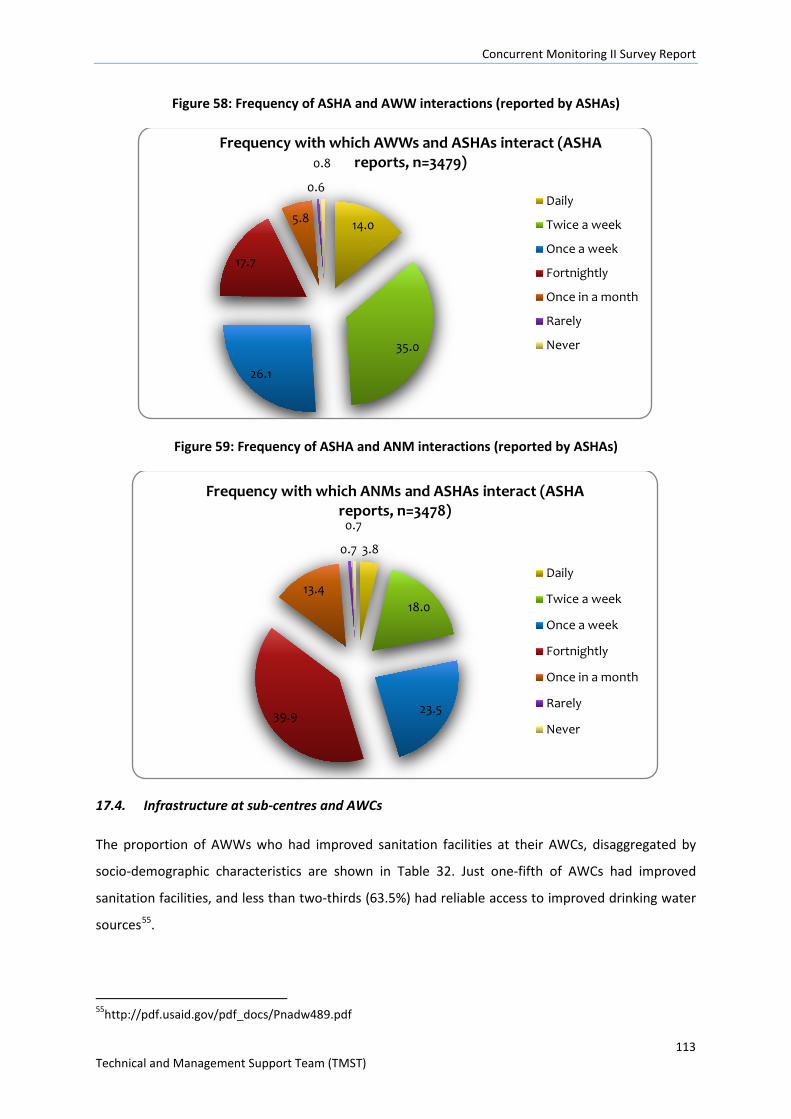
Concurrent Monitoring II Survey Report
113 Technical and Management Support Team (TMST)
Figure 58: Frequency of ASHA and AWW interactions (reported by ASHAs)
Figure 59: Frequency of ASHA and ANM interactions (reported by ASHAs)
17.4. Infrastructure at sub-centres and AWCs
The proportion of AWWs who had improved sanitation facilities at their AWCs, disaggregated by
socio-demographic characteristics are shown in Table 32. Just one-fifth of AWCs had improved
sanitation facilities, and less than two-thirds (63.5%) had reliable access to improved drinking water
sources55.
55http://pdf.usaid.gov/pdf_docs/Pnadw489.pdf
14.0
35.0
26.1
17.7
5.8
0.6
0.8 Frequency with which AWWs and ASHAs interact (ASHA
reports, n=3479)
Daily
Twice a week
Once a week
Fortnightly
Once in a month
Rarely
Never
3.8
18.0
23.5 39.9
13.4
0.7
0.7
Frequency with which ANMs and ASHAs interact (ASHA reports, n=3478)
Daily
Twice a week
Once a week
Fortnightly
Once in a month
Rarely
Never
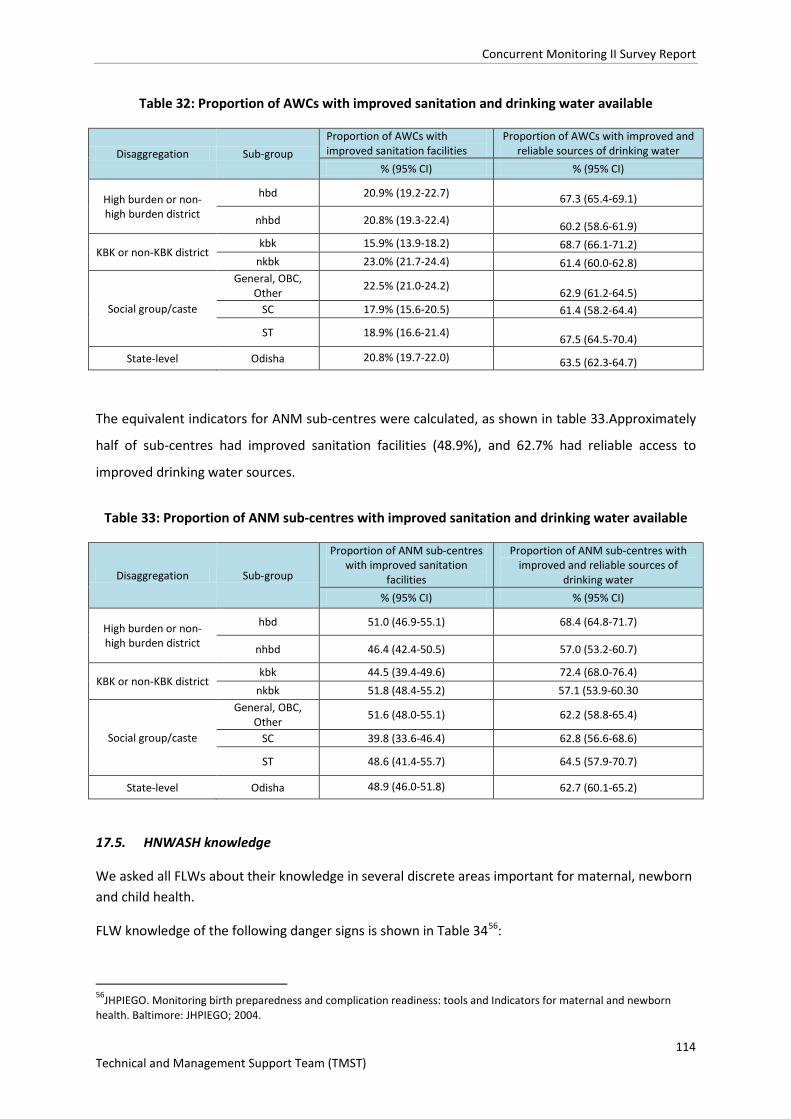
Concurrent Monitoring II Survey Report
114 Technical and Management Support Team (TMST)
Table 32: Proportion of AWCs with improved sanitation and drinking water available
Disaggregation Sub-group Proportion of AWCs with improved sanitation facilities
Proportion of AWCs with improved and reliable sources of drinking water
% (95% CI) % (95% CI)
High burden or non-high burden district
hbd 20.9% (19.2-22.7) 67.3 (65.4-69.1)
nhbd 20.8% (19.3-22.4) 60.2 (58.6-61.9)
KBK or non-KBK district kbk 15.9% (13.9-18.2) 68.7 (66.1-71.2)
nkbk 23.0% (21.7-24.4) 61.4 (60.0-62.8)
Social group/caste
General, OBC, Other 22.5% (21.0-24.2) 62.9 (61.2-64.5)
SC 17.9% (15.6-20.5) 61.4 (58.2-64.4)
ST 18.9% (16.6-21.4) 67.5 (64.5-70.4)
State-level Odisha 20.8% (19.7-22.0) 63.5 (62.3-64.7)
The equivalent indicators for ANM sub-centres were calculated, as shown in table 33.Approximately
half of sub-centres had improved sanitation facilities (48.9%), and 62.7% had reliable access to
improved drinking water sources.
Table 33: Proportion of ANM sub-centres with improved sanitation and drinking water available
Disaggregation Sub-group
Proportion of ANM sub-centres with improved sanitation
facilities
Proportion of ANM sub-centres with improved and reliable sources of
drinking water % (95% CI) % (95% CI)
High burden or non-high burden district
hbd 51.0 (46.9-55.1) 68.4 (64.8-71.7)
nhbd 46.4 (42.4-50.5) 57.0 (53.2-60.7)
KBK or non-KBK district kbk 44.5 (39.4-49.6) 72.4 (68.0-76.4)
nkbk 51.8 (48.4-55.2) 57.1 (53.9-60.30
Social group/caste
General, OBC, Other 51.6 (48.0-55.1) 62.2 (58.8-65.4)
SC 39.8 (33.6-46.4) 62.8 (56.6-68.6)
ST 48.6 (41.4-55.7) 64.5 (57.9-70.7)
State-level Odisha 48.9 (46.0-51.8) 62.7 (60.1-65.2)
17.5. HNWASH knowledge
We asked all FLWs about their knowledge in several discrete areas important for maternal, newborn and child health.
FLW knowledge of the following danger signs is shown in Table 3456:
56JHPIEGO. Monitoring birth preparedness and complication readiness: tools and Indicators for maternal and newborn health. Baltimore: JHPIEGO; 2004.
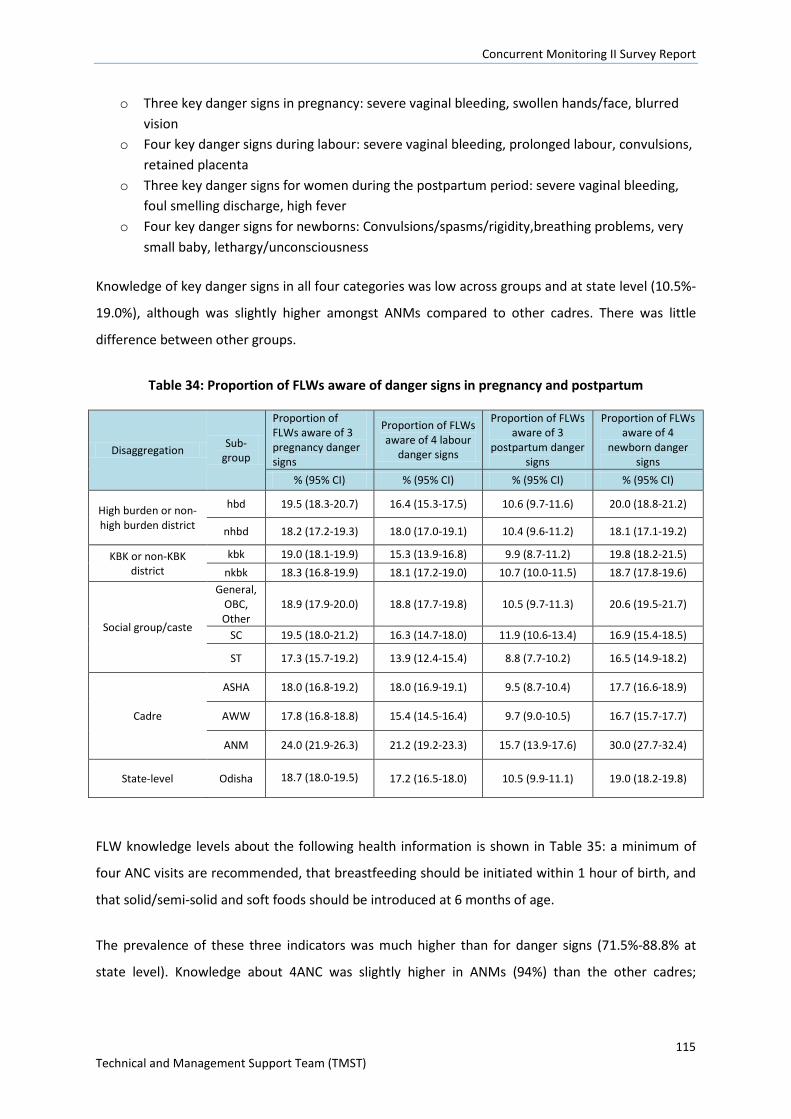
Concurrent Monitoring II Survey Report
115 Technical and Management Support Team (TMST)
o Three key danger signs in pregnancy: severe vaginal bleeding, swollen hands/face, blurred vision
o Four key danger signs during labour: severe vaginal bleeding, prolonged labour, convulsions, retained placenta
o Three key danger signs for women during the postpartum period: severe vaginal bleeding, foul smelling discharge, high fever
o Four key danger signs for newborns: Convulsions/spasms/rigidity,breathing problems, very small baby, lethargy/unconsciousness
Knowledge of key danger signs in all four categories was low across groups and at state level (10.5%-
19.0%), although was slightly higher amongst ANMs compared to other cadres. There was little
difference between other groups.
Table 34: Proportion of FLWs aware of danger signs in pregnancy and postpartum
Disaggregation Sub-group
Proportion of FLWs aware of 3 pregnancy danger signs
Proportion of FLWs aware of 4 labour
danger signs
Proportion of FLWs aware of 3
postpartum danger signs
Proportion of FLWs aware of 4
newborn danger signs
% (95% CI) % (95% CI) % (95% CI) % (95% CI)
High burden or non-high burden district
hbd 19.5 (18.3-20.7) 16.4 (15.3-17.5) 10.6 (9.7-11.6) 20.0 (18.8-21.2)
nhbd 18.2 (17.2-19.3) 18.0 (17.0-19.1) 10.4 (9.6-11.2) 18.1 (17.1-19.2)
KBK or non-KBK district
kbk 19.0 (18.1-19.9) 15.3 (13.9-16.8) 9.9 (8.7-11.2) 19.8 (18.2-21.5) nkbk 18.3 (16.8-19.9) 18.1 (17.2-19.0) 10.7 (10.0-11.5) 18.7 (17.8-19.6)
Social group/caste
General, OBC, Other
18.9 (17.9-20.0) 18.8 (17.7-19.8) 10.5 (9.7-11.3) 20.6 (19.5-21.7)
SC 19.5 (18.0-21.2) 16.3 (14.7-18.0) 11.9 (10.6-13.4) 16.9 (15.4-18.5)
ST 17.3 (15.7-19.2) 13.9 (12.4-15.4) 8.8 (7.7-10.2) 16.5 (14.9-18.2)
Cadre
ASHA 18.0 (16.8-19.2) 18.0 (16.9-19.1) 9.5 (8.7-10.4) 17.7 (16.6-18.9)
AWW 17.8 (16.8-18.8) 15.4 (14.5-16.4) 9.7 (9.0-10.5) 16.7 (15.7-17.7)
ANM 24.0 (21.9-26.3) 21.2 (19.2-23.3) 15.7 (13.9-17.6) 30.0 (27.7-32.4)
State-level Odisha 18.7 (18.0-19.5) 17.2 (16.5-18.0) 10.5 (9.9-11.1) 19.0 (18.2-19.8)
FLW knowledge levels about the following health information is shown in Table 35: a minimum of
four ANC visits are recommended, that breastfeeding should be initiated within 1 hour of birth, and
that solid/semi-solid and soft foods should be introduced at 6 months of age.
The prevalence of these three indicators was much higher than for danger signs (71.5%-88.8% at
state level). Knowledge about 4ANC was slightly higher in ANMs (94%) than the other cadres;
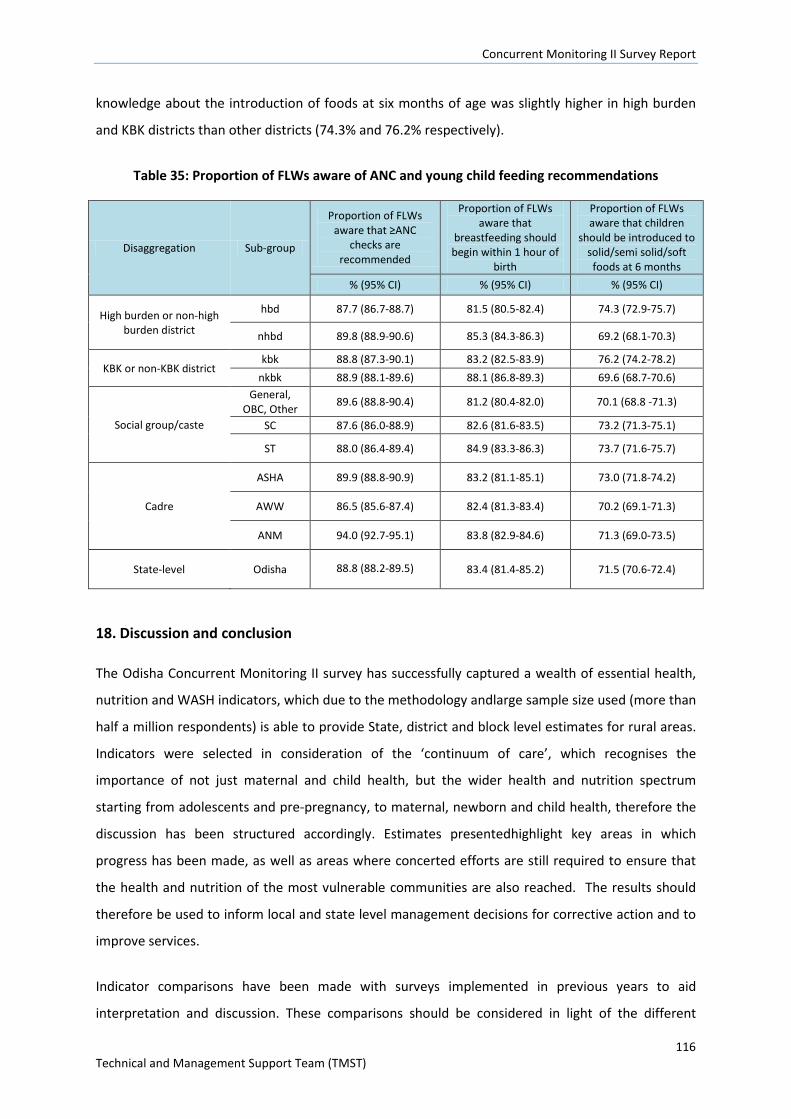
Concurrent Monitoring II Survey Report
116 Technical and Management Support Team (TMST)
knowledge about the introduction of foods at six months of age was slightly higher in high burden
and KBK districts than other districts (74.3% and 76.2% respectively).
Table 35: Proportion of FLWs aware of ANC and young child feeding recommendations
Disaggregation Sub-group
Proportion of FLWs aware that ≥ANC
checks are recommended
Proportion of FLWs aware that
breastfeeding should begin within 1 hour of
birth
Proportion of FLWs aware that children
should be introduced to solid/semi solid/soft foods at 6 months
% (95% CI) % (95% CI) % (95% CI)
High burden or non-high burden district
hbd 87.7 (86.7-88.7) 81.5 (80.5-82.4) 74.3 (72.9-75.7)
nhbd 89.8 (88.9-90.6) 85.3 (84.3-86.3) 69.2 (68.1-70.3)
KBK or non-KBK district kbk 88.8 (87.3-90.1) 83.2 (82.5-83.9) 76.2 (74.2-78.2)
nkbk 88.9 (88.1-89.6) 88.1 (86.8-89.3) 69.6 (68.7-70.6)
Social group/caste
General, OBC, Other 89.6 (88.8-90.4) 81.2 (80.4-82.0) 70.1 (68.8 -71.3)
SC 87.6 (86.0-88.9) 82.6 (81.6-83.5) 73.2 (71.3-75.1)
ST 88.0 (86.4-89.4) 84.9 (83.3-86.3) 73.7 (71.6-75.7)
Cadre
ASHA 89.9 (88.8-90.9) 83.2 (81.1-85.1) 73.0 (71.8-74.2)
AWW 86.5 (85.6-87.4) 82.4 (81.3-83.4) 70.2 (69.1-71.3)
ANM 94.0 (92.7-95.1) 83.8 (82.9-84.6) 71.3 (69.0-73.5)
State-level Odisha 88.8 (88.2-89.5) 83.4 (81.4-85.2) 71.5 (70.6-72.4)
18. Discussion and conclusion
The Odisha Concurrent Monitoring II survey has successfully captured a wealth of essential health,
nutrition and WASH indicators, which due to the methodology andlarge sample size used (more than
half a million respondents) is able to provide State, district and block level estimates for rural areas.
Indicators were selected in consideration of the ‘continuum of care’, which recognises the
importance of not just maternal and child health, but the wider health and nutrition spectrum
starting from adolescents and pre-pregnancy, to maternal, newborn and child health, therefore the
discussion has been structured accordingly. Estimates presentedhighlight key areas in which
progress has been made, as well as areas where concerted efforts are still required to ensure that
the health and nutrition of the most vulnerable communities are also reached. The results should
therefore be used to inform local and state level management decisions for corrective action and to
improve services.
Indicator comparisons have been made with surveys implemented in previous years to aid
interpretation and discussion. These comparisons should be considered in light of the different
Concurrent Monitoring II Survey Report
117 Technical and Management Support Team (TMST)
survey methodologies used. For example, for household level sampling, CCM II used a Census based
approach and randomly sampled GPs and villages, and then interviewed all eligible participants in
the selected villages. CCMI however randomly sampled five sub-centres within in block, identified
functioning AWCs, and then systematically sampled households and facilities at the AWC level, and
therefore favoured sub-centres and AWCs that are functional, meaning that underserved villages
and households might be left out. In Rapid Survey of Children (RSOC) selection of PSUs was similar to
the National Family Health Survey 2005-06. PSUs were selected using Probability Proportional to Size
(PPS) with replacement and from each PSU; selection of 26 households was done by circular
systematic random sampling in a manner that 20 households from households having at least one
child below 6 years of age and 6 households from other households. All AWCin the selected PSU /
Segmented PSUs were selected in the sample. Overall 2655 rural PSUs and 1497 urban PSU’s were
covered.
The Sample design adopted for Annual Health Survey is a uni-stage stratified simple random sample
without replacement except in case of larger villages in rural areas ( population more than or equal
to 2000 as per 2001 Census), wherein a two stage stratified sampling has been applied. The sample
units are Census Enumeration Blocks (CEBs) in urban areas and villages in rural areas. In rural areas,
the villages have been divided into two strata. Stratum I comprises villages with population less than
2000 and Stratum II contains villages with population 2000 or more. Smaller villages with population
less than 200 were excluded from the sampling frame in such a manner that the total population of
villages so excluded did not exceed 2 per cent of the total population of the district. In case of
Stratum I, the entire village is the sample unit. In case of Stratum II, the village has been divided into
mutually exclusive (non-overlapping) and geographically contiguous units comprising group of EBs
called segments of more or less equal size and population not exceeding 2000 in any case. One
segment from the frame of segments thus prepared was selected in a random manner to represent
the selected village at the second stage of sampling.
The number of sample villages in each district was allocated between the two strata proportionally
to their size (population). The villages within each size stratum were further ordered by the female
literacy rate based on the Census 2001 data, and three disjoint and equal size substrata were
established. The sample villages within each substratum were selected by simple random sampling
without replacement. Similarly, in urban areas, the Census Enumeration Blocks within a district were
ordered by the female literacy rate based on the Census 2001 data, and three disjoint and equal size
substrata were established.
Concurrent Monitoring II Survey Report
118 Technical and Management Support Team (TMST)
The sample Census Enumeration Blocks within each substratum were selected by simple random
sampling without replacement. Thus, female literacy which has a direct bearing on the fertility
behaviour was used for implicit stratification. Further, the process of selection ensured equal
representation across three sub-strata both in rural as well as in urban areas of a district besides
rendering the sample design as self-weighting. CCMII indicators therefore provide the most precise
and representative estimates.
18.1. HNWASH service coverage and outcomes for adolescent girls
Improving pre-pregnancy nutritional status of women is important for both mother and child, and
micronutrient deficiencies such as anaemia during pregnancy can have severe consequences for
both. Adolescent girls are at higher risk of anaemia due to rapid growth. Intermittent IFA
supplementation is widely used as a method of improving pre-pregnancy nutritional status and has
been identified as a feasible and effective method of improving haemoglobin status in adolescent
girls in the Indian context57. In Odisha, IFA supplementation is provided through programmes such as
SABALA programme and Kishori Shakti Yojana, and is usually provided to adolescent girls at school.
IFA coverage was low at state level, and less than one fifth of adolescent girls received supplements
(17.5%, 95%CI 17.1-17.9), and of these girls, just over half reported consuming it (53.6%, 95%CI 52.7-
54.5). Coverage of IFA was similarly low for pregnant women (see below). Reasons for low coverage
may be due to a number of reasons including lack of supplies, or distribution days (although this has
not been investigated), and that around 20% of adolescent girls in rural Odisha do not attend school
(the 2012-13 AHS found that 83.1% of females aged 6-17 years of age in rural areas attended
school). Low consumption levels may be aggravated by lack of knowledge as to the benefits of taking
IFA supplements, as well as possible side effects such as nausea and constipation. Efforts to further
investigate reasons for low coverage and consumption would be warranted given that in 2005/06
(NFHS) the prevalence of anaemia (haemoglobin <12g/dl) in girls 15-19 years of age was very high at
61.4%.
Access to education for girls is another important policy priority, and lack of modern sanitary
products and hygiene facilities at school can be a significant barrier to education. Encouragingly, 83%
of girls reported that they were allowed to attend school while they were menstruating, although,
57 Gupta et al. C Combating Iron Deficiency Anemia among School Going Adolescent Girls in a Hilly State of North India: Effectiveness of Intermittent Versus Daily Administration of Iron Folic Acid Tablets. Int J Prev Med. 2014 Nov; 5(11): 1475–1479.
Concurrent Monitoring II Survey Report
119 Technical and Management Support Team (TMST)
around 11-22.4% (depending on the socio-demographic group) reported that they missed 3+ days of
school in the last month due to menstruation, and 10-17.8% reported that they missed 1-2 days.
The data indicates that possible reasons for missing school days during menstruation could be that
schools do not consistently provide adequate sanitation facilities to manage menstruation, and
adolescent’s knowledge about menstruation was fairly low. School based facilities for managing
menstrual hygiene showed room for improvement; although 80% of school going girls reported that
separate toilets were available for males and females, only half (47.6%) reported that soap was
available, two thirds (62.9%) reported that schools provided a place to dispose of menstrual
materials, and three quarters (76.6%) reported that schools provided adequate safety and privacy to
change a cloth. Although nearly all girls used either use a cloth or a sanitary pad, less than half
(44.6%) were aware that sanitary pads could be used to manage menstruation, and just over half
(58.2%) were aware that cloths could be used. Sanitary pads were also more commonly used by
more advantaged groups, for example, nearly double the prevalence of girls used sanitary pads in
the high sli group (66.1%) compared to low sli groups (34.5%). Additionally just 15.1% (95%CI 14.7-
15.5) of girls were aware of the scheme to provide subsidised sanitary napkins via ASHAs. Assuming
availability of sanitary napkins is not an issue, efforts should be made to increase girls’ awareness of
the scheme to provide sanitary napkins, for example through raising awareness in school, or through
programmes such as Shakti Varta and other community based interventions. The recently adopted
Reproductive, Maternal, Newborn, Child, and Adolescent (RMNCH+A) forum may also provide a
useful backdrop in which to do this. Such efforts may help reduce the number of girls missing school
due to menstruation.
18.2. HNWASH service coverage and outcomes for pregnant women.
Good care during pregnancy is important for the mother as well as the future development of her
baby, and a key avenue for improving health and wellness during pregnancy is through ANC,
delivered by a qualified health professional. WHO recommends a minimum of four antenatal visits,
which should include provision of tetanus toxoid vaccination, education on identification or warning
signs during pregnancy, and treatment for infections. Commonly this also includes distribution of IFA
tablets/syrup.
In rural Odisha state, ANC coverage was fairly low, and appears to have changed little since 2005/06
(NFHS). Nearly two thirds of women had three ANC checks (63.7%, 95%CI 62.9-64.6), compared to
58% in 2005/06 (NFHS). However, less than half of the women interviewed had four ANC visits
during their last pregnancy (42.7%, 95%CI41.9-43.6).
Concurrent Monitoring II Survey Report
120 Technical and Management Support Team (TMST)
Despite significant disparities in the coverage of three or four ANC visits,progress has been made in
closing the equity gap for key ANC services and other Maternal, Neonatal and Child (MNCH) services
(see subsequent sections). Results showed asignificantly lower proportion of women from HBD, ST
and SC groups, and lower sli groups received three or four ANC checks compared to more
advantaged groups. For example, 56.2% of women from the ST caste received at least 3 ANC visits
compared to 72.5% in the general/OBC/other group, or 63.7% overall, and 58.8% of women in the
lowest standard of living category received at least 3 ANC compared to 80.9% in the high standard of
living category. However this is still an improvement, as in 2005/06 (NFHS)46.0% of women from the
ST caste compared to 61.8% of women overall received 3+ ANC visits. Even largerdisparities were
seen in 2005/06 between the 5 wealth quintiles, where 47.6% of women had three or more ANC
visits in the lowest quintile, compared to 92.8% in the highest quintile.In light of poor maternal and
child health indicators, the Government of Odisha introduced the Orissa Maternity Support Scheme
known as MAMATA. The scheme provides conditional cash transfers to pregnant and lactating
women in four instalments over 12 months, the aims of which include increasingthe utilisation of
maternal and child health services such as ANC. However, the conditionality only requires pregnant
women to attend atleast oneANC,therefore the scheme may not be expected to significantly
increase coverage of mothers receiving three or four ANCs. If this scheme is to be sustained, it may
be worth considering adding additional ANC checks as part of the conditionality. However, it should
be noted that only one in three women received all four instalment anyway (although the report
states a number of reasons for this), and it is important for the conditions to be manageable.
Receiptof IFA tablets is another condition ofwomen registered in the MAMATA scheme receiving
payments, however coverage was low. Nearly two thirds of women reported to have received at
least 90 IFA tablets in their last pregnancy (63.0%, 95%CI 62.2-63.9), however similarly to adolescent
girls, considerably less women reported to have actually consumed IFA. The relatively low receipt
and particularly consumption of IFA tablets is a concern given the importance of iron during
pregnancy to meet women’s nutritional needs as well as the development of the foetus. A study by
Wendt et al (2015)58 found that IFA receipt and consumption improved with higher education
attainment and household wealth, and also was related to the number of ANC visits, ANC quality and
counselling, although such associations were not investigated here. Another study by Kumar et al
(2014)59 conducted in Tamil Nadu found that the main reasons for not consuming IFA tables were
nausea and vomiting followed by abdominal cramps, and lastly constipation. Whilst side effects are 58Wendt A et al. Individual and Facility-Level Determinants of Iron and Folic Acid Receipt and Adequate Consumption among Pregnant Women in Rural Bihar, India.Plos One. 2015;10(3): e0120404 59 Kumar S et al. Iron-Folic Acid Intake Among Pregnant Women in Anumanthai PHC of Villupuram, Tamil Nadu. Indian Journal of Clinical Practice.2014; Vol. 24, No. 9.
Concurrent Monitoring II Survey Report
121 Technical and Management Support Team (TMST)
often un-avoidable, similarly with adolescent girls, a possible way to improve consumption might be
to improve women’s awareness of the benefits of taking IFA, as well as explanations of what side
effects might be experienced and that they are not harmful.In line with this, women’s reported
knowledge of danger signs during pregnancy was extremely low at 1.7% suggesting a lack of
pregnancy related counsellingand that the quality of ANC falls short for most women.
Despite the above, prevalence of anaemia was low (8.7%, 95%CI 8.4-9.0) although this should be
interpreted in light of the fact that only around 60% of women had their haemoglobin tested for
anaemia in their last pregnancy. Anaemia testing was more common in the more advantaged socio-
demographic groups, therefore it might be reasonable to assume that anaemia prevalence might be
higher had all women been tested in their last pregnancy.
The majority of women received at least two TT injections (92.3%, 95%CI 91.9-92.7), and was slightly
higher than indicated in the 2005-05 NFHS where 83.3% of women had two or more TT injections
during their last pregnancy. The high coverage was encouraging in light of a study by Singh et al
(2014)60 using the 2007-2008 District Level Household Survey which found that TT injections
provided the main protective effect on neonatal mortality in India.
18.3. HNWASH service coverage and outcomes during delivery and postpartum period
Indicators relating to delivery and post-natal care were encouraging and have increased considerably
since 2005/06. The state level prevalence of institutional delivery was high (82.1%, 95% CI 81.5-
82.6), as was skilled birth attendance rate (83.5%, 95%CI 83.0-84.0), which was largely driven by the
high uptake of institutional delivery.This shows great progress since 2005/06 (NFHS-3) where
institutional delivery was 35.5%, and then increased to 77.7% in 2011-12 (AHS). Institutional delivery
was 79.8% during CCM-I in 2011.The prevalence of women receiving postnatal checks within 24
hours of delivery was also high (CCM-II) at 90.3% (95% CI 89.9-90.7).
Despite these positive results, there remains room for improvement, particularly regarding the
inequitable access to care to ensure that women from less advantaged socio-economic groups are
able to access maternity services. For most indicators relating to delivery and post-natal care, results
were considerably higher for the women in the more advantaged socio-demographic groups, for
example, the prevalence of institutional delivery was 90.1% (95% CI 89.7-90.6) in non-high burden
60 Singh A et al. Do antenatal care interventions improve neonatal survival in India? Health Policy and Planning 2014;29:842–848
Concurrent Monitoring II Survey Report
122 Technical and Management Support Team (TMST)
districts, compared to 73.4% (95% CI 72.4-74.3) in high burden districts, and the prevalence of
women receiving postnatal check within 24 hours of delivery was94.9% (94.5-95.2) in non-KBK
districts, compared to79.6 (78.5-80.7), i.e. a difference of 16.7% and 15.3% respectively. C-section
rates which were 10.5% (95% CI 10.2-10.8) at state level, differed hugely according to sli, at 7.5%
(95% CI 7.2-7.7) in the lowest sli, compared to 23.1 (95% CI 21.8-24.5) in the highest.
Nevertheless, progress has been made in increasing coverage for women in disadvantage groups, as
in 2005/06 (NFHS) the prevalence of institutional deliveries for scheduled tribe social groups was just
12%, compared to 70% in 2014 (CCMII), and the coverage of postnatal checks within 48 hours of
delivery was just 19% in 2005/05 (NFHS) compared to 50.9% in 2014 (CCMII).
Figure 60: Institutional Delivery and Post-natal check up within 48 hours of delivery
Although these disparities appear to have reduced considerably since previous years61, sustained
efforts are required to further reduce disparities and to identify barriers to access for less
advantaged women. Whilst focusing on India as a whole, Kesterton et al 62 argued that although
education and region showed the strongest associations with institutional care seeking for delivery,
economic status was a more crucial determinant than access, and therefore highlighted the
importance of strengthening demand side factors (which MAMATA helps to address).
61Thomas et al. Closing the health and nutrition gap in Odisha, India: A case study of how transforming the health system is achieving greater equity. Social Science and Medicine. 2015; S0277-9536(15)00342-1
1. 62Kesterton et al. Institutional delivery in rural India: the relative importance of accessibility and economic status. BMC Pregnancy Childbirth. 2010;6;10:30.
Concurrent Monitoring II Survey Report
123 Technical and Management Support Team (TMST)
18.4. HNWASH service coverage and outcomes for essential newborn care
Essential Newborn Care is a holistic strategy aimed at improving the health of newborns through
interventions implemented prior to conception, during pregnancy, and soon after birth and the
postnatal period. Care provided during the perinatal and neonatal period are important for ensuring
the health of mothers and babies
Results for key ENC indicators, of which most focused on the period soon after birth, were mixed.
Encouragingly, around 80% of women reported that bathing of the newborn was delayed until 6
hours after birth, and just 7.2% (95%CI 6.9-7.6) reported that the newborn’s head was shaved at
birth. However care practices soon after birth were quite poor, for example only a quarter of women
reported practicing kangaroo care (26.6%, 95% CI 26.0-27.2), just two thirds of women (65.8%)
reported that the newborn was wiped within 10 minutes of birth, and less than half of women
reported that their baby was wrapped within 10 minutes of birth (42.5%, 95%CI 41.9-43.1).
Additionally, only half of newborns were checked by an ASHA, ANM or AWW within 30 days of
delivery (52.7%, 95% CI 52.1-53.3). Reasons for these inadequate practices most likely include lack of
knowledge, as for example, women’s knowledge of danger signs for newborns
(convulsions/spasms/rigidity,breathing problems, very small baby, lethargy/unconsciousness) was
extremely low at 2.0% (95% CI 1.9-2.2) suggesting that greater Information, Education and
Communication on this and related topics might be beneficial, for example during ANC checks, or as
part of the Shakti Varta PLA cycle.
Some findings worth investigating was the high prevalence of women reporting that they had made
inpatient/outpatient payments to government health institutions for newborns referred within 30
days of delivery. This was reported by 67.8% (95% CI 66.5-69.0) of newborns, however government
providers are supposed to provide these services free of charge for this age group. This may be
because of nominal user charges of two to five rupees being paid for OPD registration but this is not
a usual practice across the state.
18.5. HNWASH service coverage and outcomes for children under two
IYCF practices directly affect the nutritional status of children under two years of age, and can
impact upon child survival. It is therefore essential to protect, promote and support IYCF in order to
improve nutrition, health and development of young children (WHO 2007).
Data was collected on seven key IYCF indicators essential for health growth, recommended byWHO.
Concurrent Monitoring II Survey Report
124 Technical and Management Support Team (TMST)
Overall, IYCF practices remain far below the desired coverage level across all districts, except for
exclusive and continued breastfeeding. Exclusive breastfeeding of children up to 6 months of age
was high at 82.3% (95% CI 81.8-82.8), and >90% of women reported continued breastfeeding up to
1-2 years. This was extremely positive, given the protective effects of exclusive breastfeeding, and
that WHO recommends that children are breastfed for up to at least 2 years of age as breast milk
continues to provide key nutrients beyond the first year of life including protein, fat and a number of
nutrients. This also reflects population level progress towards optimal feeding practices, as the
prevalence of exclusive breastfeeding was reported as 50.8% by the 2005/6 NFHS-3. It is important
to note however that as previous day recall was used (as recommended by WHO), the prevalence of
exclusive breastfeeding could be over-estimated as children receiving liquids/foods irregularly may
not have received them the day before the survey. Additionally, it can be difficult to capture the
difference between knowledge and practice of a caregiver.
Timeliness of breastfeeding(feeding infants 0-23 months within 1 hour of birth) is an important
indicator given the beneficial immune properties of colostrum to a newborn child, in additional to
general health and hygiene benefits. Only 41.5% (95% CI 41.2-41) reported timely initiation of
breastfeeding, similar to 2005/06 (NFHS-3) (54.8%). However this was in contrast to the fairly high
prevalence of children <2 years of age who were given colostrum (75.4% (95% CI 74.8-75.9)
suggesting possible confusion over the question, or social desirability of responses.
Compared to breastfeeding practices, complementary feeding practices were extremely poor.Almost
half of children 6-8.99 months were not receiving complimentary foods at the appropriate
time(46.8%, 95% CI 46.0-47.6), and were reliant only on breast milk or other liquids, which when
consumed alone do not meet the energy and nutrient requirements of a growing child over six
months old. Results were slightly lower for children in high burden districts than low burden districts
at 41.3% and 52.4% respectively, as well as for other disadvantaged groups. This could reflect a
number of underlying problems that disproportionately affect disadvantaged / tribal households,
such as: poverty, food insecurity, awareness of optimal feeding practices, long working hours which
limit care-giver-child interactions both in terms of feeding but also hygiene; poorer sanitation
coverage. These low estimates are alsoprobably linked to that fact that only 1.9% (95% CI 1.8-2.0) of
women were aware that infants should be introduced to solid, semi solid and soft foods from 6
months.
Dietary diversity was also low and only 15.5% (95% CI 15.1-15.9) of children 6-23.99 months
consumed at least 4 out of 7 food groups the previous day, which may be partly explained by the
Concurrent Monitoring II Survey Report
125 Technical and Management Support Team (TMST)
fact that more than half of children 6-8.99 months did not receive any food the previous day.
Similarly, a slightly lower proportion of children in HBDs consumed an adequately diverse diet
(13.1%) compared to children from NHBDs (17.5%). Minimum feeding frequency (being fed the age
appropriate number of times the previous day and taking breastfeeding status into account) was
also far lower than is ideal (65.5%); children from HBDs were worse affected (61.0%) compared to
children from NHBDs (69.2%). Coverage of take home rations for children 6-23 months was average
at 72.0%, and it would be useful to investigate whether children are actually consuming the ration
themselves, or whether it is shared with other household members, given that the dietary diversity
is so low. If children are consuming the ration, these results suggest that it forms an important part
of children’s diet.
Nearly one fifth of children under two were fed by a bottle the previous day 17.6% [95% CI 17.2-
17.9]. It should be noted that bottle feeding carries with it the risk of contamination and children
who are bottle fed are more vulnerable to disease as a result therefore it may be useful to include
information on this in counselling sessions.
Interestingly, indicators for IYCF knowledge amongst women 15-49 were quite high, and for example
>90% of women knew that infants should be put to the breast within 1 hour of birth, however only
41.5% actually reported to have done this. Additionally >90% of women knew that infants should
only be fed breast milk in the first 6 months of a child’s life, and that infants should be fed
colostrums indicating that knowledge has not necessarily translated in to practice.
The majority of these complementary feeding indicators were developed after the NFHS-3 and were
not measured in the AHS, so we cannot provide comparisons with other surveys.
Immunisation
Immunisation coverage was quite high, and three quarters of children aged 12-23.99 months were
fully immunised (75.0%, 95%CI 74.1-75.9), and74.8% (95%CI 74.2-75.3) were immunised against
measles specifically, according to caregiver report. Nevertheless, around 25% of children are not
receiving adequate immunisation and coverage does not appear to have improved much since 2011
where CCMI reported 76.9 % to be fully immunised, and 2012/13 where the AHS reported that68.9%
of children in rural areas were fully immunised.
Social gradients in coverage of immunisation have improved since recent years, as for example in
2005/06 (NFSH-3) 30% of children in the ST caste were fully immunised compared to around 50%
overall, whereas in 2014 (CCMII) 71% of children in the ST caste were fully immunised. Nevertheless,
Concurrent Monitoring II Survey Report
126 Technical and Management Support Team (TMST)
some disparities remain;therefore efforts are required to sustain improvements in equitable
coverage so that all children, regardless of their social characteristics, are able to access these
services.
18.6. HNWASH service coverage and outcomes for children under five
Anthropometry
Although concerted efforts have been made, as touched on in the previous section, the re-
orientation of nutrition programming to priority groups has yet to translate into improved nutrition
outcomes for children under 5. The nutritional status of children in this age group was poor, and
appears to have changed little since 2005/06, whilst also reflecting differing patterns of malnutrition
according to socio-demographic profile. Nearly half of children we were stunted (HAZ <-2) (47.5%,
95% CI 47.2-49.9), with higher levels found in children from more disadvantaged groups. For
example, 30.0% of children were stunted in the high sli category, compared to 52.5% in low sli
category, and 56.7% in ST social group/caste, compared to 40.3% in the general, OBC, other
category. The prevalence of stunting in rural areas was 46.5% in 2005/06 (NFHS-3) and 39.6% in
2013/14 (RSOC).Worryingly, Global Acute Malnutrition (WHZ<-2) was extremely high (25.4%, 95% CI
2.2-25.7), with similar disparities according to socio-demographic profile, and was slightly higher
than previous years at 20.5% in 2005/06 (NFHS-3), and 18.7% in 2013/14 (RSOC) (see below for
further comparisons).
Whilst Odisha stata is not officially classified as an ‘emergency’, according to WHO thresholds for the
prevalence of malnutrition in major emergencies, the prevalence of stunting and wasting in rural
Odisha are considered of ‘critical’ public health significance (prevalence of wasting of≥15%, and
stunting ≥40% are considered critical)63. Although mortality rates are not exceptionally high (see
subsequent sections), these high levels of stunting and wasting is a cause for concern. In reality,
under nutrition, and particularly stunting, could take many years to be eradicated from the
population, particularly given the multiple underlying causes of malnutrition ranging from
inadequate access to food, inadequate care practices, poor health services and environment. In light
of these underlying causes, possible reasons for the persistently high prevalence under nutrition
include poor complementary feeding practices and delayed weaning, and low dietary diversity.
Although data has not been disaggregated by age group, the weaning process whereby
breastfeeding is stopped or reduced means the child is more vulnerable to environmental factors
influencing their nutritional status. The low dietary diversity, suggest that this also be due to the
63WHO.The management of nutrition in major emergencies, 2000.
Concurrent Monitoring II Survey Report
127 Technical and Management Support Team (TMST)
limited quantity and quality of complementary foods, particularly essential at this age for growth
and development. This is compounded by the fact that less than half of children 6-8 months were
receiving complementary foods by this age as recommended by WHO. In addition to this, coverage
of the take home ration was fairly low.
Persistent effort will be required to increase coverage of nutrition specific and sensitive
interventions and to introduce other interventions that are currently missing. The Nutrition
Operational Plan has supported stronger operational convergence between DWCD and DHFW, but it
has not had a strong enough influence on joint nutrition programming with other sectors to tackle
the core determinants of under-nutrition through nutrition sensitive approaches. As mentioned,
important initiatives have been introduced, including the ‘Mamata’ Cash Transfer Scheme, ‘Shakti
Varta’ empowerment of Women’s Self Help Groups and Community Led Sanitation (CLS), however
the latter two have not yet been evaluated.
Anthropometry - comparisons with other data sources
There are a number of other data sources providing child under nutrition estimations available to
consider alongside CCMII data.We have focused on comparison with three additional sources of
nutrition data (see Table 36): NFHS-3 for rural and urban combined (2005/6), the UNICEF RSOC
survey of 2014, and recently released CAB-AHS 2014 data.
Caution should be taken when comparing the surveys however, due to methodological
differencesand lack of confidence intervals meaning that it is not possible to detect the significance
of any differences i.e. whether they are likely to be true differences, or in fact due to sampling
variation. The NFHS-3 and RSOC data sources (shown in columns two to fourin Table 36) are
considered comparable – they used the same sampling approach within mixed urban and rural
settings, and sought to provide state-estimates for child stunting, wasting and underweight. The
NFHS-3 rural estimate is also presented alongside the CCM II rural estimates (in the third and
seventh columns of Table 36), although these two sources are less comparable. For example, the
NFHS-3 allowed replacement of remote and insecure villages whilst CCM II did not; probability
proportional to size sampling with segmentation of larger villages was used in the NFHS-3 and
sampling protocols were conducted by fieldworkers, in contrast to CCMII where a census-based
approach was used with no sampling conducted by field workers. Data cleaning approaches may also
have differed between the two surveys, oedema was not measured in the NFHS-3 but was in CCMII
and finally, the coverage of CCMII was across all 314 blocks of Odisha to provide block level data
compared to the smaller NFHS-3 state-level survey.
Concurrent Monitoring II Survey Report
128 Technical and Management Support Team (TMST)
Considering these multiple data sources, the prevalence of stunting, wasting and underweight
appear to have remained relatively unchanged since 2005/06 (NFHS-3). The prevalence of
malnutrition appears slightly lower when comparing RSOC 2014 results to 2005/06 (NFHS-3),
particularly for stunting where a 6.8% possible reduction was seen. However this is not entirely
supported by 2014 results from CAB-AHS and CCMII. The strikingly similar anthropometry results
from three independent data sources collected in 2014 strengthens the findings that little progress
has been made in improving the nutritional status of children under five since 2005/06. The
prevalence of undernutrition has remained unacceptably high, posing grave consequences for the
developmental potential of a large proportion of children in this state, warranting increased and
timely multi-sectoral action and focus over the coming years.
Table 36: A comparison of under nutrition estimates from the NFHS-3, UNICEF RSOC, AHS-CAB CCM II and surveys, in rural and mixed urban/rural samples
Indicator 2005/06 2014 NFHS-3
Rural + Urban NFHS-3 Rural
RSOC Rural + Urban
AHS-CAB Rural + Urban
AHS-CAB Rural
CCM II Rural
Stunting (HAZ <-2)
45.0% 46.5% 38.2% 41.5% (39.3-43.5)
42.4% (40.1-44.8)
47.5% (47.2-47.9)
Severe stunting (HAZ <-3)
19.6% 20.4% 15.5% 19.4% 19.8% 24.9% (24.6-25.2)
Wasting (WHZ <-2)
19.5% 20.5% 18.3% 20.2% (18.7-21.8)
20.4% (18.8-22.1)
25.4% (25.2-25.7)
Severe wasting (WHZ <-3)
5.2% 5.4% 4.9% 6.0% 6.1% 12.8% (12.6-13.0)
Underweight (WAZ <-2)
40.7% 42.3% 34.4% 38.9% (36.6-41.3)
40.1% (37.6-42.6)
42.8% (42.5-43.2)
Severe underweight (WAZ <-3)
13.4% 14.0% 11.0% 14.4% 14.9% 19.0% (18.8-19.2)
Prevention and management of childhood disease
Prevention and management of childhood diseases, which affect nutritional status,is also
suboptimal. Around two-thirds of children 6-35 months of age had received at least one Vitamin A
dose since birth (63.8%, 95%CI 63.3-64.3). Vitamin A is essential for the functioning of the immune
system, and improves chances for survival, growth and development64. Closing the gap to reach the
36.2% of children who are not receiving vitamin A supplementation is therefore important,
64Imdad et al. Vitamin A supplementation for preventing morbidity and mortality in children from 6 months to 5 years of age.Cochrane Database Syst Rev. 2010 Dec 8;(12):CD008524.
Concurrent Monitoring II Survey Report
129 Technical and Management Support Team (TMST)
particularly given the low dietary diversity, and the fact that the take home ration provided to
children <2 years of age is not fortified. Coverage has not changed much since 2010 (figure 59). The
coverage for Vitamin A and de worming can be improved by counselling in VHND sessions. Both
Vitamin A and de worming is given at fixed day immunization camps. In line with this, the coverage
of de-worming was low and only half of children had received de-worming medication (52.2%, 95%CI
51.7-52.7). We are not having any coverage data from other survey’s related to de-worming. Efforts
should be made to increase coverage as worm infection can significantly affect the health and
nutritional status of children, but also the cost of diagnoses is considerably greater than the cost of
treatment65.
Figure 61: % of children 6-35 months receiving at least one dose of vitamin A
At the state level, the most common cause of morbidity was ARI (58.8%, 95%CI 56.9-60.6), although
only 27% were formally diagnosed, and of these, only half received treatment (49.5%). Notably
fever was quite low, at only 8.6%. The lowest cause of morbidity was diarrhoea (4.0) which is
encouraging given that diarrhoeal disease is the second leading cause of death in children under five
years old66, and diarrhoeal episodes can deprive children of the nutrition necessary for growth and
are therefore an important risk factor for the development of malnutrition. The prevalence of
malaria was quite low as out of the 29% of children with fever who were tested, 38.5% (95% CI 37.2-
39.8) were formally diagnosed, however this varied considerably by socio-demographic group, and
65Hall et al.A review and meta-analysis of the impact of intestinal worms on child growth and nutrition.MaternalandChildNutrition(2008), 4, pp. 118–236. 66WHO (2009). Diarrhoeal disease factsheet; accessed 18.01.12 from http://www.who.int/mediacentre/factsheets/fs330/en/
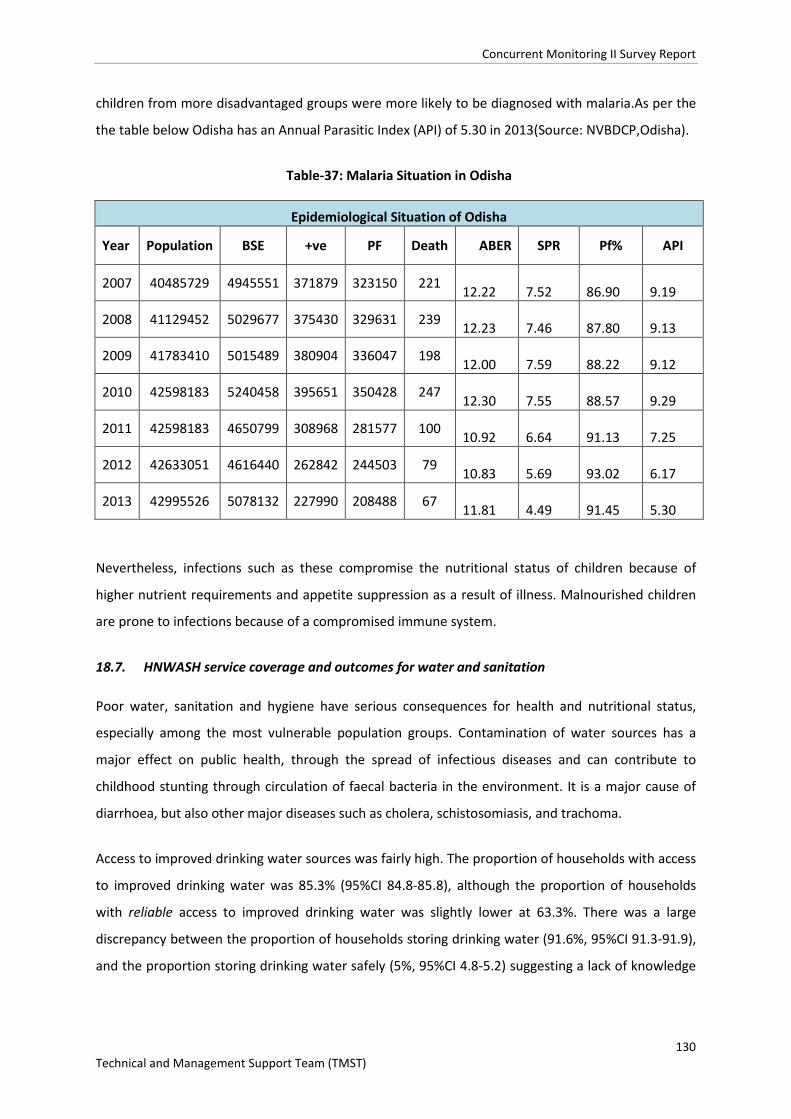
Concurrent Monitoring II Survey Report
130 Technical and Management Support Team (TMST)
children from more disadvantaged groups were more likely to be diagnosed with malaria.As per the
the table below Odisha has an Annual Parasitic Index (API) of 5.30 in 2013(Source: NVBDCP,Odisha).
Table-37: Malaria Situation in Odisha
Epidemiological Situation of Odisha
Year Population BSE +ve PF Death ABER SPR Pf% API
2007 40485729 4945551 371879 323150 221 12.22
7.52
86.90
9.19
2008 41129452 5029677 375430 329631 239 12.23
7.46
87.80
9.13
2009 41783410 5015489 380904 336047 198 12.00
7.59
88.22
9.12
2010 42598183 5240458 395651 350428 247 12.30
7.55
88.57
9.29
2011 42598183 4650799 308968 281577 100 10.92
6.64
91.13
7.25
2012 42633051 4616440 262842 244503 79 10.83
5.69
93.02
6.17
2013 42995526 5078132 227990 208488 67 11.81
4.49
91.45
5.30
Nevertheless, infections such as these compromise the nutritional status of children because of
higher nutrient requirements and appetite suppression as a result of illness. Malnourished children
are prone to infections because of a compromised immune system.
18.7. HNWASH service coverage and outcomes for water and sanitation
Poor water, sanitation and hygiene have serious consequences for health and nutritional status,
especially among the most vulnerable population groups. Contamination of water sources has a
major effect on public health, through the spread of infectious diseases and can contribute to
childhood stunting through circulation of faecal bacteria in the environment. It is a major cause of
diarrhoea, but also other major diseases such as cholera, schistosomiasis, and trachoma.
Access to improved drinking water sources was fairly high. The proportion of households with access
to improved drinking water was 85.3% (95%CI 84.8-85.8), although the proportion of households
with reliable access to improved drinking water was slightly lower at 63.3%. There was a large
discrepancy between the proportion of households storing drinking water (91.6%, 95%CI 91.3-91.9),
and the proportion storing drinking water safely (5%, 95%CI 4.8-5.2) suggesting a lack of knowledge
Concurrent Monitoring II Survey Report
131 Technical and Management Support Team (TMST)
of what constitutes safe water storage, or possibly lack of materials (e.g. covered water containers)
to do so.
In addition to improved hygiene, efforts to improve sanitation have been greatly supported by the
new Indian Prime Minister who has recently announced an ambitious new campaign to eliminate
open defecation by 2019. Safe disposal of excreta is an important preventative measure against the
contamination of water supplies or the food chain. It is particularly important to prevent defecation
near water banks and agricultural land. Results indicate that some progress has been made in recent
years. Assessment of the use of improved vs. non-improved latrines, indicated that less than one
fifth of households were using improved excreta disposal facilities(14.4%, 95%CI 14.0-14.8),which is
slightly higher than in 2005/06 by India’s NFHS-3 (9.0%). However large inequities in coverage were
apparent, in particular, 64.3% of households in the high sli category had improved latrines,
compared to just 1.7% in the low sli category, and 35.6% of households where the head had
completed >10 years of education had an improved facility, compared to 4.2% where the household
head had no education. It is hoped that some improvements will be seen in the foreseeable future
as since CCMII was implemented, TMST in collaboration with local NGOs has rolled out CLS
intervention, which aims to increase the number of ODF villages.
Sanitation practices such as handwashing and disposal of children’s faeces were poor and showed
socio-demographic variation. Less than one fifth of mothers of children under five reported washing
their hands at all five critical moments in a day (17.0%, 95%CI 16.5-17.5), with a higher among more
advantage groups. Of these, the majority of women reported using soap, detergent or ash for hand
washing (87.2%).Safe disposal of child faecesby mothers of children was reported by 7.4% (95%CI
7.1-7.6) of women, and differed considerably according to different social groups, for example 2.4%
(95%CI 2.3-2.5) of women reported to safely dispose of faeces in the low SLI category, compared to
30.4% (95%CI 29.4-31.3) in the high SLI category (‘safe is understood to mean disposal in a safe
sanitation facility or by burying).The safe disposal of children’s faeces is of particular importance
because children’s faeces are the most likely cause of faecal contamination to the immediate
household environment, and therefore should be emphasised as part of the CLS intervention.
18.8. HNWASH service coverage and outcomes forFLW and empowerment
Frontline health workers
Frontline health workers such as AWWs, ASHAs and ANM play a key role in the community by for
example providing basic health care services and advice, maternal and child health services (ANMs),
running VHNDs, participating in Shakti Varta women’s groups and Self Help Groups, which help to
Concurrent Monitoring II Survey Report
132 Technical and Management Support Team (TMST)
build relationships with village women, and women’s confidence in them. Given the status of FLWs
in the community it is important that they are properly trained and equipped to provide the services
required of them.
A number of key indicators were reported on relating to FLWs, highlighting that some improvements
in their training and particularly knowledgeof key MCH issues are needed as this is likely to affect
their work effectiveness. Although only half of AWWs had received induction training (51.9%, 95%CI
50.5-53.2), the majority received on the job training (93.3%, 95%CI 92.5-93.9). FLWs knowledge of
key areas important for maternal, newborn and child health was low and <20% of women had
sufficient knowledge in the tested areas, suggesting that more formal training might be beneficial,
rather than just on the job training. The proportion of FLWs with specific knowledge of ANC and IYCF
recommendations was higher however, ranging between 71.5% and 88.8% for the different
knowledge areas checked.Just over half of all FLWs had received training in 1000 days, and this did
not vary substantially between FLW cadres. The high knowledge of IYCF practices by mothers
mentioned previously suggests that some of this information may be translating to women, however
as mentioned, it has not resulted in improved practices.
All FLWs cited excessive workload as one of the top three constraints to carrying out their duties,
although lack of toilets and no electricity at AWCs, low salary, and delayed incentive payments were
also mentioned. Only 20.8% (95% CI 19.7-22.0)of AWWs and 48.9 (95% CI 46.0-51.8) of ANM sub
centres had improved sanitation facilities. Efforts should be strengthened to ensure that all AWCs
and ANM sub-centres have improved sanitation facilities, as lack of facilities could stunt efforts for
villages to become ODF.
Empowerment of women
Research indicates that women’s empowerment is generally associated with positive child
nutritional status as well as well as other economic factors67. Overall, results suggested that women
were not hugely empowered in their daily lives relating to decision making, and perceived ability to
change their environment although had some control over earnings. In relation to financial decision
making, while 63.9% of women had a say in the spending of their husbands earnings, 81.0% had
either total or joint control over the spending of their own earnings. Regarding household decisions,
only half of women were involved in major household decisions (53.7%), compared to 62.4%
involved in minor decisions. Somewhat in line with this, only around a quarter of women (28.5%) felt
67 Cunningham et al. Women’s empowerment and child nutritional status inSouth Asia: a synthesis of the literature. Maternal and Child Nutrition (2015), 11, pp. 1–19
Concurrent Monitoring II Survey Report
133 Technical and Management Support Team (TMST)
that they could easily change things in their community, indicating that the majority of women felt
that they had little influence. This is an area that both Shakti Varta and CLS (albeit more indirectly)
aim to equip women to be a voice for change in their communities therefore future progress may be
seen.
As would be expected, indicators for empowerment tended to be slightly higher for women from
more advantaged groups, as well as literate women, however the reverse was found for the
prevalence of women who had received payment for the work they had done of the past 12 months.
This might be because the majority women might be performing core household activities, for which
they are not getting paid.
Results indicate that a lack of confidence in the quality of health services were a significant barrier to
women accessing these services. When asked about barriers to accessing health services, the
responses rated as the biggest problems were ‘concern that there may not be any provider’ and
‘concern that there may be no drugs available’, as 85.4% and 83.8% women respectively rated these
factor as a big problem, in comparison to ‘getting money needed for treatment’ and ‘having to take
transport’ for which 50.4% and 41.2% rated these as a big problem. This suggests that further
investigation and efforts to improving the quality of health services may be warranted, so as to
encourage women to access necessary services.
18.9. Mortality - comparison of CCM II estimates with other data sources
Encouragingly, mortality rates appear to be declining since the NFHS-3 was implemented in 2005/05
reflecting some improvements in the health, nutrition and WASH situation. However, as mentioned,
care must be taken when comparing results estimated in the CCM II to surveys from previous years
due to the different sampling methodologies, sample sizes used, calculation methods, and in the
case of mortality, different reference periods used.
Figure 62 below indicates that MMR could be reducing in Odisha, but given the methodological
differences between the surveys this interpretation remains tentative. Although CCMII gives a lower
estimate of MMR than the SRS, the 95%CIs overlap and thus we do not know if the estimates reflect
a ‘true’ reduction or just lower precision of the SRS estimate (due to a smaller sample size and
number of deaths identified). Secondly, SRS used a prospective surveillance method of identifying
deaths, whereas CCMII used a household survey method – the latter approach is more vulnerable to
underreporting of deaths, although interviewers were trained to minimise this problem.
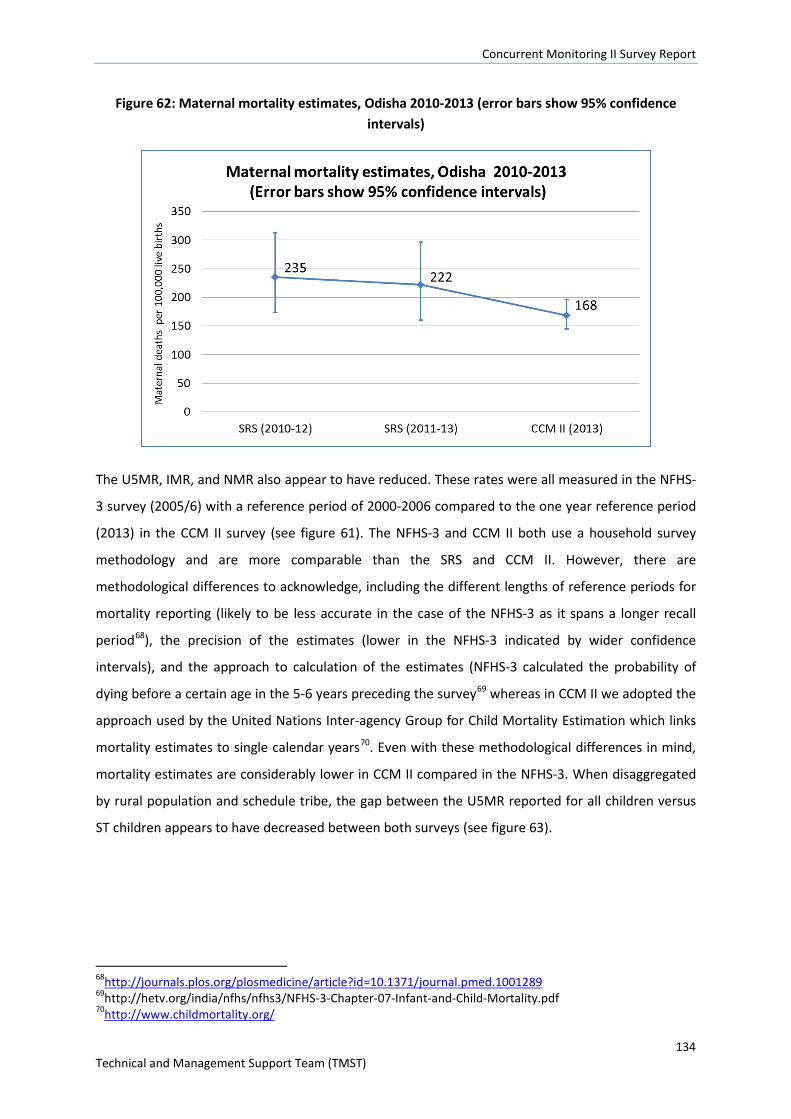
Concurrent Monitoring II Survey Report
134 Technical and Management Support Team (TMST)
Figure 62: Maternal mortality estimates, Odisha 2010-2013 (error bars show 95% confidence intervals)
The U5MR, IMR, and NMR also appear to have reduced. These rates were all measured in the NFHS-
3 survey (2005/6) with a reference period of 2000-2006 compared to the one year reference period
(2013) in the CCM II survey (see figure 61). The NFHS-3 and CCM II both use a household survey
methodology and are more comparable than the SRS and CCM II. However, there are
methodological differences to acknowledge, including the different lengths of reference periods for
mortality reporting (likely to be less accurate in the case of the NFHS-3 as it spans a longer recall
period68), the precision of the estimates (lower in the NFHS-3 indicated by wider confidence
intervals), and the approach to calculation of the estimates (NFHS-3 calculated the probability of
dying before a certain age in the 5-6 years preceding the survey69 whereas in CCM II we adopted the
approach used by the United Nations Inter-agency Group for Child Mortality Estimation which links
mortality estimates to single calendar years70. Even with these methodological differences in mind,
mortality estimates are considerably lower in CCM II compared in the NFHS-3. When disaggregated
by rural population and schedule tribe, the gap between the U5MR reported for all children versus
ST children appears to have decreased between both surveys (see figure 63).
68http://journals.plos.org/plosmedicine/article?id=10.1371/journal.pmed.1001289 69http://hetv.org/india/nfhs/nfhs3/NFHS-3-Chapter-07-Infant-and-Child-Mortality.pdf 70http://www.childmortality.org/
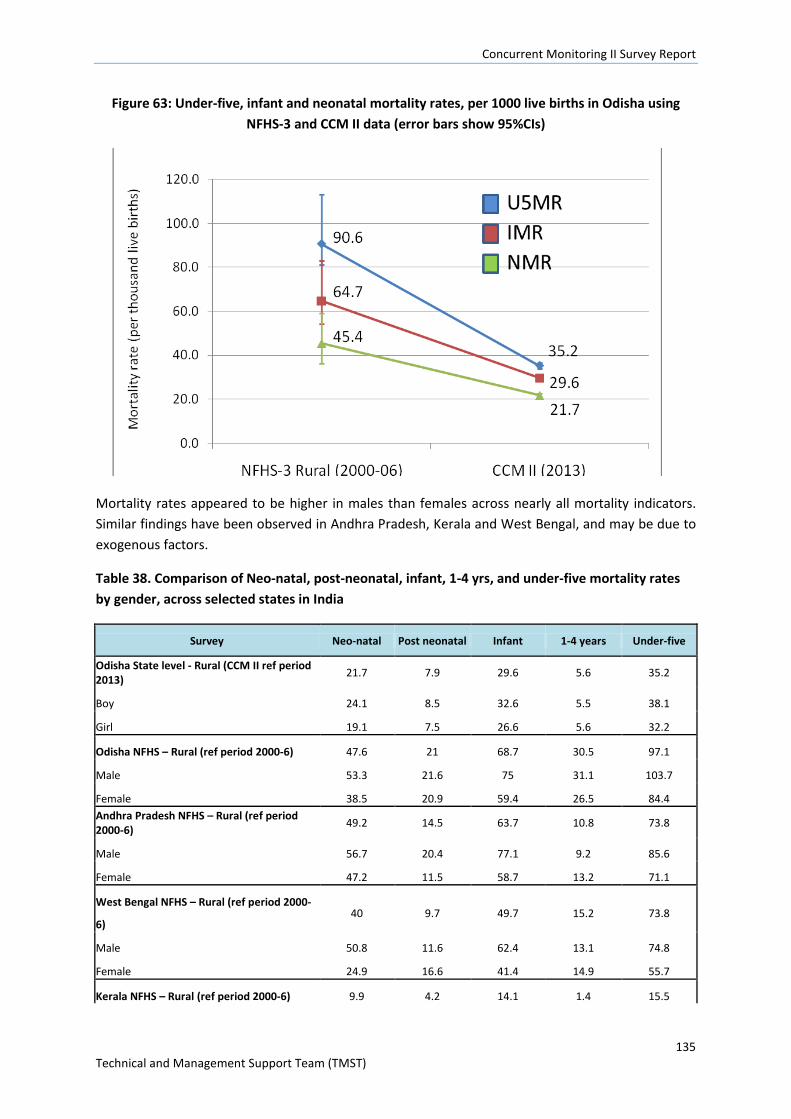
Concurrent Monitoring II Survey Report
135 Technical and Management Support Team (TMST)
Figure 63: Under-five, infant and neonatal mortality rates, per 1000 live births in Odisha using NFHS-3 and CCM II data (error bars show 95%CIs)
Mortality rates appeared to be higher in males than females across nearly all mortality indicators. Similar findings have been observed in Andhra Pradesh, Kerala and West Bengal, and may be due to exogenous factors.
Table 38. Comparison of Neo-natal, post-neonatal, infant, 1-4 yrs, and under-five mortality rates by gender, across selected states in India
Survey Neo-natal Post neonatal Infant 1-4 years Under-five Odisha State level - Rural (CCM II ref period 2013) 21.7 7.9 29.6 5.6 35.2 Boy 24.1 8.5 32.6 5.5 38.1 Girl 19.1 7.5 26.6 5.6 32.2 Odisha NFHS – Rural (ref period 2000-6) 47.6 21 68.7 30.5 97.1 Male 53.3 21.6 75 31.1 103.7 Female 38.5 20.9 59.4 26.5 84.4 Andhra Pradesh NFHS – Rural (ref period 2000-6) 49.2 14.5 63.7 10.8 73.8 Male 56.7 20.4 77.1 9.2 85.6 Female 47.2 11.5 58.7 13.2 71.1 West Bengal NFHS – Rural (ref period 2000-
6) 40 9.7 49.7 15.2 73.8 Male 50.8 11.6 62.4 13.1 74.8 Female 24.9 16.6 41.4 14.9 55.7 Kerala NFHS – Rural (ref period 2000-6) 9.9 4.2 14.1 1.4 15.5
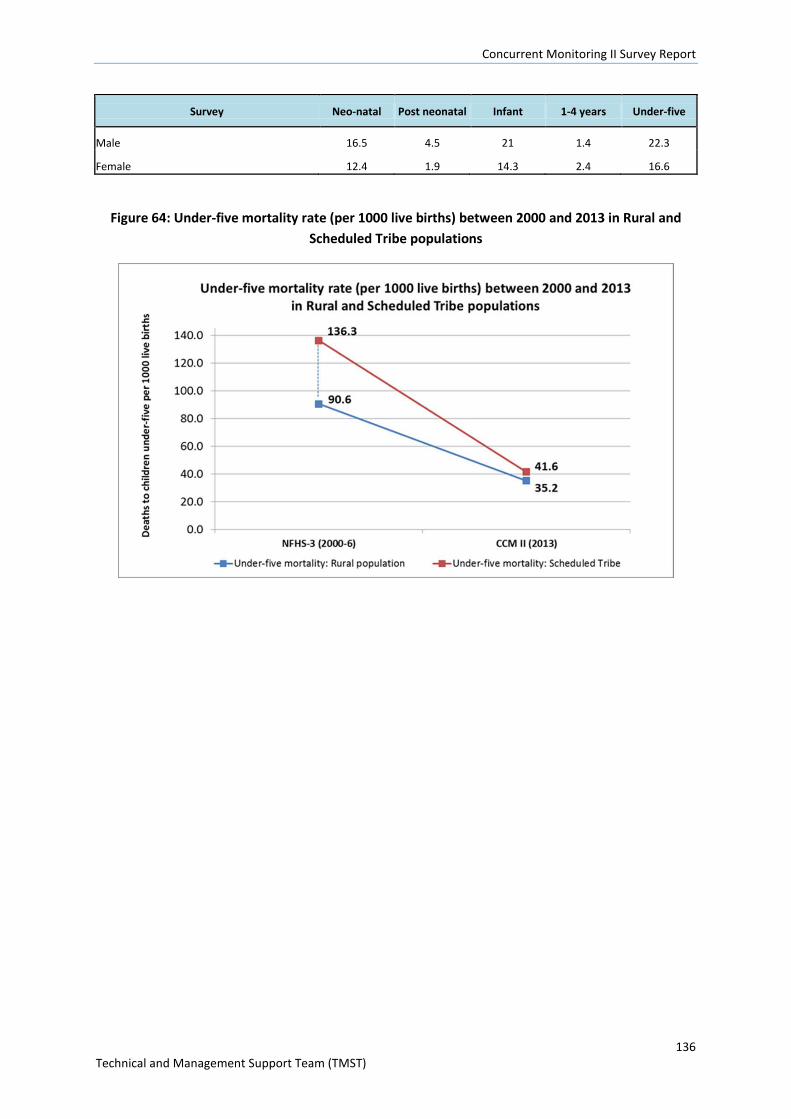
Concurrent Monitoring II Survey Report
136 Technical and Management Support Team (TMST)
Survey Neo-natal Post neonatal Infant 1-4 years Under-five Male 16.5 4.5 21 1.4 22.3 Female 12.4 1.9 14.3 2.4 16.6
Figure 64: Under-five mortality rate (per 1000 live births) between 2000 and 2013 in Rural and Scheduled Tribe populations