Embed Size (px)
Citation preview
CIVIL ENGINEERING STUDIES Illinois Center for Transportation Series No. 21-032
UILU-ENG-2021-2032 ISSN: 0197-9191
Concrete Pavement Mixtures with High Supplementary Cementitious
Materials Content: Volume 3
Prepared By M. Tyler Ley Zane Lloyd
Shinhyu Kang Dan Cook
Oklahoma State University
Research Report No. FHWA-ICT-21-027
A report of the findings of
ICT PROJECT R27-180 Concrete Pavement Mixtures with High Supplementary
Cementitious Materials (SCM) Content
https://doi.org/10.36501/0197-9191/21-032
Illinois Center for Transportation
September 2021


TECHNICAL REPORT DOCUMENTATION PAGE 1. Report No. FHWA-ICT-21-027
2. Government Accession No. N/A
3. Recipient’s Catalog No. N/A
4. Title and Subtitle Concrete Pavement Mixtures with High Supplementary Cementitious Materials Content: Volume 3
5. Report Date September 2021 6. Performing Organization Code N/A
7. Authors M. Tyler Ley, Zane Lloyd, Shinhyu Kang (https://orcid.org/0000-0001-6733-0109), Dan Cook
8. Performing Organization Report No. ICT-21-032 UILU-2021-2032
9. Performing Organization Name and Address Illinois Center for Transportation Department of Civil and Environmental Engineering University of Illinois at Urbana-Champaign 205 North Mathews Avenue, MC-250 Urbana, IL 61801
10. Work Unit No. N/A 11. Contract or Grant No. R27-180
12. Sponsoring Agency Name and Address Illinois Department of Transportation (SPR) Bureau of Research 126 East Ash Street Springfield, IL 62704
13. Type of Report and Period Covered Final Report 10/1/17–9/30/21 14. Sponsoring Agency Code
15. Supplementary Notes Conducted in cooperation with the U.S. Department of Transportation, Federal Highway Administration. https://doi.org/10.36501/0197-9191/21-032
16. Abstract Fly ash is a by-product of coal combustion, made up of particles that are collected through various methods. This by-product has been used successfully as a partial Portland cement replacement in concrete, but the performance predictions of fly ash in concrete have been difficult to predict, especially at high fly ash replacement rates. This study focuses on comparing the performance of concrete with a variety of fly ash mixtures as well as the particle distribution and chemical makeup of fly ash. The slump, unit weight, compressive strength, and isothermal calorimetry tests were used to measure the performance of concrete at 0%, 20%, and 40% fly ash replacement levels. The particle distribution of fly ash was measured with an automated scanning electron microscope. Additionally, the major and minor oxides from the chemical makeup of fly ash were measured for each mixture and inputted into a table. The particle distribution and chemical makeup of fly ash were compared to the performance of slump, unit weight, compressive strength, isothermal calorimetry, and surface electrical resistivity.
17. Key Words Concrete, Fly Ash, Cementitious Material, Particle Group
18. Distribution Statement No restrictions. This document is available through the National Technical Information Service, Springfield, VA 22161.
19. Security Classif. (of this report) Unclassified
20. Security Classif. (of this page) Unclassified
21. No. of Pages 21
22. Price N/A
Form DOT F 1700.7 (8-72) Reproduction of completed page authorized

i
ACKNOWLEDGMENT, DISCLAIMER, MANUFACTURERS’ NAMES This publication is based on the results of ICT-R27-180: Concrete Pavement Mixtures with High Supplementary Cementitious Materials (SCM) Content. ICT-R27-180 was conducted in cooperation with the Illinois Center for Transportation; the Illinois Department of Transportation; and the U.S. Department of Transportation, Federal Highway Administration.
Members of the Technical Review Panel (TRP) were the following:
• James Krstulovich, TRP Chair, Illinois Department of Transportation
• Dennis Bachman, Federal Highway Administration
• Darrin Davis, Illinois Department of Transportation
• Kevin Finn, Illinois Department of Transportation
• Dan Gancarz, American Concrete Institute
• Stephen Jones, Illinois Department of Transportation
• Kelly Morse, Illinois Department of Transportation
• Chad Pink, Illinois Department of Transportation
• Megan Swanson, Illinois Department of Transportation
• Dan Tobias, Illinois Department of Transportation
• Melinda Winkelman, Illinois Department of Transportation
• Steve Worsfold, Illinois Department of Transportation
The contents of this report reflect the view of the authors, who are responsible for the facts and the accuracy of the data presented herein. The contents do not necessarily reflect the official views or policies of the Illinois Center for Transportation, the Illinois Department of Transportation, or the Federal Highway Administration. This report does not constitute a standard, specification, or regulation.
Trademark or manufacturers’ names appear in this report only because they are considered essential to the object of this document and do not constitute an endorsement of product by the Federal Highway Administration, the Illinois Department of Transportation, or the Illinois Center for Transportation.
ii
EXECUTIVE SUMMARY Fly ash consists of several major oxides such as CaO, Al203, Si02, Fe2O3, as well as some minor oxides. ASTM C618 (2019) uses a method that separates fly ash into two groups—Class C or Class F—based on their major oxide contents. For this research project, 19 fly ash mixtures were produced in various US states, including Texas, Oklahoma, and Illinois. Of these, 12 fly ash mixtures were classified as Class C and seven were classified as Class F by ASTM C618 (2019). A conventional concrete with 100% ordinary Portland cement (OPC) was compared to 20% and 40% fly ash replacement levels with the 19 fly ash mixtures.
This work showed that 20% and 40% replacement provided concrete mixtures that could be used for acceptable workability, strength, and resistivity. Increasing the amount of fly ash also improved the workability of the mixtures in most cases, which is beneficial for placing concrete in the field.
Fresh concrete was then transferred from the mixer to a wheelbarrow, where it was tested for air using a Type B Air Pressure Meter in accordance with ASTM C231 (2017). The slump and unit weights were also collected according to ASTM C143 (2015) and C138 (2017), respectively. The concrete was then used to make 24 samples of 100 mm × 200 mm (4 in. × 8 in.) cylinders, prepared according to ASTM C192 (2018). These cylinders were then placed in a controlled environment chamber at 21°C (70°F) and 100% RH until the day of testing. Compressive strength ASTM C39 (2018) and electrical surface resistivity AASHTO T 358 (2017) testing was completed at 3, 7, 14, 28, 56, 90, and 180 days. The samples were left in their cylinder molds until they were tested. This was done to prevent leaching from the surface of the cylinder by the spray in the fog room. A control mixture was tested for strength and resistivity to set a basis for comparison.
Slump tests were performed for each mixture following the ASTM C143 (2015) testing method. While the slump test is not a workability test, it has great merit in providing consistency of fresh concrete to fall under its own weight. Therefore, this can provide an understanding of the change in consistency. Slumps showed an increase for all mixtures that included fly ash when compared to the OPC mixture, which had a 25.4 mm (1 in. slump). This was due to the small spherical fly ash particles acting as ball bearings within the paste matrix, reducing friction between particles in the mixture. There were three fly ash mixtures that did not follow this behavior.
While the 3-day strengths of these mixtures were shown to be lower than OPC, the 90-day strengths exceeded those for OPC in almost every case. All mixtures met or exceeded the compressive strength of OPC at 90 days by as much as 135%. The maximum for the Class C mixtures, C5, reached 135% at 90 days, while F1, F2, and F3 reached a maximum of 121% of OPC at 90 days. Strength was met or exceeded for mixtures at the 20% replacement level compared to OPC. When increased to 40% replacement, the mixtures achieved 95% to 126% strength when compared to OPC. Particle size distribution did not seem to directly correlate to strength gain. The ratio of calcium oxide to silica plus aluminum did indicate some correlation to the 3-day strengths given that the lower calcium fly ash had lower strengths. When observing the strengths at 90-day testing versus the oxide ratio, there did not seem to be a strong correlation between strength and calcium content.
iii
Resistivity measurements showed that mixtures at both the 20% and 40% replacement levels nearly met the resistivity of OPC at 3-day testing. However, nearly all fly ash mixtures exceeded the resistivity of OPC by as much as 300% for the 20% replacement and over 600% for the 40% replacement. The lowest measurements for 20% fly ash replacement were able to exceed the OPC mixtures by at least 30%. Testing of IC4 at 90 days with a 40% replacement showed it had the lowest resistivity of all the fly ash, but exceeded OPC by 68%. When investigating the correlation of the oxide ratio to 3-day resistivity testing, there did not seem to be a strong correlation at the 20% or 40% replacement level. Yet 90-day testing showed a significant correlation for fly ash with lower calcium content having higher resistivity at the 40% replacement level. While this could be caused by a refinement in the pore structure of the fly ash with lower amounts of calcium, it is also possible that the change in the chemical composition of the fly ash also changes the pore solution chemistry and so this would, in turn, impact the resistivity.
Isothermal calorimetry demonstrated that the majority of fly ash tested did not exceed the amount of heat transferred by OPC at 20% or 40% replacement levels. Most only came within 20% of OPC in terms of heat transferred. There were four Class C fly ash mixtures and two Class F mixtures that exceeded the heat transfer of OPC. These results did not directly correlate to the oxide ratio and an exact answer could be sought through future testing currently underway.
Conclusions as to what determines the performance of concrete mixtures discussed herein with regards to the chemical content or particle size distribution could not be conclusively determined and is beyond the scope of this work.
iv
TABLE OF CONTENTS
CHAPTER 1: INVESTIGATING PERFORMANCE AND QUALITY CONTROL OF CONCRETE WITH INCREASED FLY ASH REPLACEMENT ........................................................................................ 1
INTRODUCTION ............................................................................................................................ 1
EXPERIMENTAL METHODS ........................................................................................................... 1
Laboratory Materials ............................................................................................................... 1
Mixture Design ........................................................................................................................ 3
Concrete Mixing Procedure ..................................................................................................... 4
Testing Procedure ................................................................................................................... 4
RESULTS AND DISCUSSION ........................................................................................................... 4
Slump Test ............................................................................................................................... 5
Varying Slumps of IC2, IC3, and IC4 .......................................................................................... 6
Varying Slumps of C3, C5, and IF1 ............................................................................................ 7
Compressive Strength Testing of 3-day and 90-day Samples .................................................... 8
Resistivity Testing of 3-day and 90-day Samples .................................................................... 12
Isothermal Calorimetry .......................................................................................................... 16
CONCLUSION .............................................................................................................................. 18
REFERENCES .......................................................................................................................... 20
v
LIST OF FIGURES Figure 1. Graph. Comparison of slumps measured for each fly ash mixture at 20% and 40% replacement levels............................................................................................................................... 5
Figure 2. Graph. Particle size distribution of fly ash particles................................................................ 6
Figure 3. Graph. Comparison of slump versus mean particle size with no correlation for mixtures with 20% or 40% fly ash. .............................................................................................................................. 7
Figure 4. Graph. 20% fly ash mixtures’ compressive strength as a percent of the control..................... 8
Figure 5. Graph. 40% fly ash mixtures’ compressive strength as a percent of the control..................... 9
Figure 6. Graph. Particle size distribution of IF1, F4, C4, and IC4. ....................................................... 10
Figure 7. Graph. The 3-day compressive strength of 20% and 40% fly ash compared to the ratio of calcium oxide to the sum of silicon and aluminum oxides. ................................................................. 11
Figure 8. Graph. The 90-day compressive strength of 20% and 40% fly ash compared to the ratio of calcium oxide to the sum of silicon and aluminum oxides. ................................................................. 12
Figure 9. Graph. 20% fly ash mixtures as a percent of OPC at 3-day and 90-day testing. .................... 13
Figure 10. Graph. 40% fly ash mixtures as a percent of the control at 3-day and 90-day testing......... 14
Figure 11. Graph. The 3-day resistivity of 20% and 40% fly ash compared to the ratio of calcium oxide to the sum of silicon and aluminum oxides. ....................................................................................... 15
Figure 12. Graph. The 90-day resistivity of 20% and 40% fly ash compared to the ratio of calcium oxide to the sum of silicon and aluminum oxides. .............................................................................. 16
Figure 13. Graph. Range of heat released for isothermal calorimetry tests of the 19 fly ash mixtures. .......................................................................................................................................................... 17
Figure 14. Graph. Correlation between the oxide ratio of calcium to silica plus aluminum and heat transfer. ............................................................................................................................................. 18
vi
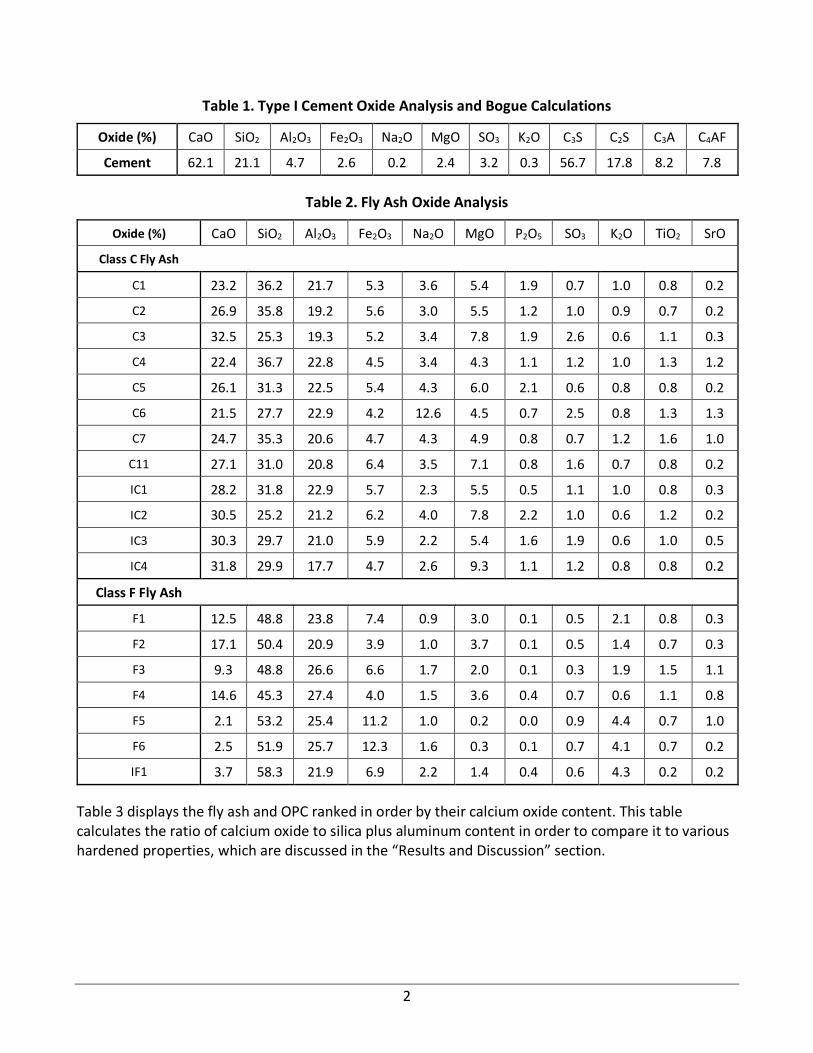
LIST OF TABLES Table 1. Type I Cement Oxide Analysis and Bogue Calculations ............................................................ 2
Table 2. Fly Ash Oxide Analysis............................................................................................................. 2
Table 3. Fly Ash Ranked in Order of Their Calcium Oxide Contents, Displaying the Ratio of Calcium Oxide to Silica Plus Alumina ................................................................................................................. 3
Table 4. Mixture Designs ...................................................................................................................... 3
Table 5. Mixture Proportions for Isothermal Calorimetry ..................................................................... 4
Table 6. Summary of Testing Results .................................................................................................... 5
1
CHAPTER 1: INVESTIGATING PERFORMANCE AND QUALITY CONTROL OF CONCRETE WITH INCREASED FLY ASH REPLACEMENT
INTRODUCTION Fly ash is a by-product of coal combustion, made up of particles that are collected through various methods before exiting the flue. It is made up of several major oxides such as CaO, Al203, Si02, Fe2O3, as well as some minor oxides. ASTM C618 (2019) uses a method that separates fly ash into two groups—Class C or Class F—based on their major oxide contents. Though there are many uses for fly ash such as soil stabilization, wastewater treatment, and supplementary cementitious material (SCM) for concrete, its use as a SCM is steadily growing. Reports from the American Coal Ash Association (AACA) (2017) say fly ash used in concrete went from 11 million short tons used in 2010 to 14 million in 2019. This is due to its economic and performance benefits. Despite this, there are some difficulties when it comes to consistency and performance predictability. This chapter aims to gather the performance data for a variety of fly ash at both 20% and 40% replacement levels. A general evaluation will be made to compare the performances between these materials in concrete mixtures at different volumes to see if the mixtures are feasible for use and if there is a bulk property that can be used to evaluate the performance in concrete. The goal of this chapter is to gather this information for more detailed investigations by other researchers in the future.
EXPERIMENTAL METHODS
Laboratory Materials All laboratory concrete mixtures in this research used a Type I cement that met the requirements of ASTM C150 (2019). Both the oxide analysis and Bogue calculations for the cement used are shown in Table 1. All 19 fly ash mixtures were produced in various US states, including Texas, Oklahoma, and Illinois. Of these, 12 fly ash mixtures were classified as Class C and 7 were classified as Class F by ASTM C618 (2019). Oxide analysis and particle size distribution were completed using an automated scanning electron microscope (ASEM) (Kim et al. 2018). The chemical compositions for each fly ash mixture are presented in Table 2. The aggregates used were locally available crushed limestone and natural sand used in commercial concrete. The crushed limestone had a maximum nominal aggregate size of 19 mm (3/4 in.). Both the crushed limestone and the sand met ASTM C33 (2018) specifications.
The fly ash listed in Table 2 is labeled using an existing system for fly ash frequently tested within our research facility at Oklahoma State University. The letters represent the class of fly ash followed by an identifying number “C#” or “F#,” except for IC and IF, which were obtained for research by the Illinois Department of Transportation and thereby denoted with the letter “I.”
2
Table 1. Type I Cement Oxide Analysis and Bogue Calculations
Oxide (%) CaO SiO2 Al2O3 Fe2O3 Na2O MgO SO3 K2O C3S C2S C3A C4AF
Cement 62.1 21.1 4.7 2.6 0.2 2.4 3.2 0.3 56.7 17.8 8.2 7.8
Table 2. Fly Ash Oxide Analysis
Oxide (%) CaO SiO2 Al2O3 Fe2O3 Na2O MgO P2O5 SO3 K2O TiO2 SrO
Class C Fly Ash
C1 23.2 36.2 21.7 5.3 3.6 5.4 1.9 0.7 1.0 0.8 0.2
C2 26.9 35.8 19.2 5.6 3.0 5.5 1.2 1.0 0.9 0.7 0.2
C3 32.5 25.3 19.3 5.2 3.4 7.8 1.9 2.6 0.6 1.1 0.3
C4 22.4 36.7 22.8 4.5 3.4 4.3 1.1 1.2 1.0 1.3 1.2
C5 26.1 31.3 22.5 5.4 4.3 6.0 2.1 0.6 0.8 0.8 0.2
C6 21.5 27.7 22.9 4.2 12.6 4.5 0.7 2.5 0.8 1.3 1.3
C7 24.7 35.3 20.6 4.7 4.3 4.9 0.8 0.7 1.2 1.6 1.0
C11 27.1 31.0 20.8 6.4 3.5 7.1 0.8 1.6 0.7 0.8 0.2
IC1 28.2 31.8 22.9 5.7 2.3 5.5 0.5 1.1 1.0 0.8 0.3
IC2 30.5 25.2 21.2 6.2 4.0 7.8 2.2 1.0 0.6 1.2 0.2
IC3 30.3 29.7 21.0 5.9 2.2 5.4 1.6 1.9 0.6 1.0 0.5
IC4 31.8 29.9 17.7 4.7 2.6 9.3 1.1 1.2 0.8 0.8 0.2
Class F Fly Ash
F1 12.5 48.8 23.8 7.4 0.9 3.0 0.1 0.5 2.1 0.8 0.3
F2 17.1 50.4 20.9 3.9 1.0 3.7 0.1 0.5 1.4 0.7 0.3
F3 9.3 48.8 26.6 6.6 1.7 2.0 0.1 0.3 1.9 1.5 1.1
F4 14.6 45.3 27.4 4.0 1.5 3.6 0.4 0.7 0.6 1.1 0.8
F5 2.1 53.2 25.4 11.2 1.0 0.2 0.0 0.9 4.4 0.7 1.0
F6 2.5 51.9 25.7 12.3 1.6 0.3 0.1 0.7 4.1 0.7 0.2
IF1 3.7 58.3 21.9 6.9 2.2 1.4 0.4 0.6 4.3 0.2 0.2
Table 3 displays the fly ash and OPC ranked in order by their calcium oxide content. This table calculates the ratio of calcium oxide to silica plus aluminum content in order to compare it to various hardened properties, which are discussed in the “Results and Discussion” section.

3
Table 3. Fly Ash Ranked in Order of Their Calcium Oxide Contents, Displaying the Ratio of Calcium Oxide to Silica Plus Alumina
Cementitious Material CaO SiO2 Al2O3 CaO/(SiO2+Al2O3)
OPC 62.1 21.1 4.7 2.41
C3 32.5 25.3 19.3 0.73
IC4 31.8 29.9 17.7 0.67
IC2 30.5 25.2 21.2 0.66
IC3 30.3 29.7 21.0 0.60
C11 27.1 31.0 20.8 0.52
IC1 28.2 31.8 22.9 0.52
C2 26.9 35.8 19.2 0.49
C5 26.1 31.3 22.5 0.49
C7 24.7 35.3 20.6 0.44
C6 21.5 27.7 22.9 0.43
C1 23.2 36.2 21.7 0.40
C4 22.4 36.7 22.8 0.38
F2 17.1 50.4 20.9 0.24
F4 14.6 45.3 27.4 0.20
F1 12.5 48.8 23.8 0.17
F3 9.3 48.8 26.6 0.12
IF1 3.7 58.3 21.9 0.05
F6 2.5 51.9 25.7 0.03
F5 2.1 53.2 25.4 0.03
Mixture Design A conventional concrete with 100% cement was compared to the 20% and 40% fly ash replacements with the 19 mixtures provided in Table 1 and Table 2. These mixture designs are used for the mixtures presented in Table 4. No air-entraining or water-reducing admixtures were used in the testing. Isothermal calorimetry testing was performed according to ASTM 1702 (2017) for all 40% mixtures and 10 fly ash mixtures at 20% replacement using the mixtures described in Table 5.
Table 3. Mixture Designs
Mixture w/b Cement (lb)
Fly Ash (lb)
Water (lb)
Paste (%)
Coarse (lb)
Fine (lb)
OPC 0.45 625 0 281 28.8 1,903 1,243
20% Fly Ash 0.45 500 125 281 28.9 1,900 1,240
40% Fly Ash 0.45 375 250 281 29.0 1,892 1,228
4
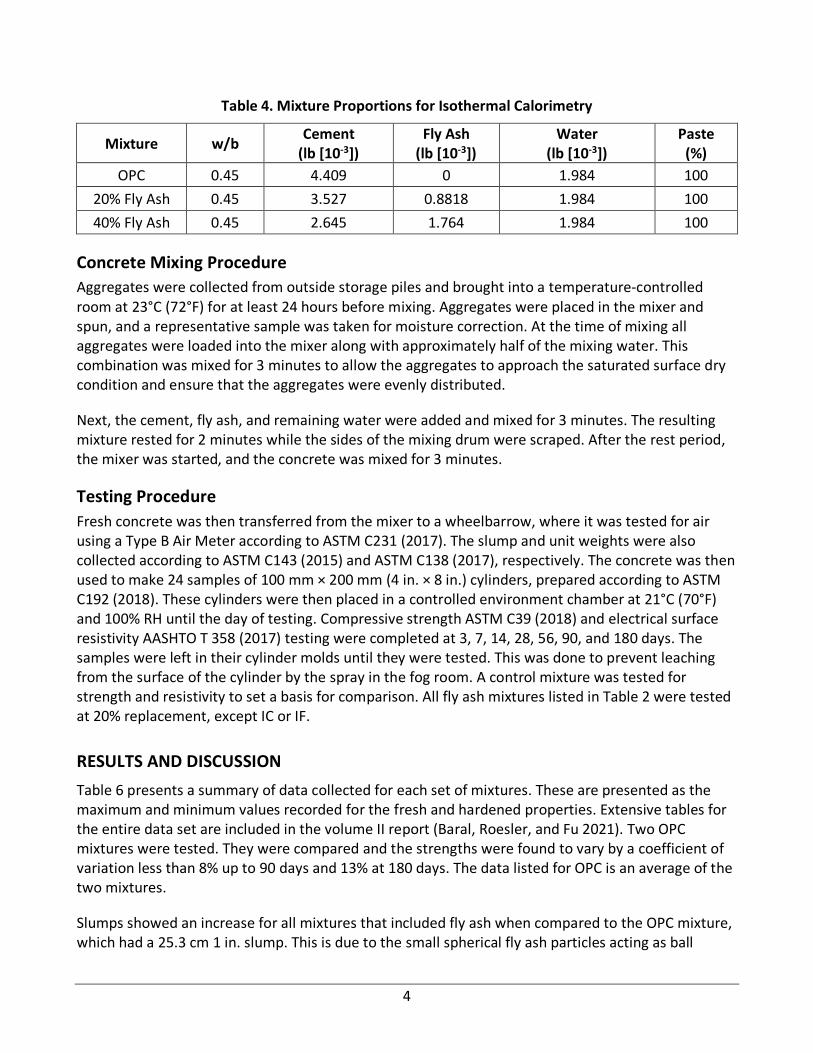
Table 4. Mixture Proportions for Isothermal Calorimetry
Mixture w/b Cement (lb [10-3])
Fly Ash (lb [10-3])
Water (lb [10-3])
Paste (%)
OPC 0.45 4.409 0 1.984 100 20% Fly Ash 0.45 3.527 0.8818 1.984 100 40% Fly Ash 0.45 2.645 1.764 1.984 100
Concrete Mixing Procedure Aggregates were collected from outside storage piles and brought into a temperature-controlled room at 23°C (72°F) for at least 24 hours before mixing. Aggregates were placed in the mixer and spun, and a representative sample was taken for moisture correction. At the time of mixing all aggregates were loaded into the mixer along with approximately half of the mixing water. This combination was mixed for 3 minutes to allow the aggregates to approach the saturated surface dry condition and ensure that the aggregates were evenly distributed.
Next, the cement, fly ash, and remaining water were added and mixed for 3 minutes. The resulting mixture rested for 2 minutes while the sides of the mixing drum were scraped. After the rest period, the mixer was started, and the concrete was mixed for 3 minutes.
Testing Procedure Fresh concrete was then transferred from the mixer to a wheelbarrow, where it was tested for air using a Type B Air Meter according to ASTM C231 (2017). The slump and unit weights were also collected according to ASTM C143 (2015) and ASTM C138 (2017), respectively. The concrete was then used to make 24 samples of 100 mm × 200 mm (4 in. × 8 in.) cylinders, prepared according to ASTM C192 (2018). These cylinders were then placed in a controlled environment chamber at 21°C (70°F) and 100% RH until the day of testing. Compressive strength ASTM C39 (2018) and electrical surface resistivity AASHTO T 358 (2017) testing were completed at 3, 7, 14, 28, 56, 90, and 180 days. The samples were left in their cylinder molds until they were tested. This was done to prevent leaching from the surface of the cylinder by the spray in the fog room. A control mixture was tested for strength and resistivity to set a basis for comparison. All fly ash mixtures listed in Table 2 were tested at 20% replacement, except IC or IF.
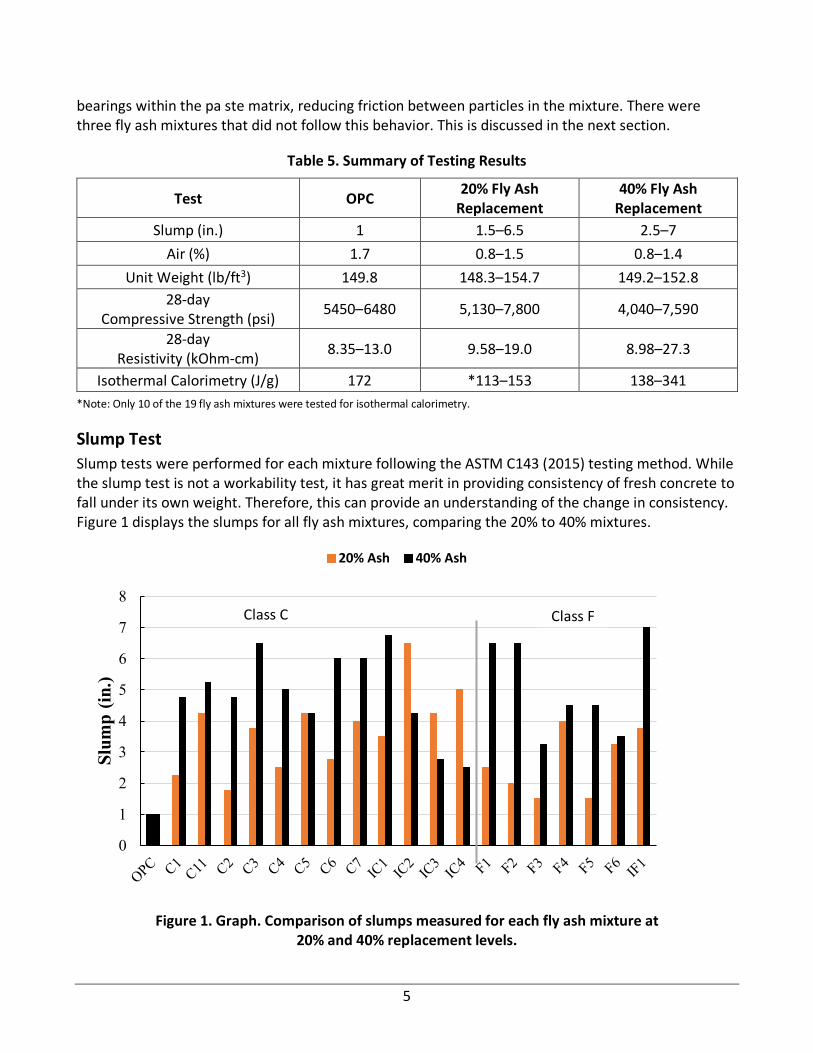
RESULTS AND DISCUSSION Table 6 presents a summary of data collected for each set of mixtures. These are presented as the maximum and minimum values recorded for the fresh and hardened properties. Extensive tables for the entire data set are included in the volume II report (Baral, Roesler, and Fu 2021). Two OPC mixtures were tested. They were compared and the strengths were found to vary by a coefficient of variation less than 8% up to 90 days and 13% at 180 days. The data listed for OPC is an average of the two mixtures.
Slumps showed an increase for all mixtures that included fly ash when compared to the OPC mixture, which had a 25.3 cm 1 in. slump. This is due to the small spherical fly ash particles acting as ball
5
bearings within the pa ste matrix, reducing friction between particles in the mixture. There were three fly ash mixtures that did not follow this behavior. This is discussed in the next section.
Table 5. Summary of Testing Results
Test OPC 20% Fly Ash Replacement
40% Fly Ash Replacement
Slump (in.) 1 1.5–6.5 2.5–7 Air (%) 1.7 0.8–1.5 0.8–1.4
Unit Weight (lb/ft3) 149.8 148.3–154.7 149.2–152.8 28-day
Compressive Strength (psi) 5450–6480 5,130–7,800 4,040–7,590
28-day Resistivity (kOhm-cm) 8.35–13.0 9.58–19.0 8.98–27.3
Isothermal Calorimetry (J/g) 172 *113–153 138–341 *Note: Only 10 of the 19 fly ash mixtures were tested for isothermal calorimetry.
Slump Test Slump tests were performed for each mixture following the ASTM C143 (2015) testing method. While the slump test is not a workability test, it has great merit in providing consistency of fresh concrete to fall under its own weight. Therefore, this can provide an understanding of the change in consistency. Figure 1 displays the slumps for all fly ash mixtures, comparing the 20% to 40% mixtures.
Figure 1. Graph. Comparison of slumps measured for each fly ash mixture at 20% and 40% replacement levels.
0
1
2
3
4
5
6
7
8
Slum
p (in
.)
20% Ash 40% Ash
Class F Class C
6
The results varied for each mixture; in most cases, the 40% replacement mixtures had a higher slump than the mixtures at 20% replacement by an average of 30.5 mm (1.2 in). Of the Class C mixtures, C6 and IC1 showed the greatest increase in slump at 82.55 mm (3.25 in). Of the Class F mixtures, F2 showed the greatest increase in slump with 50.8 mm (2 in.) at 20% compared to a slump of 165.1 mm (6.5 in.) at 40% replacement. However, this is not always the case. IC2, IC3, and IC4 showed higher slumps at the 20% replacement level by 57.2 mm (2.25 in), 37.5 mm (1.5 in), and 63.5 mm (2.5 in.), respectively, while F6 and F4 showed little effect on the slumps for the 40% mixture. C5 had no change in slumps between 20% and 40% replacement levels.
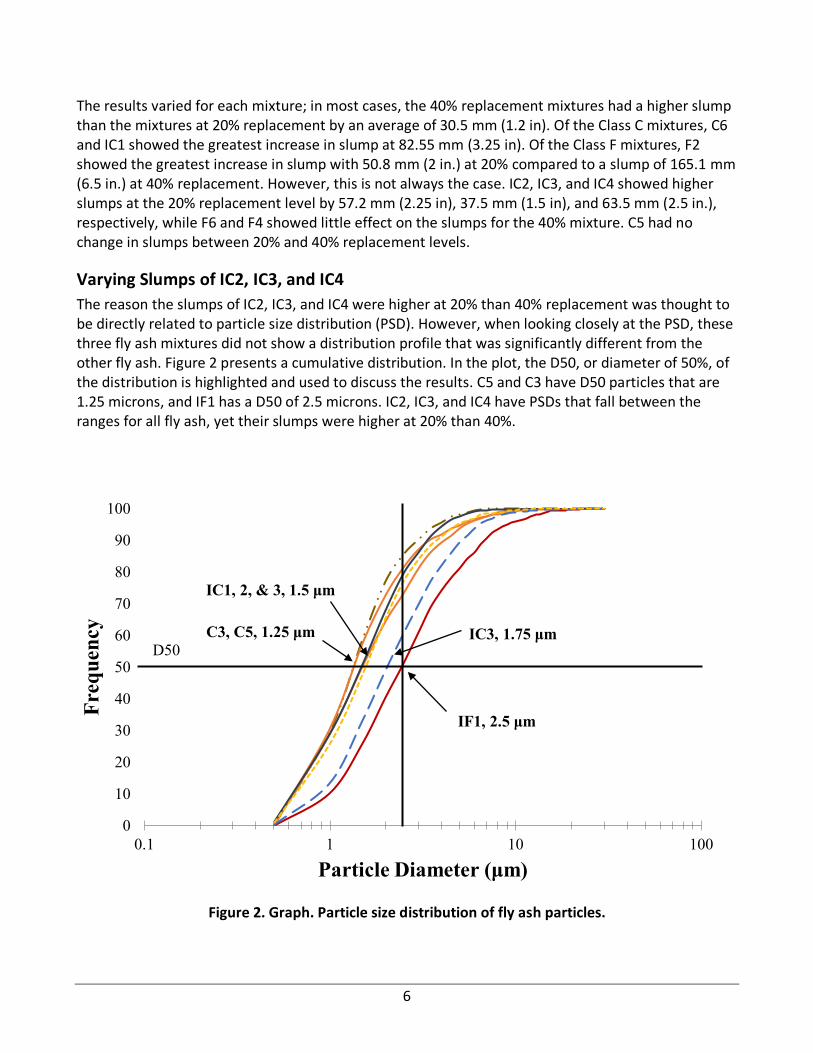
Varying Slumps of IC2, IC3, and IC4 The reason the slumps of IC2, IC3, and IC4 were higher at 20% than 40% replacement was thought to be directly related to particle size distribution (PSD). However, when looking closely at the PSD, these three fly ash mixtures did not show a distribution profile that was significantly different from the other fly ash. Figure 2 presents a cumulative distribution. In the plot, the D50, or diameter of 50%, of the distribution is highlighted and used to discuss the results. C5 and C3 have D50 particles that are 1.25 microns, and IF1 has a D50 of 2.5 microns. IC2, IC3, and IC4 have PSDs that fall between the ranges for all fly ash, yet their slumps were higher at 20% than 40%.
Figure 2. Graph. Particle size distribution of fly ash particles.
0
10
20
30
40
50
60
70
80
90
100
0.1 1 10 100
Freq
uenc
y
Particle Diameter (μm)
D50
IF1, 2.5 μm
IC1, 2, & 3, 1.5 μm
C3, C5, 1.25 μm IC3, 1.75 μm
7
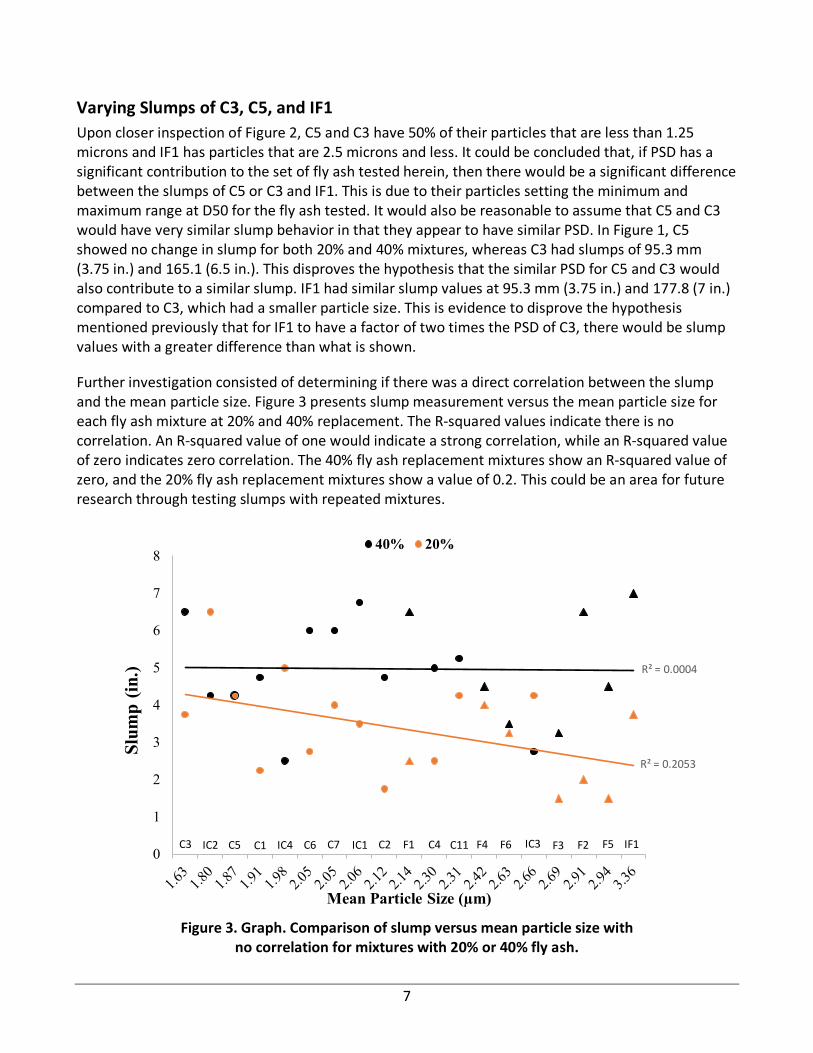
Varying Slumps of C3, C5, and IF1 Upon closer inspection of Figure 2, C5 and C3 have 50% of their particles that are less than 1.25 microns and IF1 has particles that are 2.5 microns and less. It could be concluded that, if PSD has a significant contribution to the set of fly ash tested herein, then there would be a significant difference between the slumps of C5 or C3 and IF1. This is due to their particles setting the minimum and maximum range at D50 for the fly ash tested. It would also be reasonable to assume that C5 and C3 would have very similar slump behavior in that they appear to have similar PSD. In Figure 1, C5 showed no change in slump for both 20% and 40% mixtures, whereas C3 had slumps of 95.3 mm (3.75 in.) and 165.1 (6.5 in.). This disproves the hypothesis that the similar PSD for C5 and C3 would also contribute to a similar slump. IF1 had similar slump values at 95.3 mm (3.75 in.) and 177.8 (7 in.) compared to C3, which had a smaller particle size. This is evidence to disprove the hypothesis mentioned previously that for IF1 to have a factor of two times the PSD of C3, there would be slump values with a greater difference than what is shown.
Further investigation consisted of determining if there was a direct correlation between the slump and the mean particle size. Figure 3 presents slump measurement versus the mean particle size for each fly ash mixture at 20% and 40% replacement. The R-squared values indicate there is no correlation. An R-squared value of one would indicate a strong correlation, while an R-squared value of zero indicates zero correlation. The 40% fly ash replacement mixtures show an R-squared value of zero, and the 20% fly ash replacement mixtures show a value of 0.2. This could be an area for future research through testing slumps with repeated mixtures.
Figure 3. Graph. Comparison of slump versus mean particle size with
no correlation for mixtures with 20% or 40% fly ash.
C3 IC2 C5 C1 IC4 C6 C7 IC1 C2 F1 C4 C11 F4 F6 IC3 F3 F2 F5 IF1
R² = 0.0004
R² = 0.2053
0
1
2
3
4
5
6
7
8
Slum
p (in
.)
Mean Particle Size (µm)
40% 20%
8
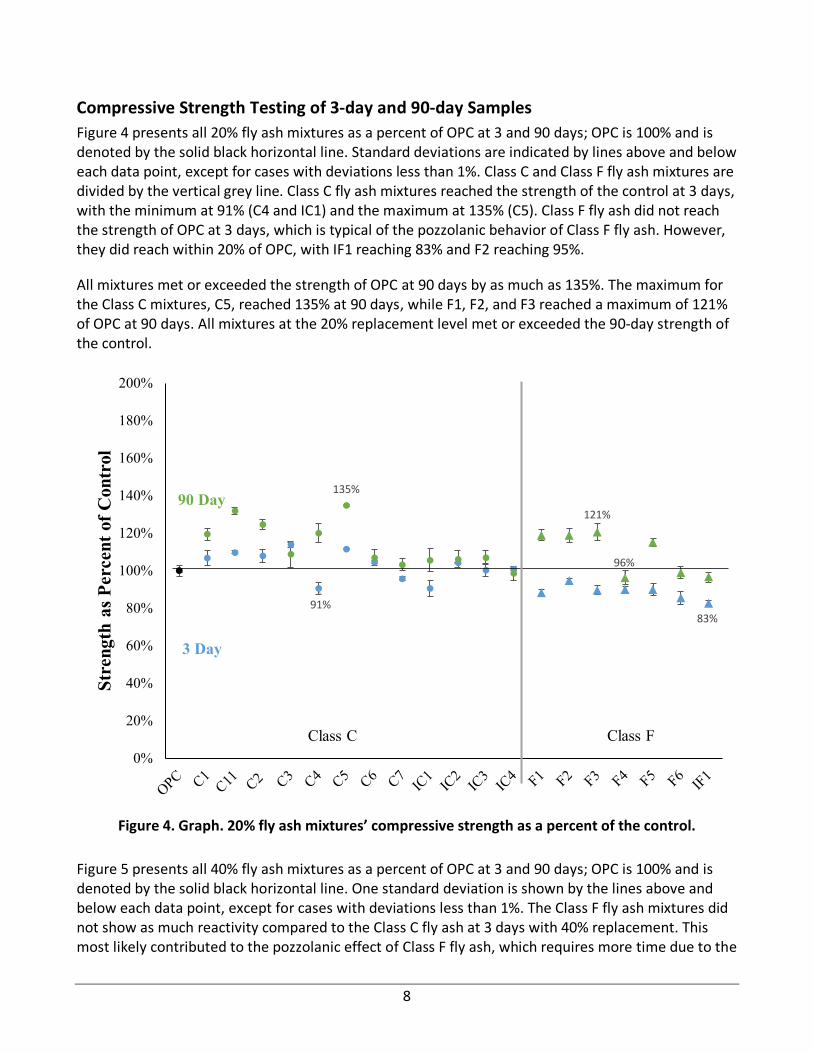
Compressive Strength Testing of 3-day and 90-day Samples Figure 4 presents all 20% fly ash mixtures as a percent of OPC at 3 and 90 days; OPC is 100% and is denoted by the solid black horizontal line. Standard deviations are indicated by lines above and below each data point, except for cases with deviations less than 1%. Class C and Class F fly ash mixtures are divided by the vertical grey line. Class C fly ash mixtures reached the strength of the control at 3 days, with the minimum at 91% (C4 and IC1) and the maximum at 135% (C5). Class F fly ash did not reach the strength of OPC at 3 days, which is typical of the pozzolanic behavior of Class F fly ash. However, they did reach within 20% of OPC, with IF1 reaching 83% and F2 reaching 95%.
All mixtures met or exceeded the strength of OPC at 90 days by as much as 135%. The maximum for the Class C mixtures, C5, reached 135% at 90 days, while F1, F2, and F3 reached a maximum of 121% of OPC at 90 days. All mixtures at the 20% replacement level met or exceeded the 90-day strength of the control.
Figure 4. Graph. 20% fly ash mixtures’ compressive strength as a percent of the control.
Figure 5 presents all 40% fly ash mixtures as a percent of OPC at 3 and 90 days; OPC is 100% and is denoted by the solid black horizontal line. One standard deviation is shown by the lines above and below each data point, except for cases with deviations less than 1%. The Class F fly ash mixtures did not show as much reactivity compared to the Class C fly ash at 3 days with 40% replacement. This most likely contributed to the pozzolanic effect of Class F fly ash, which requires more time due to the
91%83%
135%
121%
96%
0%
20%
40%
60%
80%
100%
120%
140%
160%
180%
200%
Stre
ngth
as P
erce
nt o
f Con
trol
90 Day
3 Day
Class C Class F

9
delayed reactions and is magnified by the amount of replacement. IF1 only reached 51% of OPC at 3 days; the maximum being F2 at 80% of OPC. C6 had the lowest overall strength for the Class C mixtures at 3 days with 59%, and the rest of the Class C fly ash mixtures were within 35% of OPC. F4 reached the greatest strength for the Class F fly ash mixtures with 120% of OPC at 90 days; the minimum was IF1 at 87%. The Class C fly ash mixtures all met or exceeded OPC at 90 days, except C6, which reached 89%. The highest was C4 at 126%, though C3 was right behind at 125%.
Figure 5. Graph. 40% fly ash mixtures’ compressive strength as a percent of the control.
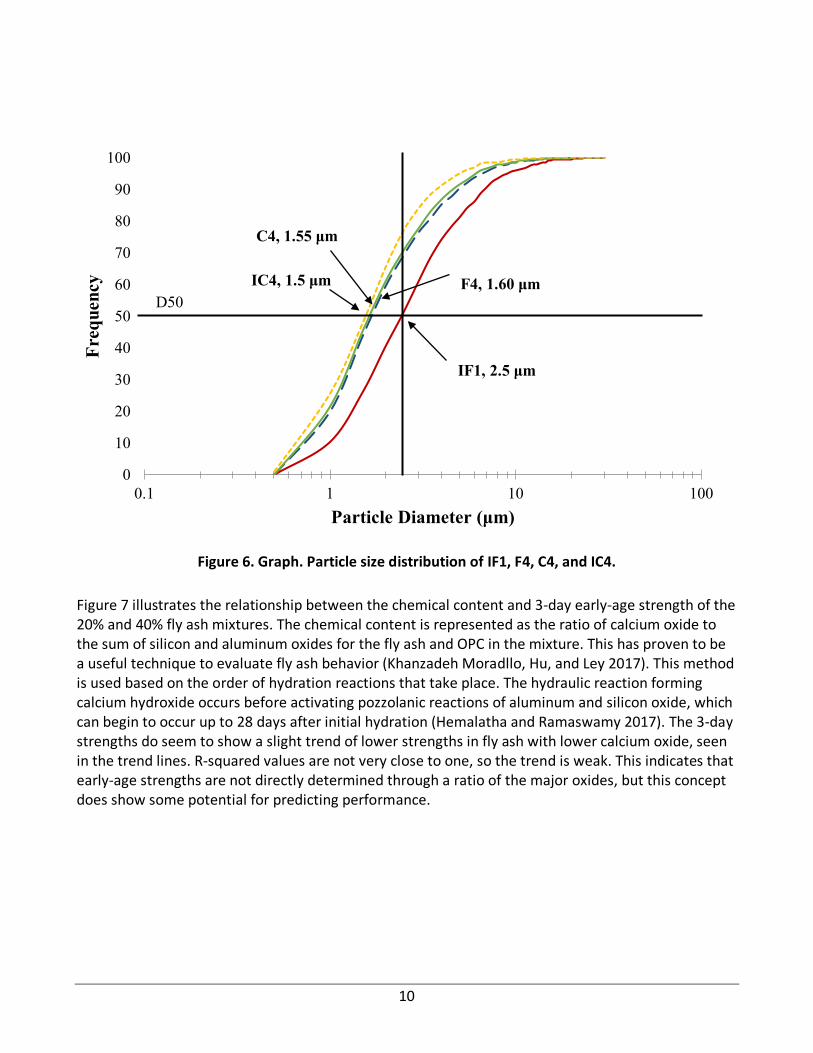
The data in Figure 5 indicate that mixtures with 20% and 40% fly ash replacement may not reach the strength of OPC at 3 days. However, they do meet and often exceed the strength of OPC at 90 days. Some fly ash mixtures may have performed better than others, such as the 20% C4 (135%, 90 days) versus 20% IC4 (99%, 90 days) or the 40% replacement with F4 (120%, 90 days) versus IF1 (87%, 90 days), because of their PSD and chemical content. The PSD in Figure 6 indicates that though C4 and F4 share a similar size distribution, which could indicate a similar strength gain, IC4 and IF1 have different distributions. If this were the case, IC4 would share a similar strength gain to C4 and F4 due to their similar PSD. This means that the particle surface could be a better indicator of their reactivity as well as chemical content.
59%51%
126%120%
0%
20%
40%
60%
80%
100%
120%
140%
160%
180%
200%
Stre
ngth
as P
erce
nt o
f Con
trol
90 Day
3 Day
Class C Class F
10
Figure 6. Graph. Particle size distribution of IF1, F4, C4, and IC4.
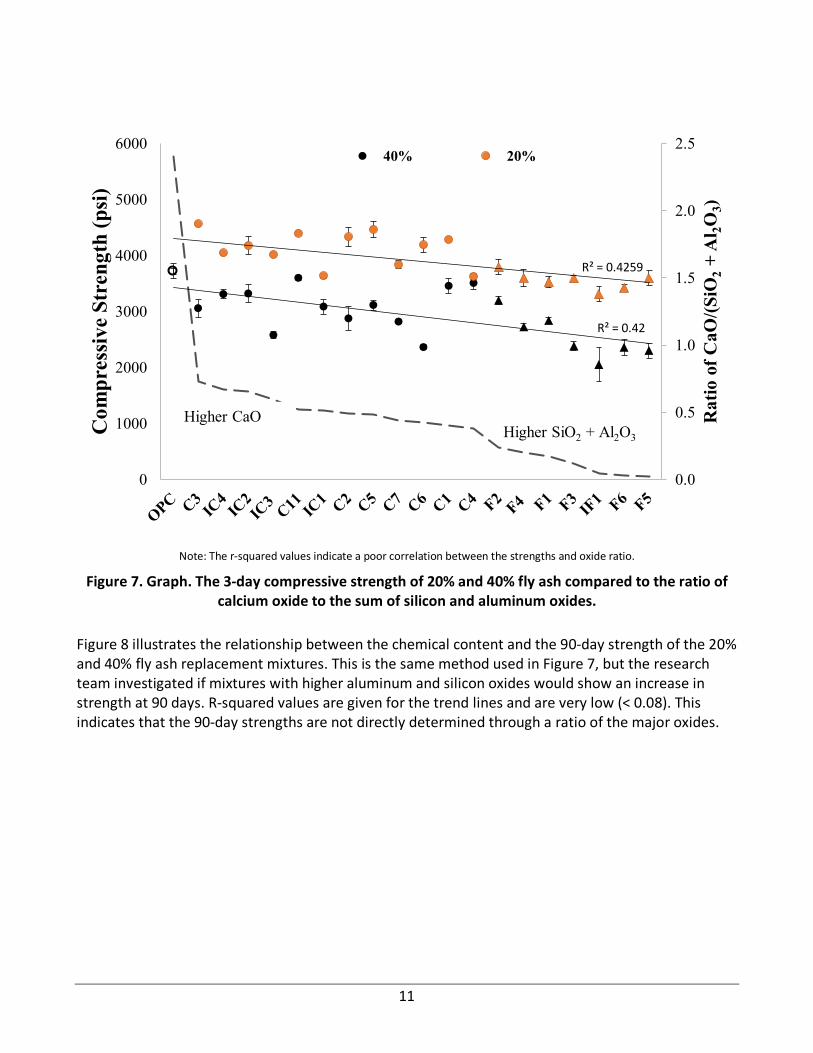
Figure 7 illustrates the relationship between the chemical content and 3-day early-age strength of the 20% and 40% fly ash mixtures. The chemical content is represented as the ratio of calcium oxide to the sum of silicon and aluminum oxides for the fly ash and OPC in the mixture. This has proven to be a useful technique to evaluate fly ash behavior (Khanzadeh Moradllo, Hu, and Ley 2017). This method is used based on the order of hydration reactions that take place. The hydraulic reaction forming calcium hydroxide occurs before activating pozzolanic reactions of aluminum and silicon oxide, which can begin to occur up to 28 days after initial hydration (Hemalatha and Ramaswamy 2017). The 3-day strengths do seem to show a slight trend of lower strengths in fly ash with lower calcium oxide, seen in the trend lines. R-squared values are not very close to one, so the trend is weak. This indicates that early-age strengths are not directly determined through a ratio of the major oxides, but this concept does show some potential for predicting performance.
0
10
20
30
40
50
60
70
80
90
100
0.1 1 10 100
Freq
uenc
y
Particle Diameter (μm)
D50
IF1, 2.5 μm
C4, 1.55 μm
IC4, 1.5 μm F4, 1.60 μm
11
Note: The r-squared values indicate a poor correlation between the strengths and oxide ratio.
Figure 7. Graph. The 3-day compressive strength of 20% and 40% fly ash compared to the ratio of calcium oxide to the sum of silicon and aluminum oxides.
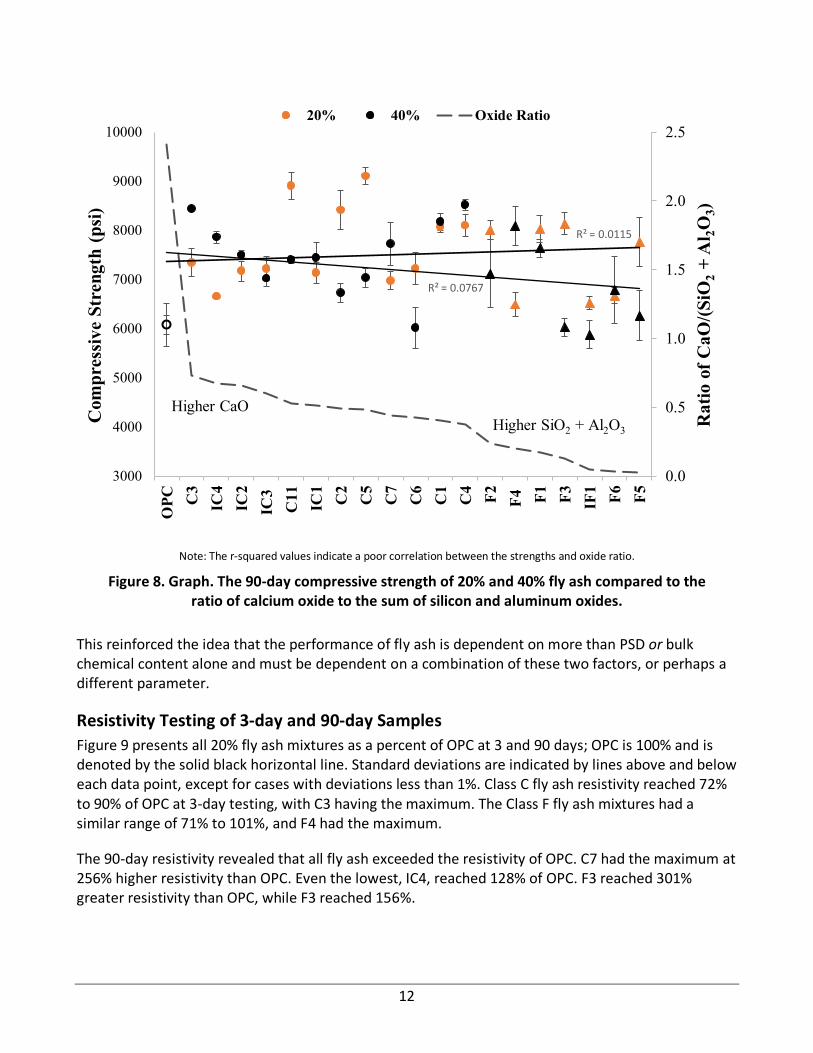
Figure 8 illustrates the relationship between the chemical content and the 90-day strength of the 20% and 40% fly ash replacement mixtures. This is the same method used in Figure 7, but the research team investigated if mixtures with higher aluminum and silicon oxides would show an increase in strength at 90 days. R-squared values are given for the trend lines and are very low (< 0.08). This indicates that the 90-day strengths are not directly determined through a ratio of the major oxides.
R² = 0.42
R² = 0.4259
0.0
0.5
1.0
1.5
2.0
2.5
0
1000
2000
3000
4000
5000
6000
Rat
io o
f CaO
/(SiO
2+
Al 2O
3)
Com
pres
sive
Str
engt
h (p
si)
40% 20%
Higher SiO2 + Al2O3
Higher CaO
12
Note: The r-squared values indicate a poor correlation between the strengths and oxide ratio.
Figure 8. Graph. The 90-day compressive strength of 20% and 40% fly ash compared to the ratio of calcium oxide to the sum of silicon and aluminum oxides.
This reinforced the idea that the performance of fly ash is dependent on more than PSD or bulk chemical content alone and must be dependent on a combination of these two factors, or perhaps a different parameter.
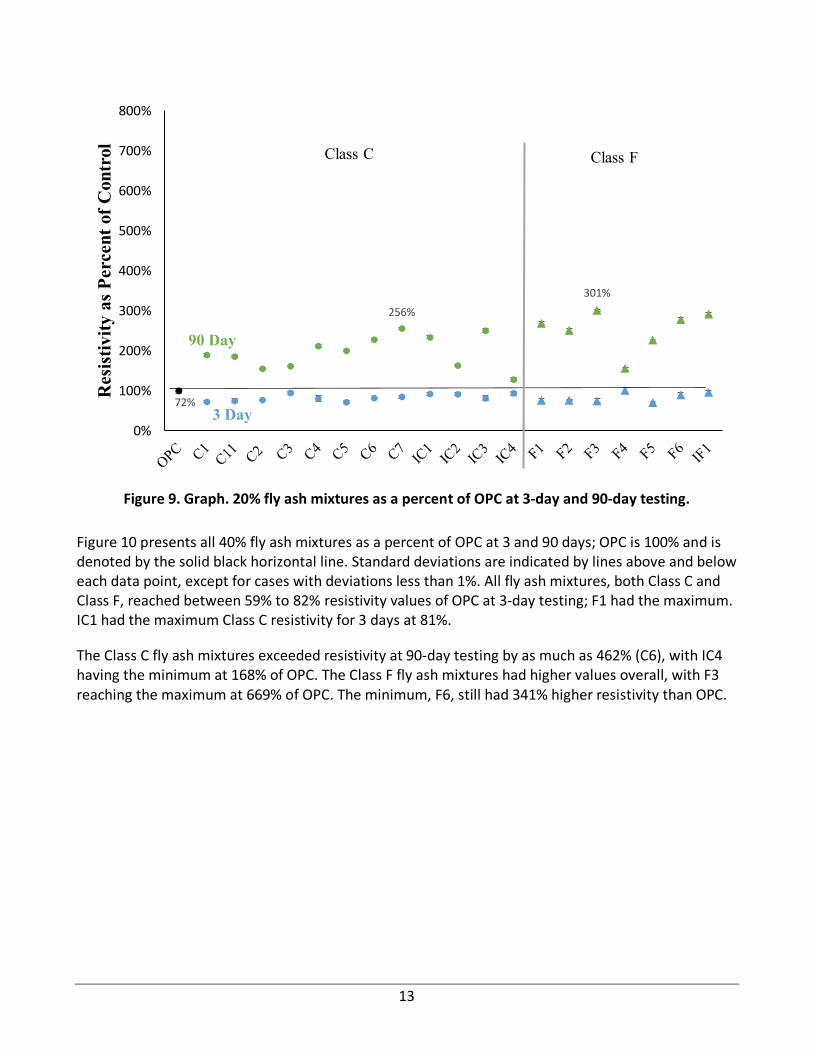
Resistivity Testing of 3-day and 90-day Samples Figure 9 presents all 20% fly ash mixtures as a percent of OPC at 3 and 90 days; OPC is 100% and is denoted by the solid black horizontal line. Standard deviations are indicated by lines above and below each data point, except for cases with deviations less than 1%. Class C fly ash resistivity reached 72% to 90% of OPC at 3-day testing, with C3 having the maximum. The Class F fly ash mixtures had a similar range of 71% to 101%, and F4 had the maximum.
The 90-day resistivity revealed that all fly ash exceeded the resistivity of OPC. C7 had the maximum at 256% higher resistivity than OPC. Even the lowest, IC4, reached 128% of OPC. F3 reached 301% greater resistivity than OPC, while F3 reached 156%.
R² = 0.0115
R² = 0.0767
0.0
0.5
1.0
1.5
2.0
2.5
3000
4000
5000
6000
7000
8000
9000
10000
OPC C
3IC
4IC
2IC
3C
11 IC1
C2
C5
C7
C6
C1
C4 F2 F4 F1 F3 IF1 F6 F5
Rat
io o
f CaO
/(SiO
2+
Al 2O
3)
Com
pres
sive
Str
engt
h (p
si)
20% 40% Oxide Ratio
Higher SiO2 + Al2O3
Higher CaO
13
Figure 9. Graph. 20% fly ash mixtures as a percent of OPC at 3-day and 90-day testing.
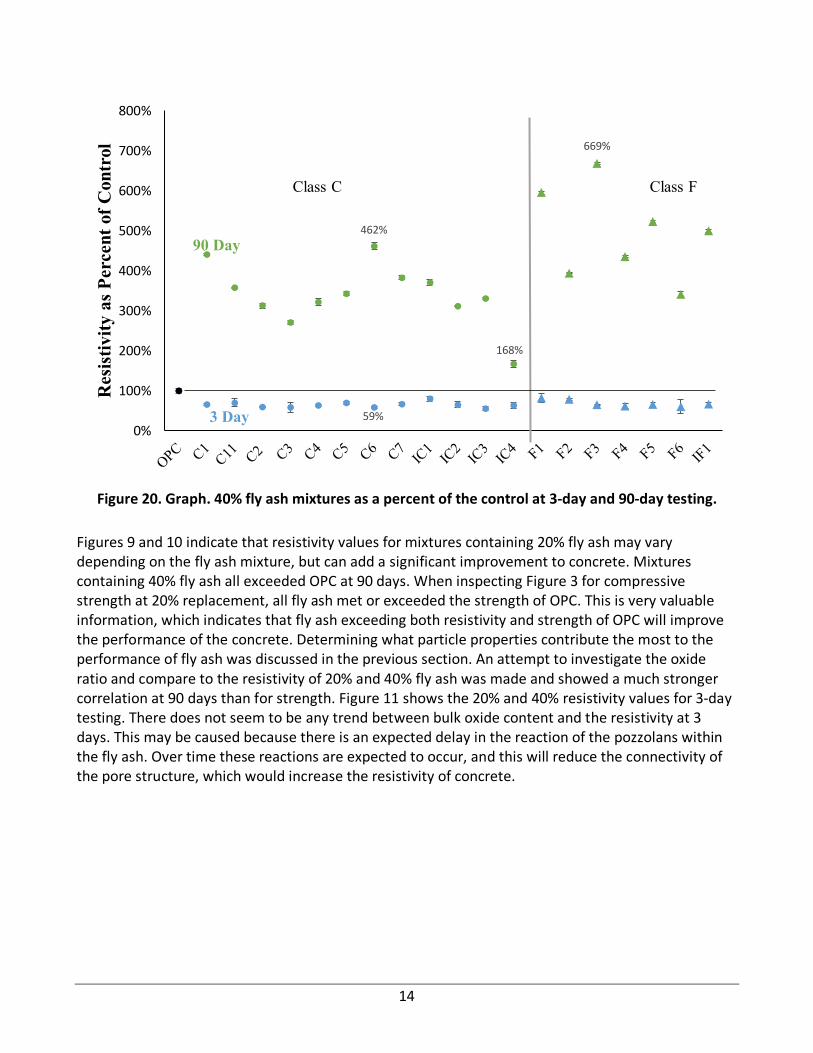
Figure 10 presents all 40% fly ash mixtures as a percent of OPC at 3 and 90 days; OPC is 100% and is denoted by the solid black horizontal line. Standard deviations are indicated by lines above and below each data point, except for cases with deviations less than 1%. All fly ash mixtures, both Class C and Class F, reached between 59% to 82% resistivity values of OPC at 3-day testing; F1 had the maximum. IC1 had the maximum Class C resistivity for 3 days at 81%.
The Class C fly ash mixtures exceeded resistivity at 90-day testing by as much as 462% (C6), with IC4 having the minimum at 168% of OPC. The Class F fly ash mixtures had higher values overall, with F3 reaching the maximum at 669% of OPC. The minimum, F6, still had 341% higher resistivity than OPC.
72%
256%
301%
0%
100%
200%
300%
400%
500%
600%
700%
800%R
esis
tivity
as P
erce
nt o
f Con
trol
90 Day
3 Day
Class C Class F
14
Figure 20. Graph. 40% fly ash mixtures as a percent of the control at 3-day and 90-day testing.
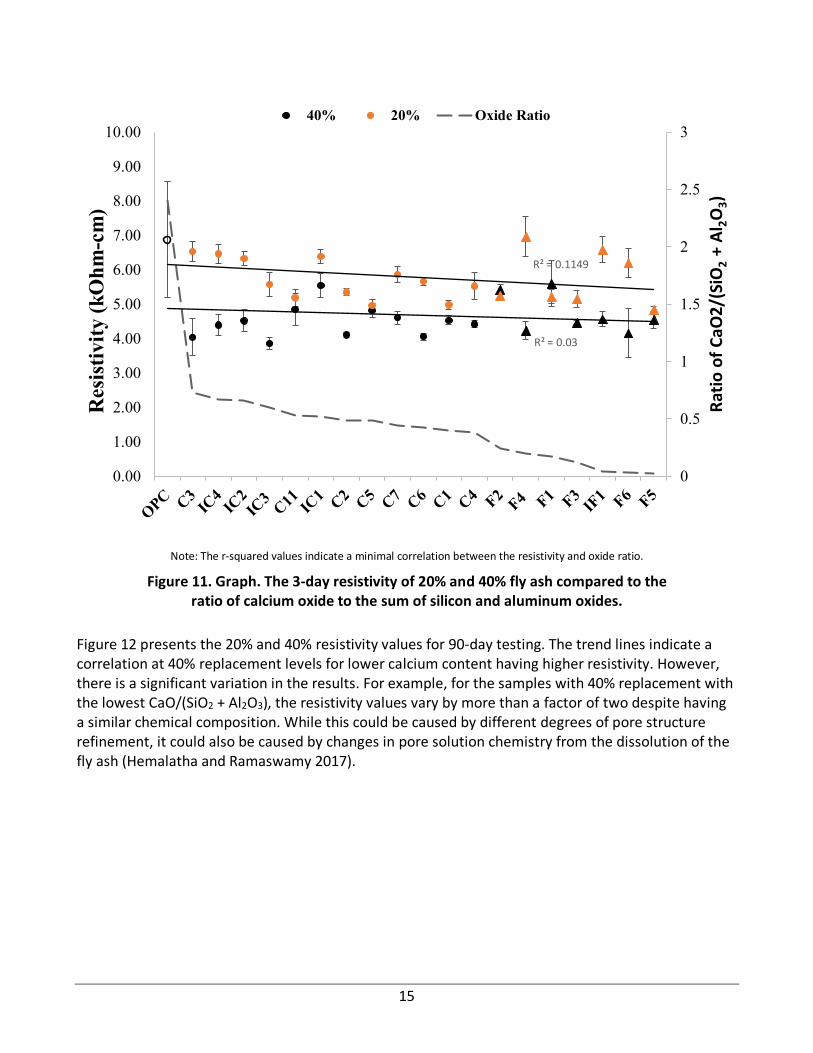
Figures 9 and 10 indicate that resistivity values for mixtures containing 20% fly ash may vary depending on the fly ash mixture, but can add a significant improvement to concrete. Mixtures containing 40% fly ash all exceeded OPC at 90 days. When inspecting Figure 3 for compressive strength at 20% replacement, all fly ash met or exceeded the strength of OPC. This is very valuable information, which indicates that fly ash exceeding both resistivity and strength of OPC will improve the performance of the concrete. Determining what particle properties contribute the most to the performance of fly ash was discussed in the previous section. An attempt to investigate the oxide ratio and compare to the resistivity of 20% and 40% fly ash was made and showed a much stronger correlation at 90 days than for strength. Figure 11 shows the 20% and 40% resistivity values for 3-day testing. There does not seem to be any trend between bulk oxide content and the resistivity at 3 days. This may be caused because there is an expected delay in the reaction of the pozzolans within the fly ash. Over time these reactions are expected to occur, and this will reduce the connectivity of the pore structure, which would increase the resistivity of concrete.
59%
462%
168%
669%
0%
100%
200%
300%
400%
500%
600%
700%
800%R
esis
tivity
as P
erce
nt o
f Con
trol
Class C Class F
90 Day
3 Day
15
Note: The r-squared values indicate a minimal correlation between the resistivity and oxide ratio.
Figure 11. Graph. The 3-day resistivity of 20% and 40% fly ash compared to the ratio of calcium oxide to the sum of silicon and aluminum oxides.
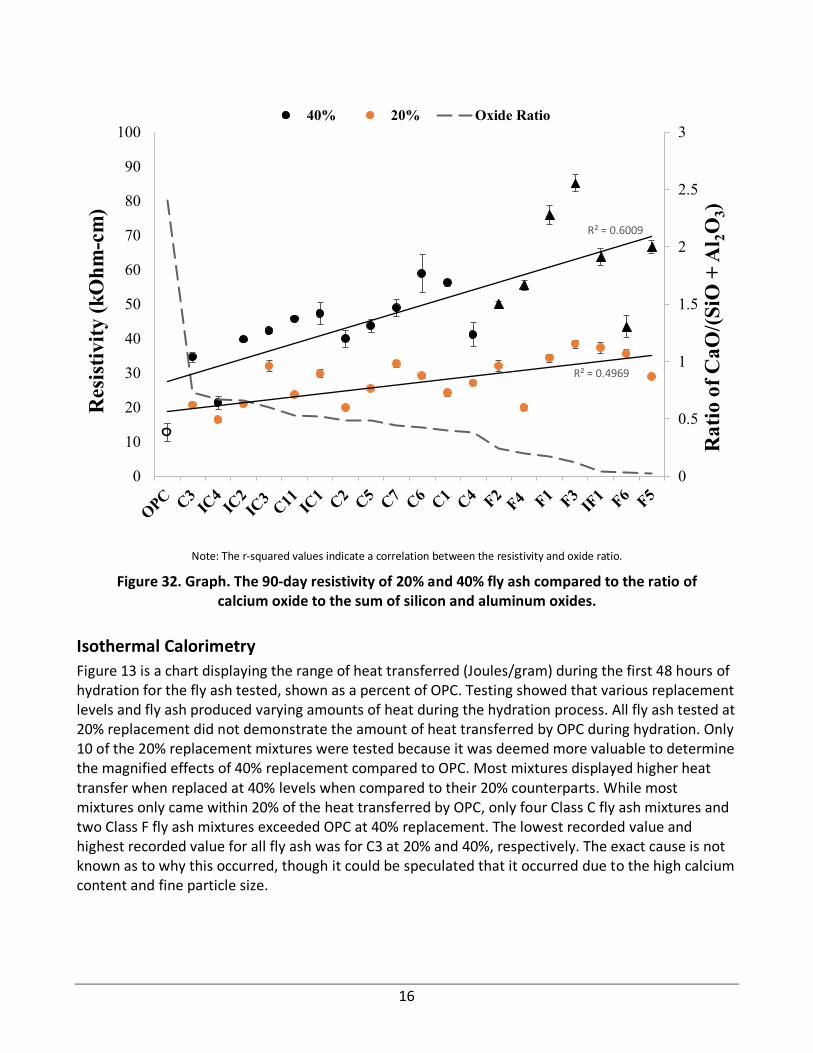
Figure 12 presents the 20% and 40% resistivity values for 90-day testing. The trend lines indicate a correlation at 40% replacement levels for lower calcium content having higher resistivity. However, there is a significant variation in the results. For example, for the samples with 40% replacement with the lowest CaO/(SiO2 + Al2O3), the resistivity values vary by more than a factor of two despite having a similar chemical composition. While this could be caused by different degrees of pore structure refinement, it could also be caused by changes in pore solution chemistry from the dissolution of the fly ash (Hemalatha and Ramaswamy 2017).
R² = 0.03
R² = 0.1149
0
0.5
1
1.5
2
2.5
3
0.00
1.00
2.00
3.00
4.00
5.00
6.00
7.00
8.00
9.00
10.00
Ratio
of C
aO2/
(SiO
2+
Al2O
3)
Res
istiv
ity (k
Ohm
-cm
)40% 20% Oxide Ratio
16
Note: The r-squared values indicate a correlation between the resistivity and oxide ratio.
Figure 32. Graph. The 90-day resistivity of 20% and 40% fly ash compared to the ratio of calcium oxide to the sum of silicon and aluminum oxides.
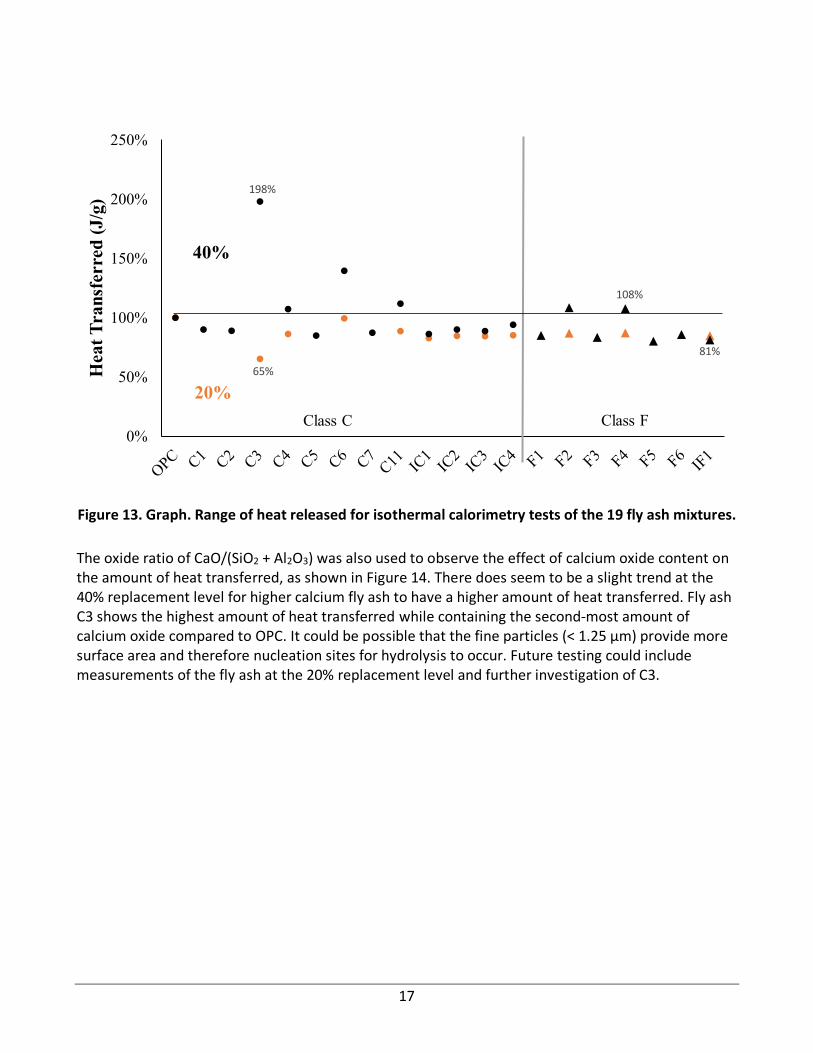
Isothermal Calorimetry Figure 13 is a chart displaying the range of heat transferred (Joules/gram) during the first 48 hours of hydration for the fly ash tested, shown as a percent of OPC. Testing showed that various replacement levels and fly ash produced varying amounts of heat during the hydration process. All fly ash tested at 20% replacement did not demonstrate the amount of heat transferred by OPC during hydration. Only 10 of the 20% replacement mixtures were tested because it was deemed more valuable to determine the magnified effects of 40% replacement compared to OPC. Most mixtures displayed higher heat transfer when replaced at 40% levels when compared to their 20% counterparts. While most mixtures only came within 20% of the heat transferred by OPC, only four Class C fly ash mixtures and two Class F fly ash mixtures exceeded OPC at 40% replacement. The lowest recorded value and highest recorded value for all fly ash was for C3 at 20% and 40%, respectively. The exact cause is not known as to why this occurred, though it could be speculated that it occurred due to the high calcium content and fine particle size.
R² = 0.6009
R² = 0.4969
0
0.5
1
1.5
2
2.5
3
0
10
20
30
40
50
60
70
80
90
100
Rat
io o
f CaO
/(SiO
+ A
l 2O3)
Res
istiv
ity (k
Ohm
-cm
)40% 20% Oxide Ratio
17
Figure 13. Graph. Range of heat released for isothermal calorimetry tests of the 19 fly ash mixtures.
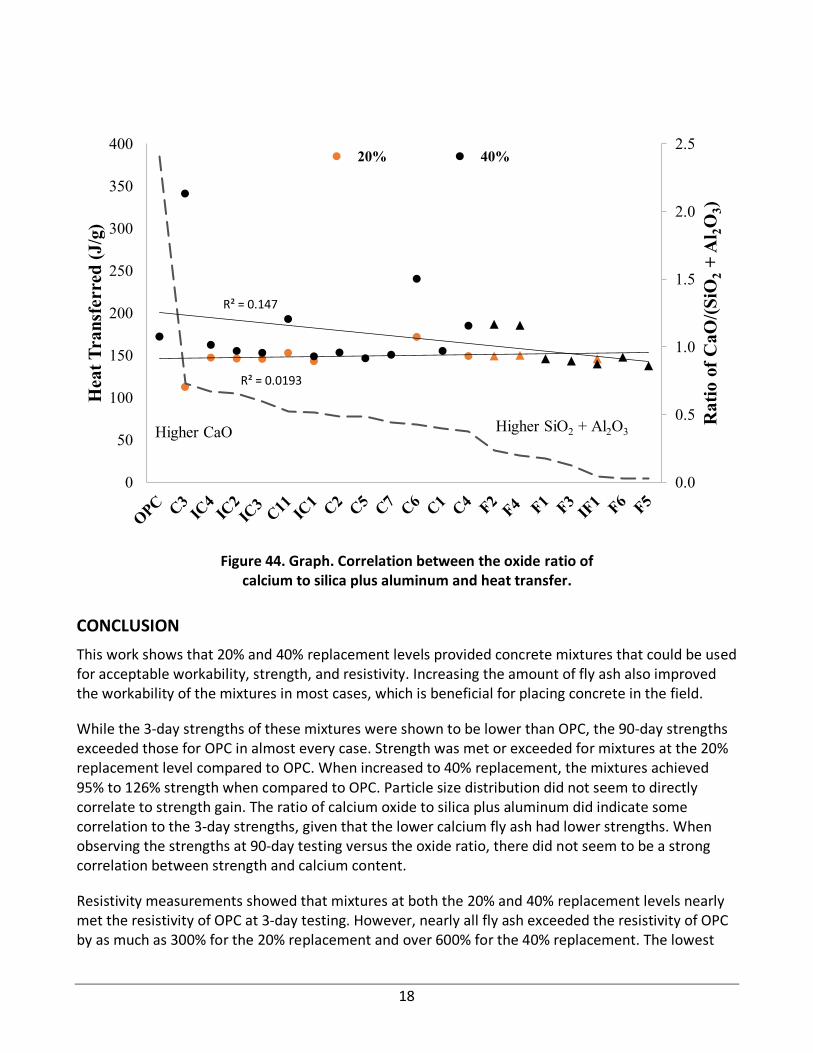
The oxide ratio of CaO/(SiO2 + Al2O3) was also used to observe the effect of calcium oxide content on the amount of heat transferred, as shown in Figure 14. There does seem to be a slight trend at the 40% replacement level for higher calcium fly ash to have a higher amount of heat transferred. Fly ash C3 shows the highest amount of heat transferred while containing the second-most amount of calcium oxide compared to OPC. It could be possible that the fine particles (< 1.25 μm) provide more surface area and therefore nucleation sites for hydrolysis to occur. Future testing could include measurements of the fly ash at the 20% replacement level and further investigation of C3.
65%
198%
108%
81%
0%
50%
100%
150%
200%
250%
Hea
t Tra
nsfe
rred
(J/g
)
40%
20%Class C Class F
18
Figure 44. Graph. Correlation between the oxide ratio of
calcium to silica plus aluminum and heat transfer.
CONCLUSION This work shows that 20% and 40% replacement levels provided concrete mixtures that could be used for acceptable workability, strength, and resistivity. Increasing the amount of fly ash also improved the workability of the mixtures in most cases, which is beneficial for placing concrete in the field.
While the 3-day strengths of these mixtures were shown to be lower than OPC, the 90-day strengths exceeded those for OPC in almost every case. Strength was met or exceeded for mixtures at the 20% replacement level compared to OPC. When increased to 40% replacement, the mixtures achieved 95% to 126% strength when compared to OPC. Particle size distribution did not seem to directly correlate to strength gain. The ratio of calcium oxide to silica plus aluminum did indicate some correlation to the 3-day strengths, given that the lower calcium fly ash had lower strengths. When observing the strengths at 90-day testing versus the oxide ratio, there did not seem to be a strong correlation between strength and calcium content.
Resistivity measurements showed that mixtures at both the 20% and 40% replacement levels nearly met the resistivity of OPC at 3-day testing. However, nearly all fly ash exceeded the resistivity of OPC by as much as 300% for the 20% replacement and over 600% for the 40% replacement. The lowest
R² = 0.0193
R² = 0.147
0.0
0.5
1.0
1.5
2.0
2.5
0
50
100
150
200
250
300
350
400
Rat
io o
f CaO
/(SiO
2+
Al 2O
3)
Hea
t Tra
nsfe
rred
(J/g
)
20% 40%
Higher SiO2 + Al2O3Higher CaO

19
measurements for 20% fly ash replacement were able to exceed the OPC mixtures by at least 30%. Testing of IC4 at 90 days with a 40% replacement showed it had the lowest resistivity of all the fly ash but exceeded OPC by 68%. When investigating the correlation of the oxide ratio to 3-day resistivity testing, there did not seem to be a strong correlation at the 20% or 40% replacement levels. Yet 90-day testing showed a significant correlation for fly ash with lower calcium content to have higher resistivity at the 40% replacement level. While this could be caused by a refinement in the pore structure of the fly ash with lower amounts of calcium, it is also possible that the change in the chemical composition of the fly ash also changes the pore solution chemistry and so this would, in turn, impact the resistivity.
Isothermal calorimetry demonstrated that the majority of fly ash tested did not exceed the amount of heat transferred by OPC at 20% or 40% replacement levels. Most only came within 20% of OPC in terms of heat transferred. There were four Class C fly ash mixtures and two Class F mixtures that exceeded the heat transfer of OPC. These results did not directly correlate to the oxide ratio and an exact answer could be sought through future testing currently underway.
Conclusions as to what determines the performance of concrete mixtures discussed herein with regards to the chemical content or particle size distribution could not be conclusively determined and is beyond the scope of this document.
20
REFERENCES AASHTO T 358. 2019. Standard Method of Test for Surface Resistivity Indication of Concrete’s Ability
to Resist Chloride Ion Penetration. Washington, DC: AASHTO.
American Coal Ash Association. 2017. 2017 Coal Combustion Product (CCP) Production & Use Survey Report. [cited 2019 April, 2019]; Available from: https://acaa-usa.org/wp-content/uploads/coal-combustion-products-use/2017-Survey-Results.pdf.
ASTM C33. 2018. Standard Specification for Concrete Aggregates. West Conshohocken, PA: ASTM International.
ASTM C39. 2018. Standard Test Method for Compressive Strength of Cylindrical Concrete Specimens. West Conshohocken, PA: ASTM International.
ASTM C138. 2017. Standard Test Method for Density (Unit Weight), Yield, and Air Content (Gravimetric) of Concrete. West Conshohocken, PA: ASTM International.
ASTM C143. 2015. Standard Test Method for Slump of Hydraulic-Cement Concrete. West Conshohocken, PA: ASTM International.
ASTM C150. 2019. Standard Specification for Portland Cement. West Conshohocken, PA: ASTM International.
ASTM C231. 2017. Standard Test Method for Air Content of Freshly Mixed Concrete by the Pressure Method. West Conshohocken, PA: ASTM International.
ASTM C192. 2018. Standard Practice for Making and Curing Concrete Test Specimens in the Laboratory. West Conshohocken, PA: ASTM International.
ASTM C618. 2019. Standard Specification for Coal Fly Ash and Raw or Calcined Natural Pozzolan for Use in Concrete. West Conshohocken, PA: ASTM International.
ASTM C1702. 2017. Standard Test Method for Measurement of Heat of Hydration of Hydraulic Cementitious Materials Using Isothermal Conduction Calorimetry. West Conshohocken, PA: ASTM International.
Baral, Aniruddha, Jeffery R. Roesler, and M. Tyler Ley. 2021. High-volume Fly Ash Concrete for Pavements Findings: Volume 1. Rantoul, IL: Illinois Center for Transportation. https://doi.org/10.36501/0197-9191/21-030
Baral, Aniruddha, Jeffery R. Roesler, and Junryu Fu. 2021. Early Age Properties of High-volume Fly Ash Concrete Mixes for Pavement: Volume 2. Rantoul, IL: Illinois Center for Transportation. https://doi.org/10.36501/0197-9191/21-031
Khanzadeh Moradllo, Mehdi, Qinang Hu, and M. Tyler Ley. 2017. “Using X-Ray Imaging to Investigate In-Situ Ion Diffusion in Cementitious Materials.” Construction and Building Materials, 136: 88–98. https://doi.org/10.1016/j.conbuildmat.2017.01.038
Kim, Taehwan, Jeffrey M. Davis, M. Tyler Ley, Shinhyu Kang, and Pouya Amrollahib. 2018. “Fly Ash Particle Characterization for Predicting Concrete Compressive Strength.” Construction and Building Materials, 165: 560–571. https://doi.org/10.1016/j.conbuildmat.2018.01.059

21
Hemalatha, T., and Ananth Ramaswamy. 2017. “A Review on Fly Ash Characteristics: Towards Promoting High Volume Utilization in Developing Sustainable Concrete.” Journal of Cleaner Production, 147: 546–559. https://doi.org/10.1016/j.jclepro.2017.01.114