Embed Size (px)
Citation preview

CONCRETE CYLINDRICAL SHELL ROOFS
PRESTRESSED WITHIN THE SHELL SURFACE
by A.G. Park '"
Supervised by J.C. Scrivener
Thes presented by A.G. Park for the
degree Doctor of Philosophy
CIVIL ENGINEERING
JUNE 1974
Department of Civil Engineering University of Christchurch New Zealand
No. 74-6
~rH
p.6
p.9
p.lO
p.48
p.92
p.92
p.102
p.103
p.123
p.124
p.127
p.129
p.145
Fig. 2.1(c):
Fig. 2.2:
Line 9:
Line 19:
Line 14:
Line 16:
Table of Cable
replace and replace
Table of Cable
replace
Fig. 5.17:
Line 19:
Line 23:
Line 3:
Line 6:
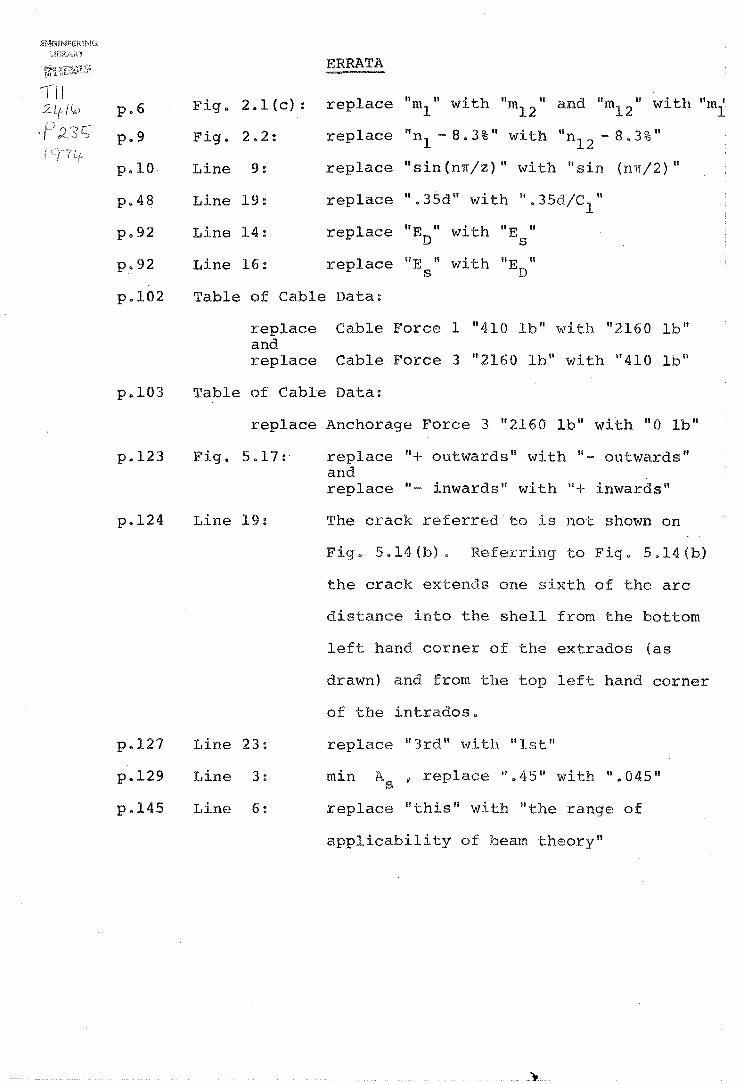
ERRATA
replace 11m II with "m II and "m II with "m ' 1 12 12 1
replace "nl - 8.3%" with "n12
-8.3%"
replace "sin(mrjz)" with II (ll1Tj2) II
replace II .35d ll with 1/ .35djCl "
replace liE " with liE 11
.... D s
replace liE " with liE Ii
s D
Data:
Cable Force 1 11410 lb" with "2160 lb ll
Cable Force 3 "2160 Ib" with "410 Ib"
Data:
Anchorage Force 3 "2160 Ibn with "0 Ibn
replace "+ outwards ll with 11- outwards" and replace" inwards" with "+ inwards"
The crack referred to is not shown on
Fig 5.l4(b). Referring to Fig. 5.14(b)
the crack extends one sixth of the arc
distance into the shell from the bottom
left hand corner of the extrados (as
drawn) and from top hand corner
of the intrados.
replace "3rd" with "1st"
min , replace ".45" with ".045"
replace " 5" with "the range of
applicability of beam theory"

i
ABSTRACT
Cylindrical shells, constructed of precast concrete
elements prestressed together by means of cables within the
curved surface, are shown to have satisfactory and predictable
behaviour under static load. By careful choice of prestressing
layout, cracking can be delayed until a considerable surface
load has been applied. An existing elastic analysis method
for effects of prestress, based on the D.K.J:. equation, is
adapted to improve its accuracy and efficiency. A method is
given for calculating the effect of the stiffness of the
traverse on the distribution of anchorage force to the shell.
This can be particularly important when the anchorage is
placed close to the shell edge.
Circular cylindrical shell roof models without edge
beams and prestressed within the curved surface with both
straight and draped cables were tested to failure. Four of
the five shells were constructed from precast elements. Strain
and deflection measurements were obtained for all shells and
confirmed the reliability of the analysis method.
A flexural beam type ultimate load analysis is devised
which accurately predicts the ultimate loads of a range of
shells including the model shells tested. This analysis is
developed into a design technique.
Some approximate methods are developed for the working
load analysis of cylindrical shells prestressed within the
shell surface.

ii
ACKNOWLEDGEMENTS
I wish to make grateful acknowledgement for help
received during the course of this project and extend my
thanks to the following people.
Professor H.J. Hopkins, Head of the Civil Engineering
Department, under whose overall guidance this study was made~
Dr. J.C. Scrivener, supervisor for the study, for his
encouragement and constructive guidance throughout this project,
and for his many helpful suggestions during the preparation of
this thesis;
The Technical Staff of 1he Civil Engineering Department
for their assistance in the ~xperimenta1 programme, in
particular Messrs. J.S. Sheard and J.G.C. Van Dyk.
I wish to gratefully acknowledge financial aid from
the New Zealand Portland Cement Association in the form of
the 1970 N.Z.P.C.A. Scho1arshipi and to the University Grants
Committee for experimental equipment and materials under
Research Grant 68/271.
Finally, I wish to thank my wife, Diane, for her const~nt
encouragement and help.

TABLE OF CONTENTS
Abstract
Acknowledgements
Table of Contents
List of Figures
List of Tables
Notation
1. INTRODUCTION AND OBJECTIVES
1.1 Introduction
1.2 Historical Background
1.3 Objects of This Research
2. ELASTIC ANALYSIS
2.1 Range of Applicability of D.K.J. Equation
2.2 Surface Loading
2.2.1 Dead load
2.2.2 Radial load
2.3 Prestressing in Shell Surface
2.3.1 Anchorage force - 1st method
2.3.2 Anchorage force - 2nd method
2.3.3 Line loads - 1st method
2.3.4 Line loads - 2nd method
2.3.5 Convergence of generator line load technique
2.3.6 Convergence of anchorage loads
2.3.7 Convergence of line loads
2;3.8 Line loads due to a parabolic cable in a circular curve
2.4 Edge Beams
2.5 Effect of Traverse on the Distribution of Anchorage Forces
Page
i
ii
iii
viii
xi
xii
1
1
2
3
5
7
8
10
10
10.
11
11
12
12
14
18
19
21
26
27

2.5.1 Assumptions
2.5.2 Theory
2.5.3 Determination of e
2.5.4 Summary of method
2.5.5 Simplification
2.5.6 Effect of change in e 2.5.7 Comparison with experiment
3. ULTIMATE LOAD BEHAVIOUR
3.1 Beam Type Failure
3.1.1 Assumptions
3.1.2 Flexural failure modes
3.1.3 Analysis of "under-reinforced II shell
3.1.4 Accurate determination of f su
3.1.5 Limitation of maximum steel content to prevent brittle fracture
3.1.6 Limitation of minimum steel content to prevent steel fracture
3.1.7 Effects of non-prestress steel
3~1.8 Discussion
3.2 Yield Line Mechanism
3.3 Shear Failure
3.4 Buckling
4. DESIGN, CONSTRUCTION AND TESTING OF MODEL SHELLS
4.1 Choice of Model Dimensions
4.2 Design Loading and Stresses
4.3 Choice of Shell Element
4 • 4 Formwork
4.4.1 Shells 1, 2 and 3
4.4.2 Shells 4 and 5
4.5 Reinforcing Steel
4.5.1 1st Shell
4.5.2 Other shell meshes
iv
27
27
33
33
34
34
35
38
38
41
41
42
47
47
49
50
51
53
55
58
59
61
62
62
63
63
64
66
66
67

4.5.3 Traverse meshes
4.6 Prestressing Steel
4.7 Concrete Mix and Casting
4.7.1 Concrete Mix
4.7.2 Casting
4.7.3 Curing and stripping
4.7.4 Variation of thickness
4.7.5 Test specimens
4.8 Prestressing System
4.8.1 Solid bearing block
4.8.2 Adjustable bearing block
4.8.3 Load cells
4.8.4 Jack
4.8.5 Anchorages
4.9 Joining, Prestressing and Grouting
4.9.1 Joining
4.9.2 Prestressing
4.9.3 Grouting
4.10 Strain Measurement
4.10.1 Strain gauges
4.10.2 Strain recording
4.11 Deflection Measurement
4.12 Reaction Frame
4.13 Loading Technique
4.14 Testing Procedure
4.15 Evaluation of Young's M.odulus
4.16 Analysis of Strain Data
'" 4.16.1 Prestressing
4.16.2 Surface loading
4.16.3 Symmetry and reliability
4.17 Analysis of Deflection Data
4.17.1 Prestressing
4.17.2 Surface loading
67
67
69
69
70
71
72
73 73
73
76
76
78
79
79
80
81
81
82
82
84
85
86
87
90
90
94
94
94
95
96
97
97

4.17.3 Symmetry and reliability
5. AND THEORETICAL RESULTS
5.1 Elastic Behaviour
5.1.1 Prestressing
5.1.2 Surface loading
5.2 Post Elastic Behaviour
5.2.1
5.2.2
5.2.3
5.2.4
5.2.5
5.2.6
5.2.7
5.2.8
Change in neutral axis position
Cracking patterns
Recoverability from overloads
Deflections I
Experimental failure mechanisms
o Comparisons between $k = 30 shells
Comparisons between 8'-0" shells
Comparison of shells with and without edge beams
5.3 Ultimate Load Behaviour
5.3.1 1st shell
5.3.2 Shells 2 and 3
5.3.3 4th shell
5.3.4 5th shell
6. APPROXIMATE METHODS FOR THE ELASTIC DESIGN OF PRESTRESSED CYLINDRICAL SHELLS
6.1 Dead and Live Loads
6.2 Anchorage Load
6.2.1 Nl at midspan
6.2.2 Nl near traverse
6.2.3 M2 due to anchorage load
6.3 Draped Cable Loads
6.3.1 Nl due to cable drape
6.3.2 M? due to cable drape ""
6.4 Discussion
Vl
97
98
98
98
113
115
115
115
117
117
124
125
126
127
130
130
132
133
134
136
137
138
138
145
148
155
155
157
159

vii
7. CONCLUSIONS 161
7.1 Model Tests 161
7.2 Elastic Behaviour 162
7.2.1 Prestressing 162
7.2.2 Surface loading 163
7.2.3 Simplification 164
7.2.4 General 164
7.3 Post Elastic Behaviour 165
7.4 Ultimate Load Behaviour 166
7.5 Major Cpnclusions 167
REFERENCES 168
APPENDIX A. "D.K.J." COMPUTER PROGRAM Al
APPENDIX B MATERIAL PROPERTY TESTS Bl

VJ.J.J.
LIST OF FIGURES
Page
2.1 positive shell axes, displacements, actions 6 and surface loads
2.2 Accuracy of D.K.J. equation 9
2.3 Effect of repeated application of sigma factor 9
2.4 Effect of Fejer arithmetic mean and convergence factor 17
2.5 Comparison of triangular and rectangular pulse expansions 17
2.6 Prestress force distribution using Rish's method 20
2.7 Comparison of line load expansions 20
2.8 Curvilinear shell coordinate system 20
2.9 Cartesian shell coordinate system 20
2.10 Forces acting on an elemental length of cable 24
2.11 positive edge beam actions and displacements 24
2.12 Distribution of actions for apoint load on a semi-infinite beam 30
2.13 Variation of .~ and ~ with Sx 30
2.14 Comparison of experimental and theoretical Nl distributions near traverse 32
2.15 Comparison of results for actions most affected by the traverse stiffness 36
3.1 Lever arms for ultimate load analysis 40 I
3.2 Concrete compression block notation 40
3.3 Variation of (2~ - sin 2 ~LJ with ~ 45
3.4 Variation of L/R and ~k for zero midspan crown deflection under surface load 45
4.1 Assembled shell mould used for shells 1, 2 and 3 65
4.2 Assembled shell mould used for shells 4 and 5 65
4.3 1st shell reinforcing mesh 68
4.4 Typical shell cross-section 68
4.5 Dimensions of prestressing system 74

4.6
4.7
4.8
4.9
4.10
5.1 5.7
5.8
Prestressing system, 2 tor. load cell, and roller support
4th shell prior to testing showing data logger and strain gauge layout
Reaction frame used for shells 1, 2 and
Reaction frame used for shells 4 and 5
Loading sequence for shells
3
- Prestressing experimental and theoretical actions and displacements
- Surface loading experimental and theoretical
l.X
75
75
88
88
91
99 -100
5.12 actions and displacements 106-111
5.13
5.14
Midspan variation of longitudinal strain with depth below crown
Crack patterns of failed shells
116
118-119
5.15 Typical surface load versus deflection curve
5.16 Radial deflection across transverse centr~ line
5.17 Horizontal deflections
5.18 Failed 5th shell
5.19 Comparison of deflections for shells with and without edge beams
5.20 Comparison of theoretical moment resistance and experimental failure moment
5.21 Failure mechanism of 5th shell in centre segment
6.1 Accuracy of beam theory results
6.2 Nl at midspan due to unit dead load
121
122
123
123
128
131
135
139
140
6.3 - Midspan Nl due to anchorage load 6.5
142-143
6.6
6.7
6.8
6.9
Variation of midspan Nl with change in R/t
Va.riation of M at· crown for change in anchorage eccentricity
M2 ratio envelope
Variation of crown M2 ~t midspan for change in anchorage eccentricity and L/R ratio
6.10 Midspan M2 ratio envelopes
6.11 L
146
147
147
151
152
Variation of crown M2 at 78 from traverse for change in anchorage eccentricity and L/R ratio 153
6.12 M2 ratio envelopes at L/8 from traverse 154
6.13 Variation in M2 distribution for change in R/t 156
6.14 Comparison of results from "D.K.J." program and Na~ser's technique 156

A.l comparison of "D.K.J." computer program with results given by Billington
A.2 Comparison of "D.K.J." computer program with results given by Gibson
B.l Load-strain curve for prestressing steel
B.2 Load-strain curve for cold drawn wire
B.3 Load-strain curve for spot welded wire
x
Page
results A2
results A3
B2
B3
B3

4.1
4.2
4.3
4.4
5.1
6.1
6.2
B.l
B.2
B.3
B.4
B.5
LIST OF TABLES
Dimensions of shells tested
Micro-concrete mix proportions
Typical shell thickness measurements
Typical repeatability of strain measurements
Data used in calculating the theoretical moment resistance of the shells
Influence of traverse on maximum Nl values
Variation of maximum M2 values along shell due to anchorage
Mortar mix code
Mortar compression tests on 4" x 2" cylinders
Young's modulus and Poisson's ratio values from strain gauged 4" x 2" cylinders
Tensile tests on 4" x 2" cylinders
Beam flexure test results
xi
60
70
72
93
129
144
149
B6
B7
B8
B8
B9

NOTATION
Each notation is defined where it first appears in the
text. For convenience of reference the more important are
listed below:
a constant defining parabola
a depth of compression block
a' depth to centroid of compression block
nth Fourier coefficient in the x direction
a. nth Fourier coefficient for the ith strip n~
am mthFourier coefficient in the y direction
A,B,C,D
b
b
c
c
c'
c
d
d
d
d'
e
constants of integration for beam on elastic foundation theory i
area of concrete in compression
prestressed steel area
non prestressed steel area
concrete area in compression required to balance tendon force Tt
breadth of edge beam
effective width of traverse
distance 0f a point force from the end of a semi-infinite beam
parameter describing parabolic cable
coefficient for rectangular stress block depth
concrete compressive force I
anchorage eccentricity as an arc distance from the crown
depth to centroid of prestressing steel from the top of the crown
thickness of traverse
vertical lever arm
slanted lever arm
anchorage eccentricity + cable drape, as an arc distance from the crown
xii

f
fc
f I
C
f' S
concrete yield strain
steel strain due to surface loading at ultimate moment
steel strain due to prestressing
steel strain at ultimate moment
nominal steel yield strain
Young's modulus
drape of prestressing cable as an arc length
allowable average concrete compressive stress
concrete cylinder strength
ultimate prestress steel stress
steel stress at ultimate moment
nominal steel yield stress
concrete tensile strength
line loads/unit length in curvilinear coordinates
xiii
F F' F' x' y' z line loads/unit length in Cartesian coordinates
g parameter describing parabolic cabl~
gi(x) equation of ith strip
h parameter describing parabolic cable
I moment of inertia of shell cross-section
I z moment of inertia of traverse
k reaction/unit length, for unit deflection in beam on elastic foundation theory
k positive integer
kd neutral axis depth from top of the crown
L shell span
m positive integer
M general expression for a moment
ml longitudinal moment/unit length
m12 twisting moment/unit length
m2 transverse moment/unit length

M o
M' o
Mil o
n
N
Q
r
R
R. ].
R o
t
t
T
xiv
corrective moment, which with point force Q is applied to the end of a semi-infinite beam °to remove redundant forces which occur when it is "cut" from an infinite beam
redundant moment on the end of a semi-infinite beam, when it is "cut" from an infinite beam
moment due to corrective actions :t.10
ultimate moment
positive integer
principal normal
longitudinal normal force/unit length
shear force/unit length
transverse force/unit length
prestressing force
prestressing anchorage force
dimensionless constant used by Boland
and Q o
point force of equal magnitude to redundant shear force Vi
o
positive constant
shell reactions/unit length
radius of shell middle surface
radius of shell intrados
radius of shell extrados
shell thickness
parameter describing parabola
unit tangent
tendon force
u displacement in x direction
v displacement in y direction
V general expression for shear force
V' redundant shear force o
V" o
shear force due to corrective actions Mo
w radial displacement
and Q o
W reaction/unit length in beam on elastic foundation theory

x,y,z
x,y' ,z'
X,Y,Z
a,S,y
is
e,~,<p,1!!
K
]l
shell axes - Cartesian coordinates
shell axes - curvilinear coordinates
surface loads/unit length in x,y,z directions
positive constant?
strain
variables in beam on elastic foundation theory
curvature
coefficient of friction
Poission's ratio
xv
coefficients used in modifying Fourier coefficients
·half included angle

CHAPTER ONE
INTRODUCTION AND OBJECTIVES
1.1 INTRODUCTION
Prestressing offers two main advantages to the designer
of cylindrical shells.
1.
First, the large edge beams traditionally used on cylindr
ical shells may be reduced in size, or, if the shell is
prestressed within the curved shell section itself, eliminated
completely. This removes the main architectural objection to
cylindrical shells. However, by reducing or eliminating the
edge beams the inherent stiffness of the shell is reduced. This
may lead to excessive cracking, although with careful choice of
prestress cable layout, flexural cracking can be avoided until
a reasonable load has been applied. For many cases it is
possible to retard crack appearance until after design working
load, thus effectively waterproofing the shell and eliminating
the need for any external membrane. A further advantage is
that while the section is uncracked, the whole cross-section is
effective in resisting deflections.
Secondly, shells can be made of precast elements and joined
by means of the prestressing cables. With high labour costs, as
in New Zealand, precasting offers considerable advantages that
make the use of cylindrical shells a viable economic proposition.
Precast elements could be made in a repeatable mould in a
factory, thus reducing the problems associated with the placing
and curing of a thin layer of in situ concrete on a relatively

large slope. By the use of top moulds, shells with larger
included angles could be constructed more easily than with
in situ pouring of shells. Precasting should ensure faster
erection on site, thus making construction progress less
dependent on weather conditions. Also a reduced amount of
skilled site labour would be required.
1.2 STORICAL BACKGROUND
The elastic analysis of circular cylindrical shells,
prestressed within the shell surface, has been solved.
de Litterl in 1963 and Berndt2 in 1966 described a method
for the analysis of circular cylindrical shells with straight
prestressing cables and in 1969 Bryant and scrivener 3 gave a
different method which can be used for both straight and
draped cables. Both these techniques use a Fourier type
analysis and require the summing of approximately 10 Fourier
terms to obtain reliable results. The accuracy of results
from these techniques was confirmed by the authors with tests
on elastic models.
2
The series of tests carried out by Bryant6 ,52 on an
aluminium shell (L = 39.12 in., R = 19.94 in., t = .1309 in.,
¢k = .526 rad., no edge beams) appear to be the roost compre
hensive tests that have been done on an elastic prestressed
cylindrical shell model. On his shell he tested five straight
cable positions with anchorage eccentricity/half arc length
of 0.048, 0.337, 0.667, 0.833, 0.972. Three draped parabolic
cable layouts were also tested, with anchorage eccentricity/
half arc length of 0.500, 0.667, 0.833. At midspan for these
three tests the cable was at a distance around the arc of
0.972 times the half arc length. All eight cable layouts

were symmetrical. Bryant obtained accurate and repeatable
experimental results for his series of tests. He found that
his theory accurately predicted the longitudinal stresses
away from the traverse and also the frequent changes in sign
of the transverse moments. Transverse stresses away from and
shear stresses close to the traverse were predicted to within
10%. At the crown, vertical deflections were given to within
3% of experimental results, but near the edges the agreement
was between 5% and 25%.
Up to the present time, very few tests have been carried
out on concrete cylindrical shells, prestressed within the
4 shell surface. In 1961 Bouma et al reported a series of
tests on eleven intermediate length cylindrical shells, one
of which was prestressed both in the edge beams and in the
3
shell surface. They found that while prestressing can improve
working load behaviour, consideration of the effect of over-
loads must be made, particularly with regard to the shell
membrane reinforcement, or premature failure may occur.
Scrivener and Megget 5 in 1967 carried out what appears to be
the only reported test on a single cylindrical shell, pre-
stressed within the curved surface and not having edge beams.
This shell (L/R = 2, $k = 300) had ungrouted straight cables,
which were designed to balance the tensile midspan edge
stresses due to dead load. Scrivener and Megget found that
despite the lack of edge beams, the shell had acceptable
deflection and strain levels at normal working loads. The
shell was found to recover to near its original state on
removal of overloads of up to twice the working load.
1.3 OBJECTS OF THIS RESEARCH
The object of the experimental part of this research
4
was to carry out a systematic series of model tests to obtain
reliable data on the behaviour of concrete cylindrical shell
roofs, without edge beams, prestressed within the shell
surface. Results from these tests were to be used:
i) To determine whether shells can be designed by an
elastic analysis to behave satisfactorily up to
design working load.
ii) To ascertain the effect which cracking of the
concrete and elongation of the steel has on the
behaviour of the shells.
iii) To study the ultimate load behaviour and failure
mechanism, and how these are altered with changes
in shell p~rameters.
The second part of the research was to develop an exist-
6 ing computer program written by Bryant , so that circular
cylindrical shells, with or without edge beams, could be
analysed elastically for surface loading and for prestress
loading - prestress loading to be either from straight or
draped cables in either the edge beam or shell surface.
The final object of the research was to develop a simple
method for the analysis of cylindrical shells, prestressed
within the shell surface, such as could be used in a design
office for preliminary analysis. For satisfactory design,
the behaviour of the shell at design working load must be able
to be determined, and also it must be known that satisfactory
ultimate load behaviour will occur.

5
CHAPTER TWO
ELASTIC ANALYSIS
The elastic shell equation used throughout this thesis
1 k · 7 . is the commonly used Donne -Karman-Jen lns equatlon:
l2(1-v
where
and E = Young's modulus
R = shell radius
t = shell thickness
v = Poisson's ratio
x,y,z = Coordinate directions, defined in Figure 2.l(a)
X,Y,Z = Surface loads in x,y,z directions
u,v,w = Displacements in x,y,z directions
Shell forces and moments are also defined in Figure 2.1
for future reference.
The D.K.J. equation is derived using Navier's hypothesis,
small deflection theory and assuming linear - elastic thin
shell action. In addition the effects of radial shear forces
on the shell deflection are ignored.
If the curved ends are assumed to be supported on kni
edge supports, with complete rigidity in their own plane,
v = w = 0, and complete flexibility in planes perpendicular
to their middle surface, ml = n l = 0, the equation can be
solved by means of a Levy type solution. The formulation
and method of solution of the equation can be found in many

(a) Shell coordinate axes and displacements
dx
~2
n12 ...,.....:.:::..------dy
(b) Forces ~
(c) Moments
6n1 nl + ---+- dx Ox
FIG. 2.1 POSITIVE SHELL AXES, DISPLACEMENTS, ACTIONS AND SURFACE LOADS.

7
8 9 10 11 8 standard texts " , • McNamee gives a particularly
clear presentation as does Billington9 who shows the deriva-
tion of the D.K.J. equation from general shell theory.
Elastic theoretical results used in this thesis were
obtained by use of a computer program "D.K.J." described
in Appendix A, which is based on the D. K .. J. equation. An
indication that the accuracy of the D.K.J. computer program
is good is given in Figures A.l and A.2 where results from
the "D.K.J." computer program are compared with results
, b 'II' 9 d G'b 22 A b ' f d '. f glven y B1 1ngton an 1 son. r1e escr1pt1on 0
the loading formulations used is given in sections 2.2,
2.3.2, 2.3.4, and 2.4.
2.1 RANGE OF APPLICABILITY OF D.K.J.
Due to the dropping of terms during the formulation
of the D.K.J. equation, the range of applicability of the
equation is limited. There is, however, some confusion
between different texts as to this limit. Billington9
suggests that it is reasonable to use the D.K.J. equation
for short (L/R <}) and intermediate (~ < L/R < 2~) shells,
but that the more rigorous methods of Holand12 or A.S.C.El~ 11 should be used for larger shells. Hamaswamy recommends
that the D.K.J. equation be used for short (L/R~ 1. 6)
shells and that for intermediate (1.6 ~ L/R.;S TI) length
shells an "exact" theory (Holand, Flugge, Dischinger)
should be used.
12 Roland ,and most other authorities, consider the
Flugge theory to be the most accurate yet tractable shell
theory_ He carried out an extensive study of a number of
shell equations and presents a graph (ref.12, pp54) of the
percentage differences in results from D.K.J. theory as

8
compared with Flugge theory. Differerices from the Flugge
theory are given for the first Fourier term (the second
coefficient showing similar trends) and are plotted against
a dimensionless constant Q,
nTI a =
n = 1,2,3 ...
and hence Q is proportional to J As Q is reduced the percentage differences from the
Flugge theory increase as does the rate of increase in
differences. The minimum value of Q for which differences
are given by Holand is 2.5. These differences are given
on Figure 2.2. Figure 2.2 also shows the range of L/R
and R/t for which Q is greater than 2.5. In this range
the differences between results using D.K.J. theory and
Flugge theory are less than the differences given on Figure
2.2 for Q = 2.5, and should be acceptable for design
purposes.
2.2 SURFACE LOADING
In order that the governing differential equation may
be solved, loading must be expressed in the form:
x = EX cos yy sin 0'. X ) 0 )
y = EY sin yy cos a.x ) (2.1) 0 }
Z = EZo cos yy cos ax }
a. = nTI L , y = a constant
Two particular loading cases are considered below.

L R
10
5
a< 2·5
Q = 2.5, 0/0 difference in D.J.K.
compared with Flugge.
Q> 2.5, % differencE'S
less than those
for Q::: 2·5.
Q 0<
n1 - 8·3°/0
n1 J m2 - 5 %
m ' v - - 2.5 % , A
9
o~-------------~~---------------~--------------~ 50 100 150 200'
Rit
FIG. 2.2 ACCURACY OF D.K.J. EQUATION.
0·5 L
Classical Fourier terms Classical x 6 Classical x 62
Funct ion expanded
0·4 L 0·3 L 0·2 L 0·1 L
FIG. 2.3 EFFECT OF REPEATED APPLICATION OF SIGMA FACTOR.
0·0

10
2.2.1 Load
At any position on the shell cross-section, distance
y around the arc from the crown, the dead load force P
per unit area can be resolved into two components Y and
Z where:
Y = P sin <1>, Z == P cos ¢ and ¢:= Y/R
This is the same form as equations (2.1) if ¢ == Y/R := YY .
In order that uniform dead load is obtained along the shell
Y, Z must be expressed in the form (4P/nn) sin (nn/z) . Hence
for dead load:
x := 0.0
Y 4p
L .1 . nn sin Y... nnx
== - ns~nT cos r;-n R
Z 4P L 1 . nn Y... nnx
== - ns~nT cos cos r;-n R
2.2.2 Radial Load
At all points on the shell for a uniform radial
pressure P , X := Y == 0 and Z == P. In a similar manner
to dead load:
Z == 4p L1. sin nn cos nnx n n T r;-
2.3 PRESTRESSING IN SHELL SURFACE
cos YY _ 1
A number of methods, some approximate, have been
proposed for the analysis of cylindrical shells prestressed
within the shell surface. Approximate methods where the
line loads (forces from friction and cable drape) have been
replaced by equivalent loads along the shell edge have been
d 1 4 14 h 15 d' 16 use by Bouma et a ,Haas , De ousse an B~eger While
these approximate methods may give satisfactory results under

11
favourable circumstances, their overall accuracy is
doubtful and the use of a more accurate method is preferable.
For the more accurate methods, described in the following
sections, there are two fundamentally different techniques
for representing both the anchorage force and the line loads.
2.3.1 Anchorage Force - 1st Method
Berndt2 and de sitterl solve the problem of the
. anchorage force on the end of the shell in two steps.
In the first stage the shell is considered as being
simply supported along the straight edges and the anchorage
force is expanded along the curved end as a Fourier series
P(y) :
P(y) == 2p
-- cos a d cos a y R¢K n n
where a n
n == 0,1,2 ...
d == anchorage eccentricity
The boundary conditions are:
i) Curved ends
w=v=m =0 1 n l = P(y)
ii) Straight edges
m = n == 0 2 2
The second stage consists of removing the unwanted
actions, n12 and r 2 ' along the straight edges by a
complementary function solution with the shell simply
supported on the curved ends.
2.3.2 Anchorage Force - 2nd Method
The second technique, developed by Bryant and
Scrivener3 , assumes that the structure is simply supported

12
at the curved ends and that the anchorage force is introduced
to the shell as a shear force over a short longitudinal
length of the shell adjacent to the traverse. The analysis
technique is a particular case of that used for draped cables
described in Section 2.3.4.
2.3.3 Line Loads - 1st Method
2 The method used by Berndt and also investigated
, 6 by Bryant is to substitute the line loads by statically
equivalent surface loads which are then developed as a
double Fourier series:
sin Ct x
cos ex x
sin myy
cos myy
n,rn are odd integers
Berndt reports that he found good agreement between model
test results and results using his method of analysis. '
However, Bryant found that the above method did not give
satisfactory convergence for some shell actions and so he
developed the following method.
2.3.4 Line Loads - 2nd Method
The method described in this section is largely a
summary of a paper by Bryant and scrivener3 .
First the shell is divided up into a number of transverse
strips of width L/ 2m , m being an integer, throughout which
the line load intensities are considered constant. A number
of equally spaced shell generators are then considered along
the cable profile and the line loads divided between them.
For each transverse strip the line load is divided between
the two closest generators in the inverse ratio of the
distances the cable is from the two generators. Along the

13
generators the line load components F , F ,Fz are replaced x y
by the actions The anchorage load is consid-
ered to be a shear load (n12 ) spread into the shell along
two generators adjacent to the anchorage and treated similarly
to the line loads.
These actions, n12 , n 2 , r 2 , are then expanded as a
Fourier series along each generator in order that a Levy
type solution may be applied. If gi (x) is the equation
along a generator for a line load component (value f (x.) ) ~
of the ith transverse strip.
n1TX
1 n1TX.
where sin n1T 1 a ni = - 4m cos n L n = 1, 3, 5 .•.
and x. ~
= distance of strip i from the centreline.
Then from the sum of all strips
m 8 cos n1TX f(x) = E gi (x) = - E a sin i';"l 1T n n
m f (xi) where a = a ni n == 1,3,5
n E i=l
For each Fourier term the analysis is carried out as
follows:
i) The shell is considered as a complete tube and
solved for each pair of symmetrical (one from each
side of the centreline) generators. This is done by
assuming that the loaded generators divide the tube
into two shells and hence the generator loads can be
considered as edge loads at the junctions of the
shells. By a complementary function solution and
considering the carryover from one shell to the
other, the actions and displacements can be found at

required points anywhere on the tube.
ii) All the complete tube solutions are then added
together and the required shell "cut" from the
tube, unwanted edge sections being removed by an
ordinary complementary function solution.
Bryant and scrivener3 have compared results obtained
14
by the above generator line-load method with experimental
results obtained for a number of cable layouts on a prestressed
aluminium model shell. Good correlation was obtained.
2.3.5 Convergence of Generator Line Load Technique
From the results of trial runs, Bryant and
Scrivener found that if 10 Fourier terms (n==1,3 ••• 19) were
summed for an anchorage load spread 0.05L into the shell
along two closely spaced gen~rators, a reasonable approxi
mation of the anchorage load was obtained. For draped cables
they found that a generator spacing of R<Pk/6, m == 20 transverse
strips and 6 Fourier terms were required to give the same order
of accuracy as that obtained for the anchorage load.
An attempt, as described below, was made by the present
author to improve the convergence of the solution by using
different methods for modifying the classical Fourier coe
icients. However it was found that little improvement in
the convergence could be obtained from that using the param
eters and method suggested by Bryant and Scrivener. The
greatest variation between methods occurred in the vicinity
of the cable near the traverse. Away from this area there
was negligible difference between many of the methods. For
the anchorage force a triangular shear pulse was considered
in addition to the rectangular shear pulse used by Bryant

15
and Scrivener. Expressions for the rectangular and triangular
pulses are:
Rf!'ctangular pulse' I trav..rs~ .. ,
• a I a
~-~J."'" tE--- L 12 -----'lllOt
-Llr~ ~
Triangular pUI se I
t;~ ______________ ~;;,_a~~,~,s. ILl2
-Llr~
f(x)
n=l, 3 •••
and for anchorage force p
f(x i ) == L/R
8 r f (x. ) 1 f (x) = 1 cos n1T (1 ) sl'n n1T 2 2" - - 2r
(n1T) r
n = 1, 3 •••
Three methods of modifying the Fourier coefficients were
tried. All of these methods distort the original function and
hence a balance must be reached between this distortion and
the reduction in Gibbs oscillations. The methods used were:
Sigma Factor 17 This method is described by Lanczos and
involves multiplying the Fourier coefficients by a factor ok'
sin klT/n ° = . k klT/n
where n == the number of Fourier terms to be considered
k = kth Fourier term.
The effect of multiplying by the sigma factors is
essentially to replace a function f(x) by f(x) where
f (x) = 2n~ f,~f (x + t) dt
n

This new function smooths the original function by taking
at each point the arithmetic mean between the limits ±~/n.
Multiplication by the sigma factors can be repeated on the
new function, i.e. if the sigma factors were to be applied
16
twice, the classical Fourier coefficients would be multiplied
by At each step the convergence becomes stronger, but
the operation of local smoothing distorts the function and
stronger convergence is obtained, not to the original function
but to a modified function. The reduction in Gibbs oscilla-
tions and distortion of the function is shown in Figure 2.3
for a rectangular anchorage block, where it can be seen that
for cr~ the slope of the graph is less than crk • As a steep
slope is required in order that the line load is applied as
near the end of the shell as possible, any use of the sigma
factor beyond crk is not advisable.
Fejer Arithmetic Mean 17 Again described by Lanczos ,
this method involves taking the arithmetic mean of the partial
sums of the Fourier coefficients up to the nth term.
If S = f o 0
cr n =
Lim. cr = f (x) n
S 'i' • . • "' 1 n-n
This is equivalent to multiplying each Fourier term by Pk(n)
where Pk(n) = (1 - ~)
The summation converges to f(x) from below as shown in
Figure 2.4, for a rectangular anchorage pulse. Figure 2.4
also shows that the Gibbs oscillations can sometimes be
completely eliminated, but that the slope at the discontinuity
is less than that for the crk factor (Figure 2.3).

- - - - Classical Fourier terms _-- F ejer ari t hmet ic mean ---. - Convergence factor
Function expanded
---0·5 L 0·4 0·3 0·2 0·1
FIG.2.4 EFFECT OF FEJER ARITHMETIC MEAN AND CONVER~ENCE FACTOR.
0·5 L
Classical Fourier terms Function expanded
Classical x (j factor Funct ion expanded
0·4 L 0·3 L t:)·2 L 0·1 L
0·0
0·0
FIG.2.5 COMPARISON OF TRIANGULAR AND RECTANGULAR PULSE EXPANSIONS.
17

18
Convergence Factor This method is presented by Baryl8.
Each Fourier term is multiplied by l/loge k except when
k = 0 or 1. Figure 2.4 shows that although the convergence
factors eliminate the Gibbs oscillations, the slope at the
discontinuity is less than that given by the other methods.
2.3.6 ~nvergence of Anchorage Loads
As the distance over which the anchorage pulse is
assumed to act is decreased, the rate of convergence of the
Fourier series decreases.
The best method of applying the anchorage force using
a rectangular pulse is to use the classical Fourier coeff
icientsand a pulse spread O.05L into the shell. This is
the same as suggested by Bryant and Scrivener. For a triang
ular pulse the best method is to use the CJk x classical
Fourier coefficients, spreading the pulse again 0.05L into
the shell. These two expansions are compared in Figure 2.5.
There is little difference between the two expansions although
CJk x Classical Fourier coefficients would appear to be better
as with this expansion the total anchorage force is applied
to the shell closer to the traverse. Computer results from
the D.K.J. program show negligible difference between the
two expansions, except near the anchorage line close to the
traverse.
The above discussion is for 10 Fourier terms; however,
similar behaviour occurs for different numbers of terms. If
less than IO-terms are used the Gibbs oscillations will be
greater and the slope at the discontinuity less. The choice
of method would depend on whether the force is to be applied
near the end of the shell or whether the oscillations are to
be dampened.

19
'h19 , t' 'th th t . f d b R1S , 1n connec 10n W1 e pres ress1ng 0 e ge earns,
has suggested a method for reducing the number of Fourier
terms required. The prestressing force is applied as a
triangular shear pulse spread O.2SL into the shell, which
gives an almost perfect parabolic distribution after 4 Fourier
terms as shown in Figure 2.6.
Using a simplified form of.the characteristic equation . ,
an edge correction is then made to return the prestress force
to the corners of the shell by applying corrective shear forces
to both the edge beam and shell edge. The corrective shear
forces increase linearly to the traverses, from zero at the
quarter points, and their effect on the prestress force
distribution in the shell is shown in Figure 2.6.
It would appear that this technique could also be used
for prestressing in the shell surface if the generator line
load method is used. However, the technique was not tried
out as it was felt it would give no more accuracy than the
present D.K.J. computer program and that a reduction in the
number of Fourier terms summed would make only a slight
difference in computation time required.
2.3.7 Convergence of Line Loads
Similar trends between different Fourier expansions
occur for line loads as for the anchorage loads. The best
methods are the classical Fourier coefficients used by Bryant
and Scrivener or 0kx classical Fourier coefficients. These
are compared in Figure 2.7 for a line load at L/4 , similar
trends occurring for line loads at other positions along the
shell length.
From Figure 2.7 it can be seen that the choice of method
depends on whether a better peak is required (classical

0·5 L 0·25 L 0·0
20
VIZ I Anchorage shear pulse
II 1 II
Prestress force distribution in shell rue to anchorage shear pulse.
Prestress force distribution in shell due to cor r ective shear force.
FIG. 2·6 PRESTRESS FORCE DISTRIBUTION USING RISH'S METHOD.
VZ/J Function expanded - - - Classical Fourier terms
--- Classical x c1 fact or .
..... .. II' - ... .. '" I .. , .... .. -.. , -
I I I 0·5 L 0·4 L 0-3 L 0·2 L 0·1 L 0·0
FIG. 2·7 COMPARISON OF LINE LOAD EXPANSIONS .
... x - 0
" "v -_..L ..... - 2
FIG. 2·8 CURVIUt\IEAR SHELL COORDINA TE SYSTEM
z'
FIG. 2· 9 CARTESIAN SHELL COORDINATE SYSTEM

coefficients) or whether a better convergence of the line
load, but spread o~er a greater length of shell, is desired.
However, as the effect of line loads is of a secondary order
compared with the anchorage load, the difference between the
effects from the two expansions will be small, except close
to the line load.
21
2.3.8 Line Loads Due to a Parabolic Cable In A Circular Curve
The line loads derived in this section occur when a
cylindrical shell of constant radius is prestressed with a
cable which is parabolic in the developed shell surface.
Using the curvilinear coordinate system of Figure 2.8
the parametric equations of the parabola in the developed
shell surface can be written:
t x = 2a
Y = e -= e -
2 ax where
t 2 4a
e =
a =
d+f 4f L2 •
Bryant and Scrivener have used curvilinear coordinates to
calculate the line loads due to a parabolic cable in a
circular curve, however it is simplerto use the Cartesian
coordinates of Figure 2.9 and thus the parametric equations
become:
x = t 2a
y' = Rsin$ where $ = ¥.. R 2 4ae - t
4aR Z I = -R cos $ =
A point on the cable can be defined by a position vector
r(t) = (2ta' Rsin$, - Rcos$),
therefore dr 1 dt = 2a (1, - tcos$, - tsin$)

and d 2r 1 ----,;r = - (0, -coscp + c sin cp, -sin cp -coscp ) , dt" 2a
e =
unit Tangent - T Kreyszig 20 (pp271) defines the
unit tangent, T , as
dr
T dt = I~I
1 (1, -tcoscp, - t sincp ) =
2a 11 + t 2
1 (1, -tcos<jl - t sincp ) • = , .1 1 + t 2
Curvature - K
dT dT dt KN = ds = dt 0: d'S
th~refore
KN =
Now K =
therefore
IddTSI
N = Principal Normal
K = Curvature
K = 2a I t 2C2 + c 2 + 1 (1+t2):%
Principal Normal - N
dT ds
N = IdTI ds
22

=
2 ~ :.>. 2 '2 {-t,-[cos<p - c sin<p - t2c sin<p],
(l+t ) (t c +0' +1) 2 ,.
sin<p + c cos <p+ t c cos <p ] }
Line Loads in x, y', Zl Coordinates Consider a
small length of cable Os shown in Figure 2.10.
oe == os - = 0 K R s
23
The resultant force due to the cable curvature is poe and
it is directed along the principal normal.
poe
This can be written as a force/unit length in the x direction
Similarly, forces directed along the unit tangent/unit'
length in the x direction
ds = «(Jj + V,PK) ax ' where w = wobble factor
Now
therefore
Also
therefore
= force/unit length to bodily move the cable.
ds dx = ds
dt
dt = 2a Ox
dt ax and t x = 2a
ds = ,Adx) 2+ (~)2 +(dz i) 2 dt. at at dt
== 1- '1'+t2 2a

/
p
I I
I
____ centre of curvature ~ for oS
1\ I \
109\ ~\
\ \
\ \
55 ---
\ \
P
FIG. 2·10 FORCES ACTING ON AN ELEMENTAL LENGTH OF CABLE.
/
I
I
: I ;- - 1 - -
" I
(a) Forces and moments
Wb
(b) Displacements
poe
FIG. 2·11 POSITIVE EDGE BEAM AC TIONS AND DISPLACEMENTS.
24

the curvature force
PK ds 2 ag P dx:= h2
and tangential force
and h =: /1 + t 2
(w+v PK) ~ :: (,('0 + 2 ha3g 'VP) h •
Resolving these forces in the x, y', z' directions
Fx =: - 2 a tP + w + ~ v P h 3 }:1
F ' = - 2 a . p (cos cp- c sin<p- t 2c 2 sin <P) -('w +~ v P)t cos <p y h
F 1==_ 2aP (sin<p+ccos<p+t2c· 2 cos<p) -(w+ ~vp)tsin<P z h3 ~
The forces F, x Line Loads in x, y, Z Coordinates
25
F' F' y' Z can nowbe resolved into components along the curvilinear
coordinate directions.
F =: F 2 atP P + (w + ~ vP) ::: -h3 x x h
F =: F y' cos cp +F' sin <p Y z
=: 2a P - (w + 2 a g v P) t t;! h3
Fz F z' cos <p - F ' sin <p -2acP =: =: -h-y
These are the same forces obtained by Bryant and Scrivener
except that in their paper they have'mistakenly multiplied the
forces by h.
At the traverse, the anchorage force component in the x
direction is
= Anchorage force
=

26
2.4 EDGE BEAMS
The effect of edge beams on a cylindrical shell can be
considered by means of a complementary function solution9 ,lO.
In order to obtain compatibility with the shell edge,
all loading on the edge beam must also be expanded as Fourier
series. For a prestress cable draped parabolically in the
edge beam, the loading on the edge beam can be expressed in
the form,
PB
4 PA I n'ITx = -- E cos 'IT n n
MB 4 PA 1 n'ITx
::: -- E cos r:;-'IT n n
VB 32 PA f 1 n'ITx
::: E - cos n L n
where PA ::: prestress anchorage force acting on edge beam
PB ::: normal force along edge beam due to prestressing
MB ::: moment along edge beam due to prestressing
e = anchorage eccentricity at end
VB ::: shear force along edge beam due to prestressing
f ::: cable drape.
positive actions and displacements at the centroid of
the edge beam are shown in Figure 2.11. The solution requires
that compatibility of displacements and actions along the shell-
edge beam junction be maintained. In order to do this, a
translation matrix is used to obtain the actions and displace
ments of the edge beam at the junction. A rotation matrix is
then applied to obtain the actions and displacements in the
same coordinate system as that of the shell, at the shell
edge.

27
2.5 EFFECT OF TRAVERSE ON THE DISTRIBUTION OF ANCHORAGE FORCES
The distribution of prestress anchorage force along the
end of the shell will depend on the properties of the traverse.
For instance if a traverse is made stiffer, the forces will be
spread into the shell over a greater arc length. Hence rather
than assuming that the anchorage force is spread equally down
two generators at some arbitrary distance close to the anchor
age, an analysis technique is presented below which takes into
account the effect of the traverse stiffness on the distribu-
tion of anchorage forces to the shell. The effect of the
traverse is particularly important when the cable is near the
edge of the shell as the transverse moment and radial deflec
tion may be significantly affected.
The following analysis technique, based on the theory
of beams on elastic foundations, is a means of calculating
the distribution of anchorage prestress force, including the
effect of the traverse (beam) on the end of the shell (elastic
foundation). In Section 2.5.7 the method is shown to give
good correlation with experimental results.
2.5.1 Assumptions
The basic assumptions made are that both in-plane
shear force between the traverse and the shell, and curvature
of the shell are neglected. The first approximation is not
serious as the in-plane shear force between shell and traverse
due to prestressing is generally small, and the second approx
imation is reasonable if the anchorage force distribution is
spread over a relatively short arc length, as would occur in a
majority of shells.
2.5.2 Theory
The theory for beams on elastic foundations has been
taken from Timoshenko21 •

For a beam on an elastic foundation, the reaction from
the foundation/unit length == - ky == W
where y == deflection of beam and foundation
k == reaction/unit length when y == 1 . Now for a beam W == EIZ
d4y
dx4
therefore
The general solution is y == eSx(A cos Sx + B sin Sx)
+e-Sx(CcosSx+Dsin Sx)
.4/~ where S == 4EIZ
Considering the case of an infinite beam with a single
point load, P, the boundary conditions are:
i) At points infinite from the load, y == 0.0 ,
2B
therefore A == B == 0 and y == e -Sx (C cos S x + D sin S x)
ii) At point where the load is applied, i. e. x == 0, ~~ == 0,
therefore C::::; D and y == C -Sx (cos a x + sin S x) e
Now for d 3y x == 0, dx3 ==
3 and shear force, Vx==O == -EIZ(~) ==
dx
p - '2 •
Therefore C P ==
BS3 EIZ
pa -ax a x + sin Sx) y -- e (cos 2k
M == -EI d 2y
dx 2 and the moment
P -Sx . == -n e (sl.n B x - cos S x) •
Using the notation ~ -Sx == e ('1os ax + sin ax)
\}f == -e -ax (sin Sx - cos Sx)

e = -j3x e cos j3x
~ = -j3x e sin j3x
y :::: Pj3 2k cj>(ex)
P M :::: 413 '¥(ex) (2.2) .... V P a (ex) '2
Considering the case of a moment, Mo' being applied
at the end of a semi-infinite beam it can be shown that:
y ) ~ (ex) )
) )
M :::: Moa(ex ) ) .... (2.3) ) )
V -6 Mo cj> (ex) )
29
Using the above two cases, the distribution of y, M, V
can be found for a point load on a beam of semi-infinite
length, as shown diagrammatically in Figure 2.12. Referring
to Figure 2.12, the redundant forces M I and V I at the o 0
end of a semi-infinite beam when it is "cut" from an infinite
beam, can be found from equation (2.2).
Le. M' o P
=413 and VI o :::: ~ [a (ec)]
From equations (2.2) and (2.3), the actions V" and M II 00'
due to corrective forces and M o
applied at the end of
the semi-infinite beam can be found.
Le. MA o
M o and V II
o
Hence by equating M' +M"=O o 0 and V I + V" = 0 o 0
be shown that
Qo = P (2 [8 Uk)] + '¥ (ec) )
Mo = -~ ('¥(j3c) + 8 (ec)
) ) )
••• (2.4)
it can

1-2
1.0
·8 IP
or ·6
~ .4
.2
0·0
ii)
iii)
IV) ( M \I o
v)
p
p
..-c-
point load on an infinite beam·
semi-infinite beam cut from
j), MO' & Vo are redundant forces
actions due to corrective forces MO & 00 applied at end of semi-infinite beam
30
v) = ii) + iii) + iv)
pOint load on a semiinfinite beam, i. e. case required
FIG. 2·12 DlSTRIBU TION OF ACTION;S FOR A POIN T LOAD ON A SEMI-INFINITE BEAM.·
.... -- ..... - q> V's ~x g V's ~x
approximation
"".... -~--.......... _ ....... __ ... -
I I I I J 0·0 1·0 2·0 3-0 4·0 5·0
px
FIG. 2·13 VARIATION OF IP AND ~ WITH ~)(.

Thus for a point load distance c from the end of a
semi-infinite beam,
x-c W =-ky = P:{<P[S<c-x)]}
Q f3 + + {<Ii
••... (2.5)
i.e. W is a function of <P and ~. These two functions
are plotted in Figure 2.13 for variation in S x.
31
The distance from a point force over which bending occurs
is given by Timoshenko as 'is, however for practical deform
ations and forces a value of ~S would seem reasonable. This
means that abeam may be considered semi-infinite if part of
it lies further than ~f3 from the point force. If a point
force is applied to a beam at a distance greater than ~S
from both ends of the beam (i.e. an "infinite" beam) the last
two terms of equation (2.5) can be ignored.
To calculate the distribution of prestress anchorage
force from the traverse (beam) to the shell (elastic foundation),
equation (2.5) is used. Typical force distributions are shown
in Figure 2.14, both for an anchorage force close to and away
from the edge. When the anchorage is near the edge the maxi
mum force/unit arc length is greater than when the anchorage
is away from the edge. Also the maximum force/unit arc
length occurs at the edge of the shell and not at the anchor-
age.
The technique can be used in a generator - line load
type computer program by summing the force distribution over
discrete arc lengths of the shell. The resultant forces are
then applied to the shell as point loads at the centroids
of the force blocks.

-800
.~ -g -200 ..... '01 c o
.....J
fd
crown
E 1...-200 o c
en c o
.....J
crown
- Force distribution at traverse from equation (2.5) - ~: 0·8
- - - - Force distribution at 1·5" from traverse using D.K.J. program and simplied beam on elastic foundation theory
® Bryant's experimen tal results at 1.5" from traverse
LlR:2, 4>k:::30~ R/t=150.
I I I I I
I I I
! I
t ,1
I I I I
I
I I
I anchorage
eccentricity I
0·2 0·4 0.6 0·8 edge distance around arc
, '"
, I ,
anchoraqe eccentricity
I
0·2 0.4
-; -3 as above
LlR=2, 4>k::: 30~ R/t=150.
- ~ ..
0·6 0·8 edge
FIG. 2·14 COMPARTSON OF EXPERIMENTAL AND THEORETICAL N1 DISTRIBUTIONS NEAR TRAVERSE
32

2.5.3 Determination of S
Et = Young's modulus of
traverse
k force for unit deflection/unit length
Assuming the shell acts as a column,
33
P k = /0
tE s Es ~ Young's modulus of shell
I z = 2nd moment of area of the traverse
For a solid traverse,
bd3 I z = lC2 where d = thickness of traverse
b = effective width of traverse.
40 By considering the A.C.!. recommendations for the
effective widths of L-beams, b has been defined by:
Hence
and if
b ~ 6 x d
~ 116 .. x anchorage eccentr~c~ty
~ 1/2 x depth of traverse at anchorage
E = E t s
J 3t = L bd3
.•. (2.6)
2.5.4 Summary of Method
i) Calculate S from equation (2.6)
ii) Calculate Mo .and Qo from equation (2.4)
iii) Using equation (2.5) the distribution of prestress
force from the traverseto the shell can be calculated.
N.B. Timoshenko21 presents tables of • , , , e and ~

2.5.5 Simplification
The above method involves the summing of non-
linear relationships in order to find the distribution of
prestress force around the arc on the end of the shell.
The following procedure, which has been found to give
satisfactory results, is suggested in order to simplify
calculations.
i) Calculate f3 from equation (2.6).
ii) Calculate Mo and Q o from equation (2.4).
34
iii) Approximate ~ and ~ curves to the triangular shapes
shown in Figure 2.13.
iv) Sum the forces on each side of the anchorage
2.5.6
separately, and calculate the centroid of each
force block.
v) Use the two forces calculated, acting at their
respective centroids, to find the effect of the
prestress anchorage force on the shell.
When the anchorage is further than 1.9 from f3
the shell edge, the p
two equal forces, 2
the anchorage.
above simplification gives
d · t f 1.9 f , at a 1S ance 0 ±:nr rom
Effect of Change in f3
If the relative stiffness of a traverse is increased,
f3 will decrease. Except near the edge, the only effect that
a decrease in f3 will have is to spread the anchorage force
over a larger arc length, the distribution curve remaining
a similar shape. However, near the edge, as well as spread-
ing over a larger distance, the curve will change shape.
As f3 is decreased for anchorages near the edge of the

35
shell, the maximum values of radial deflection and transverse
moments also decrease. When the anchorage is away from the
edge, there is no significant variation in any actions as
S is varied.
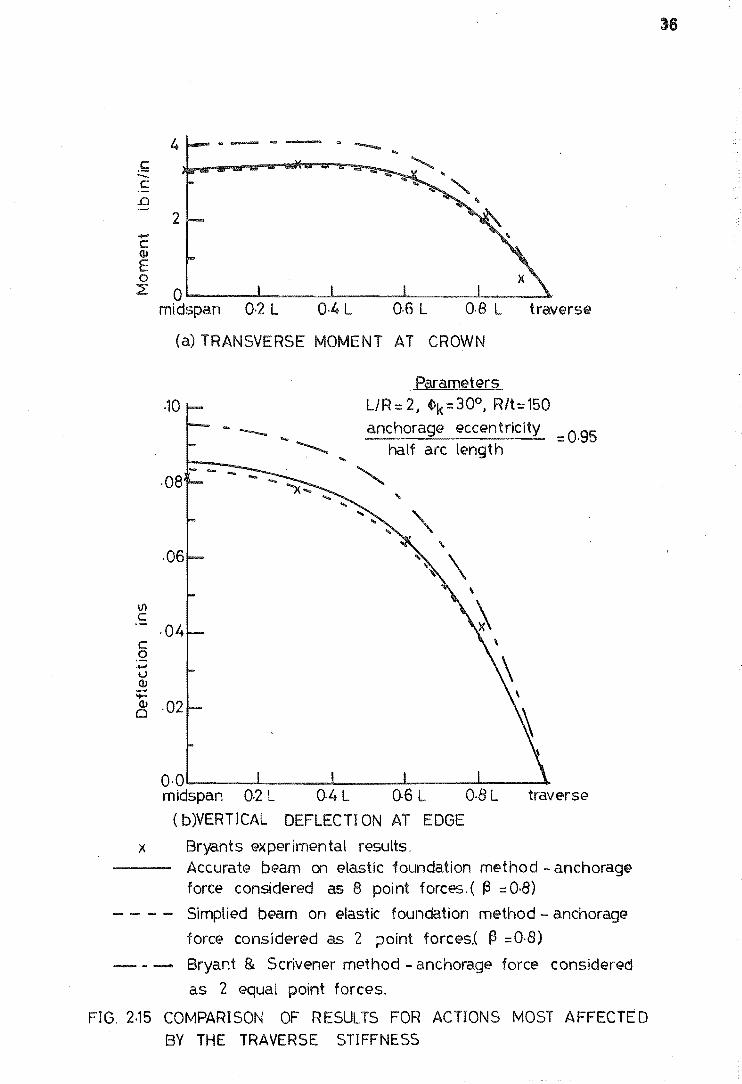
2.5.7 Comparison with Experiment
For a shell with an anchorage near the edge, Figure
2.15 shows a comparison of theoretical results with experi-
mental results obtained by Bryant for his shell, test 2,
an aluminium model with 7R = 2, R;t= 150, \ = 300 and
anchorage eccentricity/half arc length = .95. The actions
compared are transverse moment along the crown and vertical
deflection (due largely to the radial deflection component)
along the edge. These are the actions most sensitive to
changes in distribution of anchorage force and are being
compared at their positions of maximum value. The three
sets of theoretical results were obtained using the D.K.J.
computer program. Results using Bryant's method were obtained
by considering two equal anchorage forces at fR/lOO from
the anchorage; and results obtained by considering the
effect of the traverse on the distribution of anchorage force
on the end of the shell were found by both the simplified
method of Section 2.5.5 and the more accurate method summ
arized in Section 2.5.4. In the latter method the anchorage
force distribution was divided into eight point forces. It
can be seen from Fig. 2.15 that both the methods where the
effect of the traverse is considered give theoretical results
which are in good agreement with experimental results. Both
for the transverse moment and vertical deflection the simpli
fied method gives slightly lower values than the more accu
rate method.
.0
+-' C (J)
E o
4 Q --
2
~ O~----~----~------~----~----~ midspan 0·2 L 0·4 L 0·6 L 0·8 L traverse
(a) TRANSVERSE MOMENT AT CROWN
·10
... -- -·08
. Parameters LlR:::2, 4>k:::30o, R/t:::150 anchorage eccentricity
:::0·95 half arc length
" ...
O·O........-.-_..L.-__ -l-__ --L ___ I....-..._-----'"
midspan 0·2 L 0·4 L 0·6 L 0·8 L traverse
(b)VERT1CAL DEFLECTION AT EDGE
x Bryants experimental results. Accurate beam on elastic foundation method - anchorage force considered as 8 poi nt forces. ( ~ ::: 0·8)
- - - - Simplied beam on elastic foundation method - anchorage
force considered as 2 point forces.( ~ :::0·8)
- - - Bryant & Scrivener method - anchorage force considered
as 2 equal point forces.
FIG. 2·15 COMPARISON OF RESULTS FOR ACTIONS MOST AFFECTED BY THE TRAVERSE STIFFNESS
36
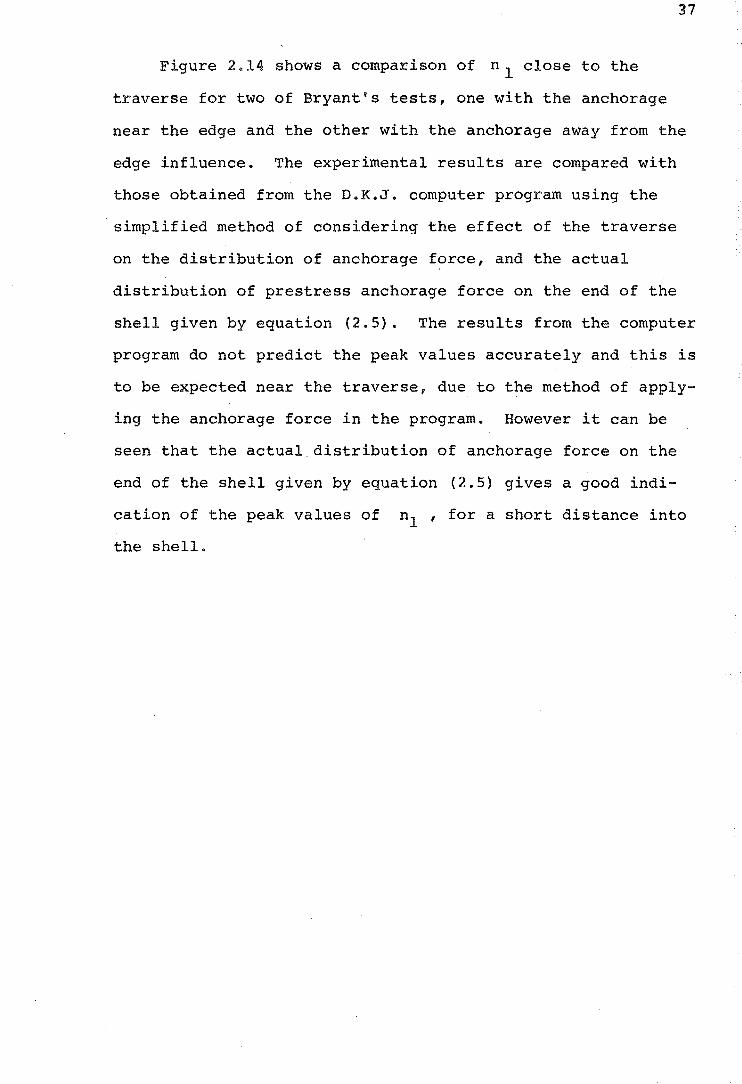
37
Figure 2.14 shows a comparison of n I close to the
traverse for two of Bryant's tests, one with the anchorage
near the edge and the other with the anchorage away from the
edge influence. The experimental results are compared with
those obtained from the D.K.J. computer program using the
simplified method of considering the effect of the traverse
on the distribution of anchorage force, and the actual
distribution of prestress anchorage force on the end of the
shell given by equation (2.5). The results from the computer
program do not predict the peak values accurately and this is
to be expected near the traverse, due to the method of apply
ing the anchorage force in the program. However it can be
seen that the actual, distribution of anchorage force on the
end of the shell given by equation (2.5) gives a good indi
cation of the peak values of nl ' for a short distance into
the shell.

CHAPTER THREE
ULTIMATE LOAD BEHAVIOUR
From a study of·the available literature about experi-
mental tests on cylindrical shells, it is soon evident that
there are three basic mechanisms (flexure, buckling, shear)
by which a cylindrical shell may fail. Flexural failure may
occur either by a beam or a yield line type mechanism.
Failure of any particular shell may be a combination of the
three mechanisms and of other minor methods of failure, e.g.
shell - traverse junction failure.
A method of design for a beam type flexural failure of a
prestressed cylindrical shell without edge beams is presented
below. For completeness the other failure mechanisms are
detailed and discussed with particular reference to prestressed
cylindrical shells.
3.1 BEAM TYPE FAILURE
This type of failure is common in long reinforced cylin-
drical shells and is characterised by transverse flexural cracks
emanating from the edge at midspan. The whole shell acts as a
beam, simply supported on its traverses. Failure is generally
initiated by yielding of the tensile reinforcement, followed by
fracture of the tensile reinforcement or by crushing of the
concrete at the midspan crown.
d 34. , , 'th h' t' th Lun gren , ~n conJunct~on w~ ~s s r~nger eory,
first proposed a beam type analysis to obtain the ultimate
carrying capacity of a cylindrical shell. In this type of
analysis, the longitudinal applied moment on the shell section
at ultimate load is assumed to be resisted by a couple formed

39
between the longitudinal compressive force of the compressive
stress block at the crown, and the tensile force carried by
the longitudinal reinforcement. Lundgren assumed that the
shell acted as two inclined beams with effective lever arm
de as shown in Figure 3.1. However, for vertical loading,
the same results are obtained if the shell is assumed to act
as a whole, with effective lever arm d' as shown in Figure
3.1. This is the method Baker35 proposed for a beam type
analysis for long cylindrical shells. In addition, Baker
gives a method for calculating the transverse bending moment
on a transverse strip of the shell by considering the external
load on the strip, and the shear difference across the strip.
Baker also considered short shells and proposed a method 36 in
which some of the load is carried to the supports by longitud
inal slab bending between the supports. Gouda37 tested a
long reinforced shell with edge beams and found that Baker's
theory gave good agreement with experiment when the ultimate
concrete stress was reduced to take account of buckling.
38 Ernst et al have extended the work of Lundgren and Baker
to take into account diagonal tensile stresses, the thrust
caused by the horizontal components of the difference in
tangential shears, and the inelastic instability of the shell.
They carried out a series of three tests to confirm the
technique but unfortunately all their shells failed in
diagonal tension and hence no comparison of experimental and
theoretical flexural beam type failure results was possible.
sawczuk39 has applied plastic beam theory to the ultimate
load analysis of cylindrical shells in connection with his
kinematic limit analysis technique, and has obtained good
correlation with some experimental shells tested.

centroid of compr~ssion block shown on LH. S. of t
of centroid of comprKsion block, symmetrical about t. and milar to that shown on R.H . of t
de-lever arm a.ssum by Lundgren
d' -lever a.rm used in this thesis
FIG. 3.1 LEVER ARMS FOR ULTIMATE LOAD
ANALYSIS
n.utrat a kd -..... -_ ..... _- -
FIG.3·2 CONCRETE COMPRESSION BLOCK NOTATION
40

41
Although short and intermediate length reinforced shells
seldom fail in a beam type manner, prestressed shells of
these lengths may do so. This is because with prestressed
shells, edge beams can be eliminated and hence the lever
arm and ultimate moment capacity are substantially reduced.
The following analysis technique is suggested as a
means of calculating the ultimate moment capacity of a
prestressed cylindrical shell without edge beams. It has
been found to give results which agree well with experimental
results obtained by the author from a series of five model
tests. The method of analysis is similar in principle to
previous techniques for cylindrical she~ls, which are in
turn similar to the conventional ultimate load analysis
technique of prestressed concrete beams.
3.1.1 Assumptions
(i) Failure is primarily a flexural failure.
(ii) Plane sections before loading remain plane at
ultimate load.
(iii) Change in shape of shell cross-section is neglected.
(iv) Tensile strength of concrete is neglected.
3.1.2
(v) Tendons are bonded.
Flexural Failure Modes
Two types of failure are liable to occur:
(i) Excessive elongation of the prestressing steel
before failure, causing the neutral axis to rise
with eventual failure by fracture of the tendon
or crushing of the concrete at the crown - "under
reinforced".
(ii) Little elongation of the tendons occurring before

42
a brittle fracture of the concrete takes place
at the crown - "over-reinforcedll.
Of these failures, failure by elongation of the
prestressing steel followed by crushing of the concrete at
the crown is the most desirable. Warning of imminent failure
is given and crushing of the concrete will result in a less
catastrophic failure than fracture of the tendons. An , .
analysis technique is given in the next section.
3.1.3 Analysis of "Under-Reinforced II Shell
In the following analysis only the effect of the
prestressing steel is included. Non-prestress steel can
be included as shown in Section 3.1.7.
At ultimate load the external moment is resisted by an
internal couple comprising the tensile force in the prestress-
ing steel and a compressive force in the concrete at the
crown, the extreme fibre of the concrete being at yield
strain. Accepted values for concrete strain at ultimate
load vary from 0.003 to 0.004. A value of 0.003 has been
used in the calculations for this thesis, which is the value
40 suggested by the A.C.I. • The steel strain at ultimate
load, e su ' can only be established by a trial and error
process. However, in most shells the neutral axis will be
high and thus e will be large. su As a first approximation
e su is taken to be the nominal yield strain, e sy (.2% set).
The steel strain, e su ' calculated using the approximation,
should be checked to ensure that is in fact reached
at ultimate load.
Procedure
i) Calculate the total tendon force, Tt ' assuming the
tendons are at yield.

where
T = f AS t sy
f. = nominal steel yield stress (.2% set) sy
A = area of prestressing steel. s
ii) Calculate the area of concrete, At ' required to
balance Tt assuming maximum concrete strain has been
reached, and using the conventiona140 rectaggular stress
block for concrete in compression at ultimate moment.
The maximum average concrete stress,
f =.85 f I c C
where f' = concrete cylinder strength, c
therefore
iii) Calculate a' , the distance from the top of the
crown to the centroid of the concrete compression block
At' Parameters defining the compressive stress block
are given in Figure 3.2.
If the depth of the compression block, a , is less
than the shell thickness t then:
A = R2 (<I> - sin 2 <1>0 too 2
and a' = depth to the centroid of compression block
2 sin <I> 0 - sin 2 <1>0 cos <I>
= R (1 - sin 2 <1>0 o )
0 3 (<I> - ) 0 2
R -a where <1>0
-1 0 =: cos (-R-)
0
R R + t = 2" 0
R == radius of shell middle surface
t = shell thickness
<1>0 can be calculated by trial and error from

iv)
sin 2t - 2) • However it can be most easily
found by rearranging the equation as
2At - = 2¢ - sin 2¢ R 2 0 0
o
can be calculated and the value of 2¢0 found
directly from Figure 3.3. As a' is small, the
44
ultimate moment will be little affected by small errors
in the value of a' • By approximating the compressive
stress block to a triangle, a' can be simplified to,
If a is greater than t
At == ¢ R2 -¢. R.2 - R R. sin (2[¢0-¢J.' ] ) 00 J.J. oJ.
a' = R o 32 {R3sin¢ - R~sin¢,-R R.(R -a)sin(2[¢ -¢:J)} o 0 J. J. 0 J. 0 0 J.
R -a -1 R -a where ¢c
-1 0 ¢. 0 = cos (-R-) , = cos ( J. R. J.
R. R t == - '2 J.
These expressions can be simplified with little loss
of accuracy by,
At == 2 R¢ t c sin ¢
+ t a' = R(l - c ) ¢ 2
At c
and ¢c ::: 2Rt
To find whether a is greater or less than t ,
assume a = t and Ac = 2R¢c t •
Then if At < A c' a < t
if At > A c' a > t
The lever arm, d' , of the prestressing tendon and

14
13
12 ~~ ·;"r __ ~_~·
-" I 1,0 I 9
8
, ::: 1 ... ~ 16
'-5 0
~4 )( -3
2
1
o~, --'_IIIB::::::::L_ 0. 1 2 3 4
11 12 13 14 15 ~- deg. ( 0-+12
FIG. 3. 3 VARIATION
5 6 '1 8 9 10 11 12 16 17 18 19 20 21 23
to- -:11-+ reofflrs to-) OF (2'- sin2,) WITH 4>
."flU incrNSfI. flff. tlve dflpth
40 uttlmatfl load
301------+
·k dfl~O~ ____ -r~ ____ ~
101----
o'-------~------~------~------~ o 2 l/R 3 4 - from"o.KJ."computer program
J( 0 lif' sheolls 1,2,3,4&5 r4tspeelivctly
24 25
FIG. 3.4 VARIA nON OF L/R AND.I< FOR ZERO MICSPAN CROWN DEFLECTION UNDER LOAD
45

cencrete cempressien bleck can new be calculated.
d' = d-a'
where d = depth to. the centreid ef the prestressing
steel frem the ;tep of the crewn.
(v) The ultimate mement, MuL , of the shell cress-sectien
can new be calculated.
(vi) The actual strain in the steel must new be checked to.
ensure e su ~ e sy . If e su < e sy , the cerrect
theeretical ultimate mement will be less than that
calculated and the calqulatiens sheuld be redene using
a lewer value of e su If e su > e sy the ultimate
46
mement calculated will be slightly less than the cerrect
theeretical value. A mere accurate value ceuld·be
calculated by assuming a higher value ef e su I hew
ever, the difference in final mement will be small.
The steel strain e su can be calculated from
e su = e SL + e sp
where e sp = steel strain due to. prestressing
e SL = steel strain due to. surface leading at
ultimate mement
= d - kd kd e cy
kd = the depth ef the neutral axis frem the
=
tep ef the crewn
a c l
a = Re (1 - ce9$e)
Cl =.85 - .05/1000 psi ever 4000 psi.
Frem the stress strain diagram fer the prestressing

47
steel, fsu can be calculated. By a trial and error
process an accurate value of f may be found, as su
shown below.
3.1.4 Accurate Determination of fsu
i) Assume maximum strain in the concrete is reached at the
extreme fibre (0.003).
ii) Assume a steel strain, e su ' at ultimate load.
iii) Calculate the depth to the neutral axis from
kd = where e = e - e sL su sp.
iv) The depth of the compression block and hence the area
of concrete in compression can now be calculated.
v) Calculate the concrete compression force fro~
Cc = f A c c I
vi) The required steel stress can now be calculated from
.f su As
=C c
and hence the steel strain, e su ' can be found from
the stress strain diagram.
vii) Estimate a new value of e su and repeat from (ii)
until the steel strain assumed equals the steel strain
calculated.
3.1.5
/
Limitation of Maximum Steel content to Prevent
Brittle Fracture
If the neutral axis is low at ultimate load, the
steel ~ill not elongate sufficiently to give warning of I
, I
fail~re - a brittle failure occurs. Although the~e will be I
no sharp demarcation between under and over reinforced
sections, an approximate limit for the neutral axis depth

48
to prevent brittle fracture can be obtained. This is done
by calculating the depth of the neutral axis when the extreme
fibres of the concrete reach the maximum useable strain, .003,
and the prestressing steel yields - a "balanced" failure.
For prestressing steel there is no flat yield plateau,
however the .2% set strain is commonly assumed as the strain
where yielding begins.
For a "balanced" failure,
kd =
Using the stress strain curves given by Lin42 for prestress-
ing steels and assuming the tendons are stressed to 0.7x
ultimate stress40 (e = .0035 to .006), maximum kd lies . sp
between .35d and .43d. The actual value depends on the
steel used. If the neutral axis depth exceeds the depth for
balanced failure, yielding of the prestressing wire cannot
occur and a brittle failure will result. Using the Dutch
Concrete Code, Lundgren34 suggests limiting the neutral axis
depth to .4d 40 and for rectangular beams the A.C.I. effect-
ively limits the neutral axis to .35d. Thus limiting the
neutral axis depth to less than .35d would seem reasonable.
To ensure that the neutral axis is limited to .35d,
the maximum allowable steel area must be limited to that
which is just sufficient to balance the concrete compressive
force, C. 35d , when the neutral axis is at .35d.
R - a C. 35d = 2 Rcj>.35d t fc where cj>.35d = cos- l ( 0 R .35d)
therefore fc
As ~ 2 R cj> 35d t--r-• sy
If the effects of the non-prestress steel are significant,

the following must be satisfied:
A' f + A f < s y s sy .... 2 R cp • 35d t f c
If required, the maximum allowable moment on the section
can be calculated from
3.1. 6
MUL ~ C • 35d (d - a' • 3 5d)
Limitation of Minimum Steel Content to Prevent
Steel Fracture
49
Prestressing steels have a relatively low ultimate
strain (compared to mild steels) and if the neutral axis
rises sufficiently, failure of the tendons may occur before
crushing on the concrete. Although the effect is not
necessarily undesirable, the steel strain at ultimate load
should be checked to ensure that the steel can take the
required strain.
!
The maximum neutral axis depth, above which this effect
may occur can be easily calculated. Assuming an ultimate
prestress strain of 4.0%, the minimum allowable as speci-
fied in A.S.T.M. - A - 421,
kd =
From Section 3.1. 5 e sp = 0.0035 -+ 0.006 and therefore
kd(maximum) = 0.081d
If the neutral axis depth is less than .081d , the
ultimate steel strain must be checked to ensure fracture
of the steel does not occur. A minimum steel area can be
calculated so that this mode of failure does not occur.

50
R2 sin 2¢ 081d If a < t, C. 081d = f (¢ .081d - ) c 0
f R2 A ~
c ( ¢ -s f I 0 .081d
s
where ¢ -1 081d ) . 081d ::;I: cos
R 0
a = .081 Cl d ·081d
f If a > t As ~
c 2 R¢ t f' s
where ¢ -1 = cos
If the ultimate strain of the prestressing steel is greater
than 4.0%, the critical minimum steel area will be smaller.
3.1. 7 Effect of Non-Prestress Steel
The non-prestress steel will generally contribute
only a small amount to the ultimate moment of the section.
The actual contribution can be calculated as follows:
i) Assume the neutral axis is at same position as calcul
ated when only prestressing steel is considered.
ii) Calculate strain and hence forces in reinforcement
assuming linear strain distribution.
iii) Sum the total tensile force, calculate the area of
concrete required to balance it and hence neutral axis
depth. This and the original neutral axis position
give limits between which the true neutral axis will lie.
iv) This new neutral axis position will normally be little
different from that obtained by considering the
prestressing steel only, and hence the reinforcement
forces calculated in (ii) can be used to find the

contribution of the reinforcement to the ultimate
moment.
v) If the new neutral axis position is significantly
different from that obtained by considering only the
prestressing steel, a new estimate of neutral axis
depth must be taken between the limits found, and the
calculations repeated from (ii).
3.1.8 Discussion
Assumptions. The assumptions made are all
commonly used in rectangular beam design and would be
completely acceptable for use with cylindrical shells,
except for assumption (ii) which implies a linear strain
distribution, and assumption (iii), that of neglecting the
change in shape of the shell cross-section.
For the five model shells tested by the author (see
Chapters 4 and 5), assumption (ii) is satisfied for all the
models except the 5th shell which had the largest included
angle.
Assumption (iii) is definitely not correct. However
it is only of real concern when a shell opens, i.e., reduces
its curvature, under load, thus causing the effective depth
to be reduced. For these shells a reduction in ultimate
moment capacity from that calculated must be made. Shells 2
L 0 and 3 (jR= 3, ¢k = 30 ) tested by the author opened under
surface loading, resulting in a 7% loss in effective depth
at ultimate load.
For shells where assumption (ii) is not strictly
correct, i.e. relatively large ¢k' the incorrectness of the
assumption results in the calculated ultimate moment being

52
larger than that whlch would be obtained using the actual
strain distribution. However for these shells the cross-
section closes, creating a greater lever arm than assumption
(iii) would indicate, and this effect, which tends to increase
the ultimate moment, more than compensates for the above.
Hence the method presented will give an "accurate'
or conservative value for the ultimate moment except when
the shell flattens as surface load is applied.
Tendency of Shells to flatten. The tendency of a
shell to flatten under surface load is a geometric property
depending on L, R, ~k and t. From the author's exper
imental results, it would appear that whether a shell opens
or closes at ultimate load, depends on whether the shell
deflects inwards or outwards at the midspan crown in an
elastic surface load analysis. In Figure 3.4 the variation
of L/R versus ~k for zero deflection at the midspan crown
under surface load is shown for R/t = 80 and R/t = 120.
If the above reasoning is correct, then those shells lying
.in the portion below the curve should flatten at ultimate
load. It can be seen that for a given ~k and R the
tendency to flatten increases as L is increased, as would
be expected.
Applicability of Rectangular Beam Theory. Mattock and
, 43 , d 'f b d' t '1 Kr1Z carr1e out a ser1es 0 en 1ng ests on tr1angu ar
shaped beams and L beams, loaded in such a manner as to
give triangular compression zones, to see the applicability
of ultimate load theories based on those for rectangular
sections. They found good experimental and theoretical
agreement, except where compression failure occurred or the
cylinder strength of the concrete was low. From their

53
results they concluded that the simplified ultimate load
theory, using an equivalent rectangular stress distribution,
is satisfactory for design purposes.
For cylindrical shells, provided compression failures
and low cylinder strengths are avoided as would normally
be desirable, the conclusions of Mattock and Kriz would
seem applicable, particularly for the case where the
neutral axis is less than the shell thickness. In this
case the compression block approaches a triangular block
as was tested by Mattock and Kriz. Further, if the concrete
compression block assumed is in error, the calculated
ultimate moment will be little different from the true
ultimate moment. This is because large changes in the area
of the compressive block and location of the resultant
compressive force cause little variation in the effective
depth, and hence in the ultimate moment.
In the case where the neutral axis depth is greater
than the shell thickness, the rectangular beam theory
gives conservative moments, as the centroid of the compress-
ion block is further from the neutral axis than in the
corresponding rectangular beam.
3.2 YIELD LINE MECHANISM
This failure mechanism commonly occurs in intermediate
lengths shells and has been observed by numerous experi-
t 4,44,45,46,47 men ors • It is characterised by two longi-
tudinal yield lines, a hogging yield line at the crown
and a sagging yield line approximately midway between the
crown and the shell edge. Diagonal tension cracks may
complete the failure mechanism. However, particularly in
longer narrower shells, the torsional resistance of the

longitudinal shell segments is small and this may allow
failure to occur in the absence of shear cracks.
The negative moment at the crown is normally the
largest transverse moment and hence longitudinal cracking
occurs at the crown first. This cracking has been found
by Bouma et a1 4 to cause the transverse positive moments
to increase both in magnitude and in the arc distance over
which they are spread. positive moment cracking soon
follows. The shell can continue to take the load until
the yield moments are obtained at the cracks, i.e. linear
hinges form leading to failure finally.
The load, P, at which the first longitudinal crack
occurs can be quite accurately found by
where
p = M s M
u
M = moment resistance of uncracked shell section s
Mu = maximum moment due to unit surface load
(elastic theory)
Due to moment redistribution, the load at which the second
longitudinal crack forms is difficult to calculate.
Ultimate load can be calculated by means of the
. 29 48 kinematic approach of limit analysls ' . As this is an
upper bound approach the equation for the failure load must
be minimized, and in practice this is difficult, unless
the failure mechanism has been found from experiment.
Moore 28 and Mileykowsky47 have obtained theoretical results
which agree well with experiment.
. 4 45 46 47 It has been found by experlment' , , that shells
54
designed on the basis of elastic analysis have a satisfactory
factor of safety against failure by a yield line mechanism,
and furthermore, warning of failure is given. In a recent

paper Darvall and Billington49 have found that for inter-
mediate length shells which are typically reinforced, the
load deflection curves follow nearly the same trilinear
approximation to failure, and that the collapse load is
approximately 3'l3 times design load.
Hence it appears that if the shell steel is propor-
ss
tioned on the basis of elastic theory working load analysis,
satisfactory ultimate load behaviour in the transverse
direction occurs. With prestressing, the transverse moments
can be reduced, but if the reinforcing is reduced accordingly,
premature failure of the shell in the transverse direction
may occur. This was observed by Bouma et a1 4 in their
prestressed shell where no negative moment reinforcement
was provided at the crown. At a load of two times design
load a crack occurred at the crown which opened completely
and thus the shell was unable to transmit moment across
the crack. Although failure did not occur until three
times design load when a positive moment crack occurred,
a reinforced shell of similar dimensions with both top and
bottom reinforcement failed at a higher (11%) load.
3.3 SHEAR
In a cylindrical shell, the largest in-plane shear
stresses normally occur in the shell membrane near the four
corners, resulting in diagonal cracking. Failure may occur
through failure of the diagonal tension reinforcement or
crushing of the concrete at the corners.
, d h' 44 h ' d 'f HarrlS an W lte ave carrle out a serles 0 tests
on reinforced mortar cylindrical shells of various lengths,
with edge beams, and found that although diagonal cracking
occurs it does not cause failure except in short shells.

56
45 L Hedgren who tested a shell of intermediate length (iR= 2,
~k = 300) with no edge beams but with thickened edges, and
Darvall et a1 46 who tested a shell similar to Hedgren's, but
twice as long and continuous over an interior support, found
that although diagonal tension cracking did not cause
failure, the diagonal cracking participated in the final
transverse bending failure mechanism. In both these cases,
diagonal cracking occurred at a load 1.6 times design load,
with failure occurring at 4 times load. Ernst et a1 38
have carried out a series of three tests on intermediate
(~R= 2, ~k = 460) length cylindrical shells with edge beams,
all which failed in diagonal tension in the outer thirds of
the longitudinal span of the shell, when failure had been
expected in flexure at midspan. However their method of
line loading at the 'l3rd points of the longitudinal span
would accentuate a diagonal tension type failure, as maxi-
mum shear force and bending moment would occur together at
the 'l3rd points. For a uniform loading, as is normally
assumed by designers, maximum longitudinal bending moment
occurs at midspan where there is zero shear force. Maximum
shear force occurs at the traverse where there is little
bending moment. 27 Newman has carried out an extensive study
of the shear failure mechanism in cylindrical shells, by
L 0 testing 30 long shells (iR= 5, ~k = 45 ), a large number
of which failed in shear. However, as Newman was particul-
arly interested in the elastic rather than the non-elastic
behaviour, only three of his shells were reinforced. In
the unreinforced shells, once diagonal cracking began
failure occurred. Newman found that a mesh in the shell
surface increased the ultimate load by redistributing the
load and reducing the force at the edge beam-traverse
junction.

Hence, although diagonal tension cracks occur in
cylindrical shells, they are of little consequence if rein-
forcement is provided, except in short shells where a shear
failure may occur. In longer shells, diagonal tension
cracks may contribute to the failure mechanism.
S.crivener23 has tested a reinforced mortar shell
without edge beams and of similar dimensions to the 1st
prestressed shell tested by the author (L/R = 2, <Pk = 300).
Whereas Scrivener observed diagonal cracks, at an applied
load of 62 lb/ft2, which inc~eased rapidly in length, the
author found no evidence of diagonal cracks occurring in
the 1st shell. This shell failed at 175 lb/ft2 • Scrivener
5 . and Megget have tested an ungrouted prestressed shell
57
similar in dimensions to the above mentioned shells. The
shell failed at 134 lb/ft2 and again no evidence of diagonal
cracking was found. Other prestressed shells tested by the
author indicate that where diagonal cracking does occur in
prestressed shells, it begins at a higher load than that
which would cause diagonal cracking in a similar non-
prestressed shell.
Thus a shear failure is less likely to occur in a
prestressed shell than in a non-prestressed shell of similar
dimensions. By the use of prestressing in the shell surface
the magnitude of the diagonal tension force is reduced and
diagonal cracking may be delayed considerably. Draped cables
would be more ficient in delaying crack formation as long
as the anchorage was not so close to the crown that the cable
did not pass through the critical shear zone. An unlikely
type of failure could occur if the prestress force was
sufficiently large so as to cause a compression type failure
at the corner.

58
3.4 BUCKLING
with prestressing, concrete cylindrical shells can
be built with longer spans and edge beams can be reduced
in size or eliminated completely, thus increasing the
possibility of buckling. This is because both the edge
beams and traverses offer restraint to an overall buckling
of the shell. If the span is lengthened, the restraining
influence of the traverses on the centre portion of the
shell is reduced.
Most of the formulae which have been presented50 for
the buckling of cylinders have been developed for complete
cylinders or shallow curved panels, and the majority of
tests carried out have been on metal or plastic models
whe~e the material properties are known accurately, and
where cracking is not a problem. Based on the above results,
buckling formulae 34 -have been suggested for concrete shells.
However at present little is actually known about the
buckling behaviour of concrete cylindrical shell roofs.
The present author has not investigated the problem.
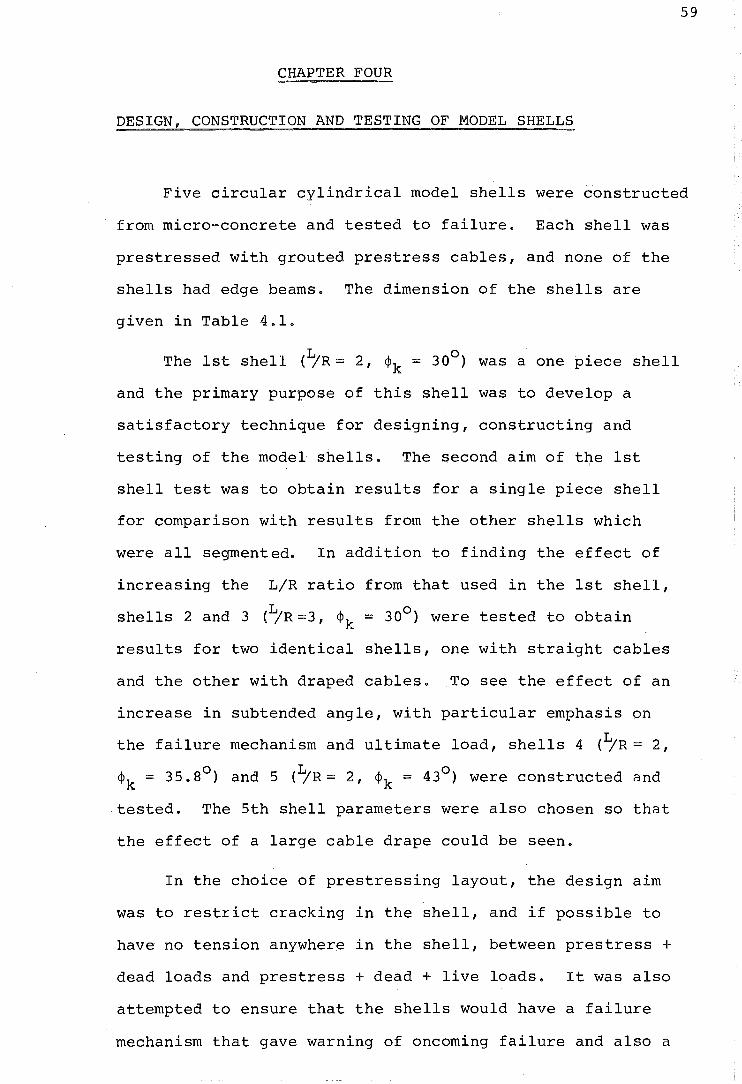
59
CHAPTER FOUR
DESIGN, CONSTRUCTION AND TESTING OF MODEL SHELLS
Five circular cylindrical model shells were constructed
from micro-concrete and tested to failure. Each shell was
prestressed with grouted prestress cables, and none of the
shells had edge beams. The dimension of the shells are
given in Table 4.1.
L 0 The 1st shell (jR= 2, ~k = 30 ) was a one piece shell
and the primary purpose of this shell was to develop a
satisfactory technique for designing, constructing and
testing of the model shells. The second aim of the 1st
shell test was to obtain results for a single piece shell
for comparison with results from the other shells which
were all segmented. In addition to finding the effect of
increasing the L/R ratio from that used in the 1st shell,
shells 2 and 3 (L/R =3, ~k = 300) were tested to obtain
results for two identical shells, one with straight cables
and the other with draped cables. To see the effect of an
increase in subtended angle, with particular emphasis on
the failure mechanism and ultimate load, shells 4 (L/R = 2,
o L 0 ~k = 35.8 ) and 5 (jR= 2, ~k = 43 ) were constructed and
tested. The 5th shell parameters were also chosen so that
the effect of a large cable drape could be seen.
In the choice of prestressing layout, the design aim
was to restrict cracking in the shell, and if possible to
have no tension anywhere in the shell, between prestress +
dead loads and prestress + dead + live loads. It was also
attempted to ensure that the shells would have a failure
mechanism that gave warning of oncoming failure and also a

60
Shell 1 2 3 4 5
R ins 48 48 48 48 48
L ins 97.625 144.125 144.125 95.0 95.0
4>k radians .5236 .5236 .5236 .625 .75
t ins .614 .625 .625 .680 .669
N 1 3 3 3 3
g ins 47.5 47.5 31. 0 31. 0
T ins 1.625 1.625 1. 625 2.0 2.0
a ins 2.5 2.25 2.25 2.0 2.0
b ins 6 6 6 6 6
c ins 1.0 1.5 1.5 1.5 1.5
p lbs 1875 2160 2160 1600 2000
lbs 0 0 0 0 0
d ins 22.8 22.8 22.8 28.0 34.0
e ins 22.8 22.8 22.8 28.0 34.0
f ins 0.0 0.0 0.0 0.0 0.0
P lbs 1790 2160 2160 1600 2000
lbs 0 0 160 0 500
d ins 18.6 20.4 15.9 26.0 20.0
e ins 18.6 20.4 20.4 26.0 30.0
f ins 0.0 0.0 4.5 0.0 10.0
P lbs 2160 2160
lbs 0 250
d ins 18.0 9.0
e ins 18.0 18.0
f ins 0.0 9.0
PL prestress loss along cable
N number of cylindrical segments
Shell Reinforcing - 1st shell, spot welded mesh, see Fig. 4.3
Dowel Bars
(lOg, 4" long)
- Other shells, 14 g spot welded mesh at l~ centres
- Between traverse and shell: at 6" centres from crown
- Between shell segments: at crown, and for shells 2 & 3 at ±15" arc distance from crown, shell 4 at ±24" shell 5 at ±28"
I Co ~ t ~----L--~----------~
...... -+- ...
TABLE 4 .1
I I
',( I R
"'<'+JV ,II "
DIMENSIONS OF SHELLS TESTED

61
reasonable factor of safety against col~apse. This latter
criterion was difficult to ensure as the ultimate load
theory was being formulated during the shell tests.
4.1 CHOICE OF MODEL DIMENSIONS
The shells to be tested were to be thin shells in the
intermediate range.
A shell thickness of 0.6" was decided upon as being
the thinnest practical size to construct the models, consid
ering two'or three layers of reinforcement and grouted
prestressing cables were to be fitted into the section.
A steel mould used by ~crivener23 (R = 48", L = 96",
<Pk = 300) was available and it was decided to use this to
get the basic shape of the shells. This gave a R/t ratio
of 80 which was considered satisfactory for thin shell
action, and the L/R ratio of two enabled a one piece,
intermediate length shell to be constructed.
In order to construct shells with a larger included
angle than 300 a new mould (R = 48', L = 32", <Pk = 500) was
constructed. The radius was kept at 48" in order to reduce
the number of variables between the shells.
A full size shell thickness of 3" was assumed and this
gave a model:full scale length ratio of 1:5. Using
dimensional analysis with Young's modulus, ti and t as I
relevant physical quantities, complete similitude of the
model and the full size shell could be obtained except for
the density, which in the model was only 75 of that required.
\

62
4.2 DESIGN LOADING AND STRESSES
For complete similitude the same load must be applied
to the model shell as to the full size shell. Thus the
model shells were designed for a dead load of 36 lb/ft2
and assumed live load of 20 lb/ft2. As the model density
was only ~5 of that required, the entire working load of
56 lb/ft2 was assumed to be applied externally to the shell
by the airbag.
A concrete cylinder strength of 4000 psi and a design
steel reinforcing stress of 20,000 psi were assumed for
the models. The reinforcement was porportioned according
to the working stress provisions of the A.C.I. (318-71)
Concrete code 40 using a modulus ratio of 7.
The prestressing steel stress was kept below 0.7 x
ultimate stress as recommended by the A.C.I. 40 • Except
for friction loss along the cables, no allowance for loss
of prestress force was necessary.
4.3 CHOICE OF SHELL
The initial decision to be made in the choice of
element is whether transverse or longitudinal elements
should be used. Transverse elements have the considerable
advantage, that prestressing cables required in the shell
to resist edge tensile forces, may be able to be used to
join the elements. However longitudinal elements may be
easier to transport and also have the advantage that areas
of potentially high tensile stress are not cut. Longitudinal
elements may, however, cut areas af high transverse moment.
Transverse elements have been used in this series of
model tests as these seem the most likely elements to be

63
used in practice. Joints have been kept away from midspan
in order to avoid areas of potentially high tensile stresses.
Longitudinal elements are, however, being used. An
American company24 is marketing prestressed, precast
cylindrical shells made of three longitudinal elements.
These elements are pre-tensioned longitudinally and have
transverse steel projecting from each element, which is
welded to the steel of the neighbouring element. These
elements come in spans of up to 100 feet and require no
formwork for erection.
4 • 4 FORMWORK
The main requirement in the design of the formwork was
that the concrete shell elements could be stripped from the
mould without undue strain or cracking. It was also necess-
ary that segments of shells could be successfully cast, and
that there be some means of holding the reinforcing steel
and prestressing cable ducts in place. The formwork also
had to be rigid enough to allow sufficient vibration for
the mortar to be compacted.
4.4.1 2 and 3
o The first three shells (~k = 30 ) were constructed
h Id ' 't' 11 db' 23 h' h d' on t e mou 1n1 1a y use y Scr1vener ,w 1C was mo 1-
fied by the author. The curved portion of the mould was
formed by rolling a 8'-0" x 4'-2" X 1/4" mild steel plate
to an arc of 4'-0", which was then spot welded onto curved
stiffener plates at the ends and centre to hold it in shape.
Along the straight edges the mould was mounted on two 6" x 3 11
angle runners which were joined by 4" x 2" channels at their
ends and midpoint to form a rigid base. Running along each

longitudinal edge of the curved mould, and bolted to the
6" x 3" angle, was a shaped 5/ 8 " x 1/4" mild steel strip
to prevent the mortar running off the edge of the mould.
Attached to each end of the base was an adjustable end
plate, bolted to the channel through a 2" x 2" X 2"
packing block. This acted as an edge to screed to and
also formed a mould within which the traverses were cast.
A 4'-4" x 2" x 1/4" plate bolted to the packing block
formed the bottom of the traverse mould. The assembled
formwork is shown in Figure 4.1, prior to the pouring of
64
two elements for shells 2 and 3. In order to allow segments
of shells to be cast, curved wooden dividing strips of
4'-0" radius and 0.6" high were cut from a sheet of 7 ply
marine plywood. These can be seen in Figure 4.1. To
prevent movement during the pouring of the mortar, a groove
was cut along the outside of each strip and a piece of No.8
gauge mild steel wire tensioned over each strip. For the
1st shell, a single piece shell, corrugated cardboard
packing was used at the ends of the steel mould to allow
for shrinkage of the shell.
4.4.2 Shells 4 and 5
The formwork used for shells 4 and 5 was constructed
froma7'-O"x 2'-8" x 1/4" mild steel plate rolled to a 48"
radius. This plate was held in shape at its end by curved
stiffener plates. Two 4" x 2" channel sections were used
to keep the bases of the stiffener plates the correct
distance apart and also to provide a base for the mould.
Attached to the stiffener platers were two curved end plates,
of slightly larger radius than the stiffeners, to provide
an accurate surface fdr screeding. Shaped sections of
5/8 " x 1/4" were again used to prevent the mortar running
off the curved surface. These were screwed onto the mould

65 o
F1G. 4·1 ASSEMBLED SHELL MOULD USED FOR SHELLS ',2&3
FIG. 4·2 ASSEMBLED SHELL MOULD USED FOR SHELLS 4 & 5.
66
and could be attached at any required arc distance. The
assembled mould is shown in Figure 4.2 during pouring of
one of the 5th shell elements. Traverses were constructed
by removing the end plates and bolting them onto a channel
section at the required distance apart. All connections
in the formwork were bolted in order to avoid distortions
which can occur during welding.
4.5 STEEL
For ease of construction and placement of the rein
forcing, spot welded meshes were used for the curved
portions of the shell. These meshes were made by a local
firm from straight lengths of cold drawn wire, fo~ which
typical stress-strain curves are given in Appendix B.l.
However, as the heat of the spot welding weakened the wire
in the vicinity of the joint, the effective stress-strain
curve was that of a spot welded wire. Typical stress-strain
curves for spot welded wires are given in Appendix B.l.
Another advantage of the spot welding was that the mesh
was given an initial curvature, thus facilitating placement
on the mould.
To position the mesh correctly for pouring, mortar
packing blocks were placed under the mesh at approximately
one foot centres as can be seen in Figure 4.1. The mesh
w~s then held onto the mould by means of 22 g piano wires
tensioned over the top of the mesh.
4.5.1 1st Shell Mesh
This mesh was designed and detailed specifically
for the 1st shell. High tensile stresses near the midspan
edge under prestress load + working loads resulted in a

large percentage of reinforcing steel in these areas.
Diagonal steel was tied under the spot welded mesh to
resist shear stresses at the corners. The mesh used
is shown in Figure 4.3. Due to a misunderstanding with
1:)(
the fabricator, the mesh was made in four parts and bronzed
together along the transverse and longitudinal centre lines.
4.5.2 Other Shell Meshes
For simplicity, economy and speed of construction
of segmented shells, it is desirable to have a standard mesh
for all elements. Thus an identical mesh, 14 g (.080"
diameter) at l~" x l~" centres, was used in the shell
cross-sections for shells 2, 3, 4 and 5. Alternatively,
two standard meshes could be used, one for the centre
elements where transverse moments and edge tensile forces
are high, and the other for the end elements where shear
stresses are high.
4.5.3 Traverse Meshes
The meshes for the traverses were made from cold
drawn bars with similar properties to those used in the
shell mesh. These bars were joined by a bronze-silver alloy
commercial preparation, "Easy-Flow". To ensure that the
traverse did not fail before the shell, the traverse reinf-
orcement was designed for forces l~ x those actually calcu
lated at design working load. Basically the traverse rein
forcement meshes consisted of 6 g horizontal bars at ~" to
1~" centres with 14 g vertical bars at l~" centres.
4.6 PRESTRESSING STEEL
The shells were prestressed with l2g (.104" diameter)
or 109 (.128" diameter) high tensile steel, the stress-

+--
4'-0" 16g
i'f-6at 2"crs.::1~01l+-12at'J crs.= "-6"
~ I I ~ ~
I I
".1
~ ~ -
~ ~ ~ ~ ~ ~ ~ ~ ~ " "- "-~ " ~ ~ 0 ~ ~" ~ ~ t\ l\ ". ~ " ~'" "" ~ ~ '\ ~ ~ ~ ~ ~ ~ ~ ~ ~ " "- ....... " '\ '" ,,'" "" '" I'-
Diagonal reinforcement -14g . at 1z!-" crs. perpendicular to bars.
~ I
: ~I I" 14g 12 at l~crs.= 1'-6/1
I
I
T t+
r.o ...!.
II rn
I (Y)
lJr.o ~ ~
N ! : T r.t
i'-.... ~
+r !fti . t ~
FIG.4·3 1st SHELL REINFORCING MESH
4g cold drawn wire mesh
0·128/1dia. prestrE?ssing wire P.V.C. sheathing USE.'d to form duet
- removed at 24 hour 5 mortar packing block
FIG.4.4 TYPICAL SHELL CROSS-SECTION
68

69
strain curves for which are given in Appendix B.l.
The prestressing steel was placed in the centre of
the shell section with the reinforcing mesh directly above
it as shown in Figure 4.4. Ducts for the prestressing steel
were formed by lengths of cold drawn wire, of the same
diameter as the prestress steel to be used, covered with a
P.v.C. tubing. The P.V.C. covered wires were positioned
by passing them through holes drilled in the end plates and
the wooden dividing strips. To maintain the wires in the
centre of the section, and to maintain the correct curve
for curved cables, the wires were also tied to the reinf-
orcing mesh.
4.7 CONCRETE MIX AND CASTING
4.7.1 Concrete Mix
In the design of the micro-concrete mix several
conflicting demands had to be met. The mix had to be of
sufficient workability so that it could be compacted and
finished to a smooth surface, but cohesive enough to stay
on the shell mould, without segregating, during compaction.
It was also desirable that the cement content be as low as
possible in order to minimize shrinkage.
Wl.'th th ' f S' 23 b' d th ' e ml.X 0 crl.vener as a asl.S, an e maXl.mum
aggregate size being determined from cover requirements ('l3
of minimum cover), several trial mixes were made. The mix
given in Table 4.2 was decided upon fu,r the 1st shell. This
proved successful and was used for shells 2 and 3 as well.
In an attempt to reduce the compressive strengths of 7,300 -
9,300 psi, but maintain the same workability the water/
cement and aggregate/cement ratios were altered slightly
for shells 4 and 5 resulting in compressive strengths of

Aggregate Proportions for All Sheils -
B.S. Sieve 7-14 14-15 25-52 52-100
% 50 20 5 25
By Weight Aggregate/Cement Water/Cement
Shells 1,2,3 2.5 0.4
Shells 4,5 3.12 0.47
Cement - Ordinary Portland Cement
Aggregate - Rivl9r Sand
TABLE 4.2 MICRO-CONCRETE MIX PROPORTIONS'
6,200 - 8,000 psi. Fuller details of the micro-concrete
properties are given in Appendix B2. Both mixes used fall . 25
within the recommendation given by Rowe .
4.7.2 Casting
A two cubic foot Cumflow concrete mixer was used
to mix the micro-concrete, Two mixes were necessary for
each mortar pour for shells 1, 2 and 3. The proportions
of all mixes were closely controlled to ensure consistency
between mixes.
For shells 1, 2 and 3 compaction was successfully
achieved by vibrating the formwork with an air-gun and a
"Kanga" hammer. Both these were hand held and had a ram
at their ends which oscillated rapidly up and down. As the
end traverses required the most vibration these were filled
first and compacted by vibrating the end plates. Mortar was
then placed on the curved surface and compacted in two layers.
compaction was achieved by holding the air gun to the under
side of the steel mould, trowels being used to keep the

1.1
mortar thickness reasonably uniform. Compacting the end
traverses and curved surface took about three-quarters of
an hour, after which a transverse steel screed, cut to the
arc of the shell top surface, was passed over the shell
three or four times. This screed sat on the 6 11 x 3" angle
runners forming the base of the mould, and was pushed along
by means of the air gun and "Kanga" hammer. Only a small
amount of mortar was allowed to build up in front of the
screed, the surplus being removed by a trowel. This
screeding left the shell with a reasonably uniform thickness.
Final screeding was carried out to the accurately machined
and positioned end plates with a 3~" x l~ aluminium T section. ,
This left the shells with a smooth surface.
Elements for shells 4 and 5 were cast on the new form-
work which was small enough to fit on an available vibrating
table. For these elements the mortar was compacted in two
layers with the vibrating table operating at 1000 rpm.
Only longitudinal screeding was used.
4.7.3 Curing and Stripping
The mortar for the first three shells was moist
cured fer 7-10 days by covering the top surface of the
shells ",ith two layers of scrim which was kept continually
damp. Evaporation was lessened by placing a piece of
black plastic over the top. The scrim was first placed
on the shell 4-5 hours after screeding was finished, to
allow the mortar sufficient time to harden, so that
crazing of the surface would not occur. Elements of shells
4 and 5 were cured for 7-10 days in a fog room.
At 24 hours the end plates, the timber blocks which
shaped the feet of the traverses, and the longitudinal

72
5/8" x 1/4" side strips were removed. The P.V.C. tubing
and wires forming the prestressing cable ducts were also
stripped after 24 hours. As P.V.C. does not bond with mortar,
both wire and P.V.C. sheathing were easily extracted, leaving
a perfectly clean duct.
The 1st shell was stripped from its formwork by jacking
up the steel mould and packing the feet of the traverse.
The mould was then lowered out from beneath the shell by
means of hydraulic jacks, care being taken to lower it
evenly to prevent the shell being damaged. Compressed air
was forced between the shell and mould to get initial move-
mente For the remaining shells, the elements were easily
slipped off the moulds. In all cases the underside of the
shells had a smooth glass like finish. Prior to casting,
the moulds were coated with varnish to facilitate stripping.
4.7.4 Variation of s
Due to the method of screeding the variation in
thickness of each shell was small. After testing, holes
were punched in the surface of the shells and thickness
measurements made with a micrometer. Variation in thickness
was generally within ±10% of the average thickness. Typical
thickness measurements are given in Table 4.3 for the 1st
shell.
TABLE 4.3 TYPICAL SHELL THICKNESS MEASUREMENTS
Equal Spacings Around Shell Arc
.663 .661 .663 .606 .616 .616 .648
.622 .624 .642 .626 .614 .689 .674
Equal Spac- .595 .615 .630 .640 .609 .628 .620
ings along .594 .622 .628 .630 .645 .641 .618 shell .530 .564 .588 .605 .590 .598 .585
.625 .586 .569 .561 .561 .560 .616
Average = .614 ins, Standard deviation = .0324 Results for 1st shell

4.7.5 Test Specimens
From each mix, a number of 411 x 2" cylinders and
12" x 6" x ~" reinforced slabs were taken. The slabs were
tested in flexure and were reinforced with 14 g l~" x l~"
spot welded mesh placed at the same depth as the shell
reinforcement.
For shells 1, 2 and 3 a number of the test specimens
were vibrated by the air gun and cured in a similar manner
to the shells. All other test specimens were vibrated at
3000 r.p.m. for three minutes on the vibrating table and
cured in the. fog room.
73
Details of the testing techniques, and results obtained
are given in Appendix B2.
4.8 PRESTRESSING SYSTEM
Considerable time was spent in developing a .suitable
prestressing system as it was required to satisfy several
demanding requirements. It was necessary that both .104 11
and .128" diameter prestressing wires could be stressed and
maintained accurately at the required load, that each wire
could be grouted, and that the system could be reused several
times. During surface loading it was desirable that the change
of load at the anchorage could be followed accurately. A
prototype system was built and tested before the final
design, detailed in Figure 4.5 was chosen. All components
were made of mild steel. The fully assembled system is shown
on the 1st shell in Figure 4.6, and a description of the
system is given in the following sections.
4.8.1 Solid Bearing Block
The bearing block was designed to be positioned
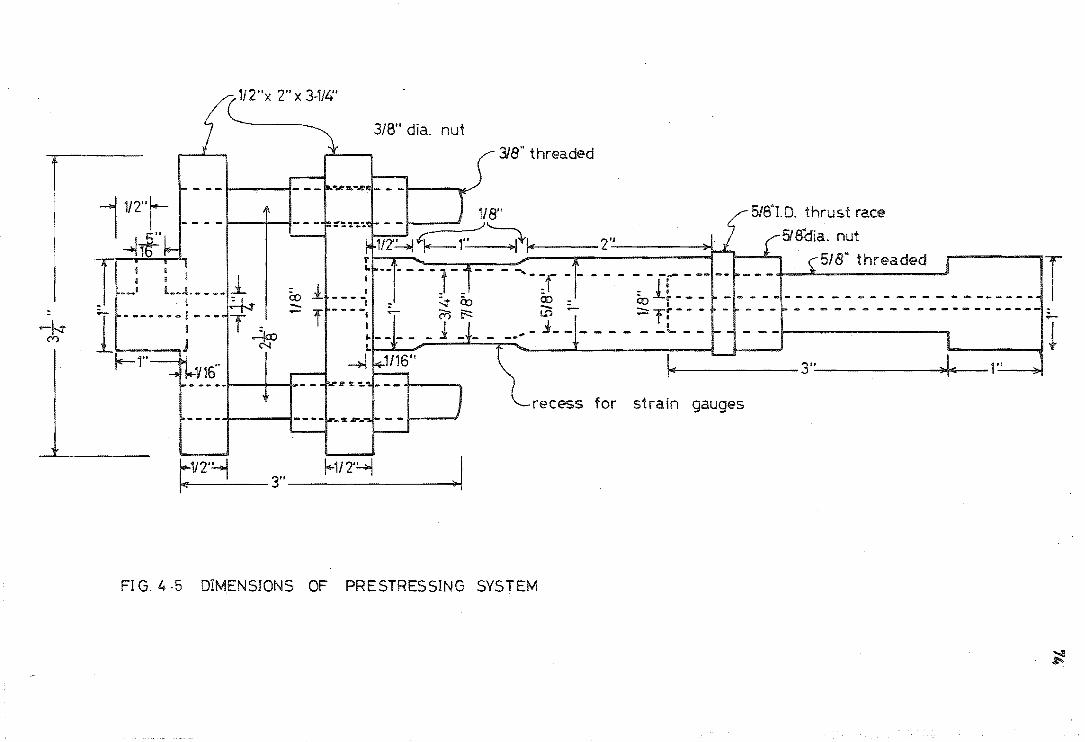
1J2"x 2" x 3~11L+'
3/8" dia. nut
f 3/8" threaded
1/8" 518"1.0. thrust race
~:~~~ ~/;~~ 1'~~"","lof ___ 2·~.J ----'30-1 518aia. nut
~·-----r ---~-T--------r----- 5'8·lhrea~d T ~ 1. -- - -: _ ~ &> 00 : &> If -- - - - - ---- -- - - - - - - - - - - - -- ----f ----I ;.- LO ...... :;;:::: Tf - - - - - - - - - - - - - - - - - - - - - - - ..-
I _ .:L _______ L _ _ I _A' ~
V 16" i"f-h------3 .. ------.-,.')"/'Ii! .. ;....--r-· -~
recess for strain gauges
~V2'4\ 3 .. __ ~_1/_2·_~ ___ ~) I
FIG. 4·5 DIMENSIONS OF PRESTRESSING SYSTEM
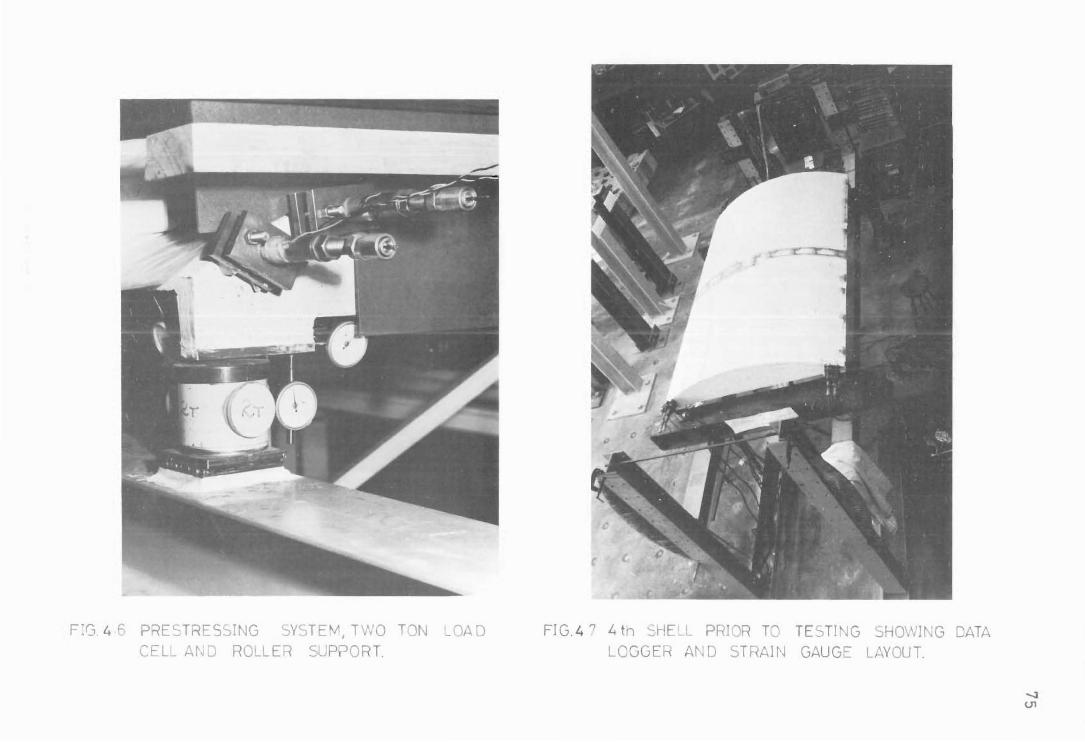
F:G 4 r PRESTRESSI G SYSTEN'I, T VO TON LOA 0 FIG .4 '7 '-t th _HE_L PRI R T TE TI~JG SHOWIt',G DATA CEL .... A~. 0 ROLLER SL.:PPORT. LOGGER A D STRAIN GAUGE L-NOUT.

76
in place over the cable duct hole, so that the main axis
of the load cell and jack would be parallel to the
wirewhere it came out of the shell. This was particularly
important for the shells with curved tendons where tapered
washers and mortar were used to pack the bearing blocks
to get the correct angle. The mortar also served to seal
the bearing block-shell interface to prevent loss of grout
during the grouting of the wires. Grout was pumped into
the wire duct through a nozzle screwed into the top of the
bearing block.
4.8.2 Adjustable Bearing Block
This served to allow any small error in the
lining up of the wire and jack axis to be corrected. To
prevent grout from spraying out, the wire was sealed with
wax or mortar where it came through the plate nearest the
shell.
4.B.3 Load Cells
The load cells were incorporated in the prestress
ing system and remained in place during the complete shell
test. Each load cell was designed to take a load of up
to 2500 Ib and still be within the elastic range of the
mild steel.
The load cells each had four active strain gauges
mounted symmetrically around the recess in the load cells,
with their main axis parallel to the main axis of the load
cell. Kyowa 120 ohm temperature compensated strain gauges
(KF - 5 -Cl-ll) were used. Adjacent pairs of gauges were
connected in series and then each set of pairs on each load
cell were connected in parallel, to give an effective resist
ance of 120 ohm.

Various strain gauge cements were tried and the two
component room setting compound Kyowa EP-18, recommended
by the manufacturers of the gauges, was found to be the
most satisfactory. Ara1dite, a commonly used glue for
load cells was found to be as good, but this glue has the
disadvantage that it requires three days of heat treatment
to get the best results. Both these glues were found to
be shock resistant and to have negligible creep under load
(2400 1bs) during a four day test period.
77
After wiring up the gauges they were waterproofed with
Budd GW-1 waterproofing compound, and then coated with
petroleum micro-crystalline wax for mechanical protection.
Lead wires to the load cells were twin twisted 7/0076"
copper wires, fifteen feet long. All load cells were
connected to a Budd P-350 portable strain indicator through
a switch box with SPI Croydon rotary stud switches. No
switch box changes in resistance could be detected. All
connections were soldered except the connection to the Budd
bridge, where horseshoe terminals were used.
To check the repeatability of readings, a prototype
load cell was cycled 80 times up to 2400 1bs over a period
of a week. It was found that the apparent strain as read
on the strain bridge gradually increased for a given load
for up to 10-15 cycles of load. From there until 80 cycles
there was negligible increase - between 20-30 ~strain
increase at maximum load. The four day creep test mentioned
above was carried out after the 40th cycle. Thus it was
decided to cycle all load cells 20 times to full load before
use.
For the 1st shell test a two arm circuit was used,
with a strain gauge mounted on a spare load cell being used

78
as a dummy gauge for all the active load cells. However,
during the calibration of the load cells for the 2nd shell
test, it was noticed that the ze:rro for the load cell altered
when the lead wires from the load cells, or dummy, were
bundled up. This zero drift did not occur if the wires from
the dummy and load cell were twisted together and then bundled
up. It was concluded that there must be some inductance
effect, and to overcome this, dummy gauges were mounted on
each load cell and the four lead wires twisted together. The
dummy gauges (KF-5-Cl-ll) were attached at right angles to the
active gauges with Kyowa CC-15 strain gauge cement. These
gauges were also protected with waterproofing compound and
wax.
Before each test, each load cell to be used was cycled
two or three times, and then three calibration runs to full
load were taken. For all load cells a straight line calibra
tion curve was obtained, and the accuracy of the load cells
was such that cable loads could be set to within 20 lb.
Three calibration runs were made on the load cells after
each shell test and these were found to give calibration
curves of the same slope as before testing, but sometimes
with slightly different zero readings. Calibration was
carried out on an Avery 25,000 lb test machine, and because
of a lag between actual and indicated load on the test machine
during unloading, calibration was only carried out with
increasing load.
4.8.4 Jack
The jacks were machined from a 1" diameter mild steel
round. A 5/ 811 diameter ball race was placed between the load
cell and the 5/8" nut which screwed the jack up and down.

79
This was to prevent wear on the load cells and to prevent
any torsion effects on the load cells, which may have affected
the load Cell readings. The jacks allowed approximately 2"
of play at each end and.this was found to be ample to take up
any slackness in the system once the cables had been anchored,
and to stress the cables to the required load. In addition,
2" movement could be obtained from the adjustable bearing
block. It was necessary to use this for the 3rd shell when
one of the ball races collapsed and the jack could not be used.
4.8.5 Anchorages
These were standard barrel and two wedge type anchor
ages which bore directly onto the end of the jack. To
prevent damage to the end of the shell, the wedges, instead
of being hammered into the barrel, were forced into its core
by a demountable mechanical device. The wedges could be
loosened by lightly tapping the barrel.
4.9 JOINING, PRESTRESSING AND GROUTING
All these operations were carried out with the shells on
the reaction frame, so that strain gauge leads would not have
to be disconnected between the sets of readings taken during
prestressing of the shell, and surface load testing.
The 1st shell was lifted into position by means of a
steel rig which supported it under the traverse at each corner.
It was then prestressed and grouted with roller supports under
the load cells allowing horizontal movement. For the remaining
shells, the segments were lifted into place on a timber rig
which supported the elements longitudinally on each side
between the crown and edge. The traverses were then fitted

80
into place, 'and then the whole shell joined with the shell
elements able to slide on the timber rig to take up move-
mente ,Prior to final prestressing, the timber frame was
dismantled and the shell placed on roller supports.
4.9.1 Joining
All segments were joined by a two component epoxy
resin "Boscrete No.lO Epoxy", the main properties of which
are: tensile strength 5,000-7,000 psi, compressive strength
18,000-25,000 psi, and flexural strength 10,000-15,000 psi. i
The preparation is commonly u~ed in construction and mainten-
ance of concrete structures.
If the surfaces to be joined were more than 1/16 11 apart
at any place when pushed together, a rotary disc grinder was
used to grind off the high spots. The surfaces were then
prepared by brushing with a wire brush and cleaning with
methyl ethyl ketone.
The shell segments were joined by coating each surface
of the joints with resin and then pulling the whole shell
together with the pair of prestressing wires closest to the
crown, to give an average compression of 100-200 psi over
the whole shell transverse cross-section. Due to the layout
of the prestressing cables it was impossible to get an even
compressive stress over the whole cross-section.
To line up the shell segments, 4" long, 10 g dowel bars
were inserted in holes in each side of the joint which had
been formed in a similar fashion to the cable ducts. The
dowel bars were anchored by filling the holes with resin durinq
the joining process, except for the dowel bars between the end
segments and traverses for shells 2 and 3. These had been

81
anchored to the traverse reinforcement and set in the traverse
during pouring. As well as helping to line up the segments,
the dowel bars were designed to carryall the working load
shear force across the joints.
From the experience of the 2nd shell where difficulty
was found in grouting the shell, each prestressing duct for
shells 3, 4 and 5 was protected at each joint from inflow of
resin by a 2" long steel shim sleeve.
4.9.2 prestressing
After the 24 hours required for the epoxy resin to
set, each shell was prestressed to its final level of stress.
This was carried out for each symmetrical pair of wires by
alternat~ly stressing each wire in small (200 lb) load indre
ments, to prevent undue eccentric forces from acting on the
shell. Initially the cables were only loaded at one end so
that the prestress loss along .the shell could be measured.
The loss along any cable was easily obtained by subtracting
the loads recorded by the load cells at each end of the cable.
No line losses could be measured along the straight cables.
When the cables were stressed to approximately one half their
final required value, each end of the cable was stressed in
alternate load increments. The line losses for the full cable
loads for use in the theoretical analysis were obtained by
direct proportion from the measured line losses for smaller
loads. Some of the measured loss was due to non-alignment
of prestressing cable ducts between segments.
Prior to grouting, minor adjustments to the prestressing
loads were made.
4.9.3 Grouting.
The shells were all grouted with a grout consisting
of three parts of cement to one part of water by weight.
The grout was forced into the cable duct at 40-60 psi
by means of a converted paint sprayer. Throughout the grouting
operation the grout was kept continuously stirred and the
flow from the delivery nozzle kept continuous in order to
prevent grout from setting in the delivery tube. Prior to
grouting all cable ducts in the shell were filled Jith water,
to prevent the duct from absorbing water from the g~out, ,and
thus causing the grout to lose its fluidity. It was found
that under water pressure, numerous leaks developed on both
the intrados and extrados. These were plugged with a dental
moulding compound similar to plaster of Paris. All cables
appeared to be grouted successfully, except in the 2nd shell,
where for some ducts it was not possible to get theigrout
to flow from one end of the duct to the other.
4.10 STRAIN MEASUREMENT
4.10.1 Strain Gauges I
Kyowa 120 ohm polyester backed wire filament strain
gauges (KP-20-Al) were used on all shells and test specimens
to measure surface strains. The gauge length of 20mm was
eight times the maximum mortar aggregate size used. This
'd ddt 'h 1 26 . . was conSl ere a equa e as CarmlC ae suggests a mlnlmum
gauge length of l~ times the maximum aggregate size.,
Except for the 1st shell, approximately 60 gauges were
mounted on each shell. These were positioned at approximately
six inch centres across the transverse centreline, and at
one foot centres along one longitudinal edge. At each gauge
position, gauges were mounted longitudinally on both the
intrados and extrados. Across the transverse centre line,

83
gauge pairs were also mounted transversely. A typical
layout of strain gauges is shown in Figure 4.7 for the 4th
shell. For the 1st shell one quarter of the shell was
strain gauged with 100 gauges. These were located at approx
imately six inch centres on four transverse cross-sections at
distances of 0", 18", 36" and 45" from the centre line.
Gauges were mounted longitudinally along the edge, both
longitudinally and transversely along the two centre lines of
the shell, while at other gauge locations 450 rosettes (KP-10-
B3) were used. At all locations, gauges were placed on both
the extrados and intrados.
The surface of the shell where gauges were to be mounted,'
was prepared with a rotary disc grinder and emery paper. This
was to ensure that the top cement layer was removed and that
the surface was smooth. The surface was cleaned with a solvent,
methyl ethyl ketone. An area of about twice the size of the
gauge was then coated with cc-15 cement and the gauge affixed
by holding it on to the surface with finger pressure for 30
seconds. Four hours were required for the cement to set
completely.
Copper terminal strips were cemented beside each gauge
with Eastman 910 contact cement, and the two lead wires from
the strain gauge soldered to the strip. These terminal strips
protected the gauges from accidental pUlling. For shells 1,
2 and 3, three foot lengths of 7/.0040" plastic insulated
copper cable were soldered to the terminal strips and then
brought to the edge of the shell where twenty foot leads of
7/,0100" twin twisted cables were soldered on. For shells 4
and 5, the heavier cables (7/.0100") were taken right to the
gauges as it was found that the insulation cover of the thin
wires was being cut on the shell edge during testing.

84
All gauges were checked to ensure that the resistance
was 120 ohm and that there were no air bubbles under the
gauge. This was done by connecting the gauge to a strain
bridge with a needle indicator and then lightly rubbing the
gauge with a finger. If any air bubbles were present the
needle would flicker. Gauges were also checked to ensure
that the resistance between the gauge and the shell was at
least 500 megohms. The resistance was normally fou:t;ld tope
between 5,000-10,000 megohms.
All gauges were water proofed with Budd GW-l water-
proofing compound. Extrados gauges were, in addition, covered
with a layer of micro-c:rystalline petroleum wax for mechanical
protection.
4.10.2 Strain Recording
A 200 channel strain data logger, manufactured for
the civil Engineering Department at Canterbury University by
Edac (New Zealand) Ltd., was used to record strains from the
shell, and can be seen in Figure 4.7. The data logger
operated on a two arm circuit and required a separate dummy
gauge for each active gauge. For the 1st shell, the gauges
6 from Bryant I s shell were used as dummies and for the other shell
tests the gauges on the 1st shell were used as dummy gauges.
A power supply to feed the gauges was built into the logger
and all circuits were kept aliv.e continually. Gauges were
connected to the logger in modules of twenty and the controls
allowed the reading of anyone gauge or group of modules.
The data logger converted voltage differences to strains, and
these could be read out onto a typewriter, tape punch or
visual display panel. Reading of the gauges could be carried
out at the rate of 1.3 seconds per gauge.

85
The makers claimed an accuracy of ±10 ~ strains for
the logger and this was easily obtained when it was operating
properly. Except for the 3rd shell, calibration of the logger
before and after each test indicated that it was operating to
within i5 ~ strains. A check was kept for erroneous readings
by connecting a Philips PR9249A/12 standard resistance box
across the first channel of each bodule of twenty gauges.
These standard boxes each had two temperature compensated
gauges mounted inside them and thus the resistance did not
change.
During testing of shells 1 and 3, zero drifts of the
strain gauges of up to 50 ~ strains occurred. This was
corrected by subtracting from each gauge reading the drift
of the standard box connected to the same module. By compar-
ing zero readings recorded during these tests, it was found
that the maiority of gauges drifted to within ±10 ~ strains
of the drift of the standard box connected to the same module.
4.11 DEFLECTION MEASUREMENT
Deflection dial gauges mounted on a 1" x 1" x ~" angle
iron frame were used to record the displacements of the shell.
This frame was bolted to the floor and was completely indepen-
dent of the main reaction frame. Dial gauges used were of
~", 1" or 2" travel an~ divided into .01", .001" or .0001"
1 divisions. Brass pads, 1" x 1" x 116", were glued to the
shells for the dial gauge plungers to bear upon. All gauges
were read, and readings recorded, manually.
Approximately 40 deflection gauges were positioned normal
to the shell surface on the intrados of each shell during
surface load testing~ These were positioned at approximately

86
six inch centres along the transverse centre line and at
twelve inch centres along both the longitudinal centre line
and one edge. Different additional cross-sections and
longitudinal sections were also gauged in each shell test.
During prestressing, except for the 1st shell, deflection
measurements were taken only across the transverse centre line.
For shells 3, 4 and 5, horizontal deflection measurements
were taken at the midspan edge. These deflection g~uges bore
against a brass strip, glued to the shell intrados, which had
been bent ddwn to be in a vertical plane. However, due to
rotation and vertical deflection of the shell edge, and
consequently of the brass strip also, the defl~ction gauges did
not accurately measure the horizontal movement of the shell
edge. They did, however, give an indication of the direction
of horizontal edge movement.
At the corners of each shell, three dial gauges were
positioned - mutually at right angles - to record the movement
of the shell on its supports. From these measurements, the
remaining deflection readings obtained were corrected to give
the displacement of the shell at each dial gauge location
relative to unyielding supports.
4.12 REACTION FRAME
The reaction frame was constructed mainly from 6" x 6" x
15.7 lb universal column. Four 7'-0" columns, placed at the
corners of a 13'-6" x 3'-9" rectangle, were joined along each
long side by lengths of universal , column, upon which the shell
was placed during testing. Each column was bolted to the
floor and each pair of end columns were tied together with a
threaded ~" diameter bar.

87
For shells 1, 2 and 3 a flat reaction deck made of 2" x
6" X 4'-6 11 dressed rimu planks, bolted to lengths of universal
column, was used. The deck was lined with 1/8 11 ivory board to
prevent the air bag being pinched by the planks. Figure 4.8
shows the fully assembled reaction frame prior to the second
shell test.
Shells 4 and 5, with larger included angles, were tested
with the curved reaction deck shown in Figure 4.9. The
reaction surface was formed from a sheet of 1/16 11 mild steel, I
shaped and strengthened with ~" plywood formers attached to
the existing reaction deck. The steel sheet was secured to
the formers.
4.13 ' LOADING TECHNIQUE
The shells were loaded by an air bag being inflated
between the shell extrados and the reaction deck. A new
airbag was constructed for each different size shell. In
order to allow for movement between the airbag and shell
surface, two layers of plastic, coated in French chalk, were
placed between the airbag and shell.
For shells with 30 0 half included angle a flat reaction
deck and 12" deep rectangular airbags were used. For testing,
an initial gap of 4" was left between the crown of the shell
and the reaction deck. This allowed for a 2" deflectioncf
the shell edge before the airbag lost contact with the shell.
However, at the very edge, the airbag tended to lift off the
shell due to the large curvature of the unrestrained side of
the airbag. This effect was minimized by timber side supports
(see Figure 4.8) made from 3/8" hardboard backed by two lengths
of 6 11 x 211 timber. The 6" x 2" timber was bolted to the

88
FIG 4· 8 REACTION FRAME USED FOR SHELLS1, 2&3_
FIG.4 ·9 REACTION FRAME USE D F OR SHELLS 4&5

89
reaction deck and could be moved in and out as required.
For shells 4 and 5, with larger included angles, a flat
reaction deck was not practicable and so a curved reaction
deck and 6" deep rectangular airbags were used. The reaction
deck was positioned 3" above the shell extrados and no side
restraints were necessary.
All airbags were constructed from a rubberized apron
material and the joints joined with Ados D2 adhesive, a one
component contact cement. Each airbag had two ~" diameter I
in·lets with one lea4ing to a water-air manometer and the
other to the control board. Air was supplied to the control
board from a compressor, throvgh a reducing valve set at 10 psi.
There were two valves on the inlet side of the control board
to allow for very fine adjustment, and one valve on the outlet.
By having a small amount of air going continually through the
valves, pressure in the bag could be maintained to within
±.005' of the required pressure. A ~u diameter outlet plug
was built into each airbag for rapid deflation.
In order to check the load on the shell as calculated
from the manometer readings, each corner of the shell was
placed on a load cell. These were all 2 ton Philips PR9226/02
load cells and were connected through a 4-arm switch box to a
Budd p-360 portable strain indicator. The load cells were
arranged with fixed, roller or ball bearing supports so that
unrestrained lateral and longitudinal movement of the shell
could take place. A 2 ton load cell and a roller support are
shown in Figure 4.6. ~u thick steel plates were attached
to the bottom of each traverse as can be seen in Figure 4.6.
Each of these had a hemispherical indentation made on it, into
which a ~" diameter ball on top of the load cell fitted. Each

90
load cell was calibrated before and after each test on an
Avery 25,000 lbs testing machine. Generally three calibration
runs were made, with the agreement between calibration before
and after the tests being within 15 lb over the whole range.
These four load cells also served to show up any non-uniformity
in the distribution of load over the shell.
4.14 TESTING PROCEDURE
Testing was carried out by three persons: one person
reading the deflection gauges and operating the data logger,
another person maintaining the airbag at the correct pressure,
and the third person recording deflection gauge readings,
obtaining and recording load cell readings, and coordinating
the test.
Initially each shell was cycled to a load of 10-15 lb/ft2
two or three times as preliminary dummy runs. Zero readings were
then taken and the shell loading begun. At each increment,
once the correct load had been applied, the deflection readings
were read and recorded. This took approximately five minutes.
Strain measurements were then recorded by the data logger on
both the typewriter and on paper tape. During this time the
load cell readings were recorded. The shell was then inspected,
any cracks or crack extensions being marked and labelled. The
load cycles to which the shells were subjected are given in
Figure 4.10. Each shell was tested over a period of approx
imately one week.
Deflection gauges were removed when they ran out of
travel or when failure of the shell appeared imminent.
4.15 EVALUATION OF YOUNG's MODULUS
Experimental values of Young's modulus, E, for the micro

N 4= :0
0 <r 0 .-l
.-l <r (5 <r a::
0 W ....... .-l n.. n.. <r
,--' I I I I
o Ob-__ ~~~~~-L~-d~~
(a) 1st SHELL
(b) 2nd SHELL
0 (c) 3rd SHELL
100
...--. . - ......, I I • I • I I I
0 • (d) 4th SHELL
3001-l-
I=-
I-
200 l-I-
i-
100 l- n l-
I=- .- j"'"I I I .-. I
I I I I
0 • I (e) 5th SHELL
.-. , I
•
.--
- - - Linear elastic load cycles
FIG.4.10 LOADING SEQUENCE FOR SHELLS.
91

92
concrete shells were obtained by testing 24" x 6" x 0.6"
reinforced slabs in bending. These slabs were supported at
their ends and loaded equally at their 1/3 points. Both
deflection and strain measurements were taken at midspan and
used to calculate E. A more detailed description of the
testing technique and the method used for calculating E is-
given in Appendix B. 2. Values of E obtained are given in
Table B.S.
From these results it can be seen that for both micro-
concrete mixes a lower average E was obtained when calculated
from deflection measurements (ED = 4.1 x l06 lb/ in2, and
5.1 x 10⁶lb/ in2) than from strain measurements (E = 4.5 x s
106 lb/in2 and 5.7 x 10⁶lb/ in2). Hence in reducing experimen-
tal strains to stresses, the average ED for that particular
mix was used; and for calculating theoretical deflections for
a shell, the average ES for that particular shell mix was
used.
Also included in Table B.5 are the values of ED and.
ES obtained for two slabs which were prestressed longitudinally
tcl an average prestress of 500 psi. These results show that
while ES remained similar to the value obtained for the non
prestressed slabs, ED increased and approached the value of
27 Neuman ,using a similar testing technique to the author,
also found that ED was lower than ES. He postulated that
ED was lower due to micro-cracking reducing the stiffness
of the slab. Whereas ED depends on the stiffness of the
whole slab, ES depends only on the stiffness of the slab at
the strain gauge. It would be reasonable to expect that the
glue layer and strain gauge would delay the formation of micro-

GAUGE STH SHELL STRAIN READINGS (\1 STRAINS) AVERAGE STANDARD No. FOR CONSECUTIVE LOAD CYCLES AT AN
APPLIED LOAD OF S6 lb/ft2. DEVIATION
1 -2 -3 1 0 -3 -1.4 1.6 2 -S9 -66 -S7 -S6 -58 -59.2 3.S 3 -104 -100 -95 -94 -96 -97.8 3.7 4 -124 -133 -112 -118 -l1S -120.4 7.4 5 5 11 12 13 13 10.8 2.9 6 -13 -21 -12 -12 -14 -14.4 3.3 7 -73 -79 -68 -67 -71 -71.6 4.2 8 -106 -110 -97 -99 -lOS -103.4 4.7 9 ~119 -119 -107 -109 -114 -113.6 4.9
10 -118 -112 -104 -105 -112 -1l0.2 5.1 11 -89 -93 -82 -90 -87 -88.2 3.6 12 -13 -15 -7 -12 -8 -11. 0 3.0 13 9 8 16 15 15 12.6 3.3 14 -136 -135 -127 -127 -132 -131.4 3.8 15 -57 -49 -41 -42 -49 -47.6 5.7 16 48 46 52 55 53 50.8 3.3 17 27 49 52 53 50 46.2 9.7 18 226 254 295 273 -101 189.4 146.9 19 -22 -19 -4 -18 -20 -16.6 6.4 20 0 3 3 2 5 2.6 1.6 21 -1 -1 -1 -2 2 -0.8 1.4 22 43 48 48 48 48 47.0 2.0 23 -54 -53 -55 -59 -50 -54.2 2.9 24 -131 -122 -119 -127 -119 -123.6 4.7 2S -127 -121 -119 -123 -119 -121.8 2.9 26 -117 -112 -115 -1l8 -113 -115.0 ,2.2 27 -61 -55 -58 -60 -59 -58.6 2.0 28 -83 -78 -81 -84 -77 -80.6 2.7 29 100 116 114 115 120 113.0 6.8 30 -131 -126 -123 -129 -121 -126.0 2.6 31 -190 -188 -184 -191 -182 -187.2 3.1 32 -217 -204 :-200 -209 -203 -206.6 5.9 33 3 10 17 14 14 11.6 4.8 34 7 13 8 2 12 8.4 3.9 35 58 63 65 65 67 63.6 3.0 36 101 105 101 102 105 102.8 1.8 37 109 113 110 112 112 111. 2 1.4 38 35 93 87 90 90 79.0 22.0 39 65 83 78 77 76 75.8 5.9 40 2 17 10 10 8 9.4 4.8 41 -2 -2 0 3 3 0.4 2.2 42 -243 -238 -233 .,.240 -234 237.6 3.7 43 -136 -135 -130 -133 -131 -133.0 2.2 44 -14 -10 -8 -9 -11 -10.4 2.0 45 25 39 32 32 31 31. 8 4.4 46 13 18 14 14 16 15.0 1.7 47 6 5 6 2 7 5.2 1.7 48 12 12 lS 16 14 12.8 1.6 49 -14 16 20 23 19 12.8 U.S SO -25 -10 -9 -10 -11 -13.0 6.0 51 -132 -135 -127 -132 -130 -131.2 2.6 52 -212 -44 -121 -91 444 -4.8 231. 0 53 -247 -234 -224 -234 -237 -235.2 7.3 54 -186 -178 -173 -181 -180 -179.6 4.2 55 -136 -126 -125 -136 -133 -131. 2 4.7 56 88 91 91 94 91 91. 0 1.8 57 -78 -72 -73 -76 -73 '""74.4 2.2 58 36 47 44 47 45 43.8 4.0 59 4 16 18 16 16 14.0 5.0 60 4 4 7 8 5 5.6 1.6
Note: Results from all gauges have been included even though results from some gauges (e.g. 18,52) are obviously in error.
TABLE 4.4 TYPICAL REPEATABILITY OF STRAIN MEASUREMENTS

94 .
cracks at the strain gauge location and thus the strain meas-
urement would give a higher E value than that calculated
from deflection measurements. The tests performed by the
author on prestressed slabs support this argument. Under
prestress load, micro-cracking is delayed everywhere, thus
increasing ED but leaving ES unchanged. A higher ED
for theoretical deflection calculations has not been used
due to the tentative nature of the above argument a~d the
variation of compressive stress throughout the shells.
4.16 ANALYSIS OF STRAIN DATA
4.16.1 Prestressing
Generally three sets of strain readings were taken
before and after the prestressing force was applied to a shell.
For each gauge the average strain, both before and after pre-
stressing, was calculated, and the difference of these averages
was taken as the strain due to the particular force being
applied. The majority of gauge readings fell within ±2~
strains of the average reading.
For the four segmented shells, the readings obtained
during the joining process were almost meaningless. This was
because the timber formwork upon which they were joined greatly
influenced the strain distribution in the shells by resisting
movement of the shells.
4.16.2 Surface Loadinq
The experimental strain data obtained during surface
loading was analysed to obtain accurate strain results for
the elastic behaviour of each shell at design working load
(561b/ft2).

Initially the strain results for each shell w~re checked
to see for which load cycles strain was' linear with load.
These cycles are shown dashed on Figure 4.10. When strain
increase was linear with load, the scatter of strain readings
from the line of best fit was normally! less than ±5 II strains
for each gauge.
When three or more load cycles were linear to 56 Ib/ft2,
the strains for each gauge due to this load were averaged and
used to obtain experimental stresses for comparison with theory.
Typical values are shown in Table 4.4, for the 5th shell.
Results for which the standard deviation was greater than
10 II strains were discarded. The linearity of the results
was then checked for each gauge by considering the average
reading at both 18.67 lb/ft2 and 37.33 Ib/ft2. If, when one
of these averages was scaled up to 56 Ib/ft2, it did not agree
to within 10 II strain of the 56 Ib/ft 2 average value, results
from that gauge were discarded. Generally agreement was to
within ± 3 llstrain.
If three linear cycles to 56 Ib/ft2 were not available,
the 56 Ib/ft 2 results for comparison with theoretical results
were obtained by extrapolating each linear cycle to 56 lb/ft2,
using results from each increment of the load cycle. The
results obtained were then averaged. For the 2nd shell there
were two linear load cycles. Any gauges not agreeing to within
lOll strains, when their readings were extrapolated to a load
of 56 Ib/ft2, were discarded. In the case of the 3rd shell,
no accurate check on the strain repeatability could be made as
cracking occurred in the first load cycle.
4.16.3 Symmetry and Reliability
Readings from symmetrical gauge positions showed that

96
all shells behaved symmetrically during prestressing and
elastic surface loading.
No attempt was made to repeat the prestressing of any
shell due to the possibility of damaging the shell or losing
the calibration of the prestressing load cells. However, one
indication that the repeatability of strain readings was good
is given by the 1st shell results (see Figures 5.1 and 5.2)
where two of the sets of results are for similar loads. More
than one set of results was obtained for the 1st shell due to
slipping of prestress cables during stressing. Also during
prestressing of the 5th shell, an outside cable failed at
full load, and upon restressing the strains were to with ±10~
strain of their former values.
For surface loading, the repeatability of the strain
readings was excellent in the elastic range. At each load
increment, the agreement between the load on the shell indic-
ated by the manometer readings and the 2 ton load cell readings
was checked. Except at low loads (up to 15 lb/ft2) the maximum
variation for any shell was 7%, the agreement often being
better than 1%. Within the elastic range for all shells, the
loads recorded on each of the 2 ton load cells were normally
within 20 lb of the average load. Strain results were discarded
from any load increment where the agreement between manometer
and corner load cells was greater than 5%, or where the load
recorded by any of the corner load cells was more than 20 lb
from the average.
4.17 ANALYSIS OF DEFLECTION DATA
All deflection readings were corrected for the movement
of the shells on their supports.

'j/
4.17.1 Prestressing
Deflection readings were taken before and after
prestressing. The difference of the corrected readings was
taken as the displacement due to that particular prestress
force.
4.17.2 Surface Loading
Deflection results were repeatable and libear before
the shells cracked. The variation between readings from
different cycles, for the same gauge, at a load of 56 lb/ft2
was generally less than 0.005".
In calculating the 56 lb/ft2 deflections for comparison 2 .
with experimental results, the 56 Ib/ft results from two
linear elastic cycles, when available, were averaged. For the
2nd shell, the deflections were calculated by extrapolating
to 56 Ib/ft2 from linear results of the first two load cycles.
Extrapolation was also used for the 3rd shell, on the first
load cycle, to obtain the 56 lb/ft2 deflection. However no
accurate check on the repeatability of the 3rd shell results
was possible as cracking occurred during the first load cycle.
4.17.3 Symmetry and Reliability
There was a slight degree of non-symmetry in all
shells. The shells behaved more symmetrically in the longi-
tudinal direction than transversely; however in both directions,
symmetrically located gauges showed similar trends.
As prestressing was not repeated no indication of the
repeatability of the deflection readings was obtained.
However for surface loading, the repeatability of the deflect-
ion measurements was excellent, despite movement of the shells
on their supports.

CHAPTER FIVE
EXPERIMENTAL AND THEORETICAL RESULTS
5.1 ELASTIC BEHAVIOUR
From the experimental elastic strains, moments and
normal forces were qalculated assuming linear elastic
behaviour across the shell thickness. In addition, for the
98
1st shell, in-plane shear forces and twisting moments were also
calculated at the rosette gauge locations. Values of actions
were averaged for symmetrical gauge locations on each shell.
Elastic theoretical results were obtained by use of the
D.K.J. computer program, described in Appendix A, and run on
the University of Canterbury's I.B.M. 360/44 computer. Three
Fourier terms were used in applying the radial surface loading.
The prestress anchorage forces were applied as rectangular
shear blocks extending 0.05L into each shell, with the simpli
fied beam on elastic foundation method of Section 2.5.5 being
used to calculate the distribution of prestress force on the
end of the shell. Line loads along the cables were considered
by dividing half of shell length into 20 transverse strips and
considering generators spaced at l~" to 3". All prestressing
terms were expanded as the sum of the first 10 Fourier terms.
5.1.1 Prestressing
Figures5.l to 5.7 show comparisons of the experi
mentally determined actions and deflections with theoretical
results.
Longitudinal Normal Force. This was the dominant action in
all shells. Agreement between experimental and theoretical

200
O~~~~-+----r---~
i 200~~~--~----~--~ I crown .25
[ 400 i c ~ 200
lj 0 gs
·5 .75 edge
'cross se<:tion X=·188L / 1---- ,. V
/. x ~
r-c--'---~.
u.. 200 .. '----...J crown .25 ·5 .75 ~ §"OO z cross section X=·375L
edge
.)
<i 200 z
~.~ "_.- "7 ~-C; ~ 0 (5
~ ~
5200 ...J crown .25
400 cross section X,,·468L
edge
)(
200 V
i :§ :f! .S IZ
../' -'- - ...
o -200
crown 25
crown ·25
......... ...-
"-_.
·5 .75
.75
~ crown ·25 .5
o :a cross sect ion X=·375Li
--
UJ lfl a::
~~-i'~- '--r---UJ > lfl Z
1---" i
L ~ crown ·25 l-I
crown ·25
; I
·5 .75 edge
edge
50 cross section X=O·O L I
I x )( I .ll
o
I 50 crown ·25 ·5 ·75 edge
.5 50 cross section X=·188 L :g UJ u a:
o x
)(
~ 50 ·25 ·75 edge crown ·5
....1
~ 50 a: o z cross section X=·375 LI
o
50 crown ·25
I x :
---. r----lx~
·5 ·75 edge
cross se<:tion X=·468 L I I
n '-....." o
50 crown
.. --f---j x-
·25 ·5 ·75 edge
.!cross section X=·188 L
I I :
i t---I I crown ·25 ·5 ·75 edge
:cross section X=.468 L'
I i x L
,
: L ~
T" , xv
'-'-
i i
crown ·25 ·5 ·75 edge
x EXPERIMENT
-- THEORY
I
1
c :::: :f! .£ I-
cross section X,,·186 L
f--- -_ .. - c .. - .. ~
edge
..... -
)( ~ .. -.. -
m crown ·25 ·5 ·75 edge :a o :a ...J .q; Z C;
cross section X=.J7~ I -,- ,-""-I
I i ~ (5 z crown ·25 ·5 ·75 edge g
j
~ :9 .!:; IZ UJ :a o
cross section X".468L/
I I I I !
crown .25 ·5 ·75 edge
crown ·25 ·5 .75 edge
cross section X=·375L
:a crown edge
crown ·25 ·75 edge
CABLE DATA
LC.~j;="=""..._ .... Ans:hQr.5l9.e e .. ccen tricity ~.Q@p~ J;.able forc:e
FIG. 5.1 1st SHELL PRESTRESSING ACTIONS AND DISPLACEMENTS

-600 ~s section X= 0·0 L
-400 i
-200
~ -o
200 crown .25
.!; 0 :9
LLI U n:
/'
fi: -600 cross section x,,·375 L -' ~ -400 e; z -' -200 « z g 0 I-
i3
:2 -z 200 g crown ·25
r
L 7
V
·75 edge
J Y
V
75 pdge
-600rc-ro-s-s-s-ec-t-ioo~X-=.~4~~L~---'
UJ <f) n: LLI
in
x
crown ·25 ·5 ·75 edge
- 50 cross sectioo X:O·O L I
o . __ ..
50 I crown ·25 :f5 edge
crown
\I) .1;
-'
-100 cross section X _ 0·0 L
o x
100 crown .25 .75 edge
0
.\;; 100 ·25 ·5 ;g crown .75 edge
w..l00 1f Ii: -' « ~ 100 0 z
LL1200 1Q crown .25 ·5 ·75 edge
~-100 z i1
cross section X= ·468 L
1 ::: .............
x
crown .25 ·75 edge
-100
100 crown .25 ·5 ·75 edge
-100 c
~ 0
UJ
1i 100 0 crown .25 u.. ·5 15 edge
ross section X= .4f?Cl L
V )..
r-x , I
.75 edge
- 001 f--+---j---+----j
O·OL--...L---L_.......L_--J crown .25 edge
z i1 I-
. g-002 F =;;;F=;;;J
j edge
iDOl f----f---I-----f----I 0.0 '--_-'-_--'-__ .l-_.,-'
crown 25 ·5 75 edge
-50 ross sectioo )( '" O.OL
OF-==~--~~~~~
50~--~--~----~--~
crown ·25 .5 .75 edge
·75 edge
crown ·25 ·5 ·75 edge
-50 cross sectioo X= ·468 L
0 j(
50 crown ·25 .5 15 edge
ro o cross section X= .168 L
50 .,;; crown ·25 ·5 ·75 edge ;g .!;-5()r-------~~ ___ ~~---,
IZ
~ 2
~ crown ·25 ;::: (f)
3i-50 I-
!cross sec lion X= ·468 L
1 5: crown .25 ·5
·75 edge
I
·75 edge
CABLE DATA , e 22·S"
0·0" b
EXPERIMENT
-- THEORY
FIG. 5.2 1 st SHELL PRESTRESSING ACTIONS AND DISPLACEMENTS
100

100"----'--- l..._----l.._---l
crown ·25 .5 .75 edge
-200;cross section
-100
UJ 100 ~ crown ·25 ·75 o LL
edge
-200r---------,---... <i cross section X= .375 ::;: g; -1001------r---1----c~""""'-----1 z
~ O~-e~~--~----+---~ Z a ~ 100 13 crown .5 z o ..J -200 cross sE'Ction X = .468
.75 E'dgE'
~ 100L--~--'----~---' crown .25 ·5 .75 edge
edge
-50 cross section X=·188L, r----------:--- I
I ... -
o -
c 50
UJ if) a: UJ
crown .25
l i l
.5 .75 edge
~ -5(J~ .. --···~---·,----~-----Z crown ·25 .5 ·75 edge « a: I-
edge
crown ·25 .5 .75 edgE' c ~-100 ross se<.tion X" .188 L
~ 0 a: o J.L,
100 <i crown ::;:
I I x
I -25 .5
x
.75 edge
g;~o'oc~~~~_v~~,--_, z l.!.J if) a:
~ z 10{)L-____ L-__ -J ____ ~ __ ___l
(!}. crown .25 .5 .75 edge I-
-100 ross section X= ·468 L
r----~--~---r--~
2QOI-----+--+----r-~~
300~-~----~--~----~ crown .25 .5 ·75 edge
-100 cross sE'ction X" ·188 L I .--+-.. -
i I
a
100 ~. I crown ·25 ·5 ·75 edgE'
.£ -100 cross section X: ·375 L !i W 0 I I ~ ~I' X ... ~, .. --\-_ .. _ ... ;
J.L, 100~--L---~-~----~ a: crown ·25 ·5 .75 E'dgE' « W J: if)
crown ·25 .5 .75 edgE'
.~ -O.O~o::.~lJ...on X= .0.0 L
~ -0.011-' ......... ...",.,;;~-~-..Q..+=:;;;..,......; Iu ~ 0.0 L-__ ---l ___ -L ____ ..J...... ___
J.L, crown ·25 .5 .75 edgE' W o ..J-0.02 :5 o (!}.-Q.O
1 00
cross section X=·308 LI 1· I
I l- I
crown .25 ·5 ·75
-5 0 cross sE'Ction X= 0·0 L
I .. -
v
I '''-
5 0 crown ·25 .5 ·75 edge
, -5 0 ross sE'Ction X= ·188 L
i-----------0
.25 ·5 ·75 edge
crown .25 ·5 ·75
-5 0 ross section X=·468 L ... _- '-'1
" I 0 i ~ 5
crown 15
IZ UJ
.5 .75
ross section X=·188 L
I ! I I I i
.5 ·75
edge
E'dge
edge
~ .-- .. .l.---::;: 50-! __ ~i ~ __ ~ ____ J _____ '
l!) crown ;25 z i= !a-50 ::: 'lcress section X".468 L! l-
I 5:
I I
! : I \..... ...
crown ·25 ·5 ·75
x EXPERIMENT
THEORY
edge
x
.-
edge
FIG.5.3 1st SHELL PRESTRESSING ACTIONS AND DISPLACEMENTS
101

-100 I I o I
: l( II l(
I I lblin
100 crown ·25 ·5 ·75 !id9l'
TRANSVERSE NORMAL FORCE
in lb/in I---+--+---!---I
~own ·25
TRANSVERSE MOMENT
-50
o v
-800
-700 ~
I I
-600
i I
-500
I I
-400
/ x /
-300
/ / -200
... -I
./ -100
o /
1"""""
Inlb/in 50
lblin
100 crown ·25 . 5 .75 edge
LONGITUDINAL NORMAL FORCE crown .25 ·5 .75 edge-
LONGITUDINAL MOMENT
CROSS SECTION X :: 0.0
-800
-600
-400
-200 lb/in
Q midspan
-50
inlb lin
)( EXPERIMENT
- TI-£ORV
~25 L ~5 L LONG] TUD(NAL NORMAL FORCE
·125 L .25 L
LONGITUDI NAL MOMEN T
x " --... ............
" \ \
375 L traverse
x
·~75 L
FIG.5.4 2nd SHELL PRESTRESSING ACTIONS AND DISPLACEMENTS
.102

OF--i-l'--lblln
100 ~ crown .25 .5 ·75 IPdge
TRANSVERSE NORMAL FORCE
-60
o Inlblln
50
I ! I I
crown .25 .5 TRANSVERSE MOMENT
50
v
""
)(
-800
-700
-600
-500
-400
-300
-200
-100
o Iblln
100
200
~ .... .. -i
.... -I
xI I
I I I
! II
I xL /
I / ...
/ I
'" ~
crown ·25 .5 ·75 II d gil' crown .25 ·5 .75 edge
LONGITUDINAL MOMENT LONGITUDINAL NORMAL FORCE
:"·15
- .1
CROSS SECT! ON
X:::O.O
-·05 Ins
.wown ·25 ·5 .75
-800
-600
-400
-200 IIllln
RADIAL DEFLECTION
X
o mid'llpan ·125 L
"
~ It
.25 L LONGlTUDI NAL NORMAL FORCE
~.
II inlblin
nO .,,""" .125 L ·25 L
LONGI TUDI NAL MOMEN T
LONGITUDINAL EDGE
x EXPERIMENT
- THEORY
CABLE DATA
.\
--.375 L
i I I I
·375 L
"" '\.x \ \
traversll'
~
t I
FIG.5.5 3rd SHELL PRESTRESSING ACTIONS AND DISPLACEMENTS
103

00 -400 .-
0 A
-300
lb/i n • 00 -200 crown ·25 ·5 ·75 I!'dge
TRANSVERSE NORMAL FORCE -100
crown ·25 ·5 .75 TRANSVERSE MOMENT
-300
-200
-100
o !b/ln
100
...-~
7 /'
/' ~
./ V
crown ·25 ·5 .75 .dg.
lblin
Q midspan
·50
A
V
;~dSpa.
LONGITUDINAL NORMAL FORCE
-50'---~----~----~----~
v in lbIin f-----J----4--_+----l
50L---~----~----~----~
crown ·25 ·5 ·75 edge LONGITUDINAL MOMENT
- 0·03,------,------,"----,----<
-0.01"..,,=~:::::===+---+--_I ins f----J-----4-~~_+~---_I 0.0 L--_~ __ __I. __ ~ __ ~
erown ·25 ·5 .75 .dg. RADIAL DEFLECTION
CROSS SECTION X: 0.0
104
..A L..7 x\
I" 1 \ \ 1 1
125 L ·25 L ·375 L LONGITUDINAL NORMAL FORCE
X X
125 L ·25 L ·375 L tray LONGITUDINAL MOMENT
LONGITUDINAL EDGE
CABLE DATA
Icabh •• 1 ']
Ancho .. Drapll' I 0" I 0" Anchoraol!' fore. 11600 Ibl Olb
x EXPERIMENT
THEORY
FIG. 5.6 4th SHELL PRESTRESSING ACTIONS AND
OISPLACEMENTS

00
v lblin
~?own
-400
-300
-200
-100
o Iblln
100
)( . )(
·25 5 ·75 edge
TRANSVERSE NORMAL FORCE
edge TRANSVERSE MOMENT
l(
/ Z
/ )IV
/' V
)(~
crown ·25 ·5 ·75 edge
iO
0 in lb/in
50
-0·05
-0·04
-0·03
0·02
-001 ins
Ir-
LONGITUDINAL NORMAL FORCE
I
I I
·25 ·5 ·75 LONGITUDINAL MOMENT
,_.
./ '!./
x/
./ ~v
.-~
00 crown ·25 ·5 ,75 edge
RADIAL DEFLECTION
CROSS SECTION X::: 0.0
105
-500r-------,--------,--------r-------
-1001---~-+-----___+----_l__----_!l
Ib/inl-----+------t-----l-----1
OL-------~-------L------~------~ midspan ·125 L ·25 L ·375 L traverS('
LONGITUDINAL NORMAL FORCE
-50r------.------,------~-----~
v
inlb/.inf------f-...... ·----+-------i------I 5QL-----~------~--------L-----__ ~ midspan ·125 L ·25 L 375 L traverse
LONGITUDINAL MOMENT
LONGITUDINAL E
x EXPERIMENT
- THEORY
FIG.5.7 5th SHELL PRESTRESSING ACTIONS AND
DISPLACEMENTS

106
-400 cross Sltction X :::0·0 L
-100 0 cross s~tion X :::0.0 L cross section X :::00 L
,t----~
-200 T I x
x a
+- """ "" b I I 100
crown ·25 50 crown ·25 ·5
.. -\ 200 c -100,-----..,----:::-:-:,-::--.. f! cross section X:::0·188L
-5 0 sect ion X", 0·188 L cross
~ •
\ ..... ~ 0 1{ I-~ Z o ~
400
0 ~ 100~ _ _L ___ ~ __ ~ ____ ~ ~ 5 ·75 edgE>;;:t crown ·25 .5 .75 edge ~ crown ·25
600 crown ·25 ·5 ·5 ·75 l!'dge
c ~ -400 ....------------,
..J ~ 400~--+--+-~ o ~ 600·~-~--~-~--..J ~ crown ·25 ·5
S _200 I I • ..... r-.....
° '-" I
... ~ I
200
cross slI'ction )( ,,0·375 L 400 crown ·25 ·5
_200r-------
2001L--~~~~-~-~ crOWn .25
x EXPERIMENT
- THEORY
~ ~ ~OO ~ -50 z z cross section X",0·375 L cross St!ction X,,0·375 L
a
100 crown
-100
0
100 crown
o Iblln
200
400
"
·25
cross
·25
x
·5 ·75 edge
·5 ·75 edge
straight edges
---
° T
I 50 crown ·25 5 ·75 edge
)(
·25 ·5 .75 edgl!'
)(/ ./
./ ~
600 midspan .125 L ·25 L ·375 L traverse
LONGITUDINAL NORMAL FORCE
-50.--------st-ra~i~--~---------,--------~
in Ibllno1r:====t:= 50'L-----~-----~--------~-------~ midspan ·125 L ·25 L ·375 L traverse
LONG I TU 0 I NAL MOMENT
FIG.S.SCa) 1st SHELL SURFACE LOADING ACTIONS AND
DISPLACEMENTS
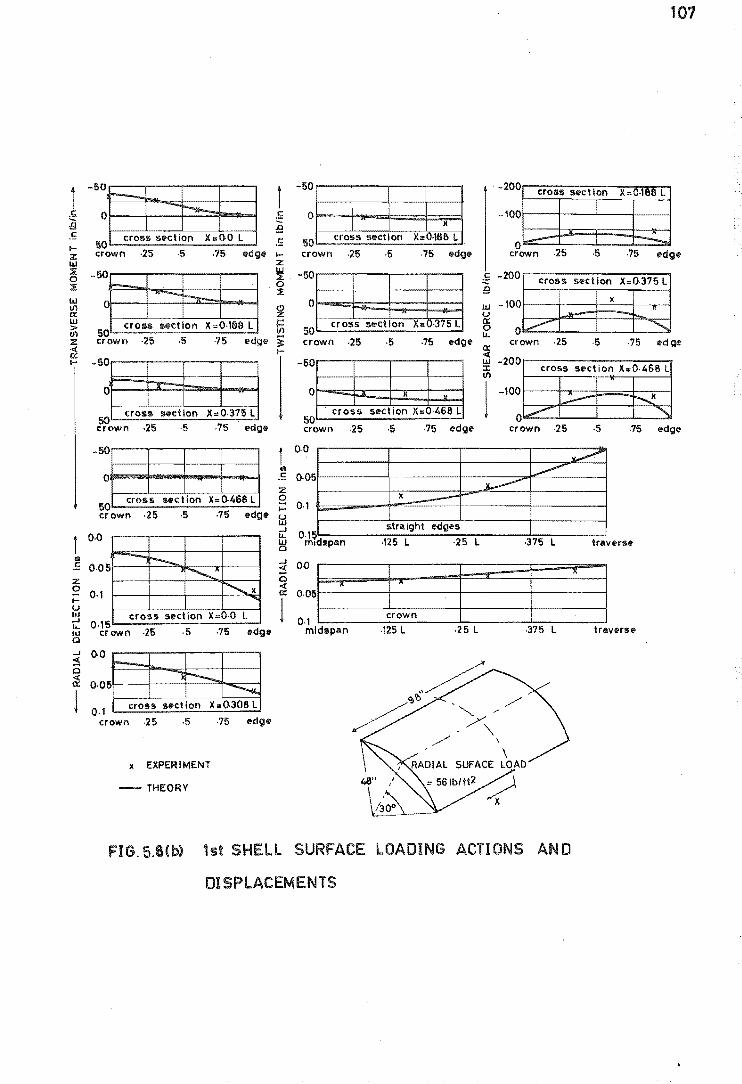
1 -50
.!; 0 ;g
-~ cross s~c tion
50 crown
X .. Q.O L
·25 ·5 ·75
crown ·25 .75
-50
° )( v
cross sect ion X .. O·468 L 50
crolls s.ction
IJJ U a: o LA..
~
IX: crown
I
.25 ,5
·25 ·5
)(=0·188 L
-=-,75
·75
~ -200 J: If)
cross sect ion )(=0·468 L
1 -10: -- -....! ~ ""
101
crown ,25 ·5 crown ·25 ·5 ·75 e-dg<!
50
I
I r,,1 cross Hctlon X=Q.468 L ~'
crown ·25 ·5 ·75
0·0
•l!_ 0,05 z o 0.' I-U III
I -'r-- I
.,--.........," I ~x I
cross sltction X",O·O L
t ().o
III
.!:: 0·0 z § 0·1
lrl ~ 0·, \!:l midspan
~
x
straight
·125 L
~ ~
~ -f'dges
·25 L ·375 L
g O~ ~~::::~::====::~~~~==~::::~::~ « IX:
! 0·, ~------~~------~~----~~~----~ .75 IIIdglll midspan Ir .. " .... , ..
~ 0·15 III crown ·25 ·5 Cl
...J Q.O :! Cl -~ "--" -...,., 0·05
j 0·1 cro!l!!l $4IIcllon X.Q.3011 L
crown ·25 ·5 ·75
x EXPERIMENT
- THEORY
L SURFACE LOADING ACT! ONS AN 0 FI 5.SCb) 1st
DISPLACEMENTS

_IlOO
-400
o Ullin
400
800
1200
.............. _"
"" 1'. "-'\
'\
~
1600 crown ·25 ·15
LONGITUDINAL NORMAL
_200
o Ib/ln
400
800
1200
1600 mldsp;an
str;aight ~!i!es
-------. .125 L ·25 L LONGITUDINAL NORMAL FORCE
108
~
---..... ~
.375 L
-100
_100
1
I ~:;~",:,,;,~f-~~~~~~~;;;;;~l~t:r_ilIx_I!i!;h;t;~~:!i!_:1I_s;;;;~~~~~~~~~sx~~~~;~~~~~:::::::j'
~L.ds-p-il-n-----. ....112-S-L -----..J..2-S-L------. ..i.37-S-L-----t-lraverse X
o Ib/ln
100
A
X
crown ·25 .5 ·75 ~gll
TRANSVERSE NORMAL FORCE
I"~/:] I· I· 1 · ~ crown ·25 ·5 ·75 Il'dge
LONGITUDINAl MOMENT
,"~:~Etf11 crown ·25 ·S ·75 edge
TRANSVERSE MOMENT
Q.{)
Inll 0.1
0·2 - -I'---x
0.3 crown .25 ·5 .75 edge RADIAL DEFLECTION
LONGITUDINAL MOMENT
'"~l,---· -----L.-r'~1 ~:=: __ . ~-------L-i~------"B midspan ·125 L ·25 L ·375 L traV<IIrS4P
RADIAL DEFLECTION
RADIAL DEFLECTION
LONGITUDINAL SECTIONS
CROSS SECTION X:O.O
EXPERIMENT
THEORY
FIG. 5.9 2nd SHELL SURFACE LOADING ACTIONS AND DISPLACEMENTS

-800 I -.... K ... -
""""--400
0 Iblln
i,J) 0
straight edglls
~ ..-~
60 O~----··· - ~ .... - 1------o Ib/in
400
soo
'\ .'\
'\ x\
1200 crown ·25 .5 ·75 CKlglt
LONGITUDINAL NORMAL FORCE
-I 00
0 Ibfln
:I'd lin 120
m $P
,~ 1 0.0 crown ·25 ·5 ·75 E'dglt Ins
TRANSVERSE NORMAL FORCE
-50
0 in Ibl In
.,,' crown ·25 ·5 .75 E'dgli'
LONGITUDINAL MOMENT
0.1
0.2
0.3 mlmpan
11
·125 L .25 L 7 J 5 L
LONGI TUD INAL NORMAL FORCE
·125 L L LONGITUDINAL MOMENT
straight E'dgn ---x __
K X --- i
.125 L 25 L .375 L
RADIAL DEFLECTION
~
~
0.0 ins crown ----'- --v
In lbl In
50 ·25
TRANSVERSE MOMENT
0.0 Ins
0·1
0.2
I---
I-~ /I
0.3 crown ·25 ·5 .75 li'dgl!
RADIAL DEFLECTION
CROSS SECTIONX:O.O
x EXPERI MENT
- THEORY
0.2
I I -I
I
I ·125 L .25 L
RADIAL DEFLECTION
LONG! TUDI NAL SECT IONS
\ RADIAL SURFACE~~
'1'" : 56lblft2 /
~~_ X
...----·375 L
FIG.5.10 3rd SHEL L SLRFACE LOADING ACTIONS AND DISPLACEMENTS
109

-200
o Ib/in
200
400
,.. ~_w
"'-."-
'\. '\
~
-200r---------------------------~------~
O~------_r--------+_------~----~~
Iblll~----+
200r-------~--------+_---~-_4~----~
600 OOO~-------L--------L-------~------~
110
crown -25 ·5 ·75 edge midspan ·125 L ·25 L ·375 L traverse LONGITUDINAL NORMAL FORCE LONGITUDINAL NORMAL FORCE
-100..---........,-----,.--.....,...--.... 50
0 Ib/in ,IL -. inl
100'----.......... ------l.----.L----l 50 crown ·25 ·5 ·75 edge midsp'an
TRANSVERSE NORMAL FORCE
0r-~~-T1=~~~~ in Iblin I-----I------+-----+--'~"..:.:j
50L---~-------l.-----.L--__ _J
crown ·25 ·5 ·75 edge LONGITUDINAL MOMENT
-50
o Inlb/in
50
---r-.. v --crown ·25 ·5 ·75 edgt'
0·0 ins
TRANSVERSE MOMENT
0·05 1-----1------+:....., .. --+-----.1
o . Hi '--__ .......... ____ -.l.. ____ --'-__ ...!
crown ·25 ·5 ·75 RADIAL DEFLECTION
CROSS SECTION X::: O· 0
)( EXPERIMENT
- THEORY
-0·05
0·0 ins
Q·05
0·1
0.15 1
midspan
strGlight edges
·125 L ·25 L ·375 L
LONGI TUDI NAL MOMENT
straight eodgl!'s
II ....".
II ~ -~ --~25 L ·25 L 0375 L RADIAL DEFLECTION
,125 L ·25 L ·375 L RADIAL DEFLECTION
LONGITUDINAL SECTIONS
RADIAL SURFACE L~AD J = 58 Ib/ft2 \
x
FIG.5.11 4th SHELL SURFACE LOADING ACTIONS AND
DISPLACEMENTS
x
......... ~
traverse
-:7
traverse
traverse

-20 0
v Iblin 200
0 60 crown
" .. "
A
Ibl In
-r- ~ ,,-'\. ~ ~
\ II
.75
LONGITUDINAL NORMAL FORCE
l!
)( A
·25 ·5 .?IS Clog TRANSVERSE NORMAL FORCE
-200
o Iblin
in
200
400
600 midspan
-::JAJ
.. ::: .--.--'
111
s.tralght edg£'s x
L i ~
\l.~1"'"
~ ~
·125 L .25 L ·375 L LONGITUDINAL NORMAL FORCE
;tr~lil~ l!
-'L
·125 L ·25 L ·375 L Ira
LONGITUDINAL MOMENT
0·0 Ins straight Itdges AL
in Iblln°t==::t==~t~~f::::~;j 0·05 L
.,n
·25 ·75
LONG I TUDINAL MOMENT
TRANSVERSE MOMENT
().O
inll
~
0·05
0·1
0·15 I
0·20 crown
..............
II"'" ~
"-~
·25 ·5 .75
RADIAL DEFLECTION
""-
CROSS SECTION X = 0.0
)( EXPERIMENT
- THEORY
~
..... 1-"'" ~
""'" V 0·1
0·16 L.---
·125 L ·25 L .375 L
RADIAL DEFLECT ION
-O'Y cro\\it"l
0·0 -11 -x
InII
I !!;.'d .. , mi_.lpan ·125 L ·26 L .J75 L I RADIAL DEFLECTION
LONGI TUD! NAL SECTIONS
FIG. 5.12 5th SHELL SURFACE LOADING ACTIONS AND
DISPLACEMENTS
"
traverse
I
tra

112
results was generally good, both along the longitudinal edge
and across the midspan cross-section.
For the 1st shell where experimental results were obtained
for other trqnsverse cross-sections, experimental and theoret-
ical results also showed good agreement. Near the traverse it
can be seen that the theoreti<pal solution underestitpates the
peak values. This is due toithe method of applying the
anchorage force over1a finite distance. (O.05L). I
Longitudinal and Transverse Moments. For both the longitud-
inal and transverse moments there was considerable experimental
scatter because the moments were calculated from the difference
of two relatively larg.e numbers (Le. strains). However, both
theory and experiment show the same trends and indicate that i,
the moments are small for most of the strain gauged! positions. I ,
Transverse Normal Both theoretical and expe~imental
forces are small. E~cept for this, there is little agreement
between the results. Theory predicts negligible N2 across
the midspan cross-section, while experimental results indicate
a small positive transverse force near the edge.
In Plane Shear Force and Twisting Moment. Experimental
values of both N12 and M12 are calculated from the strains
of six separate strain gauges and thus are very susceptible
to error.
Except at midspan where N12 is zero, the agreement
between theoretical and experimental results is not good,
especially as the traverse is approached.
M12 is given as being negligible by both theoretical and
experimental results over most of the 1st shell. However where
twisting moments do occur, theory and experiment often give a

113
different sign for the moment. Moments are small in both
cases.
Deflections. Experimentally determined radial deflections
show the same trends as theoretical values, although for shells I
I
1 and 5 experimental deflections tend to be greater: This
could well be due to incorrect determination of Young's modulus.
5.1~2 Surface Loading
Experimentally determined actions and displadements I
I for surface loading are compared with theoretical values in
'k Figures 5.8 -Co 5.12. Ii'
Longitudinal Normal Force. As in the case of prest~~ssing, {
Nl was the dominant action in all shells during surface load\
ing. There is good general agreement between experfmental and
theoretical results. At the midspan edge experimental
results tend ro be about 10% higher than theoretical values.
I
Longitudinal Moment. ,I
There was good agreement between .
theoretical and experimental values of Ml except near the I
traverse, where the stiffening effect of the traverse is
• I
clearly eVldent in the experimental results. In the theoret-
ical solution the shell is assumed to be free to rotate about
the traverse and thus the theoretical Ml is zero along the
traverse. However, in the actual shells, the traverse stiffI
ened the shells, resulting in a relatively large negative ~11
I
at the corner~ which progressively changed around the arc to
a positive moment at the crown.
Transverse Moment. Across the transverse centre line there
is good agreement between theoretical and experimental results
for M2 . From the 1st shell results, there is a tendency for
the experimental results to be slightly lower than theory as

114
the traverse is approached.
Transverse Normal Force. As for the prestress loading results,
there is little similarity between theoretical and experimental
results for N2 ' except that both are small. However, general
trends are clear. Theoretical N2 values across the midspan
centre line indicate a compressive force near the crown which I
diminishes to zero at the edge. Experimentally N2 is ~iven ,
as tensile near the crown and progressively changes;to comp-
ression at the edge,
The difference between theory and experiment would appear
to be due to the effect of skin friction on the shell as the
airbag expanded. This is supported by the fact that the
difference was reduced in shells 4 and 5 when a shaped reaction
deck was used which results in the airbag requiring less expan-
sion to conform to the shell shape. Also, in the 1st shell
the difference lessens as the traverse is approached due to
the restraining influence of the bag end.
In Plane Shear Force and Twisting Moment. Experimental N12 I
and M12 actions were only obtained for the 1st shell and
these show the same trends as theoretical results. For N12 ,
experimental values tend to be 50% higher than theoretical
results. At midspan, M12 experimental values are higher than
theory, however, at the traverse the situation is reversed.
Agreement between theory and experiment for N12 and M12 is
better for surface loading than for prestressing.
lections The agreement between theoretical and experi-
mental radial deflections is good except for shells 2 and 3
where experimental deflections are greater than theoretical
values. Across the midspan cross-section of these two shells

115
experimental deflections indicate that the shells are flatten
ing towards the edge, a trend which is not shown by theory.
As the deformation of the traverse itself was not consid
ered, experimental deflections along the longitudin~l centre
line tend to be greater than theory.
5.2 POST ELASTIC BEHAVIOUR
With increasing surface load, cracking of the shells
began, causing strain and deflection non-linearly •. Strain
measurements taken in tensile zones were particularly influen
ced by cracking.
5.2.1 Change in Neutral Axis position
Using the strain measurements from strain g~uges in
compression along the transverse centre line the position of
the neutral axis (position of zero longitudinal strain) at
midspan could be plotted, almost up to failure, for each shell.
For the final load cycle of each shell, the movement of the
neutral axis can be seen in Figure 5.13, where the midspan
longitudinal compressive strain has been plotted against
depth below the top of the crown. It can be seen that for all
shells the neutral axis depth decreased with increase in load
as would be expected in beam like behaviour. Figure 5.13 also
shows that for shells I, 2 and 3, (¢k = 300), the strain above
the neutral axis is linear with distance above the neutral
axis. For the 4th shell (¢k = 35.80" the initially non-linear
curve becomes linear towards ultimate load. However for the
5th shell (¢k = 43 0) the strain remains non-linear with
distance above the neutral axis throughout the whole load cycle.
5.2.2 Cracking Patterns
The progression of cracking in the model shells is

116
/1 ! .....
~.:-i",,:," __ ._., .. -
.,-...
I ~ .. , .. :;,; ..•. ~ -.:::?'"
~ _.0 ••.. ~.- ---V f.---- - /'
-""'~ '"""" V u E 56th/ft2 1--- 1/ - _ F 561blft2
./ - ....... F 75tb/ft2
I ----+-F 871b1fi2
~ 2n
1
d SHELl(U~~3, .,30o~
300 200 100 o -100 -200 -300 -400 -500 .600 Ii strain
L4 ~ .. ........... ---;;;;:-:: .: ~- '. • ;:.1._ ""1-................ .:,:-: .:.:..~--.:.. ~-.::----~ i
...... __ i- "'''-
/' V I I -- /' I 1
n E 561blft'
/" - F 561b/ft2
- ...... F 871b/tt2
./ • - • -D··· F 971b/ft 2
~ 3rd SHELL ( tJR=3 •• k=300 )
I I I I
7 400 300 200 100 o -100 -200 -300 -400 .500 -600 .700 -800
Ii strain
0 0 I" "'-," . .0- ---~-'\. to, ..!.o
c 2 ~
b 3 3: .
£ " '" .0
8-uP .~~ ~
iii 7 v -... II >
9
10 1
iii ,§2 c ~ 3 ... ....
I ~ 4 I 0
, }is , , ~6 c J! :6 7
~8 ;:
~ 9
I - woo ~.~w."" ~: ::..-:;:, l,...- 1 .. ,
:;;:::: ~ ;I / "
;./ I i /' )
/ II E 62 tb/ft 2
:/ - -F621b1ft 2
"" - . it- F 125lb/tt2
/' --- --11·- f156lb/tt2 - .. _*- F 1811blft2
./ 4~ SHELL (~/R=:Z, cIlki3S'S")
10 300 200 100 o -100 -200 -300 -400
11
12
13 100
E - shfolls untrackE'd
F- final load cyclE' all she-lis crackC!d
Ii strain
0 -100 -2001.\ strain
~ ~""+---fi.-lI----+---+----+----I.---. ..--------<~----l ~.E ~~4~~r'~~---+---+---~!J!
~ 5~~~-~---+---~---+--e ~ 6~··-+--~--,---+---+--...
01> > 7L--L_L--L~_~~ __ ~~_L--L_L--L~L-~~_~~
100 o 100 Il. strain
200 300 400 500 600 700
FIG. 5.13 MIDSPAN VARIATION OF LONGITUDINAL STRAIN WITH DEPTH BELOW CROWN

117
shown in Figure 5.14.
Cracking of all shells began at the edge in a transverse
direction, near midspan, at approximately design working load.
These cracks, particularly in the 1st shell, tended to start
at and follow the transverse reinforcing steel.
At approximately working load in the segmented shells,
cracking also began at the joints between the curved segments
due to the lack of tensile reinforcement at the jOihts. 'These
cracks occurred in the mortar rather than the epoxy~resin and
• I
were the only cracks to continue to open not~ceably!once 1
formed. This was because of the lack of effective grout in
I the joint region due to the metal tube used to prevent epoxy
I
resin from flowing into the prestress duct during jbining. I
On unloading from a load of three times design l load
• • I i dur~ng the 5th shell test, long~tud~nal cracks along the
crown of the shell occurred on the intrados. As the moment I
due to prestressing was a sagging moment, these cracks would
be expected if the bending resistance of the shell section to
sagging moments was sufficiently reduced. ~
This red~ction was !
presumably caused by longitudinal cracking on the extrados.
5.2.3 Recoverability from Overloads
No significant permanent set was observed in:any of
the shells on unloading from any of the loads. The shells
were loaded to and unloaded from the following percentages of
their ultimate loads; 1st, 64%; 2nd, 87%; 3rd, 88%; 4th, 75%;
5th, 58%. Only in the 4th sh~ll at 90% of ultimate load was
there any noticeable yielding of a shell.
5.2.4 Deflections
Deflections were linear and repeatable until approx-

\
a) 1st SHELL INTRADOS - extrados similar AT FAILURE
INTRADOS
EX TRADOS
b) 2nd SHELL AT FAILURE
INTRADOS
EXTRADOS
c) 3rd SHELL AT FAILURE
---before fail ur e
....... during failure
--- before failure
- . - during failure
-- before & during failure
--- before failure
.• - - - during failure
--- before 8. during
failure
FIG.5.14 CRACK PATTERN OF FAILED SHELLS
118

INTRADOS AT 124 Iblft2
.. :~ :<.~-~~::~
, " ,:~~\
INTRADOS AT FAILURE
--- before failure;··· •.. during failure
INTRADOS AT 156lblfl2
INTRADOS AT FAILURE
--- bE'foreo failure ........ dur ing fail ure
d) 4th SHELL
--
5th SHELL
INTRADOS AT 1971blft2
EXTRADOS AT FAILURE
INTRADOS AT 250lb/ft2
EXTRADOS A1 FAILURE
FIG. 5.14 CRACK PATTERNS OF FAILED SHELLS
119

120
imately the onset of cracking after which shell stiffnesses
reduced. A typical load versus deflection graph is shown in
Figure 5.15. On reloading the shells after cracking had
occurred in a previous load cycle, the load-deflection curve
was linear and the same as for the uncracked cycles until the
cracks began opening. From this position on the load-deflection
plot, the curve took a linear path to the highest load deflec
tion position reached in a previous load cycle. With further
increase in load the curve became non-linear and extended the
non-linear curve from previous load cycles.
The deflection of the transverse centre line cross
section for each shell is given in Figure 5.16 for increasing
loads during the final cycle of each shell. It can be seen
that even at high loads the deflection across the midspan
centre line remained reasonably symmetrical. More detailed
discussion of these graphs is given in sections 5.2.6 and
5.2.7.
Along longitudinal sections, the radial deflection was
symmetrical. There was a relative flattening of the central
portion for all shells which was due, in part, to the inward
rotation of the traverses towards e~ch other.
Horizontal deflections at the midspan edge for shells
3, 4 and 5 are shown in Figure 5.17. Initially all shells
deflected inwards and for shells 4 and 5 continued inwards
once cracking began. However for the 3rd shell (smallest $k)'
with the onset of cracking horizontal movement occurred
outwards.

150
<D 3rd to last cycl. up ® 2nd to last cycle up @ 2nd to last cycle down
® tina I cycht up -;----------.b''------;
I
100 r-----++-f~~+_----_+----__4 radial load
Ob/tt2)
Expe>rimental 'Ioad
deflt'ction curVIHI 1111
501---lJ..-,f-J.-1-+-- m.asufed 14" up from
edge at midspan on
5th sh.lI.
0.2 0·4 0·6 0·8 radial dl!'fleoct ion (in s. )
FIG. 5.15 TYPICAL SURFACE LOAD VERSUS DEFLECTION CURVE
o
0·2
56
o·
O. radial d.tln. (ins)
O·
1·01---------+_-------1
87
1·4.1.....------+-----------edg.
(b) 2nd SHELL
Or-------------r-----------~
O.:~~----~==~~::=_------~_t radial
de>fln. 0&---=---------...,------~lJ;;;:__I ( Ins)
0·7\----------i------+--I
0·11--------.--------+--1
O.·~---------4-----~---I
175 1·01.....------1----------' .dgl!' crown edge FIG. 5.16 (a) 1 st SHELL
Or------------+------------,
O.
().
radilll defln. (Ins)
O.
0
94
1·2 !.---------l!"'"""'------.dg.
(c) 3rd SHELL
FIG. 5.16 RADIAL DEFLECTION ACROSS TRANSVERSE (final load cyclf"s)
CENTRE LINE
121

radial deflect ion (ins)
'.21..-------~,._-_r_---------.....I edgE' cr n
(d) 4 th SHE L L
-O.2r------..;........-----+-----------....
radial deflection ( ins)
o
1.41...-. ___________ +-___________ ..J
edgfr (.) 5th SHELL
FIG. 5.16 RADIAL CENTRE
cr wn
DEFLECTION LINE
ACROSS TRANSVERSE
122

200--------~------~--------
150 r--------+------~-~------~
.-... N ..... ~1 00 t---~~-+-___4 ..a
"0 I1S o
5 0 t--I--+---t-~
0·2
o·
.-... N ---.D .:::::. 75
"0 I1S 0
.~ 50 'U I1S ...
horizontal deflection (ins)
25r-----~------+------4--4-~
• outwards - inwards
o~ ____ ~ ______ ~ ______ &_ ____ ~
-0·06 -0·04 -0·02 0·0 horizontal deflection
FIG. 5.17 HORIZONTAL DEFLECTJONS ins ) (at midspan eodge )
FIG. 5.18 FAILED 5th SHELL
0·02
123

5.2.5 Experimental Failure Mechanisms
1st Shell ($k =300, L/R = 2). The 1st shell failed suddenly
and without warning at a load of 175 Ib/ft2, by fracture of the
prestress wires at midspan on one side.
Prior to failure, transverse cracking had extended into
the shell, leaving only the central third uncracked. However
no cracks had opened appreciably. No cracking of the traverse
occurred during the test.
2nd Shell (Pk = 300, L/R = 3). Failure in the 2nd shell
occurred gently over 10-15 seconds at a load of 94 lbs/ft2,
by flattenin~ of the cross-section midway between midspan and
one joint (L/3) , followed by diagonal cracks radiating towards
the traverse from the failure region. The crown of the shell
came down almost to the level of the edges, and on examination
crushing was evident on the extrados above the failure region.
Neither prestress steel nor reinforcing steel had fractured.
At failure vertical cracks appeared at approximately 6"
centres in the traverse nearest the failure region. Also at
this traverse a small crack developed at the joint between
the traverse and shell surface as shown in Figure 5.14(b).
It is interesting to note that as the reaction deck was
being removed the shell was knocked slightly, resulting in a
large bang and the shell assuming its original shape. This
would indicate that little or no yielding of the prestressing
cables had taken place.
3rd Shell ($k = 30°, L/R = 3). The failure mechanism in the
3rd shell was similar to that of the 2nd shell. Failure
occurred slowly at 103 Ib/ft2 by flattening of the cross-section
at midspan. Crushing of the extrados above the failure region

125
was evident.
Before failure vertical cracks at approximately 6"
centres had been observed in both traverses.
4th Shell (tk-= 35.80, L;R= 2). The 4th shell was the
only shell where noticeable yielding occurred. Yielding began
at a load of l8llb/ft2 • At a load of 200 lb/ft2 the shell
continued to deflect without taking any increase in load,
resulting in the joi~t cracks opening up until the prestress-
ing wires failed at a joint. There was no apparent crushing
anywhere on the shell surface.
Vertical cracks appeared in the traverses at 180 Ib/ft2
I and by maximum load had spread across the traverses.
o L 5th Shell (CPk = 43, iR= 2). Failure of the 5th shell
occurred suddenly at a load of 293 lb/ft2 by a transverse
bending failure of one half of the centre shell segment as
shown in Figure 5.18. Prior to failure the shell had
deflected approximately 3" vertically at the edge ih the
centre section.
Vertical cracking of both traverses began at 130 lb/ft2.
5.2.6 Comparison Between CPk = 300 Shells
Across the midspan transverse cross-section (see Figure
5.16) all three shells deflected more at the edges than the
crown under low loads. However, once cracking had occurred
during previous load cycles, the 12'-0" shells regained their
original shape at approximately 60 lb/ft2 load and from this

126
load until failure the crown deflected more than the edges.
For the 8'-0" shell however, deflection at the edges was
always greater than the crown until failure, when the shell
regained its original shape.
The two 12'-0" shells were identical except that one,
the 2nd shell, had straight cables and the other, the 3rd
shell, .had draped cables. Close similarity in behaviour
between the two shells occurred. The 2nd shell, however, was
stiffer at low loads due to it having a greater prestress
force near the edge~ At higher loads the 3rd shell was stiffer
due to the draped cables retarding the development of cr~cks
and also because of the lack of effective grout in the 2nd
shell. This caused fewer but wider cracks to occur in the
shell as can be seen in Figure 5.l4(b).
In the 12'-0" shells the prestress steel at midspan was
positioned at the same effective depth. This resulted in the
shells having very similar ultimate loads.
5.2.7 Comparison Between 8'-0" Shells
For similar loads, the largest deflection at the
midspan crown for the three 8'-0" shells tested occurred in
the 1st shell (¢k = 300), which had the smallest half included
angle. For the 4th o shell (¢k = 35.8 ) with increased
the deflection was less and for the 5th shell (¢k = 43 0) with
even larger ¢k the crown actually rose. At low loads the
greatest def~ection across the midspan centre line was at the
edge for all shells. This trend continued at high loads for
shells 4 and 5 but not for the 1st shell which regained its
original shape at failure.
with increasing ¢k there was an increase in the ultimate
load per unit area ;(and hence also the ultimate load per unit

127
length along the shell). This was mainly due to the increase
in effective depth of the prestress tendons.
By comparing shells 4 and 5 it appears that corner
diagonal cracks are delayed by draped cables.
5.2.8 Comparison of Shells With and without Edge Beams
In order to counter high tensile forces near the shell
edges, reinforced concrete cylindrical shells are built with
relatively large edge beams. These edge beams also serve to
reduce deflections to an acceptable level. Concern has been
expressed that in prestressed cylindrical shells where edge
beams are eliminated, excessive deflections may occur.
Although larger deflections will occur for a prestressed
shell without edge beams, than for a similar size reinforced
shell with edge beams, the difference may not b~ as large as
an elastic analysis would indicate. This is because for
prestressed shells, the cable layout can be designed to
prevent cracking up to working load, and thus the whole
cross-section will be effective in resisting deflections.
For reinforced shells with edge beams, however, cracking will
occur before working load is reached and thus the effective
stiffness is, not that of the whole cross-section. Figure 5.19
shows a comparison of theoretical and experimental results for
o the 3rd shell (L = 8'-0", R = 4'-0", <Ilk = 30 ), a prestressed
shell without edge beams, with a similar size reinforced shell
tested by scrivene~3which had 1.3" x 3.25" reinforced edge
beams. The theoretical results would indicate that under
surface loading the shell without edge beams deflects three
times that of the shell with edge beams. However, experimental
results show that at working load, the prestressed shell defl
ection is only ~3 of the reinforced shell deflection. If

200~----~~----~------~~----~------~------~------~~----~~~---
I I
I
I I ,
, I
, Scriveners shell -1·3" x 3·25"
edge beams
150~----~-------+----+-~------4-------+----,~~---4~-------+------~ I
I
"DIIJ" t I .n.. compu Iltr ~' program -1·3'~ 3·25"
I edge beams I
I I
.. ..
100~------~--------~/~/------~------~~~---=~----~--4--------1--------~-------4 radial toad
Ob/ft2) ,
I
1 st shell - no beams -1----- 1 shell including prestress
de-flection (N. 1st shell deflections altered \0 allow tor diffences in t 8& EJ
5,n-------~---L~~~--~~------+_------~------~------~----~r_----~
"D.K.J." computer program - no edge beams
FIG.5.19 COMPARiSON OF DEFLECTIONS FOR SHELLS WITH AND WITHOUT EDGE BEAM S
O~L----~ _______ ~ ________ L_ ______ ~ ________ ~ ______ _...~ ______ ~ ________ ~ ______ ~
-0·05 o 0·05 0·15 0·2 0·25 0·3 0-35 0·4 radial deflection (ins)

Shell 1 2 3 4
min.
max.
M -uL
M -uL
A in 2 .034 .077 .077 .034
s
A (Section 3.1. 7) .45 .037 .035 .078 s
A (Section 3.1. 6) s .289 .253 .242 .318
d ins 4.71 4.56 4.56 7.74
t ins .614 .625 .625 .680
f' psi 9,300 7,690 7,350 6,200 c
f psi 7,900 6,540 6,250 5,270 c
Tt lbs 10,000 20,800 20,800 10,000
At in 2 1. 27 3.18 3.33 1. 90
a' ins .10 .26 .27 .18
d' ins 4.61 4.3 4.29 7.56
lb ins (prestress 46,000 89,000 89,000 76,000 steel only)
lb ins (total) 63,000 111,000 111,000 119,000
kd ins 1.0 .6 .6 .4
e sp .0091 .0057 .057 .0075
e SL .00256 .0228 .0228 .058
eT = e sp + e sL .0117 .0285 .0285 .0655
f psi 266,000 270,000 270,000 288,000 su
TABLE 5.1 DATA USED IN CALCULATING THE THEORETICAL
MOMENT RESISTANCE OF THE SHELLS
129
5
.051
.139
.422
10.63
.669
8,050
6,840
13,920
2.03
.20
10.43
145,000
212,000
.7
.0055
.064
.0695
270,000

130
the upward deflection due to prestressing is considered, the
total prestressed shell deflection is less at working load
than that of the reinforced shell.
5.3 ULTIMATE LOAD BEHAVIOUR
Using the method preseqted in Section 3.1, an ultimate
load analysis was carried out on all five shells. Using the
notation given in Section 3.1, a summary of the data used is
given in Table 5.1. The prestressing steel content, A , in I s
all shells was relatively low and the prestressing steel strain,
esp' high. Thus the ultimate stress, f~, of the tendons
was used as an initial estimate of the tendon stress f for su
calculating the ultimate moment of the shells. Subsequent
calculations showed that in all shells, the tendon strain was
such that f was close to fl . su S However the actual experi-
mental f could not be calculated as the stress strain su
curves of the tendons could not be obtained accurately near
ultimate load.
Comparison between the experimental failure moment along
the shells (i.e. the moment obtained by considering the shell
as a simply supported beam) and the theoretical moments of
resistance are given in Figure 5.20. Reduced theoretical
moments of resistance occur at the joints due to the absence
of non-prestressed steel.
5.3.1 1st Shell
The 1st shell had a prestressing steel content below
the minimum required to prevent failure by fracture of the
prestressing tendons. However, there was sufficient non-
prestressed steel to raise the effective steel content above
the minimum and hence failure by elongation of the longitudinal

l 't d' ',00 ongl ulna moment
50~------~~-----+-----=~~------;
(kip.in)
O~--------------~--------------~ traverse midspan traverse
(a) 1st stHtli
131
150F-----------------------~----------------------,
tongitu mal - - -100
moment (kip ins) assuming 0·3" loss
50t------~~--- in .Uective depth in centr. segme-nt
o~-------------=~--------~------------------------~ traverse- midspan traverse
(b) 2nd 150~----------------------~------------~--------~
inal -- -- -o--------------------------~------------------------~
traverse midspan traverse (c) 3rd she-lt
150~~-------------r--------------~
100~---------¥-----r----~~--------4 longitudinal
moment (kip ins) 50t----~~--------~--------~~--~
O&---------------~--------------~ traverse
(d) 4 th shell midspan traverse
250r----------------r--------------~
200~------~~~· ---~----~~~----~ longitudinal
moment (kip ins) 150 r-----1---::::;;;;;:;;;:;=+-~::---t-----_f
100~---~--------4-------~~----~
- -theory
--·-expe50~-+ __ ----------~~----------~r__4
traverse midspan traverse (e-)5th shell
FIG. 5.20 COMPARISON OF THEORETICAL MOMENT RESISTANCE AND EXPERIMENTAL FAILURE MOMENT

132
steel and subsequent crushing of the concrete would be expected.
However, failure actually occurred without warning by fracture
of the non-prestressed steel, resulting in failure of the
prestressing steel. Subsequent investigation showed that
the reason for the sudden failure was 'due to the relatively
low ultimate tensile strength (35,000 psi) at midspan of the
bronzed joints with which the reinforcing meshes had been
joined. The low strength prevented the reinforcing steel from
reaching a sufficiently high stress to elongate noticeably,
and thus give warning of imminent failure.
I
A theoretical analysis, including the effects of the
reinforcing steel, was carried out using the neutral axis
depth, 1" , and maximum crown.concrete strain, 690 llstrain,
found experimentally at the load increment before failure. As
the concrete was still in the elastic range a linear stress
strain relationship was assumed for the concrete in compression,
and the resultant longitudinal compressive force and line of
action were found by integration. The' results of the analysis
are given in Table 5.1. The agreement between the experimental
load, 162 lb/ft2, and theoretical load, 156 lb/ft2 is good.
This analysis showed that immediately prior to failure the
reinforcing had been taking approximately one third of the
tensile forces across midspan at a stress of approximately
35,000 psi. Hence failure at the next load increment, as
occurred, would not be unexpected.
Thus, although the reinforcement raised the ultimate
moment by 30%, the bronzed joint resulted in a sudden unexpected
failure.
5.3.2 Shells 2 and 3
The prestressing steel contents of shells 2 and 3 fall

133
between the limits to prevent sudden failure by crushing of
the concrete and fracture of the prestressing tendons. Thus
by considering Figure 5.20 (b) & (c), failure would be
expected to occur at the joints by elongation of the tendons
and subsequent crushing of the concrete at the crown.
However, from Figure 5.16 (b) & (c) showing radial
deflection a,cross t,he midspan cross-section, it can be seen
that the transverse cross-sections of both shells are flatten
ing near ultimate load. Hence once yielding began at the
joints, the shells would be able to flatten even more, causing
the resulting failure mechanism.
5.3.3 4th Shell
The 4th shell failed by fracture of the prestressing
tendons at the joint. This would be expected as the prestress
steel content at the joints was approximately half that
required theoretically to prevent this type of failure. Prior
to failure, the joint cracks had opened up to approximately
.45", and thus adequate warning of imminent failure was given.
It appears, Figure 5.20(d), that the theoretical moment
of resistance of the shell is exceeded experimentally. This
is due to the shell cross-section "closing up", see Figure
5.l6(d), causing an increase in effective depth and hence in
ultimate moment.
5.3.4 5th Shell
Theoretically, by the method of Section 3.1, failure
at the joints by fracture of the prestressing tendons at an
ultimate moment near the experimental value is predicted.
However, before this could happen, the shell failed in
transverse bending in the centre element.

134
A simple analysis was carried out on the centre section
by equating the internal and external virtual work. Referring
to Figure 5.21, a negative yield line was assumed along A and
a positive yield line along B. These were chosen by consider-
ing the crack pattern and rotation of the failed shell. It
was also assumed that there was no restraint along the
transverse boundary, i.e. between the centre segment and the
outer shell segments. This analysis indicat~s thatf~ilure
would occur at 110 lb/ft2 compared with the actual failure
load of 293 lb/ft2. I However, these boundary conditions would I
apply only when the:prestressing cables have elongated to
open up the joint c~acks sufficiently to remove the restraint
between segments. This would occur when the neutral axis ,
depth is small near ultimate moment. Thus a transverse
bending failure as occurred would be expected.
Moore 28 has carried out a more detailed analysis of this
shell by considering the cracks in one quarter of the shell
and idealizing yield lines. Using the kinematic limit
approach of Olzak and Sawczuk29 good agreement was obtained
between theoretical (284 lb/ft2) and experimental (293 lb/ft2)
ultimate loads. Unfortunately this technique is not a design
method, as it is extremely difficult to minimize the equations
for generalized yield lines when the failure pattern is not
known from experiment.

A - ne-gative yield line - positive yield lin f!'
C- rotation
FIG. 5.21 FAILURE MECHANISM OF 5th SHE LL IN CENTRE SEGMENT
135

136
CHAPTER SIX
APPROXIMATE METHODS FOR THE ELASTIC DESIGN
OF PRESTRESSED CYLINDRICAL SHELLS
The primary aim in the analysis of prestressed
cylindrical shells is to obtain the longitudinal normal
force, Nl ' so that Nl due to the applied load and dead
load may be fully or partly counteracted. Hence a simple,
quick method of calculating Nl is desirable. The magnitude
and distribhtion of transverse bending moments, M2 , is also
required as these may be crit~cal. Wind loading and earth-
quake loading have not been considered in this thesis as
these effects are qenerally much less severe than the effects
of dead weight and uniformly distributed live load suoh as
snow.
Within this chapter limits are put on the range of
applicability of beam theory for the analysis of prestressed
cylindrical shells. Other simplified analysis methods are
developed so that initial design can be undertaken, without
the need for electronic computers. They also enable the
designer to see in general terms the effect that an alteration
in cable position will have on the shell.
For straight cables, the only force considered is that
at the anchorage, line losses being neglected. As these are
generally small for straight cables, this is not a serious
restriction. In the case of draped cables the anchorage
force and line loads are dealt with separately. Only symmet-
rical shells and cable layouts are considered.

137
6.1 AND LIVE LOADS
In order that the feasibility of a particular design
may be quickly determined, it is helpful to have a simple
method of calculating the critical normal force distribution.
, 13 22 Once this is done a fuller analysls ' can be carried out
if required, to find the magnitude and distribution of
significant; shell actions due to dead and live loading,
namely longitudinal normal force, transverse normal force,
in-plane shear force and transverse bending moment.
A commonly u~ed method for calculating the longitudinal
normal force for the surface loads is to assume that the
shell spans longitudinally ~s a beam, simply supported
between the traverses. This technique34
is simple and has
the advantage that the loading can be of any distribution
and the shell of any thickness. Also any cylindrical shape
may be considered.
The distribution of normal force according to the beam
theory is given by:
=~ I
h M h I , d (WL 'd 'f were = t e app le moment = 13 at ml span 1 W is
the total uniformly distributed load).
t = thickness of shell.
y = vertical distance above the neutral axis,where
the depth below the crown of the neutral axis
is given by
I = moment of inertia of shell cross-section
2 sin ¢k ¢k + sin ¢k (cos ¢k - ¢k) ]
In calculating the moment of inertia the difference of two

similar numbers must be found, and hence to obtain it
accurately a reasonable number of significant figures,
say 7, must be used.
138
As the L/R ratio is decreased, the difference between
beam theory results and those calculated by an exact method
increase. Figure 6.1 shows where the results from beam
theory, for the maximum midspan values of N1 ' differ by
less than 5% from those obtained from the D.K.J. program
using 3 Fourier terms. For these shells the N1 distrib
ution across the whole cross-section is similar to the linear
distribution given by beam theory. The comparison was for
a uniform dead load.
To calculate the N1 distribution for dead load for
shells where actions are not well predicted by beam theory,
Figure 6.2 can be used. These curves have been plotted
from results obtained from the D.K.J. program, again using
3 Fourier terms.
6.2 ANCHORAGE LOAD
For straight cables the anchorage load is taken as
the actual prestressing force and for draped cables it is
taken as the component of the anchorage force parallel to
the shell generators. For draped cables, the remaining
component of anchorage force is considered to be taken
directly by the traverse. Maximum values of N1 due to
anchorage load occur at midspan or near the traverse.
6.2.1 ~1 at Midspan
At midspan, for a large range of shells, the
magnitude and distribution of N1 can be accurately deter-
mined by use of the beam theory approach.

40° Half
inctud~d
angle
30
o
For shells be-h'M' line. midspan maximum valueof n, is give-n by b~am theory to within
5·'. of n~sults obtaine-d from the .. D.J. K. It computer program
. Pr~strf.!i'ssing loads
load
1 2 3 4 5 L/R
FIG. 6.1 ACCURACY OF BEAM THEORY RESULTS
139

-1000
-1000
(l~)2 / unit (~nglh 500 1000 1500 2000
:;':=---'r--#I--~-----r~----'--- 1 - ,--
+ .. ngl" trom crOWn
I> angl. from crown
~ Angl .. 'rom crown
3
500
35·
500
Mft
FIG. 6.2(&) tk =30·
Rit = 60
Nl / Ti:TR)T unit length 1000 1500 2000 2500 3000
FIG. 6.2 (b)
'k = 40°
RII= 80
1000 1500
FIG. 6·2 (e)
+ ; 50· Rllk = 80
IR:2
(L~~)2 / unil lenglh
2000 2500 3000 I.
FIG.6.2. Nl AT MIDSPAN DUE TO UNIT DEAD LOAD
140
3500
3500

i.e. =~ I
where M = 2 P a yp
and yp = vertical distance of anchorage above
neutral axis
P = anchorage ,load. a I
, !
Beam theory has the advantage that the effect of a change
141
in cable position can be readily seen. Figure 6.1 indicates I
the range of shells for which beam theory gives results for I
maximum Nl values to within 5% of results calculated by
the D.K.J. program using 10 Fourier terms.
The range of L/R for which beam theory givesi reliable I i
I results is larger for prestress loads than dead load •. This , I
is due to the assumption inherent in the beam theory method
that the transverse cross-section does not ch~nge shape. ,
As prestress loads cause a lower order of M2 (and thus
smaller change in cross-sectional shape) than dead load,
this assumption is more valid for prestress loads than for
dead load.
For shells where beam theory does not give satisfactory
results, the distribution and magnitude of Nl at midspan
due to anchorage load can be obtained by interpolation from
Figures 6.3-6.5. These were plotted from results from the
D.K.J. program, using 10 Fourier terms and two symmetrical
prestress forces of 10,000 force units each.
Although for prestress anchorage loads beam theory
would indicate that there is no change in Nl distribution
along the shell, there is in fact a change due to the
influence of the traverse. However, the distribution and
magnitude of Nl at any particular cross-section is similar
to that at midspan for a considerable portion of the shell

. GOO -500
'k : 30·
LlR: I RII :80
NI lunit length _400 _300
Results obtained from "D. J .K." computer
program using 10 Fourier ,t~rms &, tt:! ./
symmotrical 10000 Ib "nchorog'" toa~,
200
crown
2 •
FIG.6.3 MIDSPAN N, DUE TO ANCHORAGE
.600 -500
+k: 40• L/R.l R/I.80
-400 -300
R.sulls obtained trom" D. J. K." compul"r program using 10 Fourl"r t.rms & symm"tricat 10000 Ib anchorage toads
~ (40 )
Nt /urO' longlh (lb.)
.300 -200
'k .40· LlR.2 RII • 80
Ruulls obtained from "D.J,K," <c,mput"r program using 10 f'ouri.r terms & svmmetrical 10000 Ib anchorag. loads
WOJiHm I"l>Ory
(40°)
FIG.S.lo MIDSPAN N,
! DUE TO
100 200
4 angl. Irom crOWn
position of anchorage trom crown
100 200
angle from crown
ANCHORAGE
posilion of anchorag. from crown
142
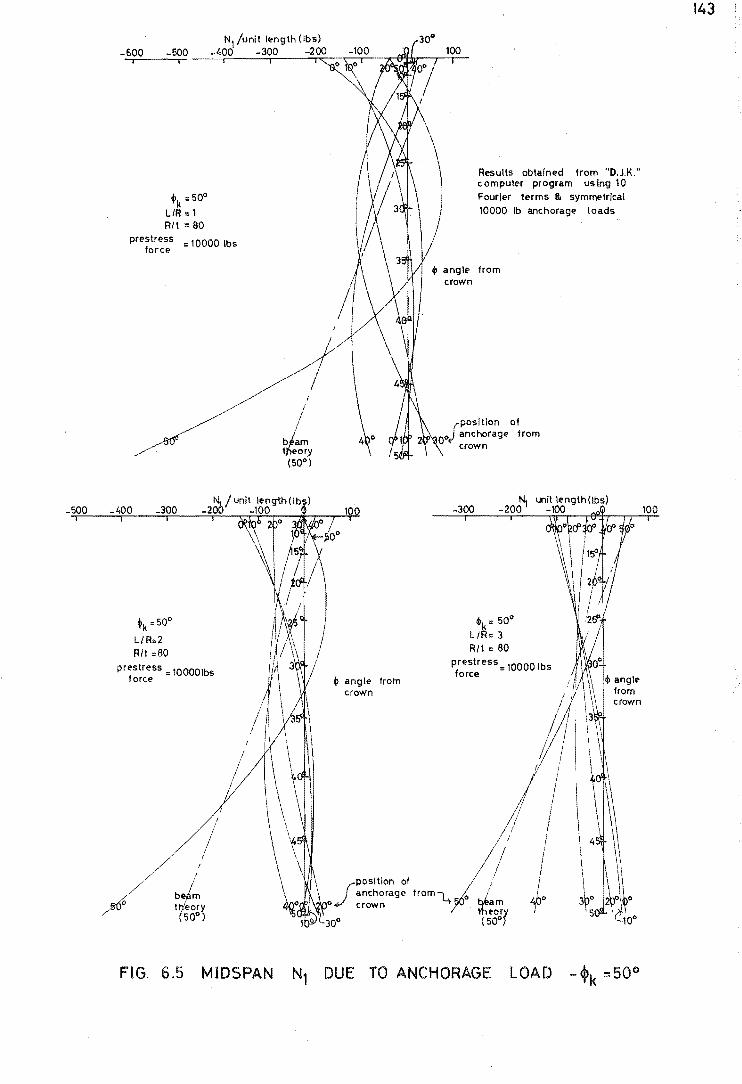
_500
-soo Nl junit length (Ibs)
-400 -300 -200 100 -600
tk = 50° LlR 1 Rlt " 80
prestress ,,10000 lbs force
_400 _300
'k =500
L/R=2 RIl 80
prestress" 10000lbs force ., angle from
crown
crown
Results obtained from "D.J.K." computer program using 10 Fourier terms & symmetrical 10000 lb anchorage loads
jPosition of
00 anchorage from crown
-300 _200N,
$k" 500
LIR= 3 Rlt = 80
prestress" 10000 Ibs force
\ \
\\ // \ J~~~~~~~g~f from4/i/
o 0 crown am eory
1" 30° (50°)
FIG. 6.5 MIDSPAN N, DUE TO ANCHORAGE LOAD -+k =50 0
143
100

144
length, even for some of those shells whose midspan distri-
bution of Nl is not given correctly by beam theory. Table
6.1 indicates the approximate distances from the traverse
where the maximum values of Nl change by more than 10%
fro~ those at midspan.
<Pk
L/R 1 2 3 4
=
=
=
=
200 5 1 1 1 1 1 1 IG L SL - 16L -L --L -L--L 8 16 8 16
300 5 5 !L !L 16 L IG L 4 8
400 5 ~L 5 5 !L -L - 16 L 16 L 16 8 4
500 5 ~L 5 5 I I 5 16L 16 L 16 ;L 16 L 8
I
Distance from traverse where maximum Nl val~es,
due to prestress anchorage force, dif~er by ~ore than 10% from midspan values.
TABLE 6.1 INFLUENCE OF TRAVERSE ON MAXHlUM Nl VALUES
It was found that for shells where the midspan distrib-
ution of Nl was generally not linear, there were for each
particular <Pk two anchorage eccentricities which did
however give linear distribution for all L/R in the range
1 - 4. For these anchorage eccentricities, the distribution
of Nl around the arc remained similar to that at the mid
span arc till nearer the traverse and transverse momehts were
minimal.
Varia tion of R/ t . With an increase in R/t the range of
applicability of beam theory decreases due to the shell
being more flexible in the transverse direction, and thus

145
the assumption no change in cross-sectional shape is
less valid. However for an increase in R/t from 80 to
120 the decrease in the range of applicability of beam theory
is small, and for shells which lie within this range there
is negligible change in the Nl distribution. For other
shells outside this range slight differences do occur as
illustrated in Figure 6.6 for a shell with and
L/R =2. Generally the Nl distribution departs further
from the linear distribution given by beam theory.
6.2.2 ~l near Traverse
The Nl distribution near the traverse can be
calculated approximately using the beam on elastic foundation
technique presented in Section 2.5, using a valu~ of S
calculated at the shell-traverse junction, and as~uming that I
this distribution continues a short (L/8) distanc~ into the
shell. This technique, which only applies close to the
traverse, indicates that the Nl distribution about the
anchorage as origin is independent of the anchorage eccentr-
icity except when it is close to the edge. Computer results
I from the D.K.J. program give the same trend, but do not
predict the magnitude of the peaks quite as well. (See
Figure 2.14).
Thus by means of beam theory or Figures 6.3 - 6.5 at
midspan, and the beam on elastic foundation technique near
the traverse, critical Nl forces due to prestress anchorage
loads can be calculated. For parts of the shell further
than LI8 from the traverse and lying within the limits of
Table 6.1, interpolation between known results can be used
to obtain sufficiently accurate results for design purposes.

Nt / unit -500 -400 -300
LlR:::: 2 .k :::: 40°
prestress anchorage :::: 10000 Ibs
foref'
position of anchorage from crown 3
RIt::::8 It:::: 120
crown
4
FIG. 6.6 VARIATION OF MIDSPAN N1 WITH CHANGE IN Rit
146

M2 at crown
c.r wn
-"Ie
FIG.S.7 VARIATION OF M2 AT CROWN FOR CHANGE IN ANCHORAGE ECCENTRICI TV
ratio of
(M2 at partieula point)
( Nil at crown)
c.r wn -"If!:
distance- around
FIG. 6.8 M 2 RATIO ENVELOPE
141

148
6.2.3 ~2 Due to Anchorage Load
Using the D.K.J. computer program, a systematic
study was made of changes in M2
age eccentricity were altered.
L as jR, ~k and anchor-
7t (=80) was kept constant.
General trends in distribution and magnitude were found for
changes in ~k and anchorage eccentricity. These trends
d h L, .. d d egenerate as t e /R rat10 1S ecrease .
The loading terms in the D.K.J, computer program are
based on the assumption that the traverse is infinitely
stiff in its own plane and has zero stiffness perpendicular
to its plane. If an actual traverse differs from this,
the general trends outlined and discussed in this section
will still hold, but numerical values will be different.
Near the traverse (within L/8 ) , relatively latge oscill
ations in the magnitude of M2 occur, due to the influence
of the traverse. In this region, M2 depends very much on
the actual properties of the traverse and few trends or
generalisations can be stated. The following discussion
only deals with M2 in the shell between midspan and L/8
from the traverse.
At midspan the maximum transverse moment usually occurs
at the crown, and the largest moment of opposite sign a short
distance up from the edge. As the traverse is approached the
positions of maximum positive and negative moments do not
alter greatly from those at midspan (until the last L/8 from
traverse), but the magnitude may increase or decrease, by a
factor of up to 20, as shown in Table 6.2.

149
L/R 1 2 3 4
<Pk == 200 I I I I
= 300 D I,D I I
== 400 D I,D I I
== 500 D D D I,D
I
D
Increase
Decrease
in maximum M2 value at 78 from traverse,
from maximum midspan M2 value. (R;t == 80) ~
I,D - Increase or Decrease; depending upon anchorage
position.
TABLE 6.2 VARIATION OF MAXIMUM M2 VALUES ALONG SHELL
DUE TO ANCHORAGE LOAD
Maximum values of M2 generally occur at midspan or about
L/8 from the traverse. For design, once these extreme
values are known other values at different cross-sections
may be obtained by interpolation.
The behaviour of M2 around an arc can be explained
by means of Figures 6.7 and 6.8, drawn for an arbitrary
L/R , R/ t d,f, I I an 'I'k' The sign convention used is that positive
moments cause sagging_
Figure 6.7 shows that the sign of the crown moment
depends on the position of the anchorage. If the anchorage
is near the crown or edge of the shell, the crown moment
is positive and for most shells would oppose the moment due
to surface loading. If the anchorage is in the centre
portion of. the shell arc, the crown moment is negative.
As L/R is varied for a particular <P k , the magnitude
of the crown moments alter, although the general distribution
150
does not alter greatly, as shown in Figures 6.9 and 6.11.
Generally as L/R is increased the magnitude of the crown
moment decreases. As the traverse is approached the rate
of decrease reduces. It is interesting to note that for
each $k the average positions of anchorage eccentricity
for zero moment, for all L/R shown (I;tR = 1 to 4), are
approximately equidistant around the arc from the neutral
axis position. Also the average distances around the arc
from the neutral axis increase linearly with increase in $ko
These anchorage eccentricities are the same as those that
were found in Section 6.2.1 to give linear midspan Nl
distribution for all L/R • No apparent reason could be
found for this phenomenon.
For a particular $k' L/R and R/t it was found that the
ratio, (M2 at any particular position on the cross-section
being considered)/(M2 at the crown), was similar for all
anchorage eccentricities. By considering all anchorage
eccentricities an envelope of ratios can be drawn as shown
in Figure 6.S. The actual ratio for any particular cable
position will be between the two extremes of the envelopes.
As a general rule, the actual M2 ratio moves from the top
of the M2 ratio envelope to the bottom, as the cable
anchorage position is varied from the edge to the crown of
the shell.
Numerical Results. Using a 10,000 unit anchorage load,
Figures 6.9-6.12 have been drawn, so that M2 at midspan
and M2 at I;ts from the traverse can be calculated. In
some cases of large $k and short shell, the envelopes are
so wide as to be of little use for design, however the
general behaviour can be seen. In drawing the M2 ratio

40
M2/unil 'k ,,20°
leng (tbs)
20
-20
80
60
l+-LlR
0 cr wn SO
-20
-40 80
60
M /unit 2 IE'ngth
40
(lbs) 4
20
100
80 M2 /unit
length (lbs)
60
40
20
0 I:r
-20
-40
.cLlR
1
wn 5°
·k=30°
0
Results obtained from "O.K. J." computE'r proqram using 10 FouriE'r tE'rms & symml!'tril:al prl!'stress anchorage forces of 10000 Ibs each. - RIt ",80
151
FIG. 6.9 VARIATION OF CROWN M2 AT MIDSPAN FOR CHANGE IN ANCHORAGE ECCENTRICITY AND LlR RATIO

0-2
3 no envelopE')
2
2
04--------+--------+---~~_+--~~--+_------_+====~~ cr wn
0·2
c:r 1'1
\
10"
LIR= 4-l'\E'gligiblE' momE'nt
..
FIG. 6.10 MIDSPAN M2 RATIO E NVE LOPES
0·8
0·4
-0.2
-0.4 ----__ 2
-U'I N

Or----+~~-r----~~~~ cr wn
-20
60
-40
-40
153
Results obtalne d fJom "D,J.K ... computer program using 10
FourlE'r t.rms a. symmetrical 10000lb anchorage loads.
R It:; 80
FIG. 6.11 VARIATION OF CROWN M2 AT LIB FROM TRAVERSE FOR
CHANGE IN ANCHORAGE ECCENTRICI TV AND LlR RATIO

-0
.()
.()
.a..
.1.
·'2
20'
.()
.()
.()
·oa
FIG. 6.12 M2 RATIO ENVELOPES AT LIS FROM TRAVERSE
R.,uU. obLaln.-d hOm ""'D.J.k" (OtnP'-lW program ullng 10000 Ib sy",,,,,,,,ulcal .. ochor&cjJ" fore... .. Bumming 10 Fourl., '-rms. (R It.SO )
154

155
envelopes, anchorage eccentricities within 2~0 on either
side of the crown zero moment anchorage eccentricity have
been ignored. This is because within this range, large
M2 ratios can occur for relatively small moments due to
the crown moments themselves being small. For these cable
positions the value of M2 is small over the entire cross
section and is less than the values calculated for anchorage
at 2~0 away from the crown zero moment anchorage eccentri-
city.
Variation of Rlt . R For an increase in It, from 80 to
120, the effect is to give slight variations in the magnitude
of the crown moments, the actual distribution across any
cross-section remaining similar. For small included angles,
(200 and 30
0), there is generally an increase in M2 at
I 0 midspan and a decrease at the traverse. For larger ~k (40
I
o I
apd 50 ), a decrease everywhere generally occurred. Figure I
6.13 illustrates these trends for a shell (~k = 300
, LIR = 2),
for an increase in R;t from 80 to 120.
6.3 DRAPED CABLE LOADS
6.3.1 ~l Due to Cable Drape
At any cross-section, for a symmetrical shell and
cable layout, the resultant external forces on the section
are a normal force P due to the anchorage load (considered
in Section 6.2), and a moment M due to the cable drape,
where
M = 2P'e'
and pi = component of anchorage force parallel
to the shell generators less line losses
up to cross-section being considered.

M21 unit tt'ng
(tbs)
20
--RIt=80 __ R/t = 120
L 18 from traverse
• =300 LlR=2 p~~stress anchorage force = 10000 lb
FIG. 6.13 VARIATION IN M2 DISTRIBUTION FOR CHANGE IN R/t.
100
M2 (ft. tb 1ft
O~----~~--~--~~~----~------+-----mids pan
L = 120' R:: 10' t = .25' \= 60° prestress anchorage force:: 170000 lb anchorage eccentr ic.ity :: 2.04' drape = 7.68'
FIG.6.14 COMPARISON OF RESULTS FROM "D.J.K" PROGRAM AND NASSERS TECHNIQUE
156
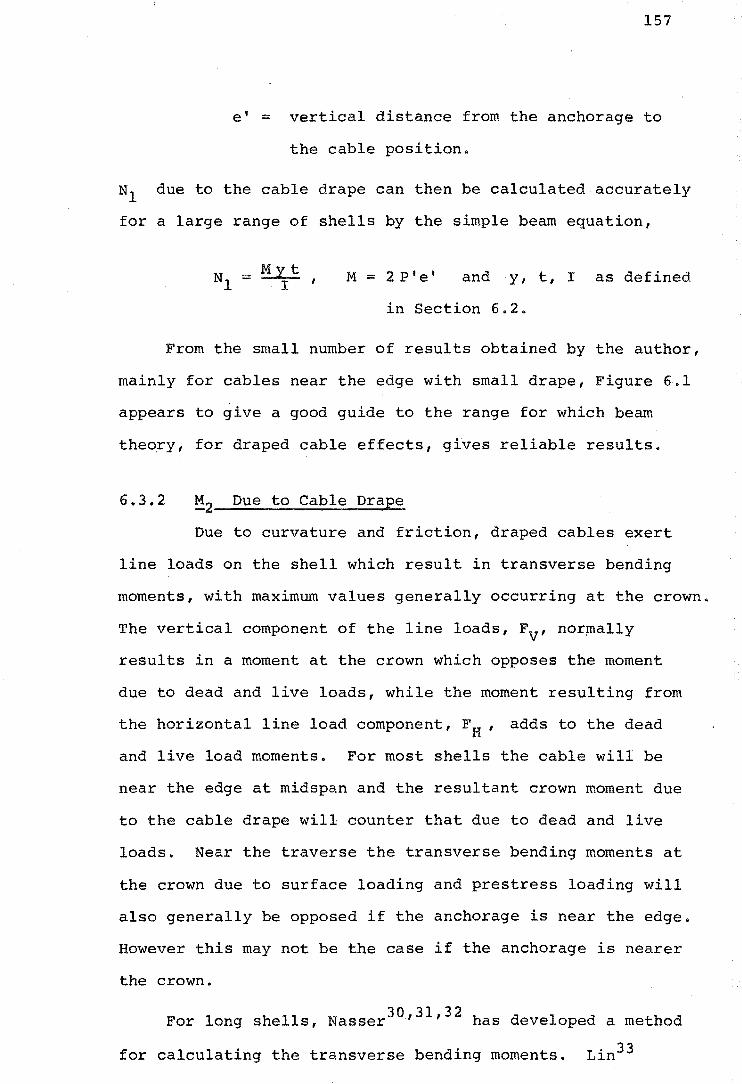
157
e' = vertical distance from the anchorage to
the cable position.
Nl due to the cable drape can then be calculated accurately
for a large range of shells by the simple beam equation,
=~ I
M == 2P'e' and y, t, I as defined
in Section 6.2.
From the small number of results obtained by the author,
mainly for cables near the edge with small drape, Figure 6.1
appears to give a good guide to the range for which beam
theory, for draped cable effects, gives reliable results.
6.3.2 ~2 Due to Cable Drape
Due to curvature and friction, draped cables exert
line loads on the shell which result in transverse bending
moments, with maximum values generally occurring at the crown.
The vertical component of the line loads, FV' nor~ally
results in a moment at the crown which opposes the moment
due to dead and live loads, while the moment resulting from
the horizontal line load component, F H' adds to the dead
and live load moments. For most shells the cable will be
near the edge at midspan and the resultant crown moment due
to the cable drape will counter that due to dead and live
loads. Near the traverse the transverse bending moments at
the crown due to surface loading and prestress loading will
also generally be opposed if the anchorage is near the edge.
However this may not be the case if the anchorage is nearer
the crown.
30 31 32 For long shells, Nasser ' , has developed a method
for calculating the transverse bending moments. Lin33

158
suggests a similar method using his load balancing technique,
but does not develop it so fully. In essence, this method
assumes that M2 at any point on a cross-section is equal
to the moment of the line loads acting on the cross-section
taken about the point being considered. This is most
easily done by calculating the vertical and horizontal
components of the line loads, FV and FH . Then, M2/unit
length, at any position A can be calculated from,
where v a are the horizontal and vertical distances
from the prestressing cable to the point A being considered.
Nasse~ approximated the line loads by assuming that the I
cable was draped in a vertical plane. This may give
incorrect results, particul~rly near the end of the shell,
and hence accurate calculation of line loads (see Section
2.3.8) would be better, especially as it involves little,
if any, extra effort.
L For the long shell (/'R = 12, q,k
analysed by Nasser, Figure 6.14 shows a comparison between
transverse bending moments calculated by the D.K.J. program
and by using Nasser's technique, accurate line loads being
used for both methods. Reasonable agreement is obtained
between results near midspan, however at other cross-sections
the agreement is lower. Except near the traverse, the
general range of magnitude of M2 is predicted correctly by
Nasser's method although the accuracy is not as good as it
is at midspan.
For shorter shells Nasser's technique gives moments
that are much too large. This is due to the assumption

159
in Nasser's technique that the total line loads at any cross-·
section contribute to the transverse bending moment, whereas
in fact a portion of the line loads are countered directly
by in-plane shear force. A similar limitation occurs for
surface loading in Lundgren's beam-arch method. Nasser's
method gives an upper bound limit to the moment but the
correct moment may be only a small percentage of this, e.g.
for the 3rd shell tested by the author, L/R == 3, CPk :: 300,
R/t == 77, the correct values of maximum transverse moments
are approximately 7% that given by Nasser's technique. As
the ratio of transverse benqing stiffness (a function of ¢k'
t3
) to longitudinal shear stiffness (a function of L2 ,CPk' t)
decreases, a greater proportion of the line loads are taken
by in-plane shear. I
No simple relation to calculate the I
proportion of load carried by each action is apparent.
For small cable drapes the line loads will be small
and thus the resulting transverse bending moment will also
be small. However for large cable drapes significant moments
may occur and a detailed analysis, such as by a computer
program similar to that used by the author, should be
carried out.
6.4 DISCUSSION
The primary aim in the design of prestressing cable
layouts is to counter Nl at the midspan edge due to dead
and live loads. This is achieved by having the cables as
near the edge as possible at midspan. For a given anchorage
force a straight cable is more efficient than a draped cable
as line losses will be less and thus there will be a larger
Nl at midspan to oppose the normal force due to surface
loading.

160
Although the magnitude of M2 caused by prestressing
will normally be lower than that resulting from dead load and
live load, it is desirable that the prestressing moments
oppose the dead and live load moments. The moments due to
prestressing can be considered in two parts, namely the
moments due to the anchorage force, M;, and the moments
due to cable drape, M~. Fbr the anchorage force; the ,
nearer the ~dge of the shell'the anchorage is, the larger
are the transverse bending moments opposing those of dead
and live loads. Moments due to the cable drape generally
'also oppose dead load and live load moments, h6wev~r these
willi be small unless there is I significant cable drape, in
which case the anchorage will be away from the shell edge
and thus M; will be reduced. For most shells the increase
in will be less than the decrease in and thus the
total transverse bending moment opposing dead and live load
moment will be less than for a straight cable with the same
cable eccentricity at midspan. If friction losses are high,
relatively large moments will occur for cables wifh small
drape. However in this case the normal force at the midspan
edge to oppose the tensile force due to dead load and live
load will be considerably reduced.
Thus in the author's opinion there is little to be
gained by the use of draped cables for prestressing cylindr-
ical shells, excepting practical difficulties of minimum
anchorage spacings, stress concentrations in the vicinity
of the anchorage etc.

161
CHAPTER
SUMMARY AND CONCLUS
7.1 MODEL TESTS
The method used for constructing the model shells
proved to be very satisfactory. By use of a mesh and mortar
packing blocks the reinforcement could be accurat~ly placed
in the shell surface. " ::1 This in turn enabled the prestressing
cables to be accurately positioned by tying theP.V.C. cable
duct to the mesh. When the micro-concrete had set, the P.V.C. I
duct was easily withdrawn, leaving a perfectly clean hole
for the prestress cable.
With the prestressing system developed, the loads on
the prestress cables could be set to within 20 lbs of the
desired load. Despite the thin shell section (.6") full
grout penetration of the cables was achieved in all but one
of the shells.
Segmented shells were successfully joined by coating
the surfaces to be joined with an epoxy resin and applying
a prestress force to the shell. The segmented shells behaved
satisfactorily through all loading stages. Cracking generally
initiated in the joint region due to lack of tensile reinf-
orcement across the joint.
The method of applying radial surface load to the
shells by means of an airbag was generally satisfactory
although some effects of skin friction between the airbag
and shell were detected. This affected the transverse normal
force results particularly.

162
Reliable results for actions and displacements were
obtained for both prestressing and surface loading of the
shells. Before cracking of the shells occurred strain
readings were repeatable to within ±S~ strains and deflec-
tion measurements were repeatable to with ±.OOS inches. All
five shells behaved symmetrically.
Young's modulus, E , was calculated by testing rein-I
I
forced concrete slabs in bending and measuring deflection
and strain ,at midspan. It was found that due to the influence
of micro-cracking, a different value of E was obtained
depending upon whether E was calculated from strain or
defl~ction measurements.
7.2 ELASTIC BEHAVIOUR
Theoretical elastic results for both prestress and
surface loading were obtained by use of the D.K.J. computer
program described in Appendix A. This program extended an
existing program to enable circular cylindrical shells, with
or without edge beams to be analysed for surface loading
and symmetrical prestress loading in either the edge beams
or in the shell surface itself. Prestressing can be from
either straight or draped cables.
7.2.1 Prestress
For cables in the shell surface, the D.K.J. computer
program used the generator line load technique developed by
Bryant and Scrivener. An attempt was made to increase the
convergence of the technique by modifying the Fourier coeff-
icients but little improvement in convergence could be
obtained. However the generator line load method was
successfully modified to include the effects of the traverse

163
on the distribution of prestress anchorage force on the
end of the shell. This is particularly important when the
anchorage is near the edge of the shell as sma~l changes in
the distribution of anchorage force can have significant
effects on the transverse bending moments and radial
deflections.
The dominant action for all the models was the longi
tudinal normal force, Nl I and for this action there was
good agreement between theory and experiment, except near
the traverse. This is due to the method of feeding in the
anchorage force over a finite length (.05L) in the theoretical
solution. However near the traverse the magnitude and distri
bution of Nl can be obtained by means of the beam on an
elastic foundation technique given in Chapter 2 (Equation
2.5). There was also good agreement between theory and
experiment for the radial deflection and longitud:j.nal and
transverse bending moments. The agreement for other actions,
particularly the transverse normal force was not as good.
7.2.2 Surface Loading
As was the case for prestressing the dominant action
for the surface loading of all shells was Nl • This action
was predicted well by the theoretical analysis. Again,
radial deflection and longitudinal and transverse moments
were also predicted well by the theoretical analysis, except
near the traverse where the stiffening effect of the traverse
is clearly evident in the experimental results. Although
both theory and experiment indicate small N2 ' experimental
results were influenced by skin friction between the airbag
and shell.

7.2.3 Simplification of Analysis
The most important actions
164
the design of
prestressed cylindrical shells are NI and M2 • By means
of the approximate hand techniques given in Chapter 6 (simple
beam theory for NI and moment design curves for M2 ) these
actions can be calculated with sufficient accuracy for
initial design purposes, for a large range of shells.
For both prestress and surface loading it has been
shown that by considering the shell as a beam, simply supp
orted between the traverses, the midspan NI can be predicted
to within 5% of results calculated by use of the D.K.J.
bending theory, providing the shell geometry is outside
certain limits. The limits on the range of shells is less
restrictive for prestressing than for surface loading. The
general trend is that for a larger included angle, a larger
L/. . d bl f h b /R 1S requ1re to ensure reasona e accuracy 0 t e earn
theory. For long narrow shells, the NI distribution
remains similar to that at midspan till near the traverse,
whereas for shorter broader shells the distribution changes
more rapidly.
7.2.4 General
The model tests show that qy means of an elastic
analysis, prestressed concrete cylindrical shells can be
designed so that no cracking occurs until a considerable
working load is applied. Thus the need for a waterproofing
membrane over the extrados can be eliminated. Also the lack
of cracking means that unlike reinforced concrete edge
beamed cylindrical shells, the effective stiffness of the
shell is that of the whole cross-section. Thus, although an
elastic analysis would indicate that a prestressed cylindri-
cal shell would deflect considerably more than an equivalent
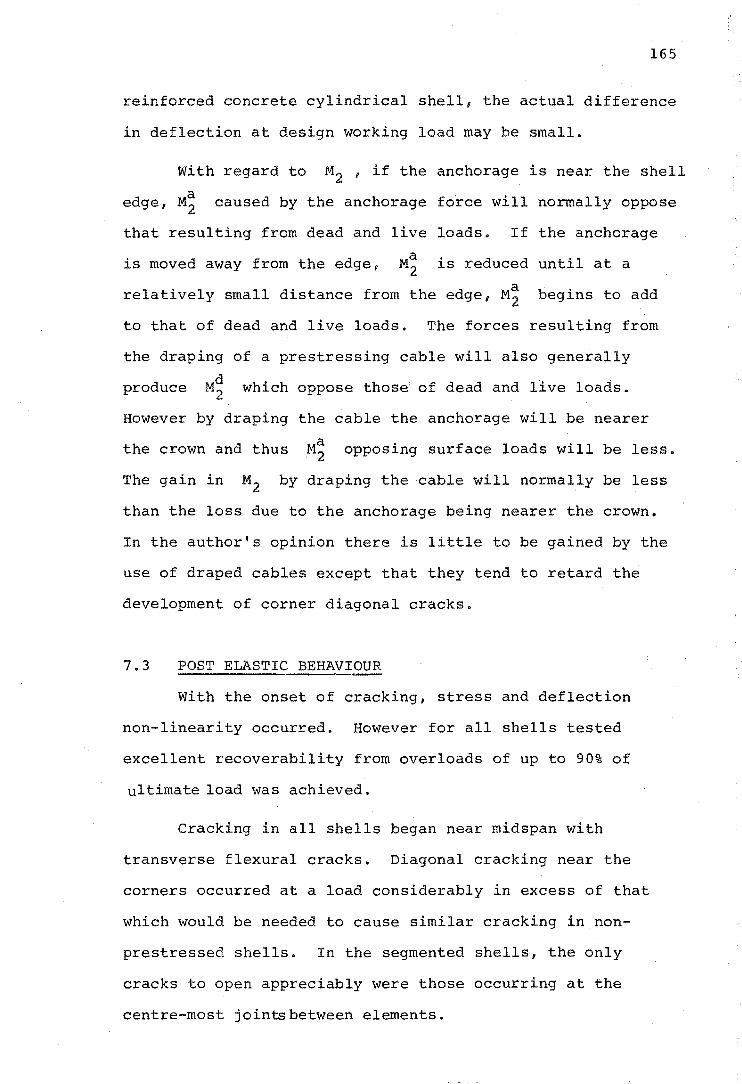
165
reinforced concrete cylindrical shell, the actual difference
in deflection at design working load may be small.
with regard to M2 ' if the anchorage is near the shell
a edge, M2 caused by the anchorage force will normally oppose
that resulting from dead and live loads. If the anchorage
is moved away from the edge, M~ is reduced until at a
relatively small distance from the edge, M~ begins to add
to that of dead and live loads. The forces resulting from
the draping of a prestressing cable will also generally
d . . ' produce M2 WhlCh oppose those of dead and 11ve loads.
However by draping the cable the anchorage will be nearer
the crown and thus ~ . 2 opposing surface loads will be less.
The gain in M2 by draping the cable will normally be less
than the loss due to the anchorage being nearer the crown.
In the author's opinion there is little to be gained by the
use of draped cables except that they tend to retard the
development of corner diagonal cracks.
7.3 POST ELASTIC BEHAVIOUR
With the onset of cracking, stress and deflection
non-linearity occurred. However for all shells tested
excellent recoverability from overloads of up to 90% of
ultimate load was achieved.
Cracking in all shells began near midspan with
transverse flexural cracks. Diagonal cracking near the
corners occurred at a load considerably in excess of that
which would be needed to cause similar cracking in non-
prestressed shells. In the segmented shells, the only
cracks to open appreciably were those occurring at the
centre-most joints between elements.

166
At midspan, where maximum radial displacements
occurred for all shells, the greatest radial deflection
during elastic behaviour occurred at the edge. Once
cracking had occurred this trend continued for the shells
with large included angle ~k; however for the longer,
narrower shells cracking resulted in the shells opening,
(i.e. decreasing in curvature) .
For the shells with small ~k' the longitudinal
compression strain at midspan was linear with distance
above the neutral axis right up to failure while for shells
with 1arge$k the strain was non-linear. For shells whose
~k lay between these two extremes, an initially non-linear
strain versus distance distribution became linear near
ultimate load.
7.4 ULTIMATE LOAD BEHAVIOUR
A method is given for the flexural beam type ultimate
load design of prestressed cylindrical shells. This method
accurately predicted the failure loads of four of the five
model shells tested by the author (lJR = 2 or 3, ~k = 300 -35.80).
The other shell failed in a yield line type failure.
In the beam type ultimate load analysis the shell is
assumed to span between the traverses as a simply supported
beam. The change in shape of the shell cross-section is
ignored. However this is of real concern only when the shell
reduces its curvature under applied loads. Limits are given
for the range of shells for which this happens. Also in the
analysis it is assumed that the strain distribution is linear
with distance above and below the neutral axis. The author's
experiments show that this assumption is valid for all but
short wide shells (e. g. lJR = 2, ~k= 43 0). A method is given

167
to include the effects of non-prestress steel and the method
was shown to give accurate results on the 1st shell tested
by the author. In this shell there was a significant amount
of non-prestress steel which raised the ultimate load 30%
above that of the prestress steel ultimate load. Ultimate
load of segmented shells would have been raised if there
had been non-prestress steel across the joints.
Limits are put on the minimum steel content to prevent
failure by fracture of the tendons, and on maximum steel
content to prevent a brittle fracture of the shell. The
four shells tested by the author which failed in a beam
type manner conformed to these limits.
7.5 MAJOR CONCLUSIONS
From the results of this thesis it is concluded that:
i) Precast, prestressed cylindrical shells can be
designed to behave satisfactorily at all loading
stages. Cracking can be avoided .until a consid
erable surface load has been applied.
ii} The elastic behaviour for both prestress and
surface loads can be accurately predicted.
iii) The ultimate load and failure mechanism can be
accurately predicted for shells which fail in a
flexural beam type manner.
iv) There is little to be gained by the use of draped
prestressing cables.
v) The approximations presented provide a simple
method for the initial design of prestressed
cylindrical shells, and in general terms show the
behaviour of the critical actions Nl and M2 as
L/R and <Vk are varied.

168
REFERENCES
1. de Sitter, W.R., "Theoretisch en experimenteel onderzoek
2. Berndt,
3. Bryant,
4. Bouma,
naar het gedrag van een voorgespannen tonschaal '! Heron, Jaargang 11, No.1, 1963, pp.28-47. ("Theoretical and Experimental Investigation into the Behaviour of a Prestressed Cylindrical Shell". Translation, University of Canterbury, 1964) •
Eo, "Die Wirkungsweise von Gekrummt und Gerade Gefuhrten Spanngliedern in langen Tonnenschalen~ Symposium tiber die Probleme des Zusammenhangen Zwischen Entwerfen und Bauausflihrung von weitgespannten Schalen. USSR, Leningrad, September 1966. ("The Effect of Draped and Straight!prestressing Cables in Long Cylindrical Shells". Translation, University of Canterbury, 1970).
A.H., and Scrivener, J.C., "Cylindrical Shell Roofs With Draped Prestressing". Journal of the Structural Division, Proceedings of the American Society of Civil Engineers, Vol.95, No.ST4, April 1969, pp.6ll-634. .
A.L., van Riel, A.C., van Koten, He, and Beranek, W.J., IlInvestigations on Models of Eleven Cylindrical Shells Made of Reinforced and Prestressed Concrete". Proceedings of the Symposium on Shell Research, Delft, August 1961, pp.79-l0l.
5. Scrivener, J.C., and Megget, L.M., IlPost-Tensioned Concrete Cylindrical Shell Roofll, Civil Engineering Transactions of the Institution of Engineers, Australia, Vol.CE12, No.1, April 1970, pp.7-l0.
6. Bryant, A.H., "A Theoretical and Experimental Investiga-tion of Prestressed Cylindrical Shell Roofsll. Ph.D. Thesis, University of Canterbury, 1966.
7. Jenkins, R.S., IlTheory and Design of Cylindrical Shell Structures ll . Ove Arup and Partners, London, 1947.
8. McNamee, J., "Analysis of Symmetric Cylindrical Shells ll • G.B.D.S.I.R., 1955.
9. Billington, D.P., "Thin Shell Concrete Structures". McGraw Hill Book Co., New York, 1965.
10. Gibson, J.E., "The Design of Cylindrical Shell Roofs". Spon, London, 2nd. ed., 1961.
11. Ramaswamy, G.S., "Design and Construction of Concrete Shell Roofs", McGraw Hill Book Co., 1968.
12. Holand, I., "Design of Circular Cylindrical Shells II •
Oslo University Press, 1957.

13. A.S.C.E., "Design of Cylindrical Concrete Shell Roofs". The American Society of civil Engineers Manual of Engineering Practice, No.3l, 1952.
14. Haas, A.M., "Prestressed and Precast Shells". Proceedings 2nd symposium on Concrete Shell Roof Construction, Oslo, July 1957.
15. Dehousse, N.M., "Discussion on Prestressed and Precast Shells ll
• Proceedings, 2nd Symposium on Concrete Shell Roof Construction, Oslo, July 1957.
16. Bieger, K.W., "Model Tests on Prestressed Cylindrical Shells". R65-34, Department of Civil Engineering Massachusetts Institute of Technology, Cambridge Mass., 1965.
17. Lanczos, COl "Linear DifferentialOperators". D. Van Nostrand Co., London, 1961.
18. Bary, N.K., "A Treatise on Trigonometric Series". V01.l, Pergamon Press, 1964.
19. Rish, R.F., "Some Studies in Elastic Shell Structures ll•
Section B, "The Analysis of Cylindrical Shell Roofs with Post Tensioned Edge Beams", Ph.D. Thesis, University of Tasmania, 1971.
20. Kreyszig, E., "Advanced Engineering Mathematics". John Wiley and Sons, 2nd ed., 1968.
21. Timoshenko, S., "Strength of Materials". Part II, D. Van Nostrand Company, 3rd ed., 1956.
22. Gibson, J.E. "Computer Analysis of Cylindrical Shells", Spon, 1961.
23. Scrivener, J.C., "The Testing and Analysis of Reinforced Concrete Cylindrical Shell Roof Models". M.E. Thesis, University of Canterbury, 1958.
24. "Shell Roof". Information Pamphlet, Concrete Technology Corporation, Tacoma, Washington.
25. Rowe, R.E., "Model Analysis and Testing - its Relation to Established Methods of Design and its Accuracy in predicting the Behaviour of the Actual Structure". Proceedings of a One-Day Meeting on Model Testing, Organized by the Cement and Concrete Association, London, March 1964.
26. Carmichael, A.J., "The Use of Wire Resistance strain Gauges for Measuring Surface Strains in Concrete Members". Construction Review, December 1959.
27. Neuman, W.M., "Shear Failure Mechanisms of Cylindrical Concrete Shells". Ph.D. Thesis, University of New South Wales, 1965.
28. Moore, B.C., "Limit Analysis of Reinforced Concrete Shells". M.E. Report, university of Canterbury, 1972.

.... , v
29. Olszak, W., and Sawczuk, A., "Inelastic Behaviour in Shells". P. Noordhoff, Groningen, Netherlands, 1967.
30. Nasser, A.R., and Johnson, C.B., "Semigraphical Analysis of Long Prestressed Concrete Vaulted Shells". Proceedings of the American Concrete Institute, Vol. 59, No.5, May 1962, pp.659-67l.
31. Nasser, G.D., "Designing Long Prestressed Vaulted Shells". Consulting Engineer, November 1966, pp.116-110.
32. Nasser, G.D., "The Design of Long Prestressed Parabolic Shells ll
• Concrete, April 1966, pp.16l-l66.
33. Lin, ToY., and Kulka, F., "Concrete Shells Prestressed for Load Balancing". Proceedings of the World Conference on Shell Structures, San Francisco, October 1962, pp.423-430.
34. Lundgren, H., "Cylindrical Shells". Vol.l, Danish Technical Press, 1960.
35. Baker, A.L.L., "A Plastic Design Theory for Reinforced and Prestressed Concrete Shell Roofs". Magazine of Concrete Research, No.4, July1950.
36. Baker, A.L.L., "Ultimate Strength Theory for Short Reinforced Concrete Cylindrical Shell Roofs". Magazine of Concrete Research, No.lO, July 1952.
37. Gouda, M.A., "Experimental and Analytical Investigation of Stresses in Reinforced Concrete Cylindrical Shell Roofs". Ph.D. Thesis, University of London, 1951. .
38. Ernst, G.C., Marlette, R.R., and Berg, G.V., "Ultimate Load Theory and Tests of Long Cylindrical Shell Roofs". Proceedings of the American Concrete Institute, Vol. 51, No.3, November 1954, pp. 257-271.
39. Sawczuk,A., "On experimental Foundations of the Limit Analysis Theory of Reinforced Concrete Shells~ Proceeding of the Symposium on Shell Research, Delft, August 1961, pp.2l7-23l.
40. A.C.I., Committee 318. "Building Code Requirements for Reinforced Concrete", American Concrete Insti tute, 1971.
41. Chronowicz, A., "The Design of Shells". Crosby Lockwood, London, 3rd ed., 1968 •
42. Lin, T.Y., "Design of Prestressed Concrete Structures". John Wiley & Sons, 2nd ed., 1963.
43. Mattock, A.H., and Kriz, L.B., "Ultimate Strength of Nonrectangular Structural Concrete Members", Proceedings of the American Concrete Institut~ Vol.57, No.7, January 1961, pp.737-766.

171
44. Harris, H.G., and White, R.N., "Inelastic Behaviour of Reinforced Concrete Cylindrical Shells". Journal of the Structural Division, Proceedings of the American Society of Civil Engineers, Vo1.98, No.ST7, July 1972, pp.1633-1653.
45. Hedgren, A.W., "A Numerical and Experimental Study of Translational Shell Roofsll. Ph.D. Thesis, Princeton University, 1965.
46. Darva11 , P. Le P., Billington, D.P., and Mark, R., "Model Analysis of a Continuous Microcrete Cylindrical Shell". Proceedings of the American Concrete Institute, Vo1.68, No.11, November 1971, pp.832~843.
47. Mi1eykovsky, I.E., "Some Problems of Analysis of Reinforced Concrete Cylindrical She.!l Roofs Taking Into Account Crack Formation". Proceedings of the Symposium on Non-Classical Shell Problems, Warsaw, 1963, North Holland Publishing Company, Amsterdam, pp.1126-1139.
48. Rzhanitsyn, A.R., "The Design of Plates and Shells by the Kinematic Method of Limit Equilibrium". IX International Congress of Applied Mechanics, Brussels, 1956, Vo1.6~ pp.331-340.
49. Darva11,·P. Le P., and Billington, D.P., "Correlation Study of the Behaviour of Concrete Thin Shells to Collapse". International Association for Shell and Spatial Structures Bulletin, No.49, June 1972, pp.59-63.
50. Gerard, G., and Becker, H., "Handbook of Structural Stability: Part III, Buckling of Curved Plates and Shells". National Advisory Committee for Aeronautics, Technical Note 3783, 1957.
51. A.C.1. Committee 334. "Concrete Shell Structures Practice and Commentary". proceedings of the American Concrete Institute, Vo1.61, No.9, September 1964, pp.1091-1107.
52. Bryant, A.H., "Model Tests of Prestressing of a Concrete Cylindrical Shell Roof". Proceedings of the 3rd Australasian Conference on the Mechanics of Structures and Materials. Auckland, August 1971, Vol. II.

Al
APPENDIX A
IID.K.J." COMPUTER PROGRAM
Two programs, both using the D.K.J. equation as the
characteristic shell equatio~, were written in Fortran IV
for the University of Canterbury's I.B.M. 360/44 computer.
The first program is for analysing single circular cylind-
rical shells without edge beams subject to surface loads and
prestress loads from both straight and draped cables. The
second program is for analysing single circular cylindrical
shells with edge beams subject to surface loading or
prestress loading in the edge beams. Both programs use
many of the same subroutines and input data decks are
similar for each program.
For prestressing loads in the shell surface, the
method described in Sections 2.3.2 and 2.3.4 has been used.
6 As Bryant's program, written in Fortran II for the
University of Canterburyi s I.B.M. 1620 computer was available,
as much use as possible was made of this program. Surface
loading is distributed to the shell as given in Section 2.2
and prestress edge beam loading as given in Section 2.4. The
torsional resistance of the edge beam has been included as
this involves little extra computer computation time and
thus there is no reason to neglect it.
An indication that the accuracy of the IID.K.J."
program is good is given in Figures A.l and A.2 where
results from the computer program are compared with results
, b 'II' 9 d 'b 22 Th It g~ven y B~ ~ngton an G~ son. ese resu s were
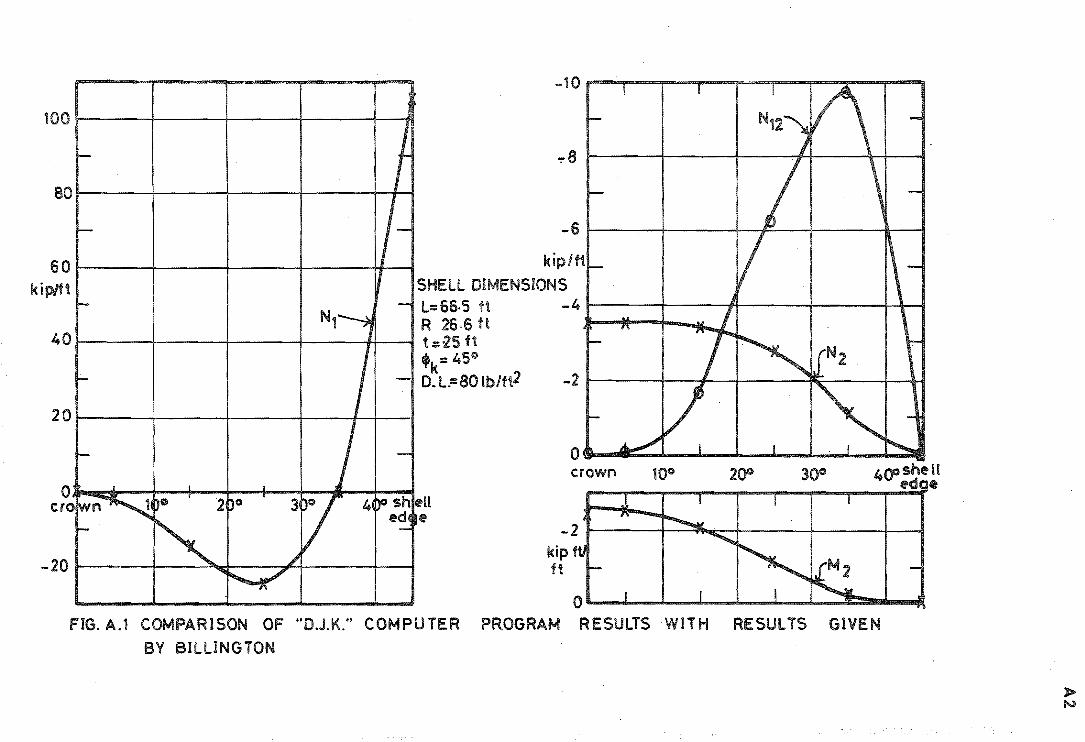
0
100
"!"8
80
-6
60 kip/ft
k ip/ft SHELL DIMENSIONS L=66·5 ft -4 R 26·6 ft
40 t :::~5 ft 'k= 45°
- D. L= 80 Ib/ft2 -2
20
0 crown U
e cr
FIG. A.1 COMPARISON OF "O.J.K." COMPUTER PR.OGRAM RESULTS WITH RESULTS GIVEN
BY BILLINGTON

-14000-------r-----r-----r----,
-12000 i-------+------t---;rtP"'---;-
-100001------+-----#-t-----+--~--f
-80001---------+----~---t--------+-----~~
lb/ft
-60001---------~-------t-------~------~-
-20001---------+---~~+-----~~~----~
O~~~--~------~------~-------W 0°
crown
HO.K.J." PROGRAM· I A.OorX GIBSON
-60u--------r-------r------~------~
-40o~~~--_+------_4-----~-----~
-2001---------+-~~--+_------4_------~
lbftlft
Ol---------+-----~+-------~----~~
200r-------+-------+-~----_+_--~~_f
400--------~------~------~------~ 0° 10° 20° 40°
crown eodge
EDGE BEAM ACTIONS Longitudinal force (lbs)
Longitudinal moment (lbft)
latera.l moment{ lbft)
GIBSON
2.46x10⁵
3.20x10⁵
4·63 x103
"D.K.J." PROG. 2.5x10⁵
]·2 x 10⁵
4·5 x 103
SHELL DIMENSION S (Gibson sheU S92)
L: 90:"0", R::: 40:..0 ", 'k::: 40° t::: 0.25: D.L.:::56Ib/U2
edge beam 5:"0" x 0.82', weight: 625 Lb/ft
FIG. A.2 COMPARISON OF "D.K.J." COMPUTER RESULTS WITH RESULTS GIVEN BY GIBSON
A3

A4
obtained by use of equations of similar formulation to that
used in the "D.K.J." program. Figure A.l shows a comparison
with Billington's results for the dead + live load analysis
of a cylindrical shell without edge beams (L/R = 2.5, ¢k = 450)
and Figure A.2 shows a comparison with Gibson's results for
a shell with edge beams (L/R = 2.25, ¢k = 400).
The imput data required for the two programs is given
below. Any of the data not required by the particular
program being used is ignored.
Card 1.
Card 2.
Card 3.
Card 4.
Title (20 A4)
Any alphanumeric characters. Leave first column
blank.
R, G, T, PHIK, E, PR, SRN, EDGB (8G 10.0) - Shell
properties
R = radius G == length
T = thickness PHIK = half included anlge (¢k)
E = Young's modulus PR = Poisson's ratio (v)
SRN = reference number, for identifying output only
EDGB = 0.0 if no edge beams
TLl, TL2, DWEI, PRESF, BAE, BDR, BETG2 (BFlO.2) -Edge beam properties. This card is omitted if there
are no edge beams
TLI = depth, D TL2 = breadth, b
DWEI = density PRESF = prestress force
BAE = anchorage eccentricity above centroid
BDR = drape at centre-line (+ve below anchorage)
BETG2 = B for calculating torsional stiffness
(a default value of
B = 0.333 is taken if BE~G2 left blank
NSECT, NP, NDO (8110)

Card 5.
Card 6.
Card 7.
NSECT ==
NP ==
NDO ==
C (I) . I ,
sections
C(l)
C(NSECT)
A5
number of transverse cross-sections ( ~ 9)
output required for.
number of points on cross-section (~ 12)
output required for.
type of printout required
= 1 actions
== 2 actions and displacements
== 3 actions, displacements and surface
stresses
== 1, NSECT (8GlO.0) positions of cross-
from centre-line where results required.
== 0.0 ~ ~et automatically = half shell length) 1n program
P(I) ; I = 1, NP (8GlO.0) Position on each cross-
section from crown where results required
P(l) = R~k - Set automatically in program
VAR (A4) Control card to determine next computation
step.
If VAR == D.L. or VAR == RADL, the dead load or radial load rout-
ine is utilized and next card is read as:
Card 8. K~DE, FL~AD, NFX (IlO, FlO.2, IlO)
K~DE = Code number of loading - used for reference
only.
FL~AD == load/unit area
NFX = number of Fourier terms to be considered
If VAR == GENL, a general surface loading is considered and
next card read as:
Card 8. K~DE, X,Y,Z,NFX (IlO, 3FlO.2, IlO)
X,Y,Z == Load/unit area in x,y,z direction respect-
ively.
If VAR == P.L., prestress loading in the shell surface is
considered and next card is read as:

Card 8.
A6
K~DE, P, FA, F, FR, NN, NB, NS, NC, NSH, PXU, WK
(IS, 4 F10.2, SIS, 2F5.5)
P = prestress force
.FA = anchorage eccentricity around arc from crown
F == cable drape around arc from anchorage
FR = friction loss along half cable length~
numerical integration is used to distribute
the friction loss along the cable using the
equations given at the end of Section 2.3.8.
NN = number of Fourier terms to be considered.
NB = number of transverse strips half the shell
is to be divided equally into for Fourier
analysis.
NS = number of loaded generators to be considered.
NC = 1: straight cable, 1 anchorage force
= 2: draped cable, 1 anchorage force
= 3: draped cable, no anchorage force
= 4: straight cable, 2 anchorage forces
= S:draped cable, 2 anchorage forces
N.B. for NC = 4 or 5, anchorage forces of p/2
are considered acting at anchorage eccentricity
±R;lOO •
NSH = anchorage force-is considered as a rectang~
ular shear block spread a distance of
shell length into the shell 4 NSH
pxu = coefficient of friction between cable and
shell
WK == wobble factor.
N.B. for draped cables, if FR = 0.0, PXU and
WK are used to calculate the line loads.
Straight cables may be considered by using
NC = 2,3 or 5 with F = 0.0

If VAR = SUML, the results for the K~DE numbers specified
on the next card are summed and then printed out.
Card 8. NPO(I) I = 1,8 (8110)
NPO(I) K~DE numbers of results to be added and
outputed.
A7
After reading any of the above VAR control cards and following
card, the program returns to read a new VAR control card.
If VAR = NEWC, the program goes to Card 1 and repeats for a
new shell.
If VAR = END. the program terminates execution.

c *.0*******.******** •• **********************************.****************** C C D.K.J. - ~AINLrNE PROGAM - EDGE 8EA~S C TO FIND ACTIONS AND DISPLACEMENTS IN A CIRCULAR CYLINDRICAL C SHELL SUBJECT TO SURFACE LOADS. OR PRESTRESSING LOADS IN C ThE EDGE BEAMS C C .**** •••••••••• **$ •• **.***.***$ •• *********** •• ** ••••• ****.**************** C
CC~~ON/SHELL/R,G,T,PHIK.E,PR,~SECT,NP,SRN,NDNP,PI,NOO,EDGS
CO~~O~/STRESS/AN(1,9.1Z1.AU(6,9,lZI,ASI6,9.121
CO~~ON/SICOS/SIXI91,SIYIIZJ, COXI9J,CCYCIZI CO~~ON/CS/CI91,P(lZI.AN~141.A~M(4)
CC~~ON/UCN/CC~11,lZI.CCUI4,121 CO~~ON/COEFS/AL.GAM CC~MON/EOGEE/TL1,TL2,WEI,PRESF,PE,VP.BI1,BI3,BGZ,BA CO~MON/BEAM/BUI4,9),BNI4,9).8CUI41,BCNI4J COM~ON/BEAM1/ACCNI4I,ACCUC41,FPISI41,UCPSI41,~PIBI4I,UPITI41,UCFSI
14),FLEXI4,41 CO~~ON IABCONI AJ.AK.AJ1,AK1,AL~,V
CO~~ON/NPO/NPClal CO~~ON/XBY/XU1,BETA,Y~AX ,PXU,WK CO~~ON/KO/KOOE,A,FA,F,FR.NN.NB.NS,NC.NSH CC~~ON/FOURT/H(5,12,41 CO~~ON/GENY/Y(5)
DATA T1/'D.L.·I,T2/·L.L.·I,T3/·P.L.·I.T4/·SU~L·I,T5/·NEWC·1,T6/ ' EN ID.'I,T11'RADL'I,TB/'GENL'1 DIMENSION TITLEI20J CALL MASKO PI-3.14159ZT
5 READ(5,110IITITLEI 1),1=1,20) WRITEI6,llO)ITITLEII),I=l,20)
C REWINDl C PEWIND3 C REWINDS
110 FCR~ATI20A4J READI5,lOO)R,G,T.PHIK,E,PR,SR~,EDGB
100 FCR~ATlaG10.01 101 FORMATI4H1SRN,T6,1H=.FIO.3,22HISHELL REFERENCE NO. )/2H R,T6,1H=,
5FIO.3, 1 8HIRADIUSl/2H G,T6,IH=,F1C.3,11HILENGTH OF SHELLI12H T,T6,2H = 2,FIO.3,20HITHICKNESS OF S~ELLI/5H P~IK,Tb,IH=.F10.5.33HIHALF INCLU 3UOEC ANGLE IN RADIANSl/2H E,T6,lH=,F10.0,16HIYOUNGS MODLLUSl/4H PR 4 .Tb,lH=,FIO.5,16HIPOISSONS RATIO))
WRITEI6,101ISRN,R,G,T,PHIK,E,PR IF(EDGB.NE.O.O)CALL EPROP READI5.10Z1 NSECT,NP,NDO IFINDC.GT.3)NCO=3 IFIN~.GT.12INP=12 If(NSECT.GT.9INSECT=9
NCNP=NSECT*NP 102 FCR~AT181101
WRITEI6,103) NSECT,NP,NOO 103 FOR~ATI6H NSECT,T6,lH=,110,23~INO. OF CROSS-SECTIONS)/3H NP,T6,
IlH=,110.32HINC. OF POINTS ON CROSS-SECTIONI/4H NOU,T6,IIC,25HITYPE 1 OF OUTPUT RECUIRED))
READIS,1001 ICII),I=1,NSECT) CI11=0.0 CINSECTI=G/2.0 WRllE(b.lOS) ICIII,{=I,NSECTJ
105 FCRMAT(58H POSITIONS OF CROSS-SECTIONS MEASURED FROM CENTRE OF SHE lLL/1H ,9F12.4)
READI5.100) IPIIJ,I=l.NP) PIl)=R*PHIK
WRITEI6.104) (PIIJ.I=1,NPJ 104 FORMAT(91H POSITIONS OF POINTS ON CROSS-SECTIONS, MEASLRED FRO~ C
1ENTRE-LINE OF SHELL AS ARC DISTANCE/IH ,5FI2.4) a READI5.110) VAR
11 DO 3001=1,12 D0300J=1,9 D0303K=1.6
302 AUIK,J,I)=O.O 303 ASIK,J,ll=O.O
00300K=1,1 300 AN{K,J,II=O.O
IFIVAR.EQ.Tl.OR.VAR.EQ.T21 GO TO 2 C IF{VAR.EQ.T31 GO TO 9 C IFIVAR.EQ.T4) GO TO 18
IFIVAR.EQ.T51 GC TO 5 IFIVAR.EQ.T61 GO TO 25 IFIVAR.EQ.TT) GO TO 2 IFIVAR.EQ.T81 GO TO 2 WRITElb,101
10 FORMATI'MISTAKE IN LOADING FORMAT') STOP
2 CALL SURFLO (VAR) GO TO 8
C 9 CALL PRESLD C GO TO 8 C 18 CALL SUMLO C GO TO 8
25 WRITEI6,109) 109 FORMATI14H JOB COMPLETED!
ENO
C SUBROUTINE ROTMLT (B,A,ANG!
C DIMENSION A(4,41,614,41
C 6=LT*A C=COS{ANGI S=SINIANGJ DO 1 J=1,4 Bll,J)=AC1,J) B!2,JJ=AI2,JI*C-AI3,JI*S SI3,JI=AIZ,J)*S+AI3,JI*C
1 BI4,JI=AI4,JI RETURN ENO

C SUBROUTINE PARTIINFX,X,V,l,VARI
C C PARTICULAR INTEGRAL SUBPROGRA~ C LO~DING IS TAKEN IN FORM C X=XSINIXICOS(YJ,Y=YCOS!XJSIN(Yl,l=lCOS(XlCOS(YI C
COM~ON/SHELL/R,G,T,PHIK,E.PR,NSECT,NP,SRN,NONP,pr,NDO.EDGS CO~~ON/STRESS/ANI7,9,121.AU(o,9,12I,AS(o.9,12J
CO~~ON/SICOS/SIXI91,SIY(lZI, CCXI91.COYIIZJ CO~MON/CS/C(9),P[12I,ANMI41.ALM'41
CD~~ON/UCN/CCNI7,12I,CCUI4,12J
CO~~ON/COEFS/AL,GAM CO~MON/BEAM/BUI4,91,BNI4.9),BCUI4I,BCNI41
CD~MON/EOGEE/TL1,TL2.WEI,PRESF,PE.VP,BIl,8I3,8G2.8A COMMON/BEAMI/ACCNI41,ACCUI4J,FPIS(4),UCPSI4),UPIB(41,~PITI4J,UCFSI
141,FLEXI4,41 CO~MON IABCONI AJ,AK,AJl,AKl,ALM,V CO~MON ISMATI AI4.41,B[4,41,IA[4,41,BSI4.4l,FSHI4.41,FZ(4.21.FYI4.
121.IS1(4,4),ACI4I,ACCI41 COMMON/NPO/NPOISJ OI"'ENSlO~ 514,41 DITA Tl/·D.L.·I.T2/'L.l.'I,T3/'P.L.'I,T4/'SU~L'I,T5/'NE~C'1 ,T6/'EN
ID.'I.T1I'RAOL'I,TS/'GENL'1 150 FORMAT 11H .8EIO.31
C 1~ITIALrZE REQUIRED CONSTANTS 0010J=1,9 00101=1,4 B~(I,JI"O.O
10 BUIl,JI.O.O NPCO=l XSI=-l.O BLl=TLlIZ. BLZ=TL2/2. PI"3.141"5921 GAM=l.O/R BE4=3*II-PR*PR)/(R*R*T*T) BT"BE4**.25 0=(T**3)/112.0*II-PR*PRll 00 4 IJ= 1, NP
GAMY=PIIJI/R SIYIIJI=SINIGAMV)
4 CCY(IJI=COSIGAMYJ C DC LOOP FOR CARRYING OUT FOURIER DISTRIBUTION IN X DIRECTION
DC 1 J=l,NFX C ESTABLISH COEFFICIENTS DEPENDENT ON PARTICULAR FOURIER C TER~ BEING CONSIDERED
A"=Z*J-l AL=[AM*PI JIG ALZ:AL*AL AU'=SQRTI AL"ST I V~AL/BT
AJl=SQRTIISQRTI1.O+11.0-VI"*ZI-1.0+V)/2.01 AJ=SQRTIISQRTIl.0+11.O+VI·*21<1.0+Vl/Z.OI AK=1.OIl2.0"AJ I AK1=1.0/12.0*~Jl) V4=IAl**4/BE41/4.0 DC Z IJ=l,NSECT AL)(=AL*CIIJI CCXIIJI=COSIALXI
IF(CIIJI.EQ.IG/2.0) I CQ)U IJ '''0.0 2 SIXIIJI=SINIALXI
GA=GAM/AL GA2=GA**2 FAC=!1.0+GA*GAJ**2 OEN=1.O+V4*FAC**2 XSI"-XSI FOCEX=!4.0*XSIJ/IPI*AMI Xl=X*FOCEX Yl:Y*FOCEX Zl",Z*FOCEX HX=(IR*(PR-GA2IJ/IAL*T*DENII*Xl Hy",(R*GA*!GA2+2.0+PRJ*Yll/tAL*T*OENI HZ=IR*R*FAC*ZlJ/IT*OENI FX=(V4*FAC*IGA2-PRI*Xl1/IAL**3*OEN) YV=IIV4*FAC*ll.O-PR*GA21+1.01*YlJ/IAL*AL*GAM*DENI ZZ=IR*Zll/(~L*AL*OEN) F=FX+VY+lZ H=HX+HY+HZ AN~lll=-AL*GAM*F ANMI21=!-AL*AL*F+YI/GAMI ANMI3J=!-D*AL**31*IGA*GA2+GA*12.0-PRI)*H A~M!41=(P~+GA21*D*AL*AL*H AUMlll=AL*IPR-GA2l*F/T+Xl/jT*AL*ALI-PR*V1/IT*AL*GAMI AUMI21=AL*Al*(PR*G-l.0J*F/IT*GAMI-PR*XI/IT*AL*GAMI+YllIT*GAM*GAMl+ IHY/IGAM*RI+HZ/!GA~*R) AUM(3I=H AU~(41:GAM*H tFIVAR.EQ.T11 GO TO 3 Oil 1 K=I,NP CCNll,K)=ANMlll*SIYIKI CCNIZ,K!=ANMIZI*COY{KI CCN(3,KI=ANM(3)*SIY(KJ CCN(4,K):ANMI41*COY[KJ CCUIl,KI=AUMllJ*COYIKJ CCU(2,K):AUM!ZI·SIYIKJ CCUI3,KI:AUMI3l*COYIKI CCU(4,K):AUMI4J*SIYIKI
1 CONTINUE 00 11K =1,4
11 ACCNIK):-CCNIK,l) C C~LCULATE SHELL EDGE DEFLECTIONS DUE TO P.I. + C.F.
CALL ABMAT(A,61 YE= 2.0*R*PHIK CALL CO~FUNIYE,FYI CALL FMULTIS,FV,AI CALL JSUBIAA,S,AI CALL FMUlTIS,FY,BI CALL JADDIBS.S,BI CALL INVERIAA.ASl,KOI
C REESTABLISH MATRIX AA CALL COMFUNIYE,FYI CALL FMUlTIS,FY,AI CALL JSUBIAA,S,A)
C SHELL STIFFNESS MATRIX CALL MMULT IFSH,BS,ASl)
C CALCULATE OEFLECTION OF SHELL DUE TO C.F. calL RMULT IUCFS,FSH,ACCNJ
C CALCULATE ARBITARY CONSTANTS CUE TO C.F. CALL RMUlTIAC,ASl,ACCNI

C FINO TOTAL SU~ ANC CONVERT TO JUNCTION COORDINATES DC 131(:1.4
13 ACCUIK) = CCU{K,ll + UCFSIKI C~LL ROTATEIACCU,UCPS,PHIK,ll
C DEFLECTION OF BEAM AT JUNCTION DUE TO PRESTRESS + D.L. lM=IPE+(WEI-VPI/AL21*FOCEX PP = -PRESF*FGCEX UPIBl11=IPP/BA-ZM*BLl/BIlI/AL UPIB(2)=O.(i UPIBI31~lM/laIl*AL21
UPIBI41=O.O C CALCULATE DIFFERENCE IN P.I. DEFLECTIONS
DO 6 1<=1,4 6 UPIT(KI=UP!B(KI-UCPSIKI
C CALCULATE TOTAL STIFFNESS MATRIX C FIND ARBITARY CONSTANTS FO~ SHELL AND EDGE BEAM
CALL ARBSE CALL S'I'CFS DO a K"'l,NP CCNI5,KI=AL*T*CCUI1,Kl+PR*CCNIZ,Kl CCNI6,KI"'PR*CCN(4,I<I+Al*AL*T**3*CCU(3,KI/IIZ.0*11.0-PR*PRl) CCNI7,KI=-Al*T**3*CCU(4,KI/I12.0*11.0+PRII
8 CONTINUE C CALCULATE INI AND lUI FOR BEAM MI~SPAN
00 q K=1,4 q ACCN(KI=-CCNIK,ll
CALL ROTATE (ACCN,FPIS,PHIK;ll SC~(ll=FPIS(lI/AL+PP
BCN(ZI=(FPISI31-AL*SL1*FPISIII1/AL2+ZM BCNI31=IFPIS1ZI-AL*BL2*FPISIII1/AL2 BCNI41*IBL1*FPISIZI-FPISI41-BL2*FPISI311/AL BCUtl)=BCNI11/IAL*BAI BCUI21",8CN!31/IALZ*BI31 BCUI31=BCNI21/IAL2*etll BCUI41=-BCN(41/IAL*BGZI
C DO LOOP TO CALCULATE VECTORS N,U AND LOADING AT EACH POINT FOR PAR C TICULIR FOURIER TER" BEING CONSIDERED. C RESULTS ARE ADDED ONTO RESULTS FROM PREVIOUS TERMS.
DO 5 L:l, NSECT Cc=cox III SS=SIXILl BN(l,LI=BNll,LI+BCNlll*CC B~IZ,L'=BNIZ.LI+8CN(ZI*CC BN(3,L)=BNI3.LI+BCN(3)~CC
BNI4,LI=BNI4.L)+BCNI41*SS BUll,L)=BUI1,LI+BCUI11*SS BUIZ.LI=BUIZ,LI+BCU(ZI*CC BUI3,LI=BU(3,LI+BCUI31*CC BUI4,LI=BUI4,ll+BCUI41*CC 00 5 K=l,NP A~11,l,KI=ANI1,l,KI+CCN(l,KI*SIX(LI
ANIZ.l,K)=ANIZ,L,K)+CCNI2,K)*COXllI A~(3.L.KI=AN(3,l.KI+CCN(3,KI*COXIL) A~(4.L,KI=ANI4,L.KI+CCN(4,KI*COX(LI AN(5,L.KI=AN(;,L.KI+CC~15.KI*COXILI A~16.L.KI=AN(6,L,KI+CCN(b.KI*COX(LI A~17.L,KI=ANI7,L.K)+CCNI7.KI*SIX(LI AUll.L,KI=AUI1.L,KI+CCUI1,KI*SIXIL) AUI2.L.K)=AUI2,L,KI+CCUI2,KI~COXILI AUI3,l,K)=AUI!,L,K)+CCUI3.K)*COXILI
C
C
AU(4,l,KI=AU(4,L,KI+CCU(4,KI*COX!LI 5 CONTI NUE 1 CONTINUE
RETURN 3 DD12 K=l,NP
CCN!l, K' =0.0 CCN!Z,KJ=ANM(ZI CCN(3,KI=O.O CCN!4,K)=ANMI41 CCU (1, K I =AUM ( II CCU(Z,K)=O.O CCU(3. K J=AUM (3)
1Z CCU(4.KJ=0.O GO TO 7 END
SUBROUTINE EPROP
C TO CALCULATE PRDPERTIES OF EDGE BEAM C
COMMON/EDGEE/TL1,Tl2,~Et,PRESF,PE,VP,BI1,BI3,BG2,BA CO~MON/SHElL/R,G,T.PHIK,E,PR,NSECT,Np,SRN,NONP,Pt,NOO REAO(5,lOOITLl,Tl2,OWEI,PRESF,BAE,BCR,BETGZ
100 FORMATIBFlO.21 . BA=TLl*TLZ WEI·OWEI*BA B=TLZ O=Hl IF(TLl.LT.TL2IB=TLl IF(TLl.lT.TL210=Tl2 tFIBETG2.EQ.0IBETGZa.3333333 BG2=BETG2*IB*B*B*OI/IZ.*ll.O+PRII PE"'PRESF*SAE VP=8.*PRESF*BDR/(G*GI Bll=Tl2*TLl**3/12. BI3=Tll*TL2**3/1Z. WRITEI6,lOlITL1,TL2,BA,WEI,DWEI
101 FDRMAT(IIT10,'PRDPERTIES OF EOGE BEAM'II' DEPTH :',TZ5,FIO.Z I' IB~EADTH =',T25,FIO.2/' AREA =',TZ5,FIO.2/' WEIGHT/UNIT LENGTH :',T 225,FIO.2,'DENSIT'I' :',FIO.2) WRiTE(6,102IBI1.BI3,BG2,BETGZ
102 FORMAT(' lXX :',T25,F10.2I' IVY =',T25,FI0.2/' IZZ ",·,T25.FIO.2,5X 1,'BETA :·,FIO.21
wRtTEI6,t03IPRESF,BAE.BDR,VP,PE 103 FORMAT!' PRESTRESS FORCE =',TZ5,F10.2/' ANC. ECC. =',T25,FIO.4/' 0
lRAPE =',T25,FIO.4/' EQ. VERT. CABLE LOAO :',T25,FIO.3/' ANC. MT. Z'. T25, FlO.2)
RETURN END
l> <5

C
C
C C C
C C C
C C C
C
SUBROUTiNE SURFLO(VARI
COMMON/SHELL/R,G,T,PHIK.E,PR,NSECT,NP,SRN,NDNP,PI,NOO,EDGB CO~MON/STRESS/AN(7,9,12I,AUI6,9,121.AS(6,9.121
COMMON/SICOS/SIXI9I,SIYI121, COX(9I,COVI121 CO~MONfCS/CI91,PI121.ANM(4I,AUM(41
COMMON/UCN/CCN(7,12),CCU(4,121 CO~~ONICOEFS/AL,GAM COMMON/EOGEE/TLl,TLZ,WEI,PRESF,PE,VP,Bll,BI3,BGZ,BA COMMON/BEAMfBU(4,9I,BNI4,9I,BCU(4I,BCNI4) COMMON/BEAMI/ACCNI41,ACCU(4I,FPISI4I,UCPSI4I,UPIBI41,UPIT(4I,UCFS(
14l,FLEXI4,41 COM~ON/NPO/NPOIBI
DATA Tl/'D.L.'I,T2/'L.L.'I,T3/'P.l.'I,T4/'SUML'I,T5f'NE"C'1,T6/'EN ID.'f,T7/'RADL'I,TBI'GENL·f
100 FORMAT(110,FIO.2,IIO) IF (VIR.EO.TBI GOTO 1 REIO(5,1001 KODE,FLOAD,NFX
1 IF(VAR.EQ.Tll GO TO 7 IF(VAR.EO.T21 GO TO 8 IFIVAR.EQ.T7) GO TO 9 {F(VIR.EO.TSI GO TO 13
GENERAL LOAD CASE
13 READ16,1011 KODE,X,y,l,NFX 101 FORMATIIIO,3FI0.2,II01
WR!TE(6,141 KODE,X,Y,I.NFX 14 FORMAT('OGENERAL LOAD CASE'I' KODE NO
110.5/' l :',FI0.5/' NFX :',15) CALL PARTIINFX,X,Y,l.VARI GO TO 11
'DEAD LOAD ROUTINE
7 WRITE(6,121 FLOAD,KODE,NFX
',lSI' X :·,FIO.5/' Y:',F
12 FDRMATI'ODEAD LOAD = ',FI0.5/' KODE NO = ',15/' NFX =',151111 X=O.O Y=FLOAD l=~LOAD CALL PARTI(NFX,X,Y,l,VAR) GO TO 11
RADIAL LOAD ROUTINE
q WRITEI6,10IFLOAD,KODE,NFX 10 FORMATI'ORADIAL LOAD = ',FI0.5/' KODE NO
X=O.O Y=O.O Z=FLOID CALL PARTI(NFX,X,V,l,VARI GO TO 11
',lSI' NFX =',151111
C LIVE LOAD ROUTINE C
8 WRITElb,lol FLOAD,KODE 16 FORMATI'OLIVE LOAD = ',F10.5,'KODE NO ',151
C C TO WRITE RESULTS O~ DISC
C
C C C
C
C
11 CALL OUTPUT 11 W~ITE(lIKODE
WRITEI11«(ANIJ,I,KI,J=I,7I,K=l,NPI,I=1,NSECTI WRITE(111(AUIJ,I,KI,J=l,4I,K=l,NP1,I=l,NSECTI RETURN END
SU8ROUTINE SYCFS
COM~ON/SHELL/R,G,T,PHIK,E,PR,NSECT,NP,SRN,NDNP,PI,NDO,EDGB CO~MON/STRESS/ANI7,9,12),AUI6,9,121,ASlb,9,12) CO~MON/SICOS/SIX(9I,SIY(12I, COX(9I,COV(121 CO~MON/CS/CI91,PI12I,ANM(41,AU"14J
CCMMON/UCN/CCNI7,ll',CCUI4,121 COMMON/COEFS/AL,GAM CO~MON/EDGEE/TLl,Tl2,WEI,PRESF,PE,VP,Bll,BI3,BGl,BA COMMDN/BEAM/BUI4,9),BN(4,9I,BCU(4I,BCN(41 CO~MON/BEAMI/ACCNI41,4CCUI41,FPISI4I,UCPS(4),UPIBI41,UPIT(41,UCFS(
141,FLEX(4,41 CO~MON IABCONI AJ,AK,AJl,AKl,ALM,V CO~MON ISMATI AI4,4I,6(4,41,AA(4,4I,6S(4,4I,KSHI4,41,FZ(4,ll,FYI4,
121,BS114,41,IC(4I,ACC(4! CO~MON/NPO/NPOI81 DIMENSION A114,4I,A2(4,4I,8114,4I,B2(4,4), ENI4I,EU(41 P!=R*PHIK DO 1 I=l,NP V=Pl+PIII Z=PI-P(II CALL COMFUNIl,Fll CALL COMFUNIY,FY) CALL FMULTIAl,FY,AI CALL FMULTIA2,FI,AI CALL FMULTIBl,FY,BI CALL FMUlTIB2,FZ,BI CALL JSU6(41,Al,AZ) CALL JADD 161,Bl,B21 CALL RMULT IEN,Al,ACI CALL RMULT IEU,Bl,ACI DO 2K=l,4 CCNIK.II=CCNIK,IJ+ENIKI CCUIK,I'=CCUIK,II+EU(KI
2 CONTINUE 1 CONTINUE
RETURN END

C SUBROUTINE OUTPUT
C C PRINTS OUT MATRIX ANI1,9,51,AUI6,9,5),AS(6,9.51 C
COMMON/SHELL/R,G,T,PHIK,E,PR,NSECT,NP,SRN,NDNP,PI,NOO COMMON/STRESS/ANI7,9,12I,AUI6,9,12I,ASI6,9,121 COMMON/SICOS/SIXI91.SIYI121. COX(9I,COYI121 COMMON/CS/CI9I,PIIZI.ANMI4I,AUMI41 COMMON/UCN/CCNI1.121.CCUI4.1ZI CO~MON/COEFS/AL.GAM CO~MON/EOGEE/TLl,TL2,WEI.PRESF,PE.VP,BII,BI3,BG2,BA COMMON/BEAH/BUI4,9I,BNI4,91,BCUI4I,BCNI41 COMHON/BEAMI/ACCNI4I,ACCU(41,FPIS(4I,UCPSI41,UPIBI4),UPITI41,UCFSI
141,FLEX14.41 CO~MON/NPO/NPOIBI
DI MENSION DO (61 WRITEI6,2001 SRN
200 FORMATI' RESULTS FOR SHELL·,FIO.5,TIIO,'SEAM ACTIONS'I WRITElb,2081
208 FORMAT(~OHOX IS MEASURED FROM CENTRE-LINE OF SHELLI WRlTElb,Z021
202 FORMATI48H NP IS MEASURED AS ARC DISTANCE FROM CENTRE-LINEIIT5.3H INP,T15,3HN12,T29,ZHN2,T41,ZHRZ,T53,2HM2,T65.2HN1,T11,2HMl,T89,3HMI 22,T98,lHP,TI07.2HMl.Tl16,2HM3,T125,2HMZl
DO 3 JK=I,NSECT WRITElb.201IC(JKI,!BN(I,JKI,I=1,41
201 FORMAT(31HOSTRESSES FOR CROSS-SECTION X =,FI5.5,T95.4IE9.2 I J 00 3 L=l,NP WRITEI6.203IPILI,IANII,JK,LI,I=1,11
203 FORMATIFIO.3,TIO,lOIFIZ.411 3 CONTINUE
IFINO.EO.ll GO TO 10 WRITEI6,2041 SRN
Z04 FORMAT!Z4KIDISPLACEMENTS FOR SHELL,F15.51 WR ITE (6.207)
207 FORMAT(T5,3H NP,T17,lHU,T29,lHV,T41.1HW.T53.6HTHETA2,T65,SHHORIZ,T 117,~HVERT.T9B,lHU,TI07,lHV,Tl16,lHW,T125,5HTHETA)
Z ED=b.1 n*Tl 00 9K"l,NP DO 'I J=l,NSECT AUI5,J,Kl -AUI3.J,KJ*SIYIKl + AUI2.J,KI*COYIK) AUI6,J,KJ=(AUI3,J,KI*COYIKI+AUI2.J,KI*SIYIKII ASIl,J,KI=ANIS,J,KI/T+ANlb,J,KI*ZED ASIZ,J,Kl=ANI5,J,KI/T-ANI6,J,KI*ZED ASI3,J.K)=A~12,J.K)/T+ANI4.J.Kl*lED ASI4,J,Kl-ANI2.J,Kl/T-ANI4,J,Kl*ZEO ASIS.J,KI=ANIl,J,KI/T+ANI7,J,KI*lED
9 ASlb,J.KI=ANll,J,K)/T-ANI7,J,Kl*ZED DO 8 JK=l,NSECT DO 1 1"1.4
1 DOIII=BU(I,JKI/E WRITE!6.205ICIJKI,IODIII, 1=1,41
Z05 FORMAT(36HODlSPLACEMENTS FOR CROSS-SECTION X =,F15.5,T95,4IE'I.2 111
00 8 L=l,NP 00 4 I=l.b
4 DDII)=AUII,JK,LI/E WRITE{6,20bl Pill ,IDOl II, l=l,bl
20b FORHATIFIO.3,T12.6(2X,FI0.411
8 CONTINUE IFINO.EO.2) GO TO 10
C PRINT OUT SURFACE SRESSES
C
c
wRITEI6,210lSRN 210 FORMAT('OSURFACE STRESSES FOR SHELL',FlO.l)
WRITEI6,2111 211 FORMATIT20,'LONG STRESS',T39,'TRANS STRESS',TS9,'SHEAR STRESS'/TS,
I'NP',T15,3I'INT',7X,'EXT',7XII OOllJK=l,NSECT WRITEI6,2011C(JKI DO 12 L=l,NP
12 WRITEI6.2i2IPILI,IASII,JK,LJ,I-I,61 212 FORMAT(FIO.3,TlS,6IFB.2,2XII
10 RETURN END
SUBROUTINE FLEXIB(A,AL)
COMMON/EDGEE/TL1,TL2,WEI,PRESF,PE,VP,BIl,BI3,BG2,6A AL2"AL*AL DIMENSION A14,4) Al=TLl/Z. Bl"TL2I2. AIl,11=1./B~+Al*AI/BIl+Bl*Bl/BI3 AI1.21=-BI/IBI3*ALI AI!,3)=-Al/IBI1*ALI A fl,4 )"0.0 A(Z,1l=AIl.21 A(2,21=1./IALZ*S131+Al*Al/BG2 AI2.3)z-Al*BI/BGZ AI2,41=-AI/BG2 AI3,11=AIl,31 AI3.21=A(Z.31 AI3,31=1./(AL2*Blll+Bl*Bl/BG2 A(3,4)z BI/BG2 A 14,11 =0.0 A(4,21=AI2.41 AI4,31-A13,41 AI4,4)= 1./BG2 DO 1 J=1,4 DO 1 1=1,4 AII,J)=AII,JI/AL2 RETURN END
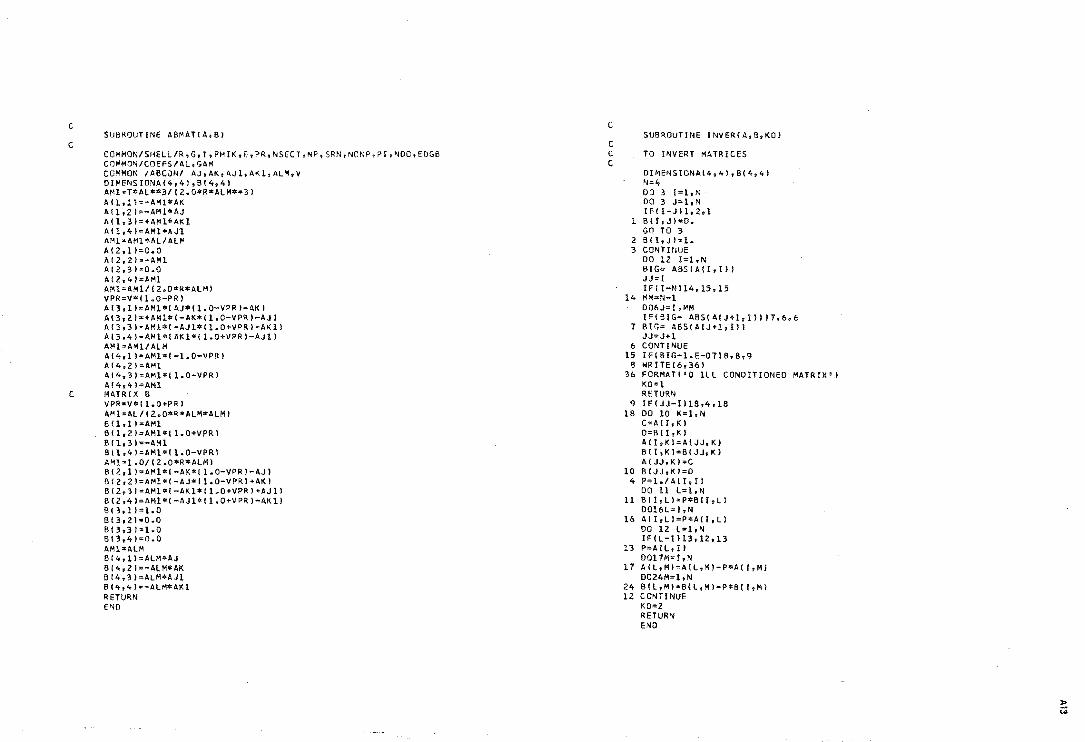
c
C
C
SUBROUTINE A8MATIA.B!
CO~MON/SHELL/R,G.T,PHIK,E,PR,NSECT,NP.SRN,NONP,PI,NOO.EOGB CO~MON/COEFS/AL.GAM
COMMON /ABCON/ AJ,AK,AJl.AKl.ALM,Y 0IMENSIONAI4,41,8!4,4J AMl=T*AL··3/IZ.0.R*ALM··31 All .11=-IIM1*IIK 1111,2 !=-IIMl*AJ A 1 1,3 I =+AM I*AK 1 A!l.4J=AMl*AJl AM1"'AM1*AL/AU' AI2.1)=0.0 I\12,21=-AM1 A(l,31=0.0 A(2,41=AMI AM1=AMl/12.0*R*ALMI VPR=V*' 1.O-PR I A!),I'=AMl*IAJ*!1.0-VPR1-AKI AI3,21~+AM1*(-AK"ll.0-VPRI-AJI AI3.31=AM1*(-AJ1*ll.0+VPRI-AKl1 A!3,41=AMl·'AKl*ll.0+VPRI-AJ11 A!41=AMlIALM A!4.11=AMl*l-l.O-VPRI AI4.l)=AM1 AI4,31=AMl*ll.0-VPRl A(4,41=AH1 MURIX 8 VPR"voq 1.O+PR 1 lI~l=AL/!l.O*~"ALM*ALMI 811,II=AMI BIl,ZI=AMl*(l.O+VPRI B n. 31 x-AMI Sll,41=AMl*ll.0-VPRl AM1=1.0/!Z.0*R*ALMI BIZ,ll=AMl*(-AK*ll.O-VPR1-AJl BIZ.ll=AM1*I-AJ*ll.0-VPR1+AKl B(2,31=AMl*,-AKl*ll.0+VPR1+AJll 8(2,41=AMl·I-AJl*'1.0+VPRI-AKll 813,11=1.0 813.ll=0.0 BI3,31=1.0 B13,41=0.0 AMl=ALM B I 4,11 =AlM*AJ B (4, ll=-AlM*AK 1l14,31=ALM*AJl BI4,41=-AlM*AKl RETURN E'lO
C SUBROUTINE INVERIA.6.KOJ
C C TO INVERT MATRICES C
OIMENSIONAI4,41,B(4,41 '1=4 DO 3 1=I,N DO 3 J=I,N IF( I-Jll.l.l
1 BIJ.JI=O. GO TO 3
l BO,J)"I. 3 CONT Ir!UE
DO 12 I=l,N B I G= A BS ( II I I .I I I JJ=I IF! 1-1'1114.15,15
14 MM=N-l OD6J= I, MM IF(BIG- ABS(AIJ+l,IIIIT,6,6
T BIG= ABS(AIJ+l,Ill JJ:J+l
6 CONTINUE 15 IF(SIG-l.E-07IB,B,9
9 WRITEI6,36) 36 FORMATI'O III CONDITIONED MATRIX')
KO=1 RETURN
9 IF!JJ-1118,4,18 18 00 10 K=l,N
C=A( I,KI O=BII,KI A!I.KI"A(JJ,1(1 BII,KI=BIJJ,KI AIJJ,K)"C
10 BIJJ,Kl=O 4P=I./AII,1I
DO 11 l=l,N 11 BII,ll=P*SII,LI
D016L=I,N 16 AII,LI=P*AII,LI
DO 12 L"'I,N IFIL-IIl3,12,13
13 P=AIL.I) 0017M=I,N
17 AIl,MI=AIL,MI-P*AII,MJ D024M=I.N
24 BIL,M)=BIL,MI-P*BII,MI Il CONTINUE
KO=l RETURN END

C
C SUBROUTINE ARBSE
COMMON/SHELL/R,G.T,PHIK,E,PR,NSECT,NP,SRN,NONP,PI,NOO,EOGS COM~ON/COEFS/AL,GAM
COMMON/BEAM1/ACCN(4),ACCUI4I,FPtSI41,UCPSI41,UPISI41,UPIT(4I,UCFSI 14I,FLE)(14.41 CO~MON ISMATI AI4,41,B(4.4I,AAI4,41.BSI4,4I,KSH(4,4I,FZ(4.21,FY(4,
121,BS114,4I,ACI41,ACCI41 CO~MON IABCONI AJ,AK,AJ1,AK1,ALM,V OIMENSION SI4,4I,TOTFI4,4I,TOTK{4,41 CALL ROTMLTIS,AA,PHIKI CALL FLEXIBIFlEX,ALI CALL ~MULT (TOTF,FLEX,S) CALL ROTMLT IS.BS,PHIK)
C SUM TO OBTAIN TOTAL FLEXIBILITY MATRIX TOTF(I,JI DO 31 2 1,4 DO :3 J ·1 ....
3 TOTF!I.J! TOTFII,JI + SII,J) CALL INVER ITOTF,TOTK,KO)
C FINO ARBITARY CONSTANTS FOR S~ELL AND EDGE BEAM CALL RMULTIACC,TOTK,UPIT!
C FIND TOTAL ARBITARY CONSTANTS FOR SHELL AND EOGE BEAM DO 14 I = 1,4
C
C
14 ACII! 2 ACIII + ACCII) END
SUAROUTINE ROTATE IA.B,ANG,KI
C IF K=l, TO ROTATE FROM SHELL TO JUNCTION COOROINATES C IF K:2, TO ROTATE FROM JUNCTION TO SHELL COORDINATES C A-SHELL CDORDS., B- JUNCTION ceOROS. C
OI~ENSION A141,B(4) C=COS!ANGI S=SINIANGI IFIK.EQ.2) GOTO 2 8!1I=AIl! B!21=AIZI*C-AI31*S BI31~A(ZI*S+AI31*C BI41=A(4)
150 FOR~AT(lH ,8EIO.3) RETu~N
2 Al11=8111 AI21~R(2!*C+BI31*S A(3'=-BIZI*s.e!31*C AI4J=BI4J RETURN E"<O
C
C C C C C
C
C C C
C
C C C
SUBROUTINE CO~FUN(y,FI
COMPLEMENTARY FUNCTION PROGRAM TO CORRECT FOR SYMMETRICAL STRESSES AT EDGE. TO OBTAIN MATRIX F FOR Y=Y
COMMON/COEFS/AL.GAM COMMON lAB CONI AJ,AK,BJ,BK.BM DIMENSION F!4.21 P:IlM*V Ql=EXPI-AJ*PI Q2=EXP(-BJ*P J Pl"COSIAK*PI P2=SINIAK*PI P3:COSIBK*PI P4=SINIBK*PJ F 11,1 J =Q1*P1 FIl,Z)=Ol*P2 FIZ,l):-Q1*PZ FIZ,ZI=Ql*Pl FI3.11=Q2"'P3 F 13 ,2 J=OZ*P4 F(4,l,=-QZ*P4 FI4.Z)=Q2*P3 RETURN END
SUBROUTINE FMULTIB,F,AI
B=A*F
DIMENSION BI4,"'I.F(4,21,AI4,4) 00 1 1=1,4 DO 1 J=I.Z BII.JI=AII,11*FI1.J)+AII.21*F(Z,J)
1 BII.J+Z'=AII.31*FI3.J)+AII.4J*F(4.JJ RETURN END
SUBROUTINE RMULT(C,A,BJ
DIMENSION C(41,AI .... 4I,BI4J DO 1 1=1,4 s-o. on 2 J=1.4
2 S=S+AII,JJ*BIJ! 1 C III=S
RETURN END

C
C SUBROUT[NE MMULT(C,A,BI
C C=A*B C
c c
D[MENSION AI4.41.RI4,4J,CI4,4) DO 1 1:1,4 DO 1 J:l,4 S=O. DO ;2 K"'I,4
2 S=S+A([,KI*BIK,JI 1 CII,JI"S
RETURN END
SUBROUTINE JAOD(C.A,BJ
C C"A+J*B
C
C
DIMENSION CI4,4J.B(4.41,A!4.41 00 1 !"1,3,2 00 1 J=I,4 C! I • J I "A ( I tJ ) + B f ! ,J I CII+l,JI=AII+l,JI-B! [+I.JI RETURN E'JO
SUBROUTINE JSUBIC,A,BI
C C-=A-J*B c
0IMENSIONA(4,41.B(4,41.C!4,41 DO 1 !=1,3,2 DO 1 J=1,4 CII ,JI=A( [,J I-BII.JI
1 C(I+l.JI"A(!+l.JI+B([+l,JI RETURN END

c ********$**$*.$*.*$**$*~****.**********$*.**~***~*.*********$* •• *****.**$* C C O.K.J. - MAINLINE PROGAM - NO EDGE BEAMS C TO FIND ACTIONS AND DISPLACEMENTS IN A CIRCULAR CYLINORICAL C SHELL SUBJECT TO SURFACE LOADS, OR PRESTRESSING LOADS IN C SHELL SURFACE C C ***** •• ******$*****.* •••• ***.************************* ••• *********-**.**** C
COMMON/SHELL/R,G,T,PHIK,E,PR,NSECT,NP,SRN,NDNP,PI,NDO CO~MON/STRESS/AN17,9,121.AU(6,9.121.AS(6,9,12J COMMON/SICOS/SIXI91.SIYllZ). COX19l,COYl121 COMMON/CS/C(9),PIlll,ANMI4),AUMI41 COMMON/UCN/CCNI7,lZI,CCUI4,12) COMMON/COEFS/AL.GAM COMMON/NPO/NPO(BI COMMON/XBY/XU1,BETA,YMAX ,PXU,WK COMMON/KO/KODE,A,FA,F,FR,NN,Ne,NS,NC,NSH CO~MON/FOURT/HI5,12,41
CO~MON/GENY/Y(5) DATA T1/'D.L.·I,T2/'L.l.·I,T3/'P.L.·I,T4/·SUMl·I,T5/·NE~C·1 IT6/'EN
lO.'I,T11'RADL'I,TBI'GENL'1 DIMENSION TITLEI20! CALL ~~SKO PI:3.1415927
5 READI5,llOIITITLEII),I=1,201 WRITEI6,1101ITITLEII1,I=1,201
RFWINDI R=WIND3 REWINDS
110 FORHATI20A41 READ15.1001 R,G,T,PHIK,E,PR,SRN
100 FOR~ATI8G10.01 101 FORMATI4H1SRN,T6,lH=,FIO.3,2lHISHELL REFERENCE NO. 1/2H R,T6,lH=,
5F10.3, 1 8HIRADIUSJ/2H G,T6,lH=.F10.3,17HILENGTH OF SHElLl/2H T,T6.2H = 2,F10.3,20HITHICKNESS OF SHELLl/5H PHIK,T6,lH=,F10.5,33HIHALF INCLU 3UDED ANGLE IN RADIANSl/2H E,T6.1H=.FIO.O,16HIYOUNGS MODULUSl/4H P 4R,T6,lH=.F10.5.16H(POISSONS RATIOI!
WRITEI6,lOlISRN,R,G,T,PHIK,E,PR READ15,1021 NSECT,NP,NDO IFINDO.GT.3INDO=3 IF(NP.GT.12INP=12 IFINSECT.GT.9INSECT=9
NONP=NSECr*NP 102 FOR~ATIBI101
WRITE(6,1031 NSECT,NP,NDO 103 FORMATI6H NSECT,T6,lH=,IIO,23HINO. OF CROSS-SECTIONSI/3H NP,T6,
llH=,I10,32HINO. OF POINTS ON CROS5-SECTIONI/4H NOO,T6,I10,l5HITYPE 1 OF OUTPUT REQUIREDll
READI5,lOOI ICIII,I=l,NSECTI Cl11=0.0 CINSECTI=Gll.O WRITEI6,l051 ICII),I=l,NSECT!
105 FORMATI5SH POSITIONS OF CROSS-SECTIONS MEASURED FROM CENTRE OF SHE 1LL/1H ,9F12.41 RE~D(5,100I IPIII,I=l,NPI
PI1J=R*PHIK WRITEI6,104J IPIII,I=l,NP)
104 FORMATI91H POSITIONS OF POINTS ON CROSS-SECTIONS, MEASURED FROM C
C
C
lENTRE-LINE OF SHELL AS ARC DISTANCE/IH ,5F12.41 8 READI5,110! VAR
11 DO 3001=1,12 D0300J=l,9 D0303K=1.6
302 AU(K,J,II=O.O 303 ASIK.J,II=O.O
D0300K=I,7 300 ANIK,J,II=O.O
IFIVAR.EO.Tl.OR.VAR.EQ.T21 GO TO 2 IF(VAR.EQ.f31 GO TO 9 IFIVAR.EQ.T4) GO TO 16 IFIVAR.EQ.T51 GO TO 5 IFIVAR.EO.T&1 GO TO 25 IF(VAR.EO.T71 GO fO 2 IFIVAR.EQ.T81 GO TO 2 WRITEI6,lOl
10 FORMATI'MISTAKE IN LOADING FORMAT'I STOP
2 CALL SURFLD IVARI GO TO 8
9 CALL PRESlD GO TO 8
18 CALL SUMLO GO TO 8
25 WRITE(6,1091 109 FORMATI14H JOB COMPLETED)
END
SUBROUTINE PRESlD
COMMDN/SHELL/R,G,T,PHIK,E,PR.NSECT,NP,SRN,NDNP,PI.NDO COMMON/XBY/XU1.BETA,YMAX ,PXU,WK CO~MON/GENY/Y(5) CO~MON/FOURT/H(5,12.41
COMMON/KO/KODE,P,FA,F,FR,NN,NB,NS,NC,NSH READt5,lOl) KODE,P,FA,F,FR,NN,NB,NS,NC,NSH,PXU,WK
l02FOR~ATI15,4FI0.2,5I5,2F5.51 WRITEI6,l03! KODE,P,FA,F,NN
103 FORMAT('OKODE = ',I5/aX,' PRESTRESS FORCE = ',F10.2/8X,' ANCHORAGE 1 ECCENTRICITY • ',FIO~5,5X.'DRAPE = ',FI0.5/8X,'NO OF FOURIER TERM 2S = ',15/11)
WRITE16,1041 FR,NB,NS,NC,NSH,WK,PXU 104 FORMATISX,' FR = ',F10.l,ZX,' NB = ',15.lX,' NS = ',IS/ax,' NC = •
l,15,2X,' NSH = ',15/' WOBBLE FACTOR IWKI ',F6.5,'COEFF. OF FRI 2CTION IPXUI= ',F6.511111
REWIND 3 REWIND 8 CALL CHAPl CALL CHAP2 CALL CHAP3 CALL CHAP4 RF.TURN END

C SUBROUTINE PARTIfNFX,X,V,Z,VARI
C C PARTICULAR INTEGRAL SUBPROGRAM C LOADING IS TAKEN IN FORM C X=XSINIXlCOSIV),V=VCOSIXlSINIVl,Z=ZCDSIXlCOStVI C
COMMON/SHELL/R,G,T,PHIK,E,PR,NSECT,NP,SRN,NONP,PI,NDO,EDGS COMMON/STRESS/ANI7,9.1ZI,AUI6.9,lZl,ASlb.9,lZ) COMMON/SICOS/SIXI91,SIYtlZI, COXf91,COYIIZI COMMON/CS/Cf91.PIIZI.ANMI41.AUMt41 COMMON/UCN/CCNI7.1ZI.CCUI4,lZI COMMON/COEFS/AL.GAM COMMON/NPO/NPOISI DATA T1/'D.L.'/,TZI'L.L.'/,T3/'P.L.'I,T4/'SUML'/,T5/'NEwC'1,Tbl'EN
ID.'I.T7/'RADL'/,TS/'GENL'/ 150 FORMATISFIQ.OI
C lNITIALIlE REQuiRED CONSTANTS NPOO=l XSI"-1.0 PI:3.14159Z7 GAM-I.0/R BE4~3.ll-PR.PRI/IR*R*T.T)
D"IT*"31/11Z.0*II-PR*PR)) 00 4 IJ=l,NP
GAMY"PIIJI/R SIVIIJ)=SINIGAMYI
4 COYIIJlaCOSIGAMYI C DO LOOP'FOR CARRYING OUT FOURIER DISTRIBUTION IN X DIRECTION
00 1 J"l,NFX C ESTABLISH COEFFICIENTS DEPENDENT ON PARTICULAR FOURIER C TERM BEING CONSIDERED
AM"'Z*J-l AL"IAM'"Pll/G V4=IAL**4/BE4114.0 DO 2 IJ-l,NSECT ALX-AL*CIIJ) COXIIJl=COSIALXl IFfCI IJI.EQ. IG/Z.O) I COXIIJ)"O.O
Z SIXIIJI=SINIALXI GA"GAM/AL GA2=GA .... Z FAC-tl.Q+GA*GAI**Z DEN-1.0·V4*FAC**Z XSI=-)(51 FOCEX2 14.0*XSI)/IPI*AMI )(l"X*FOCEX Yl=Y*FQCEX ll-Z*FOCEX HX=IIR*IPR-GAZII/IAL*Y*OENI)*Xl HV=IR*GA*IGlZ+Z.O·PRI*Y1l/IAL*T*OENI Hl2IR*R"FAC*Zll/IT*DENl FX-tV4*FAC*IGAZ-PRI*XII/IAL**3*DENI FV=IIV4*F4C*11.0-PR*GA21+1.Ql*Yll/IAL*AL*GAM*DENl FZ=IR*Zll/tAL*AL*DENI H=HX+HY+HZ F2FX+FY+FZ ANHIll"-AL*GAM*F ANMIZI~I-AL·AL·F+YI/GAMI ANM(3)=I-D*AL**3'*IGA*GA2+GA*IZ.O-PRll*H
C C C
ANMI41=(PR+GA21*O*AL*AL*H AUMIll=AL*tPR-GAZl*F/T+XlllT*AL*ALI-PR*vl/IT*AL*GAMI AUMIZ)=AL*AL*IPR*G-l.OI*F/IT*GAMl-PR*Xl/IT*AL*GAMl+Yll(T"GA~"GAMI+
IHY/IGAM"RI AUMI31=H AUMI4l=GAM*H IFIVAR.EQ.T71 GO TO :3 00 7 K=l.NP CCNI1,K)=ANMtll*SIYIKI CCNI2,KI=ANMIZl*COYIKl CCNI3,KI=ANMI]I*SIVIKI CCNI4,Kl=ANMI41*CQYIKI CCUI1,KI-AUMIll*COYIKl CCUI2,KI=AUMIZI*SIY(K' CCUI3.KI=AUMI31*COYIK) CCUI4,KI=AUMi41*SIYIKI
7 CONTINUE CALL SYCFIAL.8E41 DO 8 K"l,NP
'CCNI5.KI=lL*T*CCUIl,KI+PR*CCNI2,KI CCNlo,KI=PR*CCNI4,K)+AL*AL*T**3*CCUt3,Kl/llZ.0*11.0-PR.PRI I CC~17,KI=-AL·T."3.CCUt4.KIIIIZ.0.11.0+PRll
8 CONTINUE 00 LOOP TO CALCULATE VECTORS N,U AND LOADING AT EACH POINT FOR PAR TICULAR FOURIER TERM BEING CONSIDEREO. RESULTS ARE ADDEO ONTO RESULTS FROM PREVIOUS TERMS. DO 5 L"'1,NSECT 00 5 K"lt NP CC=COXILl*COYIKl CS=COXILI*SIYIKI SS=SIXILl*SIYIKI SC=SIXIL'*CDYIKI ANIl.L,Kl=ANI1,L.Kj+CCNI1,Kl*SIXILl ANIZ.L,KI=ANIZ,L,KI+CCNI2.Kl·COXILI ANI3.L,KI=ANI3.L,Kl+CCNI),KI*CDXILI ANt4.L,Kl·ANI4,L.Kl+CCNI4,KI*COXILI ANIS,L,Kl=ANI5,L.K)+CCNIS.Ki*COXILI ANI6,L,KI=ANlb,L,KI.CCNlb.KI*COXILl AN(7.L,KI=ANI7.L,Kl+CCNI7,K)*SIXILI AUI1,L.KI=AJI1,L,KI+CCUI1,KJ*SIXILI AUI2.L,Kl"AUIZ,L,KI.CCUI2,KI*COXILI AUI3,L,KI=AUI3.L,K).CCUI].KI.COXILI AUI4.L,KlzAJI4.L,Kl+CCUI4.KI*COXILI
5 CONTINUE 1 CONTINUE
RETURN 3 DO b K=l,NP
CCNIl,KI=O.O CCNIZ.KI=ANMI21 CCN(3,Kl=O.Q CCNI4,KI=ANMI41 CCUI1,KI"AUMIlI CCUI2,Kl=O.O CCUI3.KI"AUMI31
b CCUI4,KI=O.O GO TO 7 END

C
C
C C C
C C C
C C C
C C C
C C C
SUBROUTINE SURFLDIVARI
COMMON/SHELL/R,G,T,PHIK,E,PR,NSECT,NP,SRN,NDNP,PI,NOO COMMON/STRESS/ANI7,9,l21,AUlo,9,12I,ASlo,9,12) COMMON/SICOS/StX\9I,SIYIIZI, COXI91,COYI121 COMMON/CS/C(91,Pt12I,ANMI4I,AUM(41 COMMON/UCN/CCNI1,l21,CCUI4,121 COMMON/COEFS/AL.GAM COMMON/NPO/NPO!81 DATA T1/'D.L.'I,T2/'L.L.·I,T3/·P.L.'I,T4/·SUML'I,T5/·NE~C·1 ,Tbl'EN
1D.'I,T1I'RADL'/,TB/'GENL'1 IF (VAR.EQ.TSI GO TO 1
100 FORMATII10,FIO.2,IIOI RE~DI5,lOOI KODE,FLOAD,NFX
1 IFIVAR.EQ.Tll GO TO 1 IFIVAR.EQ.T21 GO TO B IFIVAR.EQ.T11 GO TO 9 IFIVAR.EQ.TSI GO TO 13
GENERAL LOAO CASE
13 READI6,lOll KODE,X,Y,l,NFX 101 FORMATI110,3F10.2,IIOI
WRITEI6,141 KODE,X,Y,Z,NFX 14 FORMATI'OGENERAL LOAD CASE'I' KODE NO
110.5/' I .',FlO.5/' NFX 2',151 CALL PARTIINFX,X,Y.Z.VARI GO TO 11
DEAD LOAD ROUTINE
7 WRITEI6,121 FLOAD,KODE,NFX
',lSI' X :',FIO.5/' Y.',F
12 FORMATI'ODEAD LOAD. ',FIO.5/' KODE NO = ',15/' NFX =',15//11 x=O.O
9 10
8 16
TO
Y=FLOAO l=FLOAO CALL PARTIINFX,X,Y,Z,VARI GO TO 11
RAOIAL LOAD ROUTINE
WRITE(6,lOIFLOAD,KOOE,NFX FORMATI'ORADIAL LOAO * ',FIO.5/' X-O.O Y~O.D
Z~FLOAD CALL PARTI(NF~,X,Y,Z,VARI GO TO 11
LIVE LOAD ROUTINE
WRITEI6,161 FLOAO,KOOE
KODE NO
FORMAT('OLI~E LOAD ~ ',FI0.5,'KODE NO
WRITE RESULTS ON DISC
',15/' NFX =',15//11
• ,IS,
11 WRITEIIIKOOE WRITEl111(IAN(J,t,K"J=1,11,K=1,NP),1~1,NSECTI WRITEI1)[((lU(J,I,KI,J=1,4I,K~1,NPI,I*l,NSECTI RETURN END
C
C
C
c
C C
SUBROUTINE SYCFIAL,BE41
COMMON/SHELL/R,G,T,PHIK,E,PR,NSECT,NP,SRN,NDNP,PI,NDO,EOGS CO~MDN/STRESS/AN(7,9,12I,AUI6,9,121,ASI6,9,12)
COMMON/SICDS/SIXI91,SIY(12), COXI9I,COY(12) CO~MDN/CS/C(9I,PI121,ANM(4) AUMI41 COMMON/UCN/CCNI7,12I,CCUI4, COMMON/NPO/NPOISI OIMENSION AB14,4J,S14,41 DIMENSION WI4,41,ACI4I,AI4,4',BI4,4I,FYI4,2I,FZI4,21 DIMENSION AlI4,4I,A214,41,Bl(4,4),B214.41. ENI41,EU(4) DIMENSION W!(4,4) .EF(41 ESTABLISH CONSTANTS NOT DEPENDENT ON Y ANO l
101 FORMAT(6E12.41 BT=BE4·*.25 ALM=SQRTIAL*STI V=AL/BT AJI=SQRTIISQRTI1.O+(1.0-VI·*ZJ-1.0+VI/2.0) AJ=SQRTIISQRTI1.0+11.O+VI**2J+1.O+VI/2.01 AK=1.O/(2.0*AJI AK1=1.O/12.0*AJ11 KO=O.O Pl=R*PHIK ESTABLISH MATRICES A AND B CALL ABHAT IT,AL,ALM,AK,AJ,AKl,AJ1,V,PR,R,A,BI FIND ARBITARY CONSTANTS FOR SHELL FOR EACH CROSS-SECTION AND COMPLEMENTARY STRESSES Z= 2.0*R*PHIK CALL COMFUNIZ,FZ,AJ,AK,AJl,AK1,ALMI CALL FMULTIS,FZ,A) CALL JSUBIW,A,SI CALL INVERIW,WI,KOI EF(1)=CCNI1,ll EF(2)~-CCNI2,11
EFI3':CCNI3.11 EF(41=-CCNI4,11 CALL RMULTIAC,WI,EFJ DO 1 I=l,NP Y=P1+PIII Z=PI-PIII , CALL COMFUNIZ,FZ,AJ,AK,AJ1,AK1,ALMI CALL COMFUNIY,FY,AJ,AK,AJl,AKl,ALMI CALL FMULTIA1,FY,A) CALL FMULTIA2,FZ,A) CALL FMULTIBl,FY.BI CALL FMULTIB2,FZ,B! CALL JSUSIA1,Al,A21 CALL JADO (B1,81,B21 CALL RMULT IEN,Al,AC) CALL RMULT IEU,Bl,AC) DO ZK=1,4 CCNIK,I'=CCNIK,I)+ENIK) CCUIK,I'=CCU(K,II+EUIKI
2 CONTINUE 1 CONTINUE
RETURN END

C
C
C
SUBROUTINE CHAPI
COMMON/XBV/XUl,8ETA,VMAX ,PXU,WK COMMOI>;/FOI:lRT/H COMI'!ON/GENY/V COMMON/KO/KOOE,P,FA,F,FR,NN,NB,NS,NC,NSH COI'!MON/SHELL/R.XL,T,PHIK,E,XU.NO.NY.SRN,NONP,PI OIMENSION Q(S,ZO.41,HI5.l2,4I,YISI.X(ZO,51 IFINC.EQ.41NS=2 iFINC.EQ.1INS=1 IFINS.GT.51NS=S
C INITIALIZE XUl=I.-)W ..... 2 BETA=13.*XUI/IR*TI"*21**.Z5 YMAX*R"'PHIK 00 5 1"I.S 00 5 Ke 1.20 00 5 .1"1,4 IFIK.GT.12IGOTOS HII.K,Jl*O.
S Q(!,K,Jl"O. YIll"FA SNIl=2*NIl GOTOIl.Z,Z.11,21,NC
C CURVATURE AND WOBBLE LOADS 2 IFINC.EQ.SlNS3NS-l
IF(NS.EQ.ll DY=O.O IFINS.EQ.ll GO TO 10 SNS=NS-l OY=F/SNS D031"2,NS
3 VIII"YII-ll+OV 10 OX=XL/SNB
)(I1,1I"OX/2. 00 4 1=2,NB
10 XII ,1I=xlI-1,1I+OX CALL LINEIF,XL.X,PA,P,R,NB,FR,PXU,WKI CALL EOGEIX,Q,OY,NB,NS,Yl CALL FOURIPI,SNB,NB,NS,Q,H,X.XL,NNI GO TO Il,7,31o,11,71,NC
C ANCHORAGE LOADS
C
11 YIII-FA-R/lOO. YIZl=FA+R/lOO. NS=2. PA"P/2. GO TO 7
1 PA=P 7 SNB=2*NSH
PIT"P II( 2.*SNe I PA~B.*SNB/IPI*XLI"PA DO 6 N"1,NN XN"2*N-l
8 HI1,N,1IaPA/XN*SINIXN*PITI*SINIXN*PI/2.1+HI1,N,11 WRITE16.2031 IHI1,N,1I,N~1.NNI
203 FORMAT IIOEIO.41
C OUTPUT 34 DO 9 K=1,4
C
C
DO q l"l,NS DO 9 .I3 1,NN
9 HII,J,KI=-HII,J,K) GO TO (12,lZ,12,13,771,NC
77 007BJ*I,NN 007BK:lvio 00791"1,1'15
79 H(NS.Z-I,J,Kl~HINS+l-I,J,KI H(2,J.Kl=0.5*H(2,J,Kl
7B HIl,J,Kl=HIZ,J,KI DO B01 3 1,NS
SO VINS+Z·II=VINS+I-II VIll-FA-R/lOO. V(21-FA+R/100. NS=NS+l GO TO 1Z
13 DO 14 Kal,Io 00 14 J=l,NN
14 H(Z.J,KI=HI1,J,KI lZ FOOL =0.
RETURN END
SUBROUTINE FOUR IPI,SNB,NS,N5,Q,H,X.XL,NNI
C TO OBTAIN FOURIER COEFFICIENTS FOR DISTRIBUTED LOADS C
DIMENSION XI20,SI,HIS.12.41,QIS,20,41 TQ=B./PI TS=PI/IZ.*SNBI 00 3 N=l.NN XN=N*2-1 SI-TQ/XN*SINIXN*TSI AN",XN*PI/XL 00 3 "'''1,1'18 C=X I 14, ll"AN CU .. COSICI SU=SINICI 0031"'1,1'15 DO :3 L=l,::! G=QII,M,Ll IFIGI4,3,4
10 GO TO IS,6,bl,L 5 CB=SU
GO TO 7 I> CB:CU 7 HIl,N,LI"HII,N,LI+Ca*SI*G .3 CONTINUE
RETURN ENO

C
C
C
C
SUBROUTINE CHAP2
CO~MON/FOURT/HI5.12.4) COMMON/GENY/\I CO~MON/XBY/XU1,BETA,YMAX
COM~ON/KO/KOOE.P,FA.FB,FR,NN.NB.NS.NC.NSH COMMON/SHELL/R,XL,T,PHIK,E,XU,NO,NY,SRN,NONP,P[ 0IMENSIONA(4,4),BI4,4I,QFI4),FI4,2I,EN(41.C114,4),C214,41,A114,41,
IB1{4,4I,B214.41,A2(4,41,ElI4,41.EZI4,4),AKI14,41,AKZI4,41,\l151,A81 214I,AB214I,ABT(4),EB(4J.GI41.VAI41,EU(41
REWIND 8 0=T*$3/112 ."'XUl I Y2=2."'PI*R 0021:1.4
2 QF I [lsO. COMPLIMENTARY FUNCTION. SOLUTION 001N=I,NN XN"2"'1<l-1 00 141:1,4
14 E"I(I):O. AN=XN*PI/XL AN:>"AN."':> BM=SQRTIAN"'BETAI CM"ANIBETA AJ=SQRTIISQRTI1.+Il.+CMI.*ZI+1.+CMI/Z.1 AK=.5/AJ BJ=SQRTIISQRTI1.+(1.-CMI**ZI-1.+CMI/2.1 BK-.5/BJ CALL ABMATIT,AN,BM,AK,AJ,BK,BJ,CM,XU,R,A,BI WRITEISI N,AJ,AK.BJ,BK,BM,AN
101 FORMATIBEIO.31 WRITE!SI A,B ARBITARY CONSTANTS FROM LOADED GENERATORS 00 15 I=loNS 0022K=1,4
2Z QfIKI=HII,N,KI Y"YZ-Z.*VIII CALL COMFUNIY,F,AJ,AK,BJ,8K,BMI CALL FMULTIC1,F,BI CALL JAOOIBI,B,Cll CALL FMULTtCZ,F,AI CALL JSUBIA1,A,CZI CALL INVERIB1,EZ.KOI
100 FORMATISIIOI GO TO (5.41.KO
4 CALL MMULTIAKl.AI.E21 Y=2.*VIII CALL COMFUNIY,F,AJ,AK,BJ,BK,BMI CALL FHULTICI,F,BI CALL JAOOIB1.Cl,BI CALL FMULTICZ,F.AI CALL JSUBIAl,CZ,AI CALL INVERIB1.El,KOI GO TO 15,61,KO
6 CALL MMULTIAKI,Al.Ell 00 B L=I,4 00 8 J=I,4
B AKIIL,JI-AKIIL.JI-AKZtL.JI CALL INVERIAK1,AK2,KOI
C
C
C
C C C C C
GO TO (S,71,KO 7 CALL RMUlTIVA,AKZ,QFl
CAL COM FUN CALL ~MULT(AB1,El.VAI CALL RMUlTIABZ,E2,VAI Y-YMAX-VfII Z=Y2-l. *v I II-Y CALL COMFUN(y,F,AJ,~K,BJ,BK,BMI CALL FMULTICl,F.AI CALL COMFUNIZ,F,AJ.AK,BJ,BK.BMI CALL FHULTIC1,F.AI CALL JSUBIA1,CZ,Cli CALL RHULTIEU,Al,AB21 DO 9 L=1,4
9 ENILI=ENILI-EUILI 15 WRITE(B) ABI,ABZ
ARBITARY CONSTANTS FOR EDGE OF SHELL lXV=Z.*YHAX CALL COMFUNllX\I.F,AJ,AK,BJ,BK,BHI CALL FMULT{CZ,F,AI CALL JSUBIAl,C2,AI CALL INVERIA1,AZ,KOI GO TO (5,54"KO
54 CALL RMUlTIABT,A2.ENI WR ITE I S I ABT
10 WRITEI6.106IN,EN 106 FORHATC'O',15,4IG15.8,5XII
1 CONTINUE 16 RETURN
5 CALL EXiT ENO
SUBROUTINE COHFUNly,F,AJ,AK,BJ,BK,BMI
COMPLEMENTARY FUNCTION PROGRAM TO CORRECT FOR SYMMETRICAL STRESSES AT EDGE. TO OBTAIN MATRIX F FOR ,yay
DIMENSION FI4,ZI P=BM*Y Ql"EXI'I-AJ*PI Q2=EXP(-!lJ*PI PltCOSCAK*PI P2"SINIAK*PI P:>-COSISK*PI P4=SINIBK"'PI FI1.ll=Ql*Pl F I1,ZI "Ql*P2 FI2,1I,.-Ql*P2 FIZ,21=Ql*Pl F(3,1I=QZ*P3 Ft3.ZJ"QZ*P4 FI4.11--QZ*P4 F{4.ZI=QZ*P3 RETURN END
l> ..., o

C
C SUBROUTINE CHAP]
COMMON/GENY/IIA COMMON/CS/CIII,V COMMON/KO/KODE,P,FA,F,FR,NN,N6,NS,NC,NSH CO~MON/SHELL/R,XL,T,PHIK,E.XU.ND.NY.SRN,NDNP,PI DIMENSIONVI12I,VAISI,EU(4),ENI4I,FYI4.2J,FZ/4,2I,A/4,4),6(4,41,ABI
1!4"AB2(4).ASTI4).AlI4,41,A214.41.S114,41,S214.41,H!35,81 REWiND 3 REWIND 8
C READ AND PUNCH DIMENSIONS AND CONTROL NX=2"'NN-l Y2=Z.*PI"'R YMAX=R"'PHIK
C OBTAIN VECTORS NAND U 15 READIS) N,AJ,AK,SJ,BK,BM,AN
READIS' A,S DO 2 l"bNY 00 2 J=loS
2 HH,J'=O. KA=2 DO ., 1( .. 1,I\IS READIS) ABI. AB2 YlzVAIK) 00 6 I"l.NY IFIYI-VII»4,5,5
5 KU*Z Y-Yl+V I I' I"YI-VII) GO TO 1
4 KU-3 Y~Y ll)-Vi lzY2-2.$Yl-Y GO TO 1
6 CONTINUE KU=l KA=l READIS) ABT 00 13I s l.NY Y"VI[)+YMAX Z"YMA)(-YII) GO TO 1
13 CONTINUE WRITE(3) N DOlll"lrNY
11 WRITEI3' IHII,J,.J-l,8J IFlNN-N'14,14.1S
1 CALL COMFUNIY,FY,AJ.AK,BJ.BK,BMJ CALL COMFUNIZ,Fl,AJ,AK,BJ.6K,BMJ CALL FMULTIA1,FY,A) CALL FMULTIA2.FZ,A) CALL FMULTIB1,FY,BI CALL FMULTIS2,FZ,B' CALL JSUSIAl,Al,AZI CALL JADDIB1.81,S2) GO TO IS.9,lO',KU
9 CALL RMULTIEN,Al.AB1) CALL RMULTIEU,Bl,ABl) GO TO 11
C
C
10 CAll RMUlTIEN,Al,AB21 CALL RMUlTIEU.Bl,AB21 GO TO 11
8 CALL RMUlTIEN,Al,ABTJ CALL RMULTIEU,Bl,ABTI
11 00 12 J z l.4 HI!,JJ~EN{JI+HII,J)
12 Hll,J+41~EUIJI+HII.J.41 GO TO 113,6,6J,KA
14 RETURN END
SUBROUTI NE ASMAn T. AL. ALM, AK, AJ, AKI. AJ I, V. PR, R. A, B)
DIMENSfONA(4,4"BI4,41 AM1"T*AL""'3/12.0*R*ALM**3' AIl,lI=-AfoIl*IIoK AI1.2)"-AMl*AJ AI1.3'=+AM1*AKl A!l,4)=AM1"'AJl AMlzAMl*Al/ALM A lZ,1I-0.0 AIZ.Z'--AMI A(2,3)=0.0 AI2.4).AMl AMI-AM1/12.0"'R*AlMJ VPR=V*Il.0-PR' AI3,I'zAM1*(AJ*ll.O-YPR)-AKI AI3.2):+AMl*I-AK*II.0-VPR'-AJI AI3,3)=AMl*I-AJ1*11.O+YPR'-IIoKl) AI3,4):AMl*IAKl"'ll.0+VPRI-AJll AM1=AMI/AlM AI4,1)"AMl*l-l.O-VPR) AI4.21=1I1'I1 AI4,3':AM1*11.0-VPR) AI4,41"/lMl
C MATRIX B VPR=V*ll.O+PR) AMl=AL/12.0*R*ALM*ALM) B 11,11"1101'11 Bll,21=AM1*ll.O+VPRI SI1,31--AMI Bll,4'''AMl*11.0-VPRI AM1-1.0/12.0"'R*ALM' BIZ,l,zAM1*I-AK*ll.0-vPR'-AJ) BlZ,ZI=AM1*I-AJ*ll.0-VPRI+AK) BI2,3)=AM1*I-AKl*ll.0+VPR)+AJl) BI2,41=AM1*(-AJ1*ll.D+VPR)-AKl) B(:3,1I"1.0 BI3.2)"0.0 BI3.3'=1.0 BI3,4)=0.0 AM1=ALM SI4,11:ALM*AJ SI4,Z)=-AlM*AK BI4.3)=ALM*AJl SI4,4':-ALM*AKl RETURN ENO
l>
'"

C SUBROUTINE OUTPUT
C C PRINTS OUT MATRIX ANI7,9,5"AUlb,9,5I,ASI6,9,S' C
C
COMMON/SHELL/R,G,T,PHIK,E,PR,NSECT,NP,SRN,NDNP,PI.NO COMMON/STRESS/AN(7,9,121,AUI6.9.121,ASI6,9,121 COMMON/SICOS/SIX(91,SIY(121, COX(91,COYI121 COMMON/CSIC(9I,PI12I,ANM(41,AUMI41 COMMON/UCN/CCNI7,121,CCU(4,121 COMMON/COEfS/AL,GAM COMMON/NPO/NPO!SI OIMENSlON 00161 ' WRITE16,2001 SRN
200 FORMATI' RESULTS FOR SHELL',FIO.51 WRITEI6.,zOSI
20B FORMATI40HOX IS MEASURED FROM CENTRE-LINE OF SHELLI WRITE 16,2021
202 fORMATI48H ~P IS MEASURED AS ARC DISTANCE FROM CENTRE-LINE/IT5,3H INP,T15,3HN1,z,T,z9.2HN,z,T41,2HR2.T53,2HM,z.T65,,zHN1,T77,2HM1.T89,3HMl 221
DO 3 JK=l. NSECT WRITEI6,2011 CIJKI
201 FORMATI31HOSTRESSES FOR CROSS-SECTION X .,F15.51 DO 3 L-l,NP WRITEI6.,z03IPILI.IANII,JK.LI,r-I,71
203 FORMATIFIO.3,TlO.IOIF12.4)1 3 CONTINUE
IFINO.EQ.l) GO TO 10 IIRITEI6.,z041 SRN
204 FORMATIZ4HIOISPLACEMENTS FOR SHELL,FI5.51 WR ITEI6,Z071
207 FORMATIT5,3H NP,T17,lHU,T29,lHV,T41.1HW,T53,6HTHETA,z,T65,5HHORIZ,T 177,4HIfERTI
DO e JK=l,NSECT WRITE16,2051 CIJKI
,z05 FORMATI36HOOISPLACEMENTS fOR CROSS-SECTION X ",F15.51 DO 8 L-l,NP DO 4 1-1,6
4DDII'-AUII,JK,LI/E WRITE16,,z061 PILI.IDDI II,I=I,~>1
206 FORMATIFlO.3.TI2,612X,FI0.411 a CONTINUE
IFINO.EQ.,zl GO TO 10
C PRINT OUT SURFACE SRESSES C
WRITEI6,210ISRN ,z10 FORMATI'OSURFACE STRESSES fOR SHELL',FIO.ll
WRITEI6.2111 ,z11 FORMATIT,zO,'LONG STRESS',T39,'TRAHS STRESS',T59,'SHEAR STRESS'/T5,
l'NP',T15,31'INT',7X,'EXT',7XII DOIZJKsl,NSECT WRITEI6,201lCIJKI DO 12 L"'l,NP
12 WRITEI6,,z1,zIPlll,IASI[.JK.LI,I~1,61 212 FORMATIFIO.3,Tl5,6IFB.,z,ZXII
10 RETURN END
C
C SUBROUTINE CHAP4
COHMON/SHELl/R,XL,T,PH1K,E.XU,NO,NY,SRN,NDNP,PI,NDO COMMON/KO/KODE,P,FA,FS,FR,NN,NB,NS,NC,NSH COMMON/GENY/VA COMMON/CS/X,V DIMENsrONXI91,CHI1,z"SHI12I,ENI4I,EUI41,QIIOa,7I,
IV(12I,CIIOI,SIIOI,HC!7l,VAISI,HDI7I,QAIIOe,7) REWIND :I REWINO 8
100 FORMATI4E14.SI KU"'ND*NY CA"'T**3/11Z.*ll.-Xu**,z)I KUP .. O OO:lI-l,KU 003J=l,7 QA(I,J)"'O.
3 Q! I,J):O. DOU-ltNY CH(IlzCOSIIf(II/R)
I SHIII=SINIVII)/R) 16 READ(3) N
XN-,z*N-l AN:J(N*PlIXL DO,zI-I.ND CII):COSIAN*XIII)
2 SIII-SINIAN.XIIII CAT=CA*AN**,z*ll.-XU**21 CAS"CA*ll.-XU)*AN D04I"ltNY READI31 EN,EU HC121=EN121 HCI41=EN(41 HC171=EN131 HCIII-XU*HCI21+AN*T*EUI11 HCI31=XU*HCI41+CAT*eUI31 HCI 51"EN III HCI61--CAS*EUI41 HD 11I"'EUI 11 HDI,zI"EUI,z1 HDI31=EUI:l1 HD(41"EUI41 004K"ltND l=K*NY+I-NY QIL,ll.QIL,ll+HCI11*C(KI QAIL,ll-QAIL,ll+HDI11*SIKI D09J:Z,4 QIL,JI:QIL,JI+HCIJI.CIKI
9 QAIL,JI.QAIL,JI+HDIJI*CIK) D08J"5,6
a QIl,JI=QIL,JI+HCIJI*SIKI 4 QIl,71=QIL.11+HCI71*CIK)
IFINN-NI115.115,16 115 WRITE(1)I(ODE
IIRITEI111IQIL.5',QIL,,zI,QIL,7I,Qll,41,Qll,1',QIL,3I,QIL,6Il,L-l,ND 1NPI
WRITEIIIIIQAIl.JI,J=l,41.l=1,NDNPI 5002 FORMATI·O',2X,I3,713X,G15.7)1
27 RETURN END

C SUBROUTINE SUMLD
C C TO ADD COMBINATIONS OF LOADING FROM DISC READY FOR OUTPUT C
COMMON/SHELL/R,G,T,PHIK,E,PR,NSECT,NP,SRN,NDNP,PI,NDO COMMON/STRESS/AN!1,9,lZI,AUI6,9,121,ASI6.9,121 COMMON/SI COS IS IXI91 ,S IY 11ZI, COX(9) .C,OY 11211L0AD/XYZ 13,9,121 COMHON/CS/CI91,PI121,ANMI41,AUM(4J COMMON/UCN/CCN(1,12),CCU!4,12) CO~MON/COEFS/AL,GAM
COMMON/NPO/NPOl81 DIMENSION DANI1,9,12),OAUI6,9,12I,DASI6,9,121 Z ED"6.1( T"n
11 00 300 1"'1,12 D0300J=1,9 003031<=1,6
302 AUIK.J,II-O.O 303 AS{K.J.I'=O.O
003001(=1.1 300 ANIK,J,I'=O.O
C KOOE NOS. OF RESULTS TO 8E AODED REAOI5,1001INPOIII,I-l,81
100 FORMA Tl8 Uo I wRITEI6,1011INPOIII,I-1,8)
101 FORMAT!' ............................. '11' ................................................ *** .. .. I'll' KODE NOS OF RESULTS THAT HAVE SEEN AODEO'IIBIIDIII' ............... .. 25$5$$$$$$$$$$$$5$5$$$$$$$$$$$$$$$$$'1/1
DOIL a l. 8 REWIND 1 IF !NPOlll.EQ.O) GO TO 2
.. READ III KODE IFIKOOE.EQ.NPOllll GO TO 3
IF(KOOE.EQ.O) GO TO 5 READ III 1(IOANIJ,I,KI,J"1,1),K"l,NP),I"1,NSECTI READ III II(OAUIJ,I.KI,J-l,41,1("1,NP',I=I,NSECTI GO TO 4
5 WRITEI6,10Z' KOOE 102 FORMATI' RESULTS FOR KODE -'.110,' CANNOT BE FOUND"
1 CONTINUE 2 CONTINUE
C CALCULATE SURFACE STRESSES AND HOR AND VERT DEFLECTIONS 00 8 I z l,NP SIYII lzSINIP( II/R'
e COYIIlzCOSIPIIl/RI 00 9K"l,NP 00 9 J=l,NSECT AUIS,J,KI • -IAUI3,J,K'*SIYII() + AUIZ,J,K'*COYIKI' AUlb,J,KI=IAUI3,J,K'''COYIKI+AUIZ,J,KI''SIYIK" ASll,J,K)zAMIS,J,K"T+ANI6,J,KI*ZED ASI2,J,K'=ANI5,J,I()/T-ANI6,J,K'*ZEO AS(3,J,KI"ANI2,J,K'/T+ANI'o,J,KI*lEO ASI4,J,KI-AN(2,J,KI/T-AN(~,J.KI*lED ASI5,J,K)"ANfl,J,K)/T+ANI7,J,K'''ZED
9 ASI6,J,KI.AMll,J,KI/T-ANI1,J,KI"ZED CALL OUTPUT RETURN
3 READ III IIIOANIJ,I,K),J"1,71,K=1,NPI,I-I.NSECT) READ III IIIOAUIJ.I,K),J=1,41,K"l,NPI,I=1,NSECTJ
C ADD TO EXISTING RESULTS
C
C
00 6K=1.NP 00 6J=lt NSEC T 00 11=1.1
7 ANII,J,KI .. ANII,J,KI+ OAN{I,J,KI 00 61"'1,4
b AUII,J,KI z AUII,J,K!+ DAUII,J,KI GO TO 1 END
SUBROUTINE INVERIA,B,KDI
DIMENSIONAI4, .. "BI .. ,41 N=4 00 3 ["l,N 00 3 J-1,N iFII-Jl1.Z,l
1 SII,JI"O. GO TO 3
2 SII,JI"l. 3 CONTINUE
DO 12 l=l,N 81G- ASSIA!!,!I) JJ"I IFII-NIl4,15,15
14 14M:N-l 006J"I,MM IF(BIG- ABSIAIJ+I,[1117,6,6
1 8IG .. ABSIAIJ+I,I', JJ=J+l
6 CONTINUE 15 IFIBIG-l.E-01IB,a,9
8 WRfTElb,36) 36 FORMATI'O ILL CONDITIONED MATRIX')
KO"l RETURN
9 IFIJJ-I)18,~,la 18 00 10 Ka l,N
C=AII,K) 0=6 (I ,K I AII,KI:AIJJ,KI SII,K'''SIJJ,K' AIJJ,KI=C
10 III JJ, K )-0 .. P=l./AII'[ I
00 11 L=1,N 11 BII,L'.P"BII,Ll
D016l=I,N 16 AII,LI=P"AfI,LI
00 12 l=I,N IF f L-I I 13,12, 13
13 P=AILtI' 0017M=I,N
17 AIL,MI=AIL,~I-P*AII.M' 0024M:l,N
24 SIL,M,,,8fL,MI-P"Sfl,M) 12 CONTINUE
KO"Z RETURN END

C
C C C
TO CALCULArE LINE - LOADS ALONG CABLES
DIMENSION XI20,51,EIZO,8J,PBIZOl,PCI201.PRIZOI BN=Z"NS A=4.*F/XL"'*Z D)(-XL/SN A2:2.*A DO 1 I"l.NS T"XCl,ll*A2 TZ"T**Z IFIF.NE.O.I GOT0300 0=0.0 XII,ZlsO. GOT0303
300 0"-TZ/IA2"Rl XII,2l s F-TZ/14.*Al
303 OZ·0 .... 2 AS-SQRTll.+OZ+TZ*oZI AC-SQRT 11. +T 21 EII.11·AZ .. AS/AC .... 3 AO--l. I IAS""C I Ell ,Zl-T*AD EII,31"AO EII,41-0*ITZ+1.'''AO EII,51-0X*AC EI 1t61=1./AC EII,71,,-T/AC EII,SI-O. IFIFR.EQ.O.OI GO TO 7 IFIF.NE.0.IXU-FR*XL/14.*P*FI PRI1,,,P-FR*IBN-l.I/BN PBI11=EI1,ll*PRlll
5 PCIll=XU*PSI11 oO;n-Z,NS PRIII·PRII-11+PCII-11*EII-l,51 PSIIl=EII.ll"PRlll
Z PCIl)-XU*PBlll WRITEI6,ZOOI xu
200 FORMATI'O xu- ',F7.31 IFlXUl 8,3,11
8 PUN-IPRINSI+PCINBl*EINB.5l*O.5-Pl/FR IFIABSIPUNl-.02l3,3,4
4 XU-11.-PUNI*XU GO TO 5
3 00 6 I=l,NB 00 6 J=l,3
6 XI{,J+ZI=-IEI{,J+11"PBIII+EII,J+51"PCIIII*AC AL"ATANI4.*F/XLI PA-P*COS I AU RETURN
7 PCINal= P"'I~K + XU*EINS,1ll PRINB) "P-0.5*PCINB)*EINB.5) P8INS) • PRINSl*EINS,ll PCINBl" PBINBI*XU + PRINBI*WK NBB-NB-1 009I=ltNBB J=NB-I
C
c C C
PRIJJ " PRIJ+l'-PCIJ+11*EIJ+1.51 PBIJI ~ PRIJI*EIJ,ll
9 PCIJI = XU*PBIJI+PRIJI*WK FRzP-PRIII-O.5*PCI11*EI1.51 WRITEI6,2011FR
201 FORMATI' CABLE LOSS ALONG HALF CABLE = ',FB.2) GO TO 3 END
SUBROUTINE EOGE (X.Q.OV,NB,NS,V!
TO DIVIDE LINE - LOADS BETWEEN GENERATORS
DIMENSION X120,51,Q15,20.4J,Y151 DO 1 M"l.NB DO 2 1=1.NS CA"XIM.21+VIII-VIII {FICA) 3.3,2
Z CONTINUE 3 A=O.
{FIOY.NE.OIA--CA/oY Bz1.-A 00 1 J"l,3 QII-l.M.JI-QII-l,M,JI+A*XIM,J+ZI
1 QI!.M,JI*Qll,M,JI+S*XIM.J+21 RETURN END

C SUBROUTINE MMULrlC.A,Bl
C C C=A*B C
DIMENSION AI~,~I.BI4,~I,CI~,~1 DO 1 !"l.~ DO 1 J=l,4 S"O. DO 2 I("l,~
2 S=S+AII,KI*BIK,JI 1 CII.JI"S
RETURN END
C SUBROUTINE JSUBIC.A,BI
C C C=A-J*e C
DIMENSIONAI4,4I,BI4,4I,CI4.41 DO 1 1"1,3,2 00 1 J"'1.4 CII.JI",AII,JI-BII,JI
1 CII+l,JI"AII+l.JI+BII+l,JI RETURN END
C SUBROUTINE JADOIC.A,BI
C C C"A+J*B C
DIMENSION CI4,41,BI4,41,AI4,41 00 1 1-1.3,2 00 1 Ja l." CII,JI=AII,JI+BII,JI
1 CII+I,JI=AII+l,JI-BII+l,JI RETURN END
C SUBROUTINE RMULTIC,A,BI
C C C=B*A C
C
C
DIMENSION CI4l,AI4."',B(4) 00 1 !=1." S=O. DO 2 J=I,"
2 S=S+AII,Jl*BIJI 1 CIII"S
RETURN, END
SUBROUTINE FMUlTIB,F,AI
C B=A*F C
DIMENSION B(4,~I.FI4,2!.AI",41 DO 1 1"1,4 DO 1 J"'l,2 BII.JI=AII.11*FII.JI+AII.2'*FI2,J'
1 BII,J+21=AII,31*FI3,JI+AII,4)*FI4,J) RETURN END
Bl
APPENDIX B
B.l STEEL TENSILE TESTS
Tensile tests were carried out on an Avery 25,000 lb
testing machine using test specimens 8" - 10 \I long. The
extension was measured over a 2" gauge length using a Baty
(0.0001") extensometer.
Typical load strain curves for both the prestressing
and cold drawn wires are given in Figures B.l and B.2.
Figure B.3 shows a typical load strain curve of a length of
cold drawn wire which has had a wire spot welded across it
within the 2" gauge length.
B.2 MORTAR PROPERTY TESTS
For each concrete mix, Table B.I lists the mixes ~sed,
the position in the shell where each mix was used and the
age of the mix when the shell was prestressed and tested.
Compression Tests. These tests were carried out on 4 11 x 2"
cylinders,which had been capped with dental plaster, loaded
at a rate of 2000 Ib/in2/min. Results obtained are given
in Table B.2. The apparent decrease of some mortar strengths
with age is due to the fact that good quality cylinders were
tested first. In addition a number of cylinders were strain
gauged circumferentially and longitudinally to obtain values
of Young's modulus and Poission's ratio. It was attempted
to load thes~ cylinders also at 2000 Ib/in2/min, but this was
not completely achieved due to the time taken to measure and
record the strain readings. Table B.3 lists the results
obtained.
Tests. Tensile tests were performed on ---------------------------

(Ib~)
1
o o
1 LOA
·005 strain
0.128" diAmeter
1 ___ ------ - --
0·105 "dIameter ",..."..-
"""'"
Q·10S"diame-ter ultimate toad::: 2500 tbs ultimat. str.ss::: 288,000 Ib/in2
.Ias tic modulus::: 26·2 x 106lblin2 0,2-1. offset::: 21001bs 1 °/. elongation::: 19S0 Ibs
STRAIN CURVE FOR PRESTRESSING STEEL
82

600
400
200
load (lbs)
ultimatE' load: 560 lbs ultimate- sl,E'ss: no,ooo Ibs/ln2 e-Iastic modulus: 28·2 x 1oStblln2
o~------~------~--------~--------o strain -01
FIG.S.2 LOAD-STRAIN CURVE FOR COLD DRAWN WIRE
300
200
load ( lbs)
100
14 g- 0·080" diamE't.r cold drawn wir. spot WE'ldttd one. within 2" gaug. l@'ngth
·005
ultimat. load: 300 lbs ultimat. str.ss: 60.000 Ib/in2
strain -01 FIG.8.3 LOAD-STRAIN CURVE FOR SPOT WELDED WIRE
83
·015

B4
a number of 4" x 2" cylinders at a loading rate of 1200 lb/in2/
min, measured at the maximum cross-section. Load was distrib
uted by 1/8" x I" x 5" ivory board strips.
The tensile splitting strength, f t , was calculated
by the formula:
P 1TRL
where p = total splitting load
R = radius of cylinder
L= length of cylinder
Values of f t obtained are given in Table B.4.
Bending Tests. Slabs, 24" x 6" x 0.6", were tested in
bending to obtain values for Young's modulus and ultimate
flexural tensile stress for the shell section. The slabs were
simply supported over a distance of 1'-6" and line loaded
equally at their third points. Thus there was constant moment
across the midspan third of the slab. Loading platforms and
supports were made from 111 diameter steel bar and extended
the full width of the slab. Strain gauges were mounted
longitudinally at midspan, on both the top and bottom surfaces
of the slabs. Midspan deflections were measured with 0.0001"
graduated deflection gauges. Testing was carried out by
loading each slab in increments of 10 lbs to failure. At
each load increment, strain and deflection measurements were
taken. It was found that initially both strains and displace-
ments were linear with load.
Values of Young's modulus were calculated using the
initial linear slope of the load-strain and load-deflection
curves, and by assuming linear elastic behaviour of the slabs.
Initially the tests were carried out using an Avery
25,000 lb test machine, but considerable difficulty was
experienced in obtaining accurate deflection measurements.

BS
Later a small test frame was constructed where deflection
measurements could be accurately obtained, the slabs being
loaded by hanging weights at the third points. Results from
slabs tested on the frame indicated that a lower value of
Young's modulus was being obtained by ,using deflection measure
ments than by using strain measurements. Thus in an effort to
solve the dilemma a number of extra slabs were made and tested
from mixes identical to those used for the shells. Two of
these slabs were prestressed longitudinally. Results obtained
from the original slabs and extra slabs are given in Table B.S.
Ultimate flexural tensile stress was obtained by calcu
lating the stress at midspan when cracking first began, assum
ing linear elastic behaviour of the slab.

B6
I
FOR I SHELL i MORTAR POSITION IN AGE AT AGE AT AVERAGE AGE MIX CODE SHELL PREST- TEST SHELL
RESSING PRESTRESS- TEST (days) (days)
ING
1 1,1 (one piece 49 58 49 58 (
1,2 (shell 49 58 I
2 2,1 (traverse + 88 115 76 103 (end
2,2 (segments 88 115
2,3 centre 54 80 segment I
3 3,1 centre 80 130 I 57 107 segment
3,2 (traverse + 46 96 (end
3,3 (segments 46 96
4 4,1 end 46 60 34 48 segment !
4,2 traverse 28 42
4,3 end 39 53 segment
4,4 traverse 24 38
4,5 centre 32 46 segment
5 5,1 traverse 41 48 32 39
5,2 end 35 42 segment
5,3 traverse 31 38
5,4 end 27 34 segment
5,5 centre 23 30
I segment
N.B. The centre segments of shells 2 and 3 were constructed
together and thus mixes 2,3 and 3,1 are the same mix.
TABLE B.1 MORTAR MIX CODE

B7
SHELL MIX AGE AVERAGE NUMBER AVERAGE COMMENTS CODE (days) f' (psi)
c TESTED psi
1 1,lP 11 6,350 2
1,2P 11 5,570 2 }5,950 stripping
1,1 49 7,140 3 }7,700 prestressing 1,2 49 8,430 3
1,lP 62 9,500 3 }9,300 4 days after 1,2P 62 9,100 3 test
2 2,lP 91 8,500 3
2,2P 91 9,700 3 }9,200 prestressing
2,1 125 10,500 2
2,2 125 8,400 2 7,690 4 days after
2,lP 125 5,550 2 test
2,2P 125 6,300 2
3 3,lP 182 7,550 3
3,3P 148 7,150 3 }7,350 42 days after
test
4 4,4 23 7,260 3
4,5 31 7,400 3 }7,330 prestressing
4,1 64 6,700 3
4,2 46 6,610 3
4,3 57 5,200 3 6,204 4 days after
4,4 42 7,160 3 test
4,5 50 5,350 3
5 5,1 56 7,680 3
5,2 50 7,850 3
5,3 46 8,500 3 8,050 8 days after
5,4 42 7,490 3 test
5,5 38 8,710 3
P after mix code indicates the test specimen was air-vibrated.
TABLE B.2 MORTAR COMPRESSION TESTS ON 4" x 2" CYLINDERS

B8
SHELL MIX AGE E x -6 10 (Secant POISSONS CODE (days) Modulus) RATIO
2 2,1 131 5.53
2,2 131 5.74
3 3,2 148 6.04
3,2 148 .130
3,3 148 .124
TABLE B.3 YOUNG'S MODULUS AND POISSION'S RATIO VALUES FROM STRAIN GAUGED 4" x 2" CYLINDERS
SHELL MIX . AGE AVERAGE NUMBER AVERAGE COMMENTS CODE (days) f t (psi) TESTED psi
3 3,1 182 1,350 2 ) 42 days after
3,lP 182 923 2 ) test )
3,2 148 1,250 2 )1160
3,3 148 1,160 2 ) )
3,3P 148 1,100 1 )
4 4,1 67 935 3 ) 7 days after
4,2 49 904 1 ) test ) 931
4,3 60 926 3 )
4,5 53 950 3 )
5 5,1 57 896 3 ) 9 days after
5,2 51 796 3 ) test )
5,3 47 855 3 ) 780
5,4 43 750 3 ) )
5,5 39 760 3 )
P after mix indicates the test specimen was air-vibrated
TABLE B.4 TENSILE TESTS ON 4" x 2" CYLINDERS

B9
MIX AGE E x 10-6 CALCULATED FROM f t CODE (days) STRAIN DEFLECTION 1st CRACK
1,1 90 5.75 1080
1,2 90 5.95 918
2,lP 91 5.85
2,lP 91 5.7 5.4 1080
2,2P 91 5.05
2,2P 91 5.33 5.2 1115
3,2 148 6.16 1160
A 46 5.6 4.9 1100
A 48 5.7 5.1 1150 \
A 46 5.3
Average 5.7 5.1
4,3 63 4.0 665
B 41 4.7 3.96 474
B 41 5.0 3.8
B 41 4.38 4.36
B 44 4.4 780
B 50 4.2
B 50 4.1
Average 4.5 4.1
SLABS PRESTRESSED LONGITUDINALLY TO AN AVERAGE STRESS OF 500 PSI
A 48 5.52 5.65
B 41 4.32 4.4
P after mix code indicates the test specimen was air-vibrated
Mix A - identical to that used in shells I, 2 & 3
Mix B identical to that used in shells 4 & 5
~~~B~~5 BEAM FLEXURE TEST RESULTS


![library.tee.grlibrary.tee.gr/digital/m2401_2500/m2422/m2422_majowiecki.pdf · — suspended roofs — cable trusses — single and multilayer nets [2] Membrane structures — prestressed](https://img.pdfslide.us/doc/110x75/5f03f25d7e708231d40b8dff/a-suspended-roofs-a-cable-trusses-a-single-and-multilayer-nets-2-membrane.jpg)