Embed Size (px)
Citation preview
i
Table of Contents Executive Summary ...................................................................................................................................... ii Project Management ..................................................................................................................................... 1 Quality Assurance / Quality Control ............................................................................................................ 2 Organization Chart ....................................................................................................................................... 3 Hull Design and Structural Analysis ............................................................................................................ 4 Development and Testing ............................................................................................................................. 6 Construction ................................................................................................................................................. 9 Project Schedule ........................................................................................................................................... 11 Construction Drawing .................................................................................................................................. 12
List of Figures Figure 1: Man Hours break down ...................................................................................................... 1 Figure 2: Cross section of the canoe .................................................................................................. 4 Figure 3: Moment diagram for all loading cases ............................................................................... 5 Figure 4: Team members dry mixing ingredients ............................................................................. 6 Figure 5: The expended shale aggregate, Stalite ............................................................................... 6 Figure 6: Compression test using the UTM Machine ....................................................................... 7 Figure 7: Concrete slab being test in a four-point bending test ......................................................... 8 Figure 8: Dry mix preparation and organization ............................................................................... 9 Figure 9: The Styrofoam mold before drywall is applied ................................................................. 9 Figure 10: Placing the bottom layer on the mold ................................................................................ 10 Figure 11: Tiling and the interior design of the canoe ........................................................................ 10
List of Tables Table 1: Canoe Specifications .......................................................................................................... ii Table 2: Concrete Properties ............................................................................................................ ii Table 3: Milestones Chart ................................................................................................................. 1 Table 4: Maximum Bending Moment & Stress per Loading Case .................................................. 5
List of Appendices Appendix A: References .......................................................................................................................... A1 Appendix B: Mixture Proportions ........................................................................................................... B1 Appendix C: Example Structural Calculation ......................................................................................... C1 Appendix D: Hull Thickness/Reinforcement and Percent Open Area Calculations ............................... D1
ii
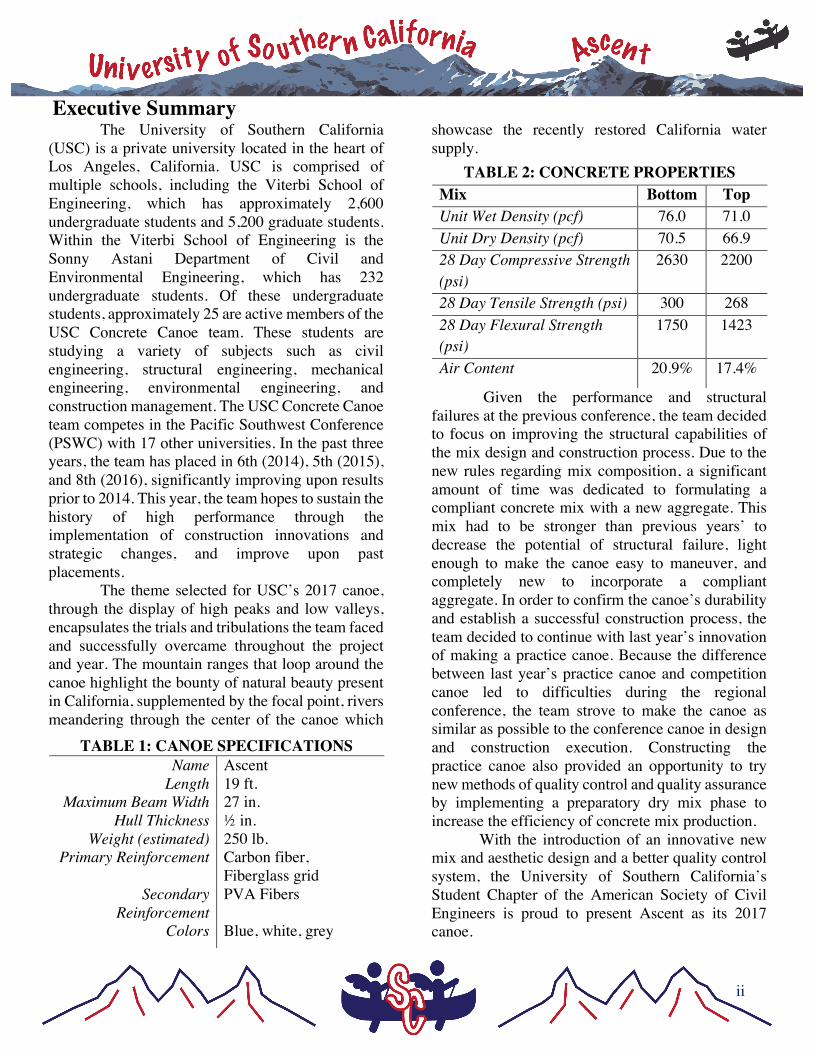
Executive Summary The University of Southern California
(USC) is a private university located in the heart of Los Angeles, California. USC is comprised of multiple schools, including the Viterbi School of Engineering, which has approximately 2,600 undergraduate students and 5,200 graduate students. Within the Viterbi School of Engineering is the Sonny Astani Department of Civil and Environmental Engineering, which has 232 undergraduate students. Of these undergraduate students, approximately 25 are active members of the USC Concrete Canoe team. These students are studying a variety of subjects such as civil engineering, structural engineering, mechanical engineering, environmental engineering, and construction management. The USC Concrete Canoe team competes in the Pacific Southwest Conference (PSWC) with 17 other universities. In the past three years, the team has placed in 6th (2014), 5th (2015), and 8th (2016), significantly improving upon results prior to 2014. This year, the team hopes to sustain the history of high performance through the implementation of construction innovations and strategic changes, and improve upon past placements.
The theme selected for USC’s 2017 canoe, through the display of high peaks and low valleys, encapsulates the trials and tribulations the team faced and successfully overcame throughout the project and year. The mountain ranges that loop around the canoe highlight the bounty of natural beauty present in California, supplemented by the focal point, rivers meandering through the center of the canoe which
showcase the recently restored California water supply.
Given the performance and structural failures at the previous conference, the team decided to focus on improving the structural capabilities of the mix design and construction process. Due to the new rules regarding mix composition, a significant amount of time was dedicated to formulating a compliant concrete mix with a new aggregate. This mix had to be stronger than previous years’ to decrease the potential of structural failure, light enough to make the canoe easy to maneuver, and completely new to incorporate a compliant aggregate. In order to confirm the canoe’s durability and establish a successful construction process, the team decided to continue with last year’s innovation of making a practice canoe. Because the difference between last year’s practice canoe and competition canoe led to difficulties during the regional conference, the team strove to make the canoe as similar as possible to the conference canoe in design and construction execution. Constructing the practice canoe also provided an opportunity to try new methods of quality control and quality assurance by implementing a preparatory dry mix phase to increase the efficiency of concrete mix production.
With the introduction of an innovative new mix and aesthetic design and a better quality control system, the University of Southern California’s Student Chapter of the American Society of Civil Engineers is proud to present Ascent as its 2017 canoe.
TABLE 1: CANOE SPECIFICATIONS Name Ascent
Length 19 ft. Maximum Beam Width 27 in.
Hull Thickness ½ in. Weight (estimated) 250 lb.
Primary Reinforcement Carbon fiber, Fiberglass grid
Secondary Reinforcement
PVA Fibers
Colors Blue, white, grey
TABLE 2: CONCRETE PROPERTIES Mix Bottom Top Unit Wet Density (pcf) 76.0 71.0 Unit Dry Density (pcf) 70.5 66.9 28 Day Compressive Strength (psi)
2630 2200
28 Day Tensile Strength (psi) 300 268 28 Day Flexural Strength (psi)
1750 1423
Air Content 20.9% 17.4%
1
Project Management This year proved to be extremely schedule
driven for USC’s Concrete Canoe Team due to external impacts affecting several key activities during the initial phases of the canoe process. Originally, the team intended to follow the schedule employed for That ‘70s Canoe by virtue of its success however, as the semester progressed, discrepancies arose. Early on in the academic year, school-initiated renovations of the team’s working area were identified as the obstacle with the most consequential, long lasting impact. The team was required to reorganize its inventory and relocate to an area more convenient in order to make room for incoming faculty. Subsequently, the schedule was modified and, as a result, all mix development was condensed to a four-week period, limiting the float available to make mix design adjustments after initial testing. After the development and testing cycle concluded, per the initial schedule, a three-week period was intended for the construction of the new mold. However, the team was again required to forfeit access to its work space for approximately 2.5 weeks. This duration of time was critical to the casting of the practice canoe. In a turn of fortune, the team’s preservation and sustainability tendencies allowed for the reuse of the mold from That ‘70s Canoe, enabling the team to remain on schedule and successfully cast the practice canoe. Although the practice canoe was a high priority for the team, it was not necessary to compete at PSWC, thus rendering it inactive on the critical path. Moreover, the constructability of the canoe was unclear due to time constraints stemming from lack of constant accessibility to a work area. Therefore, the activities displayed as part of the critical path are those that are necessary to the team’s participation at PSWC. The activities identified as critical to the
ultimate goal of substantial canoe completion began with construction of the mold for the competition canoe and continued through its Pour Day, curing and finishing timeline. In spite of the numerous scheduling difficulties faced during the fall semester, all key milestones were completed successfully while still meeting the team’s high standards of quality.
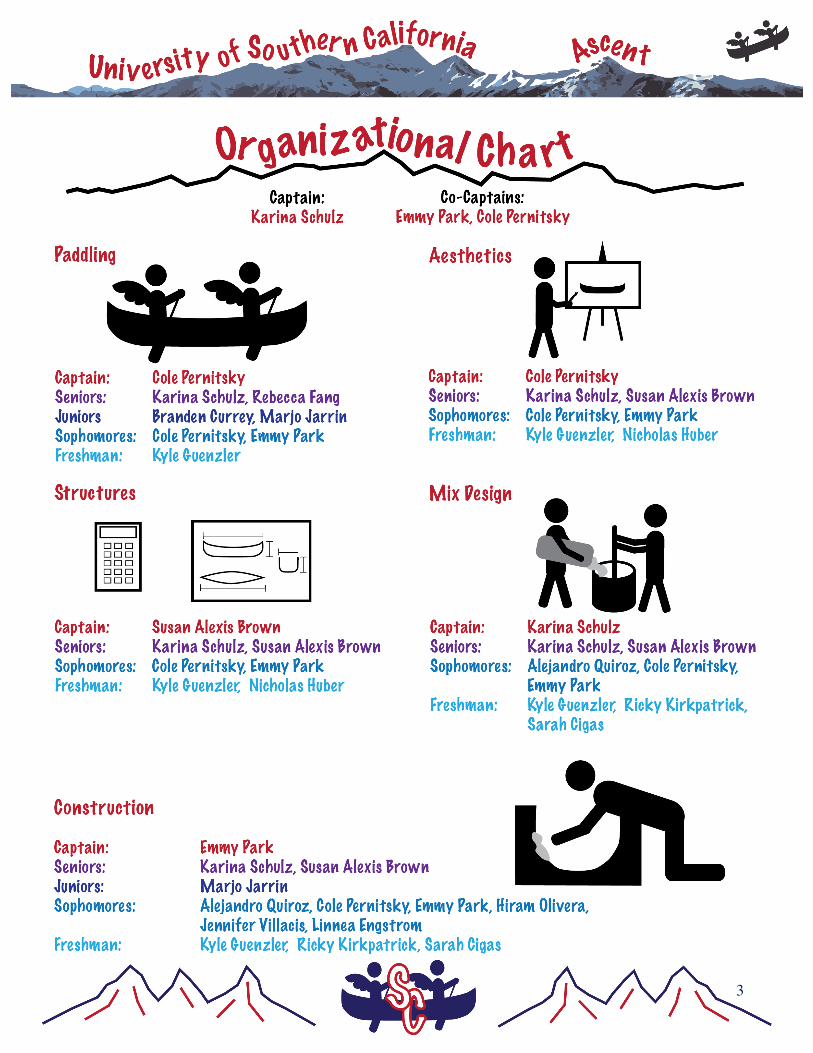
After reflecting on last year’s augmented costs, a more accurate project cost estimate was created, allowing for a streamlined cash flow breakdown. To ensure continued budgeting success, a tracking system was enacted through constant coordination between the initial project estimate and a purchase log that was consistently updated. The procurement phase was divided so each member of leadership was responsible for buying out specific materials. Division of responsibilities extended into the breakdown of project phases, resulting in sub-teams with clearly defined roles. The scope of the sub-teams was separated between the five central components of the project: aesthetics, structures, mix design, construction and paddling. The retention of this structure afforded members the opportunity to specialize within the project scope as well as ensured that each project phase remained on schedule. One project manager and two assistant project managers oversaw the successful completion of each phase of the project. Additionally, through the appointment of sub team captains, safety practices were consistently enforced. Members were required to wear personal protective equipment, including but not limited to masks, gloves and closed toe shoes when working with concrete. All members became familiar with the appropriate MSDS information during usage of all chemicals and materials particularly during the mixing process.
Milestone Completed Receive Rules 9-Sep Competition Canoe Pour Day 4-Feb Deliverables Due 6-Mar Canoe Substantial Completion 4-Apr Pacific Southwest Conference 5-Apr
Figure 1: Man Hours break down.
TABLE 3: MILESTONE CHART.
2
Quality Assurance / Quality Control In an effort to create a better overall product,
the team put an emphasis on quality assurance and quality control, beginning with material procurement. Each of the captains was charged with ordering specific materials and establishing that they complied with the required standards. Quality control initiatives were also taken with regards to material inventory. Through the application of a new, secure method of storage, materials were put into labelled, air-tight buckets to reduce exposure to air. This allowed the team to consolidate materials from previous years, determine what materials were needed, and have a better overall organization for mix design. The labels made mix design easier to comprehend for new members and the air-tight containers ensured that the quality of materials would not be affected by outside sources.
The next step to the quality control process was sufficient training for all of the team members. Because of the high turnover rate of members from the previous year, this year’s team had a large number of inexperienced members, making training a necessity. Training for mix design began in the classroom by getting members acquainted with the materials and proportions. The team then moved to the mix lab where they were given an introduction to the physical mixing process. Members became familiar with the process of forming a canoe by placing concrete layers on sections of the previous year’s mold and testing for the correcting thickness throughout each layer. Furthermore, through demonstration and practice, instruction was provided for new members to learn how to hot wire cut before construction of the mold began. Overall, through lessons from captains and more experienced members, each member received full, thorough training so that the team could produce the best possible product.
On Pour Day for both the practice and competition canoe, a multi-step quality control plan was put into action. Captains and experienced members were placed in charge of dry mix, wet mix, and placement stations. At the dry mix station, the captain assigned aggregates for each member to measure, demonstrated how to separate fibers, and
made sure that every dry mix had the right amount of every component before progressing to the next step. At the wet mix station, members were assigned liquids to measure and the captain in charge assessed the remainder of mixes required by those casting the canoe. The wet mix captain was also responsible for certifying the texture and color of a mix before going to the pouring station. Each mix was recorded before being placed, allowing for an accurate count of mixes used to determine the overall weight of the canoe. At the casting station, the captain managed the quality control of the placement process by demonstrating placing techniques and continuous review of the progression. This involved checking the depth along the canoe with marked toothpicks to make sure that the concrete was being placed at the correct thickness. Thus, any issues found were immediately rectified and used as an example for future prevention. This was a critical step since construction inconsistencies were partially the reason for last year’s structural failure. Members at each station remained consistent to maintain a high level of quality assurance. This aspect became critical at the casting station where the members charged with placing the concrete were well attuned to the optimal consistency of the mixes, thereby adding a further layer of quality control. Documentation was also crucial to the success of the project. All documents and files, such as test results of mixes and pictures from Pour Day, were placed in a shared folder online so every captain could have access to it and collaborate efficiently. To make sure that USC’s canoe complied with the NCCC rules and regulations, the rules document was kept on hand at all times for immediate reference. In sections that provided more rigid and specific guidelines, such as those for the design paper, checklists were created. Each rule was catalogued in a way that was easy to identify and understand. Once the rule or item was completed or addressed, it was checked off the list for the first time. After a secondary review, the rule was checked off for a second time. By having multiple people check multiple times, it was ensured that all rules were being followed.
3
4
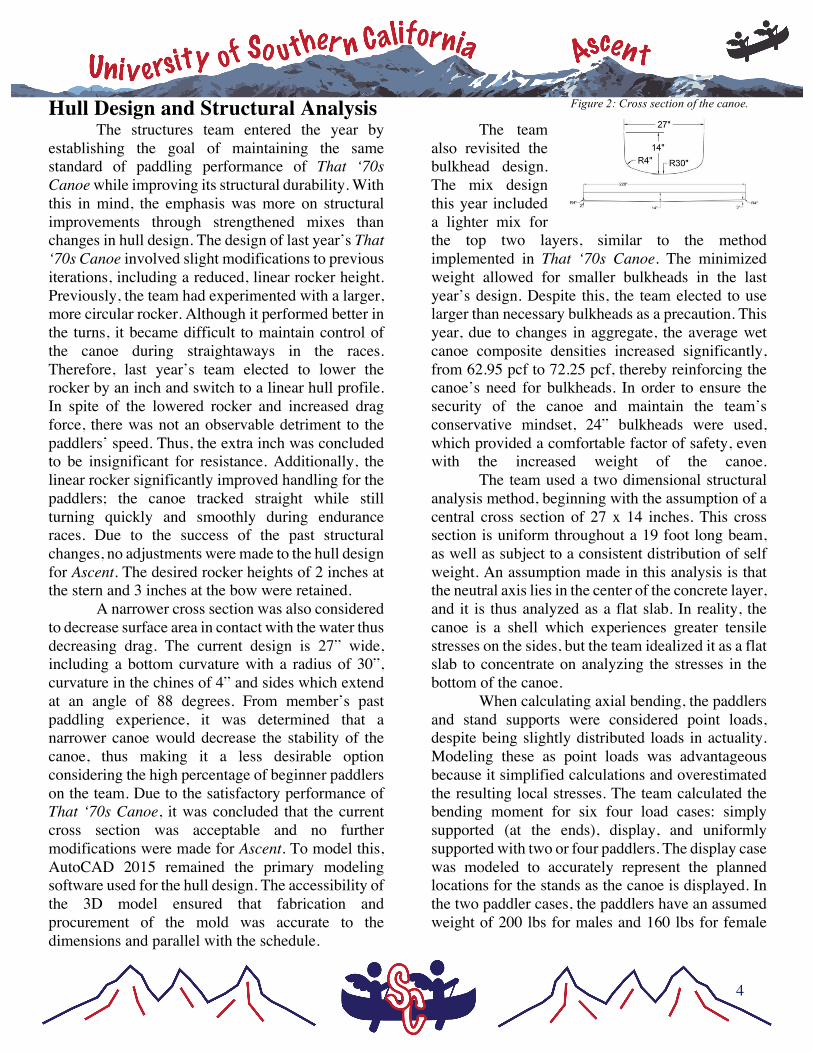
Hull Design and Structural Analysis The structures team entered the year by
establishing the goal of maintaining the same standard of paddling performance of That ‘70s Canoe while improving its structural durability. With this in mind, the emphasis was more on structural improvements through strengthened mixes than changes in hull design. The design of last year’s That ‘70s Canoe involved slight modifications to previous iterations, including a reduced, linear rocker height. Previously, the team had experimented with a larger, more circular rocker. Although it performed better in the turns, it became difficult to maintain control of the canoe during straightaways in the races. Therefore, last year’s team elected to lower the rocker by an inch and switch to a linear hull profile. In spite of the lowered rocker and increased drag force, there was not an observable detriment to the paddlers’ speed. Thus, the extra inch was concluded to be insignificant for resistance. Additionally, the linear rocker significantly improved handling for the paddlers; the canoe tracked straight while still turning quickly and smoothly during endurance races. Due to the success of the past structural changes, no adjustments were made to the hull design for Ascent. The desired rocker heights of 2 inches at the stern and 3 inches at the bow were retained.
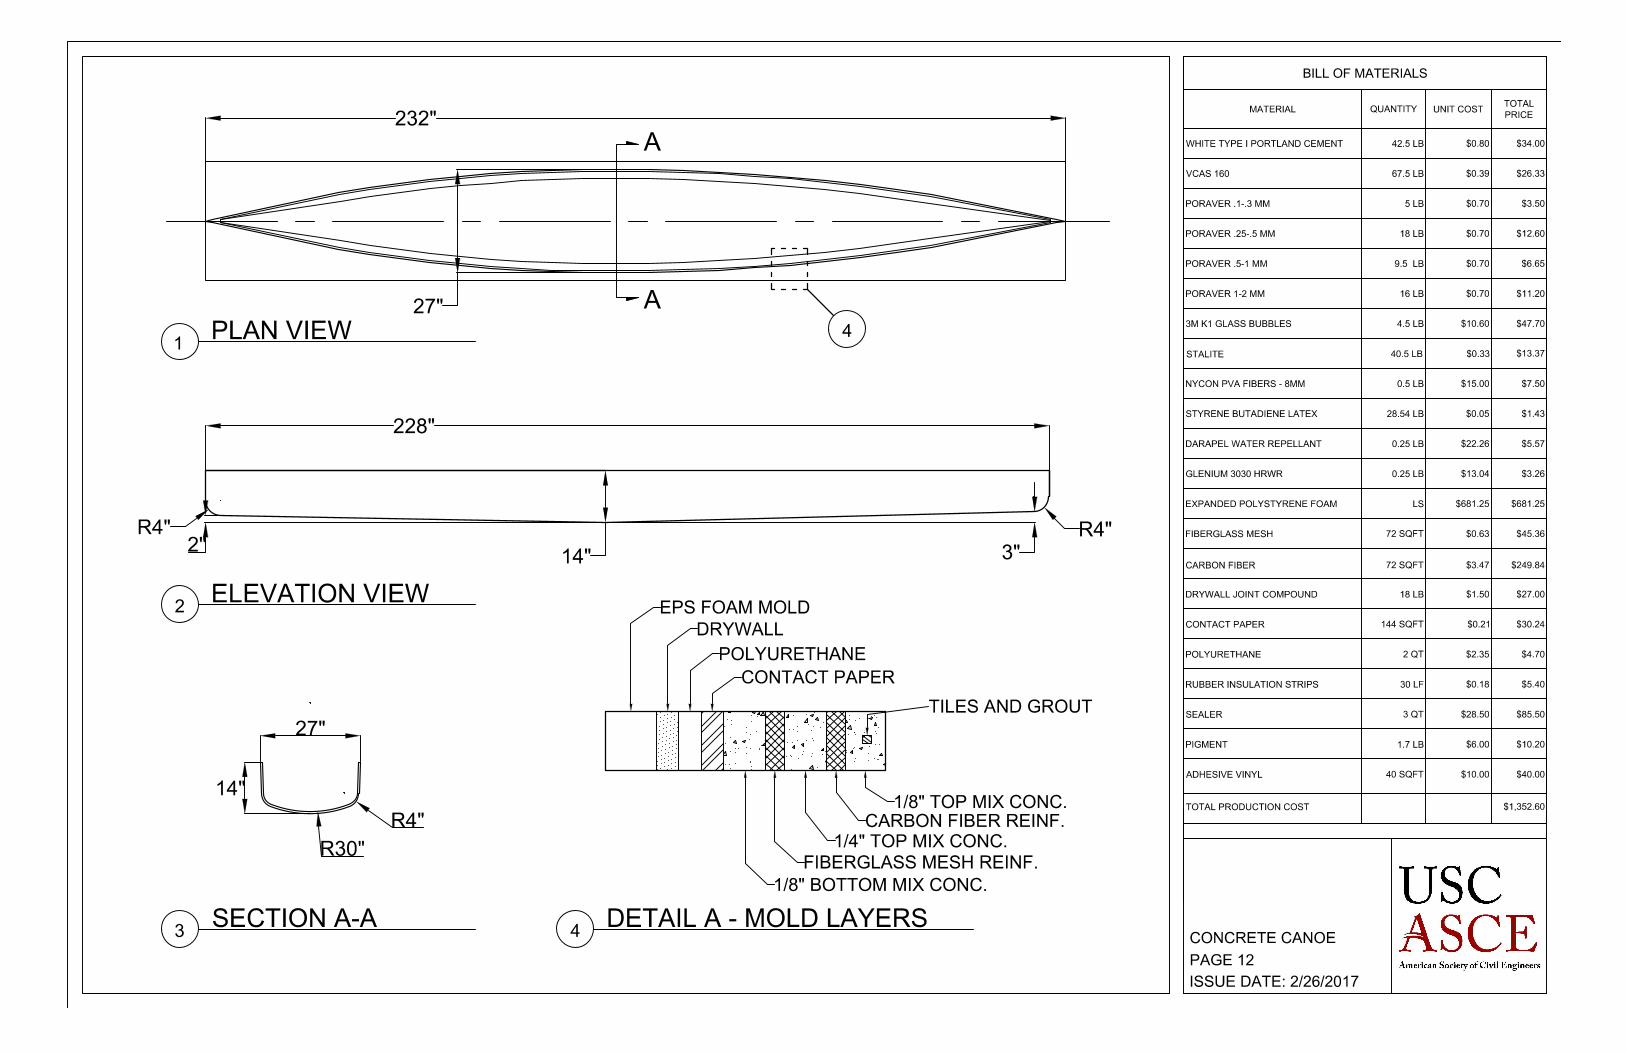
A narrower cross section was also considered to decrease surface area in contact with the water thus decreasing drag. The current design is 27” wide, including a bottom curvature with a radius of 30”, curvature in the chines of 4” and sides which extend at an angle of 88 degrees. From member’s past paddling experience, it was determined that a narrower canoe would decrease the stability of the canoe, thus making it a less desirable option considering the high percentage of beginner paddlers on the team. Due to the satisfactory performance of That ‘70s Canoe, it was concluded that the current cross section was acceptable and no further modifications were made for Ascent. To model this, AutoCAD 2015 remained the primary modeling software used for the hull design. The accessibility of the 3D model ensured that fabrication and procurement of the mold was accurate to the dimensions and parallel with the schedule.
The team also revisited the bulkhead design. The mix design this year included a lighter mix for the top two layers, similar to the method implemented in That ‘70s Canoe. The minimized weight allowed for smaller bulkheads in the last year’s design. Despite this, the team elected to use larger than necessary bulkheads as a precaution. This year, due to changes in aggregate, the average wet canoe composite densities increased significantly, from 62.95 pcf to 72.25 pcf, thereby reinforcing the canoe’s need for bulkheads. In order to ensure the security of the canoe and maintain the team’s conservative mindset, 24” bulkheads were used, which provided a comfortable factor of safety, even with the increased weight of the canoe. The team used a two dimensional structural analysis method, beginning with the assumption of a central cross section of 27 x 14 inches. This cross section is uniform throughout a 19 foot long beam, as well as subject to a consistent distribution of self weight. An assumption made in this analysis is that the neutral axis lies in the center of the concrete layer, and it is thus analyzed as a flat slab. In reality, the canoe is a shell which experiences greater tensile stresses on the sides, but the team idealized it as a flat slab to concentrate on analyzing the stresses in the bottom of the canoe.
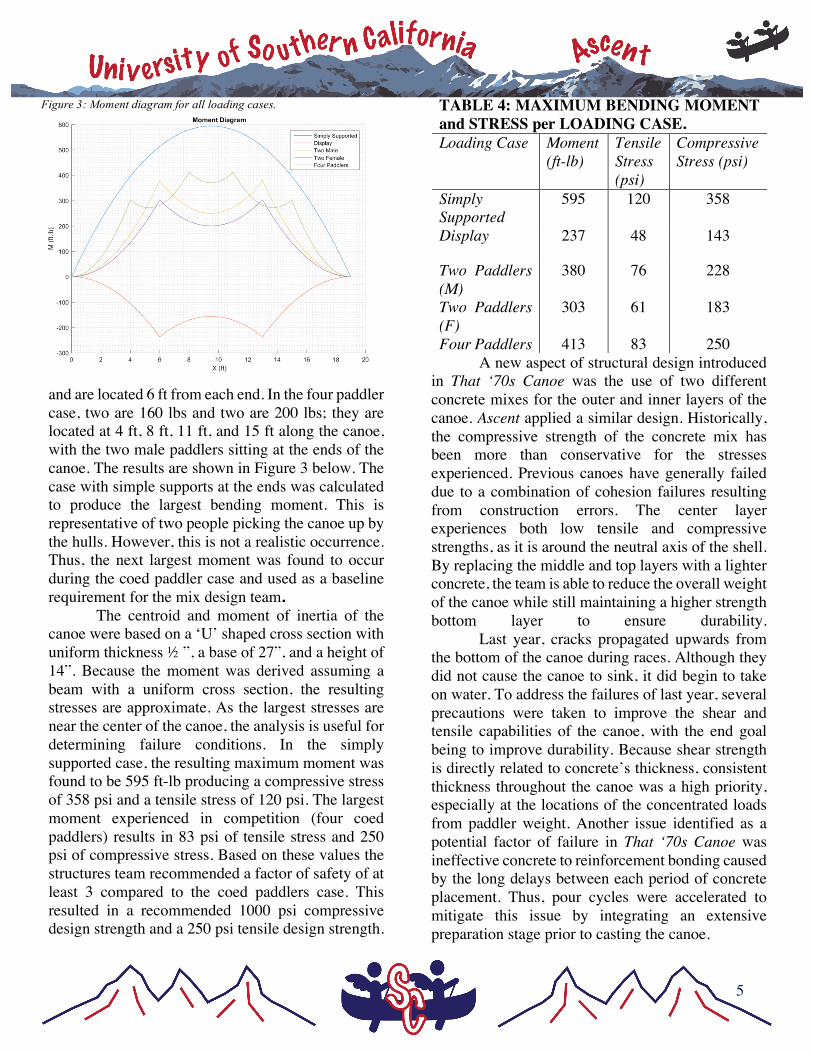
When calculating axial bending, the paddlers and stand supports were considered point loads, despite being slightly distributed loads in actuality. Modeling these as point loads was advantageous because it simplified calculations and overestimated the resulting local stresses. The team calculated the bending moment for six four load cases: simply supported (at the ends), display, and uniformly supported with two or four paddlers. The display case was modeled to accurately represent the planned locations for the stands as the canoe is displayed. In the two paddler cases, the paddlers have an assumed weight of 200 lbs for males and 160 lbs for female
Figure 2: Cross section of the canoe.
5
and are located 6 ft from each end. In the four paddler case, two are 160 lbs and two are 200 lbs; they are located at 4 ft, 8 ft, 11 ft, and 15 ft along the canoe, with the two male paddlers sitting at the ends of the canoe. The results are shown in Figure 3 below. The case with simple supports at the ends was calculated to produce the largest bending moment. This is representative of two people picking the canoe up by the hulls. However, this is not a realistic occurrence. Thus, the next largest moment was found to occur during the coed paddler case and used as a baseline requirement for the mix design team. The centroid and moment of inertia of the canoe were based on a ‘U’ shaped cross section with uniform thickness ½ ”, a base of 27”, and a height of 14”. Because the moment was derived assuming a beam with a uniform cross section, the resulting stresses are approximate. As the largest stresses are near the center of the canoe, the analysis is useful for determining failure conditions. In the simply supported case, the resulting maximum moment was found to be 595 ft-lb producing a compressive stress of 358 psi and a tensile stress of 120 psi. The largest moment experienced in competition (four coed paddlers) results in 83 psi of tensile stress and 250 psi of compressive stress. Based on these values the structures team recommended a factor of safety of at least 3 compared to the coed paddlers case. This resulted in a recommended 1000 psi compressive design strength and a 250 psi tensile design strength.
A new aspect of structural design introduced in That ‘70s Canoe was the use of two different concrete mixes for the outer and inner layers of the canoe. Ascent applied a similar design. Historically, the compressive strength of the concrete mix has been more than conservative for the stresses experienced. Previous canoes have generally failed due to a combination of cohesion failures resulting from construction errors. The center layer experiences both low tensile and compressive strengths, as it is around the neutral axis of the shell. By replacing the middle and top layers with a lighter concrete, the team is able to reduce the overall weight of the canoe while still maintaining a higher strength bottom layer to ensure durability. Last year, cracks propagated upwards from the bottom of the canoe during races. Although they did not cause the canoe to sink, it did begin to take on water. To address the failures of last year, several precautions were taken to improve the shear and tensile capabilities of the canoe, with the end goal being to improve durability. Because shear strength is directly related to concrete’s thickness, consistent thickness throughout the canoe was a high priority, especially at the locations of the concentrated loads from paddler weight. Another issue identified as a potential factor of failure in That ‘70s Canoe was ineffective concrete to reinforcement bonding caused by the long delays between each period of concrete placement. Thus, pour cycles were accelerated to mitigate this issue by integrating an extensive preparation stage prior to casting the canoe.
TABLE 4: MAXIMUM BENDING MOMENT and STRESS per LOADING CASE. Loading Case Moment
(ft-lb) Tensile Stress (psi)
Compressive Stress (psi)
Simply Supported
595 120 358
Display 237 48 143
Two Paddlers (M)
380 76 228
Two Paddlers (F)
303 61 183
Four Paddlers 413 83 250
Figure 3: Moment diagram for all loading cases.
6
Development and Testing The goals for this year’s mix design team
were focused on incorporating an aggregate that is compliant with ASTM C330, maintaining the compressive strength achieved in previous years’ mixes, as well as optimizing the density to ensure high maneuverability for paddlers. During the initial mix design phase, the aggregate to be newly incorporated was analyzed first. The location and procurement of the new aggregate was expedited in order to ensure that enough time would remain for mix development and testing. The initial schedule was still expected to be met as the creation of a practice canoe was prioritized and a deadline was set by the team as the last date to finalize the mix. This date for the finalization of the mix would ensure useful testing for both the practice canoe and its competition equivalent. Based on the performance of That ‘70s Canoe, the team elected to take a more conservative approach in regards to the mix composition of the canoe. Although all testing seemingly proved that the lightweight mix would have a minimal effect on the structural integrity of the canoe, the combination of this technique as well as flaws in the construction process- particularly its inconsistent and ultimately thin layers- resulted in failure. Thus, the key goal
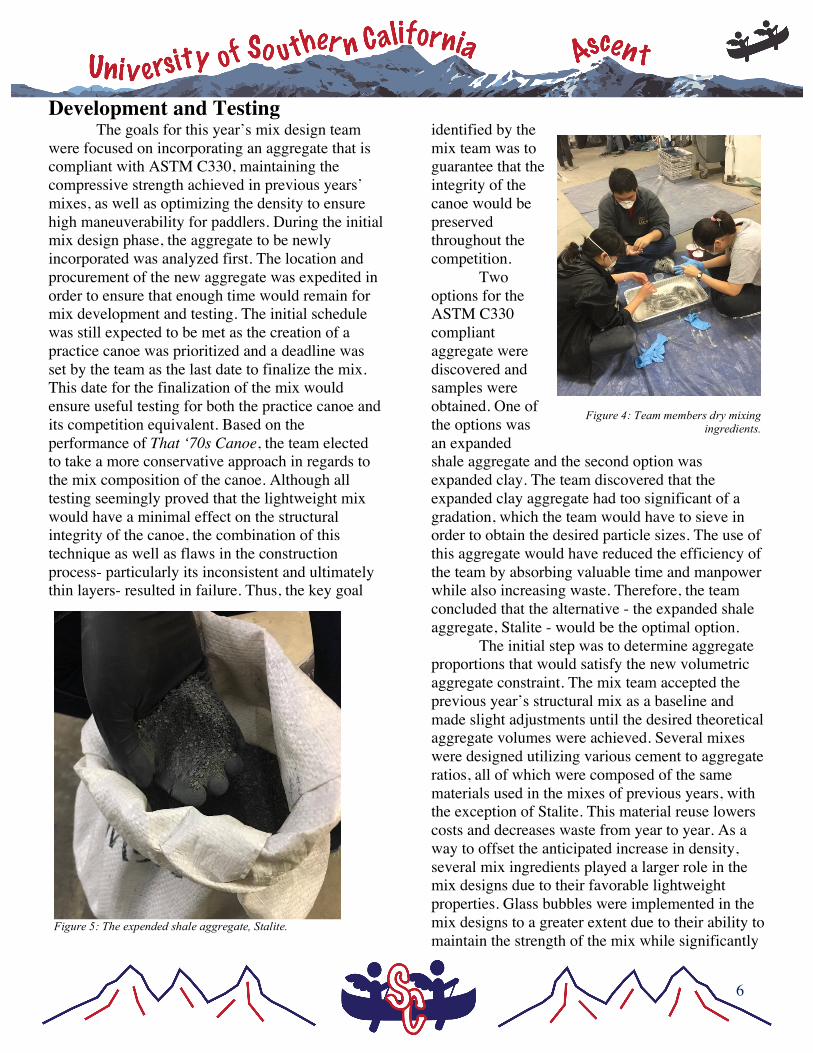
identified by the mix team was to guarantee that the integrity of the canoe would be preserved throughout the competition.
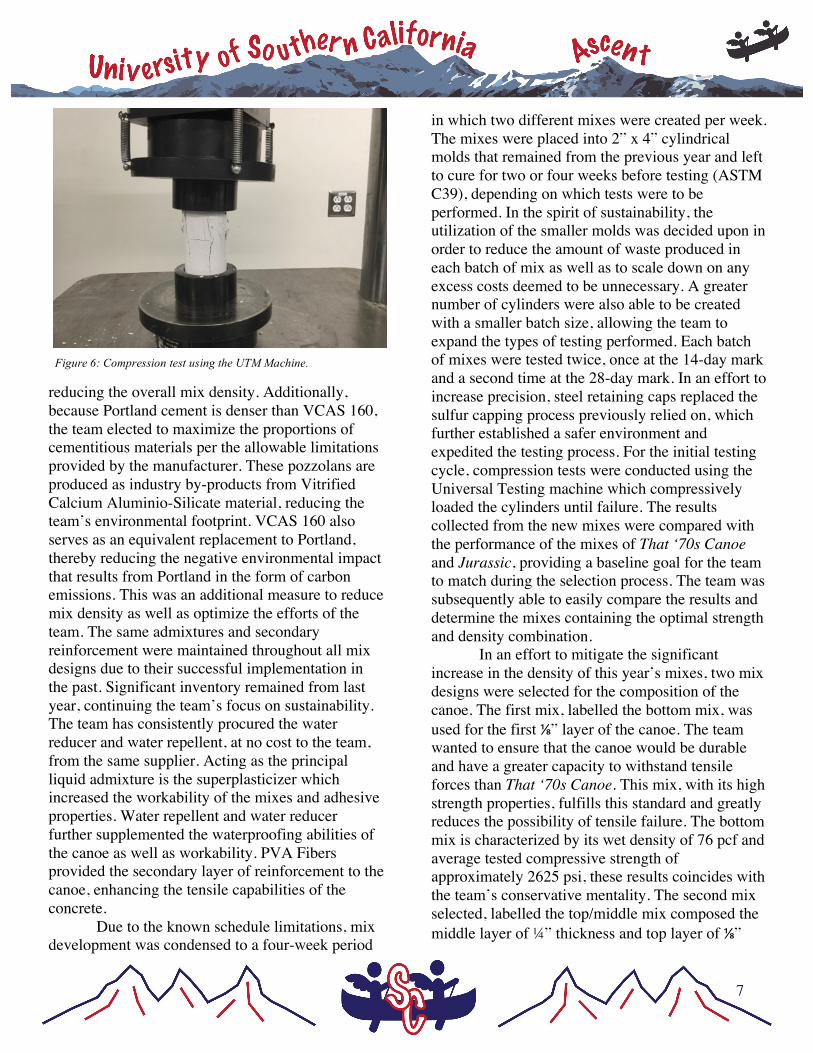
Two options for the ASTM C330 compliant aggregate were discovered and samples were obtained. One of the options was an expanded shale aggregate and the second option was expanded clay. The team discovered that the expanded clay aggregate had too significant of a gradation, which the team would have to sieve in order to obtain the desired particle sizes. The use of this aggregate would have reduced the efficiency of the team by absorbing valuable time and manpower while also increasing waste. Therefore, the team concluded that the alternative - the expanded shale aggregate, Stalite - would be the optimal option.
The initial step was to determine aggregate proportions that would satisfy the new volumetric aggregate constraint. The mix team accepted the previous year’s structural mix as a baseline and made slight adjustments until the desired theoretical aggregate volumes were achieved. Several mixes were designed utilizing various cement to aggregate ratios, all of which were composed of the same materials used in the mixes of previous years, with the exception of Stalite. This material reuse lowers costs and decreases waste from year to year. As a way to offset the anticipated increase in density, several mix ingredients played a larger role in the mix designs due to their favorable lightweight properties. Glass bubbles were implemented in the mix designs to a greater extent due to their ability to maintain the strength of the mix while significantly
Figure 4: Team members dry mixing ingredients.
Figure 5: The expended shale aggregate, Stalite.
7
reducing the overall mix density. Additionally, because Portland cement is denser than VCAS 160, the team elected to maximize the proportions of cementitious materials per the allowable limitations provided by the manufacturer. These pozzolans are produced as industry by-products from Vitrified Calcium Aluminio-Silicate material, reducing the team’s environmental footprint. VCAS 160 also serves as an equivalent replacement to Portland, thereby reducing the negative environmental impact that results from Portland in the form of carbon emissions. This was an additional measure to reduce mix density as well as optimize the efforts of the team. The same admixtures and secondary reinforcement were maintained throughout all mix designs due to their successful implementation in the past. Significant inventory remained from last year, continuing the team’s focus on sustainability. The team has consistently procured the water reducer and water repellent, at no cost to the team, from the same supplier. Acting as the principal liquid admixture is the superplasticizer which increased the workability of the mixes and adhesive properties. Water repellent and water reducer further supplemented the waterproofing abilities of the canoe as well as workability. PVA Fibers provided the secondary layer of reinforcement to the canoe, enhancing the tensile capabilities of the concrete. Due to the known schedule limitations, mix development was condensed to a four-week period
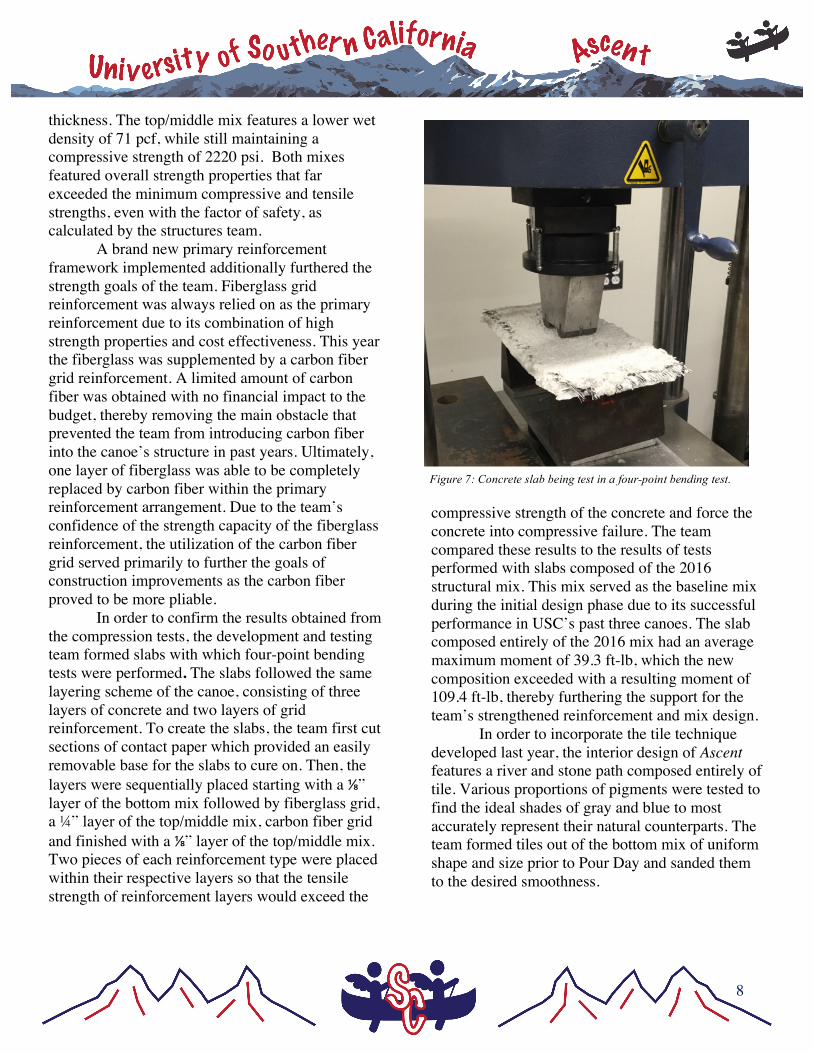
in which two different mixes were created per week. The mixes were placed into 2” x 4” cylindrical molds that remained from the previous year and left to cure for two or four weeks before testing (ASTM C39), depending on which tests were to be performed. In the spirit of sustainability, the utilization of the smaller molds was decided upon in order to reduce the amount of waste produced in each batch of mix as well as to scale down on any excess costs deemed to be unnecessary. A greater number of cylinders were also able to be created with a smaller batch size, allowing the team to expand the types of testing performed. Each batch of mixes were tested twice, once at the 14-day mark and a second time at the 28-day mark. In an effort to increase precision, steel retaining caps replaced the sulfur capping process previously relied on, which further established a safer environment and expedited the testing process. For the initial testing cycle, compression tests were conducted using the Universal Testing machine which compressively loaded the cylinders until failure. The results collected from the new mixes were compared with the performance of the mixes of That ‘70s Canoe and Jurassic, providing a baseline goal for the team to match during the selection process. The team was subsequently able to easily compare the results and determine the mixes containing the optimal strength and density combination.
In an effort to mitigate the significant increase in the density of this year’s mixes, two mix designs were selected for the composition of the canoe. The first mix, labelled the bottom mix, was used for the first ⅛” layer of the canoe. The team wanted to ensure that the canoe would be durable and have a greater capacity to withstand tensile forces than That ‘70s Canoe. This mix, with its high strength properties, fulfills this standard and greatly reduces the possibility of tensile failure. The bottom mix is characterized by its wet density of 76 pcf and average tested compressive strength of approximately 2625 psi, these results coincides with the team’s conservative mentality. The second mix selected, labelled the top/middle mix composed the middle layer of ¼” thickness and top layer of ⅛”
Figure 6: Compression test using the UTM Machine.
8
thickness. The top/middle mix features a lower wet density of 71 pcf, while still maintaining a compressive strength of 2220 psi. Both mixes featured overall strength properties that far exceeded the minimum compressive and tensile strengths, even with the factor of safety, as calculated by the structures team.
A brand new primary reinforcement framework implemented additionally furthered the strength goals of the team. Fiberglass grid reinforcement was always relied on as the primary reinforcement due to its combination of high strength properties and cost effectiveness. This year the fiberglass was supplemented by a carbon fiber grid reinforcement. A limited amount of carbon fiber was obtained with no financial impact to the budget, thereby removing the main obstacle that prevented the team from introducing carbon fiber into the canoe’s structure in past years. Ultimately, one layer of fiberglass was able to be completely replaced by carbon fiber within the primary reinforcement arrangement. Due to the team’s confidence of the strength capacity of the fiberglass reinforcement, the utilization of the carbon fiber grid served primarily to further the goals of construction improvements as the carbon fiber proved to be more pliable.
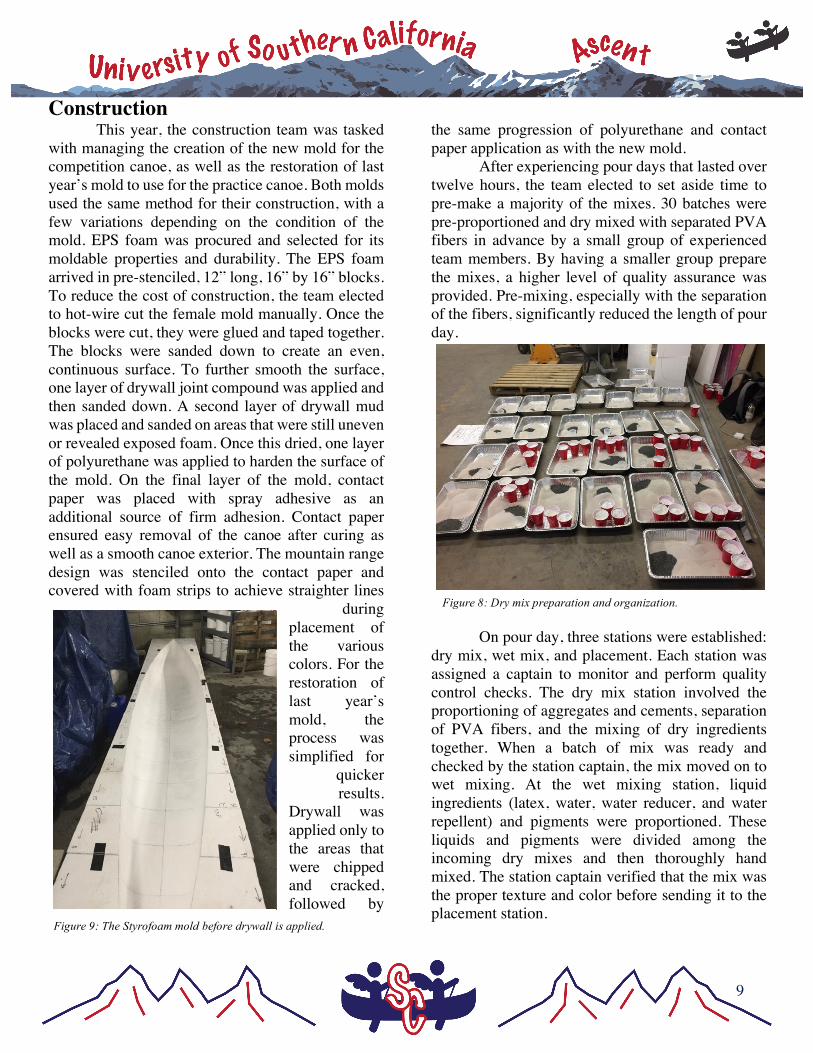
In order to confirm the results obtained from the compression tests, the development and testing team formed slabs with which four-point bending tests were performed. The slabs followed the same layering scheme of the canoe, consisting of three layers of concrete and two layers of grid reinforcement. To create the slabs, the team first cut sections of contact paper which provided an easily removable base for the slabs to cure on. Then, the layers were sequentially placed starting with a ⅛” layer of the bottom mix followed by fiberglass grid, a ¼” layer of the top/middle mix, carbon fiber grid and finished with a ⅛” layer of the top/middle mix. Two pieces of each reinforcement type were placed within their respective layers so that the tensile strength of reinforcement layers would exceed the
compressive strength of the concrete and force the concrete into compressive failure. The team compared these results to the results of tests performed with slabs composed of the 2016 structural mix. This mix served as the baseline mix during the initial design phase due to its successful performance in USC’s past three canoes. The slab composed entirely of the 2016 mix had an average maximum moment of 39.3 ft-lb, which the new composition exceeded with a resulting moment of 109.4 ft-lb, thereby furthering the support for the team’s strengthened reinforcement and mix design.
In order to incorporate the tile technique developed last year, the interior design of Ascent features a river and stone path composed entirely of tile. Various proportions of pigments were tested to find the ideal shades of gray and blue to most accurately represent their natural counterparts. The team formed tiles out of the bottom mix of uniform shape and size prior to Pour Day and sanded them to the desired smoothness.
Figure 7: Concrete slab being test in a four-point bending test.
9
Construction This year, the construction team was tasked
with managing the creation of the new mold for the competition canoe, as well as the restoration of last year’s mold to use for the practice canoe. Both molds used the same method for their construction, with a few variations depending on the condition of the mold. EPS foam was procured and selected for its moldable properties and durability. The EPS foam arrived in pre-stenciled, 12” long, 16” by 16” blocks. To reduce the cost of construction, the team elected to hot-wire cut the female mold manually. Once the blocks were cut, they were glued and taped together. The blocks were sanded down to create an even, continuous surface. To further smooth the surface, one layer of drywall joint compound was applied and then sanded down. A second layer of drywall mud was placed and sanded on areas that were still uneven or revealed exposed foam. Once this dried, one layer of polyurethane was applied to harden the surface of the mold. On the final layer of the mold, contact paper was placed with spray adhesive as an additional source of firm adhesion. Contact paper ensured easy removal of the canoe after curing as well as a smooth canoe exterior. The mountain range design was stenciled onto the contact paper and covered with foam strips to achieve straighter lines
during placement of the various colors. For the restoration of last year’s mold, the process was simplified for
quicker results.
Drywall was applied only to the areas that were chipped and cracked, followed by
the same progression of polyurethane and contact paper application as with the new mold.
After experiencing pour days that lasted over twelve hours, the team elected to set aside time to pre-make a majority of the mixes. 30 batches were pre-proportioned and dry mixed with separated PVA fibers in advance by a small group of experienced team members. By having a smaller group prepare the mixes, a higher level of quality assurance was provided. Pre-mixing, especially with the separation of the fibers, significantly reduced the length of pour day.
On pour day, three stations were established: dry mix, wet mix, and placement. Each station was assigned a captain to monitor and perform quality control checks. The dry mix station involved the proportioning of aggregates and cements, separation of PVA fibers, and the mixing of dry ingredients together. When a batch of mix was ready and checked by the station captain, the mix moved on to wet mixing. At the wet mixing station, liquid ingredients (latex, water, water reducer, and water repellent) and pigments were proportioned. These liquids and pigments were divided among the incoming dry mixes and then thoroughly hand mixed. The station captain verified that the mix was the proper texture and color before sending it to the placement station.
Figure 8: Dry mix preparation and organization.
Figure 9: The Styrofoam mold before drywall is applied.
10
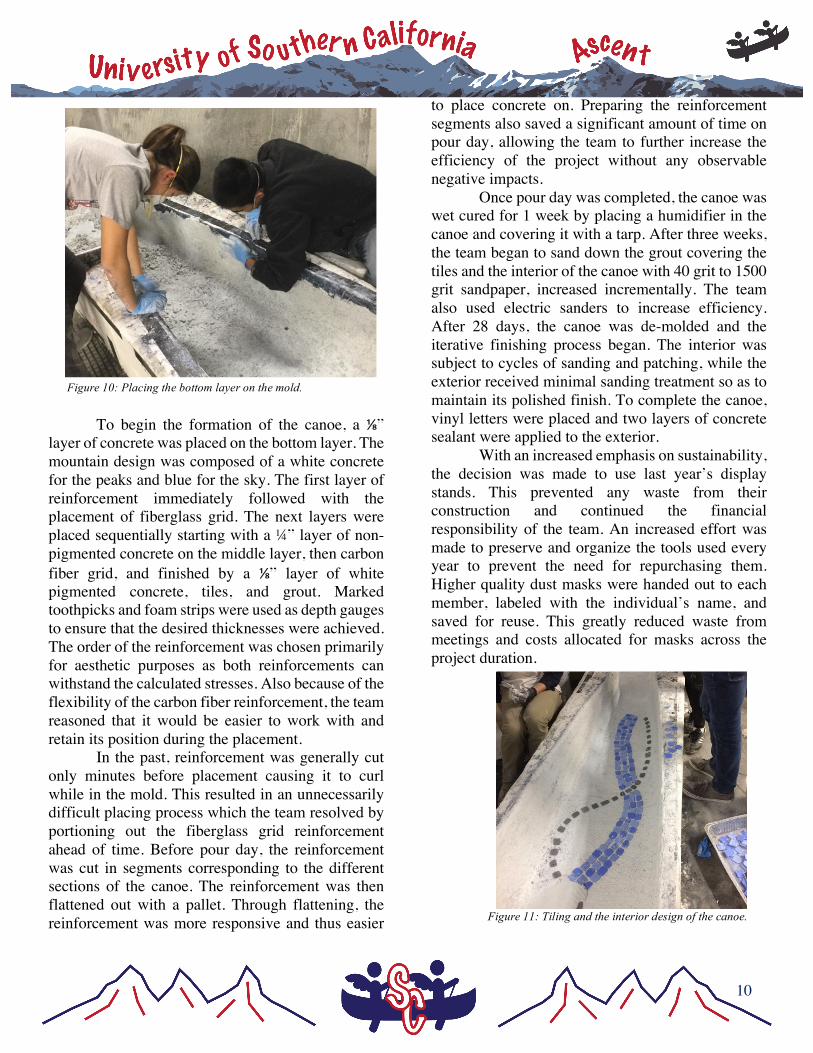
To begin the formation of the canoe, a ⅛” layer of concrete was placed on the bottom layer. The mountain design was composed of a white concrete for the peaks and blue for the sky. The first layer of reinforcement immediately followed with the placement of fiberglass grid. The next layers were placed sequentially starting with a ¼” layer of non-pigmented concrete on the middle layer, then carbon fiber grid, and finished by a ⅛” layer of white pigmented concrete, tiles, and grout. Marked toothpicks and foam strips were used as depth gauges to ensure that the desired thicknesses were achieved. The order of the reinforcement was chosen primarily for aesthetic purposes as both reinforcements can withstand the calculated stresses. Also because of the flexibility of the carbon fiber reinforcement, the team reasoned that it would be easier to work with and retain its position during the placement.
In the past, reinforcement was generally cut only minutes before placement causing it to curl while in the mold. This resulted in an unnecessarily difficult placing process which the team resolved by portioning out the fiberglass grid reinforcement ahead of time. Before pour day, the reinforcement was cut in segments corresponding to the different sections of the canoe. The reinforcement was then flattened out with a pallet. Through flattening, the reinforcement was more responsive and thus easier
to place concrete on. Preparing the reinforcement segments also saved a significant amount of time on pour day, allowing the team to further increase the efficiency of the project without any observable negative impacts.
Once pour day was completed, the canoe was wet cured for 1 week by placing a humidifier in the canoe and covering it with a tarp. After three weeks, the team began to sand down the grout covering the tiles and the interior of the canoe with 40 grit to 1500 grit sandpaper, increased incrementally. The team also used electric sanders to increase efficiency. After 28 days, the canoe was de-molded and the iterative finishing process began. The interior was subject to cycles of sanding and patching, while the exterior received minimal sanding treatment so as to maintain its polished finish. To complete the canoe, vinyl letters were placed and two layers of concrete sealant were applied to the exterior.
With an increased emphasis on sustainability, the decision was made to use last year’s display stands. This prevented any waste from their construction and continued the financial responsibility of the team. An increased effort was made to preserve and organize the tools used every year to prevent the need for repurchasing them. Higher quality dust masks were handed out to each member, labeled with the individual’s name, and saved for reuse. This greatly reduced waste from meetings and costs allocated for masks across the project duration.
Figure 10: Placing the bottom layer on the mold.
Figure 11: Tiling and the interior design of the canoe.
Activity ID Activity Name BL1 Start BL1 Finish Start Finish Original
Duration
CC2017 Concrete Canoe Project Schedule 2016-2017CC2017 Concrete Canoe Project Schedule 2016-201702-Jul-16 05-Apr-17 02-Jul-16 05-Apr-17 278
CC2017.1 MilestonesCC2017.1 Milestones 04-Jul-16 04-Apr-17 09-Sep-16 05-Apr-17 209
M1000 Receive Rules 09-Sep-16 09-Sep-16* 0
M1010 Deliverables Due 06-Mar-17 06-Mar-17* 0
M1020 Canoe Substantial Completion 04-Apr-17 04-Apr-17* 0
M1030 Pacific Southwest Conference 04-Jul-16 05-Apr-17 0
CC2017.2 AdministrativeCC2017.2 Administrative 02-Jul-16 05-Apr-17 02-Jul-16 05-Apr-17 278
A1000 Budgeting & Funding 02-Jul-16 16-Sep-16 02-Jul-16 16-Sep-16 76
A1010 Design Paper: First Draft 28-Dec-16 26-Jan-17 15-Jan-17 21-Feb-17 37
A1020 Design Paper: Final Draft 26-Jan-17 15-Feb-17 21-Feb-17 26-Feb-17 5
A1030 Engineer's Notebook 07-Feb-17 24-Feb-17 21-Feb-17 28-Feb-17 7
A1040 Presentation 13-Feb-17 03-Mar-17 03-Mar-17 10-Mar-17 7
A1050 Presentation Rehearsal 09-Mar-17 05-Apr-17 09-Mar-17 05-Apr-17 27
CC2017.3 StructuresCC2017.3 Structures 20-Sep-16 02-Dec-16 20-Sep-16 25-Jan-17 127
ST1000 Finalize Hull Design 20-Sep-16 20-Sep-16 20-Sep-16 20-Sep-16 0
ST1010 Simple Beam Structural Analysis 20-Sep-16 01-Oct-16 20-Sep-16 01-Oct-16 11
ST1020 Determine Max Loading Cases 01-Oct-16 16-Oct-16 01-Oct-16 16-Oct-16 15
ST1030 Verify Structural Analysis with Mix Design01-Dec-16 02-Dec-16 24-Jan-17 25-Jan-17 1
CC2017.4 Development & TestingCC2017.4 Development & Testing 11-Sep-16 02-Dec-16 11-Sep-16 25-Jan-17 136
DT1010 Order Initial Mix Materials 11-Sep-16 01-Oct-16 11-Sep-16 01-Oct-16 20
DT1000 Obtain ASTM C330 Compliant Aggregates19-Sep-16 07-Oct-16 19-Sep-16 07-Oct-16 18
DT1020 Design Structural Mixes 22-Sep-16 21-Oct-16 22-Sep-16 21-Oct-16 29
DT1030 Create Mixes for Testing 06-Oct-16 28-Oct-16 06-Oct-16 28-Oct-16 22
DT1040 Testing 20-Oct-16 25-Nov-16 20-Oct-16 18-Jan-17 90
DT1050 Finalize Mix Design 01-Dec-16 02-Dec-16 25-Jan-17 25-Jan-17 0
CC2017.5 ConstructionCC2017.5 Construction 11-Sep-16 03-Apr-17 11-Sep-16 03-Apr-17 205
C1000 EPS Foam Procurement 02-Oct-16 04-Nov-16 02-Oct-16 04-Nov-16 33
C1010 Construct Mold 07-Nov-16 17-Nov-16 10-Jan-17 18-Jan-17 7
CC2017.5.1 Practice CanoeCC2017.5.1 Practice Canoe 11-Sep-16 12-Jan-17 11-Sep-16 03-Feb-17 146C1020 Order Practice Canoe Pour Materials11-Sep-16 30-Sep-16 11-Sep-16 29-Nov-16 79
C1050 Pour Day 02-Dec-16 03-Dec-16 02-Dec-16 03-Dec-16 1
C1060 Curing Time 03-Dec-16 31-Dec-16 03-Dec-16 31-Dec-16 28
C1070 Removal from Mold 09-Jan-17 09-Jan-17 09-Jan-17 09-Jan-17 0
C1080 Sanding 09-Jan-17 12-Jan-17 09-Jan-17 12-Jan-17 3
C1090 Apply Sealant 12-Jan-17 12-Jan-17 12-Jan-17 12-Jan-17 0
C1030 Sand/Drywall/Polyurethane Mold 17-Nov-16 24-Nov-16 18-Jan-17 02-Feb-17 15
C1040 Contact Paper 24-Nov-16 02-Dec-16 31-Jan-17 03-Feb-17 3
CC2017.5.2 Competition CanoeCC2017.5.2 Competition Canoe 05-Dec-16 03-Apr-17 28-Nov-16 03-Apr-17 127C1110 Repair Mold 15-Jan-17 27-Jan-17 28-Nov-16 02-Dec-16 4
C1100 Final Pour Day Materials Ordered 05-Dec-16 10-Dec-16 04-Dec-16* 09-Dec-16 5
C1120 Pour Day 28-Jan-17 04-Feb-17 0
C1130 Cure 28-Jan-17 25-Feb-17 04-Feb-17 04-Mar-17 28
C1140 Removal from Mold 26-Feb-17 26-Feb-17 06-Mar-17 06-Mar-17 0
C1150 Sand & Patch 26-Feb-17 01-Apr-17 06-Mar-17 01-Apr-17 26
C1160 Apply Letters & Seal 03-Apr-17 03-Apr-17 03-Apr-17 03-Apr-17 0
CC2017.6 Final Product DisplayCC2017.6 Final Product Display 09-Feb-17 03-Apr-17 09-Feb-17 03-Apr-17 53
PD1020 Prepare Cutaway Section Mold 09-Feb-17 17-Feb-17 09-Feb-17 17-Feb-17 8
PD1030 Finish, Place & Cure Cutaway Section17-Feb-17 25-Mar-17 17-Feb-17 25-Mar-17 36
PD1000 Procure Materials 13-Mar-17 21-Mar-17 20-Mar-17 28-Mar-17 8
PD1010 Display Table 30-Mar-17 03-Apr-17 30-Mar-17 03-Apr-17 4
CC2017.7 Aesthetic DesignCC2017.7 Aesthetic Design 20-Sep-16 24-Feb-17 20-Sep-16 08-Mar-17 169
AD1000 Theme Selection 20-Sep-16 06-Oct-16 20-Sep-16 06-Oct-16 16
AD1010 Design Canoe Graphics 11-Oct-16 22-Oct-16 11-Oct-16 14-Jan-17 95
AD1020 Design Paper Graphics 02-Feb-17 13-Feb-17 09-Feb-17 16-Feb-17 7
AD1030 Design Presentation Slides 02-Feb-17 24-Feb-17 03-Mar-17 08-Mar-17 5
CC2017.8 PaddlingCC2017.8 Paddling 02-Oct-16 10-Feb-17 15-Oct-16 01-Apr-17 168
P1000 Transport Canoe 15-Oct-16 15-Oct-16 15-Oct-16 15-Oct-16 0
P1010 Practice 02-Oct-16 10-Feb-17 15-Oct-16 01-Apr-17 168
P1020 Finalize Paddling Team 04-Feb-17 05-Feb-17 15-Jan-17 15-Jan-17 0
Jul Aug Sep Oct Nov Dec Jan Feb Mar Apr May Jun
Qtr 3, 2016 Qtr 4, 2016 Qtr 1, 2017 Qtr 2, 2017
05-Apr-17, CC2017 Concrete Canoe Project Schedule 2016-2017
05-Apr-17, CC2017.1 Milestones
Receive Rules,
Deliverables Due,
Canoe Substantial Completion,
Pacific Southwest Conference,
05-Apr-17, CC2017.2 Administrative
Budgeting & Funding
Design Paper: First Draft
Design Paper: Final Draft
Engineer's Notebook
Presentation
Presentation Rehearsal
25-Jan-17, CC2017.3 Structures
Finalize Hull Design
Simple Beam Structural Analysis
Determine Max Loading Cases
Verify Structural Analysis with Mix Design
25-Jan-17, CC2017.4 Development & Testing
Order Initial Mix Materials
Obtain ASTM C330 Compliant Aggregates
Design Structural Mixes
Create Mixes for Testing
Testing
Finalize Mix Design
03-Apr-17, CC2017.5 Construction
EPS Foam Procurement
Construct Mold
03-Feb-17, CC2017.5.1 Practice CanoeOrder Practice Canoe Pour Materials
Pour Day
Curing Time
Removal from Mold
Sanding
Apply Sealant
Sand/Drywall/Polyurethane Mold
Contact Paper
03-Apr-17, CC2017.5.2 Competition CanoeRepair Mold
Final Pour Day Materials Ordered
Pour Day,
Cure
Removal from Mold
Sand & Patch
Apply Letters & Seal
03-Apr-17, CC2017.6 Final Product Display
Prepare Cutaway Section Mold
Finish, Place & Cure Cutaway Section
Procure Materials
Display Table
08-Mar-17, CC2017.7 Aesthetic Design
Theme Selection
Design Canoe Graphics
Design Paper Graphics
Design Presentation Slides
01-Apr-17, CC2017.8 Paddling
Transport Canoe
Practice
Finalize Paddling Team
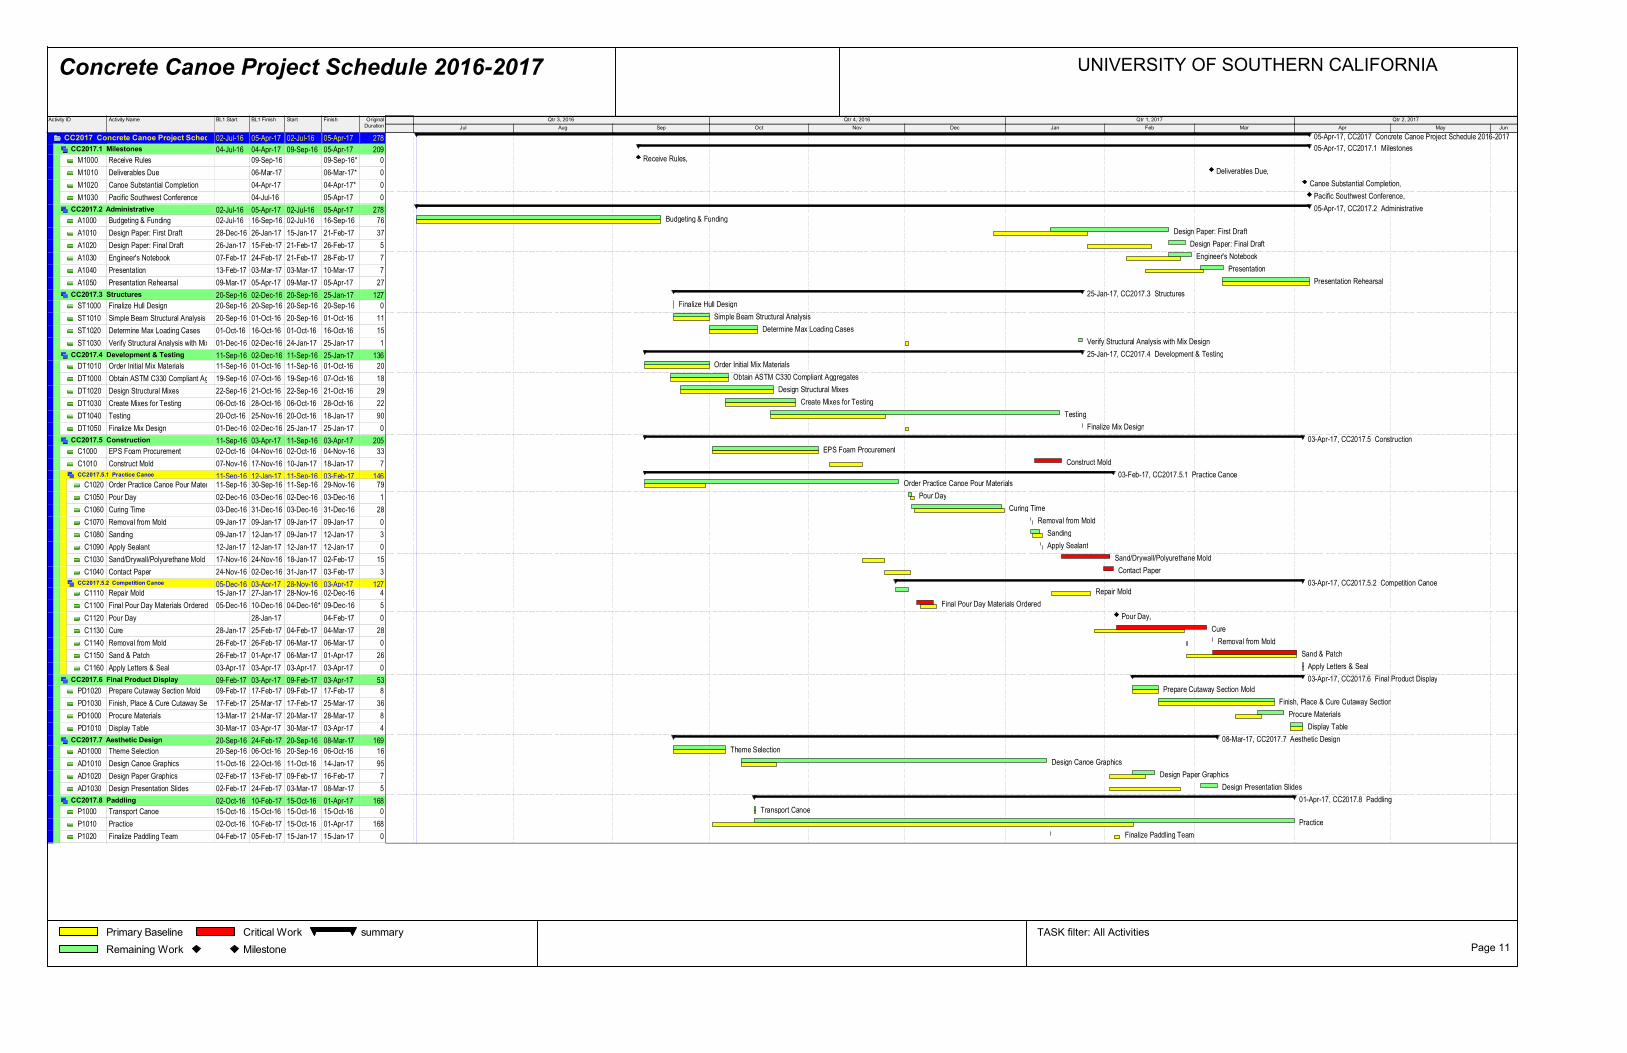
Concrete Canoe Project Schedule 2016-2017 UNIVERSITY OF SOUTHERN CALIFORNIA
Primary Baseline
Remaining Work
Critical Work
Milestone
summary TASK filter: All Activities
Page 11
A1
Appendix A: References Almesfer, Nasser, and Jason Ingham. “Effect of Waste Latex Paint on Concrete.” Sciencedirect.com. Elsevier
B.V., 31 Oct. 2013. Web. 27 Oct. 2015. ASTM C 39 (2012), “Standard Test Method for Compressive Strength of Cylindrical Concrete Specimens,”
ASTM International, West Conshohocken, PA, DOI: 10.1520/C0039_C0039M-12a. ASTM C 138 (2010), “Standard Test Method for Density (Unit Weight), Yield, and Air Content (Gravimetric)
of Concrete,” ASTM International, West Conshohocken, PA, DOI: 10.1520/C0138_C0138M-13a. ASTM C 330/330M (2014) “Standard Specification for Lightweight Aggregates for Structural Concrete,”
ASTM International, West Conshohocken, PA ASTM C 979, “Specifications for Pigments for Integrally Colored Concrete,” ASTM International, West
Conshohocken, PA, DOI: 10.1520/C0979_C0979M-10. ASTM C 1438 (2013), “Standard Specification for Latex and Powder Polymer Modifiers for use in Hydraulic
Cement Concrete and Mortar,” ASTM International, West Conshohocken, PA, DOI: 10.1520/C1438-13. “Chemical Admixtures.” Cement.org. Portland Cement Association, 2015. Web. 10 Feb. 2016. “Darapel® Material Technical Data Sheet,” Grace Concrete Products. 2012. “Direct Colors Concrete Pigment Material Technical Data Sheet,” Direct Colors. 2010. “Glenium® 3030 Material Technical Data Sheet.” BASF. 2010. “MasterLife® SRA 20 Material Technical Data Sheet.” BASF. 2011. “Physical Properties of EPS.” Physical Properties. EPS Industry Alliance, n.d. Web. 01 Mar. 2017. “Styrofan 1186 Technical Data Sheet.” BASF. March 2010. USC Concrete Canoe Team (2014), DiSCovery II, Concrete Canoe Competition Design Paper. USC Concrete Canoe Team (2015), Jurassic, Concrete Canoe Competition Design Paper. USC Concrete Canoe Team (2016), That ‘70s Canoe, Concrete Canoe Competition Design Paper. “Use of Water Reducers, Retarders, and Superplasticizer.” Engr.psu.edu. Pennsylvania State University, 2014.
Web. 10 Feb. 2016. “VCASTM White Pozzolans.” Vitrominerals.com. Vitro Minerals, Inc., 2015. Web. 05 Sep. 2015. “Water - Density and Specific Weight.” The Engineering Toolbox. Engineering Toolbox, 2015. Web. 03 Feb. 2016.
B1
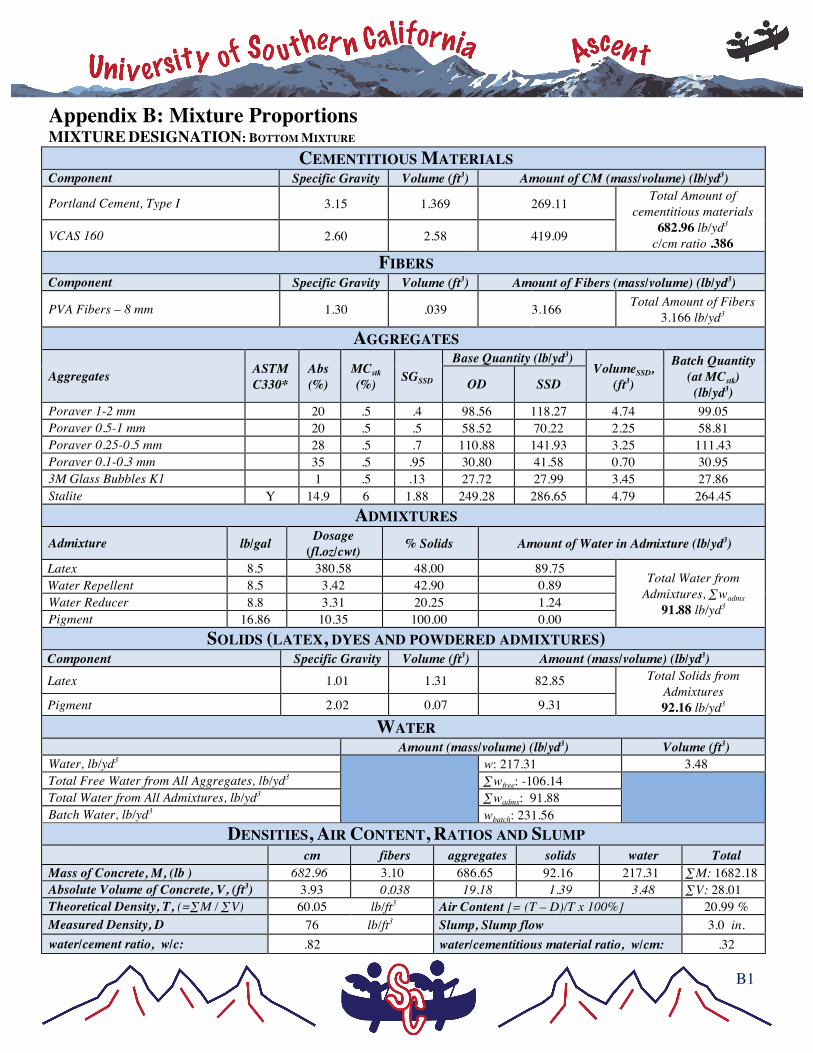
Appendix B: Mixture Proportions MIXTURE DESIGNATION: BOTTOM MIXTURE
CEMENTITIOUS MATERIALS Component Specific Gravity Volume (ft3) Amount of CM (mass/volume) (lb/yd3)
Portland Cement, Type I 3.15 1.369 269.11 Total Amount of cementitious materials
682.96 lb/yd3
c/cm ratio .386 VCAS 160 2.60 2.58 419.09
FIBERS Component Specific Gravity Volume (ft3) Amount of Fibers (mass/volume) (lb/yd3)
PVA Fibers – 8 mm 1.30 .039 3.166 Total Amount of Fibers 3.166 lb/yd3
AGGREGATES
Aggregates ASTM C330*
Abs (%)
MCstk (%) SGSSD
Base Quantity (lb/yd3) VolumeSSD,
(ft3)
Batch Quantity (at MCstk)
(lb/yd3) OD SSD
Poraver 1-2 mm 20 .5 .4 98.56 118.27 4.74 99.05 Poraver 0.5-1 mm 20 .5 .5 58.52 70.22 2.25 58.81 Poraver 0.25-0.5 mm 28 .5 .7 110.88 141.93 3.25 111.43 Poraver 0.1-0.3 mm 35 .5 .95 30.80 41.58 0.70 30.95 3M Glass Bubbles K1 1 .5 .13 27.72 27.99 3.45 27.86 Stalite Y 14.9 6 1.88 249.28 286.65 4.79 264.45
ADMIXTURES
Admixture lb/gal Dosage (fl.oz/cwt) % Solids Amount of Water in Admixture (lb/yd3)
Latex 8.5 380.58 48.00 89.75 Total Water from
Admixtures, ∑wadmx 91.88 lb/yd3
Water Repellent 8.5 3.42 42.90 0.89 Water Reducer 8.8 3.31 20.25 1.24 Pigment 16.86 10.35 100.00 0.00
SOLIDS (LATEX, DYES AND POWDERED ADMIXTURES) Component Specific Gravity Volume (ft3) Amount (mass/volume) (lb/yd3) Latex 1.01 1.31 82.85 Total Solids from
Admixtures 92.16 lb/yd3 Pigment 2.02 0.07 9.31
WATER Amount (mass/volume) (lb/yd3) Volume (ft3) Water, lb/yd3
w: 217.31 3.48 Total Free Water from All Aggregates, lb/yd3 ∑wfree: -106.14
Total Water from All Admixtures, lb/yd3 ∑wadmx: 91.88 Batch Water, lb/yd3 wbatch: 231.56
DENSITIES, AIR CONTENT, RATIOS AND SLUMP cm fibers aggregates solids water Total Mass of Concrete, M, (lb ) 682.96 3.10 686.65 92.16 217.31 ∑M: 1682.18 Absolute Volume of Concrete, V, (ft3) 3.93 0.038 19.18 1.39 3.48 ∑V: 28.01 Theoretical Density, T, (=∑M / ∑V) 60.05 lb/ft3 Air Content [= (T – D)/T x 100%] 20.99 % Measured Density, D 76 lb/ft3 Slump, Slump flow 3.0 in. water/cement ratio, w/c: .82 water/cementitious material ratio, w/cm: .32
B2
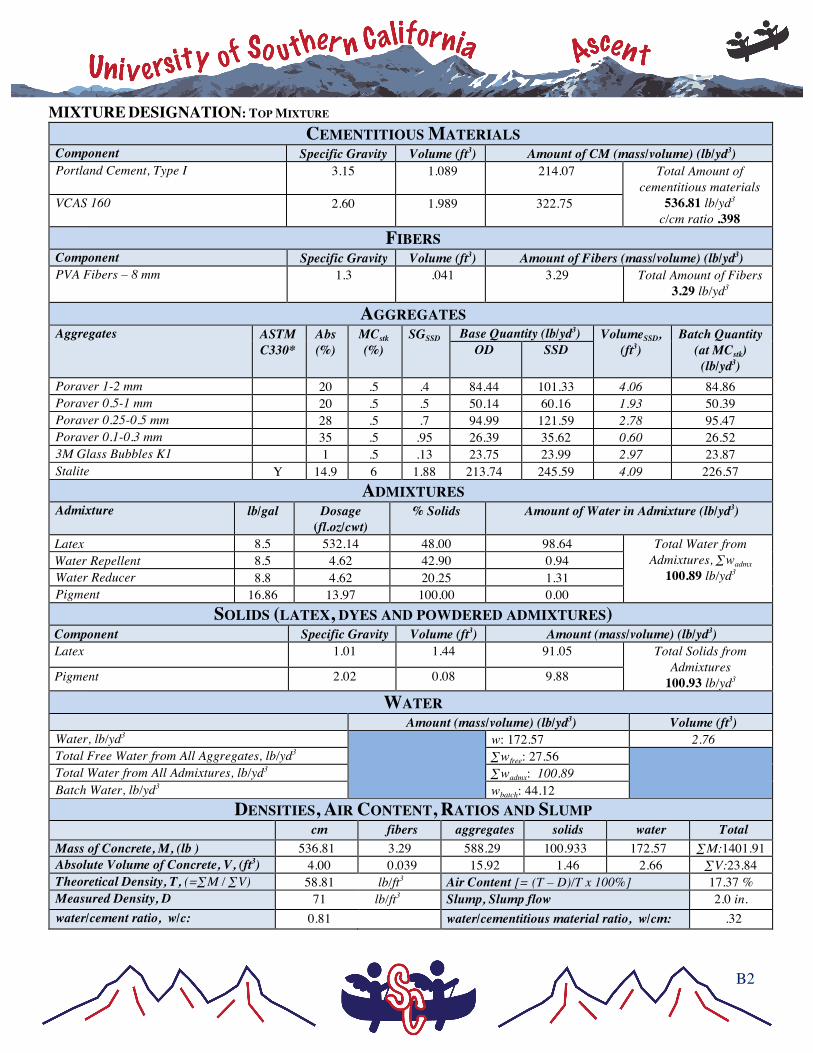
MIXTURE DESIGNATION: TOP MIXTURE CEMENTITIOUS MATERIALS
Component Specific Gravity Volume (ft3) Amount of CM (mass/volume) (lb/yd3) Portland Cement, Type I 3.15 1.089 214.07 Total Amount of
cementitious materials 536.81 lb/yd3
c/cm ratio .398 VCAS 160 2.60 1.989 322.75
FIBERS Component Specific Gravity Volume (ft3) Amount of Fibers (mass/volume) (lb/yd3) PVA Fibers – 8 mm 1.3 .041 3.29 Total Amount of Fibers
3.29 lb/yd3
AGGREGATES Aggregates ASTM
C330* Abs (%)
MCstk (%)
SGSSD Base Quantity (lb/yd3) VolumeSSD, (ft3)
Batch Quantity (at MCstk)
(lb/yd3) OD SSD
Poraver 1-2 mm 20 .5 .4 84.44 101.33 4.06 84.86 Poraver 0.5-1 mm 20 .5 .5 50.14 60.16 1.93 50.39 Poraver 0.25-0.5 mm 28 .5 .7 94.99 121.59 2.78 95.47 Poraver 0.1-0.3 mm 35 .5 .95 26.39 35.62 0.60 26.52 3M Glass Bubbles K1 1 .5 .13 23.75 23.99 2.97 23.87 Stalite Y 14.9 6 1.88 213.74 245.59 4.09 226.57
ADMIXTURES Admixture lb/gal Dosage
(fl.oz/cwt) % Solids Amount of Water in Admixture (lb/yd3)
Latex 8.5 532.14 48.00 98.64 Total Water from Admixtures, ∑wadmx
100.89 lb/yd3 Water Repellent 8.5 4.62 42.90 0.94 Water Reducer 8.8 4.62 20.25 1.31 Pigment 16.86 13.97 100.00 0.00
SOLIDS (LATEX, DYES AND POWDERED ADMIXTURES) Component Specific Gravity Volume (ft3) Amount (mass/volume) (lb/yd3) Latex 1.01 1.44 91.05 Total Solids from
Admixtures 100.93 lb/yd3 Pigment 2.02 0.08 9.88
WATER Amount (mass/volume) (lb/yd3) Volume (ft3) Water, lb/yd3 w: 172.57 2.76 Total Free Water from All Aggregates, lb/yd3 ∑wfree: 27.56 Total Water from All Admixtures, lb/yd3 ∑wadmx: 100.89 Batch Water, lb/yd3 wbatch: 44.12
DENSITIES, AIR CONTENT, RATIOS AND SLUMP cm fibers aggregates solids water Total Mass of Concrete, M, (lb ) 536.81 3.29 588.29 100.933 172.57 ∑M:1401.91 Absolute Volume of Concrete, V, (ft3) 4.00 0.039 15.92 1.46 2.66 ∑V:23.84 Theoretical Density, T, (=∑M / ∑V) 58.81 lb/ft3 Air Content [= (T – D)/T x 100%] 17.37 % Measured Density, D 71 lb/ft3 Slump, Slump flow 2.0 in. water/cement ratio, w/c: 0.81 water/cementitious material ratio, w/cm: .32
C1
Self weight: 13.158 plf
125 lb 125 lb
17 ft 1 ft 1 ft
-150 -100 -50
050
100150
0 5 10 15 20
Shea
r For
ce (l
b)
Position from Front of Canoe (ft)
Shear Diagram
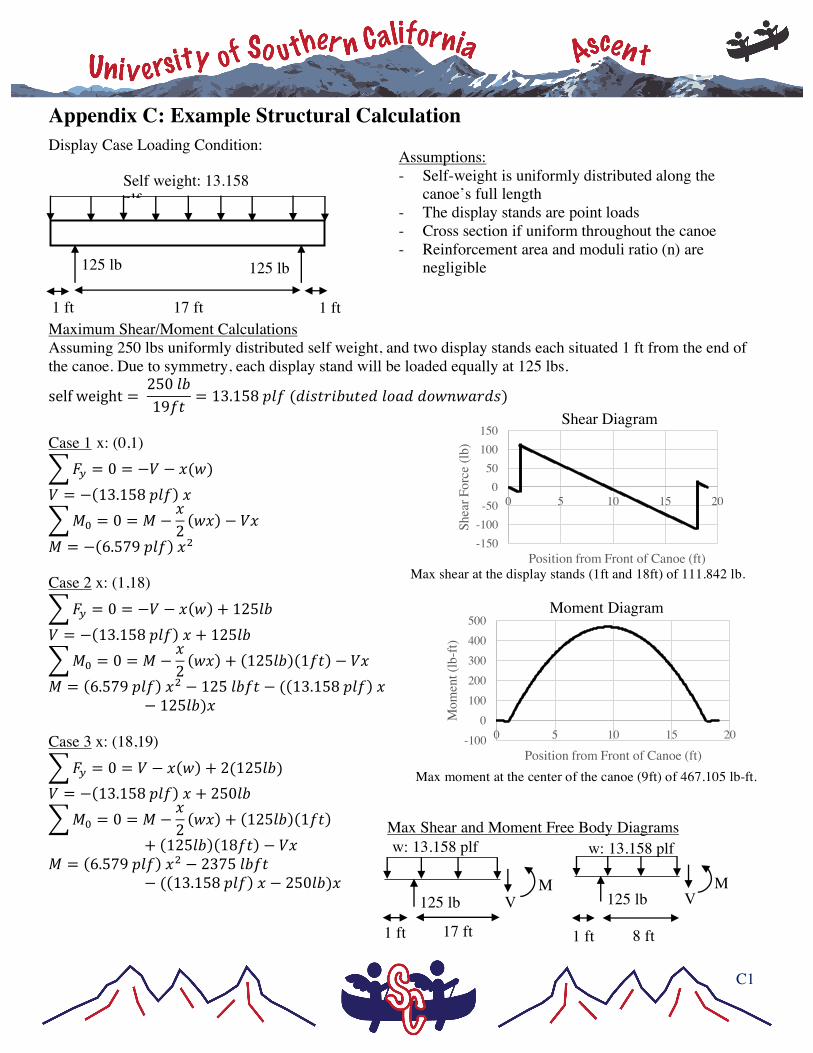
Appendix C: Example Structural Calculation Display Case Loading Condition: Maximum Shear/Moment Calculations Assuming 250 lbs uniformly distributed self weight, and two display stands each situated 1 ft from the end of the canoe. Due to symmetry, each display stand will be loaded equally at 125 lbs.
selfweight = 250/01934
= 13.1588/3(:;<4=;0>4?:/@A::@BCBA=:<)
Case 1 x: (0,1)
EF = 0 = −H − I(B) H = − 13.1588/3 I
JK = 0 = J −I2BI − HI
J = − 6.5798/3 IN Case 2 x: (1,18)
EF = 0 = −H − I B + 125/0 H = − 13.1588/3 I + 125/0
JK = 0 = J −I2BI + 125/0 134 − HI
J = 6.5798/3 IN − 125/034 − ( 13.1588/3 I− 125/0)I
Case 3 x: (18,19) EF = 0 = H − I B + 2(125/0)
H = − 13.1588/3 I + 250/0 JK = 0 = J −
I2BI + 125/0 134
+ 125/0 1834 − HI J = 6.5798/3 IN − 2375/034
− ( 13.1588/3 I − 250/0)I
Assumptions: - Self-weight is uniformly distributed along the
canoe’s full length - The display stands are point loads - Cross section if uniform throughout the canoe - Reinforcement area and moduli ratio (n) are
negligible
-100 0
100200300400500
0 5 10 15 20
Mom
ent (
lb-ft
)
Position from Front of Canoe (ft)
Moment Diagram
Max shear at the display stands (1ft and 18ft) of 111.842 lb.
Max moment at the center of the canoe (9ft) of 467.105 lb-ft.
w: 13.158 plf
125 lb
8 ft 1 ft
V M
w: 13.158 plf
125 lb
17 ft 1 ft
V M
Max Shear and Moment Free Body Diagrams
C2
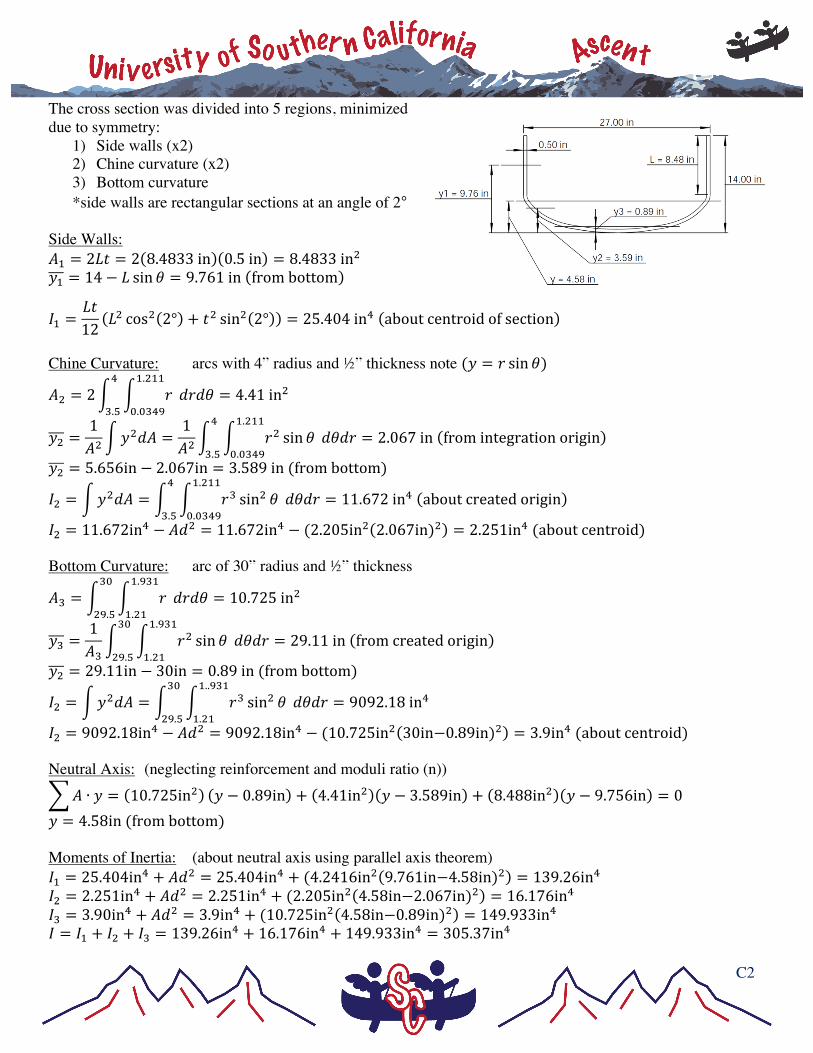
The cross section was divided into 5 regions, minimized due to symmetry:
1) Side walls (x2) 2) Chine curvature (x2) 3) Bottom curvature *side walls are rectangular sections at an angle of 2°
Side Walls: PQ = 2R4 = 2 8.4833in 0.5in = 8.4833inN UQ = 14 − R sin V = 9.761in frombottom
[Q =R412
RN cosN 2° + 4N sinN 2° = 25.404in^ aboutcentroidofsection Chine Curvature: arcs with 4” radius and ½” thickness note (U = = sin V)
PN = 2 = :=:VQ.NQQ
K.Kb^c
^
b.d= 4.41inN
UN =1PN
UN:P =1PN
=N sin V :V:=Q.NQQ
K.Kb^c
^
b.d= 2.067in fromintegrationorigin
UN = 5.656in − 2.067in = 3.589in(frombottom)
[N = UN:P = =b sinN V :V:=Q.NQQ
K.Kb^c
^
b.d= 11.672in^ aboutcreatedorigin
[N = 11.672in^ − P:N = 11.672in^ − (2.205inN 2.067in)N = 2.251in^(aboutcentroid) Bottom Curvature: arc of 30” radius and ½” thickness
Pb = = :=:VQ.cbQ
Q.NQ
bK
Nc.d= 10.725inN
Ub =1Pb
=N sin V :V:=Q.cbQ
Q.NQ
bK
Nc.d= 29.11in fromcreatedorigin
UN = 29.11in − 30in = 0.89in(frombottom)
[N = UN:P = =b sinN V :V:=Q..cbQ
Q.NQ
bK
Nc.d= 9092.18in^
[N = 9092.18in^ − P:N = 9092.18in^ − (10.725inN 30in−0.89in)N = 3.9in^(aboutcentroid) Neutral Axis: (neglecting reinforcement and moduli ratio (n))
P ∙ U = 10.725inN U − 0.89in + 4.41inN U − 3.589in + 8.488inN U − 9.756in = 0 U = 4.58in(frombottom) Moments of Inertia: (about neutral axis using parallel axis theorem) [Q = 25.404in^ + P:N = 25.404in^ + (4.2416inN 9.761in−4.58in)N = 139.26in^ [N = 2.251in^ + P:N = 2.251in^ + (2.205inN 4.58in−2.067in)N = 16.176in^ [b = 3.90in^ + P:N = 3.9in^ + (10.725inN 4.58in−0.89in)N = 149.933in^ [ = [Q + [N + [b = 139.26in^ + 16.176in^ + 149.933in^ = 305.37in^
C3
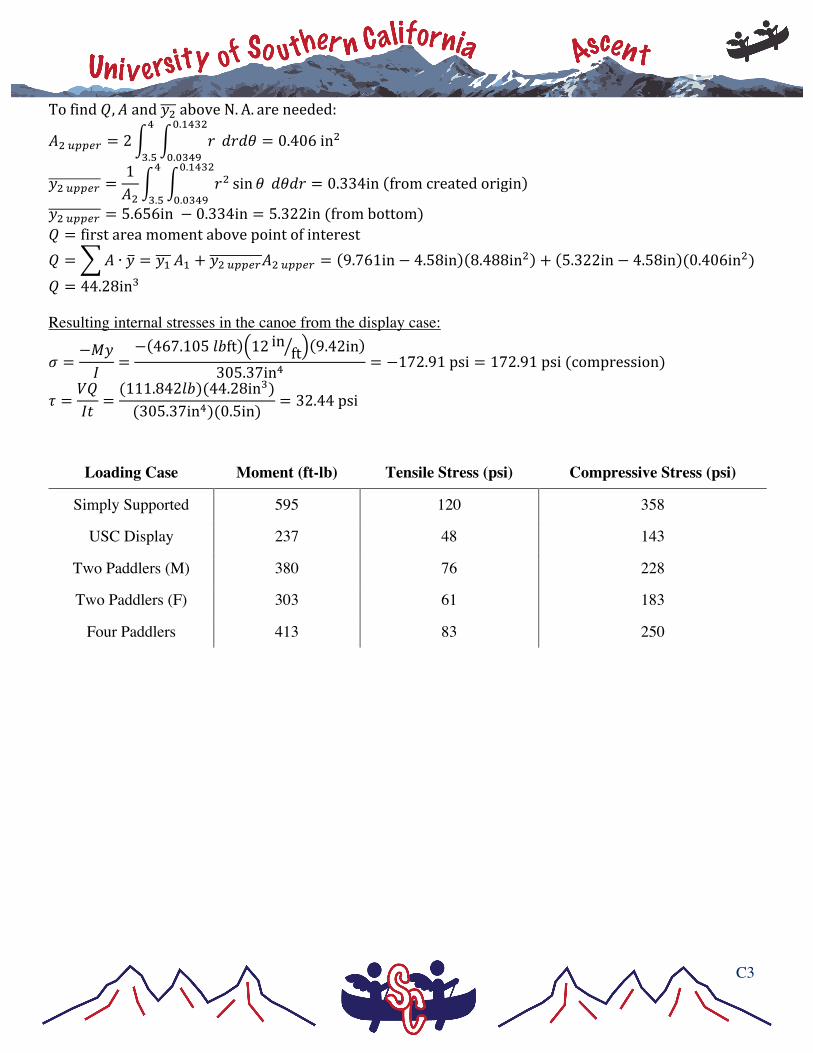
Tofindg, PandUNaboveN. A. areneeded:
PNmnnop = 2 = :=:VK.Q^bN
K.Kb^c
^
b.d= 0.406inN
UNmnnop =1PN
=N sin V :V:=K.Q^bN
K.Kb^c
^
b.d= 0.334in fromcreatedorigin
UNmnnop = 5.656in − 0.334in = 5.322in(frombottom) g = firstareamomentabovepointofinterest g = P ∙ U = UQ PQ + UNmnnopPNmnnop = 9.761in − 4.58in 8.488inN + 5.322in − 4.58in (0.406inN) g = 44.28inb Resulting internal stresses in the canoe from the display case:
r =−JU[
=− 467.105/0ft 12 in ft 9.42in
305.37in^= −172.91psi = 172.91psi(compression)
s =Hg[4
=(111.842/0)(44.28inb)(305.37in^)(0.5in)
= 32.44psi
Loading Case Moment (ft-lb) Tensile Stress (psi) Compressive Stress (psi)
Simply Supported 595 120 358
USC Display 237 48 143
Two Paddlers (M) 380 76 228
Two Paddlers (F) 303 61 183
Four Paddlers 413 83 250
D1
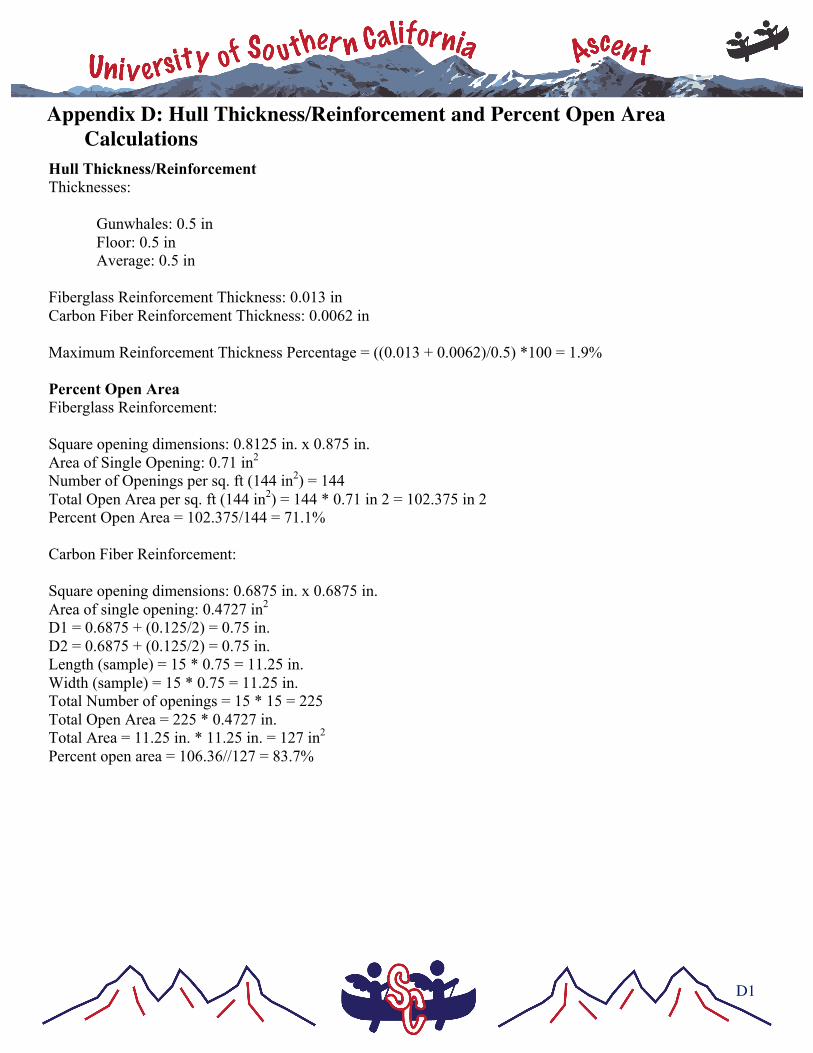
Appendix D: Hull Thickness/Reinforcement and Percent Open Area Calculations
Hull Thickness/Reinforcement Thicknesses:
Gunwhales: 0.5 in Floor: 0.5 in Average: 0.5 in
Fiberglass Reinforcement Thickness: 0.013 in Carbon Fiber Reinforcement Thickness: 0.0062 in Maximum Reinforcement Thickness Percentage = ((0.013 + 0.0062)/0.5) *100 = 1.9% Percent Open Area Fiberglass Reinforcement: Square opening dimensions: 0.8125 in. x 0.875 in. Area of Single Opening: 0.71 in2 Number of Openings per sq. ft (144 in2) = 144 Total Open Area per sq. ft (144 in2) = 144 * 0.71 in 2 = 102.375 in 2 Percent Open Area = 102.375/144 = 71.1% Carbon Fiber Reinforcement: Square opening dimensions: 0.6875 in. x 0.6875 in. Area of single opening: 0.4727 in2 D1 = 0.6875 + (0.125/2) = 0.75 in. D2 = 0.6875 + (0.125/2) = 0.75 in. Length (sample) = 15 * 0.75 = 11.25 in. Width (sample) = 15 * 0.75 = 11.25 in. Total Number of openings = 15 * 15 = 225 Total Open Area = 225 * 0.4727 in. Total Area = 11.25 in. * 11.25 in. = 127 in2 Percent open area = 106.36//127 = 83.7%