Embed Size (px)
Citation preview
v o l . 1 4 • n o . 2 • F a l l 2 0 1 0
CONCORDCONCORD
10
12
14
15
Perspective: Prepare and Inspire, A Watershed Report
Ready, Set, Go Evolution!
Monday’s Lesson: Quantum Chemistry at Your Fingertips
Visualizing Dissolving with IR Imaging
7
8
2 Student-Teacher Feedback Loops Promote Inquiry
Molecular Literacy in the Science Classroom
Probes, Models, and UDL in the Elementary Science Classroom
Innovator Interview: Stephen Bannasch
4
Realizing the promise of educational technology.
2 w w w . c o n c o r d . o r g • v o l . 1 4 • n o . 2 • F a l l 2 0 1 0
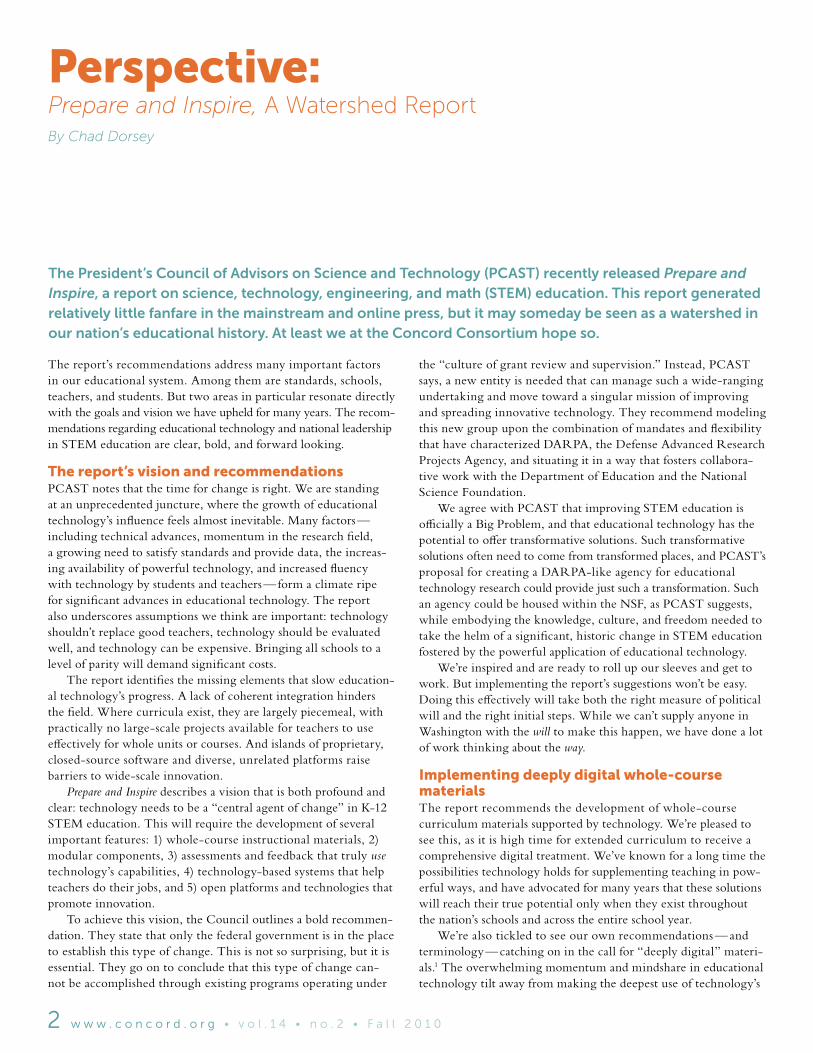
The President’s Council of Advisors on Science and Technology (PCAST) recently released Prepare and Inspire, a report on science, technology, engineering, and math (STEM) education. This report generated relatively little fanfare in the mainstream and online press, but it may someday be seen as a watershed in our nation’s educational history. At least we at the Concord Consortium hope so.
Perspective: Prepare and Inspire, A Watershed Report By Chad Dorsey
The report’s recommendations address many important factors in our educational system. Among them are standards, schools, teachers, and students. But two areas in particular resonate directly with the goals and vision we have upheld for many years. The recom-mendations regarding educational technology and national leadership in STEM education are clear, bold, and forward looking.
The report’s vision and recommendationsPCAST notes that the time for change is right. We are standing at an unprecedented juncture, where the growth of educational technology’s influence feels almost inevitable. Many factors — including technical advances, momentum in the research field, a growing need to satisfy standards and provide data, the increas-ing availability of powerful technology, and increased fluency with technology by students and teachers — form a climate ripe for significant advances in educational technology. The report also underscores assumptions we think are important: technology shouldn’t replace good teachers, technology should be evaluated well, and technology can be expensive. Bringing all schools to a level of parity will demand significant costs. The report identifies the missing elements that slow education-al technology’s progress. A lack of coherent integration hinders the field. Where curricula exist, they are largely piecemeal, with practically no large-scale projects available for teachers to use effectively for whole units or courses. And islands of proprietary, closed-source software and diverse, unrelated platforms raise barriers to wide-scale innovation. Prepare and Inspire describes a vision that is both profound and clear: technology needs to be a “central agent of change” in K-12 STEM education. This will require the development of several important features: 1) whole-course instructional materials, 2) modular components, 3) assessments and feedback that truly use technology’s capabilities, 4) technology-based systems that help teachers do their jobs, and 5) open platforms and technologies that promote innovation. To achieve this vision, the Council outlines a bold recommen-dation. They state that only the federal government is in the place to establish this type of change. This is not so surprising, but it is essential. They go on to conclude that this type of change can-not be accomplished through existing programs operating under
the “culture of grant review and supervision.” Instead, PCAST says, a new entity is needed that can manage such a wide-ranging undertaking and move toward a singular mission of improving and spreading innovative technology. They recommend modeling this new group upon the combination of mandates and flexibility that have characterized DARPA, the Defense Advanced Research Projects Agency, and situating it in a way that fosters collabora-tive work with the Department of Education and the National Science Foundation. We agree with PCAST that improving STEM education is officially a Big Problem, and that educational technology has the potential to offer transformative solutions. Such transformative solutions often need to come from transformed places, and PCAST’s proposal for creating a DARPA-like agency for educational technology research could provide just such a transformation. Such an agency could be housed within the NSF, as PCAST suggests, while embodying the knowledge, culture, and freedom needed to take the helm of a significant, historic change in STEM education fostered by the powerful application of educational technology. We’re inspired and are ready to roll up our sleeves and get to work. But implementing the report’s suggestions won’t be easy. Doing this effectively will take both the right measure of political will and the right initial steps. While we can’t supply anyone in Washington with the will to make this happen, we have done a lot of work thinking about the way.
Implementing deeply digital whole-course materialsThe report recommends the development of whole-course curriculum materials supported by technology. We’re pleased to see this, as it is high time for extended curriculum to receive a comprehensive digital treatment. We’ve known for a long time the possibilities technology holds for supplementing teaching in pow-erful ways, and have advocated for many years that these solutions will reach their true potential only when they exist throughout the nation’s schools and across the entire school year. We’re also tickled to see our own recommendations — and terminology — catching on in the call for “deeply digital” materi-als.1 The overwhelming momentum and mindshare in educational technology tilt away from making the deepest use of technology’s

Chad Dorsey ([email protected]) is President of the Concord Consortium.
w w w . c o n c o r d . o r g • v o l . 1 4 • n o . 2 • F a l l 2 0 1 0 3
We are standing at an
unprecedented juncture,
where the growth of
educational technology’s
influence feels almost
inevitable.
potential. Instead, materials often use technology for glitz, but miss opportunities for more complete content connections, or bring a textbook’s words and diagrams into electronic format, but stop short of including elements that could engage students in deeper interaction or inquiry. This tendency is understand-able — it’s often very difficult to determine the strongest uses of technology for learning. But it does not serve students well. If a national effort is to spur large-scale innovation that is truly deeply digital, those leading the work will need to provide care-fully selected examples and clear guidance, actively encouraging the best use of technology and staying focused on solid support of learning. Providing and publicizing a well-chosen library of deeply digital examples and design principles would be a start. And vigilance in holding development to these high standards will be necessary to sustain the integrity of this work. As we undertake this huge effort, we shouldn’t forget how much past work has already been completed. Previous curriculum efforts supported by the NSF and others have sketched out marvel-ous and rigorous curricula for these STEM courses many times over. They have generally faded into the background not because of lack of quality, but because they have been unable to compete with glossier or better publicized efforts. Certainly, these curricula have generally not been designed with digital media in mind, but they are built with some of the country’s best pedagogical knowl-edge at their center and generally demonstrate excellent thinking
about the coherent presentation of curricular ideas. Allowing this massive investment to go to waste is practically unconscionable. The materials are available. The nation owns the licenses. Start-ing a round of whole-course STEM materials without reviewing this body of work would be shortsighted. Of course, much would need to be changed to bring these ideas into deeply digital form. Adaptations of these materials should not simply be recreations of textbooks on a computer screen. But thoughtful adaptations could help these become a very effective core for digital curricula. Of course, we would be remiss if we did not also drive home the importance of these materials for supporting science instruction through what we have long termed digital inquiry. Digital materials open up possibilities for great inquiry learning by enabling students to formulate and test ideas by manipulating computational models or investigating their surroundings with probeware. While we are certain this assumption was implicit in PCAST’s thinking, we encourage all involved to make it both clear and explicit in any future efforts. The PCAST report is reinvigorating. But we know that the possibilities that lie ahead will demand work to become reality, so we encourage all our colleagues to stay focused on this goal. And even in cases where doing so will inevitably involve making some difficult political choices, we urge the administration to listen to and enact these wise recommendations.1 See “The Deeply Digital Texts Initiative” in the Fall 2009 issue of @Concord.

Have you ever wondered why manatees have toenails?
Do they use them to dig in the sand?
Or maybe to scratch their itchy spots?
The fourth grade students participating in the Evolution
Readiness project in Massachusetts, Missouri, and
Texas know why. Manatees evolved from an ancestor
that had toenails — a common ancestor that they share
with elephants! While their toenails have no practical
function, they remain as a reminder of their terrestrial
ancestors. Demystifying concepts like common
ancestry is just one of the many objectives of the
Evolution Readiness project.
Camelia Rosca ([email protected]) is a Senior Research Associate at the Center for the Study of Testing, Evaluation, and Educational Policy, Boston College.
Laura O’Dwyer ([email protected]) is an Associate Professor in the Educational Research, Measurement, and Evaluation Department, Boston College.
Trudi Lord ([email protected]) manages the Evolution Readiness project at the Concord Consortium.
Paul Horwitz ([email protected]) directs the Evolution Readiness project at the Concord Consortium.
By Camelia Rosca, Laura O’Dwyer, Trudi Lord, and Paul Horwitz
evolution!Ready, set, go

w w w . c o n c o r d . o r g • v o l . 1 4 • n o . 2 • F a l l 2 0 1 0 5
Cohort 1 Cohort 2 Is the difference in means
significant?
Effect sizeMean Sample
sizeMean Sample
size
All Students 534.36 132 557.4 186 Yes .31
Massachusetts Students 553.40 33 556.59 39 No .05
Missouri Students 550.29 50 574.38 80 Yes .34
Texas Students 505.21 49 537.59 67 Yes .47
Using a cohort design, we collected pre-program and post-program implementation data from the students of nine participating elementary teachers in three states. In all, we collected pre-implementation baseline data from 132 students (Cohort 1) who had not been exposed to the Evolution Readiness learning goals progression, computer-based activities, and supplemental curriculum materials. The following year, a second cohort of 186 students (Cohort 2, students from the same schools who had the same teachers as Cohort 1) was exposed to the curriculum.
evolution!
Models address complex concepts The Evolution Readiness project seeks to support elementary schoolchildren in acquiring the prerequisite concepts necessary for understanding the theory of evolution by natural selection. Funded by the National Science Foundation, this project is being conducted by the Concord Consortium in collaboration with researchers at Boston College’s Center for the Study of Testing, Evaluation, and Educational Policy. Our team has developed computer-based models, classroom activities, and assess-ment materials based on a progression of learning goals that elaborate the existing science standards and detail a series of concepts that are instrumental in under-standing evolution. Confronting fourth grade students directly with the fundamental concepts of evolutionary theory — e.g., descent with modification — would most likely generate quizzical looks and downright confusion. Constructing a full understand-ing of evolution is a step-by-step process. The purpose of our curriculum is to provide engaging activities, hands-on experiences, and computer models that make each step fun for students and easy for teachers. Thus, our big ideas are broken down into smaller goals, which are addressed in both classroom activities and computer-based activities. In the 2009-2010 implementation, students were presented with five offline activities and five computer activities, focused on evolution in plants. Each computer activity contains two or three scaffolded models used to experiment with specific concepts such as variation, heritability, and selection pressure. Students began by learning about the life cycle of flowering plants. In the classroom, they planted seeds from FastPlants and watched the seedlings mature into adult plants. In parallel, on the computer they planted virtual seeds from several variet-ies of “Mystery Plants,” and discovered that variation in the plants allowed some individuals to survive in different environ-ments. This simple but important concept is just one of many blocks needed to build a solid foundation as students move closer to understanding evolution. The Evolution Readiness activities support students as their understanding
progresses through the following stages: a) move from reasoning about single organisms to reasoning about populations, b) move from thinking about populations in an environment to recognizing that each population’s environment is composed of other interacting populations, c) recognize the importance of physical and behavioral variation among the organisms in a population and its effect on relative fitness, d) understand that some of the variation within populations is heritable, and e) as a result, over many generations, populations may change as fitter organisms have more offspring and the traits that made them fitter become more frequent. This progression in understanding can be as difficult for adults as for children. Accordingly, we supported teachers with online training, classroom guides, and face-to-face workshops.
Results show significant student gainsAt the start of our project there were no test instruments available that measured understanding of evolution at the fourth grade level, so we developed a Concept In-ventory for Evolution Readiness, aligned to our learning goals progression. We piloted this concept inventory, which includes both multiple-choice and constructed response items, during the first year of the project and refined it to achieve high validity, reliability, and psychometric quality. Estimates of students’ knowledge of the
concepts were computed for two cohorts using traditional measurements and Rasch modeling, a type of statistical analysis that determines students’ understanding/ability regardless of the test difficulty. An indepen-dent means t-test showed that the second cohort of students who used the Evolution Readiness materials performed statistically significantly better than students who had not used the materials. There was some variability in imple-mentation among the three states, which was reflected in the magnitude of the gains from Cohort 1 to Cohort 2. Not surpris-ingly, for instance, the state where the curriculum was first implemented achieved the lowest gain. The lessons learned from this first implementation — through direct observation as well as teacher interviews — were used to refine the curriculum before introducing it in the other two states. The later two states benefited not only from curriculum changes, but also from an additional teacher workshop conducted on site prior to the start of the unit. We also observed a significant difference between the two states that started later, with the state with the lower baseline score showing the greatest gain. The post-test demonstrated that students were able to identify particular physical traits that an organism needs to survive in a given environment, and they had a general understanding that animals obtain energy and resources by eating plants and other

In this model, students build a dam and watch as the environment changes below the dam, thus favoring one of the three types of plant, and eventually one type of rabbit that eats the plant.
L I N K S
Evolution Readiness http://concord.org/er
animals, that plants produce their own food, and that plants and animals have basic needs like air, water, light, nutrients, food, and shelter. These basic ecology topics are important to understand before delving into the mechanics of evolution. However, students had difficulty understanding the more complex evolutionary concepts: different species can arise from one species if different groups have different selection pressures; selection pressure can lead to a change in the characteristics of a population; and species adapt to changes in their environment. To address some of these shortfalls, six additional activities have been added to the curriculum for implementation in the 2010-2011 school year. They focus on evolution through an ecology lens and cover competition for resources, selection pressure, and interdependence among the various species in an ecosystem.
Evolution as the heart of biologyEvolution occupies a place in biology akin to that of Newton’s Laws in physics. Just as the formula F = ma describes the motion of objects, so the mechanism of evolution by natural selection explains the fantastically intricate and diverse adaptations exhib-ited by organisms. It is curious, then, that evolution is not given a more prominent place in biology education. Arguably, it should be front and center in every biology curriculum, rather than being relegated
to a section of its own at the back of the textbook. Aside from the political controversy surrounding the subject — which may have caused some U.S. publishers to minimize its importance — it is also true that evolu-tion is a particularly difficult concept to learn and to teach. It is driven, after all, by tiny variations between organisms that become amplified only after a filter-ing process requiring many generations. In most cases (bacterial patho-gens being one obvious exception), the process takes place too slowly to be directly perceived and must, therefore, be inferred from indirect evidence such as fossils or DNA sequencing. In modern terminology, evolution is an “emergent behavior”— the unexpected outcome of many iterations of a simple process involving heritable traits that give rise to small differences in reproduc-tive success. The model is straightforward but surprising and difficult to grasp. Computers are very good at doing the same thing over and over very quickly, so it is natural to use them to build models that evolve through natural selection. It is a small step to adapt such models to enable students to manipulate them, experiment with them, and learn from them. Our Evolution Readiness project is demonstrat-ing the value of this approach with very young children. This is a first step toward
a broader “learning progression” that will engage older students with models that include processes such as Mendelian genetics (unknown to Darwin) as well as cutting-edge topics in molecular biology that are the subjects of current research.
In a much-quoted 1973 essay the evo-lutionary biologist (and Russian Orthodox Christian) Theodosius Dobzhansky wrote, “Nothing in biology makes sense except in the light of evolution. ” 1 Dobzhansky was reacting to anti-evolution theories such as creationism, but his statement has important implications for pedagogy as well. Arguably, it makes little sense to teach biology from anything but an evolutionary point of view. The results reported here are grounds for hope that such a goal is within reach and that, given powerful modeling tools and a teaching strategy that embraces a carefully orchestrated learning progres-sion, students can be taught to understand and appreciate the extraordinary power of evolutionary theory as a unifying concept throughout the biology curriculum.
“ Nothing in biology makes sense except in the light of evolution.”
6 w w w . c o n c o r d . o r g • v o l . 1 4 • n o . 2 • F a l l 2 0 1 0
1 American Biology Teacher, volume 35, pages 125-129.
w w w . c o n c o r d . o r g • v o l . 1 4 • n o . 2 • F a l l 2 0 1 0 7
Monday’s Lesson:
Quantum Chemistry at Your Fingertips
Charles Xie ([email protected]) is the creator of the Molecular Workbench software and the director of the Electron Technologies project.
By Charles Xie
The interactions among electrons and nuclei are fundamentally important in determining the chemical properties of atoms and molecules. It is the gain, loss, and sharing of electrons that governs all chemical reactions. A chemical bond is created when two or more atoms share their electrons. The distribution of electrons in atoms and molecules affects how they interact and form various structures and states. Understanding the properties of electrons is a key to understanding chemistry. Fundamental concepts in chemistry can be explained from the perspective of electronic interactions. In this lesson, which you will complete online, your students will be guided through a sequence of interactive simulations powered by a real-time computational quantum dynamics engine called the Quantum Workbench, embedded in our Molecular Workbench software. But don’t be intimidated by the word “quantum.” The Quantum Workbench uses dynamic, interactive visualizations to teach the same concepts — like electron clouds and chemical bonding — you’ve seen in static textbook illustrations. For example, your students can drag the nucleus around to see how the electron cloud follows it. This explains why an atom that consists of a nucleus and an electron cloud can move as a whole.
Students can also:
• change the charge on the nucleus to see why the electron cloud cannot form an atom with a single neutron or why a negatively charged ion cannot take more electrons.
• apply an external electric field to see how an atom can be polarized or ionized, depending on the intensity of the field.
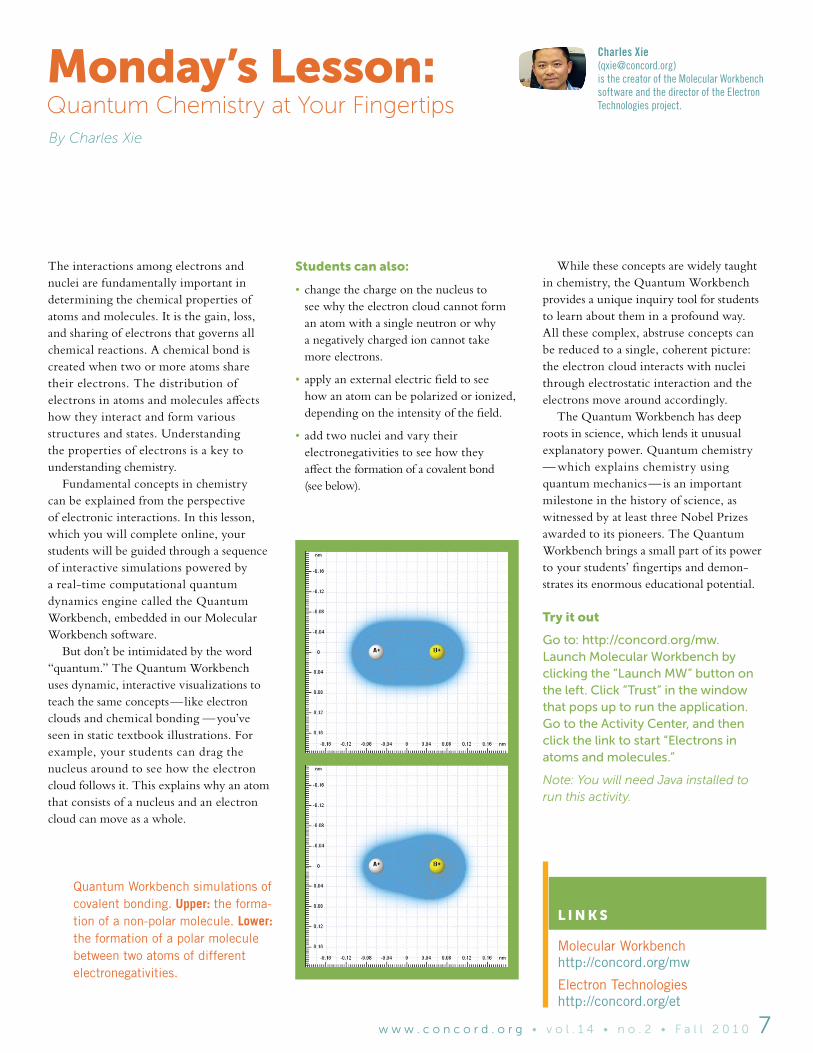
• add two nuclei and vary their electronegativities to see how they affect the formation of a covalent bond (see below).
While these concepts are widely taught in chemistry, the Quantum Workbench provides a unique inquiry tool for students to learn about them in a profound way. All these complex, abstruse concepts can be reduced to a single, coherent picture: the electron cloud interacts with nuclei through electrostatic interaction and the electrons move around accordingly. The Quantum Workbench has deep roots in science, which lends it unusual explanatory power. Quantum chemistry — which explains chemistry using quantum mechanics — is an important milestone in the history of science, as witnessed by at least three Nobel Prizes awarded to its pioneers. The Quantum Workbench brings a small part of its power to your students’ fingertips and demon-strates its enormous educational potential.
Try it out
Go to: http://concord.org/mw. Launch Molecular Workbench by clicking the “Launch MW” button on the left. Click “Trust” in the window that pops up to run the application. Go to the Activity Center, and then click the link to start “Electrons in atoms and molecules.”
Note: You will need Java installed to run this activity.
L I N K S
Molecular Workbench http://concord.org/mw
Electron Technologies http://concord.org/et
Quantum Workbench simulations of covalent bonding. Upper: the forma-tion of a non-polar molecule. Lower: the formation of a polar molecule between two atoms of different electronegativities.
Did you know that dissolving table salt in water requires energy? Chemists call such a reaction endothermic, but how can you know that’s what really happens? Because seeing is believing!
Infrared (IR) imaging allows you to see the temperature distribution of a system based on detecting the IR radiation it emits. The temperature of a given location reflects the heat absorbed or released there. IR cameras are easy to use — just point and shoot — and the images are intuitive: color shows temperature distribution. IR cameras are also becoming more affordable (Flir and Fluke sell versions for $1,500-$2,500), making their classroom use more feasible. An IR camera presents an innovative way to visualize chemical processes that absorb or release heat. This article shows the visualization of dissolving as an example. The heat of solution, which is a measure of the energy absorbed or released when a solvent dissolves in a solute, is 3.9 and 16.7 kJ/mol for table salt (NaCl) and baking soda (NaHCO3), respectively. Both are endo-thermic, meaning they absorb heat when dissolving in water. IR imaging is sensitive enough to capture the heat of solution of NaCl and show the higher endothermicity of NaHCO3. This experiment is easy to do and requires only three plastic cups and a few teaspoons of table salt and baking soda — plus an IR camera.
Preparation. Remove everything from a tabletop and place three cups next to each other (Figure 1). Carefully fill the cups with the same amount of water. If you ac-cidentally spill any water outside the cups or on the inside walls, wipe the area with a tissue and wait until it is completely dry. This step is necessary because the highest
and lowest temperatures in the IR camera’s viewfinder affect the color of every pixel in an IR image. The evaporative cooling effect from a wet area may create a greater temperature range in which the effect of the heat of solution may become too small to show up in the same IR image. For the same reason, the color of a point may differ from one IR image to another if there is a change of highest or lowest temperature in the viewfinder — even if the temperature at the point itself does not change. It is, therefore, important to have a cup of plain water (no solute) in the viewfinder to pro-vide a reference that will stay at the same temperature throughout the experiment. When analyzing the results, you can only compare colors within the same IR image.
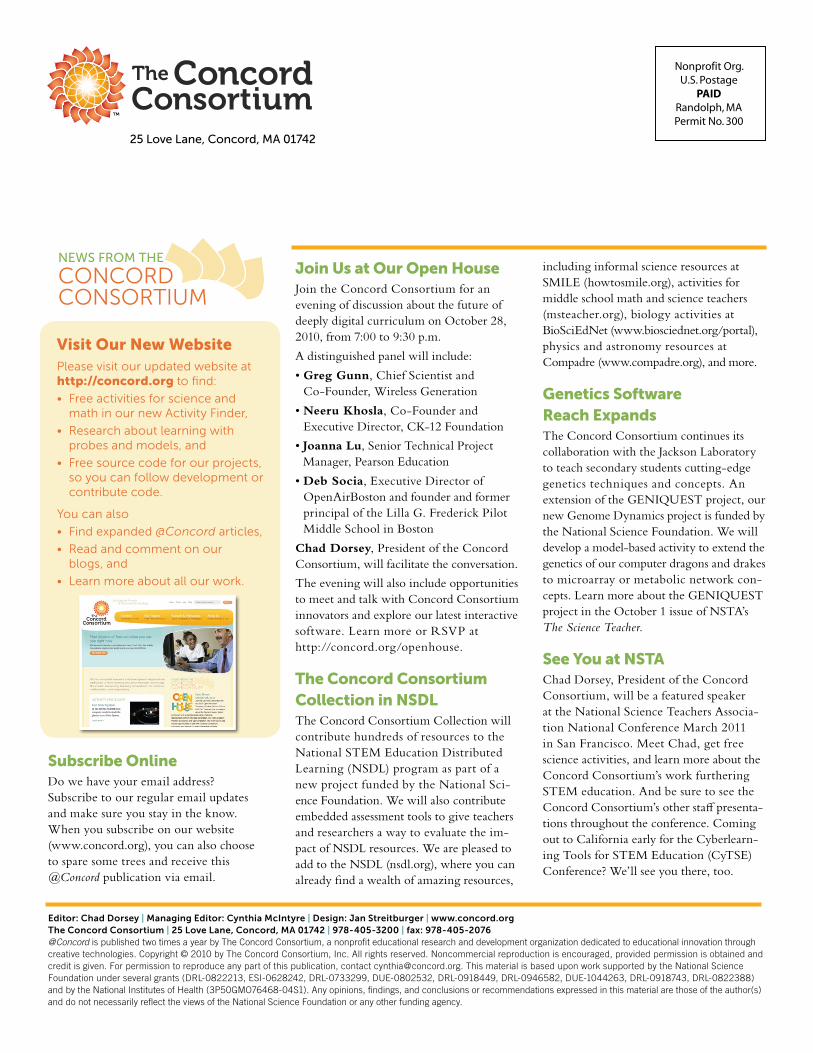
Observation. Before making solutions, take an IR image of the three cups. The image should show no appreciable tem-perature difference among the three cups
(Figure 2a). Note that the cups appear green because water was evaporating, which caused it to be slightly cooler than the environment (you can use an empty cup to confirm this). Now add table salt to one cup and baking soda to another and take an IR image. You should observe a pattern similar to Figure 2b, which shows that both substances sank to the bottom
Visualizing Dissolving with
IR Imaging By Charles Xie
Charles Xie ([email protected]) is a pioneer of the educational applications of IR imaging who has devised many IR-based experiments for physical science and engineering.
8 w w w . c o n c o r d . o r g • v o l . 1 4 • n o . 2 • F a l l 2 0 1 0
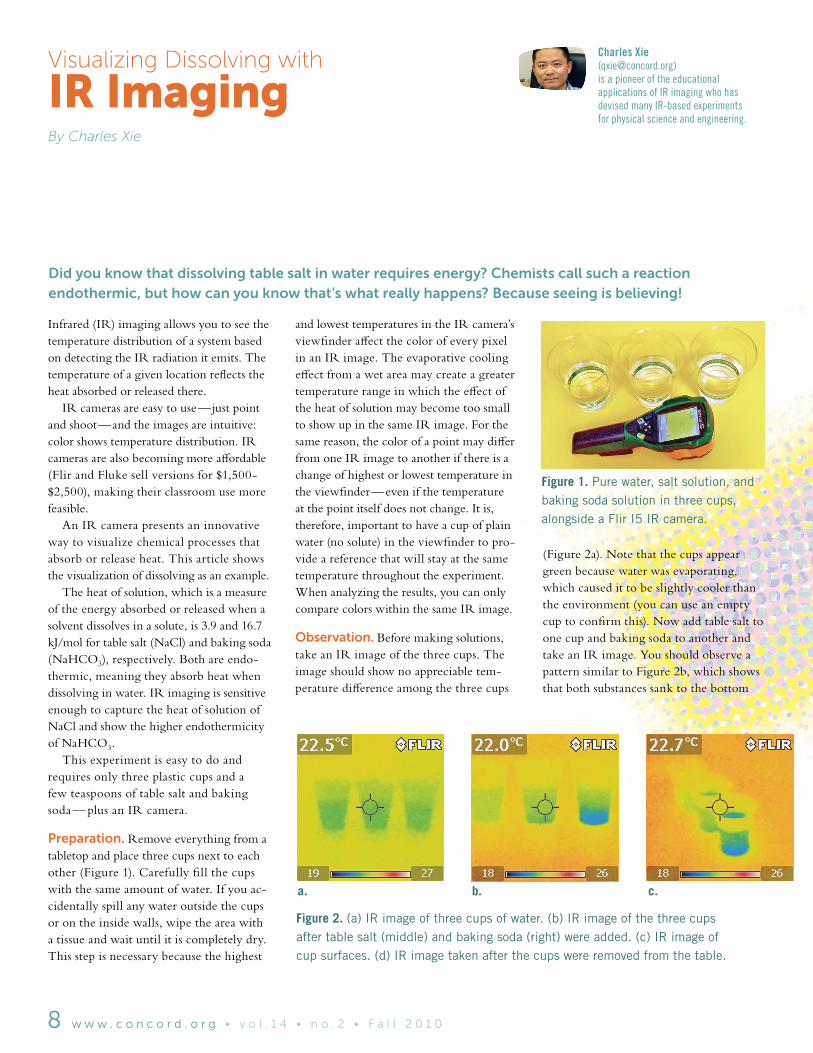
Figure 1. Pure water, salt solution, and baking soda solution in three cups, alongside a Flir I5 IR camera.
Figure 2. (a) IR image of three cups of water. (b) IR image of the three cups after table salt (middle) and baking soda (right) were added. (c) IR image of cup surfaces. (d) IR image taken after the cups were removed from the table.
b.a. c.

w w w . c o n c o r d . o r g • v o l . 1 4 • n o . 2 • F a l l 2 0 1 0 9
Figure 3. These IR images show some unexpected results after the cups were left for three days. (a) IR image shows that the surface of the solutions is cooler than that of the pure water. (b) IR image shows that the lower parts of the solutions are warmer than the upper parts.
b.a.d.
quickly. Most dissolving took place later. The cup in the middle with table salt was slightly cooler, but the cup on the right with baking soda was approximately 3°C cooler at the bottom where dissolving was occurring. You can take an IR image from a different angle that shows the liq-uid surfaces (Figure 2c). The temperature of the surface of the NaHCO3 solution was the coolest. Quickly remove the cups and immediately take an IR image of the table; you may see some traces of the cool-ing effect on the tabletop (Figure 2d). The IR images show that dissolving both substances is endothermic and the heat of solution of baking soda is much greater than that of table salt. (Note: We verified results with a fast-response surface tem-perature sensor, taking measurements at different locations in the three cups.) Thanks to IR imaging technology, stu-dents can now see the effects of otherwise invisible chemical processes. Because the
dissolving process happens slowly, the cool-ing effect lasts for a while, giving students plenty of time to observe and explore.
A discovery toolAdd more salt and baking soda to the cups to make sure you have saturated solutions. Give the cups a few hours to stabilize and you should see some baffling images (Figure 3). The surfaces of the solutions ap-peared to be slightly cooler than that of the pure water (Figure 3a). Does this mean that the IR emissivity of a solution is different from that of pure water? If not, why should the surface of a solution be cooler? An IR image from a different angle suggests that the lower parts of the solutions were slightly warmer (about 0.5°C) than the upper parts, whereas the temperature of the pure water was the same throughout (Figure 3b). This is counterintuitive because we would expect that the entire solution should have reached a thermal equilibrium.
If not, we would expect the bottom to be cooler since a colder liquid should sink. This puzzling temperature gradient lasts for a long time. You can verify it after three days. What is the thermodynamic driving force for this temperature gradient? If you are curious about figuring this out with us, please visit our blog. As this experiment shows, IR imag-ing can be used as a powerful inquiry and discovery tool for exploring chemistry. Capable of detecting a difference of 0.1°C, an IR camera can capture subtle scientific effects quickly and allow students to discover science in a profound way. Dozens of other experiments — from phase change to latent heats, heats of reac-tion, and more — can be investigated. IR imaging opens a new door to chemistry visualization and discovery, making science as colorful and exciting as we know it is.

Whatdoesinquirylooklikeinyour
scienceclassroom?Whileinquiry
appearsinmanyforms,an“inquiry
classroom”generallyfeatures
studentsexperimentingandtesting
variables,collectingdata,analyzing
it,presentingittotheclass,and
buildingunderstandingthrough
discussionsandscientificdebates.
But what happens when students are exper-imenting and collecting data in an online activity using probes or a computer model? Students may be doing experiments, but as they crouch over their computers, would you know how well they are investigat-ing and learning? Would you know how far they had progressed or what they had tried? Having made some discoveries, could students easily share them with you and the class, ready to defend their data and their conclusions? The Concord Consortium’s LOOPS project, funded by the National Science Foundation, aims to answer these ques-tions and more by researching new ways to use online activities to support inquiry. LOOPS, or more formally Logging Op-portunities in Online Programs for Science, also describes its fundamental feature, namely direct and timely feedback loops between students and teachers.
By Nathan Kimball and Kimberle Koile
Nathan Kimball ([email protected]) is a curriculum designer and educational researcher.
Kimberle Koile ([email protected]) is a Senior Research Scientist.
Student-Teacher Feedback
Loops Promote Inquiry
Here’showitworks.Studentssubmittheirin-classworkviawirelessnetwork.
TheteacherusesthestudentworkalongwithsummaryinformationthatLOOPS
providestoassesseachstudent’sprogressandtoguidethecourseofinstruction.
Iftheteacherchooses,studentworkcanbeselectedandsharedwiththeclass
viaprojectororonstudents’computers,thuscompletingtheloopfromstudent
toteacherandbackagain.Theseperformanceandformativeassessmentloops
makeastudent’sclassroomworktransparenttotheteacherandprovidefor
flexiblelessons.
10w w w . c o n c o r d . o r g • v o l . 1 4 • n o . 2 • F a l l 2 0 1 0

By Nathan Kimball and Kimberle Koile
Kimberle Koile ([email protected]) is a Senior Research Scientist.
Student-Teacher Feedback
Loops Promote Inquiry
What’s in a loop? Let’s look at the first half of a loop: conveying student ideas to the teacher. In inquiry, a student’s science ideas are para-mount — these are the ideas we as science educators must nurture and build upon. Yet, coaxing out student ideas and having students communicate them effectively can be difficult. Tried and true methods of eliciting student thoughts, such as multiple-choice and open response questions, are still important. LOOPS, however, is broadening the pathways of communica-tions in online activities by providing ways for students to submit evidence of their understanding in multiple formats. Graphs, which are indispensable tools for scientific exchange, may be sent to the teacher either as hand-drawn experiment predictions or as data from probes. Students can also use snapshots that capture the state of online models and images made with a drawing tool to present their learning. In a LOOPS activity, students forward these representa-tions and associated annotated comments to the teacher by clicking a “Submit” button when they are satisfied with their work. As students collect additional data or change or improve upon their ideas, they can resub-mit their work. Here is where the second half of a loop begins: the teacher receives student work. Teachers can easily monitor student progress by viewing summarized data, including pie charts representing the number of students who have started and those who have completed particular steps in an activity. The pie charts also function as clickable buttons that teachers can use to view the actual responses arrayed in a manner that can be understood quickly. Responses to multiple-choice questions are encapsulated into histograms. Text, graphs, and pictorial responses are ar-ranged in tables. To lead a discussion using student data, teachers can select some or all student responses for public display. At this point, the selected student responses appear, with or without student names, on the class projector and simultaneously on each student’s machine.
Students become greatly invested in see-ing and explaining their data or defending their results. By viewing a representative sample of student results, students whose answers are outliers may decide to rethink their approaches or advocate for their posi-tions. Teachers can use these discussions to redirect student learning if misconceptions remain or bring issues to debate or closure.
The role of teachers using loopsHaving access to student work during class can pose a dilemma. Teachers generally like to circulate among students, checking on progress, offering suggestions, and address-ing problems. But with LOOPS, student work can come pouring into the teacher’s computer all at once. Should teachers be focusing on students’ submitted work or on the students themselves? In early LOOPS field trials, finding the balance was tricky, especially because the teachers were using desktop computers and circulating while looking at student work was impossible. In a recent pilot test in a suburban Boston middle school, we tried a different configuration of classroom technology. The teacher used a wireless tablet computer that could be operated with a stylus pen. The keyboard folded out of the way so the com-puter could be held with one hand while walking or standing. We also redesigned the teacher interface for greater simplicity. The teacher could move about the class in-teracting with student groups, then glance down to get an overall impression of stu-dent progress and decide when to interrupt student activities to lead a discussion. View-ing student work while circulating through the classroom and talking to students took some practice, but within a day, our pilot teacher — a 30-year veteran — was working with students while intermittently checking the interface to gauge overall class under-standing. The teacher could also control the public display of student work on the projector and on student machines using the mobile device. The LOOPS approach encourages student inquiry and enables the classroom teacher to be actively engaged with students at the same time.
LOOPS now and in the futureThe LOOPS project is in the third year of its five-year funding period. We have learned a lot about what software features are needed to support looping and how best to use those features in the curriculum we write to enhance inquiry and inform the teacher of student progress. Pre- and post-test comparisons have shown very effective content improvement for motion studies using probes and selected chemistry topics using models in middle school classrooms in Massachusetts and California, where our University of California, Berkeley collaborators carry on parallel and complementary research.1 Moving forward, our goal is to enhance student inquiry skills as well as content knowledge. We will investigate whether further enhancements to the technology can capture and summarize the progres-sion of student explorations, and thus help inform teachers about students’ inquiry process skills. For example, if students are experimenting with a model that has a number of variables, do they test the vari-ables one at a time? Do they test extreme and intermediate values? How long do they spend with a model, and have they accumulated enough evidence to back up their understandings? Using this informa-tion, teachers will be able to help students develop their inquiry skills. LOOPS is expanding the role of student reflection and discussion about data and science ideas by making student interaction with online activities more visible to teach-ers and to other students. As one field test teacher commented, “With the technol-ogy… you removed the anxiety, and the students see the importance of expressing themselves clearly.”
1 Colleagues at the University of Toronto also collaborate with us on LOOPS research.
L I N K S
LOOPShttp://concord.org/loops
w w w . c o n c o r d . o r g • v o l . 1 4 • n o . 2 • F a l l 2 0 1 0 11

Modern science demands molecular literacy. Secondary science educators are increasingly supporting this view even though it requires substantial changes in the way science is taught. The Science of Atoms and Molecules (SAM) project has made important contributions to the reordering of the secondary science curriculum by creating materials that help teach students to reason at the molecular level in physics, chemistry, and biology. SAM offers 24 computer-based activities built within Molecular Workbench that allow students to explore the atomic basis of important science phenomena.
A remaining question is whether the secondary science sequence of courses is improved by including molecular-level content that builds progressively from one year to the next. Positive results could justify broader implementation of these materials and would provide empirical evidence for additional research and curriculum initiatives. Until recently, however, there was no evidence to as-sess the success of this substantial shift in science content. The National Science Foundation has funded the Concord Consortium to undertake this research.
BackgroundThe SAM materials were designed to provide the content missing in most “Physics First” curricula. For the physics-chemistry-biology sequence to work best, the basic physics of atoms and molecules needs to be introduced early, so that a fuller understanding of atomic and molecular interactions can be built in the second-year chemistry course. With that strong foundation, students can gain a better understanding of the complex molecular biology interactions in the third-year biology course. The SAM materials provide this content-focused progression. For example, in a first-year physics course, students learn about heat and tem-perature, electrostatics, and atomic structure, all of which are critical in understanding
intermolecular attractions, a central topic in the following year’s chemistry course (e.g., in phase change, solubility, and chemical bonds). In turn, intermolecular attractions are essential in biology for insight into the structure and function of biomolecules such as protein, DNA, lipids, and carbohydrates. The SAM materials are structured to maximize learning by presenting a progres-sion of relevant molecular concepts over the three-year sequence of courses. All activi-ties are based on guided inquiry, and the same computational engine and molecular visualization tools are used throughout. There is a common format and design for all activities, so students become familiar with the interface and navigation. In test schools, student gains as measured by pre- and post-tests show that students learned the content. However, do students apply the core concepts from one year to topics in subsequent years? If so, does student understanding grow over the years as a result of multiple exposures to our materials? Although there are many validated tests
in physics, chemistry, and biology, there are no test instruments that focus specifically on molecular concepts only. Therefore, we developed a molecular concept inventory (MCI) for each subject, aligned with the SAM learning goals in each activity, to use as a pre-test and post-test to measure changes in student learning. The study focused on students in 11th grade biology classes taught by five pilot teachers in Physics First high schools. Each student took a pre-test chemistry MCI and pre-test and post-test biology MCI. In the study, only data for students who completed all three assessments was analyzed (n=141). The chemistry MCI consists of 22 multiple-choice items and the biology MCI includes 40 multiple-choice items. These items were piloted prior to this research, revised, and tested again to achieve high validity, reliability, and psychometric quality. We identified how many and which SAM activities students had completed in their prior year chemistry classes. We also collected data on student demographics and attitudes about science.
Molecular Literacy
in the Science ClassroomBy Amy Pallant, Frieda Reichsman, and Sarah Pryputniewicz
Amy Pallant ([email protected]) is the SAM project manager.
Frieda Reichsman ([email protected]) directs the SAM project.
Sarah Pryputniewicz ([email protected]) is a research assistant.
• Is student exposure to SAM activities in one year correlated with knowledge gains in SAM activities in a subsequent year?
• Is student performance related to the percentage of completed activities in a course?
The Study This article presents data from part of a larger study. Here, we explore the following research questions:
12w w w . c o n c o r d . o r g • v o l . 1 4 • n o . 2 • F a l l 2 0 1 0

Table 1. Dependent means t-tests show that the difference between the percent correct on the biology pre- and post-tests is statistically significant (at <.001).
L I N K S
Science of Atoms and Molecules http://concord.org/sam
Molecular Workbench http://concord.org/mw
ResultsAn examination of the effectiveness of the SAM materials was conducted using pre- and post-tests to assess student content knowledge gains. Dependent means t-tests were conducted to examine whether there was a significant difference between the percent correct scores on the biology MCI pre- and post-tests. The dif-ference between the percent correct on the MCI pre-test and post-test was statistically significant for all 40 items (Table 1). Statistical analyses were also used to determine whether student performance on the post-test was related to the num-ber of activities completed in biology and chemistry. The results show that the number of biology activities and chemistry activities completed are each significantly and positively related to student scores on
the biology MCI post-test (Table 2). Additionally, the results of regression analyses show that for all 40 biology items, the total number of completed biology and chemistry activities is a significant predictor of student post-test scores, after controlling for student pre-test scores. These results demonstrate statistically significant effects of using the Science of Atoms and Molecules materials. Not only do students who complete more SAM biology activities fare better on the biology MCI post-test, but students who do more SAM chemistry activities improve their biology MCI scores the following year. These results support our hypothesis that student understanding grows from year to year as a result of multiple exposures to the SAM model-based materials.
ConclusionThese research results are a step closer to demonstrating that a serious treatment of atoms and molecules as a unifying theme across content areas has the potential to improve the science curriculum and student learning across years. As science has been changing to focus on the molecular level, there is an urgent need to revise the secondary science curriculum, teacher training, and professional development. The Science of Atoms and Molecules activities can help teachers realign their classroom tools and strategies in keeping with the most recent and exciting developments in science.
Table 1. Mean N Std. Dev. Mean Diff. t Sig. (2-tailed)
All Items
Pre-test Percent Correct 31.73 141 8.97
- 11.95 -7.54 <.001
Post-test Percent Correct 43.69 141 20.81
Table 2.Percent of biology activities completed * Percent of chemistry activities completed *
Pearson Correlation Sig. (2-tailed) Pearson Correlation Sig. (2-tailed)
Pre-test Percent Correct 0.142 .094 0.202 .016
Post-test Percent Correct 0.338 <.001 0.320 <.001
Table 2: Pearson correlations show that the number of completed biology activities and chemistry activities can each be used to predict student learning gains in biology. The value <.001 indicates a statistically significant correlation.
* At least 50% of the activity must be completed for an activity to be considered “complete.”
w w w . c o n c o r d . o r g • v o l . 1 4 • n o . 2 • F a l l 2 0 1 0 13

The dream of Universal Design for Learning (UDL) is to use computers to create flexible learning activities that can meet the needs of a wide range of young students. Flexibility is important for all students, but particularly for students with mild learning disabilities.
In 2006, with a grant from the National Science Foundation, we took up the challenge of creating UDL science materials. Led by our colleagues at CAST, the Center for Applied Special Technology, progress has been made in applying UDL ideas to language and communications. But creat-ing UDL science materials is substantially different because students need to learn through inquiry, they need to observe, and they need to learn general quantitative principles that can be applied in many contexts. The goal of our project was to come up with a UDL design for science curriculum using inquiry of real and virtual environments that is effective for a broad range of learners. Classrooms have students with a wide variety of needs, especially as the number of children receiving special education ser-vices within inclusive classrooms increases. Computer-based curriculum has the capac-ity to meet the needs of this increasingly diverse group of students and provide them with multiple paths by which they can engage the material, as well as multiple ways to acquire and express knowledge. But flexibility and multiplicity create a number of questions. Does every concept taught require a different treatment that ad-dresses various learning styles, disabilities, and thinking patterns? This could require numerous ways of teaching each concept. Even if we had only a few different treat-ments of a topic, how would the right one be assigned to a particular student? Would the student or the teacher select the right one? Do we want to target a student’s strengths or strengthen a weakness? Assessment raises additional questions. Should it match the materials? It doesn’t
make sense to ask a student who learned using materials that avoided advanced language skills to then take an assessment that relied on reading and writing. Should there be a different assessment for each treatment? How can we ensure that students who use different assessments learn the essential ideas? With so many possibilities, developing UDL materials is a huge undertaking. In our project, we created materials for four common elementary science topics at both the beginning (grades 3-4) and intermediate (grades 5-6) levels in order to develop a design that would begin to address these questions. Last year, 11 teachers and 500 students in two large school districts serving a large number of students from low-income
families used the activities. The results were quite encouraging. Student under-standing increased, and by about the same amount regardless of reading ability. By and large, teachers liked the approach and reported that students were excited and asked good questions. The inclusion of the stories and math activities helped teachers justify using more science materials. Our UDL science project was one of the first of its kind and provides a coherent, real-istic UDL design for computer-based science materials. Other designs are being developed at CAST and Education Development Cen-ter. We look forward to mining these efforts to produce a common set of UDL designs that can become a standard and universal part of all computer-based materials.
By Robert Tinker and Carolyn Staudt
Robert Tinker ([email protected]) is President Emeritus of the Concord Consortium. Carolyn Staudt ([email protected]) directs the UDL project.
14w w w . c o n c o r d . o r g • v o l . 1 4 • n o . 2 • F a l l 2 0 1 0
The primary UDL design features of our approach are the following:
Universal Design for Learning http://concord.org/udl SmartGraphs http://concord.org/smartgraphsCenter for Applied Special Technology http://www.cast.orgEducation Development Center http://www.edc.orgL I N K S
Probes, Models, and UDL in the Elementary Science Classroom
Multiple paths through each topic. Each unit has six activities from which teachers and students can select.
Formative feedback to teachers. Teachers can tell at all times where each student is within a unit, and what progress is being made.
Inquiry experiences that require minimal language skills. Each unit includes an inquiry of the real world enhanced with probeware and models.
Text-to-speech and electronic glossaries. The computer can voice any text, and new words are linked to an interactive glossary.
Imaginative stories based on each science topic. A fictional story based on real science content engages students.
Math activities in each science topic. The link between math and science is made in context, not as isolated topics.
Hints and graphing support. Five levels of hints provide students with increasing support on questions embedded in the unit. SmartGraphs provide feedback based on features of the graph.
Assessments designed for different cognitive strengths. Sketches and annotated snapshots of models and graphs provide alternative ways of demonstrating understanding.

Innovator Interview: Stephen Bannasch([email protected])
* The International Netcourse Teacher Enhancement Coalition (INTEC) was one of the first large-scale online teacher professional development courses in the country, offering courses to 800 math and science secondary teachers.
Universal Design for Learning http://concord.org/udl SmartGraphs http://concord.org/smartgraphsCenter for Applied Special Technology http://www.cast.orgEducation Development Center http://www.edc.org
w w w . c o n c o r d . o r g • v o l . 1 4 • n o . 2 • F a l l 2 0 1 0 15
Q. You co-founded the Concord Consortium. What are some things you did prior to that?
A. In 1982 I designed a datalogging system with a KIM-1 microcontroller to monitor the performance of an experimental passive solar home I had helped build. The analysis of these data was my thesis project in college and this work led very nicely into my work on probeware with Bob Tinker at TERC.
Q. What was an especially interesting project or moment in CC’s history?
A. In our early days, we held a retreat at a historic barn in Shelburne Farms, Vermont, where we came up with the idea for INTEC*, which was the forerunner of the Virtual High School.
Q. What do you see in the future of educational technology that excites you?
A. Cheaper and more powerful mini-tablet/iPad-like devices. These platforms will help make it possible for students to interact with powerful real-time abstractions in a visual interface (for example, sensor graphs, sensor fusion graphs, and sensor-model interactions) on a portable device. There are many compelling situations to explore in our extended physical environment, and connecting kids to the world around them is meaningful and motivating. Combining the two can produce a wonderful synergy.
Q. You often say that you hope our work will change the world. In what way do you hope the world changes as a result?
A. Many ways. I want more people to become creators and explorers sharing their discoveries. I want to develop ways of au-thentically assessing science inquiry, analysis, and communication skills, hopefully by extracting this information from portfolios of student work and their collaboration with other students. Unless we have ways of measuring how well we accomplish these goals in this environment of high-stakes assessment, the educational system will continue the current trends, which devalue these skills.
Q. What do you like to do outside of work?
A. Play with my kids. Go sea kayaking with friends. Play music every other Sunday night in the local bar. Go for walks with my dog. Play Frisbee. Go sailing as fast as I can on a Hobie Cat. I once got my hang glider to 13,000 feet. And I spent a week in Italy with a circus traveling by horse-drawn carriage.
Q. Can you describe the projects you’re currently working on?
A. I’m co-PI on the Engineering Energy Efficiency project. We want to find out how the use of simulations might encourage deeper and more effective student learning in solar house design. The project is different than many at CC because more of the student work is open-ended engineering rather than structured in-quiry. I’m also co-PI on the VISUAL project where we are working with researchers at the University of California, Berkeley to explore how visualizations — including those used in students’ narratives, argumentation, portfolios, and presentations — change and hopefully improve science learning. As Director of Technology, I also contribute to many projects, like CLEAR, which is also collaborating with Berkeley to investigate how science assessments can capture and contribute to cumulative, integrated learning in middle school. When we work together on problems like these, what we are doing can make a positive difference in the world.
Q. You referred to making a “positive difference in the world” again.
A. I really believe it!
Subscribe OnlineDo we have your email address? Subscribe to our regular email updates and make sure you stay in the know. When you subscribe on our website (www.concord.org), you can also choose to spare some trees and receive this @Concord publication via email.
Join Us at Our Open HouseJoin the Concord Consortium for an evening of discussion about the future of deeply digital curriculum on October 28, 2010, from 7:00 to 9:30 p.m.
A distinguished panel will include:
• Greg Gunn, Chief Scientist and Co-Founder, Wireless Generation
• Neeru Khosla, Co-Founder and Executive Director, CK-12 Foundation
• Joanna Lu, Senior Technical Project Manager, Pearson Education
• Deb Socia, Executive Director of OpenAirBoston and founder and former principal of the Lilla G. Frederick Pilot Middle School in Boston
Chad Dorsey, President of the Concord Consortium, will facilitate the conversation.
The evening will also include opportunities to meet and talk with Concord Consortium innovators and explore our latest interactive software. Learn more or RSVP at http://concord.org/openhouse.
The Concord Consortium Collection in NSDL
The Concord Consortium Collection will contribute hundreds of resources to the National STEM Education Distributed Learning (NSDL) program as part of a new project funded by the National Sci-ence Foundation. We will also contribute embedded assessment tools to give teachers and researchers a way to evaluate the im-pact of NSDL resources. We are pleased to add to the NSDL (nsdl.org), where you can already find a wealth of amazing resources,
including informal science resources at SMILE (howtosmile.org), activities for middle school math and science teachers (msteacher.org), biology activities at BioSciEdNet (www.biosciednet.org/portal), physics and astronomy resources at Compadre (www.compadre.org), and more.
Genetics Software Reach ExpandsThe Concord Consortium continues its collaboration with the Jackson Laboratory to teach secondary students cutting-edge genetics techniques and concepts. An extension of the GENIQUEST project, our new Genome Dynamics project is funded by the National Science Foundation. We will develop a model-based activity to extend the genetics of our computer dragons and drakes to microarray or metabolic network con-cepts. Learn more about the GENIQUEST project in the October 1 issue of NSTA’s The Science Teacher.
See You at NSTAChad Dorsey, President of the Concord Consortium, will be a featured speaker at the National Science Teachers Associa-tion National Conference March 2011 in San Francisco. Meet Chad, get free science activities, and learn more about the Concord Consortium’s work furthering STEM education. And be sure to see the Concord Consortium’s other staff presenta-tions throughout the conference. Coming out to California early for the Cyberlearn-ing Tools for STEM Education (CyTSE) Conference? We’ll see you there, too.
Realizing the promise of educational technology.
Editor: Chad Dorsey | Managing Editor: Cynthia McIntyre | Design: Jan Streitburger | www.concord.orgThe Concord Consortium | 25 Love Lane, Concord, MA 01742 | 978-405-3200 | fax: 978-405-2076@Concord is published two times a year by The Concord Consortium, a nonprofit educational research and development organization dedicated to educational innovation through creative technologies. Copyright © 2010 by The Concord Consortium, Inc. All rights reserved. Noncommercial reproduction is encouraged, provided permission is obtained and credit is given. For permission to reproduce any part of this publication, contact [email protected]. This material is based upon work supported by the National Science Foundation under several grants (DRL-0822213, ESI-0628242, DRL-0733299, DUE-0802532, DRL-0918449, DRL-0946582, DUE-1044263, DRL-0918743, DRL-0822388) and by the National Institutes of Health (3P50GMO76468-04S1). Any opinions, findings, and conclusions or recommendations expressed in this material are those of the author(s) and do not necessarily reflect the views of the National Science Foundation or any other funding agency.
25 Love Lane, Concord, MA 01742
Visit Our New WebsitePlease visit our updated website at http://concord.org to find:
• FreeactivitiesforscienceandmathinournewActivityFinder,
• Researchaboutlearningwithprobesandmodels,and
• Freesourcecodeforourprojects,soyoucanfollowdevelopmentorcontributecode.
Youcanalso
• Findexpanded@Concordarticles,
• Readandcommentonour blogs,and
• Learnmoreaboutallourwork.
NEWS FROM THE
CONCORD CONSORTIUM