Embed Size (px)
Citation preview
2
September 21, 2021
Concessions Webinar: Beginning a New Year

3
Go To Webinar Housekeeping
Open and close your control panel
Join audio (attendees will be in listen
only mode):
• Choose Computer Audio to useVoIP
• Choose Phone Call and dial
using the information provided
Submit questions via the Questionspanel during the presentation.
Note: Today’s presentation is being
recorded and will be provided.
Your Participation

4
There will be a short survey at the end of this webinar

5
Zenola Campbell
Vice President, Concessions
Welcome
6
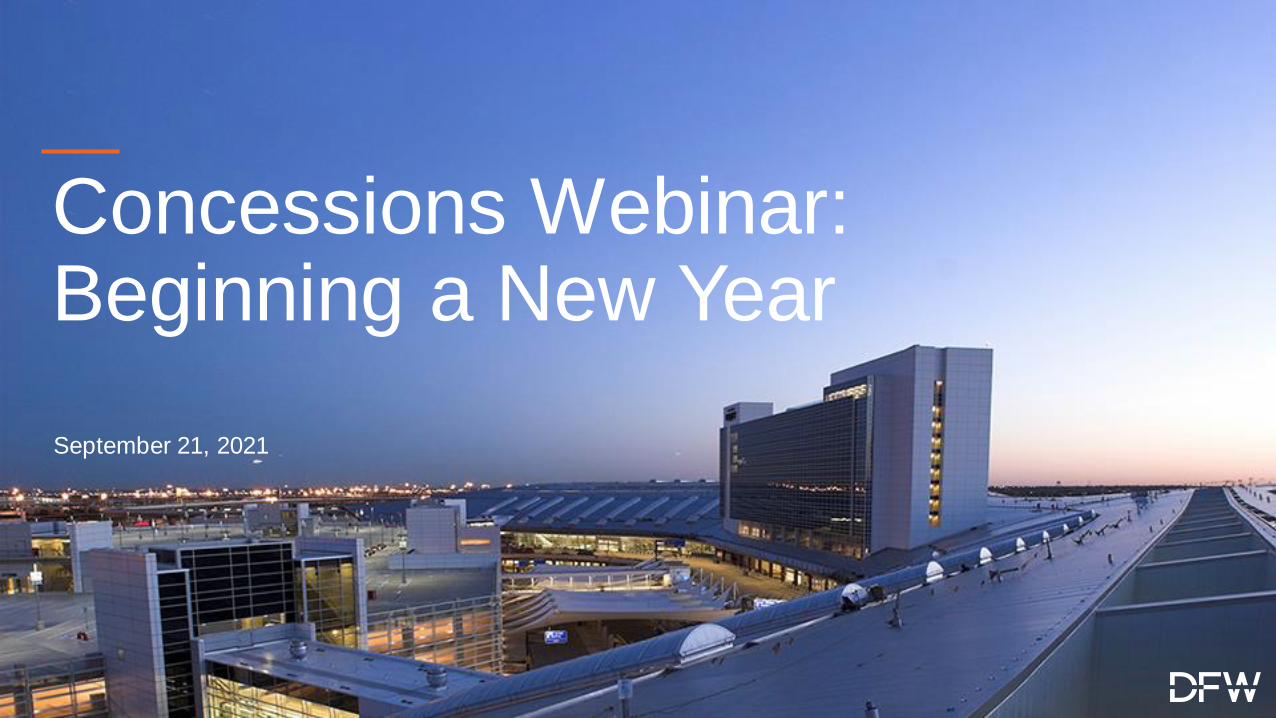
Board Relief & ARPA Zenola Campbell
Certification Update
Covid-19 Update Dustin Jaynes
Federal Regulations Dee Amos
Air Services Update Milton De La Paz
BDD Update Tamela Lee
Performance Update Kevin Lemmons
CTA Expansion Program Update Mohamed Charkas
GRAB / GBAC Update Cristen Mosley
Recruitment and Marketing Dee Amos
Staffing & Operations Strategies Michael Morford
Outstanding Customer Service Zenola Campbell
Shining Stars Zenola Campbell
Closing Ken Buchanan
Agenda

7
Zenola Campbell
Vice President, Concessions
Board Relief and ARPA Certification Update
8
• All rent waivers end September 30, 2021
• Temporary Closures
• Opportunity to give back leases without penalty
• ARPA funds at risk if upon receipt by the Board locations not operational
• Locations closed or sold prior are not eligible
for ARPA funding
End of Waivers
September 30, 2021
9
COVID-19 Updates
Capt. Dustin Jaynes
Epidemiologist
Designated Infection Control Officer, DFW Department of Safety

10
• National, State and Local
Situation
• Vaccine Overview
Agenda
11
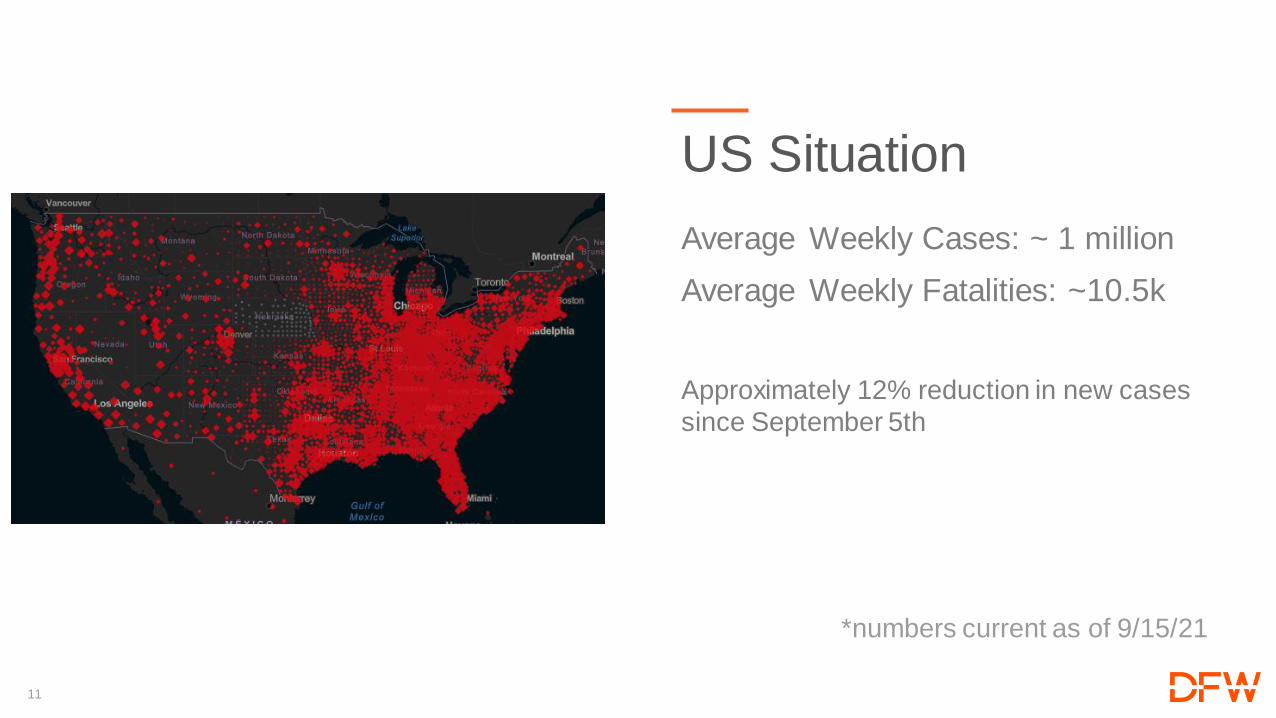
Average Weekly Cases: ~ 1 million
Average Weekly Fatalities: ~10.5k
Approximately 12% reduction in new cases
since September 5th
US Situation
*numbers current as of 9/15/21
12
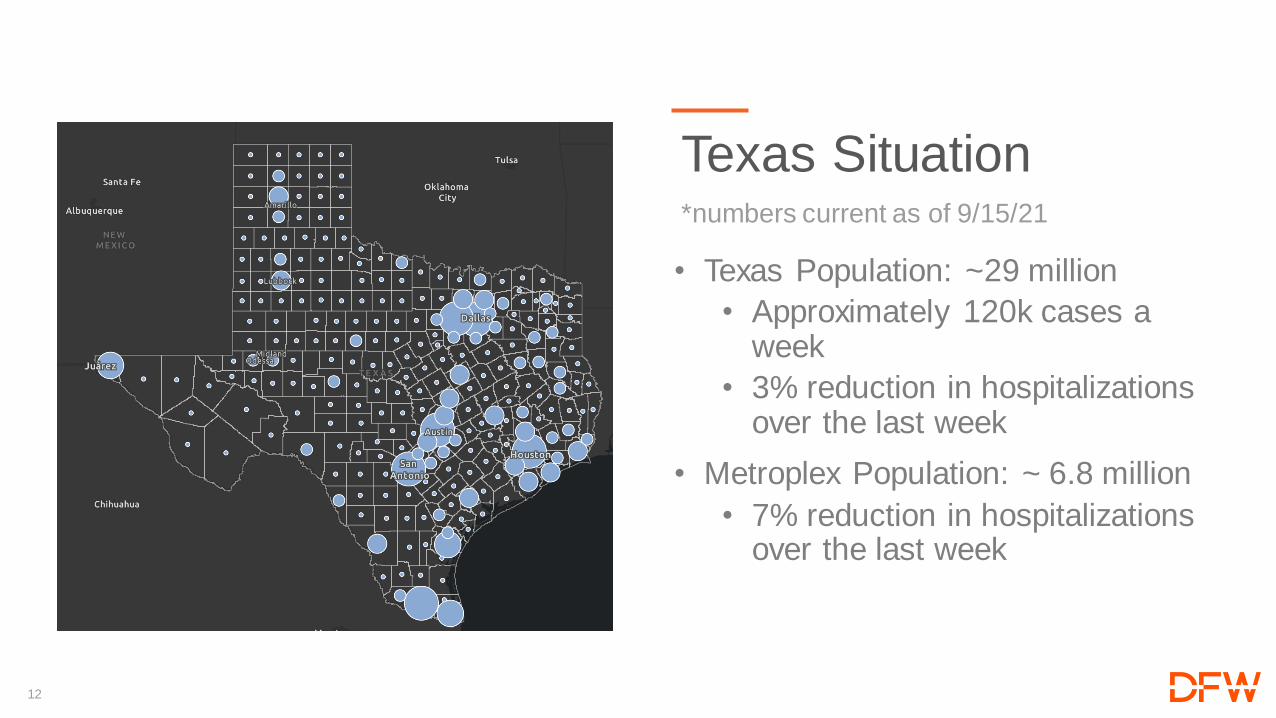
• Texas Population: ~29 million
• Approximately 120k cases a week
• 3% reduction in hospitalizations over the last week
• Metroplex Population: ~ 6.8 million
• 7% reduction in hospitalizations over the last week
Texas Situation*numbers current as of 9/15/21
13
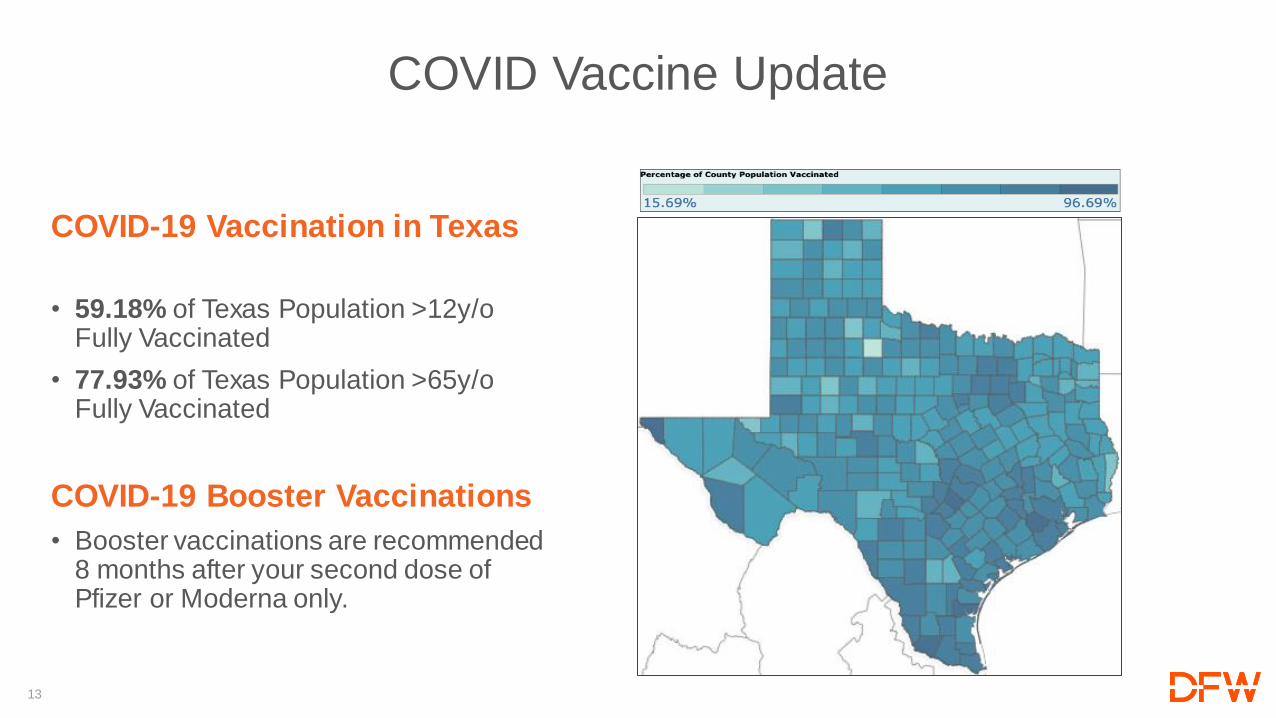
COVID-19 Vaccination in Texas
• 59.18% of Texas Population >12y/o Fully Vaccinated
• 77.93% of Texas Population >65y/o Fully Vaccinated
COVID-19 Booster Vaccinations
• Booster vaccinations are recommended 8 months after your second dose of Pfizer or Moderna only.
COVID Vaccine Update

Dee Amos
Vice President, Corporate Communications and Marketing
Federal Regulations
15
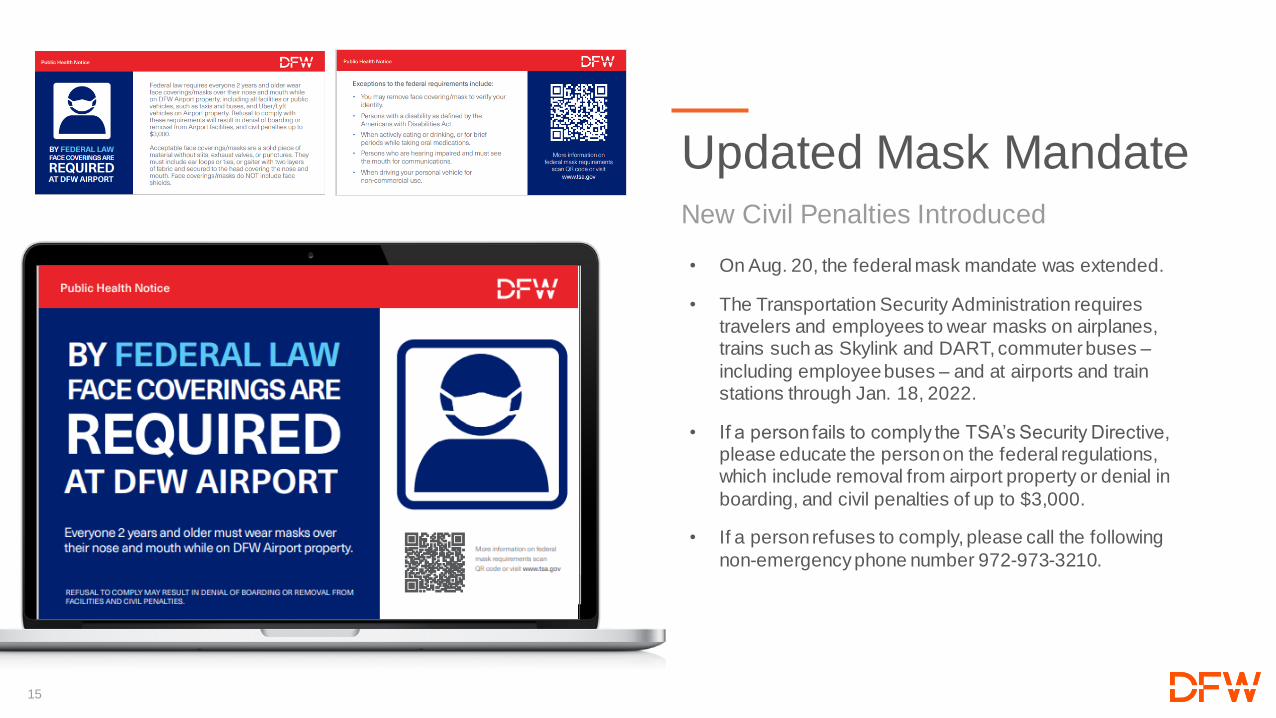
Updated Mask MandateNew Civil Penalties Introduced
• On Aug. 20, the federal mask mandate was extended.
• The Transportation Security Administration requires travelers and employees to wear masks on airplanes, trains such as Skylink and DART, commuter buses –
including employee buses – and at airports and train stations through Jan. 18, 2022.
• If a person fails to comply the TSA’s Security Directive, please educate the person on the federal regulations, which include removal from airport property or denial in
boarding, and civil penalties of up to $3,000.
• If a person refuses to comply, please call the following
non-emergency phone number 972-973-3210.
16
Milton De La Paz
Vice President, Airline Relations
Air Services Update
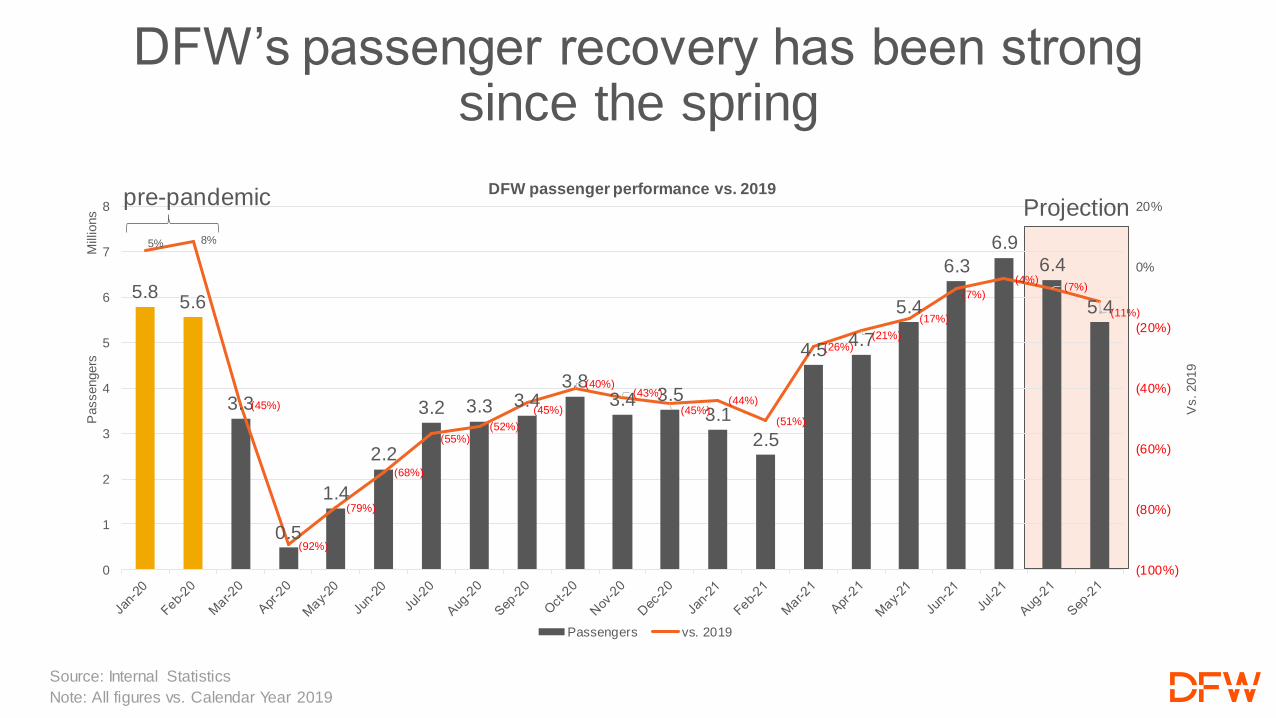
DFW’s passenger recovery has been strong since the spring
Source: Internal Statistics
Note: All figures vs. Calendar Year 2019
5.85.6
3.3
0.5
1.4
2.2
3.2 3.3 3.43.8
3.4 3.53.1
2.5
4.54.7
5.4
6.3
6.9
6.4
5.4
5% 8%
(45%)
(92%)
(79%)
(68%)
(55%)(52%)
(45%)
(40%)(43%)
(45%)(44%)
(51%)
(26%)(21%)
(17%)
(7%)
(4%)(7%)
(11%)
(100%)
(80%)
(60%)
(40%)
(20%)
0%
20%
0
1
2
3
4
5
6
7
8
Vs. 2019
Passengers
Mill
ions
DFW passenger performance vs. 2019
Passengers vs. 2019
pre-pandemic Projection
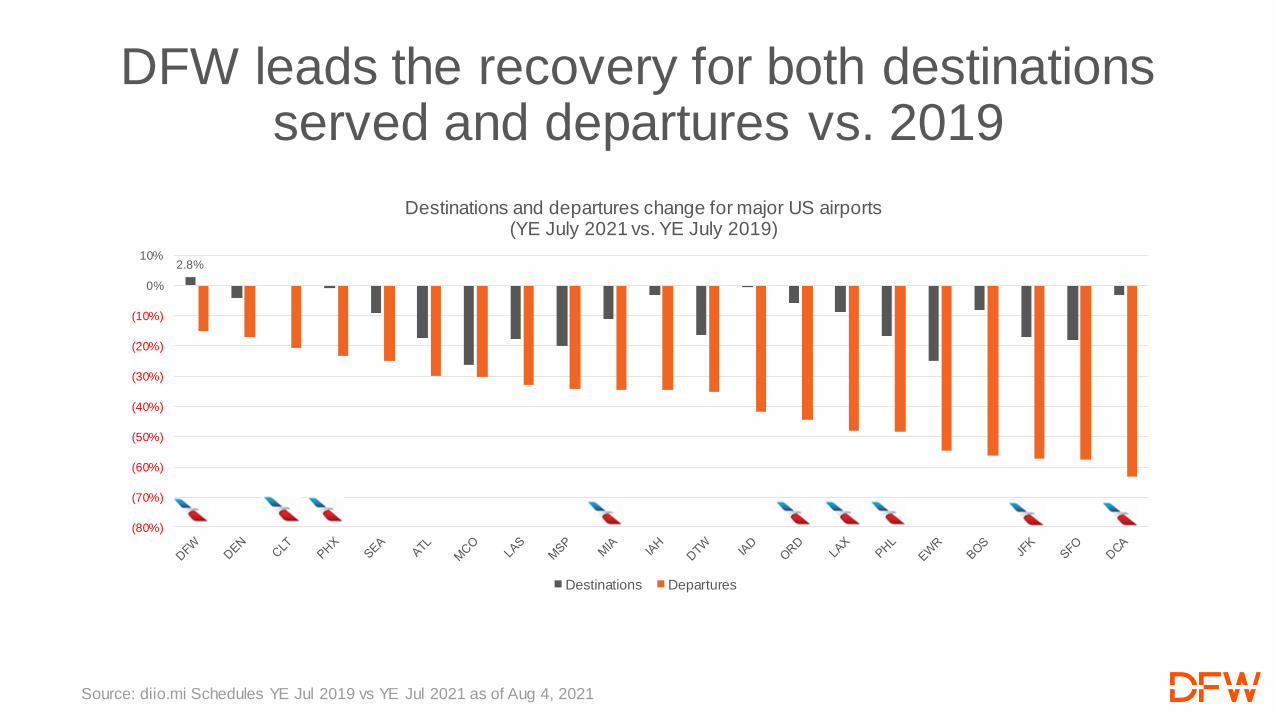
DFW leads the recovery for both destinations served and departures vs. 2019
Source: diio.mi Schedules YE Jul 2019 vs YE Jul 2021 as of Aug 4, 2021
2.8%
(80%)
(70%)
(60%)
(50%)
(40%)
(30%)
(20%)
(10%)
0%
10%
Destinations and departures change for major US airports(YE July 2021 vs. YE July 2019)
Destinations Departures
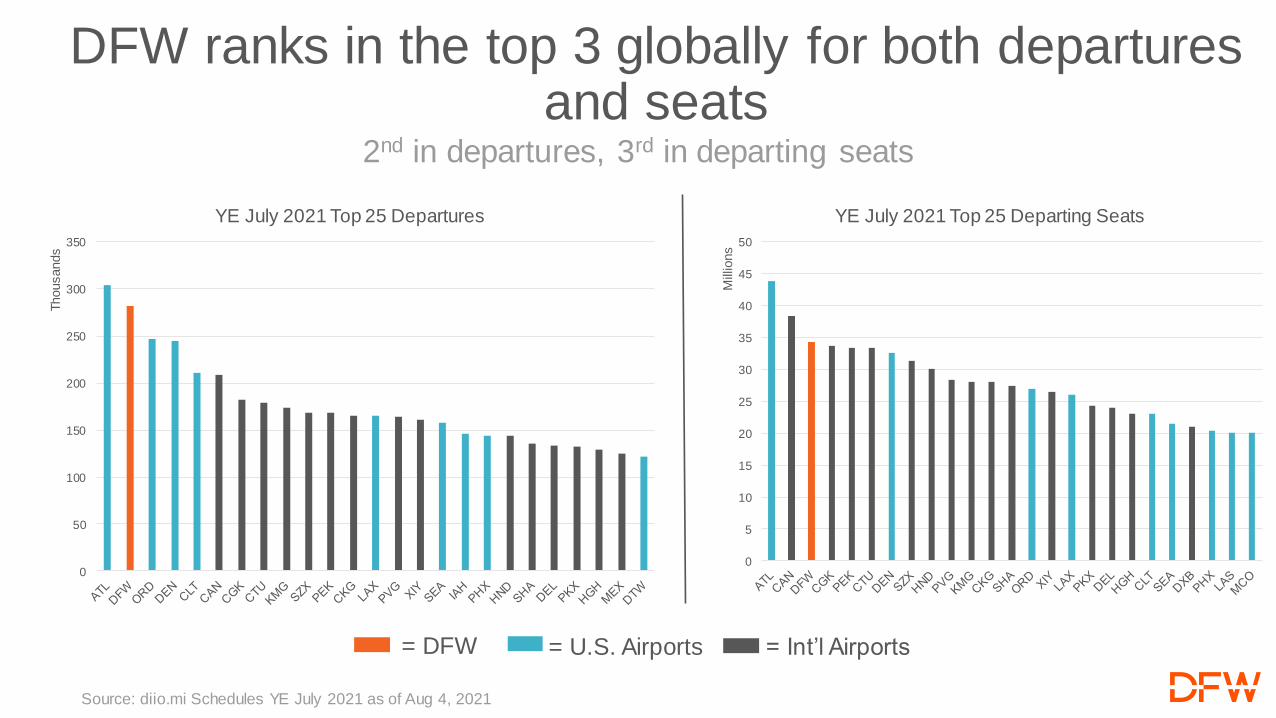
DFW ranks in the top 3 globally for both departures and seats
2nd in departures, 3rd in departing seats
Source: diio.mi Schedules YE July 2021 as of Aug 4, 2021
0
50
100
150
200
250
300
350
Thousands
YE July 2021 Top 25 Departures
0
5
10
15
20
25
30
35
40
45
50
Mill
ions
YE July 2021 Top 25 Departing Seats
= DFW = U.S. Airports = Int’l Airports

Domestic leisure traffic is projected to continue to drive the recovery
Source: Internal Statistics
All figures vs. Fiscal Year 2019
116%
117%
48%
73%69%
79%
41%
51%
0%
20%
40%
60%
80%
100%
120%
140%
Pax recovery projections by segment (FY21/22)(% of 2019 levels)
Dom lei Dom biz Intl lei Intl biz
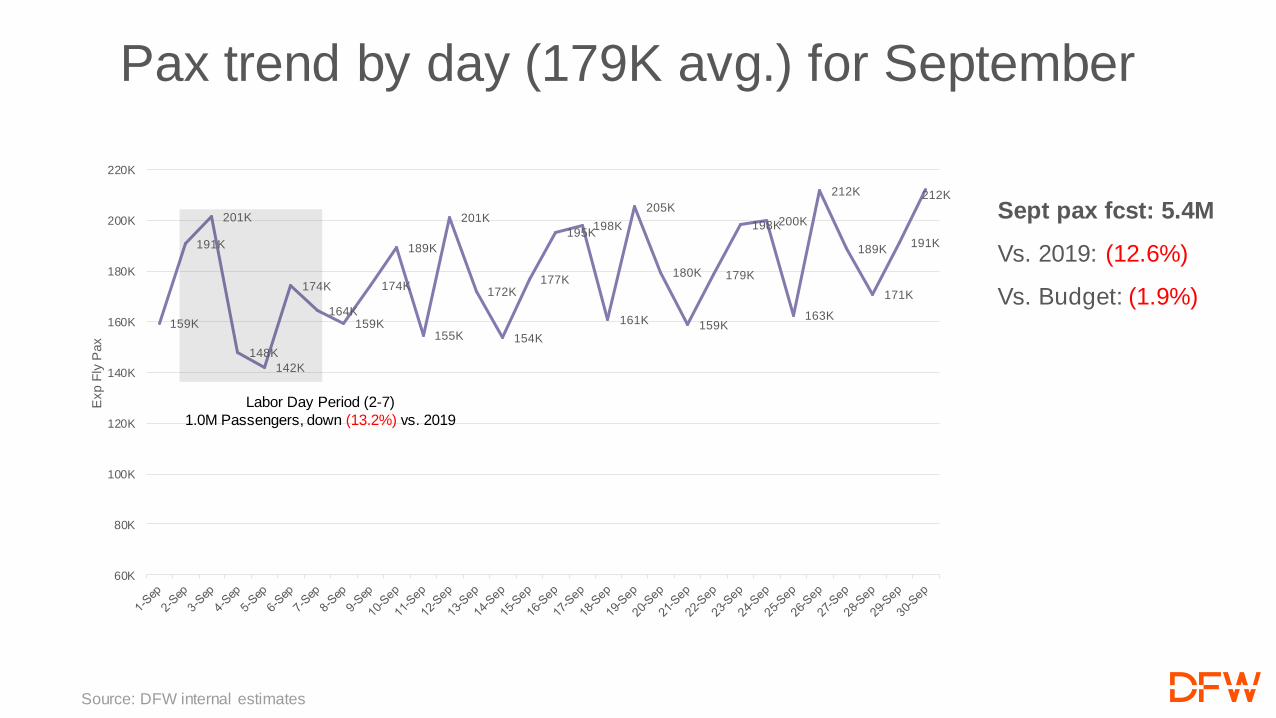
Pax trend by day (179K avg.) for September
Source: DFW internal estimates
Sept pax fcst: 5.4M
Vs. 2019: (12.6%)
Vs. Budget: (1.9%)159K
191K
201K
148K
142K
174K
164K159K
174K
189K
155K
201K
172K
154K
177K
195K198K
161K
205K
180K
159K
179K
198K200K
163K
212K
189K
171K
191K
212K
60K
80K
100K
120K
140K
160K
180K
200K
220K
Exp F
ly P
ax
Labor Day Period (2-7)
1.0M Passengers, down (13.2%) vs. 2019
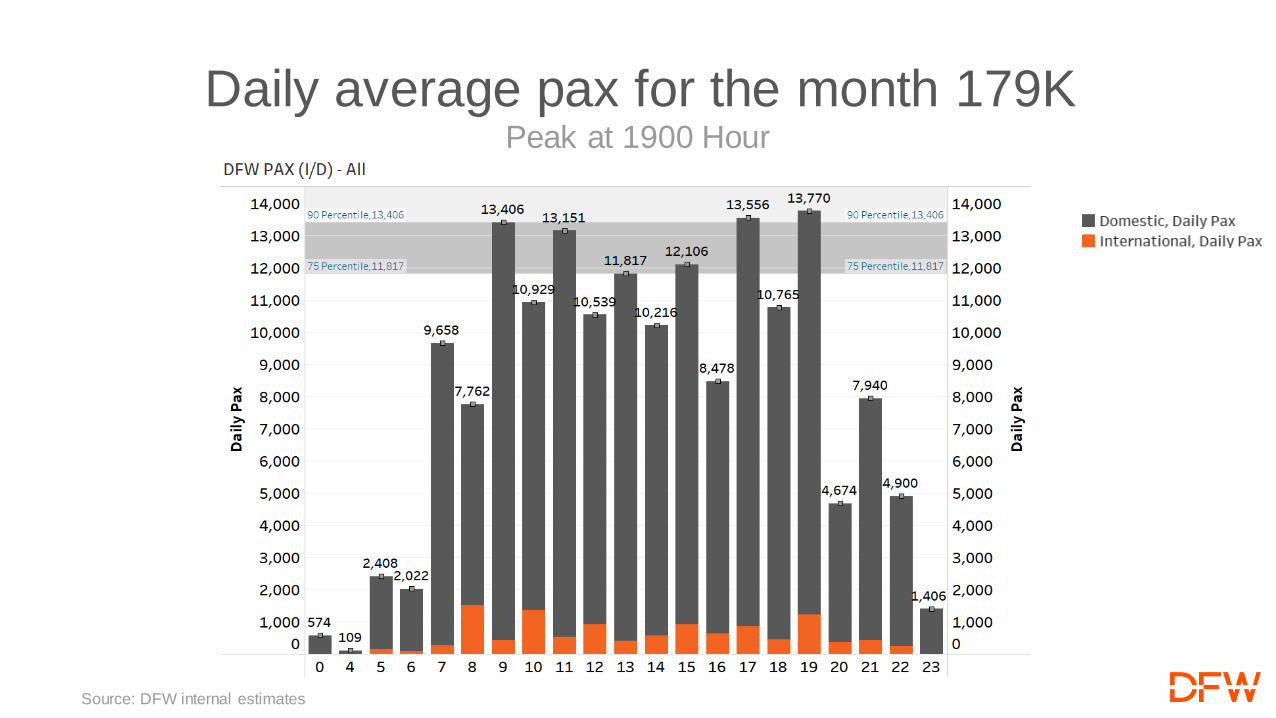
Peak at 1900 Hour
Source: DFW internal estimates
Daily average pax for the month 179K
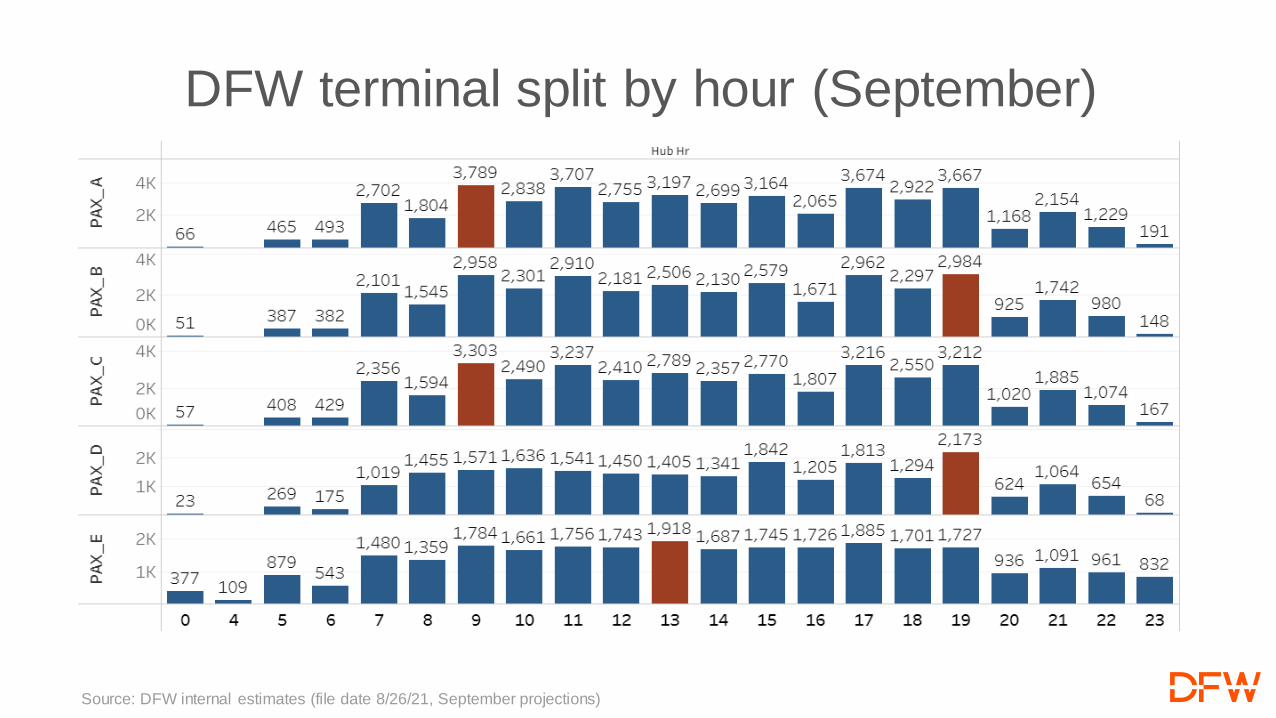
Source: DFW internal estimates (file date 8/26/21, September projections)
DFW terminal split by hour (September)
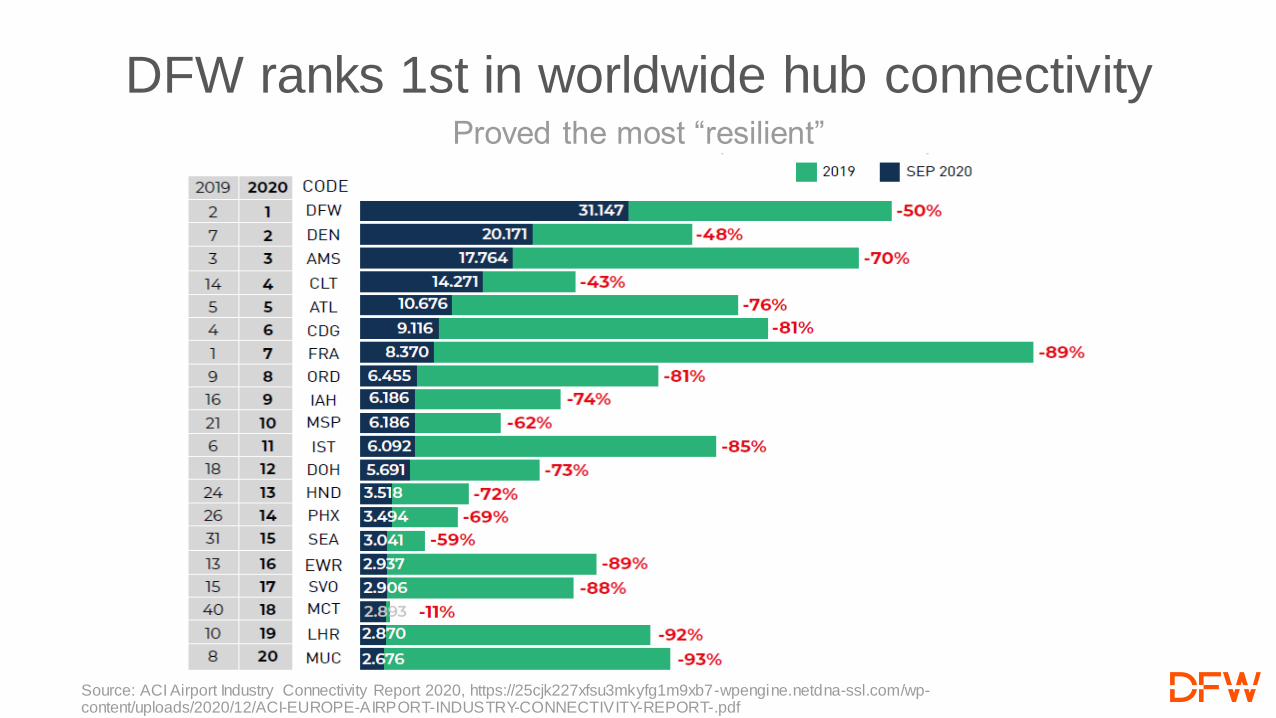
DFW ranks 1st in worldwide hub connectivityProved the most “resilient”
Source: ACI Airport Industry Connectivity Report 2020, https://25cjk227xfsu3mkyfg1m9xb7-wpengine.netdna-ssl.com/wp-content/uploads/2020/12/ACI-EUROPE-AIRPORT-INDUSTRY-CONNECTIVITY-REPORT-.pdf
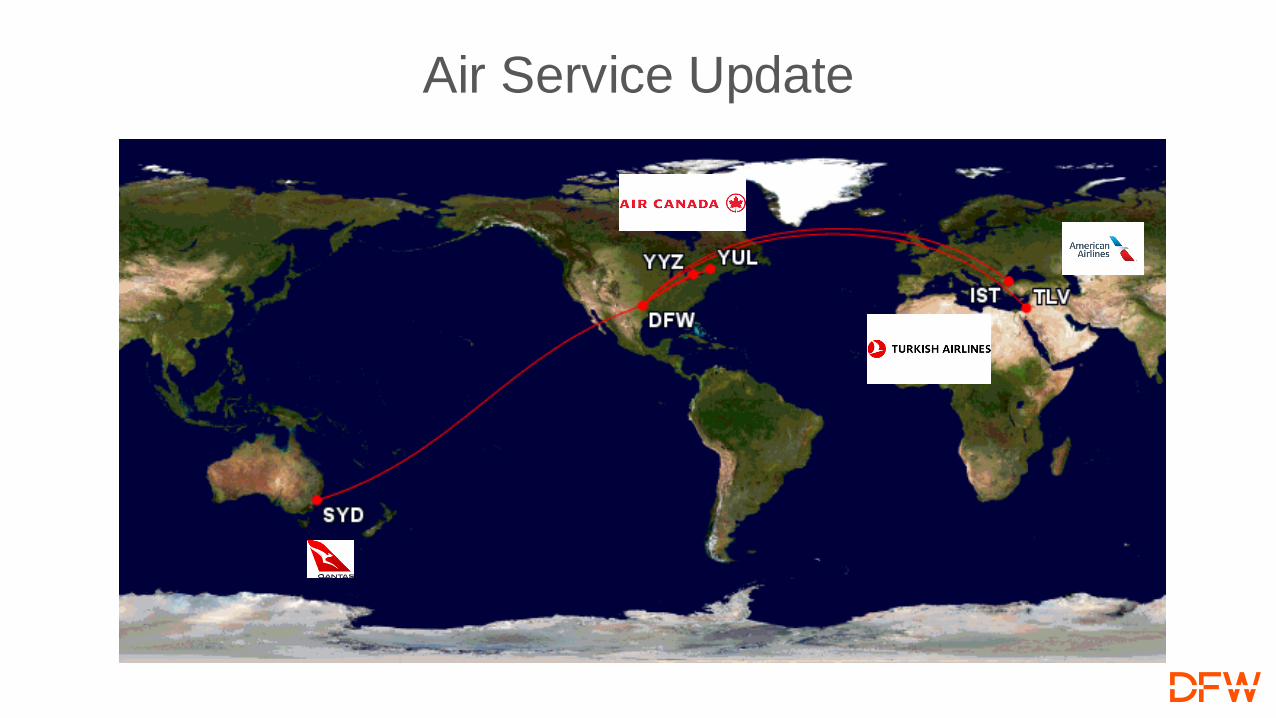
Air Service Update
26
Tamela Lee
Vice President, Business Development and Diversity
BDD Update

Title VI Awareness TrainingUpdate as of 8/15/21
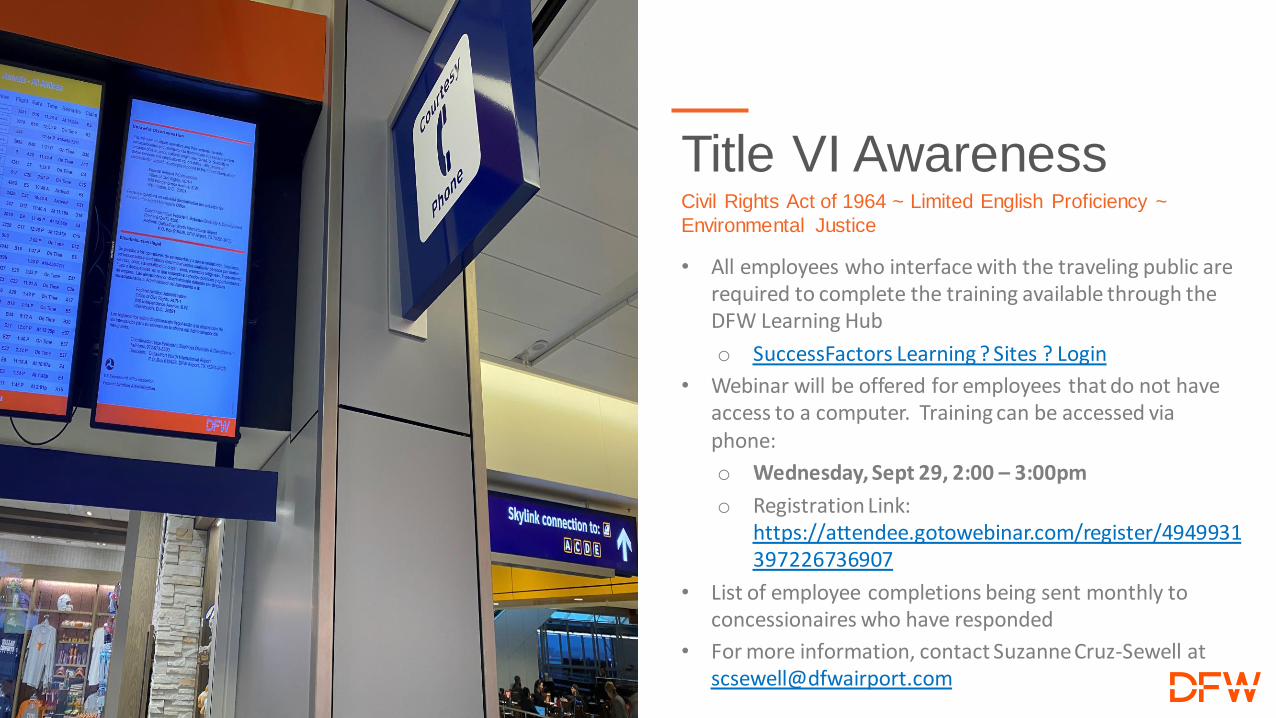
Civil Rights Act of 1964 ~ Limited English Proficiency ~
Environmental Justice
• All employees who interface with the traveling public are required to complete the training available through the DFW Learning Hub
o SuccessFactors Learning ? Sites ? Login
• Webinar will be offered for employees that do not have access to a computer. Training can be accessed via phone:
o Wednesday, Sept 29, 2:00 – 3:00pm
o Registration Link: https://attendee.gotowebinar.com/register/4949931397226736907
• List of employee completions being sent monthly to concessionaires who have responded
• For more information, contact Suzanne Cruz-Sewell at [email protected]
Title VI Awareness
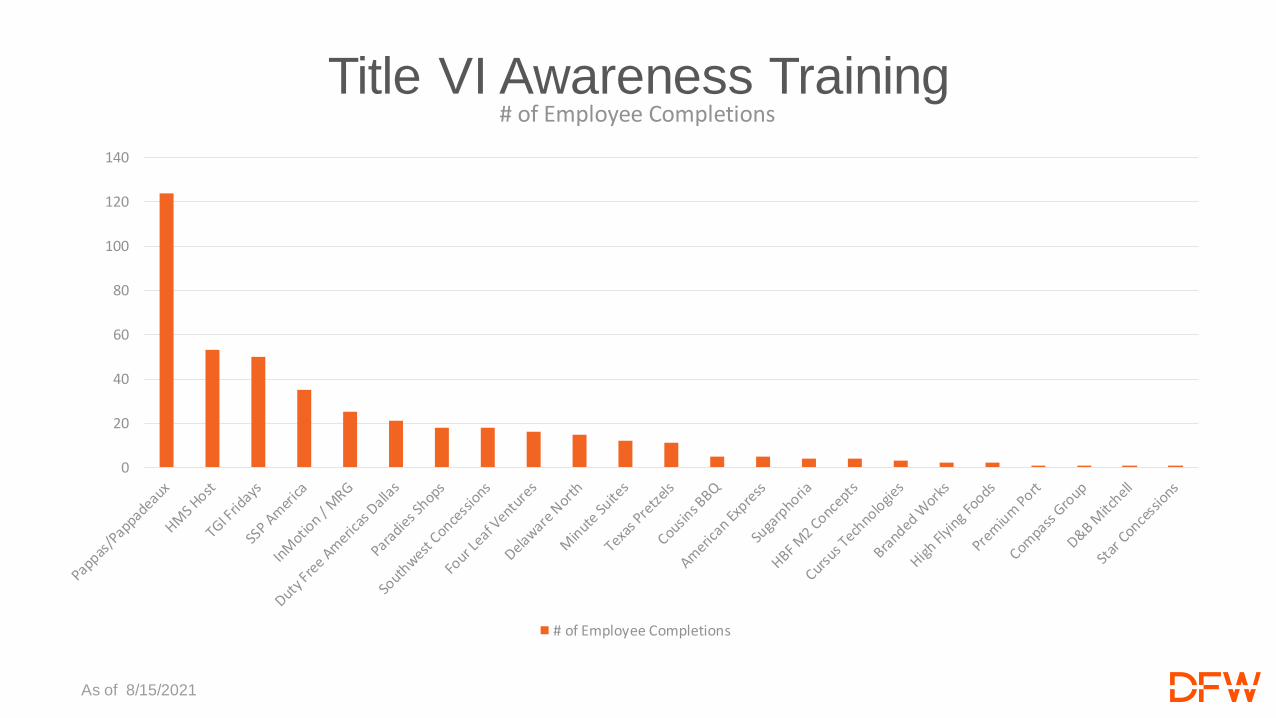
Title VI Awareness Training
As of 8/15/2021
0
20
40
60
80
100
120
140
# of Employee Completions
# of Employee Completions

30
Kevin Lemmons
Assistant Vice President, Concessions
Performance Update
31
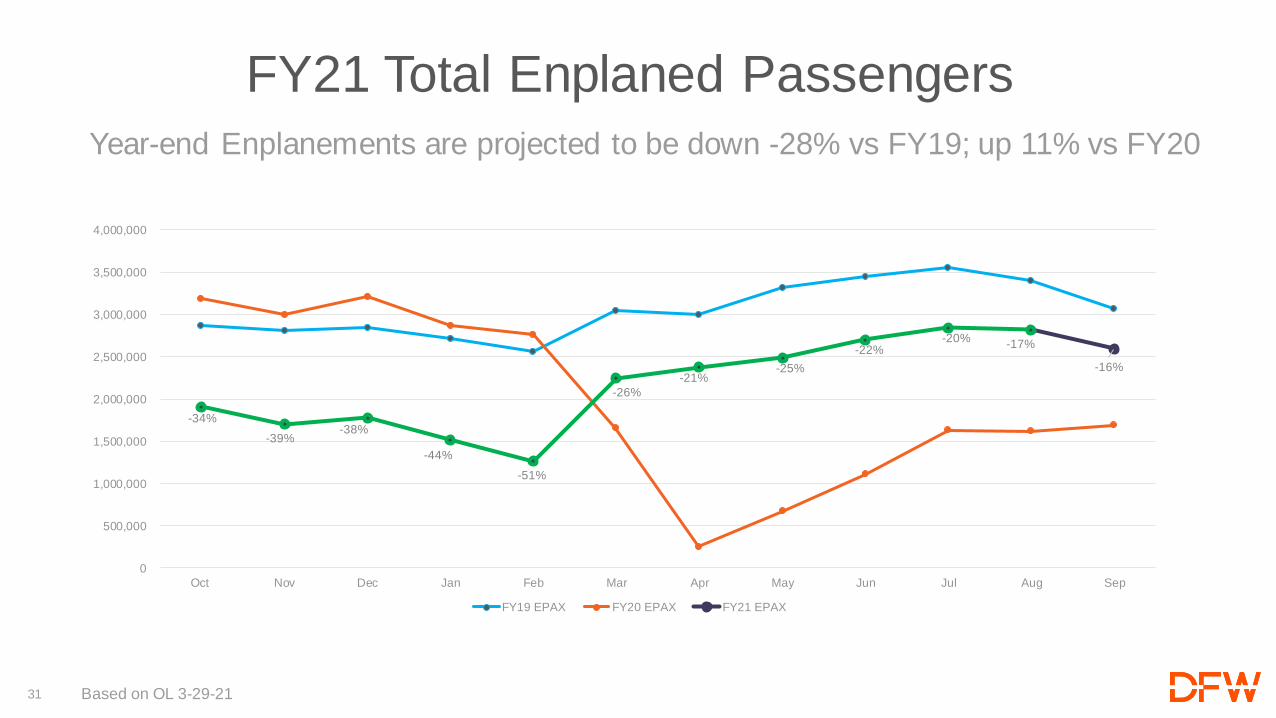
FY21 Total Enplaned Passengers
Year-end Enplanements are projected to be down -28% vs FY19; up 11% vs FY20
Based on OL 3-29-21
-34%
-39%-38%
-44%
-51%
-26%
-21%-25%
-22%-20%
-17%
-16%
0
500,000
1,000,000
1,500,000
2,000,000
2,500,000
3,000,000
3,500,000
4,000,000
Oct Nov Dec Jan Feb Mar Apr May Jun Jul Aug Sep
FY19 EPAX FY20 EPAX FY21 EPAX
32
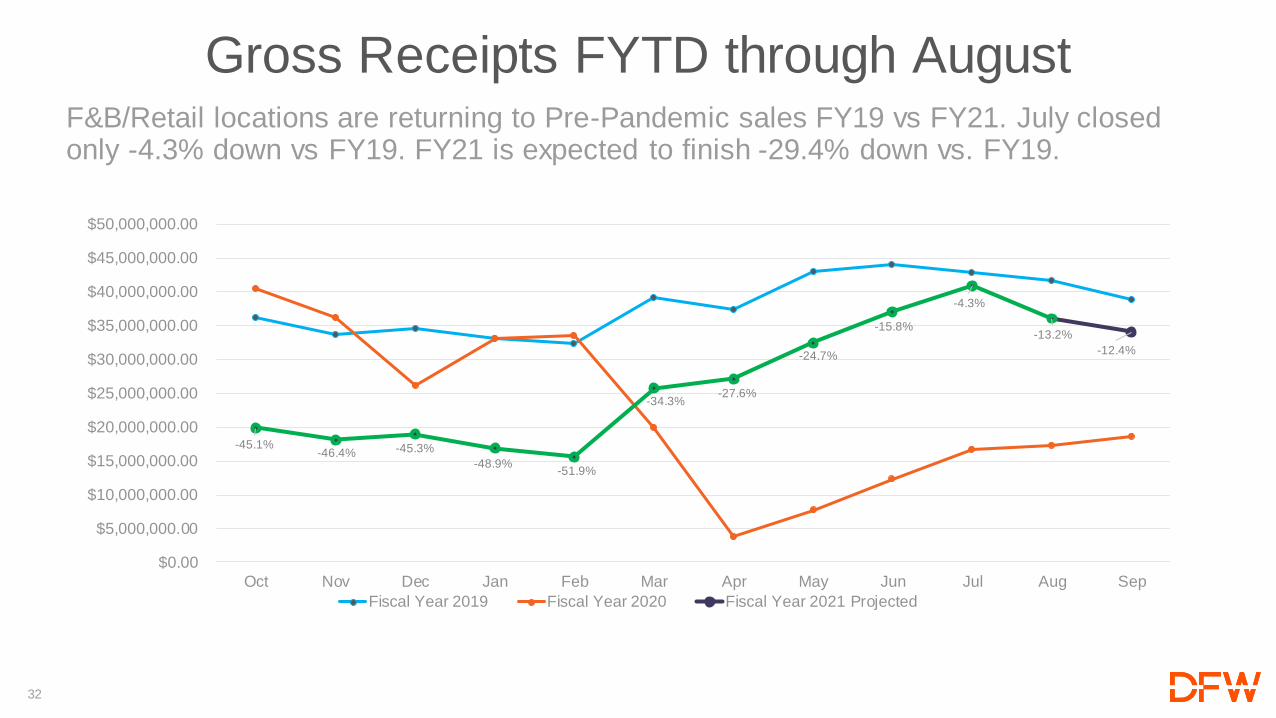
F&B/Retail locations are returning to Pre-Pandemic sales FY19 vs FY21. July closed only -4.3% down vs FY19. FY21 is expected to finish -29.4% down vs. FY19.
Gross Receipts FYTD through August
-45.1%-46.4% -45.3%
-48.9%-51.9%
-34.3%-27.6%
-24.7%
-15.8%
-4.3%
-13.2%
-12.4%
$0.00
$5,000,000.00
$10,000,000.00
$15,000,000.00
$20,000,000.00
$25,000,000.00
$30,000,000.00
$35,000,000.00
$40,000,000.00
$45,000,000.00
$50,000,000.00
Oct Nov Dec Jan Feb Mar Apr May Jun Jul Aug Sep
Fiscal Year 2019 Fiscal Year 2020 Fiscal Year 2021 Projected
33
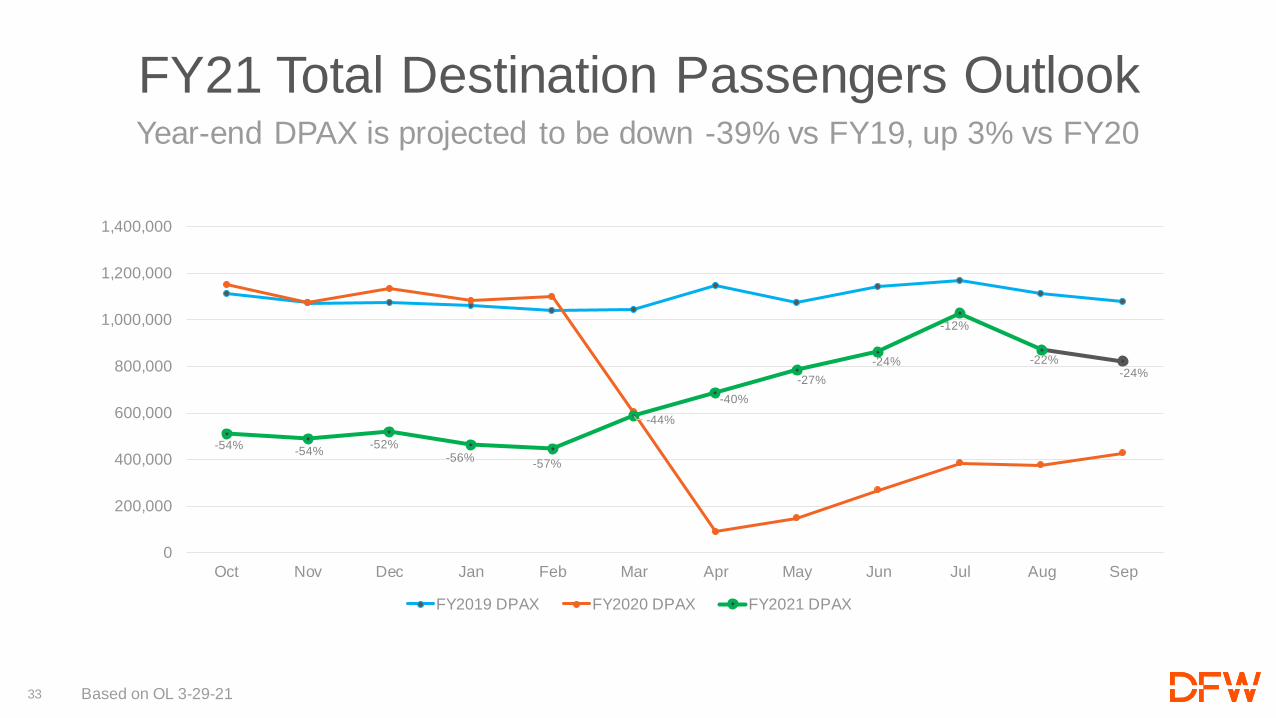
FY21 Total Destination Passengers Outlook Year-end DPAX is projected to be down -39% vs FY19, up 3% vs FY20
Based on OL 3-29-21
-54%-54%
-52%-56%
-57%
-44%
-40%
-27%
-24%
-12%
-22%-24%
0
200,000
400,000
600,000
800,000
1,000,000
1,200,000
1,400,000
Oct Nov Dec Jan Feb Mar Apr May Jun Jul Aug Sep
FY2019 DPAX FY2020 DPAX FY2021 DPAX
34
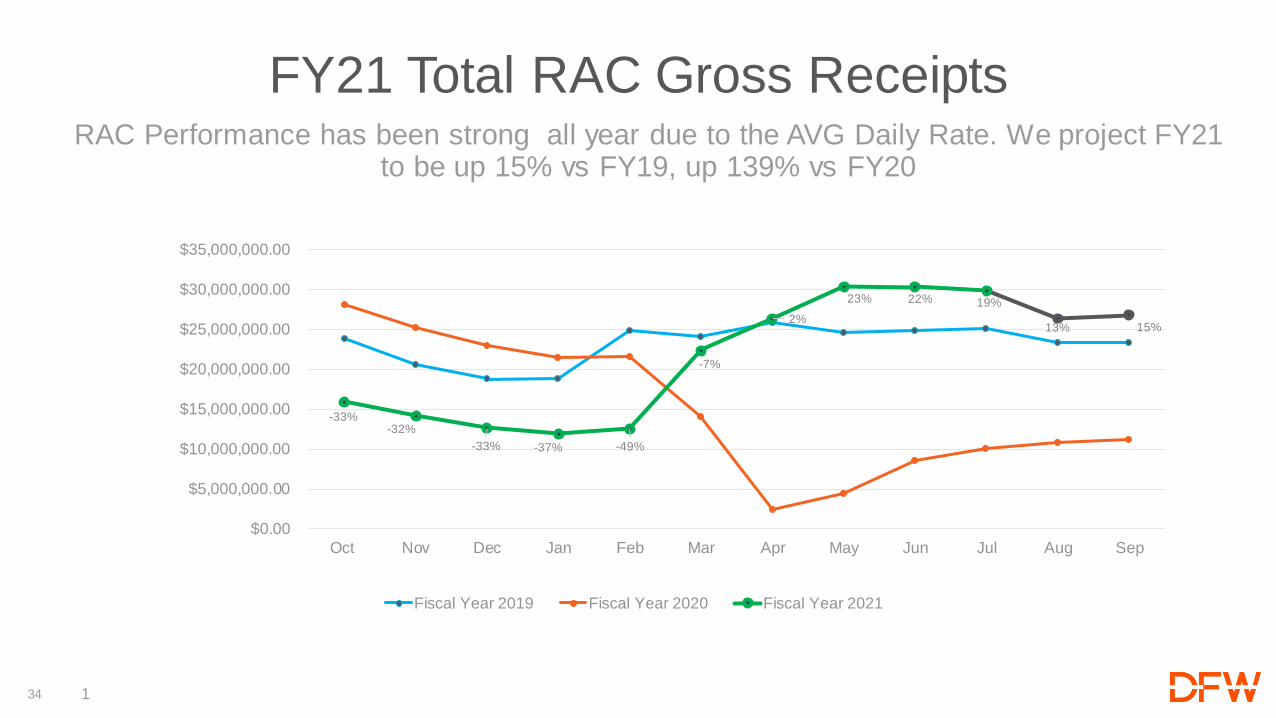
FY21 Total RAC Gross Receipts RAC Performance has been strong all year due to the AVG Daily Rate. We project FY21
to be up 15% vs FY19, up 139% vs FY20
1
-33%-32%
-33% -37% -49%
-7%
2%
23% 22% 19%
13% 15%
$0.00
$5,000,000.00
$10,000,000.00
$15,000,000.00
$20,000,000.00
$25,000,000.00
$30,000,000.00
$35,000,000.00
Oct Nov Dec Jan Feb Mar Apr May Jun Jul Aug Sep
Fiscal Year 2019 Fiscal Year 2020 Fiscal Year 2021
35
Mohamed Charkas
Senior Vice President, Infrastructure and Development Division
CTA Expansion Program Update

36
Previously renovated Terminals A, B, and E
Terminal C systems are beyond service life
Transform 1970s terminal to 2030 modern terminal expectations and operations
Opportunity to enhance Customer Experience and Concession offerings
Central location to Terminal complex provides
more efficient operations, connection times
To provide DFW and AA opportunity for growth
in the near term.
Terminal C Purpose & Need

37
Terminal A/C PiersDe-Risking Strategy Utilidor & Phasing
38
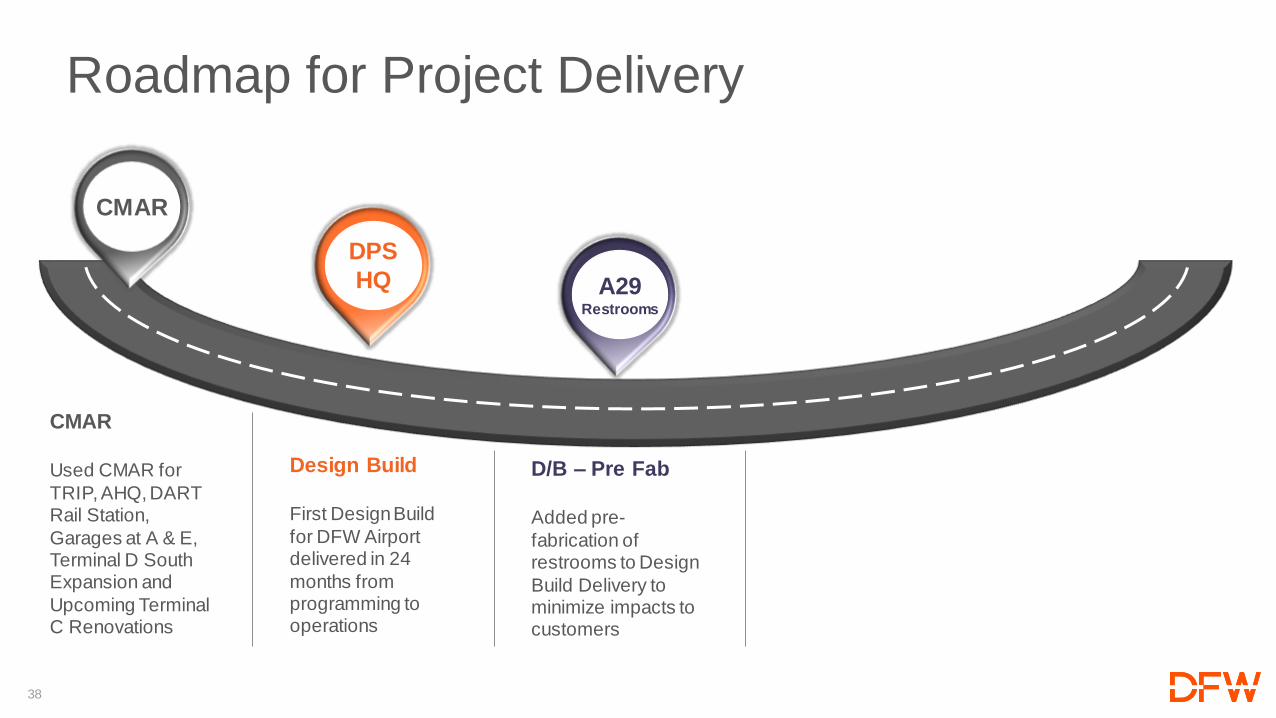
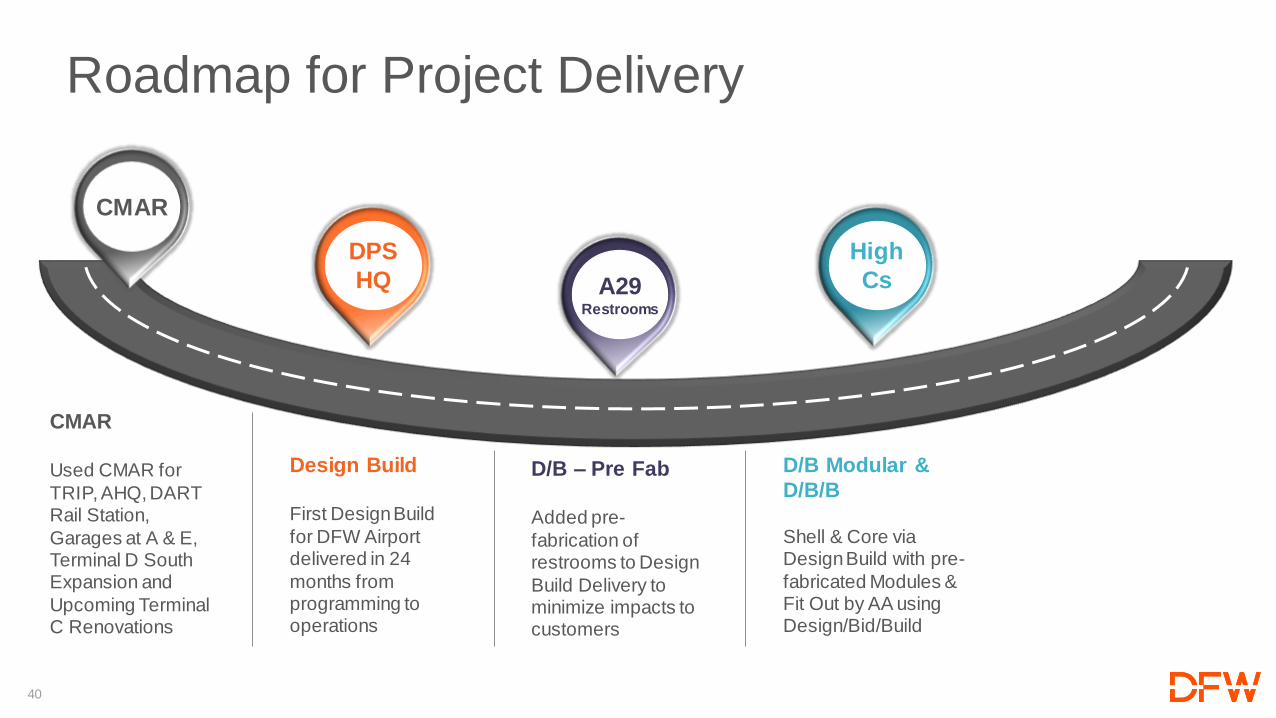
Roadmap for Project Delivery
CMAR
DPS
HQ A29Restrooms
Design Build
First Design Build
for DFW Airport delivered in 24
months from programming to operations
CMAR
Used CMAR for
TRIP, AHQ, DART Rail Station,
Garages at A & E, Terminal D South Expansion and
Upcoming Terminal C Renovations
D/B – Pre Fab
Added pre-
fabrication of restrooms to Design
Build Delivery to minimize impacts to customers
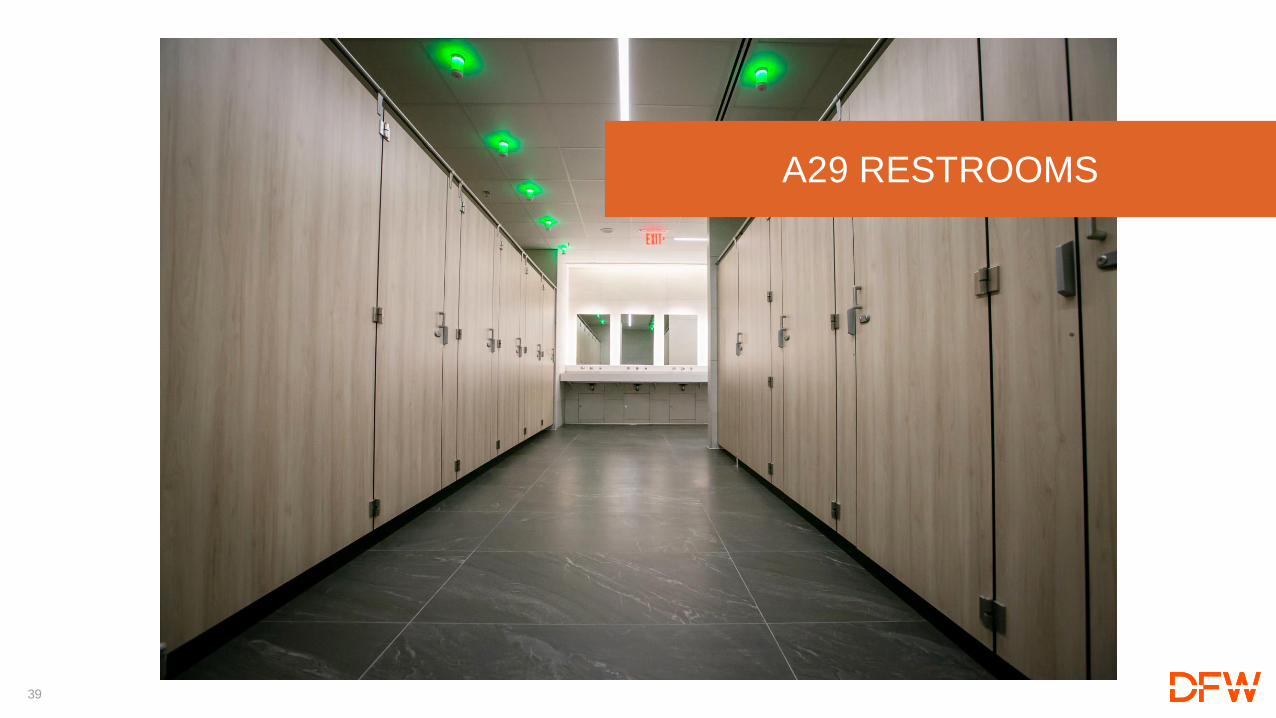
39
A29 RESTROOMS
40
Roadmap for Project Delivery
CMAR
DPS
HQ A29Restrooms
High
Cs
Design Build
First Design Build
for DFW Airport delivered in 24
months from programming to operations
CMAR
Used CMAR for
TRIP, AHQ, DART Rail Station,
Garages at A & E, Terminal D South Expansion and
Upcoming Terminal C Renovations
D/B – Pre Fab
Added pre-
fabrication of restrooms to Design
Build Delivery to minimize impacts to customers
D/B Modular &
D/B/B
Shell & Core via Design Build with pre-
fabricated Modules & Fit Out by AA using Design/Bid/Build
41
42
43
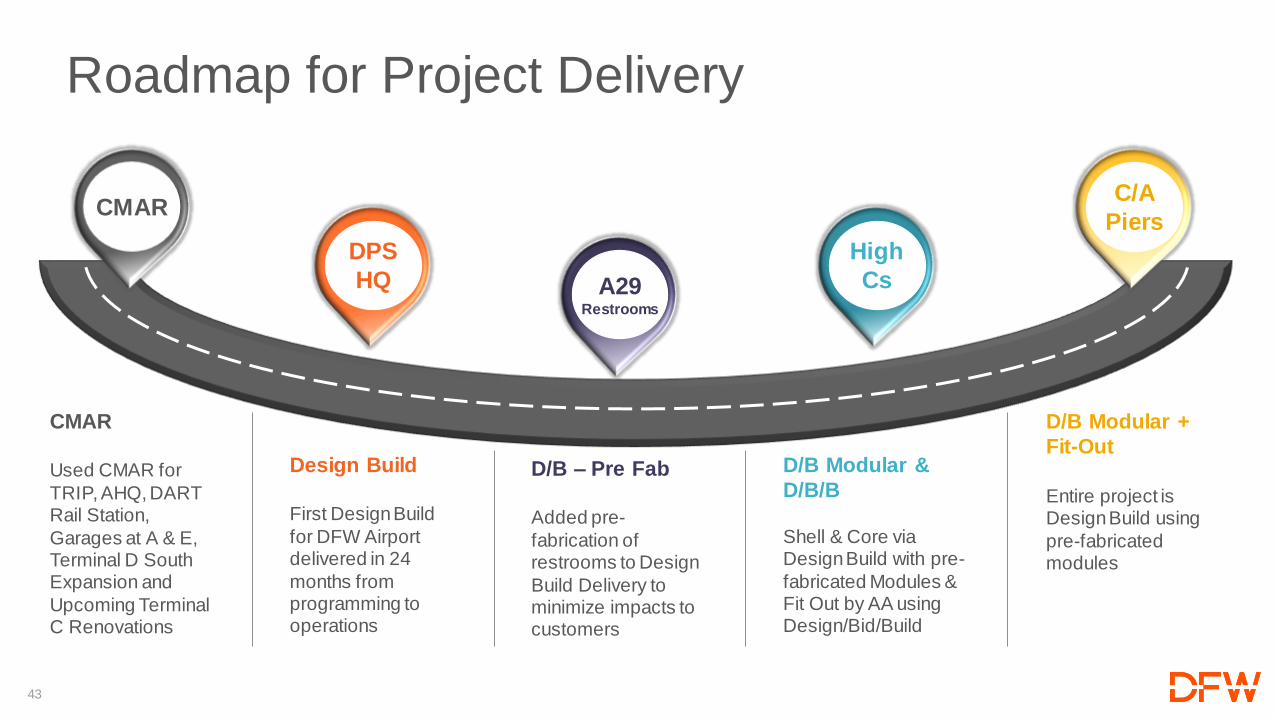
Roadmap for Project Delivery
CMAR
DPS
HQ A29Restrooms
High
Cs
C/A
Piers
Design Build
First Design Build
for DFW Airport delivered in 24
months from programming to operations
CMAR
Used CMAR for
TRIP, AHQ, DART Rail Station,
Garages at A & E, Terminal D South Expansion and
Upcoming Terminal C Renovations
D/B – Pre Fab
Added pre-
fabrication of restrooms to Design
Build Delivery to minimize impacts to customers
D/B Modular &
D/B/B
Shell & Core via Design Build with pre-
fabricated Modules & Fit Out by AA using Design/Bid/Build
D/B Modular +
Fit-Out
Entire project is Design Build using
pre-fabricated modules

44
CTA EXPANSION DESIGN BUILD – TERMINAL C PIER
45
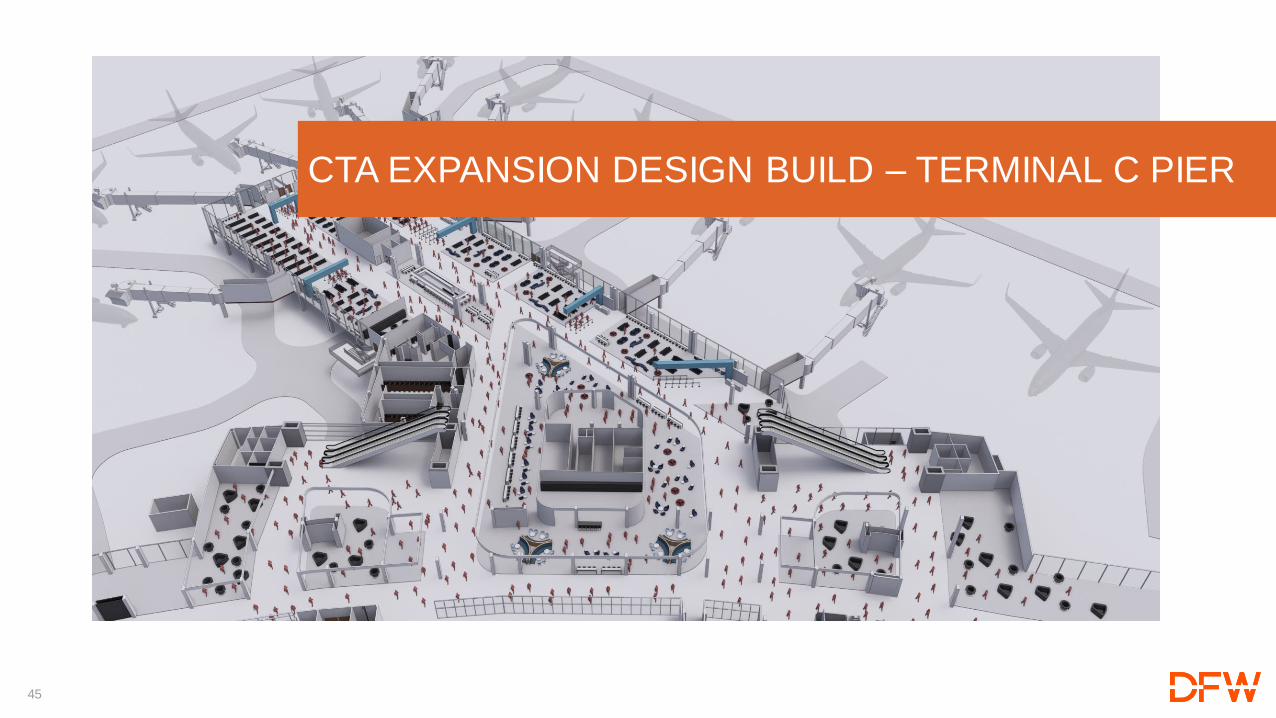
CTA EXPANSION DESIGN BUILD – TERMINAL C PIER
46
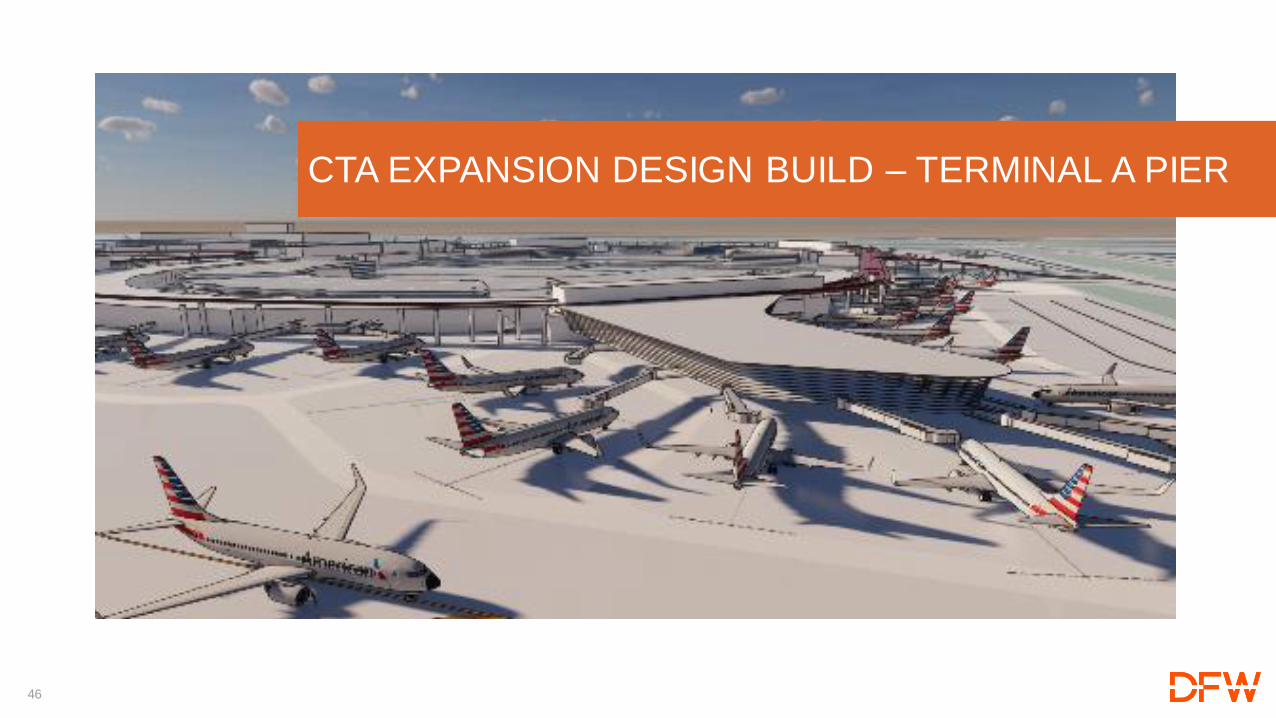
CTA EXPANSION DESIGN BUILD – TERMINAL A PIER
47
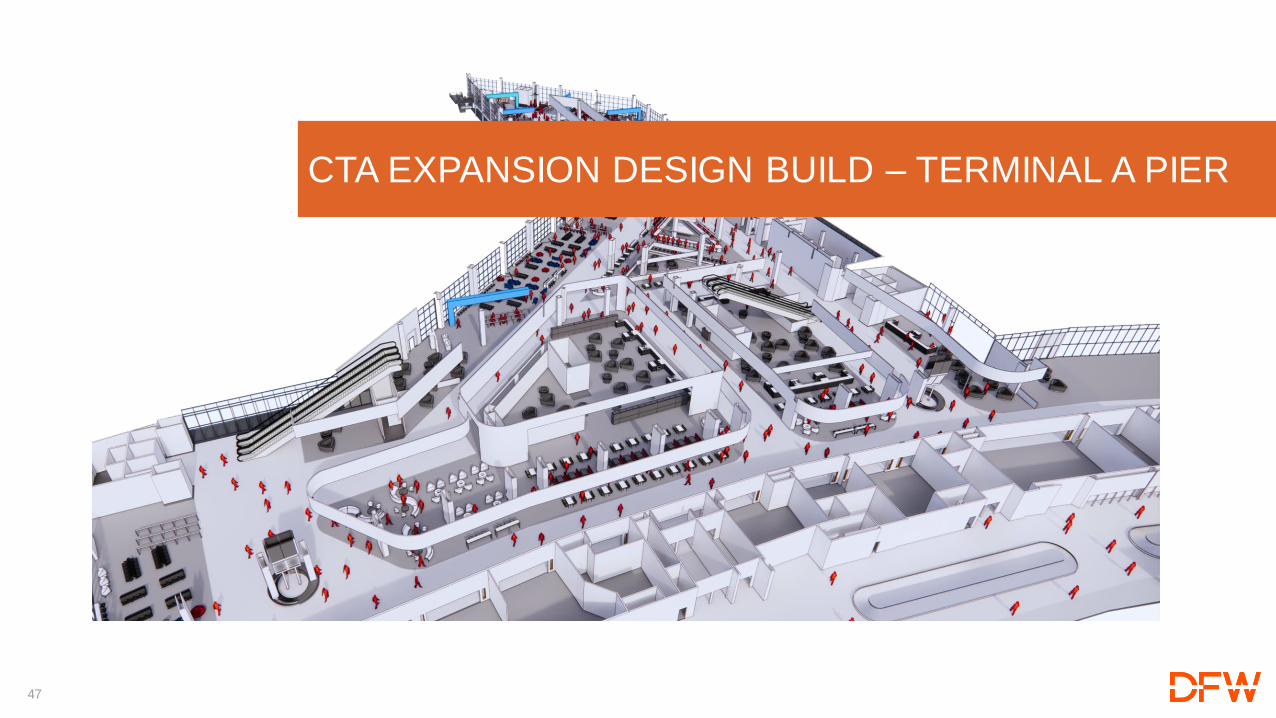
CTA EXPANSION DESIGN BUILD – TERMINAL A PIER

48
TERMINAL C RENOVATIONS
CONSTRUCTION MANAGER AT RISK

4949
Next time we see you…
50
Cristen Mosley
Concessions Project Manager
GRAB / GBAC Update
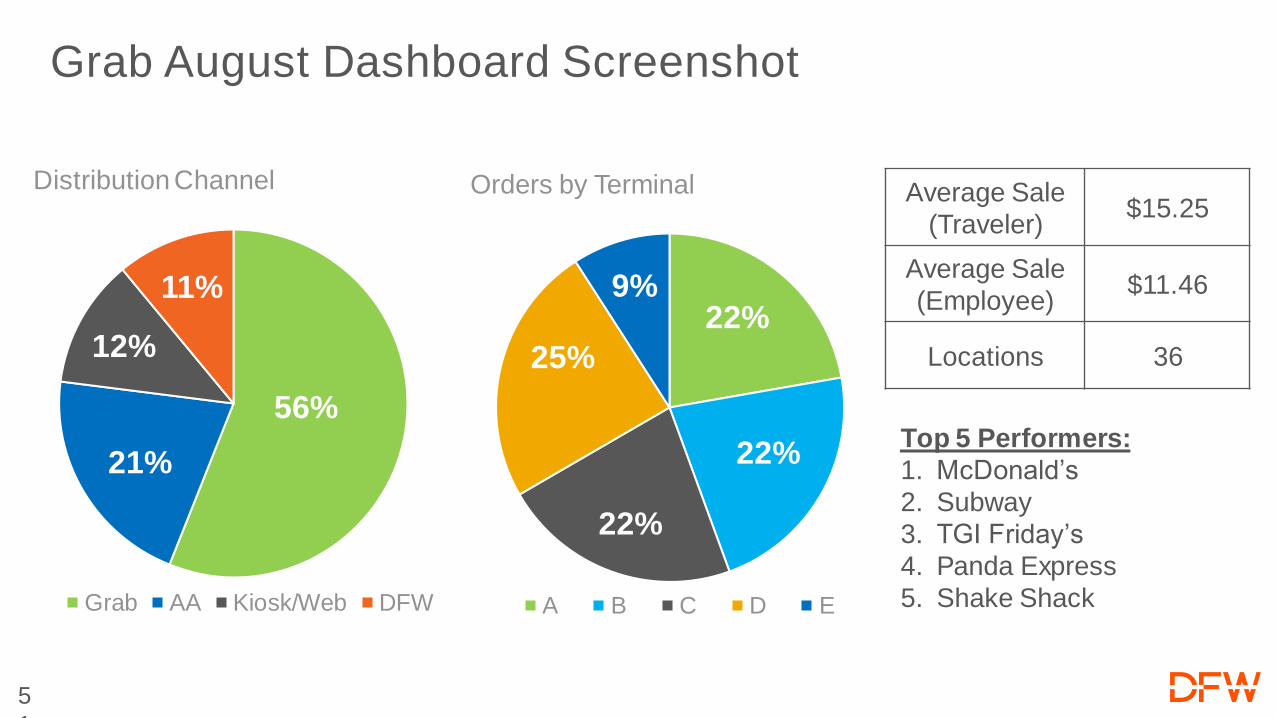
Grab August Dashboard Screenshot
5
1
Average Sale
(Traveler)$15.25
Average Sale
(Employee)$11.46
Locations 36
Top 5 Performers:
1. McDonald’s
2. Subway
3. TGI Friday’s
4. Panda Express
5. Shake Shack
56%
21%
12%
11%
Distribution Channel
Grab AA Kiosk/Web DFW
22%
22%
22%
25%
9%
Orders by Terminal
A B C D E
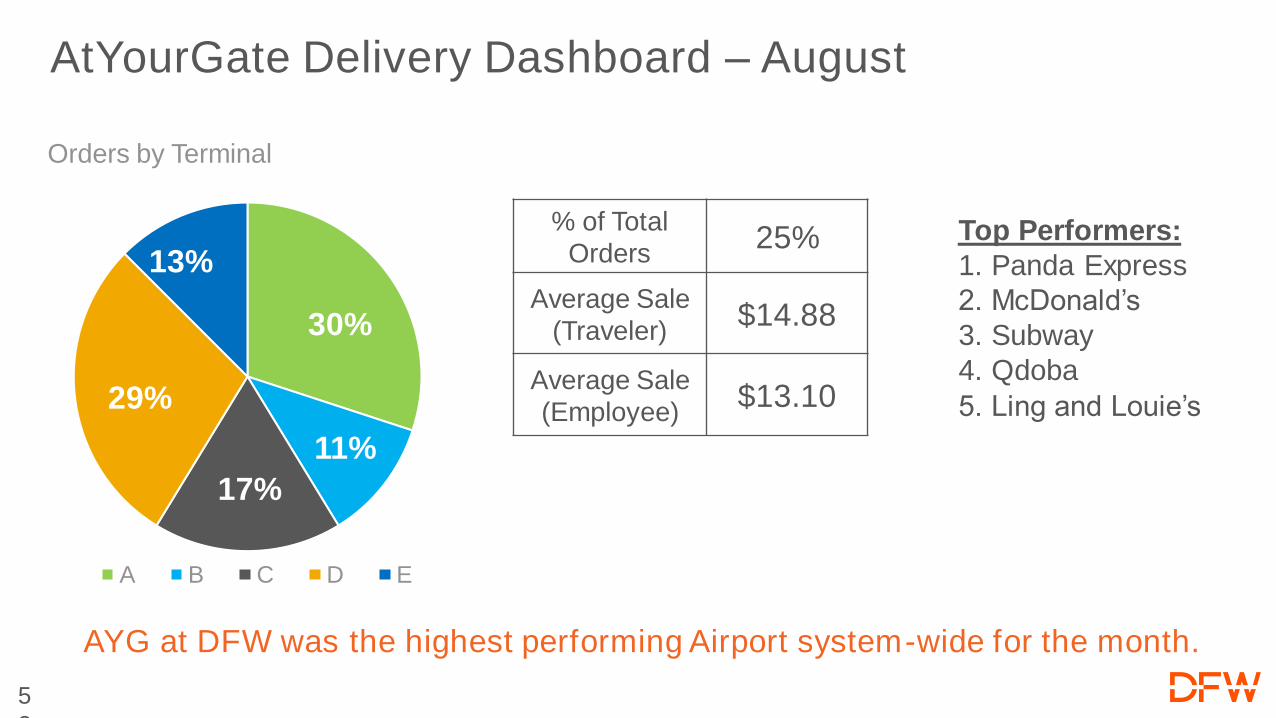
AtYourGate Delivery Dashboard – August
5
2
% of Total
Orders25%
Average Sale
(Traveler)$14.88
Average Sale
(Employee)$13.10
Top Performers:
1. Panda Express
2. McDonald’s
3. Subway
4. Qdoba
5. Ling and Louie’s
AYG at DFW was the highest performing Airport system-wide for the month.
30%
11%
17%
29%
13%
Orders by Terminal
A B C D E
84%
16%
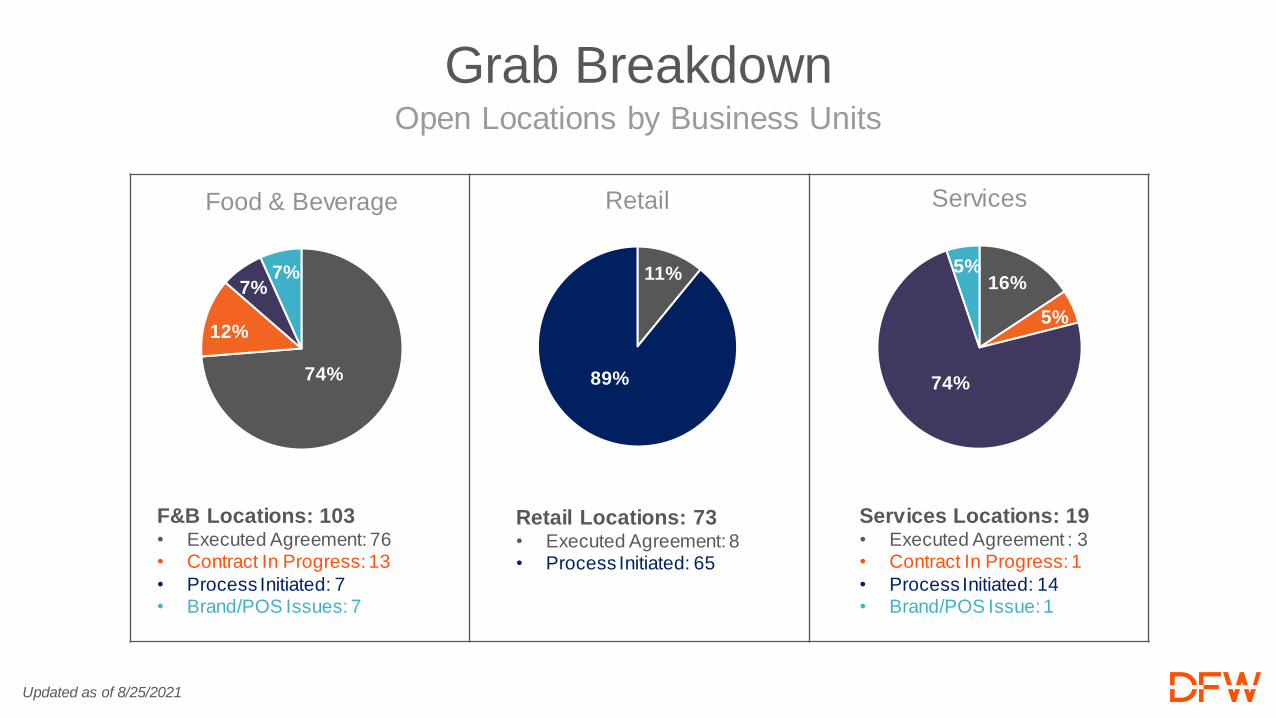
Retail Locations: 73• Executed Agreement: 8• Process Initiated: 65
84%
16%
Services Locations: 19• Executed Agreement : 3• Contract In Progress: 1
• Process Initiated: 14• Brand/POS Issue: 1
F&B Locations: 103• Executed Agreement: 76• Contract In Progress: 13
• Process Initiated: 7• Brand/POS Issues: 7
73%
18%
9%78%
10%
Grab BreakdownOpen Locations by Business Units
Updated as of 8/25/2021
74%
12%
7%7%
Food & Beverage
11%
89%
Retail
16%
5%
74%
5%
Services

Retail
Retail Locations: 73• Completed: 69• Not yet completed: 4
Services
Services Locations: 19• Completed: 18• Not yet completed: 1
Food & Beverage
F&B Locations: 103• Completed: 89• Not yet completed: 14
86%
14%
Overall Program
Open Locations: 195• Completed: 176• Not yet completed: 19
90%
10%
GBAC Certification DashboardOpen Locations by Business Unit
Updated as of 9/20/2021
95%
5%
95%
5%
55
Dee Amos
Vice President, Corporate Communications and Marketing
Employee Updates
56
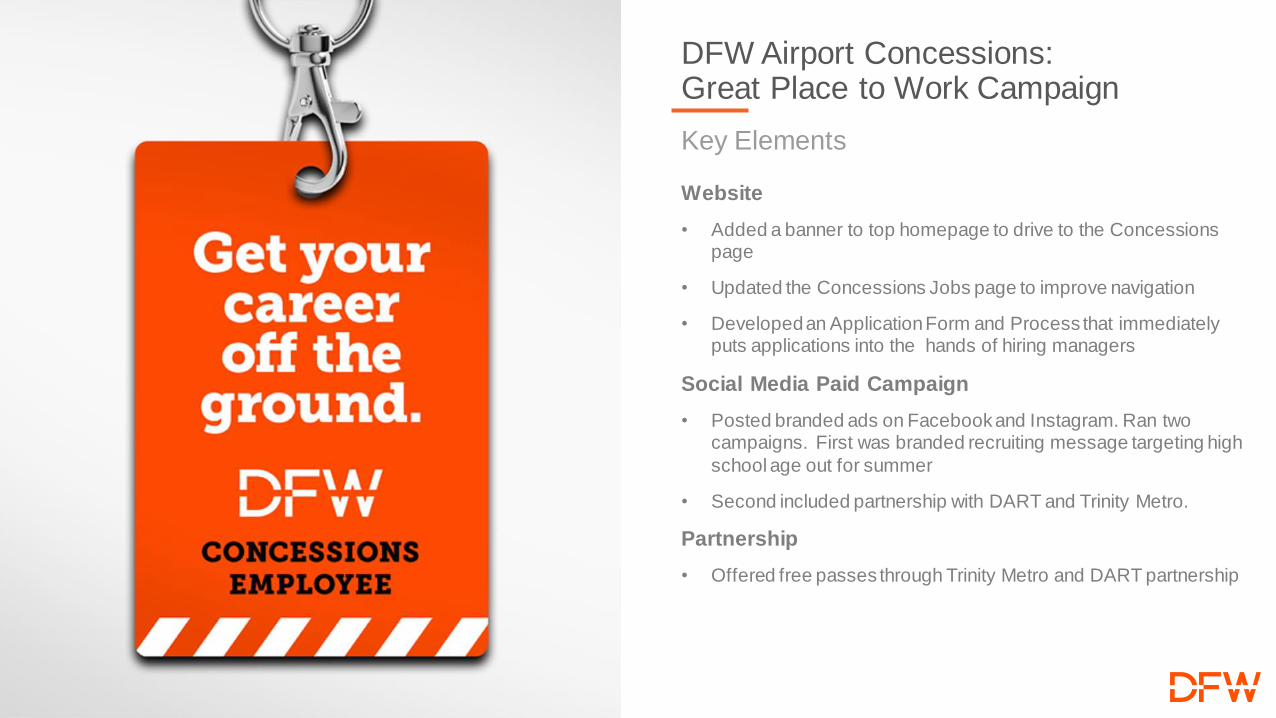
Website
• Added a banner to top homepage to drive to the Concessions page
• Updated the Concessions Jobs page to improve navigation
• Developed an Application Form and Process that immediately puts applications into the hands of hiring managers
Social Media Paid Campaign
• Posted branded ads on Facebook and Instagram. Ran two campaigns. First was branded recruiting message targeting high
school age out for summer
• Second included partnership with DART and Trinity Metro.
Partnership
• Offered free passes through Trinity Metro and DART partnership
DFW Airport Concessions: Great Place to Work Campaign
Key Elements

57
Concessions Recruiting Results As of Monday, September 13 at 2:00 p.m.– 465 Online Applications Completed
As of September 13:
• 818 Applicant Engagements
• 285 Job Interviews
• 61 New Hires <35% locations reporting
Partnership with DART and Trinity Metro
58
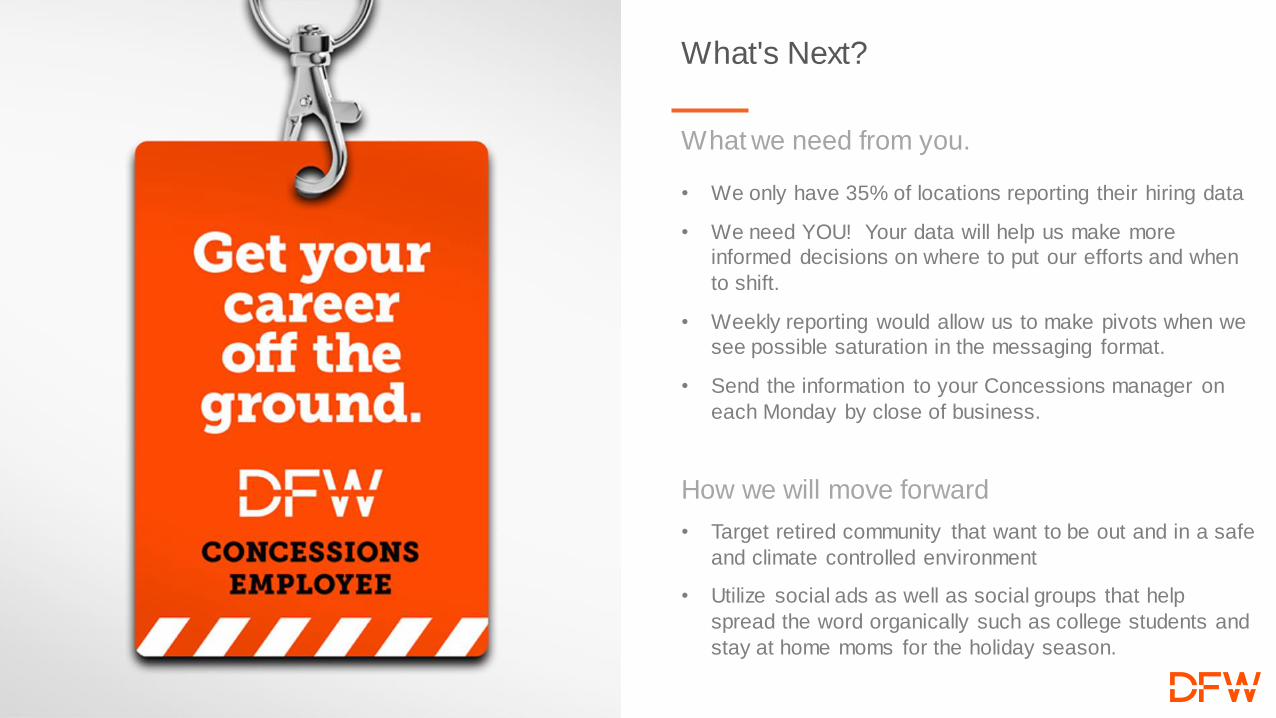
• We only have 35% of locations reporting their hiring data
• We need YOU! Your data will help us make more
informed decisions on where to put our efforts and when
to shift.
• Weekly reporting would allow us to make pivots when we
see possible saturation in the messaging format.
• Send the information to your Concessions manager on
each Monday by close of business.
How we will move forward
• Target retired community that want to be out and in a safe
and climate controlled environment
• Utilize social ads as well as social groups that help
spread the word organically such as college students and
stay at home moms for the holiday season.
What's Next?
What we need from you.
59
Michael Morford
Concessions Manager
Staffing & Operations “Begin with the End in Mind.” – Baldwinism Philosophies
60
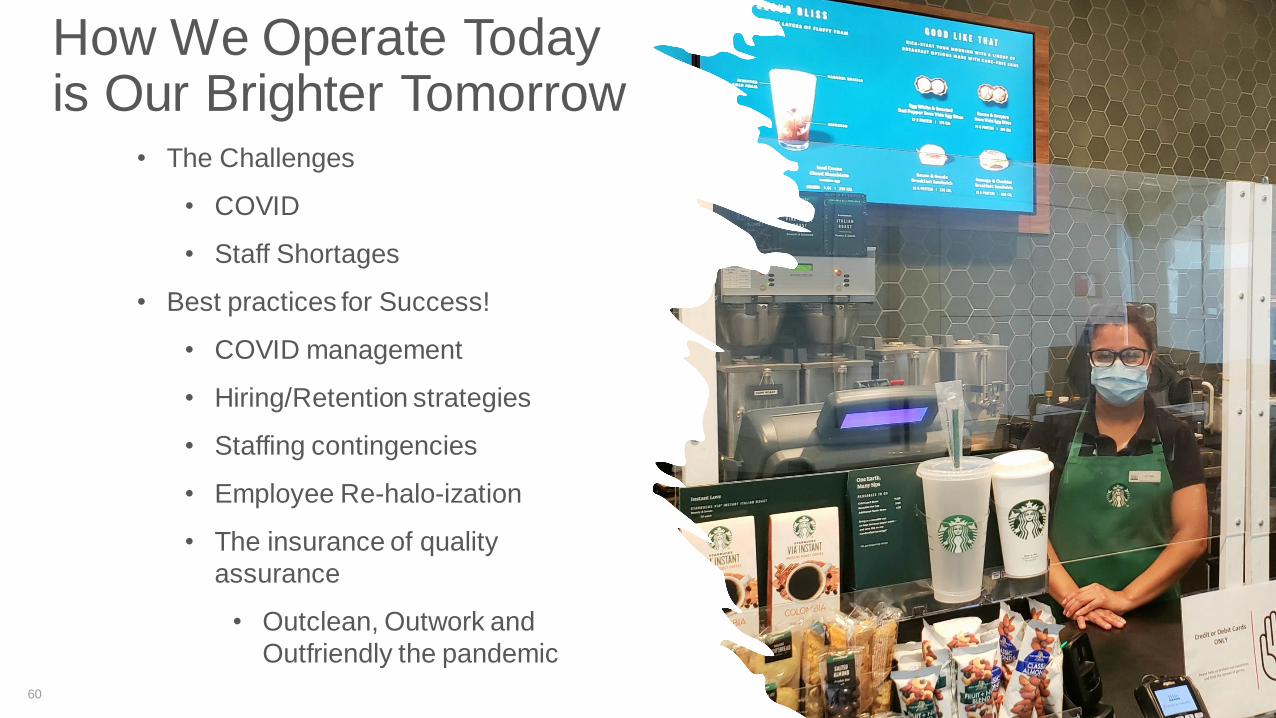
How We Operate Today is Our Brighter Tomorrow
• The Challenges
• COVID
• Staff Shortages
• Best practices for Success!
• COVID management
• Hiring/Retention strategies
• Staffing contingencies
• Employee Re-halo-ization
• The insurance of quality
assurance
• Outclean, Outwork and
Outfriendly the pandemic
61
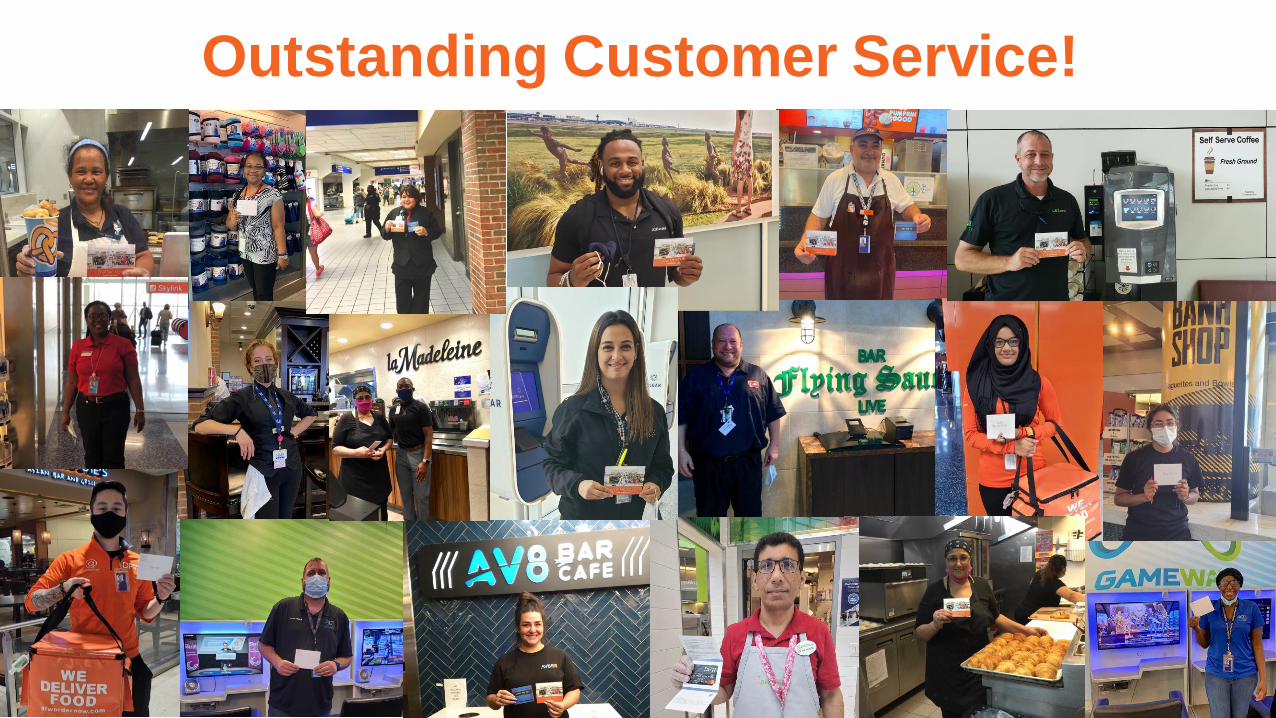
Outstanding Customer Service!

62

63
64
Ken Buchanan
Executive Vice President, Customer Experience & Revenue Management
Closing Remarks

65

66
Thank You