Embed Size (px)
Citation preview

Brigham Young UniversityBYU ScholarsArchive
All Theses and Dissertations
2016-07-01
Conceptualizing Blended Learning EngagementLisa R. HalversonBrigham Young University
Follow this and additional works at: https://scholarsarchive.byu.edu/etd
Part of the Educational Psychology Commons
This Dissertation is brought to you for free and open access by BYU ScholarsArchive. It has been accepted for inclusion in All Theses and Dissertationsby an authorized administrator of BYU ScholarsArchive. For more information, please contact [email protected], [email protected].
BYU ScholarsArchive CitationHalverson, Lisa R., "Conceptualizing Blended Learning Engagement" (2016). All Theses and Dissertations. 5981.https://scholarsarchive.byu.edu/etd/5981

Conceptualizing Blended Learning Engagement
Lisa R. Halverson
A dissertation submitted to the faculty of Brigham Young University
in partial fulfillment of the requirements for the degree of
Doctor of Philosophy
Charles R. Graham, Chair Ross Larsen Peter J. Rich
Richard R Sudweeks Richard E. West
Department of Instructional Psychology and Technology
Brigham Young University
July 2016
Copyright © 2016 Lisa R. Halverson
All Rights Reserved

ABSTRACT
Conceptualizing Blended Learning Engagement
Lisa R. Halverson Department of Instructional Psychology and Technology, BYU
Doctor of Philosophy
Learner engagement, or the involvement of the student’s cognitive and emotional energy to accomplish a learning task, has been called “the holy grail of learning” (Sinatra, Heddy, & Lombardi, 2015, p. 1) because of its correlations to academic achievement, persistence, and satisfaction. In the 21st century, learning will be increasingly “blended,” combining face-to-face with computer-mediated instruction. Research is already exploring learner engagement in blended contexts, but no theoretical framework guides inquiry or practice. Developing models and measures of the factors that facilitate learner engagement is important to the advancement of the domain. This multiple-article format dissertation addresses the theoretical gap in research on learner engagement in blended settings. The first article reviews the existing literature on learner engagement, delineates a set of constructs most relevant to the contexts of blended learning, and proposes a theoretical framework for learner engagement in blended settings. The second article operationalizes and tests the proposed model of blended learning engagement using exploratory and confirmatory factor analysis. It creates and evaluates an end-of-course self-report measure of cognitive and emotional engagement. The unique factor structure of online and face-to-face indicators of learner engagement is clearly demonstrated in the results of this study. Keywords: learner engagement, blended learning, technology-mediated learning, theoretical framework, structural equation modeling

ACKNOWLEDGMENTS
I feel deep gratitude to so many for the support I have received during this doctoral
program and the writing of this dissertation. The department of Instructional Psychology and
Technology is phenomenal for the level of collaboration, support, and professionalism. For
several years I have been blessed to research and write with Dr. Charles Graham, who
recognized my interest in blended learning theory very early on. Drs. Ross Larsen and Richard
Sudweeks have provided critical mentoring for me in statistical analysis processes required to
complete this work. Drs. Rick West and Peter Rich have given encouragement and excellent
feedback on refining my writing and thinking. I am grateful to each of you!
I am the person that I am because of my parents, Alice and Mark Rampton. Thank you
for encouraging my growth and exploration in my younger years, from following promptings to
attend “the Farm,” to bicycling through France and teaching English in Eastern Europe at age 20,
to traversing India on my own. Thank you for your examples of service and stewardship and for
making each of your seven children believe we were unique and favored and loved.
My husband Taylor Halverson has supported me in countless ways as I’ve juggled
classes, research, teaching, and motherhood. Our children have spent nearly every Saturday for
the last several years on adventures with Dad – while Mom stayed home to write. When, six
months ago, I lost the hearing in one of my ears, Taylor encouraged me to move forward with the
cochlear implant surgery that will help in the long run, but that has required much more time and
energy than we expected and necessitated even more support from Taylor. Thank you for always
opening doors for me.
Finally, life is rich and exciting because of my two children, David and Rachel. You are
my miracles!
iv
TABLE OF CONTENTS
ABSTRACT .................................................................................................................................... ii
ACKNOWLEDGMENTS ............................................................................................................. iii
TABLE OF CONTENTS ............................................................................................................... iv
LIST OF FIGURES ....................................................................................................................... vi
LIST OF TABLES ........................................................................................................................ vii
DESCRIPTION OF RESEARCH AGENDA AND STRUCTURE OF THE DISSERTATION ....
.............................................................................................................................................. viii
Article 1: Learner Engagement in Blended Learning Environments: A Conceptual Framework ...
................................................................................................................................................. 1
Abstract ........................................................................................................................................... 3
Introduction ..................................................................................................................................... 4
Literature Review............................................................................................................................ 7
Formation of the Learner Engagement Model .............................................................................. 14
Cognitive Engagement .......................................................................................................... 17
Emotional Engagement ......................................................................................................... 24
Conclusion .................................................................................................................................... 33
References ..................................................................................................................................... 37
Article 2: Scale Development to Measure Learner Engagement in Blended Learning
Environments ......................................................................................................................... 63
v
Abstract ......................................................................................................................................... 65
Introduction ................................................................................................................................... 66
Method .......................................................................................................................................... 69
Item Generation .................................................................................................................... 69
Data Collection ..................................................................................................................... 74
Analysis................................................................................................................................. 74
Results ........................................................................................................................................... 75
Descriptive Statistics ............................................................................................................. 75
Cognitive Engagement .......................................................................................................... 75
Emotional Engagement ........................................................................................................ 88
Discussion ..................................................................................................................................... 96
References ................................................................................................................................... 103
Appendix: Blended Learning Course Engagement Survey ........................................................ 111
DISSERTATION CONCLUSION ............................................................................................. 119
DISSERTATION REFERENCES .............................................................................................. 123

vi
LIST OF FIGURES
Article 1
Figure 1. Overall logic model of relationship between learner characteristics, learning
experience, engagement, and outcomes .................................................................................16
Figure 2. Model of CE. .................................................................................................................17
Figure 3. Models of EE (Positive and Negative). .........................................................................25
Article 2
Figure 1. Theoretical Model of Cognitive Engagement. .............................................................68
Figure 2. Theoretical Models of Emotional Engagement (Positive and Negative). .....................69
Figure 3. Face-to-Face CE Model 2, with five first order factors: attention, effort and
persistence, cognitive strategy use, absorption, and curiosity. ...............................................80
Figure 4. Face-to-Face CE Model 3, with two first order factors: focused attention (FOC) and
curiosity (CUR). .....................................................................................................................80
Figure 5. Face-to-Face CE Model 4, with two first order factors: effort (EFF) and flow
(FLO). ............................................................................................................................................81
Figure 6. Face-to-Face CE Model 4, a single factor model in which all indicators load on CE. .82
Figure 7. Face-to-Face EE Model 2, with seven first order factors: enjoyment or situational
interest, happiness, lack of detachment, confidence, anxiety, confusion, and frustration......91
Figure 8. Face-to-Face EE Model 3, with three first order factors: positive engagement (POS),
confidence (CONFD), and negative engagement (NEG). ......................................................92

vii
LIST OF TABLES
Article 1
Table 1. Comparisons of Several Engagement Models on Key Dimensions ...................................9
Article 2
Table 1. Sources Consulted in the Development of Items ..............................................................71
Table 2. Summary of Goodness-of-Fit Indices for Alternative Models of Face-to-Face Cognitive
Engagement ............................................................................................................................83
Table 3. Cross-Validation Factor Loadings of Cognitive Engagement Indicators: CE Model 3 .86
Table 4. Cross-Validation Factor Loadings of Cognitive Engagement Indicators: CE Model 4 .87
Table 5. Summary of Goodness-of-Fit Indices for Alternative Models of Face-to-Face Emotional
Engagement ............................................................................................................................93
Table 6. Cross-Validation Factor Loadings of Emotional Engagement Indicators: EE Model 3
........................................................................................................................................................95

viii
DESCRIPTION OF RESEARCH AGENDA AND STRUCTURE OF THE DISSERTATION
The purpose of this dissertation is to propose, operationalize, and test a theoretical
framework for learner engagement in technology-mediated environments. Learner engagement
is the investment of mental and emotional energy in the learning process, and its importance to
student learning, satisfaction, and persistence has been widely acknowledged (Filak & Sheldon,
2008; Fredricks, Blumenfeld, & Paris, 2004; Hughes, Luo, Kwok, & Loyd, 2008; Kuh, Cruce,
Shoup, Kinzie, Gonyear, & Gonyea, 2008; Reschley & Christenson, 2012). As the learning of
the 21st century becomes increasingly “blended,” combining face-to-face with computer-
mediated instruction, understanding the nature of learner engagement in different modalities
becomes increasingly important.
Several hurdles to understanding engagement in blended settings exist, including the
dynamic and evolving conception of blended learning, the lack of definitional clarity about
learner engagement, and the absence of an instrument to measure learners’ degree of engagement
in blended learning environments. Without such an instrument, it becomes impossible to
measure the impact of specific designs or make comparisons across different contexts (Henrie,
Halverson, & Graham, 2015), all the more critical because effective and engaging “blending” is
not unilaterally conceived or implemented. But instrument creation is hampered by the fact that
there does not exist a universally accepted definition for learner engagement (Fredricks,
Blumenfeld, & Paris, 2004), let alone blended learning engagement. There is a need for
theoretical clarity in the study of learner engagement in blended settings and for research
instruments aligned with such theory (Onku & Cakir, 2011).
This multiple-article format dissertation proposes, operationalizes, and tests theoretical
models and measures of blended learning engagement. It is written in a hybrid format,

ix
combining traditional dissertation requirements with journal publication formats. The
preliminary pages of the dissertation reflect requirements for submission to the university. The
dissertation report is presented as a journal article, and conforms to length and style requirements
for submitting research reports to education journals. Article 1 is also an extensive review of the
literature on learner engagement.
Article 1
In the first article in this dissertation, “Learner Engagement in Blended Learning
Environments: A Conceptual Framework,” we reviewed the existing literature on learner
engagement and found much “duplication of concepts and lack of differentiation in definitions”
(Fredricks et al., 2004, p. 65). Across several models of learner engagement, theoretical “jingle
and jangle” prevailed, with the same term being used for different things and different terms
being used for the same construct (see Reschly & Christenson, 2012). Additionally, facilitators
and indicators of engagement are at times indiscriminately grouped. Several key instruments
attempt to measure learner engagement at the institutional level, but this may be “a different
reality than engagement in the classroom or, even more circumscribed, in learning activities. . . .
[T]here may be no necessary equivalence between engagement in school and engagement in
specific learning activities” (Janosz, 2012, p. 698). Finally, we found no comprehensive
framework established and operationalized to understand engagement in blended contexts.
Unable to find an existing model to apply to the affordances of blended learning, we
delved further into the literature in order to propose a theoretical framework for blended learning
engagement. We proposed that the most fundamental indicators of engagement were those that
demonstrated learner investment of mental and emotional energy in the learning process (see
also Astin, 1984; Janosz, 2012; Schunk & Mullen, 2012). Drawing upon the literature of fields

x
such as educational psychology, human development, and human-computer interaction, we
proposed subconstructs for cognitive and emotional engagement that might best apply to the
affordances of blended contexts. This paper was not an empirical study but a case for a
theoretical model, intended to guide future measurements of engagement, which can test the
efficacy of blended interventions and designs.
This article was selected for the Educational Technology Research and Development
Young Scholar Award in 2015. It was submitted to the journal in October 2015 and has been
through one cycle of review and revision.
Article 2
The second article in this dissertation, “Scale Development to Measure Learner
Engagement in Blended Learning Environments,” operationalized and tested the proposed model
of blended learning engagement using exploratory and confirmatory factor analysis. We
developed investigated the structural validity of a new end-of-course self-report instrument to
measure blended learning engagement. To generate items for our scale, we consulted various
related instruments, although very few of the face-to-face items matched our purposes without
alteration and all online items had to be created anew.
The instrument, which we called the Blended Learning Course Engagement Survey,
accounted for context (online or face-to-face) and the cognitive and emotional aspects of learner
engagement. Results indicated that the original model be adjusted to separate factors by context,
as the unique factor structure of online and face-to-face indicators of learner engagement is
clearly demonstrated. Lack of discriminant validity between first order factors led to a
respecification of the original model. Future research can further refine the engagement scale
utilized in this research. Contributions that this framework and scale can make to theory and

xi
pedagogy are discussed. Computers & Education or The Internet and Higher Education are
potential outlets for publishing this article.

Running Head: A CONCEPTUAL FRAMEWORK 1
Article 1: Learner Engagement in Blended Learning Environments:
A Conceptual Framework

A CONCEPTUAL FRAMEWORK 2
Learner Engagement in Blended Learning Environments:
A Conceptual Framework
Lisa R. Halverson and Charles R. Graham
Brigham Young University

A CONCEPTUAL FRAMEWORK 3
Abstract
Learner engagement correlates with important educational outcomes, including academic
achievement, persistence, and satisfaction. In the 21st century, learning will be increasingly
“blended,” combining face-to-face with computer-mediated instruction. Although research is
already exploring learner engagement in blended contexts, no theoretical framework guides
inquiry or practice, and there is little consistency or even specificity in the definitions and
operationalizations of engagement. Developing definitions, models, and measures of the factors
that indicate learner engagement is important to the advancement of the domain. Greater clarity
is needed about facilitators versus indicators of engagement in order to establish whether changes
in instructional methods (facilitators) have actually resulted in improved engagement (measured
via indicators). This article examines existing literature on learner engagement and identifies
constructs that are most relevant to learning in general and blended learning in particular. We
then propose a theoretical framework for learner engagement that includes both cognitive and
emotional indicators and investigates their relevance to blended learning contexts. We share
examples of research measuring these engagement indicators in technology-mediated learning
contexts. We believe this framework can support advances in blended learning engagement
research that is increasingly real-time, minimally intrusive, and maximally generalizable across
various subject matter contexts.
Keywords: learner engagement; cognitive engagement; emotional engagement; blended learning;
hybrid learning; theory

A CONCEPTUAL FRAMEWORK 4
Introduction
Learner engagement, defined as the involvement of the student’s cognitive and emotional
energy (Astin, 1984; Schunk & Mullen, 2012) to accomplish a learning task, has been found to
correlate with important educational outcomes, including academic achievement (Hughes, Luo,
Kwok, & Loyd, 2008; Ladd & Dinella, 2009; Nystrand & Gamoran, 1991), satisfaction (Filak &
Sheldon, 2008; Zimmerman & Kitsantas, 1997), sense of community (Conrad, 2010; Robinson,
2010), and persistence (Berger & Milem, 1999; Kuh et al,, 2008). Such correlations have
prompted scholars to refer to learner engagement as “an educational bottom line" (Coates, 2006,
p. 36) and “the holy grail of learning” (Sinatra, Heddy, & Lombardi, 2015, p. 1). Yet many
students today are not engaged in their own education, resulting in high attrition as well as low
interest, motivation, and academic outcomes (Chapman, Laird, & Kewalramani, 2011;
Rumberger & Rotermund, 2012).
Many educators have hoped that blended learning (BL), which is the thoughtful
integration of face-to-face and online instruction, can more fully engage students in their learning
(Aspden & Helm, 2004; Graham & Robison, 2007). BL may support improved reflection and
critical discourse (Garrison & Kanuka, 2004), important in cognitive engagement (CE) (Nystrand
& Gamoran, 1991). Technology-mediated instruction can offer multiple pathways for studying a
particular topic, increasing choice and thus assisting agentic engagement (Reeve & Tseng, 2011).
Emotional engagement (EE) may be preserved and enhanced through the face-to-face interactions
in BL, though this idea needs further research. Nelson Laird and Kuh (2005) found a strong
positive relationship between use of information technology for educational purposes and
indicators of engagement as per the National Survey of Student Engagement (NSSE). Interest in
learner engagement is high among BL proponents, with almost half of the top-cited publications

A CONCEPTUAL FRAMEWORK 5
on BL employing the term engagement (Halverson, Graham, Spring, & Drysdale, 2012). Yet
only four of the 85 top-cited articles and chapters addressed the topic in their research questions
(Halverson, Graham, Spring, Drysdale, & Henrie, 2014). Even though scholars and practitioners
show interest in the potential of BL to increase learner engagement, more research is essential.
Several hurdles to researching engagement in blended settings exist, including the
dynamic and evolving conception of BL, the lack of definitional clarity about learner
engagement, and the confusion between facilitators and indicators of engagement. The first
obstacle is the nature of BL itself. At the most basic level, BL involves the combination of face-
to-face and technology-mediated (or online) instruction (Graham, 2013). However, BL is a high
level term that is often defined in terms of its surface features (online and face-to-face) rather than
its pedagogical features (Graham, Henrie, & Gibbons, 2014). Some authors (Graham, 2013;
Laumakis, Graham, & Dziuban, 2009; Norberg, Dziuban, & Moskal, 2011) have referred to the
term as a boundary object, “plastic enough to adapt to local needs and constraints of the several
parties employing them, yet robust enough to maintain a common identity across sites" (Star &
Griesemer, 1989, p. 393). Some are frustrated by this lack of specificity, while others see a
flexibility that allows “individual institutions and collaborative groups to tailor the concept to
maximize its potential while being responsive to a new generation of students” (Moskal, Dziuban,
& Hartman, 2012, p. 16). Accordingly, engaging and effective blending can involve countless
possible combinations of human- and technology-mediated instruction—neither conceived nor
implemented unilaterally. Research is needed to clarify which blended designs most effectively
increase learner engagement and thus student learning.
To measure changes in learner engagement, greater theoretical and definitional clarity
about engagement is required. At present, no definition for learner engagement is universally

A CONCEPTUAL FRAMEWORK 6
accepted. Literature on the topic has been described in terms of “duplication of concepts and lack
of differentiation in definitions” (Fredricks, Blumenfeld, & Paris, 2004, p. 65). If research on
learner engagement is theoretically entangled, it is no surprise that learner engagement in blended
settings is still a theoretically undefined and untested domain. Henrie, Halverson, and Graham
(2015) found little consistency or even specificity in the definitions and operationalization of
engagement in literature measuring engagement in technology-mediated learning (TML). This
paper reviews the existing literature on learner engagement and proposes a definition and set of
theoretical constructs for learner engagement in blended settings. This theoretical framework is
intended to provide guidance to researchers interested in measuring learner engagement in
blended contexts.
A final challenge in researching engagement is the not infrequent confusion of facilitators
and indicators of engagement. According to Skinner, Furrer, Marchand, and Kindermann (2008),
“Indicators refer to the features that belong inside the construct of engagement proper, whereas
facilitators are the causal factors (outside of the construct) that are hypothesized to influence
engagement” (p. 766). When BL advocates speak of best practices or optimal blends, they are
proposing the contextual facilitators that will encourage engagement and thus student learning.
But we cannot evaluate the effect of those proposed interventions until we have a clear set of
engagement indicators to measure. Several existing instruments to measure engagement actually
mix facilitators and indicators. For example, the recently revised NSSE lists ten engagement
indicators, but many of these (especially those in the Effective Teaching Practices category)
assess practices that facilitate engagement, not the indicators that engagement is occurring.
In this paper we propose a cohesive set of engagement indicators that are applicable to the
contexts of both face-to-face and technology-mediated instruction. We have drawn these

A CONCEPTUAL FRAMEWORK 7
indicators from the literature of fields such as educational psychology, human development, and
human-computer interaction, trying to find the configuration of constructs that would best apply
to learner engagement in BL contexts. Although our research team is currently using factor
analysis to test the model with empirical data, this paper is not an empirical study but a case for a
theoretical model. However, we hope our framework will guide future measurements of
engagement, testing the efficacy of blended interventions and designs and better determining
which facilitators most efficaciously improve engagement.
Literature Review
Terms like learner engagement or student engagement are used prolifically, even
excessively, in educational research. Azevedo (2015) reported that a search on PsycINFO
unearthed more than 32,000 articles about engagement dated over the last 14 years. Because
standard keyword database searching gave us much that was irrelevant or used engagement too
loosely for our purposes, we began our literature review with the 50-page overview of school
engagement by Fredricks et al. (2004). This highly cited paper reviewed definitions, measures,
facilitators, and outcomes of engagement. Its appendix compiled 44 studies that used the term
engagement, listing definitions, measures, methods, and key findings. More recently, Fredricks,
McColskey, Meli, Mordica, Montrosse, and Mooney (2011) published an expansive report on
how engagement was measured in K-12 settings. We looked up each study and instrument, as
well as other referenced literature. Each retrieval led to new references, and we gradually
gathered more than 900 articles, chapters, and instruments on engagement. Then to ensure that
no influential works on learner engagement had slipped by, we reviewed the results from
Harzing’s (2014) Publish or Perish software, which calculates academic citations from Google
Scholar, using a title search of the 100 top-cited results for engagement. From these we gleaned

A CONCEPTUAL FRAMEWORK 8
additional relevant publications to review. We also used Publish or Perish to search for learner
engagement and student engagement, adding relevant publications found.
Another extensive resource in the literature on learner engagement is the recently
published Handbook of Research on Student Engagement (Christenson, Reschly, & Wylie, 2012),
incorporating 39 chapters on learner engagement. Each contributor to this 839-page volume was
asked to consider: What is your definition of engagement? and What overarching framework or
theory do you use to study/explain engagement? (p. vii). The diverse contributions showed, as
Fredricks et al. (2004) had warned, that research still seeks a consensus on the definitions,
frameworks, and constructs of engagement. The tome’s opening chapter (Reschly & Christenson,
2012) is titled “Jingle, Jangle, and Conceptual Haziness”: in psychology, jingle refers to the same
term being used for different things and jangle designates different terms being used for the same
construct (see Kelly, 1927; Thorndike, 1913). Reschly and Christenson displayed a table
comparing four prominent engagement models on key dimensions such as number of types or
subconstructs and definitions or indicators; we have compiled a similar but expanded table (Table
1). As these demonstrate, a plethora of constructs have been proposed for engagement research
and theory.

A CONCEPTUAL FRAMEWORK 9
Table 1
Comparisons of Several Engagement Models on Key Dimensions
Source No. of types Indicators of engagement Appleton & colleaguesa
4 Academic: Time on task, credit accrual, homework completion Behavioral: Attendance, in-class and extracurricular participation Cognitive: Value/relevance, self-regulation, goal setting, strategizing Affective/psychological: Belonging, identification, school membership
Bangert-Drowns & Pyke (2001)
7 Disengagement: Avoidance or premature discontinued use Unsystematic engagement: Unclear goals Frustrated engagement: Inability to accomplish goals Structure-dependent engagement: Pursuit of goals communicated by software Self-regulated interest: Creates personal goals, makes interesting to self Critical engagement: Tests personal understandings, limits of the software Literate thinking: Interprets software from multiple, personally meaningful perspectives
Finn (1989) 2 Participation: Task-oriented interaction; on-task behaviors; responding to requirements, expenditure of extra time on work Identification: Belonging and valuing success in school-relevant goals
Fredricks, Blumenfeld, Friedel, & Paris (2005)
3 Behavioral: Participation, positive conduct; involvement in academic, social, or extracurricular activities Cognitive: Investment, thoughtfulness, and willingness to exert effort Emotional: Appeal; affective reactions to teachers and classmates, academics and school (boredom, interest, anxiety, etc.); belonging; valuing
Handelsman, Briggs, Sullivan, & Towler (2005)
4 Skills engagement: Skills practice, general learning strategies Emotional engagement: Emotional involvement with the class material Participation/ interaction engagement: Participation in class, interactions with instructors and classmates Performance engagement: Levels of performance in class, including confidence, performance goals, and extrinsic motivation
High School Survey of Student Engagementb
3 Cognitive/intellectual/academic engagement: “Engagement of the mind”—effort, investment in work, and strategies for learning Emotional engagement: “Engagement of the heart”—students’ feelings of connection to (or disconnection from) their school Social/behavioral/participatory engagement: “Engagement in life of the school” —actions, interactions, and participation within school community
Martin (2007) 4 higher order factors,
11 subconstructs
Adaptive cognition: Valuing, mastery orientation, self-efficacy Adaptive behavior: Persistence, planning, study management Maladaptive behavior: Disengagement, self-handicapping Impeding/maladaptive cognition: Uncertain control, failure avoidance, anxiety
Miller, Greene, Montalvo, Ravindran, & Nichols (1996)
1 higher order factor
with 4 subconstructs
Cognitive engagement: Self-regulation, cognitive strategy use (deep vs shallow), effort, and persistence
National Survey of Student Engagementc
4 “themes” with 10
“engagement indicators”
Academic Challenge: Higher-order learning, reflective & integrative learning, learning strategies, quantitative reasoning Learning with Peers: Collaborative learning, discussions with diverse others Experiences with Faculty: Student-faculty interaction, effective teaching practices

A CONCEPTUAL FRAMEWORK 10
Campus Environment: Quality of interactions, supportive environment
Pekrun & Linnenbrink-Garcia (2012)
1 + 5 Emotional: Considered the antecedent of other components of engagement Cognitive: Attention, memory processes Motivational: Intrinsic and extrinsic motivation, achievement goals Behavioral: Effort, persistence Cognitive-behavioral: Strategy use and self-regulation Social-behavioral: Social on-task behavior
Reeve & colleaguesd
4 Agentic: Constructive contribution into flow of instruction Behavioral: Task involvement, effort, attention Cognitive: Metacognitive strategy use, self-regulation, personal application and relevance Emotional: Enjoyment, interest, curiosity
Skinner & colleaguese
4 Engagement • Behavioral: Action initiation, effort, hard work, persistence, intensity,
attention, absorption, involvement • Emotional: Enthusiasm, interest, enjoyment, satisfaction, pride, vitality,
zest Disaffection • Behavioral: Passivity, giving up, withdrawal, restlessness, inattentiveness,
distraction, mental disengagement, burn-out, lack of preparation • Emotional: Boredom, disinterest, frustration/anger, sadness,
worry/anxiety, shame, self-blame a Appleton, Christenson, Kim, & Reschly (2006); Appleton (2012). b Yazzie-Mintz (2010). c McCormick, Gonyea, & Kinzie (2013). d Reeve & Tseng (2011); Reeve (2012); Reeve (2013) e Skinner, Kindermann, Connell, & Wellborn (2009); Skinner, Kindermann, & Furrer (2009); Skinner & Pitzer (2012).

A CONCEPTUAL FRAMEWORK 11
Initially we hoped to find an existing model to modify to the affordances of BL. Fredricks
et al.’s (2004) comprehensive review of engagement has led many researchers to adopt their
tripartite model of emotional, cognitive, and behavioral engagement. However, we (like
Fredricks. Blumenfeld, Friedel, & Paris, 2005) noticed overlapping elements for cognitive and
behavioral engagement in this and other models. Skinner and colleagues have been gathering
data for their model of emotional and behavioral engagement and disaffection since the 1990s
(e.g., Skinner & Belmont, 1993), and have some of the clearest explications of indicators versus
facilitators of engagement; this combination of clarity and substance was attractive to us. But the
absence of a cognitive measurement left vital aspects of learner engagement unexamined. Reeve
and colleagues (Reeve, 2012; Reeve & Tseng, 2011) started with Skinner’s model and added CE
items from other research as well as their own agentic engagement items.
Even if agreement had been reached on construct labels, careful study of the construct
descriptions produced additional jingle and jangle. For example, absorption is considered by
some to be an aspect of CE, by others to be part of behavioral engagement; valuing indicates EE
in one model and CE in another (Christenson, Reschly, & Wylie, 2012; Fredricks et al., 2011).
Persistence is a component of CE for Miller, Greene, Montalvo, Ravindran, and Nichols (1996),
but of behavioral engagement in the frameworks of Fredricks et al. (2004), Pekrun and
Linnenbrink-Garcia (2012), and Skinner and colleagues. Henrie et al. (2015) found particular
conceptual fuzziness between cognitive and behavioral engagement; some research stated the
intent to measure CE but operationalized the construct in ways other models deemed behavioral.
When we examined engagement definitions, we found additional confusion. While some
literature included explicit definitions about engagement, other research jumped straight to its
operationalization (see Table 1 in Appleton, Christenson, & Furlong, 2008). Jimerson, Campos,

A CONCEPTUAL FRAMEWORK 12
and Greif (2003) examined 45 articles on engagement and found that 31 did not explicitly define
terms. In the narrower context of TML, Henrie et al. (2015) likewise found that the majority of
articles reviewed did not clearly define engagement. They wrote, “The future success of research
relating subconstructs of engagement to specific outcomes relies on consensus of definitions and
measures of engagement” (p. 37). Findings from two studies on engagement may conflict simply
because of differences in definition or construct conceptualization.
Even without these shortcomings, transfer of current instruments for measuring learner
engagement to blended settings may be questionable. Some researchers have applied existing
instruments to technology-mediated settings. For example, to measure engagement in online
college students, Sun and Rueda (2012) used Fredricks et al.’s (2005) K-12 classroom
engagement scale. To measure engagement in game-based learning, Rowe, Shores, Mott, Lester,
and Carolina (2011) combined the Positive and Negative Affect Schedule (Watson, Clark, &
Tellegen, 1998) and the Presence Questionnaire (Witmer & Singer, 1998). But overall, existing
engagement instruments have numerous items that transfer poorly to blended contexts, requiring
revalidation of any instrument adapted to BL.
Thus no comprehensive framework has been established and operationalized to
understand engagement in blended contexts. Bangert-Drowns and Pyke (2001) observed students
working in a blended setting, then proposed a 7-level taxonomy of engagement with educational
software (including simulations, activities, tools, game, tutorials, and internet). Yet no discussion
of the blended nature of their engagement constructs was included. O’Brien and Toms (2008)
created a list of engagement attributes to predict engaging user-computer experiences.
Unfortunately, their compilation mixes facilitators and indicators of engagement, as well as
characteristics of the computer application and the participant: challenge, positive affect,

A CONCEPTUAL FRAMEWORK 13
endurability, aesthetic and sensory appeal, attention, feedback, variety/novelty, interactivity, and
perceived user control. Coates (2007) applied the Student Engagement Questionnaire (SEQ) to
online as well as more “general campus-based engagement” (p. 121) but narrowly limited online
learning to use of learning management systems (LMS).
Another limitation is that the SEQ, like the widely used NSSE (Kuh, 2009; NSSE, 2014)
and Student Engagement Instrument (Appleton, Christenson, Kim, & Reschly, 2006), focuses
primarily on institutional level engagement (Skinner & Pitzer, 2012). Institutional engagement
promotes retention and discourages dropout—vital educational goals. But improving BL design
requires understanding when students are engaging with their learning and when they begin to
disengage. To do this, engagement must be conceptualized and then measured at the course and
activity levels—termed the microprocess level (Ainley, 2012) and grain sizes (Sinatra, Heddy, &
Lombardi, 2015). We feel that “[e]ngagement should be measured at the same specificity level as
the intervention” (Wang, Bergin, & Bergin, 2014, p. 518). Indeed, engagement at the institutional
or school level is “a different reality than engagement in the classroom or, even more
circumscribed, in learning activities. . . . [T]here may be no necessary equivalence between
engagement in school and engagement in specific learning activities” (Janosz, 2012, p.
698). Thus models and scales which focus on the institutional level can tell us little about
measuring engagement in specific BL courses and activities. If “engagement is fundamentally
situational” (Kahu, 2013, p. 763) and “occurs during the actual experience of an activity or event”
(Davis & McPartland, 2012, p. 516), then by understanding how engagement fluctuates in
different face-to-face and online situations we can improve the design of BL.
But merely collecting class- and activity-level case studies of learner engagement will not
give us the "reasonably stable theory base . . . [that] allows for a clear focus on important issues

A CONCEPTUAL FRAMEWORK 14
and provides sound (though still limited) guidance for the design of improved solutions to
important problems" (Burkhardt & Schoenfeld, 2003, p. 6). We need a theoretical framework to
guide research into learner engagement in settings that combine face-to-face with computer-
mediated instruction. As Meyer (2014) noted regarding online learning,
It is not sufficient to rely on the research conducted in the pre-Internet era to claim that
pursuing student engagement has an effect on positive outcomes of interest to institutions
and students; instructors and designers involved in online learning must prove such an
effect for online learning specifically. (p. 72)
Current engagement models and instruments are inadequate due to contextual affordances
(course and activity level vs. institutional) and to conflation of constructs and subconstructs of
engagement. A new model of learner engagement is needed to guide research in BL settings.
Formation of the Learner Engagement Model
Given this landscape littered with overlapping or conflicting definitions and constructs of
engagement, and instruments not adapted to blended contexts, we decided to establish a
theoretical framework of engagement, applicable to engagement in general but also suited to
inform the creation of instruments to measure engagement in both face-to-face and technology-
mediated contexts. Our overall logic model (see Figure 1) encapsulates both facilitators and
indicators of engagement, but our intent in this paper will be to establish which indicators, culled
from the literature, are most fundamental to understanding engagement. Once these are clearly
established, then BL research can test various designs and interventions, manipulating various
facilitators and assessing their effect upon engagement.
Thus we begin by inquiring into the most fundamental expressions of learner
engagement. Janosz (2012) stated, “To develop new skills and acquire new knowledge,

A CONCEPTUAL FRAMEWORK 15
individuals must consciously mobilize and devote some of their physical and psychological
(cognitive, emotional) energy; they must engage themselves in the learning situation” (p. 695).
We propose that the most elemental indicators of engagement show whether learners are
investing mental and emotional energy in the learning process. Research acknowledges the
primacy of emotional and cognitive engagement. Reschly and Christenson (2012) classified
cognitive and affective engagement as individual internal processes that mediate and precede
academic and behavioral engagement. Appleton et al. (2006) proposed moving beyond academic
and behavioral indicators to focus on “the underlying cognitive and psychological needs of
students” (p. 430). Research from human-computer interaction and educational data mining
measure this energy by examining what they call “cognitive-affective states” (Baker, D’Mello,
Rodrigo, & Graesser, 2010; D’Mello & Graesser, 2011).
In a domain that has sometimes (erroneously in our view) emphasized seat-time over
pedagogy in its definition of blending (Picciano, 2009), a focus on cognitive and emotional
engagement reminds us that internal processes are paramount. Still some may be surprised that
our model does not include behavioral engagement as a key indicator. Henrie et al. (2015),
reviewing measures of student engagement in TML, found that 77% of the research measured
behavioral indicators, while only 43% measured cognitive and 41% emotional indicators.
Engagement research that uses educational data mining techniques may measure online behaviors
such as click data, assignment submission, or time viewing videos (Kizilcec, Piech, & Schneider,
2013; Ramesh, Goldwater, Huang, Daum, & Getoor, 2013), hoping those behaviors imply
emotional and cognitive engagement. We argue that what other models are considering displays
of behavioral engagement are actually indicators of underlying cognitive and emotional
involvement. Renninger and Bachrach (2015) suggested that the ability of a learner to

A CONCEPTUAL FRAMEWORK 16
behaviorally engage without emotional and cognitive investment implies that behavior should be
considered separately. Piaget (1981) argued that all behavior has cognitive and affective
underpinnings, with affectivity providing energy to intellection. Thus researchers may infer
internal processes from external behaviors; these behaviors are not trivial, but must be recognized
as outward displays of the mental and emotional energies that fuel learning.
Figure 1. Overall logic model of relationship between learner characteristics, learning experience, engagement, and outcomes.
Consequently, this framework proposes that CE and EE are the key factors essential to
understanding learner engagement. Figure 1 displays our overall model of the relationship of
learner characteristics, learning experience, engagement, and desired learning
outcomes. Personal and contextual facilitators of engagement, including learner characteristics
and thoughtful learning experience design, can increase the likelihood of learner
engagement. Engagement is manifest via cognitive and emotional indicators and contributes to
desired learning outcomes. We have crossed disciplines to cull the first order factors proposed to

A CONCEPTUAL FRAMEWORK 17
indicate cognitive and emotional engagement, forging a more unified framework that can be
acceptably operationalized in both face-to-face and technology-mediated contexts. As we discuss
these indicators, we will not attempt to propose every BL practice that might lead to them—
research on BL facilitators must fill in this gap. Since we are focusing on indicators, we will
offer some examples of how such indicators have been measured in blended contexts.
Cognitive Engagement
Cognitive engagement—the expenditure and reception of mental energy—has long been
the subject of theoretical debate (Pintrich & DeGroot, 1990; Zimmerman, 2002). Our framework
proposes that CE is comprised of several first order factors, some of which indicate the quantity
of CE, others the quality (see Figure 2).
Figure 2. Model of CE. Attention, effort and persistence, and time on task indicate the quantity of CE, while cognitive strategy use, absorption, and curiosity indicate its quality.
Factors indicating quantity of CE. Our first three factors include the more outwardly
visible and quantifiable indicators that mental energy is being put toward learning: attention,
effort and persistence, and time on task. In the literature these variables were labeled behavioral

A CONCEPTUAL FRAMEWORK 18
in some frameworks and cognitive in others (Henrie et al., 2015). Pekrun and Linnenbrick-
Garcia’s (2012) model shows the overlap: Cognitive, behavioral, and cognitive-behavioral are
among their five types of engagement. Proponents of divergent perspectives may question our
labeling of these indicators as cognitive rather than behavioral. Certainly the variables that we
incorporate here may include behaviors, yet we consider them behaviors reflecting the presence
or absence of mental energy focused on learning. Moreover, when we collected formative
feedback on an early version of an instrument based on this framework, giving an end-of-course
engagement survey to students (n=57) in a blended course, exploratory factor analysis showed
that both quantity and quality factors loaded well onto one higher-level factor—cognitive
engagement. We hypothesize that subsequent empirical studies will find that these factors
converge, together reflecting the expenditure and reception of mental energy.
Some consider attention the defining attribute of engagement (e.g., Cocea & Weibelzahl,
2011). Miller (2015), using self-paced reading and eye-tracking methodologies to measure
engagement, called attention “the baseline of engagement” (p. 34). Keller’s (1987, 2008) ARCS
model of motivational design established attention as the first stepping-stone to other means of
motivating learners (relevance, confidence, and satisfaction follow). Attention is a cognitive
process, as are perception, deliberation, and memory (Calvo & D’Mello, 2010; Lehman, D’Mello,
& Graesser, 2012); Pekrun and Linnenbrick-Garcia (2012) included attention and memory
processes in conceptualizing CE. Attention is the gatekeeper for information processing
(Atkinson & Shiffrin, 1968); without it, learning could not take place. Attention is one of the
most basic indicators that learners are engaging mental effort in the learning process.
Some have measured attention using classroom observation, but online aspects of a
blended course may be at a distance, making such techniques impractical. Other methods for

A CONCEPTUAL FRAMEWORK 19
measuring attention during online instruction track eye movement (Boucheix, Lowe, Putri, &
Groff, 2013; Miller, 2015; Toyama, Sonntag, Orlosky, & Kiyokawa, 2015), brainwaves (Sun,
2013), or gross body language (D’Mello et al., 2008). Already intelligent tutoring systems (ITSs)
attempt to reengage students when they perceive waning attention (D’Mello et al., 2008), and as
understanding of blended and online learner engagement improves, additional data-rich systems
will sense waning attention and provide real-time feedback to both learner and instructor
(Bienkowski, Feng, & Means, 2012).
Effort and persistence and time on task are dimensions of CE that manifest in outward
behaviors but, of more importance, reflect expenditure of mental energy towards learning. Any
researcher who has tried to differentiate between time logged on an LMS and actual time on task
characterized by effort and persistence would intuitively understand the interest in CE, not just
behavior: as in face-to-face learning, time spent on task is desirable primarily when accompanied
by cognitive effort and committed persistence. Thus Miller et al. (1996) saw effort and
persistence as variables that indicated cognitive engagement, and found both to be significantly
related to academic achievement.
Persistence counteracts the likelihood of attrition, which may be higher in online than in
traditional settings (Carr, 2000; Diaz, 2002). In addition to course-level measures of persistence
(often, did the student complete the course), Tan, Sun, and Khoo (2014) employed activity-level
measures of persistence. They used log data from the online ASSISTments Math Tutor program
to map engagement levels to engagement indicators. “Persistency” was operationalized as
revisiting and spending extra time on difficult tasks, using hints appropriately, and completing all
tasks on time. Persistence occupied the fourth of five hierarchical levels, just lower than
enthusiasm, in importance to learning.

A CONCEPTUAL FRAMEWORK 20
The link between academic engaged time and learning “is one of the most enduring and
consistent findings in educational research” (Gettinger & Walters, 2012, p. 654), such that some
researchers have argued that time on task is the single most influential factor in student success
(Farragher & Yore, 1997). Time on task has been ranked “most reflective of the degree of
student engagement in classroom learning” (Kong, 2011, p. 1856). Nevertheless, in blended and
online contexts, conceptualizing and measuring time on task can be complex. Beck (2004),
studying learner interaction with computer tutors, considered time on task the most basic
component of engagement, yet his model fit best when he incorporated question difficulty and
response accuracy. Macfayden and Dawson (2010), mining log data to measure engagement in
online courses, found that other measures of engagement—interaction with peers through
discussion forums, number of optional self-test quizzes completed, and attention to administrative
details—were more important than time online. Cocea and Weibelzahl (2011) also examined log
data and found the most valuable factor for detecting disengagement to be the average time spent
on content pages: spending too little or too much time on a page could indicate disengagement.
Care must be taken if time-on-task data are drawn from diverse blended courses. Many
blended courses replace seat time with online expectations (Picciano, 2009), but some instructors
may consider the face-to-face activities as optional enhancement, not required work. In BL
contexts, measuring time on task in face-to-face and online settings must account for policies of
seat-time flexibility.
Factors indicating quality of CE. CE also comprises factors indicative of the quality of
engagement, namely cognitive and metacognitive strategy use, deep concentration or absorption,
and individual interest or curiosity. These factors are supported by one of the most frequently
employed theories in BL research (Halverson, et al., 2014), Garrison, Anderson, and Archer’s
A CONCEPTUAL FRAMEWORK 21
(2001) Community of Inquiry framework. The framework proposes that the requirements for
effective online educational transaction include cognitive presence, which is further broken down
into triggering events (which pique curiosity), exploration, integration (cognitive and
metacognitive strategies applied to solidify understanding), and resolution.
Many existing descriptions of CE focus either on effort and persistence or on cognitive
and metacognitive strategies. Winne and Baker (2013) proposed that with metacognitive
monitoring and control, learners are “actively engag[ing] in thinking about their learning" (p. 3),
expending mental energy in the process of learning. Reeve (2012, 2013) stated that cognitive
learning strategies were the better indicators of CE, since metacognitive strategy use cross-loaded
with behavioral engagement (Reeve & Tseng, 2011). This might be another reason for
interpreting behavioral engagement as an outward manifestation of the more fundamental
constructs of CE and EE.
In blended and online contexts, cognitive and metacognitive strategy use and the closely
correlated ability of self-regulation (Sun & Rueda, 2012) may be particularly important. Meyer
(2014) wrote, “Learning self-regulation is especially important in online learning [where being
successful] . . . depends upon the student’s discipline, self-direction, and ability to remain
motivated” (p. 24). At the same time, hypermedia use (common in blended and online resources)
“greatly increases task demands and requires the learner to stretch limited processing resources
across two major constraints: to-be-learned information and the hypermedia environment”
(Schraw, 2010, p. 258). Fortunately, online tasks also give us new ways to measure cognitive and
metacognitive strategy use and self-regulation: Winne and Baker (2013) proposed using
educational data mining techniques to provide real-time data about these factors and about the
process of learning “as it unfolds” (p. 1).

A CONCEPTUAL FRAMEWORK 22
Another first order factor that indicates the quality of focused mental energy in learning is
deep concentration or absorption. Early conceptualizations of absorption defined it as a trait or
disposition (see Tellegen & Atkinson, 1974). Later research distinguished ways in which
absorption functions as a state to which individual or situational factors lead (Agarwal &
Karahanna, 2000). Absorption may express a deep level of attention (Keller, 2008), but is
qualitatively different: “paying attention” may be associated with coercion, whereas absorption is
a “state in which people are so involved in an activity that nothing else seems to matter”
(Csikszentmihalyi, 1990, p. 4). Csikszentmihalyi’s theory of flow describes “states of intense
concentration or absolute absorption in an activity” (Shernoff, Csikszentmihalyi, Schneider, &
Shernoff, 2003, p. 161) accompanied by a sense of control, exhilaration, and deep happiness; in
such cases mental energy is not only being expended but also created. Researchers have applied
the flow theory to studies of human-computer interaction (Agarwal & Karahanna, 2000; Hoffman
& Novak, 1996; Trevino & Webster, 1992). Ghani and Deshpande (1994), studying computer
use in the workplace, evaluated enjoyment and total absorption; Estenban-Millat, Martínez-
López, Huertas-García, Meseguer, and Rodríguez-Ardura (2014) proposed a model of flow in
online learning environments and found that focused attention (similar to our conception of
absorption) was one of the two most important direct determinants of a state of flow.
Our final first order variable of CE, individual interest or curiosity, must be distinguished
from the short-lived emotional experience of situational interest (Ainley, 2012; Hidi &
Renninger, 2006). According to Senko and Miles (2008), the latter “refers to enjoyment of
external stimuli, such as an entertaining lecture or catchy story” (p. 567); we propose that
situational interest and enjoyment are part of positive EE, to be discussed shortly. When the
learner perceives the material to be personally relevant, “situational interest may develop into

A CONCEPTUAL FRAMEWORK 23
individual interest, which is characterized by curiosity and self-guided exploration” (p. 567; see
also Dewey, 1910). Interest research portrays cognitive and affective components as co-
occurring (Hidi & Renninger, 2006; Renninger & Bachrach, 2015), but prioritizes emotion in
triggering situational interest, whereas cognitive processes such as stored learning and curiosity
have primacy in individual interest.
We will focus on cognitive curiosity (Reio, Petrosko, Wiswell, & Thongsukmag, 2006),
also termed scientific (James, 1890/1950), epistemic (Berlyne, 1978), or intellectual curiosity
(Dewey, 1910); we will not explore physical, social (Dewey, 1910), perceptual (Berlyne, 1978),
sensory (James, 1890/1950), or other curiosity variants (Reio et al., 2006). Cognitive curiosity is
a “deeper level of attention” stimulated by the learner’s sense of inquiry (Keller, 2008, p. 177).
Berlyne (1978) posited that curiosity, resulting from subjective uncertainty, may generate
“exploratory behavior aimed at resolving or partially mitigating the uncertainty" (p. 98). This
exploration is one way that mental energy is expended in learning.
Some have argued that computer use can abet curiosity as the learner explores,
experiments, and browses (Ghani & Deshpande, 1994), though such behaviors, if labeled “surfing
the web,” may be discouraged in educational contexts. Technology-pervasive learning
environments may even alter how curiosity is expressed and sustained (Arnone, Small, Chauncey,
& McKenna, 2011). Curiosity is among the discrete cognitive-affective states frequently present
in TML (D’Mello, 2013), and the studies included in that meta-analysis demonstrate new ways to
measure curiosity in TML, such as using multichannel physiological signals to gauge learner
reactions to ITSs (Pour, Hussein, AlZoubi, D’Mello, & Calvo, 2010; Hussein, AlZoubi, Calvo, &
D’Mello, 2011) or prompting frequent self-report via smartphone in game-based learning
environments (Sabourin, Mott, & Lester, 2011).

A CONCEPTUAL FRAMEWORK 24
We believe that the affordances of BL have the potential to encourage CE, an energy
indicated by attention, effort and persistence, time on task, cognitive strategy use, absorption, and
curiosity. BL may diversify the learning pathways available to accomplish a task; this increased
flexibility and personalization abets curiosity, absorption, and attention (Estenban-Millat et al.,
2014). At the same time, personalization and flexibility may require learners to employ greater
effort and cognitive strategy use. When time on task is accompanied by effort (even absorption),
deep learning occurs. At the same time, BL preserves the benefits of humanness (Graham, 2006),
which encourage CE while mediating the varied emotions that inevitably arise during learning.
Emotional Engagement
Picard, who coined the term affective learning, has noted “an accelerated flow of findings
in multiple disciplines supporting a view of affect as complexly intertwined with cognition in
guiding rational behaviour, memory retrieval, decision-making, creativity, and more” (Picard et
al., 2004, p. 253). Pekrun (2011) argued that emotions influence “a broad variety of cognitive
processes that contribute to learning, such as perception, attention, memory, decision making, and
cognitive problem solving" (p. 26), and Skinner and Pitzer (2012) labeled emotion “the fuel for
the kind of behavioral and cognitive engagement that leads to high-quality learning" (p. 33). The
intertwining of mental and emotional energy is also acknowledged in human-computer interaction
research of “cognitive-affective states” (Baker et al., 2010; D’Mello & Graesser, 2011).
Even as consensus coalesces around the importance of emotions in learning, the emotions
to be studied—particularly in TML—are still up to debate. According to Picard et al. (2004),
“[T]here is still very little understanding as to which emotions are most important in learning, and
how they influence learning. To date there is no comprehensive, empirically validated, theory of
emotion that addresses learning” (p. 255; see also Lopatovska & Arapakis, 2011). Research from

A CONCEPTUAL FRAMEWORK 25
the fields of human-computer interaction, artificial intelligence, and computer science has found
that the prominent emotions occurring during complex learning with technology are different
from Ekman’s (1992) basic universal emotions: anger, disgust, fear, joy, sadness, and surprise
(Graesser & D’Mello, 2011). D’Mello (2013) performed a meta-analysis tracking 17 affective
states across 24 studies; he found the discrete states most frequent in TML to be boredom,
engagement/flow, confusion, curiosity, happiness, and frustration. We include these cognitive-
affective states in our EE constructs, considering curiosity part of CE.
We also use the work of Skinner and colleagues (e.g., Skinner et al., 2008; Skinner,
Kindermann, & Furrer, 2009). Drawing on motivation theory, they divided EE into two
constructs: emotional engagement and emotional disaffection. We call the comparable constructs
positive EE (POS) and negative EE (NEG; see Figure 3).
Figure 3. Models of EE (Positive and Negative). The factor of Confusion is unattached for now, for confusion affects engagement and learning differently depending on contextual details.
Positive EE (POS). Research has noted how positive emotions assist learning by
broadening the scope of action, attention, and cognition, and by helping learners “to see
relatedness and interconnections . . . and to process material in a more integrated and flexible
fashion” (Fredrickson, 1998, p. 308; see also Hazlett & Benedek, 2007). We propose that

A CONCEPTUAL FRAMEWORK 26
particular emotions indicate learner engagement. Skinner and colleagues do not differentiate the
positive aspects of EE but focus primarily on interest or enjoyment. Representative items from
their scale include “Class is fun” and “When we work on something in class, I feel interested”
(Skinner, et al., 2008, p. 781). Despite Patrick, Skinner, and Connell’s (1993) finding that various
positive emotional items were accounted for by a single factor (α = .88), we will investigate
whether additional positive emotions described in other research might indicate the expenditure
and reception of emotional energy in the learning process. We propose that POS includes not
only the first order factor of situational interest (Senko & Miles, 2008) or enjoyment (Skinner et
al., 2008), but also happiness (D’Mello, 2013) and confidence (Arroyo, Cooper, Burleson, Woolf,
Muldner, & Christopherson, 2009; Keller, 2008). We explain these subconstructs below.
As stated, many conceptualizations of EE focus on enjoyment or situational interest
(Milne & Otieno, 2007; Furlong et al., 2003). Situational interest, or enjoyment created by
external stimuli (Hidi, 1990; Senko & Miles, 2008), is a short-lived affective state that indicates
emotional energy expended and created by learning efforts. Though short-lived, this interest
focuses attention, enhances cognitive performance and learning, and improves integration (Hidi &
Renninger, 2006). For Ainley (2012), interest functions as a “hook”: A learning activity that
sparks interest easily engages students, and the learning process begins. For most scales that we
investigated, enjoyment and interest were central components to positive EE.
These factors matter in blended and online learning. Tempelaar, Niculescu, Rienties,
Gijselaers, and Giesbers (2012) found significant correlations between students’ engagement in
the online component of BL and their self-reported levels of enjoyment. They reported no clear
correlation between face-to-face engagement and achievement emotions including enjoyment,
boredom, anxiety, and hopelessness. However, the proxy measure they employed to estimate

A CONCEPTUAL FRAMEWORK 27
face-to-face engagement was the number of clicks in the LMS, a questionable substitute for the
fidelity, synchronicity, and humanness available in face-to-face settings (Graham, 2006).
Happiness research is complex (Oishi, Diener, & Lucas, 2007), with various definitions of
the constructs. Some define happiness as a relatively stable feeling towards life, noting its
association with better social and marital relationships, longevity, higher income, and lower
unemployment (Oishi et al., 2007). As an indicator of engagement, however, we are interested in
happiness as a more momentary state expressing engagement in a learning task. This state of
happiness is similar to the mild joy and contentment that Fredrickson (2001) found to be
associated with increased creativity and cognitive performance.
In TML research this state of happiness has been examined (D’Mello, Lehman, &
Persons, 2010; Lehman, D’Mello, & Persons, 2008) and found among the more frequent affective
states experienced by learners when interacting with technology (D’Mello, 2013). As an
indicator of engagement, we expect happiness to occur after engagement-facilitating experiences,
such as receiving positive feedback, attaining learning goals, and resolving confusion or other
impasses (D’Mello, 2013; Lehman et al., 2008; Stein & Levine, 1991). D'Mello et al. (2010)
found that when students using an ITS reacted with happiness to feedback on one problem, their
performance improved on subsequent problems: as our overall logic model suggests, learners’
POS improved their learning outcomes. Some have argued that engagement (along with pleasure
and meaning) can be a key pathway to happiness; thus happiness may result from and indicate an
engaged state (Parks, Schueller, & Tasimi, 2013; Seligman, Ernst, Gillham, Reivich, & Linkins,
2009). Future research could investigate these pathways with increasingly fine-grained and real-
time tools available to recognize expressions of happiness, including facial action coding, posture,
and eye-tracking (D’Mello & Graesser, 2012; D’Mello et al., 2010).

A CONCEPTUAL FRAMEWORK 28
We propose confidence as a third dimension of POS. Confidence provides a clear
contrast to the NEG factor (suggested by Skinner and colleagues) of anxiety (Kort, Riley, &
Picard, 2001); research indicates an inverse relationship between the two (Pajares, 1996; Shea &
Bidjerano, 2010). It is possible that confidence may double as both an indicator and a facilitator
of engagement. Confidence may precede and facilitate engagement: students are more likely to
exert effort in academic tasks if they believe they have the capacity to succeed (Greene, 2015;
Hulleman, Godes, Hendricks, & Harackiewicz, 2010; Milligan, Littlejohn, & Margaryan, 2013;
Shea & Bidjerano, 2010). But confidence may also indicate engagement: self-reports of
confidence “depen[d] on events that occurred in [solving] the previous problem and not on
[learners’] incoming beliefs” (Arroyo et al., 2009, n.p.). In subsequent testing of this model, we
will frame items to measure not only learners’ general confidence in a course, but their
confidence during or immediately after particular learning activities. Arroyo et al. (2009) used
physiological sensors and frequent self-report to create models of confidence (plus frustration,
excitement, and interest) for students interacting with an ITS to learn math. One kind of
confidence—belief in one’s ability to work with computers (called computer self-efficacy or
technical confidence [Conrad & Kanuka, 1999])— may be of particular relevance in blended and
online learning in which confidence in one’s technical abilities might facilitate engagement in or
reflect perceived success during computer-mediated activities.
Negative EE (NEG). Skinner and colleagues found emotional disengagement to be a
multidimensional construct consisting of enervated emotion (tiredness, sadness, boredom),
alienated emotion (frustration, anger), and pressured participation (anxiety; see Skinner,
Kindermann, & Furrer, 2009); D’Mello (2013) noted that frustration and boredom are critical in
learning with technology. We propose that NEG is comprised of three first order factors:

A CONCEPTUAL FRAMEWORK 29
boredom, frustration, and anxiety. This is a narrower configuration than Skinner and colleagues
employ. The emotions they group as enervated emotion—sadness, tiredness, and boredom—are
considered discrete emotions by other researchers (Russell, 2003; Segura & Gonzalez-Roma,
2003). In research to evaluate cognitive-affective states during TML, the unit of analysis is
usually the discrete emotion (boredom, not enervated emotion). We will employ the narrower
unit so that our framework may be applicable to such methodologies.
Baker et al. (2010) defined boredom as weariness or restlessness due to lack of interest.
Skinner, Kindermann, Connell, and Wellborn (2009) called boredom “a sufficient condition for
lack of effortful involvement” (p. 226). Such weariness and lack of involvement indicate the
absence of emotional energy towards learning. Boredom may threaten CE “by reducing cognitive
resources, undermining both intrinsic and extrinsic motivation, and promoting superficial
information processing” (Pekrun, 2011, p. 31).
In studying TML, Baker et al. (2010) found that boredom occurred during approximately
5% of the times examined as students interacted with different computer-based learning
environments. Though infrequent, once boredom settled in, it was an especially persistent
affective state that could “reduce learning more than other cognitive–affective states by leading
students to engage in gaming behaviors which are associated with poorer learning" (p.
236). Researching ITSs, Lehman, D'Mello, and Person (2008) labeled boredom "the least
productive state” (n.p.); frustration and confusion at least indicated investment in the learning
process. In his meta-analysis of the affective states experienced in TML environments, D’Mello
(2013) found that boredom and frustration were more likely in laboratory studies with simple
computer interfaces. In contrast, engagement was more frequent in studies conducted in authentic
learning contexts using advanced learning technologies (such as ITSs, animations and
A CONCEPTUAL FRAMEWORK 30
simulations, and immersive educational games) with enhanced interactivity and human-like
communication capabilities. Thus, preserving interaction and humanness may increase
engagement and decrease boredom and frustration.
Skinner, Kindermann, and Furrer (2009) grouped frustration and anger under the heading
of alienated emotion, whereas Pekrun and Linnenbrink-Garcia (2012) combined these two as
negative activating emotions. We will focus on frustration, the more common of the two during
learning with technology (D’Mello, 2013) and situate it as another first order factor in
NEG. When Dennerlein, Becker, Johnson, Reynolds, and Picard (2003) frustrated computer
users (through poor software usability), they found increased physical risk associated with
musculoskeletal and cardiovascular disorders. Baker et al. (2010) noted that frustration “may
lead students to use (or fail to use) learning environments in ways that reduce their
learning.” Even so, they acknowledged that frustration (and confusion—see below) “may be a
natural and unavoidable part of the experience of learning when difficult material is encountered .
. . a byproduct of positive learning experiences” (p. 235). They found that frustration and
confusion rarely led to gaming the system at levels caused by boredom, even titling an article
“Better to Be Frustrated than Bored.”
Anxiety is the last first order factor in our proposed NEG construct. Pekrun (2011)
explained that any emotion could deplete cognitive resources, but “resource consumption effect is
likely bound to emotions that have task-extraneous objects and produce task-irrelevant thinking,
such as worries about impending failure” (p. 27). Pekrun noted that on simple tasks anxiety may
not affect or may even enhance performance, but on complex or difficult tasks that demand
cognitive resources, learning is impaired (see p. 30). Thus anxiety may be most deleterious to
emotional and cognitive energy reserves in complex learning contexts.

A CONCEPTUAL FRAMEWORK 31
Regardless of the complexity of the learning task, some students may find nontraditional
settings like blended or online instruction to produce anxiety. Conrad (2010) described adult
learners beginning a completely online course: “Their anxiety level is universally high, even
among those who have already completed many online courses” (p. 220). Without a face-to-face
component, Conrad continued, “It is hard to demonstrate empathy without a facial nod or smile.
Words alone, which are all online educators have at their fingertips, often fail to convey a deep
sense of humanness” (p. 214). Hermes et al. (2009) found that female rats kept in isolation
developed 84 times as many mammary tumors as female rats in groups, along with increased
levels of stress hormones and anxious, fearful behavior (see also Pinker, 2014). If we too have
less anxiety when we are with other humans, the face-to-face component in BL becomes key to
reducing negative EE.
Researchers have debated whether confusion is a cognitive state, an emotion, or even an
affective state that is not an emotion (D’Mello, Lehman, Pekrun, & Graesser, 2014). Confusion
arises with cognitive disequilibrium, when incoming information does not seem to align with
existing knowledge structures (Graesser, Lu, Olde, Cooper-Pye, & Whitten, 2005). This can be
productive to learning, as D’Mello et al. (2014) noted: when “there is a discrepancy in the
information stream and the discrepancy is identified and corrected. . . , one important form of
deep learning occurs” (p. 155). D’Mello’s meta-analysis (2013) found confusion the second most
frequent emotion (of 17) among students interacting with learning technologies; thus we must
recognize its role in learner engagement. Thus far, researchers have found varied effect
depending on contextual details. When accompanied by enjoyment, curiosity, or confidence,
confusion spurs engagement and learning; when combined with boredom or frustration, it
correlates with disengagement and lower learning outcomes (Baker et al., 2010; D’Mello et al.,

A CONCEPTUAL FRAMEWORK 32
2014). Future research can investigate the interplay of confusion with other first order factors
such as frustration, boredom, and interest and whether confusion aligns more with POS or NEG.
EE is indispensable to the learning process, a “fuel” (Skinner & Pitzer, 2012, p. 33) for
high quality learning and the “antecedent of other components of engagement” (Pekrun &
Linnenbrick-Garcia, 2012, p. 260). The importance of emotion to cognition and learning is
conveyed by findings that human tutors spend at least as much time dealing with affective and
motivational goals as they do with cognitive and informational challenges (Lepper, Woolverton,
Mumme & Gurtner, 1993). The ability to deal with the emotions that arise during learning may
help explain why human tutors are “unrivaled in their ability to promote deep and lasting
learning” (Paul, 2014). Human actors are more adept at managing EE than are computers, but
that does not mean that computer-mediated resources are not sufficient or even more expeditious
to learning in certain situations. In BL environments, where the decisions to blend human- and
computer-mediated instruction must consider the effect upon learner engagement, instructional
designers need to understand when human-human interaction is necessary to maintain EE and
when computer-mediated resources are desirable.
Research can investigate how the affordances of BL impact EE. BL’s additional channels
for interactivity—with asynchronous online discussions increasing flexibility and opportunity for
reflection, and in-class interactions promoting spontaneity and human connection (Graham,
2006)—might result in “absolutely richer interaction” (Gedik, Kiraz, & Ozden, 2012, p. 108).
Improved personalization could increase interest and confidence while curtailing boredom,
frustration, or anxiety. Immediate feedback from online tools could lessen confusion, frustration,
and anxiety. On the other hand, BL may introduce barriers, such as increased workload or
technical difficulties (Gedik et al., 2012), which increase frustration, anxiety, and confusion.

A CONCEPTUAL FRAMEWORK 33
Conclusion
We began by mentioning three challenges to researching learner engagement in blended
settings. The dynamic nature of BL and the diverse ways of combining human- and technology-
mediated instruction make the ability to measure engagement under different conditions all the
more important. To do this, we need greater clarity about the definitions and constructs of
engagement. We have proposed a theoretical framework for learner engagement, grounded in
existing engagement literature and contextualized for blended settings, which can add conceptual
clarity and direction for future research. We have tried to maintain the distinction between
indicators and facilitators, for “research and intervention efforts require a clear demarcation
between these two” (Skinner et al., 2008, p. 766).
At times, however, the distinction is blurred. As noted, confidence may function as both
facilitator and indicator. We also considered including perceived relevance and perceived
challenge as cognitive indicators of engagement. A learner who perceives the relevance of a
learning activity may be further cognitively engaged (Assor, Kaplan, & Roth, 2002; Frazee, 2003;
Wang & Eccles, 2013), and relevance interventions can trigger interest in learning exercises
(Hulleman et al., 2010). In these examples perceived relevance precedes and facilitates. But the
reverse is also true: CE manifests itself in increased perception of relevance. O'Neill et al. (2015)
considered academic engagement to be indicated by four factors including intrinsic valuing and
motivation, measured using items that assessed relevance. However, early results from
experience sampling research being done by our team show relevance functioning as a facilitator
rather than an indicator of engagement.
Csikszentmihalyi’s theory of flow argues that a balance between perceived challenge and
learner skill is a critical factor to learner engagement (Csikszentmihalyi, 1990; Shernoff et al.,

A CONCEPTUAL FRAMEWORK 34
2003). Fredricks et al. (2005) found task challenge to be a significant predictor of cognitive
engagement, and the self-system process model contends that learners are more likely to be
engaged when they perceive optimal challenge on meaningful or enjoyable tasks (Connell &
Wellborn, 1991). Mahatmya, Lohman, Matjasko, and Farb (2012), using a bioecological theory
of human development and the person-environment fit perspective, listed three elements to their
conceptualization of CE: attention to task, mastery of task, and preference for challenging
tasks. In each of these propositions, the perception of an optimal level of challenge abets and
facilitates engagement. Though perceived relevance and perceived challenge are not included as
engagement indicators in our model, we believe they may be important facilitators of
engagement. We have some knowledge (and need more) about factors with potential to facilitate
BL engagement.
To assess the impact of these and other facilitators, we must know what indicates
engagement. We have proposed the same indicators for engagement in face-to-face and online
contexts, but this assumption must still be tested: does engagement manifest itself differently in
face-to-face settings than in online settings? Factor analysis research could determine whether,
for example, face-to-face curiosity and online curiosity are comparable in factor loadings and
estimated intercepts, or whether they are unique constructs.
At the same time, when examining BL engagement, we must also think beyond the
physical attributes of face-to-face and online instruction. As Graham (2013) noted, “[P]sycho-
social relationships are the issues at the core of BL research and design” (p. 346). We need to
better understand how engagement indicators are affected by human and by machine
interaction. In the first fMRI study to compare brain responses to live interactions versus
prerecorded ones, Redcay et al. (2010) found that live interaction sparked greater activity in brain

A CONCEPTUAL FRAMEWORK 35
regions associated with attention. What might be seen if researchers could likewise examine
brain activity in regions associated with curiosity, enjoyment, or anxiety? Is face-to-face human
interaction the gold standard (as often accepted) in encouraging learner engagement? Or are
some engagement indicators equally propelled by computer-mediated human interaction or even
by machine interaction, with its affordance of near-instant feedback in certain situations?
To answer such questions, research is needed not only at the completion of a blended
course, but throughout the course at the activity level. In future research we will use an end-of-
course survey to attempt to operationalize and test this framework, but will also compare the
results to log data and to experience-sampling surveys collected biweekly in blended courses.
Possibly engagement indicators function differently at the activity and course levels: confusion
noted in real time might be an indicator of focused engagement (D'Mello, et al., 2014), but
confusion recalled much later (e.g., in an end-of-course survey) might indicate residual frustration
and anxiety. By examining activity- and course-level engagement, we can study relationships
between intervention strategies (both human- and machine-driven), learning pathways, and
engagement (D’Mello & Graesser, 2012).
Blended contexts expand the methods for collecting data to measure engagement (Henrie,
et al., 2015), and this paper has referenced many ways of collecting data on various engagement
indicators. Due to both the complex nature of engagement and the differences inherent to
measuring it in multiple contexts, research on engagement in BL settings will often require mixed
methods for collecting data. Research on BL engagement ought to be increasingly real-time,
minimally intrusive, and maximally generalizable across various subject matter contexts. Yet
these aims sometimes conflict with one another or with the need for scalability. Experience-
sampling methods ask learners to report on both internal (thoughts, feelings, mood) and external

A CONCEPTUAL FRAMEWORK 36
(date, time, location, companions, activities) dimensions of specific experiences (Fleeson, 2007;
Hektner, Schmidt, & Csikszentmihalyi, 2007); this method results in considerable amounts of
quantitative and qualitative data but is fairly obtrusive. Collecting machine-generated log data is
unobtrusive, but interpretability regarding CE and EE is questionable. We look forward to
advances in BL engagement research that address these challenges.
This framework advances inquiry about BL engagement by establishing a set of indicators
rooted in theory and literature. At a time when learner engagement is considered “the holy grail
of learning” (Sinatra, Heddy, & Lombardi, 2015, p. 1) and interventions are touted for their
ability to improve engagement, we need a clear model from which to design and evaluate.
Though our model is only an outline of the principal factors indicating learner engagement, it is a
starting point with the potential to further our understanding of engagement in BL settings.

A CONCEPTUAL FRAMEWORK 37
References
Agarwal, R., & Karahanna, E. (2000). Time flies when you’re having fun: Cognitive absorption
and beliefs about information technology usage. MIS Quarterly, 24(4), 665–694.
Retrieved from http://www.jstor.org/stable/3250951
Ainley, M. (2012). Students’ interest and engagement in classroom activities. In S. L.
Christenson, A. L. Reschly, & C. Wylie (Eds.), Handbook of research on student
engagement (pp. 283–302). New York, NY: Springer. doi:10.1007/978-1-4614-2018-7
Appleton, J. J. (2012). Systems consultation: Developing the assessment-to-intervention link
with the Student Engagement Instrument. In S. L. Christenson, A. L. Reschly, & C.
Wylie (Eds.), Handbook of research on student engagement (pp. 725–741). New York,
NY: Springer. doi:10.1007/978-1-4614-2018-7
Appleton, J. J., Christenson, S. L., & Furlong, M. J. (2008). Student engagement with school:
Critical conceptual and methodological issues of the construct. Psychology in the
Schools, 45(5), 369–386. doi:10.1002/pits.20303
Appleton, J. J., Christenson, S. L., Kim, D., & Reschly, A. L. (2006). Measuring cognitive and
psychological engagement: Validation of the Student Engagement Instrument. Journal of
School Psychology, 44(5), 427–445. doi:10.1016/j.jsp.2006.04.002
Arnone, M. P., Small, R. V., Chauncey, S. A., & McKenna, H. P. (2011). Curiosity, interest and
engagement in technology-pervasive learning environments: A new research agenda.
Educational Technology Research and Development, 59(2), 181–198.
doi:10.1007/s11423-011-9190-9
Arroyo, I., Cooper, D. G., Burleson, W., Woolf, B. P., Muldner, K., & Christopherson, R.
(2009). Emotion sensors go to school. In V. Dimitrova, R. Mizoguchi, B. Du Boulay, &

A CONCEPTUAL FRAMEWORK 38
A. C. Graesser (Eds.), Artificial intelligence in education (pp. 17–24). Amsterdam, NL:
IOS Press.
Aspden, L., & Helm, P. (2004). Making the connection in a blended learning environment.
Educational Media International, 41(3), 245–252. doi:10.1080/09523980410001680851
Assor, A., Kaplan, H., & Roth, G. (2002). Choice is good, but relevance is excellent: Autonomy-
enhancing and suppressing teacher behaviours predicting students’ engagement in
schoolwork. British Journal of Educational Psychology, 72, 261–278.
doi:10.1348/000709902158883
Astin, A. W. (1984). Student involvement: A developmental theory for higher education. Journal
of College Student Personnel, 40(5), 518–529. Retrieved from
https://www.middlesex.mass.edu/tutoringservices/downloads/astininv.pdf
Atkinson, R. C., & Shiffrin, R. M. (1968). Human memory: A proposed system and its control
processes. In K. W. Spence & J. T. Spence (Eds.), The psychology of learning and
motivation (Vol. 2, pp. 89-195). New York, NY: Academic Press.
Azevedo, R. (2015, March). Defining and measuring engagement and learning in science:
Conceptual, theoretical, methodological, and analytical issues. Educational Psychologist,
50, 84-94. doi:10.1080/00461520.2015.1004069
Baker, R. S. J. d., D’Mello, S. K., Rodrigo, M. M. T., & Graesser, A. C. (2010). Better to be
frustrated than bored: The incidence, persistence, and impact of learners’ cognitive–
affective states during interactions with three different computer-based learning
environments. International Journal of Human-Computer Studies, 68(4), 223–241.
doi:10.1016/j.ijhcs.2009.12.003

A CONCEPTUAL FRAMEWORK 39
Bangert-Drowns, R. L., & Pyke, C. (2001). A taxonomy of student engagement with educational
software: An exploration of literate thinking with electronic text. Journal of Educational
Computing Research, 24(3), 213–234. doi:10.2190/0CKM-FKTR-0CPF-JLGR
Beck, J. E. (2004). Using response times to model student disengagement. Paper presented at the
ITS2004 Workshop on Social and Emotional Intelligence in Learning Environments,
Maceió, Alagoas, BR.
Berger, J. B., & Milem, J. F. (1999). The role of student involvement and perceptions of
integration in a causal model of student persistence. Research in Higher Education,
40(6), 641–664. Retrieved from
http://link.springer.com/article/10.1023/A%3A1018708813711
Berlyne, D. E. (1978). Curiosity and learning. Motivation and Emotion, 2(2), 97–175. Retrieved
from http://link.springer.com/article/10.1007/BF00993037
Bienkowski, M., Feng, M., & Means, B. (2012). Enhancing teaching and learning through
educational data mining and learning analytics: An issue brief. Washington, DC: SRI
International. Retrieved from http://www.ed.gov/edblogs/technology/files/2012/03/edm-
la-brief.pdf
Burkhardt, H., & Schoenteld, A. H. (2003). Improving educational research: Toward a more
useful, more influential, and better-funded enterprise. Educational Researcher, 32(9), 3-
14. doi:l0.3102/0013189X032009003
Calvo, R. A., & Mello, S. D. (2010). Affect detection: An interdisciplinary review of models,
methods, and their applications. IEEE Transactions on Affective Computing, 1(1), 18–37.
Retrieved from http://ieeexplore.ieee.org/xpls/abs_all.jsp?arnumber=5520655

A CONCEPTUAL FRAMEWORK 40
Campanelli, P. (2008). Testing survey questions. In E. D. de Leeuw, J. J. Hox, & D. A. Dillman
(Eds.), International handbook of survey methodology (pp. 176-200). New York, NY:
Lawrence Erlbaum Associates.
Carr, S. (2000, February 11). As distance education comes of age, the challenge is keeping the
students. The Chronicle of Higher Education, 46. Retrieved from
http://chronicle.com.erl.lib.byu.edu/article/As-Distance-Education-Comes-of/14334/
Chapman, C., Laird, J., & Kewalramani, A. (2011). Trends in high school dropout and
completion rates in the United States: 1972–2008. Population. Washington, DC.:
National Center for Educational Statistics.
Christenson, S. L., Reschly, A. L., & Wylie, C. (2012). Handbook of research on student
engagement. New York, NY: Springer. doi:10.1007/978-1-4614-2018-7
Coates, H. (2006). Student engagement in campus-based and online education: University
connections. New York, NY: Routledge.
Coates, H. (2007). A model of online and general campus-based student engagement. Assessment
& Evaluation in Higher Education, 32(2), 121–141. doi:10.1080/02602930600801878
Cocea, M., & Weibelzahl, S. (2011). Disengagement detection in online learning: Validation
studies and perspectives. IEEE Transactions on Learning Technologies, 4(2), 114–124.
doi:10.1109/TLT.2010.14
Conrad, D. L. (2010). Engagement, excitement, anxiety, and fear: Learners’ experiences of
starting an online course. The American Journal of Distance Education, 16(4), 205–226.
doi:10.1207/S15389286AJDE1604

A CONCEPTUAL FRAMEWORK 41
Conrad, D. L., & Kanuka, H. (1999). Learning in safety and comfort: Towards managing online
learning transactions. Paper presented at the Association for Advancement of Computers
in Education Conference, Seattle, WA. doi:10.1207/s15327752jpa8502
Connell, J. P., & Wellborn, J. G. (1991). Competence, autonomy and relatedness: A motivational
analysis of self-system processes. In M. Gunnar & L.A. Sroufe (Eds.), Minnesota
Symposium on Child Psychology: Vol. 23. Self processes in development (pp. 43-77).
Chicago, IL: University of Chicago Press.
Costello, A. B., & Osborne, J. W. (2005). Best practices in exploratory factor analysis: Four
recommendations for getting the most from your analysis. Practical Assessment,
Research & Evaluation, 10(7). Retrieved from http://pareonline.net/pdf/v10n7.pdf
Csikszentmihalyi, M. (1990). Flow: The psychology of optimal experience. New York, NY:
Harper-Perennial.
Davis, M. H., & McPartland, J. M. (2012). High school reform and student engagement. In S. L.
Christenson, A. L., Reschly, & C. Wylie (Eds.), Handbook of research on student
engagement (pp. 515-539). New York, NY: Springer.
Dennerlein, J., Becker, T., Johnson, P., Reynolds, C., Picard, R.W. (2003). Frustrating computer
users increases exposure to physical factors. Paper presented at the Proceedings of the
IEA, Seoul, Korea. Retrieved from
http://www.researchgate.net/publication/2832780_Frustrating_Computers_Users_Increas
es/file/60b7d528f8535cac39.pdf
Dewey, J. (1910). How we think. Boston, MA: D. C. Heath.
Diaz, D. P. (2002). Online drop rates revisited. The Technology Source. Retrieved from
http://technologysource.org/article/online_drop_rates_revisited/

A CONCEPTUAL FRAMEWORK 42
Dillman, D. A., Smith, J. D., & Christian, L. M. (2009). Internet, mail, and mixed-mode surveys:
The tailored design method (3rd ed.). Hoboken, NJ: John Wiley & Sons.
D’Mello, S. (2013). A selective meta-analysis on the relative incidence of discrete affective
states during learning with technology. Journal of Educational Psychology, 105(4),
1082–1099. doi:10.1037/a0032674
D’Mello, S., & Graesser, A. (2011). The half-life of cognitive-affective states during complex
learning. Cognition & Emotion, 25, 1299–1308.
D’Mello, S. K., & Graesser, A. (2012). AutoTutor and Affective AutoTutor: Learning by talking
with cognitively and emotionally intelligent computers that talk back. ACM Transactions
on Interactive Intelligent Systems, 2(4), 1–39. doi:10.1145/2395123.2395128
D’Mello, S. K., Jackson, G. T., Craig, S. D., Morgan, B., Chipman, P., White, H., Person, N.,
Kort, B., el Kaliouby, R., Picard, R., & Graesser, A. C. (2008). AutoTutor detects and
responds to learners affective and cognitive states. Workshop on Emotional and
Cognitive issues in ITS held in conjunction with Ninth International Conference on
Intelligent Tutoring Systems. Retrieved from http://141.225.218.248/web-
cslwebroot/emotion/files/dmello-affectwkshp-its08.pdf
D’Mello, S. K., Lehman, B., Pekrun, R., & Graesser, A. (2014). Confusion can be beneficial for
learning. Learning and Instruction, 29, 153–170. doi:10.1016/j.learninstruc.2012.05.003
D’Mello, S. K., Lehman, B. A., & Person, N. (2010). Monitoring affect states during effortful
problem solving activities. International Journal of Artificial Intelligence in Education,
20(4), 361-389.
Ekman, P. (1992). An argument for basic emotions. Cognition & Emotion, 6(3-4), 169-200.

A CONCEPTUAL FRAMEWORK 43
Esteban-Millat, I., Martínez-López, F. J., Huertas-García, R., Meseguer, A., & Rodríguez-
Ardura, I. (2014). Modelling students’ flow experiences in an online learning
environment. Computers and Education, 71, 111–123.
doi:10.1016/j.compedu.2013.09.012
Fabrigar, L.R., & Wegener, D. T. (2012). Exploratory factor analysis. New York, NY: Oxford
University Press.
Farragher, P., & Yore, L. D. (1997). The effects of embedded monitoring and regulating devices
on the achievement of high school students learning science from text. School Science
and Mathematics, 97(2), 87–95.
Filak, V. F., & Sheldon, K. M. (2008). Teacher support, student motivation, student need
satisfaction, and college teacher course evaluations: Testing a sequential path model.
Educational Psychology, 28(6), 711–724. doi:10.1080/01443410802337794
Finn, J. D. (1989). Withdrawing from school. Review of Educational Research, 59(2), 117–142.
Retrieved from http://rer.sagepub.com/content/59/2/117.short
Fleeson, W. (2007). Using experience sampling and multilevel modeling to study person-
situation interactionist approaches to positive psychology. In A. D. Ong & M. H. M. Van
Dulmen (Eds.), Oxford handbook of methods in positive psychology (pp. 487-500). New
York, NY: Oxford University Press.
Floyd, F. J., & Widaman, K. F. (1995). Factor analysis in the development and refinement of
clinical assessment instruments. Psychological Assessment, 7(3), 286–299.
doi:10.1037//1040-3590.7.3.286
Frazee, R. V. (2003). Using relevance to facilitate online participation in a hybrid course.
Educause Quarterly, 4, 67–69.

A CONCEPTUAL FRAMEWORK 44
Fredricks, J. A., Blumenfeld, P., Friedel, J., & Paris, A. (2005). School engagement. In What do
children need to flourish? Conceptualizing and measuring indicators of positive
development (pp. 419–446). doi:10.1207/s15327752jpa8502
Fredricks, J. A., Blumenfeld, P. C., & Paris, A. H. (2004). School engagement: Potential of the
concept, state of the evidence. Review of Educational Research, 74(1), 59–109. Retrieved
from http://rer.sagepub.com/content/74/1/59.short
Fredricks, J., McCo!skey, W., Meli, J., Mordica, J., Montrosse, B., & Mooney, K. (2011).
Measuring student engagement in upper elementary through high school: A description
of 21 instruments (Issues & Answers Report, REL 2011-No. 098). Washington, DC: U.S.
Department of Education, Institute of Education Sciences, National Center for Education
Evaluation and Regional Assistance, Regional Educational Laboratory Southeast.
Retrieved from http://www.talkgroups-mentors.org/pdfs/research/2011 Student
Engagement UNC.pdf
Fredrickson, B. L. (1998). What good are positive emotions? Review of General Psychology
2(3), 300–319. doi:10.1037/1089-2680.2.3.300
Fredrickson, B. L. (2001). The role of positive emotions in positive psychology: The broaden-
and-build theory of positive emotions. American Psychologist, 56(3), 218–226.
doi:10.1037/0003-066X.56.3.218
Furlong, M. J., Whipple, A. D., St. Jean, G., Simental, J., Soliz, A., & Punthuna, S. (2003).
Multiple contexts of school engagement: Moving toward a unifying framework for
educational research and practice. The California School Psychologist, 8, 99–113.
Gable, R. K. (1986). Instrument development in the affective domain. Boston, MA: Kluwer-
Nijhoff Pub.

A CONCEPTUAL FRAMEWORK 45
Garrison, D. R., Anderson, T., & Archer, W. (2001). Critical thinking, cognitive presence, and
computer conferencing in distance education. American Journal of Distance Education,
15(1), 7–23. doi:10.1080/08923640109527071
Garrison, D. R., & Kanuka, H. (2004). Blended learning: Uncovering its transformative potential
in higher education. The Internet and Higher Education, 7, 95–105.
doi:10.1016/j.iheduc.2004.02.001
Gedik, N., Kiraz, E., & Ozden, Y. (2012). The optimum blend: Affordances and challenges of
blended learning for students. Turkish Online Journal of Qualitative Inquiry, 3(3), 102–
117.
Gettinger, M. & Walte, M. J. (2012). Classroom strategies to enhance academic engaged time. In
S. L. Christenson, A. L., Reschly, & C. Wylie (Eds.), Handbook of research on student
engagement (pp. 653-673). New York, NY: Springer.
Ghani, J. A., & Deshpande, S. P. (1994). Task characteristics and the experience of optimal flow
in human-computer interaction. The Journal of Psychology, 128(4), 381–391.
doi:10.1080/00223980.1994.9712742
Graesser, A. C., Lu, S., Olde, B. a, Cooper-Pye, E., & Whitten, S. (2005). Question asking and
eye tracking during cognitive disequilibrium: comprehending illustrated texts on devices
when the devices break down. Memory & Cognition, 33(7), 1235–1247.
doi:10.3758/BF03193225
Graham, C. R., Henrie, C. R., & Gibbons, A. S. (2014). Developing models and theory for
blended learning research. In A. G. Picciano, C. D. Dziuban, & C. R. Graham (Eds.),
Blended learning: Research perspectives, Volume 2 (pp. 13–33). New York, NY:
Routledge.

A CONCEPTUAL FRAMEWORK 46
Graham, C. R. (2006). Blended learning systems: Definition, current trends, and future
directions. In C. J. Bonk & C. R. Graham (Eds.), The handbook of blended learning:
Global perspectives, local designs (pp. 3–21). San Francisco, CA: Pfeiffer Publishing.
Graham, C. R. (2013). Emerging practice and research in blended learning. In M. G. Moore
(Ed.), Handbook of distance education (3rd ed., pp. 333–350). New York, NY:
Routledge.
Graham, C. R., & Robison, R. (2007). Realizing the transformational potential of blended
learning: Comparing cases of transforming blends and enhancing blends in higher
education. In A. G. Picciano & C. D. Dziuban (Eds.), Blended learning: Research
perspectives (pp. 83–110). Needham, MA: The Sloan Consortium.
Graesser, A., & D’Mello, S. K. (2011). Theoretical perspectives on affect and deep learning. In
R. A. Calvo & S. K. D’Mello (Eds.), New perspectives on affect and learning
technologies (pp. 11–21). New York, NY: Springer. Retrieved from
http://link.springer.com/chapter/10.1007/978-1-4419-9625-1_2
Greene, B. A. (2015). Measuring cognitive engagement with self-report scales: Reflections from
over 20 years of research. Educational Psychologist, 50(1), 14–30.
doi:10.1080/00461520.2014.989230
Halverson, L. R., Graham, C. R., Spring, K. J., & Drysdale, J. S. (2012). An analysis of high
impact scholarship and publication trends in blended learning. Distance Education, 33(3),
37–41. doi:10.1080/01587919.2012.723166
A CONCEPTUAL FRAMEWORK 47
Halverson, L. R., Graham, C. R., Spring, K. J., Drysdale, J. S., & Henrie, C. R. (2014). A
thematic analysis of the most highly cited scholarship in the first decade of blended
learning research. The Internet and Higher Education, 20, 20–34.
doi:10.1016/j.iheduc.2013.09.004
Handelsman, M. M., Briggs, W. L., Sullivan, N., & Towler, A. (2005). A measure of college
student course engagement. The Journal of Education, 98(3), 184–191. Retrieved from
http://www.tandfonline.com/doi/abs/10.3200/JOER.98.3.184-192
Harzing, A. W. (2014). Publish or perish (Version 4) [Computer software]. Retrieved from
http://www.harzing.com/pop.htm
Hazlett, R. L., & Benedek, J. (2007). Measuring emotional valence to understand the user’s
experience of software. International Journal of Human-Computer Studies, 65(4), 306–
314. doi:10.1016/j.ijhcs.2006.11.005
Hektner, J. M., Schmidt, J. A., & Csikszentmihalyi, M. (2007). Experience sampling method:
Measuring the quality of everyday life. Thousand Oaks, CA: Sage.
Henrie, C. R., Halverson, L. R., & Graham, C. R. (2015). Measuring student engagement in
technology-mediated learning: A review. Computers & Education, 90, 36-53.
doi:10.1016/j.compedu.2015.09.005
Hermes, G. L., Delgado, B., Tretiakova, M., Cavigelli, S. a, Krausz, T., Conzen, S. D., &
McClintock, M. K. (2009). Social isolation dysregulates endocrine and behavioral stress
while increasing malignant burden of spontaneous mammary tumors. Proceedings of the
National Academy of Sciences of the United States of America, 106(52), 22393–22398.
doi:10.1073/pnas.0910753106

A CONCEPTUAL FRAMEWORK 48
Hidi, S. (1990). Interest and its contribution as a mental resource for learning. Review of
Educational Research, 60(4), 549–571. doi:10.3102/00346543060004549
Hidi, S., & Renninger, K. A. (2006). The four-phase model of interest development. Educational
Psychologist, 41(2), 111–127.
Hoffman, D. L., & Novak, T. P. (1996). Marketing in hypermedia computer-mediated
environments: Conceptual foundations. Journal of Marketing, 60(3), 50–68.
Hu, S., & Kuh, G. D. (2002). Being (dis)engaged in educationally purposeful activities: The
influences of student and institutional characteristics. Research in Higher Education,
43(5), 555-575.
Hughes, J. N., Luo, W., Kwok, O.-M., & Loyd, L. K. (2008). Teacher-student support, effortful
engagement, and achievement: A 3-year longitudinal study. Journal of Educational
Psychology, 100(1), 1–14. doi:10.1037/0022-0663.100.1.1
Hulleman, C. S., Godes, O., Hendricks, B. L., & Harackiewicz, J. M. (2010). Enhancing interest
and performance with a utility value intervention. Journal of Educational Psychology,
102(4), 880–895. doi:10.1037/a0019506
Hussain, M. S., AlZoubi, O., Calvo, R. A.,& D’Mello, S. K. (2011). Affect detection from
multichannel physiology during learning. In S. Bull & G. Biswas (Eds.), Proceedings of
the 15th International Conference on Artificial Intelligence in Education (pp. 131–138).
New York, NY: Springer.
James, W. (1890/1950). The principles of psychology. New York, NY: Dover.

A CONCEPTUAL FRAMEWORK 49
Janosz, M. (2012). Part IV commentary: Outcomes of engagement and engagement as an
outcome: Some consensus, divergences, and unanswered questions. In S. L. Christenson,
A. L., Reschly, & C. Wylie (Eds.), Handbook of research on student engagement (pp.
695-703). New York, NY: Springer.
Jayanti, R. K., McManamon, M. K., & Whipple, T. W. (2004). The effects of aging on brand
attitude measurement. Journal of Consumer Marketing, 21(4), 264–273.
Jimerson, S., Campos, E., & Greif, J. (2003). Toward an understanding of definitions and
measures of school engagement and related terms. The California School Psychologist, 8,
7–27. Retrieved from http://casel.org/wp-
content/uploads/CSP2003volume_81.pdf#page=9
Kahu, E. R. (2013). Framing student engagement in higher education. Studies in Higher
Education, 38(5), 758–773. doi:10.1080/03075079.2011.598505
Keller, J. M. (1987). Development and use of the ARCS model of motivational design. Journal
of Instructional Development, 10(3), 2–10.
Keller, J. M. (2008). First principles of motivation to learn and e3-learning. Distance Education,
29(2), 175–185. doi:10.1080/01587910802154970
Kelley, T. L. (1927). Interpretation of educational measurements. Yonkers, NY: World Book.
Kizilcec, R. F., Piech, C., & Schneider, E. (2013). Deconstructing disengagement: Analyzing
learner subpopulations in massive open online courses. In Proceedings of the Third
International Conference on Learning Analytics and Knowledge (pp. 170–179). Leuven,
Belgium: ACM.

A CONCEPTUAL FRAMEWORK 50
Klem, A. M., & Connell, J. P. (2004). Relationships matter: Linking teacher support to student
engagement and achievement. Journal of School Health, 74(7), 262–73. Retrieved from
http://www.ncbi.nlm.nih.gov/pubmed/15493703
Kong, S. C. (2011). An evaluation study of the use of a cognitive tool in a one-to-one classroom
for promoting classroom-based dialogic interaction. Computers & Education, 57(3),
1851–1864. doi:10.1016/j.compedu.2011.04.008
Kort, B., Reilly, R., & Picard, R. W. (2001). An affective model of interplay between emotions
and learning: Reengineering educational pedagogy—building a learning companion.
Proceedings of IEEE International Conference on Advanced Learning Technologies
(pp.43-46). Madison, WI.
Krause, K.-L., & Coates, H. (2008). Students’ engagement in first-year university. Assessment &
Evaluation in Higher Education, 33(5), 493–505. doi:10.1080/02602930701698892
Kuh, G. D. (2009, Spring). The national survey of student engagement: Conceptual and
empirical foundations. New Directions for Institutional Research, 141, 5–20.
doi:10.1002/ir
Kuh, G. D., Cruce, T. M., Shoup, R., Kinzie, J., Gonyea, R. M., & Gonyea, M. (2008).
Unmasking the effects of student engagement on first-year college grades and
persistence. The Journal of Higher Education, 79(5), 540–563.
Ladd, G. W., & Dinella, L. M. (2009). Continuity and change in early school engagement:
Predictive of children’s achievement trajectories from first to eighth grade? Journal of
Educational Psychology, 101(1), 190–206. doi:10.1037/a0013153

A CONCEPTUAL FRAMEWORK 51
Laumakis, M., Graham, C. R., & Dziuban, C. (2009). The Sloan-C pillars and boundary objects
as a framework for evaluating blended learning. Journal of Asynchronous Learning
Networks, 13(1), 75–87.
Lehman, B., D’Mello, S., & Graesser, A. (2012). Confusion and complex learning during
interactions with computer learning environments. The Internet and Higher Education,
15(3), 184–194. doi:10.1016/j.iheduc.2012.01.002
Lehman, B., D’Mello, S., & Person, N. (2008). All alone with your emotions: An analysis of
student emotions during effortful problem solving activities. Paper presented at the
Workshop on Emotional and Cognitive issues in ITS at the Ninth International
Conference on Intelligent Tutoring Systems. doi:10.1207/s15327752jpa8502
Lepper, M. R., Woolverton, M., Mumme, D. L., & Gurtner, J-L. (1993). Motivational techniques
of expert human tutors: Lessons for the design of computer-based tutors. In S. P. Lajoie
& S. J. Derry (Eds.), Computers as cognitive tools. Technology in education (pp. 75-105).
Hillsdale, NJ: Lawrence Erlbaum Associates, Inc.
Lewin, K. (1951). Field theory in social science. New York, NY: Harper & Brothers Publishers.
Loorbach, N., Peters, O., Karreman, J., & Steehouder, M. (2015). Validation of the Instructional
Materials Motivation Survey (IMMS) in a self-directed instructional setting aimed at
working with technology. British Journal of Educational Technology, 46(1), 204-218.
doi:10.1111/bjet.12138
Lopatovska, I., & Arapakis, I. (2011). Theories, methods and current research on emotions in
library and information science, information retrieval and human-computer interaction.
Information Processing and Management, 47(4), 575–592. doi:10.1016/j.ipm.2010.09.001

A CONCEPTUAL FRAMEWORK 52
Macfadyen, L. P., & Dawson, S. (2010). Mining LMS data to develop an “early warning system”
for educators: A proof of concept. Computers & Education, 54(2), 588–599.
doi:10.1016/j.compedu.2009.09.008
Mahatmya, D., Lohman, B. J., Matjasko, J. L., & Farb, A. F. (2012). Engagement across
developmental periods. In S. L. Christenson, A. L., Reschly, & C. Wylie (Eds.),
Handbook of research on student engagement (pp. 45-64). New York, NY: Springer.
Martin, A. J. (2007). Examining a multidimensional model of student motivation and
engagement using a construct validation approach. British Journal of Educational
Psychology, 77(2), 413–440. doi:10.1348/000709906X118036
McCormick, A. C., Gonyea, R. M., & Kinzie, J. (2013, May/June). Refreshing engagement:
NSSE at 13. Change: The Magazine of Higher Learning, 45(3), 6–15.
Mehl, M. R., & Conner, T. S. (2012). Handbook of research methods for studying daily life. New
York, NY: The Guilford Press.
Meyer, K. A. (2014). Student engagement in online learning: What works and why. ASHE
Higher Education Report, 40(6), 1–114. doi:10.1002/aehe.20018
Miller, B. W. (2015, March). Using reading times and eye-movements to measure cognitive
engagement. Educational Psychologist, 50, 31–42. doi:10.1080/00461520.2015.1004068
Miller, R. B., Greene, B. A., Montalvo, G. P., Ravindran, B., & Nichols, J. D. (1996).
Engagement in academic work: The role of learning goals, future consequences, pleasing
others, and perceived ability. Contemporary Educational Psychology, 21, 388–422.
Milligan, C., Littlejohn, A., & Margaryan, A. (2013). Patterns of engagement in connectivist
MOOCs. MERLOT Journal of Online Learning and Teaching, 9(2), 149–159.

A CONCEPTUAL FRAMEWORK 53
Milne, C., & Otieno, T. (2007). Understanding engagement: Science demonstrations and
emotional energy. Science Education, 91, 523–553. doi:10.1002/sce
Mishra, P., & Koehler, M. J. (2006). Technological pedagogical content knowledge: A
framework for teacher knowledge. Teachers College Record, 108(6), 1017-1054.
Moskal, P., Dziuban, C., & Hartman, J. (2012). Blended learning: A dangerous idea? The
Internet and Higher Education, 18, 15-23. doi:10.1016/j.iheduc.2012.12.001
Nelson Laird, T. F., & Kuh, G. F. (2005). Student experiences with information technology and
their relationship to other aspects of student engagement. Research in Higher Education,
46(2), 211–33.
Norberg, A., Dziuban, C. D., & Moskal, P. D. (2011). A time-based blended learning model. On
the Horizon, 19(3), 207-216. doi: 10.1108/1074 812 1111163913
NSSE. (2014, January). From benchmarks to engagement indicators and high-impact practices.
Bloomington, IN: National Survey of Student Engagement. Retrieved from
http://nsse.iub.edu/pdf/Benchmarks%20to%20Indicators.pdf
Nystrand, M., & Gamoran, A. (1991). Instructional discourse, student engagement, and literature
achievement. Research in the Teaching of English, 25(3), 261–290. Retrieved from
http://www.jstor.org/stable/10.2307/40171413
O’Brien, H. L., & Toms, E. G. (2008). What is user engagement? A conceptual framework for
defining user engagement with technology. Journal of the American Society for
Information Science and Technology, 59(6), 938–955. doi:10.1002/asi

A CONCEPTUAL FRAMEWORK 54
O’Neill, T. A., Deacon, A., Larson, N., Hoffart, G., Brennan, R., Eggermont, M., & Rosehart, W.
(2015). Life-long learning, conscientious disposition, and longitudinal measures of
academic engagement in engineering design teamwork. Learning and Individual
Differences, 39, 124–131. doi:10.1016/j.lindif.2015.03.022
Pajares, F. (1996). Self-efficacy beliefs and mathematical problem-solving of gifted students.
Contemporary Educational Psychology, 21, 325–344. doi:S0361476X96900259 [pii]
Parks, A. C., Schueller, S., & Tasimi, A. (2013). Increasing happiness in the general population:
Empirically supported self-help? In I. Boniwell & S. David (Eds.), Oxford handbook of
happiness. Oxford, UK: Oxford University Press.
Patrick, B. C., Skinner, E. A., & Connell, J. P. (1993). What motivates children’s behavior and
emotion? Joint effects of perceived control and autonomy in the academic domain.
Journal of Personality and Social Psychology, 65(4), 781–791. doi:10.1037//0022-
3514.65.4.781
Paul, A. M. (2014, September 17). Computer tutors that can read students’ emotions. Retrieved
from http://hechingerreport.org/content/computer-tutors-can-read-students-
emotions_17371/
Pekrun, R. (2011). Emotions as drivers of learning and cognitive development. In R. A. Calvo &
S. K. D’Mello (Eds.), New perspectives on affect and learning technologies (pp. 23–39).
New York, NY: Springer. Retrieved from http://link.springer.com/chapter/10.1007/978-
1-4419-9625-1_3
Pekrun, R., & Linnenbrink-Garcia, L. (2012). Academic emotions and student engagement. In n
S. L. Christenson, A. L., Reschly, & C. Wylie (Eds.), Handbook of research on student
engagement (pp. 259–282). New York, NY: Springer.

A CONCEPTUAL FRAMEWORK 55
Picard, R. W., Papert, S., Bender, W., Blumberg, B., Breazeal, C., Cavallo, D., … Strohecker, C.
(2004). Affective learning—A manifesto. BT Technology Journal, 22(4), 253–269.
doi:10.1023/B:BTTJ.0000047603.37042.33
Picciano, A. G. (2009). Blending with purpose: The multimodal model. Journal of Asynchronous
Learning Networks, 13(1), 7-18.
Pinker, S. (2014). The village effect: How face-to-face contact can make us healthier, happier,
and smarter. New York, NY: Spiegel & Grau.
Pintrich, P. R. (1999). The role of motivation in promoting and sustaining self-regulated
learning. International Journal of Educational Research, 31(6), 459–470.
doi:10.1016/S0883-0355(99)00015-4
Pintrich, P. R., & De Groot, E. V. (1990). Motivational and self-regulated learning components
of classroom academic performance. Journal of Educational Psychology, 82(1), 33–40.
doi:10.1037//0022-0663.82.1.33
Pintrich, P. R., Smith, D. A. F., Garcia, T., & McKeachie, W. J. (1991). A manual for the use of
the Motivated Strategies for Learning Questionnaire (MSLQ). Ann Arbor, MI: The
University of Michigan.
Pour, P. A., Hussein, S., AlZoubi, O., D’Mello, S., & Calvo, R. (2010). The impact of system
feedback on learners’ affective and physiological states. In J. Kay & V. Aleven (Eds.),
Proceedings of 10th International Conference on Intelligent Tutoring Systems (pp. 264–
273). Berlin, Germany: Springer-Verlag.
Ramesh, A., Goldwasser, D., Huang, B., Daum, H., & Getoor, L. (2013). Modeling learner
engagement in MOOCs using probabilistic soft logic. NIPS Workshop on Data Driven
Education.
A CONCEPTUAL FRAMEWORK 56
Redcay, E., Dodell-Feder, D., Pearrow, M. J., Mavros, P. L., Kleiner, M., Gabrieli, J. D. E., &
Saxe, R. (2010). Live face-to-face interaction during fMRI: A new tool for social
cognitive neuroscience. NeuroImage, 50(4), 1639–1647.
doi:10.1016/j.neuroimage.2010.01.052
Reeve, J. (2012). A self-determination theory perspective on student engagement. In S. L.
Christenson, A. L. Reschly, & C. Wylie (Eds.), Handbook of research on student
engagement (pp. 149–172). New York, NY: Springer.
Reeve, J. (2013). How students create motivationally supportive learning environments for
themselves: The concept of agentic engagement. Journal of Educational Psychology,
105(3), 579–595. doi:10.1037/a0032690
Reeve, J., & Tseng, C.-M. (2011). Agency as a fourth aspect of students’ engagement during
learning activities. Contemporary Educational Psychology, 36(4), 257–267.
doi:10.1016/j.cedpsych.2011.05.002
Reio, T. G., Petrosko, J. M., Wiswell, A. K., & Thongsukmag, J. (2006). The measurement and
conceptualization of curiosity. The Journal of Genetic Psychology, 167(2), 117–35.
doi:10.3200/GNTP.167.2.117-135
Renninger, K. A., & Bachrach, J. E. (2015, March). Studying triggers for interest and
engagement using observational methods. Educational Psychologist, 50, 58–69.
doi:10.1080/00461520.2014.999920
Reschly, A. L., & Christenson, S. L. (2012). Jingle, jangle, and conceptual haziness: Evolution
and future directions of the engagement construct. In S. L. Christenson, A. L. Reschly, &
C. Wylie (Eds.), Handbook of research on student engagement (pp. 3-19). New York,
NY: Springer.

A CONCEPTUAL FRAMEWORK 57
Ritzhaupt, A. D., Sessums, C., & Johnson, M. (2012). Where should educational technologists
publish their research? An examination of peer-reviewed journals within the field of
educational technology and factors influencing publication choice. Educational
Technology, 52(6), 47 – 56.
Robinson, J. (2010). Assessing the value of using an online discussion board for engaging
students. Journal of Hospitality, Leisure, Sport & Tourism Education, 10(1), 13–22. doi:
10.3794/johlste.101.257
Rowe, J. P., Shores, L. R., Mott, B. W., & Lester, J. C. (2011). Integrating learning, problem
solving, and engagement in narrative-centered learning environments. International
Journal of Artificial Intelligence in Education, 21(2), 115–133. doi:10.3233/JAI-2011-
019
Rumberger, R. W., & Rotermun, S. (2012). The relationship between engagement and high
school dropout. In S. L. Christenson, A. L., Reschly, & C. Wylie (Eds.), Handbook of
research on student engagement (pp. 491-513). New York, NY: Springer.
Russell, J. A. (2003). Core affect and the psychological construction of emotion. Psychological
Review, 110(1), 145–172. doi:10.1037/0033-295X.110.1.145
Sabourin, J., Mott, B., & Lester, J. (2011). Modeling learner affect with theoretically grounded
dynamic bayesian networks. In S. D’Mello, A. Graesser, B. Schuller, & J. Martin (Eds.),
Proceedings of the Fourth International Conference on Affective Computing and
Intelligent Interaction (pp. 286–295). Berlin, Germany: Springer-Verlag.
doi:10.1007/978-3-642-24600-5_32
Schraw, G. (2010). Measuring self-regulation in computer-based learning environments.
Educational Psychologist, 45(4), 258–266. doi:10.1080/00461520.2010.515936

A CONCEPTUAL FRAMEWORK 58
Schunk, D. H., & Mullen, C. A. (2012). Self-efficacy as an engaged learner. In S. L. Christenson,
A. L. Reschly, & C. Wylie (Eds.), Handbook of research on student engagement (pp.
219-235). New York, NY: Springer. doi:10.1007/978-1-4614-2018-7
Segura, S. L., & Gonzalez-Roma, V. (2003). How do respondents construe ambiguous response
formats of affect items? Journal of Personality and Social Psychology, 85(5), 956-968.
Seligman, M. E. P., Ernst, R. M., Gillham, J., Reivich, K., & Linkins, M. (2009). Positive
education: Positive psychology and classroom interventions. Oxford Review of
Education, 35(3), 293–311. doi:10.1080/03054980902934563
Senko, C., & Miles, K. M. (2008). Pursuing their own learning agenda: How mastery-oriented
students jeopardize their class performance. Contemporary Educational Psychology, 33,
561-583.
Shea, P., & Bidjerano, T. (2010). Learning presence: Towards a theory of self-efficacy, self-
regulation, and the development of a communities of inquiry in online and blended
learning environments. Computers & Education, 55(4), 1721–1731.
doi:10.1016/j.compedu.2010.07.017
Shernoff, D. J., Csikszentmihalyi, M., Schneider, B., & Shernoff, E. S. (2003). Student
engagement in high school classrooms from the perspective of flow theory. School
Psychology Quarterly, 18(2), 158–176.
Sinatra, G. M., Heddy, B. C., & Lombardi, D. (2015). The challenges of defining and measuring
student engagement. Educational Psychologist, 50(1), 1–13.
doi:10.1080/00461520.2014.1002924

A CONCEPTUAL FRAMEWORK 59
Skinner, E. A., & Belmont, M. J. (1993). Motivation in the classroom: Reciprocal effects of
teacher behavior and student engagement across the school year. Journal of Educational
Psychology, 85(4), 571–581.
Skinner, E., Furrer, C., Marchand, G., & Kindermann, T. (2008). Engagement and disaffection in
the classroom: Part of a larger motivational dynamic? Journal of Educational
Psychology, 100(4), 765–781. doi:10.1037/a0012840
Skinner, E. A., Kindermann, T. A., Connell, J. P., & Wellborn, J. G. (2009). Engagement and
disaffection as organizational constructs in the dynamics of motivational development. In
K. Wentzel & A. Wigfield (Eds.), Handbook of motivation at school (pp. 223–246).
Malwah, NJ: Erlbaum.
Skinner, E. A., Kindermann, T. A., & Furrer, C. J. (2009). A motivational perspective on
engagement and disaffection: Conceptualization and assessment of children’s behavioral
and emotional participation in academic activities in the classroom. Educational and
Psychological Measurement, 69(3), 493–525. doi:10.1177/0013164408323233
Skinner, E. A. & Pitzer, J. (2012). Developmental dynamics of student engagement, coping, and
everyday resilience. In S. L. Christenson, A. L. Reschly, & C. Wylie (Eds.), Handbook of
research on student engagement (pp. 21-44). New York, NY: Springer.
Star, S. L., & Griesemer, J. R. (1989). Institutional ecology, “translations” and boundary objects:
Amateurs and professionals in Berkeley's Museum of Vertebrate Zoology, 1907-39.
Social Studies of Science, 19(3), 387-420. doi:10.1177/030631289019003001
Stein, N. L., & Levine, L. J. (1991). Making sense out of emotion: The representation and use of
goal-structured knowledge. In Memories, thoughts, and emotions: Essays in honors of
George Mandler (pp. 295–322).

A CONCEPTUAL FRAMEWORK 60
Sun, J. C.-Y. (2013). Influence of polling technologies on student engagement: An analysis of
student motivation, academic performance, and brainwave data. Computers & Education,
72, 80-89. doi:10.1016/j.compedu.2013.10.010
Sun, J. C.-Y., & Rueda, R. (2012). Situational interest, computer self-efficacy and self-
regulation: Their impact on student engagement in distance education. British Journal of
Educational Technology, 43(2), 191–204. doi:10.1111/j.1467-8535.2010.01157.x
Tan, L., Sun, X., & Khoo, S. T. (2014). Can engagement be compared? Measuring academic
engagement for comparison. In International Conference on Educational Data Mining
(pp. 213–216). Retrieved from
http://educationaldatamining.org/EDM2014/uploads/procs2014/short papers/213_EDM-
2014-Short.pdf
Tellegen, A., & Atkinson, G. (1974). Openness to absorbing and self-altering experiences
(“absorption”), a trait related to hypnotic susceptibility. Journal of Abnormal Psychology,
83(3), 268–277. doi:10.1037/h0036681
Tempelaar, D. T., Niculescu, A., Rienties, B., Gijselaers, W. H., & Giesbers, B. (2012). How
achievement emotions impact students’ decisions for online learning, and what precedes
those emotions. The Internet and Higher Education, 15(3), 161–169.
doi:10.1016/j.iheduc.2011.10.003
Thorndike, E. L. (1913). An introduction to the theory of mental and social measurements (2nd
ed.). New York, NY: Teachers College, Columbia University.
Toyama, T., Sonntag, D., Orlosky, J., & Kiyokawa, K. (2015). Attention engagement and
cognitive state analysis for augmented reality text display functions. In IUI 2015 (pp.
322–332). Atlanta, GA: ACM Press. doi:10.1145/2678025.2701384

A CONCEPTUAL FRAMEWORK 61
Trevino, L. K., & Webster, J. (1992). Flow in computer-mediated communication: Electronic
mail and voice mail evaluation and impacts. Communication Research, 19, 539–573.
doi:10.1177/009365092019005001
Wang, Z., Bergin, C., & Bergin, D. A. (2014). Measuring engagement in fourth to twelfth grade
classrooms: The Classroom Engagement Inventory. School Psychology Quarterly, 29(4),
517–535. doi:10.1037/spq0000050
Wang, M.-T., & Eccles, J. S. (2013). School context, achievement motivation, and academic
engagement: A longitudinal study of school engagement using a multidimensional
perspective. Learning and Instruction, 28, 12–23. doi:10.1016/j.learninstruc.2013.04.002
Watson, D., & Clark, L. A. (1994). Emotions, moods, traits and temperaments: Conceptual
distinctions and empirical findings. In P. Ekman & R. J. Davidson (Eds.), The nature of
emotion: Fundamental questions (pp. 89–93). New York, NY: Oxford University Press.
Winne, P. H., & Baker, R. S. J. d. (2013). The potentials of educational data mining for
researching metacognition, motivation and self-regulated learning. Journal of
Educational Data Mining, 5(1), 1–8.
Witmer, B. G., & Singer, M. J. (1998). Measuring presence in virtual environments: A presence
questionnaire. Presence: Teleoperators and Virtual Environments, 7(3), 225-240.
Yazzie-Mintz, E. (2010). Charting the path from engagement to achievement: A report on the
2009 High School Survey of Student Engagement. Bloomington, IN: Center for
Evaluation & Education Policy.
Zimmerman, B. J. (2002). Becoming a self-regulated learner: An overview. Theory into Practice,
41(2), 64–70. doi: 0.1207/s15430421tip4102_2

A CONCEPTUAL FRAMEWORK 62
Zimmerman, B. J., & Kitsantas, A. (1997). Developmental phases in self-regulation: Shifting
from process goals to outcome goals. Journal of Educational Psychology, 89(1), 29–36.
doi:10.1037//0022-0663.89.1.29

Running Head: SCALE DEVELOPMENT TO MEASURE ENGAGEMENT 63
Article 2: Scale Development to Measure Learner Engagement
in Blended Learning Environments
SCALE DEVELOPMENT TO MEASURE ENGAGEMENT 64
Scale Development to Measure Learner Engagement
in Blended Learning Environments
Lisa R. Halverson, Ross A. A. Larsen, and Charles R. Graham
Brigham Young University

SCALE DEVELOPMENT TO MEASURE ENGAGEMENT 65
Abstract
Learner engagement correlates to student satisfaction, achievement, and persistence, outcomes
important to educators, students, and researchers. In the quest to improve learner engagement,
many have thought that the integration of face-to-face and online instruction—frequently called
blended or hybrid learning—might provide "the best of both worlds." However, determining
whether particular blended interventions actually lead to increased learner engagement requires
clear models and measures of engagement. Halverson and Graham (under review) recently
proposed the first theoretical framework to guide inquiry and practice into blended learning
engagement. This research was undertaken to operationalize and test their proposed model of
blended learning engagement using exploratory and confirmatory factor analysis. To do so a
new instrument to measure blended learning engagement was developed and the structural
validity investigated from a sample of 571 students from two universities in the Intermountain
Western United States. Results showed the related but nevertheless distinct nature of face-to-
face and online engagement. We also found that indicators considered behavioral in some
alternative models of engagement were empirically indistinguishable from cognitive indicators.
The instrument, the Blended Learning Course Engagement Survey, takes into account context
(online or face-to-face) and the cognitive and emotional aspects of learner engagement in such
settings. We discuss contributions this framework and scale can make to theory and pedagogy.
Keywords: learner engagement; cognitive engagement; emotional engagement; blended learning;
scale development; factor analysis
SCALE DEVELOPMENT TO MEASURE ENGAGEMENT 66
Introduction
Blended learning, defined as the integration of face-to-face and online instruction (Aspden
& Helm, 2004; Graham, 2006), is increasingly the norm in educational settings today (Murphy,
Snow, Mislevy, Gallagher, Krumm, & Wei, 2014; Picciano, Seaman, Shea, & Swan, 2012;
Staker, Chan, Clayton, Hernandez, Horn, & Mackey, 2011). However, since effective blending
can involve innumerable instantiations of human- and technology-mediated instruction,
practitioners and researchers alike are uncertain as to which blended designs most efficaciously
increase learner engagement.
Supporting learner engagement is no insignificant goal. Learner engagement—the
investment of cognitive and emotional energy to bring about a learning task (Halverson &
Graham, under review; Schunk & Mullen, 2012)—has been correlated with academic
achievement (Hughes, Luo, Kwok, & Loyd, 2008; Ladd & Dinella, 2009), student satisfaction
(Filak & Sheldon, 2008; Zimmerman & Kitsantas, 1997), and persistence (Berger & Milem,
1999; Kuh, Cruce, Shoup, Kinzie, Gonyea, & Gonyea, 2008). With such influence, it is not
surprising that learner engagement has been termed “the holy grail of learning” (Sinatra, Heddy,
& Lombardi, 2015, p. 1), “an educational bottom line” (Coates, 2006, p. 36). But no definition of
learner engagement is universally accepted at present, especially in the blended context, and
Henrie, Halverson, and Graham (2015) found confusion among the terms and operationalizations
of engagement in research that measured learner engagement in technology-mediated settings.
To advance research on the impact of blended designs on learner engagement, we require
greater theoretical and definitional clarity about blended learning engagement. To this end
Halverson and Graham (under review) examined existing literature on learner engagement,
identified constructs most relevant to blended learning, and proposed the first theoretical
SCALE DEVELOPMENT TO MEASURE ENGAGEMENT 67
framework for learner engagement in blended settings. They had been dissatisfied with existing
models of learner engagement in relation to blended learning. Models like the National Survey of
Student Engagement (NSSE; Kuh, 2009) and the Student Engagement Questionnaire (Coates,
2006), focused on institutional level engagement (Skinner & Pitzer, 2012), “a different reality
than engagement in the classroom or, even more circumscribed, in learning activities" (Janosz,
2012, p. 698). Other models ignored cognitive engagement (CE; see Skinner, Furrer, Marchand,
& Kindermann, 2008 and Skinner, Kindermann, & Furrer, 2009). Across the existing models
they found confusion in definitions and constructs (see also Henrie, Halverson, & Graham, 2015).
No theoretical framework existed that was appropriate for blended learning engagement.
Thus Halverson and Graham (under review) proposed a new model, arguing that the most
fundamental indicators of engagement are those that demonstrate learner investment of mental
and emotional energy in the learning process (see also Astin, 1984; Janosz, 2012; Schunk &
Mullen, 2012). Some models of learner engagement include behavioral engagement, but
Halverson and Graham argued that behavioral factors are actually outward displays of the
underlying cognitive and emotional energies that fuel learning. Their model suggested that
cognitive engagement (CE) is composed of attention, effort and persistence, time on task,
cognitive strategy use, absorption, and curiosity (see Figure 1). The first three factors were
theorized to indicate quantity of CE, while the last three were thought to indicate quality.

SCALE DEVELOPMENT TO MEASURE ENGAGEMENT 68
Figure 1. Theoretical Model of Cognitive Engagement. Attention, effort and persistence, and time on task were theorized to indicate the quantity of cognitive engagement, while cognitive strategy use, absorption, and curiosity were thought to indicate its quality.
Emotional engagement (EE), Halverson and Graham proposed, consists of positive energy
indicators, including interest and enjoyment, happiness, and confidence, along with negative
energy indicators such as boredom, frustration, and anxiety (see Figure 2). They noted research
suggesting that confusion may indicate positive or negative energy, depending on the concurrent
emotions. When interest is present, confusion may accompany increased EE, but when boredom
or frustration is present, confusion decreases EE and may lead to gaming the system or otherwise
disengaging (Baker, D’Mello, Rodrigo, & Graesser, 2010; D’Mello, Lehman, Pekrun, &
Graesser, 2014). Halverson and Graham advocated further research to determine the place of
confusion in the theoretical model.

SCALE DEVELOPMENT TO MEASURE ENGAGEMENT 69
Figure 2. Theoretical Models of Emotional Engagement (Positive and Negative). The factor of Confusion was left unattached, for confusion affects engagement and learning differently depending on contextual details.
Halverson and Graham’s engagement framework (under review) was grounded in
engagement literature, applied to the affordances of blended learning, and presented as a
theoretical construct paper. Our goal was to empirically test this model by developing and
testing the structural validity of an instrument based on its framework of learner engagement.
Method
The present study operationalized Halverson and Graham’s proposed model of blended
learning engagement (currently under review) through an end-of-course survey. While survey
methodology is not the only, or perhaps even the best, way to measure learner engagement, it is
the most common (Henrie, Halverson, & Graham, 2015). The survey probed each theoretical
subconstruct using question pairs that applied each to face-to-face and online modalities.
Item Generation
Halverson and Graham (under review) drew upon a vast array of existent literature to
form their theoretical model of learner engagement in blended settings. Their review of the
engagement literature and consideration of the affordances of blended contexts provided strong
content validity on which to base our scale. To operationalize the theorized constructs and

SCALE DEVELOPMENT TO MEASURE ENGAGEMENT 70
generate items for our scale, we consulted various related instruments. Table 1 gives a partial list
of sources we consulted in generating items. We found that very few of the items matched our
purposes without alteration. For example, we appreciated Skinner and colleagues’ model of
engagement, but felt its lack of a cognitive factor neglected one of the most significant aspects of
engagement. We corresponded with their research team and learned that, although they felt CE
was “worthy of investigating,” they did not “yet have measures to capture the cognitive
component, and aren't actively working on developing them at this time” (J. Pitzer, personal
communication, January 6, 2014). They did, however, share with us the alterations they had
made to their existing scales, which are usually implemented in K-12 settings, in order to fit a
higher education context.

SCALE DEVELOPMENT TO MEASURE ENGAGEMENT 71
Table 1
Sources Consulted in the Development of Items
Construct & Subconstruct
Sources Consulted in Item Development
Cognitive Engagement Attention Chi and Skinner (personal communication, January 20, 2014)
Dornbusch and Steinberg (1990) Skinner, Kindermann, and Furrer (2009)
Effort and Persistence Oliver (2007) Finn, Boyd-zaharias, Fish, and Gerber (2007) Pintrich, Smith, Garcia, and McKeachie (1991)
Time on Task Dornbusch and Steinberg (1990) Pintrich, Smith, Garcia, and McKeachie (1991)
Cognitive and Metacognitive Strategy Use
Mokhtari and Reichard (2002) Pintrich, Smith, Garcia, and McKeachie (1991) Wolters (2004)
Absorption No direct sources, but based on Csikszentmihalyi (1990) Curiosity Agawal and Karahanna (2000) Positive Emotional Engagement Enjoyment/Situational Interest Chi and Skinner (personal communication, January 20, 2014)
Singh, Granville, and Dika (2002) Skinner, Kindermann, and Furrer (2009)
Happiness Skinner, Kindermann, and Furrer (2009) Confidence Pintrich, Smith, Garcia, and McKeachie (1991) Negative Emotional Engagement Boredom Chi and Skinner (personal communication, January 20, 2014)
Skinner, Kindermann, and Furrer (2009) Frustration Chi and Skinner (personal communication, January 20, 2014)
Skinner, Kindermann, and Furrer (2009) Anxiety Chi and Skinner (personal communication, January 20, 2014)
Martin (2009) Pintrich, Smith, Garcia, and McKeachie (1991) Skinner, Kindermann, and Furrer (2009)
Confusion No direct sources. D’Mello (2013) finds that confusion is one of the most frequent emotions when learning with technology.
SCALE DEVELOPMENT TO MEASURE ENGAGEMENT 72
The most significant needs we found to alter or invent items developed because existing
surveys of learner engagement fail to address both the face-to-face and online settings included
in blended learning. Most investigate only face-to-face settings, although some instruments that
measure engagement in face-to-face contexts have been adapted for online use (Rowe, Shores,
Mott, Lester, & Carolina, 2011; Sun & Rueda, 2012). The widely used NSSE has been applied
to online settings (Henrie, Halverson, & Graham, 2015), but as stated earlier its focus is
primarily institutional-level engagement, and thus it does not help us understand course- and
activity-level interventions. Most existing engagement instruments contain numerous items that
transfer poorly to blended contexts; thus revalidation of any adapted items has been required.
Halverson and Graham (under review) proposed that the same constructs indicate engagement in
face-to-face and online contexts, but acknowledged that this assumption must be tested and that
engagement might manifest itself differently in the two settings. We created paired questions
with similar wording to inquire about engagement during face-to-face and online learning
experiences. For example, to measure absorption, a CE indicator, we included the following
pair: “I became absorbed in face-to-face learning activities for this course” and “I became
absorbed in online learning activities for this course.” We developed multiple items probing
each CE and EE factor.
To collect formative feedback, 57 students in a blended world civilization course taught
by the first author were invited on the last day of class to complete a pilot version of the
instrument. Though not enough data were collected for a full exploratory factor analysis (EFA)
or confirmatory factor analysis (CFA), the results were informative for improving the individual
items, the model, and the overall instrument before our full-scale data collection. We decided to
avoid using bipolar and unipolar items in the same survey, especially regarding the same

SCALE DEVELOPMENT TO MEASURE ENGAGEMENT 73
constructs. First, consistency in response categories is advisable for respondent clarity and later
ease of analysis. Additionally, only some of the bipolar items in the original instrument featured
opposite constructs that were both of interest to our model (e.g., boredom and interest). Other
bipolar items included an opposite construct not relevant to our work. For example, items asked
students to rate their level of confusion/clarity during a variety of learning activities, but
Halverson and Graham’s theoretical framework only features confusion, not clarity. This
formative process helped us refine our end-of-course survey items.
We next conducted cognitive interviews (Campanelli, 2008; Dillman, Smith, & Christian,
2009) to ensure that the items would be understood by potential respondents. We administered
the revised instrument to undergraduates at one of the universities where the instrument would be
utilized. Those students were asked to think aloud as they considered each item, and two
graduate students took notes on their reflections. Based on student comments, we revised the
wording of a number of items to improve the clarity and intended interpretation of each.
In the revised instrument (see Appendix), most of the first order engagement factors were
represented by three question pairs each, though time on task featured only two item pairs, and a
few constructs featured four pairs. Eight items inquiring about perceived challenge and
perceived relevance were present in the survey but excluded from the framework and the
analysis that follows. Pairs were similarly worded questions that inquired into face-to-face and
online contexts: for example, “Describe your level of attentiveness in face-to-face class” and
“Describe your level of attentiveness during online work for this course.” Response format
collected categorical data using a five point Likert-type scale ranging from 1 (never) to 5 (all the
time) or other five-response variations such as 1 (not at all interested) to 5 (extremely interested).
To decrease the likelihood of response acquiescence (Jayanti, McManamon, & Whipple, 2004),
SCALE DEVELOPMENT TO MEASURE ENGAGEMENT 74
some items were negatively stated; these items were subsequently reverse-scored before we
proceeded with data analysis.
Data Collection
The target population consisted of undergraduate students in blended courses at two four-
year universities in the Intermountain West. Blended learning designs varied, and subject matter
covered topics from finance and chemistry to nursing and the humanities, as we hoped to develop
an instrument measuring learner engagement across various disciplines and blends. Most courses
were three-unit general education and introductory courses, neither upper-level nor specialized.
At the end of fall 2014, we emailed an invitation to potential participants from 11 blended
courses to participate in the end-of-course learner engagement survey, requiring approximately
10-15 minutes. Some students were part of a larger research study that also collected log data,
experience sampling responses, and learner characteristics; others were solicited only for the
end-of-course engagement survey. We utilized an implied consent format for their participation
and we collected no identifying information. Students were emailed a link to the online survey
in Qualtrics, an online survey software platform. Some professors requested that students not
receive the survey until final exams had concluded; thus vacations may have reduced response
rate in such classes. Response rate varied by class from 14% to 63%; thus results may not be
fully generalizable as we have no simple way of determining whether there was a pattern of
missingness. A total of 571 students began the survey, though some failed to complete all
questions.
Analysis
This research used factor analysis “to examine empirically the interrelationships among
the items and to identify clusters of items that share sufficient variation to justify their existence
SCALE DEVELOPMENT TO MEASURE ENGAGEMENT 75
as a factor or construct to be measured by the instrument” (Gable, 1986, p. 85). Halverson and
Graham’s (under review) proposed theoretical framework and the corresponding instruments are
new and untested, though grounded in the learner engagement literature. Using Mplus version
7.31, we ran an initial CFA to test the theoretical framework. Since model fit was not ideal, we:
(a) randomly sampled half of the data, with the remaining data used for validation, (b) ran an
EFA and a series of CFAs on the training dataset, and (c) ran the final model on the validation
set. EFA allowed us “to identify the underlying dimensions of a domain of functioning, as
assessed by a particular measuring instrument” (Floyd & Widaman, 1995, p .286), and additional
CFAs allowed us to “examin[e] the derived constructs in light of the theoretical predictions that
follow from the literature review and the operational definitions of the targeted categories . . .”
(Gable, 1986, p. 87). Our goal was to find models for CE and EE that displayed good model fit
and were comprised of constructs with both convergent and discriminant validity.
Results
Descriptive Statistics
Excluding a few items dropped for reasons explained below, the mean scores of all items
ranged from 2.13 to 4.09, and the standard deviations ranged from .777 to 1.349. The skew
indices ranged from -.849 to .856, and the kurtosis indices from -1.258 to .835. The data in this
study were considered to be univariate normal based on Kline’s (2011) recommendations that
values around .70 are “adequate,” those around .80 are “very good,” and those around .90 are
“excellent” (p. 70).
Cognitive Engagement
Halverson and Graham (under review) proposed that CE is composed of attention, effort
and persistence, time on task, cognitive strategy use, absorption, and curiosity. In order to reach

SCALE DEVELOPMENT TO MEASURE ENGAGEMENT 76
our goal of good model fit with constructs displaying convergent and discriminant validity, we
tested five models, described in further detail below. Our first model, CE Model 1, was based on
Halverson and Graham’s theoretical constructs and did not separate indicators by context, but
this had poor model fit. A subsequent EFA showed context as the clearest element in factor
structure, so we decided to test face-to-face indicators only, select the best-fitting models, and
then use invariance testing across context to determine whether the online indicators were
comparable. We tested a five-factor model based on the theoretical first order factors (CE Model
2). Although model fit was good, several factors lacked discriminant validity. We respecified
the models to take factor intercorrelations into account, and then tested two two-factor models
featuring the constructs of focused attention and curiosity (CE Model 3), and effort and flow (CE
Model 4). These showed very similar model fit. Considering the several high factor
intercorrelations, a single factor model (CE Model 5) was tested, but did not display acceptable
model fit and was rejected.
Initial confirmatory factor analysis. Since our scale was based upon a substantive
theoretical framework, we chose to run an initial CFA (CE Model 1 in Table 2) using our entire
sample set (n = 558) to test the strength of the CE framework. Halverson and Graham (under
review) did not make a definitive claim about the effect of context, but wrote: “We have
proposed the same indicators for engagement in face-to-face and online contexts, but this
assumption must still be tested: does engagement manifest itself differently in face-to-face
settings than in online settings?” Thus in these initial CFAs we ran the models without the
context condition, that is allowing all items purported to measure attention, for example, to be
grouped under the first order construct attention, without dividing them into online attention and
face-to-face attention. Then all the first order constructs were specified to measure a second

SCALE DEVELOPMENT TO MEASURE ENGAGEMENT 77
order factor, CE. The model was estimated using weighted least squares (WLSMV)—useful for
categorical data as well as smaller sample sizes (Brown, 2006). However, we also compared
factor loadings estimated using WLSMV and MLR; results were similar, suggesting that there
was no method effect and that our data was missing completely at random (MCAR; the
probability of having missing data is unrelated to the value of the measured variable or any other
measured variable). While the second order factor CE had significant loadings from all first
order factors (all standardized loadings above .900 except curiosity [CUR] at .736), within the
first order factors the face-to-face and online items differed in their measurement sensitivity,
with online items loading much lower than their face-to-face equivalents. For example, the item
ATT_F3 loaded onto attention (ATT) at .844, while its online counterpart, ATT_O3, loaded at
.476. Online items also had weaker R2 estimates than did their face-to-face counterparts. Model
fit is often considered good when within these parameters: RMSEA < .08 (Browne & Cudeck,
1993; Byrne, 2013; MacCallum, Browne, & Sugawara, 1996), CFI > .95 (Hu & Bentler, 1998,
1999), and TLI > .90 (Wang & Wang, 2012). According to these standards, our model fit was
poor for CE when context was not taken into account (RMSEA = .125, CFI = .630, TLI = .591).
The Chi-square test of model fit was χ2 = 5675.487 (df = 588). These results suggested that this
model had been misspecified and needed to be modifyied.
We also concluded that the first order factor of time on task should be dropped. First, all
the indicators had particularly low factor loadings, suggesting that the construct could not be
measured well using the data. The time construct only contained two question pairs. One pair
asked, “How often did you spend the expected amount of time in face-to-face class/completing
online work for this course?” These questions may have had different meanings to students
based on the course blend, as some sections required face-to-face time and others made

SCALE DEVELOPMENT TO MEASURE ENGAGEMENT 78
classroom fathering an optional workshop experience. The face-to-face item, though still within
bounds of univariate normalcy, had the highest mean (4.44) and kurtosis index (3.090) as well as
the lowest skew index (-1.919). For these reasons, while time on task may still indicate CE, we
removed the time items from subsequent analyses discussed here.
Exploratory factor analysis. To analyze the 32 remaining CE items, we first randomly
divided the total sample into two split-half samples using the Statistical Package for the Social
Sciences (SPSS, version 22). We tested the factorability of the data using Bartlett’s test of
sphericity (Bartlett, 1954), and then examined the sampling adequacy using the Kaiser-Meyer-
Olkin (KMO) test (Kaiser, 1958). Findings indicated a significant test for Bartlett’s test of
sphericity (χ2 (496) = 3942.786, p < 0.001) and a KMO value of 0.862, indicating that the data
were suitable for structure detection (Tabachnick & Fidell, 1989). Subsequently we used Mplus
version 7.31 to carry out an exploratory factor analysis with an oblique geomin rotation and, with
the indicators declared categorical, a WLSMV estimation of the first split-half sample (n = 290).
This result suggested seven factors with eigenvalues over 1.0 (Kaiser’s eigenvalue-greater-than-
one rule). A scree plot inspection, on the other hand, suggested three or four factors. We also
considered the interpretability of different factor solutions. Specifically, the two-factor structure
suggested a face-to-face CE factor reflected by all 16 items inquiring into the face-to-face
context and an online CE factor reflected by all 16 items inquiring into the online context. These
two factors were correlated (r = .177, p < .01). All face-to-face items but one (ABS_F2) had
standardized loadings greater than .500 (p < .001), but again the online items had a unique
pattern, with standardized loadings generally lower than their face-to-face pairs, ranging from
.271 (RATT_O2) to 847 (ABS_O3), all significant (p < .001). The three- and four-factor
structures again suggested the face-to-face and online CE factors as the first and second factors,

SCALE DEVELOPMENT TO MEASURE ENGAGEMENT 79
but the third and fourth factors crossed context boundaries, clustering face-to-face and online
curiosity, for example. Additionally, the third and fourth factors were less interpretable overall
and included items that double-loaded on the first two factors.
Clearly, these exploratory factor analyses pointed to a strong context effect. Online and
face-to face engagement appeared to be unique though correlated constructs. In our next step,
using CFA we first tested a few variations of our model using face-to-face items only.
Confirmatory factor analysis of face-to-face CE items. We ran several CFAs on the
same half of the sample employed for the EFAs. To establish the validity of the scale, we
conducted a first order CFA (CE Model 2 in Table 2) on the data. Since we had decided to
eliminate the time-on-task factor from our analysis, we hypothesized a correlated five-factor CE
measurement model (Figure 3). Results suggested a good fit: RMSEA = .069, CFI = .977, and
TLI = .971. All indicators measured their respective factors fairly well, with all standardized
parameters estimates ranging from .623 to .932 (p < .001) except for one (ABS_F2, .435).
However, the factor intercorrelations (.688-.994) suggested that some of our first order factors
lacked discriminant validity (Kline, 2011). The one first order factor with most noticeable
discriminant validity was curiosity, which had factor intercorrelations of .688 to .755, except
with absorption (r = .851).

SCALE DEVELOPMENT TO MEASURE ENGAGEMENT 80
Figure 3. Face-to-Face CE Model 2, with five first order factors: attention, effort and persistence, cognitive strategy use, absorption, and curiosity.
Thus we next hypothesized a correlated two-factor CE measurement model (CE Model 3
in Table 2) with focused attention (FOC_F, specified by attention, effort and persistence,
cognitive strategy use, and absorption indicators) and curiosity (CUR_F) (Figure 4). Results
suggested an acceptable fit: RMSEA = .085, CFI = .962, and TLI = .956. Indicators measured
their respective factors fairly well (.412 to .855 for FOC_F, .750 to .874 for CUR_F, p < .001).
The intercorrelation between focused attention and curiosity was acceptable (.793, p < .001).
Figure 4. Face-to-Face CE Model 3, with two first order factors: focused attention (FOC) and curiosity (CUR).
However, Halverson and Graham, drawing upon the theory of flow (Csikszentmihalyi,
1990), argued that deep concentration or absorption and curiosity might be closely related. As

SCALE DEVELOPMENT TO MEASURE ENGAGEMENT 81
well, the highest factor intercorrelation for curiosity was with absorption (.851). For these
reasons, we tried one more variation of the model (CE Model 4 in Table 2). A factor we labeled
effort (EFF_F) was specified by attention, effort and persistence, and cognitive strategy use
indicators. A second factor, designated as flow (FLO_F), was specified by indicators of
absorption and curiosity (Figure 5). Results for this correlated two-factor model were similar to
those in CE Model 3: RMSEA = .083, CFI = .964, and TLI = .958. Indicators measured their
respective factors fairly well (.609 to .862 for EFF_F, .440 to .943 for FLO_F, p < .001). The
intercorrelation between face-to-face effort and flow was just barely above acceptable levels
(0.852, p < 0.001).
Figure 5. Face-to-Face CE Model 4, with two first order factors: effort (EFF) and flow (FLO).
Because of these high factor intercorrelations, we tested a one-factor model (CE Model 5
in Table 2) that might suggest that respondents perceived all items to belong to a unidimensional
construct (Figure 6). Model fit was less robust than either two-factor model (RMSEA = .102,
CFI = .946, TLI = .937), and we rejected the single-factor model. Since at least three indicators
are expected in order to have reliable latent constructs (Worthington & Whittaker, 2006), we did
not test a second order model of CE. A bifactor model did not achieve convergence.

SCALE DEVELOPMENT TO MEASURE ENGAGEMENT 82
Figure 6. Face-to-Face CE Model 4, a single factor model in which all indicators load on CE.
Thus we had two comparable two-factor models, one with factors of focused attention
and curiosity and another with factors of effort and flow. The intercorrelation between the
factors of the latter model was higher than desirable, but we wondered whether introducing the
online items might introduce differences.

SCALE DEVELOPMENT TO MEASURE ENGAGEMENT 83
Table 2
Summary of Goodness-of-Fit Indices for Alternative Models of Face-to-Face Cognitive
Engagement
Goodness-of-Fit Measures Model CFI TLI RMSEA Comments
Optimal values > .950a > .950b < .060c CE Model 1 (Theoretical, without context factor)
.630 .591 .125 Context factor necessary
CE Model 2 (5 first order factors) .977 .971 .069 Lacks discriminant validity
CE Model 3 (2 first order factors, FOC and CUR)
.952 .956 .085 Is curiosity an indicator or facilitator?
CE Model 4 (2 first order factors, EFF and FLO)
.964 .958 .083 r = .852 between EFF and FLO
CE Model 5 (single factor model) .946 .937 .102 Rejected due to poor fit CE Model 3a (Cross-validation of FOC and CUR)
.938 .931 .053
CE Model 4a (Cross-validation of EFF and FLO)
.939 .931 0.053
Note. CFI = comparative fit index; TLI = Tucker-Lewis index; RMSEA = root mean square error of approximation. a Hu and Bentler (1998, 1999). b Wang and Wang (2012). c Browne and Cudeck (1993), Byrne (2013), MacCallum, Browne, and Sugawara (1996).
Invariance testing across context. We next began to test whether the two-factor CE
models established using the face-to-face items would also apply to the online items.
Measurement invariance (also called measurement equivalence) is often used to determine
whether a particular measure is perceived in a conceptually similar manner by respondents from
different groups. In our case, we wanted to know whether online indicators and face-to-face
indicators of engagement were being interpreted as equivalent by respondents. Thus we
performed an analysis of measurement invariance to determine whether the face-to-face and
online items were comparable in factor loadings and estimated intercepts, and used the Satorra-

SCALE DEVELOPMENT TO MEASURE ENGAGEMENT 84
Bentler Scaled Chi-Square Difference Test to analyze the differences in chi-square and degrees
of freedom between the configural and weak measurement invariance models. Errors of similar
items were allowed to be correlated in these models due to the content similarities between face-
to-face and online items.
The online and face-to-face versions of CE Model 3 (focused attention and curiosity) had
configural invariance. Model fit was RMSEA = .053, CFI = .948, TLI = .941, χ2 = 802.829 (df =
442). Weak measurement invariance across context was not achieved: The weak measurement
model including face-to-face and online factors had fit of RMSEA = .059, CFI = .933, TLI =
.928, χ2 = 915.036 (df = 456). The resulting chi-square difference was 87.156 (df = 14, p < .001).
Similarly, the online and face-to-face versions of CE Model 4 (effort and flow) had configural
invariance. Model fit was RMSEA = .049, CFI = .955, TLI = .949, χ2 = 753,551 (df = 442).
Once again weak measurement invariance across context was not achieved: The weak
measurement model including face-to-face and online factors had fit of RMSEA = .055, CFI =
.942, TLI = .937, χ2 = 857.336 (df = 456). The resulting chi-square difference was 79.720 (df =
14, p < .001). The fact that neither model achieved weak measurement invariance suggests that
face-to-face engagement indicators are not equivalent to online engagement indicators. This
means that, for example, focused attention displayed in a face-to-face context is somehow
different than focused attention shown in an online one. Flow perceived in a face-to-face context
is likewise somehow different from flow perceived in an online setting.
Cross-validation. Once adequate model fit has been achieved, researchers recommend
cross-validation using a separate sample (Brown, 2006; Schumacker & Lomax, 2010). Both CE
models were cross-validated using data from the other half, which had been held back (n = 268).
Acceptable model fit was again achieved for both models. Fit for CE Model 3 (focused

SCALE DEVELOPMENT TO MEASURE ENGAGEMENT 85
attention, curiosity) was RMSEA = .053, CFI = .938, TLI = .931). The factor intercorrelations
were acceptable: r = .780 between face-to-face curiosity and focused attention and .764 between
online curiosity and focused attention. Table 3 displays the loadings and communalities of face-
to-face and online items in this model, as well as the internal-consistency reliability measures
(Cronbach’s alpha) for each factor. Reliabilities were greater than the .70 benchmark suggested
for modest composite reliability (Nunnally, 1978). Fit for CE Model 4 (effort, flow) was:
RMSEA = .053, CFI = .939, TLI = .931. The factor intercorrelations were also acceptable: r =
.847 between face-to-face flow and effort, and .823 between online flow and effort. Table 4
displays the loadings and communalities of both face-to-face and online items in CE Model 4, as
well as Cronbach’s alpha measures, all greater than .70. These results suggest that the two
models fit the data comparably well; both will be further discussed hereafter. In both models,
factors are differentiated by not only cognitive qualities, but also by context.

SCALE DEVELOPMENT TO MEASURE ENGAGEMENT 86
Table 3
Cross-Validation Factor Loadings of Cognitive Engagement Indicators: CE Model 3
Face-to-Face Online Cognitive Engagement Indicators Loading R2 α Loading R2 α Focused Attention (FOC) .876 .843 My mind wandered during F2F class/while completing OL assignments. (ATT1)a .686 .471 .403 .162 How often did you work on other things during F2F class time?/When I did OL work for this course, I multitasked. (ATT2)a
.619 .383 .463 .214
Describe you level of attentiveness during F2F class/OL work for this course. (ATT3) .850 .723 .614 .377 Compared to other courses, the effort I put into F2F class activities/OL activities for this course has been: (EFF1)
.583 .339 .608 .370
Even when F2F class/OL work for this course was uninteresting, I made an effort to learn. (EFF2)
.603 .364 .581 .338
How persistent were you in trying to understand the material in F2F class/the material OL for this course? (PERS1)
.771 .595 .778 .605
If I didn’t understand something in F2F class, I listened more closely in order to better understand./ … something in OL work for this course, I kept working at it ... (PERS2)
.582 .339 .654 .428
In F2F class/During OL instruction, I consciously tried to make the different ideas fit together and make sense in my mind. (COG1)
.549 .301 .626 .392
How often did you take notes while in class/while reading or listening OL to help you understand what you were learning? (COG2)
.597 .356 .477 .227
To what degree did you thoughtfully analyzed and evaluate the information presented in F2F class/OL instruction? (COG3)
.801 .641 .740 .547
I became absorbed in F2F/OL learning activities for this course. (ABS1) .713 .508 .706 .498 How often did you lose track of time when in F2F class/when doing OL activities…? (ABS2) .331 .110b .383 .147 Describe your level of absorption/deep concentration during F2F class/OL work…. (ABS3) .863 .745 .776 .602
Curiosity (CUR) .777 .721 Something we discussed in F2F class/Something I read or watched OL for this course “stuck with me” and continues to be of interest to me. (CUR1)
.671 .450 .613 .376
During F2F class/OL learning activities, my curiosity was piqued and I wanted to know more about principles and concepts being taught. (CUR2)
.839 .703 .748 .559
Describe your level of curiosity during F2F class/OL work for this course. (CUR3) .852 .726 .867 .752 Note. Loadings are standardized estimates. All loading parameters are statistically significant at p < 0.001 (two-tailed) except for those indicated. a Item reverse scored. b p < 0.01

SCALE DEVELOPMENT TO MEASURE ENGAGEMENT 87
Table 4
Cross-Validation Factor Loadings of Cognitive Engagement Indicators: CE Model 4
Face-to-Face Online Cognitive Engagement Indicators Loading R2 α Loading R2 α Effort (EFF) .861 .802 My mind wandered during F2F class/while completing OL assignments. (ATT1)a .694 .482 .403 .163 How often did you work on other things during F2F class time?/When I did OL work for this course, I multitasked. (ATT2)a
.625 .390 .469 .220
Describe you level of attentiveness during F2F class/OL work for this course. (ATT3) .869 .756 .615 .379 Compared to other courses, the effort I put into F2F class activities/OL activities for this course has been: (EFF1)
.591 .349 .613 .375
Even when F2F class/OL work for this course was uninteresting, I made an effort to learn. (EFF2)
.610 .372 .588 .345
How persistent were you in trying to understand the material in F2F class/the material OL for this course? (PERS1)
.781 .610 .787 .620
If I didn’t understand something in F2F class, I listened more closely…/ If I didn’t understand something in OL work for this course, I kept working at it until I thought I’d solved it. (PERS2)
.590 .348 .664 .441
In F2F class/During OL instruction, I consciously tried to make the different ideas fit together and make sense in my mind. (COG1)
.559 .312 .634 .402
How often did you take notes while in class/while reading or listening OL to help you understand what you were learning? (COG2)
.603 .363 .479 .229
To what degree did you thoughtfully analyzed and evaluate the information presented in F2F class/OL instruction? (COG3)
.811 .658 .749 .560
Flow (FLO) .808 .794 I became absorbed in F2F/OL learning activities for this course. (ABS1) .732 .535 .762 .580 How often did you lose track of time when in F2F class/when doing OL activities…? (ABS2) .349 .122b .426 .181 Describe your level of absorption/deep concentration during F2F class/OL work.... (ABS3) .920 .846 .836 .699 Something we discussed in F2F class/Something I read or watched OL for this course “stuck with me” and continues to be of interest to me. (CUR1)
.624 .389 .564 .318
During F2F class/OL learning activities, my curiosity was piqued and I wanted to know more about principles and concepts being taught. (CUR2)
.766 .587 .694 .481
Describe your level of curiosity during F2F class/OL work for this course. (CUR3) .765 .586 .769 .592 Note. Loadings are standardized estimates. All loading parameters are statistically significant at p < 0.001 (two-tailed) except for those indicated. a Item reverse scored. b p < 0.01
SCALE DEVELOPMENT TO MEASURE ENGAGEMENT 88
Emotional Engagement
Halverson and Graham (under review) proposed that EE is composed of positive energy
indicators, including interest and enjoyment, happiness, and confidence, while negative energy
indicators include boredom, frustration, and anxiety. They also suggested investigating the first
order factor of confusion; depending on the learner’s feelings about the activity, confusion may
indicate positive or negative energy. Seeking good model fit with constructs showing
convergent and discriminant validity, we tested three models, explained in further detail below.
Our first model, EE Model 1, was based on Halverson and Graham’s theoretical constructs and
did not separate indicators by context, but this had poor model fit. A subsequent EFA showed
that, as was the case with CE, context was the clearest element in factor structure. As was done
with CE, we chose to test face-to-face indicators only, select the best-fitting models, and then use
invariance testing across context to determine whether the online indicators were comparable.
We tested a seven-factor model based on the theoretical first order factors (EE Model 2). Model
fit was good, but several factors lacked discriminant validity. We respecified the models to take
these factor intercorrelations into account, and then tested a three-factor model featuring the
constructs of positive emotional engagement, negative emotional engagement, and confidence
(EE Model 3), which showed good model fit.
Initial confirmatory factor analysis. As we did in testing CE, we chose to run an initial
CFA (n = 549) based on the EE model proposed by Halverson and Graham's theoretical
framework (EE Model 1 in Table 5). Again we ran this CFA without the context condition,
allowing all items purported to measure an indicator like enjoyment to be grouped under the first
order construct enjoyment, without divisions into online enjoyment and face-to-face enjoyment.
All the positive first order constructs were then specified to measure a second order factor,

SCALE DEVELOPMENT TO MEASURE ENGAGEMENT 89
positive emotional engagement (POS), and the negative first order constructs were specified to
measure the second order factor negative emotional engagement (NEG). The model was
estimated using WLSMV with categorical indicators. Again we compared factor loadings
estimated using WLSMV and MLR and found similar results, suggesting that there was no
method effect and that any missing data were missing completely at random (MCAR).
All items measured the first order constructs well (standardized loadings ranging from
.534 to .922; p < .001). The differences in measurement sensitivity between paired face-to-face
and online results were not as striking as in CE. For example, the loadings of indicator ENJ_F1
on the latent variable enjoyment (ENJ) was .849, while the online item ENJ_O1 loaded at .811.
At the second order level, enjoyment, happiness, and confidence loaded well on POS (.910, .906,
.719, respectively; p < .001), while boredom, frustration, and anxiety loaded well on NEG (.820,
.914, .684 respectively; p < .001). The correlation between confusion and POS was -.522, while
the correlation between confusion and NEG was .850. Finally NEG and POS were significantly
correlated (r = -.867, p < .001). Overall model fit was poor: RMSEA = .158, CFI = .636, TLI =
.615, χ2 = 13071.235 (df = 893), suggesting that this model needed modifying.
Exploratory factor analysis. To search for a better fitting model, we conducted another
EFA of the 44 emotional engagement items with the same approach used for CE. We again used
Bartlett’s test of sphericity to discern the factorability of the data and the KMO test to determine
the sampling adequacy. Results indicated that the data were suitable for factor detection
(Bartlett’s test of sphericity: χ2 (946) = 9278.820, p < 0.001; KMO = 0.915). This suggested six
factors with eigenvalues over 1.0. A scree plot inspection suggested four or six factors.
The six-factor model lacked interpretability, but the four-factor model gave us insights
into some possible model revisions. First, confusion loaded much more strongly on NEG than

SCALE DEVELOPMENT TO MEASURE ENGAGEMENT 90
on POS. Second, a new cluster of items emerged, as all of the boredom indicators and one
frustration indicator (FRUS2)—items which seemed to express a sense of detachment from the
learning experience—had high negative loadings onto POS, rather than loading onto NEG as
Halverson and Graham (under review) had theorized. We reverse-scored the items and labeled
this factor lack of detachment (DET). Most striking was that, as with CE, context was
unambiguously important in factor structure. Face-to-face positive emotional engagement
(POS_F) was reflected by face-to-face enjoyment (ENJ_F), happiness (HAP_F), lack of
detachment (DET_F), and one confidence (CONFD_F) item. Online positive emotional
engagement (POS_O) was similarly comprised but was reflected by all online confidence
(CONFD_O) items. Face-to-face negative emotional engagement (NEG_F) was reflected by
face-to-face anxiety (ANX_F), confusion (CONFS_F), and the remaining frustration (FRUS_F)
indicators. In addition, all face-to-face confidence (CONFD_F) items loaded negatively to this
factor. Online negative emotional engagement (NEG_O) was reflected by online anxiety
(ANX_O), confusion (CONFS_O), and the remaining frustration (FRUS_O) indicators, but
online confidence (CONFD_O) items did not reflect NEG_O. Overall, online items reflecting
the factor confidence matched Halverson and Graham’s (under review) theoretical model by
loading onto POS_O (.411-.560, p < .001), with lower but significant loadings onto NEG_F.
However the face-to-face confidence items had a unique pattern, loading onto NEG_F (-.759 to -
.768, p < .001).
We determined to test a few different CFAs, including the factor of detachment, aligning
confusion with NEG, and trying various models that retained, double-loaded, or dropped the
confidence items. Our models first tested the face-to-face emotional engagement items alone,
and then tested whether the online items follow the same model suggested.

SCALE DEVELOPMENT TO MEASURE ENGAGEMENT 91
Confirmatory factor analysis of face-to-face EE items. Employing the same sample
half utilized in the EFAs, we conducted several CFAs. A first order CFA (EE Model 2 in Table
5) was conducted to include a lack of detachment factor (Figure 7). Results for this correlated
seven-factor EE model suggested good fit: RMSEA = .058, CFI = .986, TLI = .983. All
indicators measured their respective factors well (.679-.946, p < .001). All indicators now
specified on lack of detachment had high standardized parameter estimates, ranging from .844 to
.946. Lack of detachment correlated particularly strongly with enjoyment (.928) and happiness
(.852), while confusion correlated particularly strongly with frustration (.818), anxiety (.889),
and a (lack of) confidence (-.853). These high factor intercorrelations suggested that some of our
first order factors lacked discriminant validity.
Figure 7. Face-to-Face EE Model 2, with seven first order factors: enjoyment or situational interest, happiness, lack of detachment, confidence, anxiety, confusion, and frustration.
Our next step was to hypothesize a correlated three-factor EE measurement model (EE
Model 3 in Table 5). Positive emotional engagement (POS_F) was specified by enjoyment,
happiness, and lack of detachment indicators. Negative emotional engagement (NEG_F) was
specified by anxiety, confusion, and frustration indicators. Because we found that confidence
had a unique pattern across contexts (POS_O being specified by CONFD_O, but NEG_F being
specified by CONFD_F), we chose to keep confidence as a unique factor in this model (see

SCALE DEVELOPMENT TO MEASURE ENGAGEMENT 92
Figure 8). Results suggested acceptable fit: RMSEA = .090, CFI = .964, and TLI = .960.
Indicators measured their respective factors fairly well (.785 to .919 for POS_F, .744 to .890 for
NEG_F, and .675 to .819 for CONFD_F, p < .001), showing convergent validity. Supporting
discriminant validity, no factor intercorrelations also surpassed .850 (r = .397 between
CONFD_F and POS_F; -0291 between NEG_F and POS_F; and -.820 between NEG_F and
CONFD_F, p < .001).
Figure 8. Face-to-Face EE Model 3, with three first order factors: positive engagement (POS), confidence (CONFD), and negative engagement (NEG).
Because of the multifaceted nature of emotional engagement (particularly negative
engagement or disaffection, according to Skinner, Kindermann, & Furrer, 2009), we did not
expect a second order model to have good fit, and we achieved no convergence when we tested a
model with the superfactor of emotional engagement, comprised of face-to-face positive
engagement, confidence, and negative engagement.
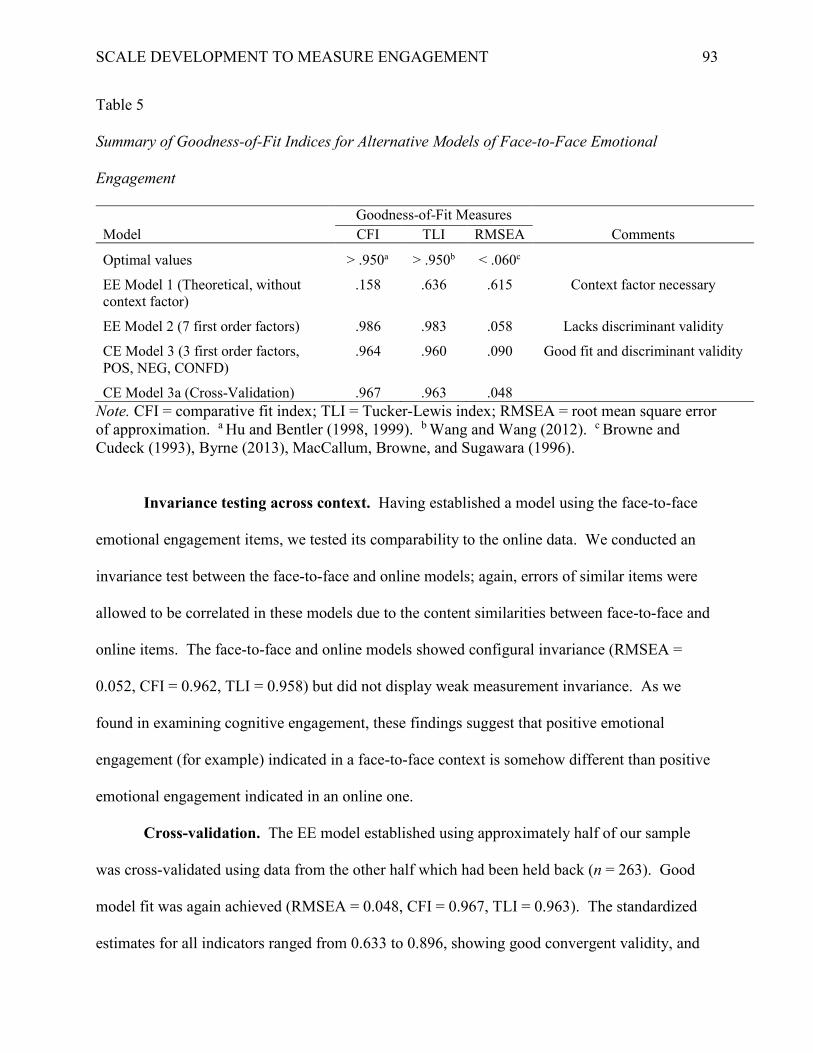
SCALE DEVELOPMENT TO MEASURE ENGAGEMENT 93
Table 5
Summary of Goodness-of-Fit Indices for Alternative Models of Face-to-Face Emotional
Engagement
Goodness-of-Fit Measures Model CFI TLI RMSEA Comments
Optimal values > .950a > .950b < .060c
EE Model 1 (Theoretical, without context factor)
.158 .636 .615 Context factor necessary
EE Model 2 (7 first order factors) .986 .983 .058 Lacks discriminant validity
CE Model 3 (3 first order factors, POS, NEG, CONFD)
.964 .960 .090 Good fit and discriminant validity
CE Model 3a (Cross-Validation) .967 .963 .048 Note. CFI = comparative fit index; TLI = Tucker-Lewis index; RMSEA = root mean square error of approximation. a Hu and Bentler (1998, 1999). b Wang and Wang (2012). c Browne and Cudeck (1993), Byrne (2013), MacCallum, Browne, and Sugawara (1996).
Invariance testing across context. Having established a model using the face-to-face
emotional engagement items, we tested its comparability to the online data. We conducted an
invariance test between the face-to-face and online models; again, errors of similar items were
allowed to be correlated in these models due to the content similarities between face-to-face and
online items. The face-to-face and online models showed configural invariance (RMSEA =
0.052, CFI = 0.962, TLI = 0.958) but did not display weak measurement invariance. As we
found in examining cognitive engagement, these findings suggest that positive emotional
engagement (for example) indicated in a face-to-face context is somehow different than positive
emotional engagement indicated in an online one.
Cross-validation. The EE model established using approximately half of our sample
was cross-validated using data from the other half which had been held back (n = 263). Good
model fit was again achieved (RMSEA = 0.048, CFI = 0.967, TLI = 0.963). The standardized
estimates for all indicators ranged from 0.633 to 0.896, showing good convergent validity, and

SCALE DEVELOPMENT TO MEASURE ENGAGEMENT 94
the factor intercorrelations ranged from .028 (POS_F with NEG_O) to -.816 (NEG_F with
CONFD_F). Table 6 displays the loadings and communalities of both face-to-face and online
items, as well as Cronbach’s alpha for each factor. Reliabilities for face-to-face and online POS
and NEG were excellent, while those for face-to-face and online confidence were adequate.
These results provided support for a hierarchical model of EE, including factors of positive
emotional engagement (such as enjoyment, happiness, and a feeling of attachment), negative
emotional engagement (frustration, anxiety, and confusion), and confidence. These factors were
perceived in face-to-face and online contexts, though they were not equivalent across contexts.

SCALE DEVELOPMENT TO MEASURE ENGAGEMENT 95
Table 6
Cross Validation Factor Loadings of Emotional Engagement Indicators: EE Model 3
Face-to-Face Online Emotional Engagement Indicators Loading R2 α Loading R2 α Positive Emotional Engagement .949 .919 I enjoyed the F2F time I spend in this class./I enjoyed the OL activities for this course. (ENJ1) .893 .797 .849 .721 How interesting was the material covered in F2F class/OL work for this course? (ENJ2) .789 .622 .744 .553 Describe your level of interest during F2F class/OL work for this course. (ENJ3) .849 .721 .841 .708 I look forward to going to F2F class/OL learning activities for this course. (ENJ4) .863 .744 .810 .656 I felt happy during F2F/OL learning activities. (HAP1) .750 .562 .756 .571 To what extent did you feel glad during F2F class/OL learning activities? (HAP2) .885 .783 .795 .632 Describe your level of happiness during F2F class/OL work for this course. (HAP3) .887 .787 .816 .665 F2F class was dull./The OL materials for this course were dull. (BORE1) a .876 .767 .776 .602 When in F2F class/During OL activities for this course, I felt bored. (BORE2) a .804 .647 .712 .508 Describe your level of boredom during F2F class/OL work for this course. (BORE3) a .878 .772 .728 .531 How often did you feel like sitting in class/OL work for this course was a waste of your time? (FRUS2) a
.803 .644 .665 .443
Confidence / Self-efficacy .741 .715 How confident did you feel that you could understand the most difficult materials …? (CONFD1)
.713 .508 .766 .586
How confident did you feel that you could understand the basic concepts …? (CONFD2) .674 .454 .633 .401 After attending F2F class/completing OL activities, I felt confident about my ability to succeed in this course. (CONFD3)
.856 .732 .768 .590
Negative Emotional Engagement .921 .899 To what extent did you feel frustrated while in class/during OL work for the course? (FRUS1) .888 .789 .896 .803 Describe your level of frustration during F2F class/during OL work for this course. (FRUS3) .868 .753 .867 .752 F2F class/OL work for this course stressed me out. (ANX1) .716 .513 .647 .419 How worried did you feel while in F2F class/during OL work for this course? (ANX2) .823 .678 .737 .543 Describe your level of anxiety during F2F class/OL work for this course. (ANX3) .738 .545 .727 .529 I felt confused during F2F class/while doing OL assignments for this course. (CONFS1) .789 .623 .724 .524 I felt puzzled in F2F class/while doing OL assignments for this course. (CONFS2) .840 .706 .718 .515 Describe your level of confusion during F2F class/OL work for this course. (CONFS3) .863 .744 .853 .727
Note. Loadings are standardized estimates. All loading parameters are statistically significant at p < 0.001 (two-tailed) except for those indicated. a Item reverse scored.

SCALE DEVELOPMENT TO MEASURE ENGAGEMENT 96
Discussion
The purpose of this study was to operationalize and test a proposed model of blended
learning engagement using exploratory and confirmatory factor analysis. Although learner
engagement has been described as “the holy grail of learning” (Sinatra, Heddy, & Lombardi,
2015, p. 1) due to its correlations with student satisfaction, achievement, and persistence, the
constructs and definitions of learner engagement are ill-conceived in general and even less
understood in blended contexts. We selected a theoretical framework for learner engagement
(Halverson & Graham, under review) and subjected it to exploratory and confirmatory factor
analyses, invariance testing across contexts, and cross-validation in order to determine the
strength of the model of engagement.
One of the clearest conclusions from our research is the related but nevertheless distinct
nature of face-to-face and online engagement. EFAs unambiguously showed that context matters
in the factor structure development. We achieved configural invariance across contexts when
testing the CE and EE models, showing that the same structure applies to both contexts and that
the paired questions held together in a pattern though not at the same level of strengths.
However, we did not achieve weak or strong measurement invariance across contexts.
Particularly within cognitive engagement, factor loadings of paired face-to-face and online items
behaved quite uniquely. These discrepancies were apparent in the analyses of emotional
engagement as well, though less pronounced. Overall, our data showed that measures of
engagement must be context-specific.
We were surprised that differences between online and face-to-face indicators would be
stronger than all other differences. It is possible that the differences indicate that learners have a
harder time understanding what engagement means in the online setting. Alternatively, perhaps
SCALE DEVELOPMENT TO MEASURE ENGAGEMENT 97
their online experiences were perceived as more varied than their face-to-face class experiences.
Finally, the paired questions were presented together in the survey, and the face-to-face items
always presented first. This could have introduced an order effect into the results.
However, other explanations may also help account for our finding. If pedagogical
methods differ across modality, is what we are seeing less an effect of modality and more an
effect of pedagogy? If learners experience engagement differently based on pedagogy, then the
best level at which to measure engagement is the activity level, where the effect of different face-
to-face and different online activities on engagement can be evaluated. Because we wished our
framework to be generalizable, we intentionally collected data from many different courses
displaying variation in blended course design. However, if the observed “context effect” is
actually due to pedagogy, research will need to look at specific pedagogies in specific classes,
making the large data sets required for factor analysis more difficult to collect. More research
into “the actual experience of an activity or event” (Davis & McPartland, 2012, p. 516) can be
done to explore the differences that various pedagogies have on cognitive and emotional energy.
Another significant finding was the empirical equivalence between indicators that some
models separate into cognitive and behavioral categories. Halverson and Graham’s (under
review) framework suggested that cognitive engagement was comprised of several first order
constructs—attention, effort and persistence, time on task, cognitive strategy use, absorption, and
curiosity—some of which have been considered behavioral in other models of learner
engagement. Halverson and Graham argued “that what other models are considering displays of
behavioral engagement are actually indicators of underlying cognitive and emotional
involvement” and are “outward displays of the mental and emotional energies that fuel learning.”
They proposed that attention, effort and persistence, and time on task might indicate quantity of

SCALE DEVELOPMENT TO MEASURE ENGAGEMENT 98
CE, while cognitive strategy use, absorption, and curiosity might indicate CE quality. Although
our analysis had to drop the time on task variable due to issues in the way we operationalized the
construct, in a model not presented here we found that second order quantity and quality factors
could not be justified because they were so highly correlated (r = .977) that the constructs were
empirically indistinguishable. At the first order level, cognitive strategy use (the hallmark of CE
in most other frameworks) and effort and persistence (usually considered aspects of behavioral
engagement) were likewise empirically equivalent (r = .994). This sheds light upon the
longstanding theoretical debate as to the nature of cognitive engagement (Pintrich & DeGroot,
1990; Zimmerman, 2002) and gives justification to Halverson and Graham’s assertion that certain
behavioral manifestations of engagement are best conceptualized as expressions of the internal
processes of CE.
We presented two different two-factor models of CE for consideration. In one (CE Model
3), focused attention was specified by attention, effort and persistence, cognitive strategy use, and
absorption indicators; the second factor was curiosity. Since curiosity was the factor most unique
from the other factors, a single-factor model in which curiosity is better regarded as a facilitator
of engagement might be also investigated in future research. As Skinner, Furrer, Marchand, and
Kindermann (2008) have written, “Indicators refer to the features that belong inside the construct
of engagement proper, whereas facilitators are the causal factors (outside of the construct) that are
hypothesized to influence engagement” (p. 766). In a second model (CE Model 4), effort was
specified by attention, effort and persistence, cognitive strategy use indicators, and flow was
specified by absorption and curiosity indicators. Since absorption and curiosity seem to us to be
integral to deep engagement, we find this the more compelling of the two models. However, one
absorption item pair (ABS2: How often did you lose track of time when in face-to-face

SCALE DEVELOPMENT TO MEASURE ENGAGEMENT 99
class/when doing online activities for this course?) was the weakest measure of CE in our scale.
Replacing this item might increase reliability. This question was particularly intended to measure
a state of flow, so if researchers are interested in CE Model 4, refining these indicators to more
clearly measure deep absorption and the state of flow would be important.
Our preferred EE Model (EE Model 3) measured constructs in ways unique from the
original framework proposed by Halverson and Graham (under review) and from the models of
Skinner and colleagues upon which Halverson and Graham largely based their concept of
negative EE. Skinner and colleagues saw positive EE as primarily about enjoyment and interest;
Halverson and Graham proposed including happiness and confidence as well. Skinner and
colleagues found evidence for a hierarchical model of negative EE, comprised of boredom,
frustration, and anxiety; Halverson and Graham adopted this construct. Confusion was not
included in the emotional disaffection model proposed by Skinner and colleagues, but as the
second-most frequent affective state in technology-mediated learning contexts (D’Mello, 2013),
Halverson and Graham suggested additional research to better understand its role in blended
learning engagement.
Our findings rearranged some of these alliances. First, we found that confusion, at least
when recalled in an end-of-course survey (thus considerably after any particular learning
activity), is remembered by learners as negative. This does not contradict other assertions that
confusion during the moment of a learning activity in which the learner is engaged and interested
may spur on investigation and thus learning (Baker et al., 2010; D’Mello et al., 2014). D’Mello
et al. (2014) state that “one important form of deep learning occurs when there is a discrepancy in
the information stream and the discrepancy is identified and corrected,” a kind of confusion they
call “productive” (p. 155). It is possible that learners do not later remember this temporary state

SCALE DEVELOPMENT TO MEASURE ENGAGEMENT 100
as confusion, but only recall those frustrating unresolved impasses under that label. This suggests
that those who wish to research confusion in technology-mediated settings will need to take into
account not only the accompanying emotions (e.g., boredom, frustration, or interest) but also
whether the instrument is measuring confusion felt in the moment of a learning activity or
recalled at a later date. Once again, context is critical in measuring indicators of engagement.
Next our findings suggested that detachment indicators correlated most strongly (and
negatively) with happiness and enjoyment, rather than with the other negative emotions of
frustration, anxiety, and confusion. Detachment contained items inquiring into perceived
boredom as well as one item which we had intended to measure frustration: “How often did you
feel like sitting in class/like online work for this course was a waste of your time?” This
constellation of items seemed to crystallize around the very absence of interest, enjoyment, and
happiness. In circumplex models of emotion, the latter have been described as positive activating
emotions, while boredom and detachment are their orthogonal opposites, negative deactivating
emotions (Feldman Barrett & Russell, 1998; Pekrun & Linnenbrink-Garcia, 2012). Frustration
and anxiety have been classified as negative activating emotions, and had high enough factor
intercorrelations to justify consolidation, along with confusion, into a single variable of negative
EE. Because we have utilized a definition of learner engagement as the investment of cognitive
and emotional energy to bring about a learning task, physiological activation and deactivation
ought to be considered for their impact upon emotional energy. It is possible that activating
emotions (positive or negative) are stronger indicators of engagement than deactivating ones;
effects of the presence of activating and deactivating emotional states on the overall learning
process might thus be questioned. Perhaps the construct we have called POS might better be
labeled energy-producing emotions (enjoyment, happiness, and attachment), while the construct

SCALE DEVELOPMENT TO MEASURE ENGAGEMENT 101
we have labeled NEG might be better viewed as energy-depleting emotions (frustration, anxiety,
and confusion).
Context was again important in measuring confidence. Indicators from the confidence
variable behaved uniquely across context. The EFAs showed that online confidence indicators
loaded as Halverson and Graham (under review) had expected, aligning with the other online
POS factors such as enjoyment and happiness (though with significant double-loadings on other
factors as well). Face-to-face confidence, in contrast, had high negative loadings onto face-to-
face NEG. Halverson and Graham noted that confidence might function as both a facilitator and
an indicator of engagement. Longitudinal research could help establish whether confidence
primarily precedes and facilitates engagement instead of indicating an engaged state. Due to the
difficulties we experienced with this factor, future research might consider dropping it from the
model of engagement indicators.
Future research can further refine the scale utilized in this research. Since our findings
suggest that online and face-to-face engagement are unique constructs, perhaps our careful
pairing of items was unnecessary. We felt restrained in dropping items when a weak item (such
as ATT_O1, “My mind wandered while completing online assignments”) had a stronger partner
(ATT_F1, “My mind wandered during face-to-face class”). Perhaps face-to-face confidence, for
example, ought to be measured in ways unique from the measurement of online confidence. If
proceeding with CE Model 4, we need better measures of the perception of flow; our face-to-face
question most intended to investigate this state was the weakest CE indicator. Finally, time on
task might be reintroduced into the CE model if better operationalized.
We utilized an end-of-course survey in this research, attempting to measure course-level
engagement. However, engagement may be “fundamentally situational” (Kahu, 2013, p. 763). If

SCALE DEVELOPMENT TO MEASURE ENGAGEMENT 102
this is true, then activity-level measures of engagement (such as Henrie, Larsen, Manwaring,
Halverson, & Graham, under review) will give us the best information about how different face-
to-face and online experiences impact learner engagement in blended courses. As we have noted
already, confusion measured at the end of a course was recalled negatively, but confusion in the
moment of a learning activity may if accompanied by interest and curiosity actually spur learner
engagement, investigation, and learning.
In conclusion, developing and testing this new instrument has offered important insights
to our understanding of blended learning engagement. First, context matters in how learners
perceive their own engagement in settings that combine face-to-face and technology-mediated
learning activities. Whether this is more a reflection of modality or of pedagogy requires further
research, especially at the activity level. Second, factors that some models label behavioral are
empirically indistinguishable from those considered cognitive; thus the behavior and cognitive
engagement models can be combined as one and the underlying construct—cognitive
engagement—considered the root of behavioral manifestations of learner engagement. We
recommend a model of cognitive engagement that considers effort (attention, persistence, effort,
and cognitive strategy use) as well as flow (curiosity and absorption). Learner’s emotional
energy can be positive or negative, with the latter consuming rather than fueling cognitive
resources for learning. These findings can inform how we conceptualize and measure
engagement in blended settings. Improved measures of engagement, it follows, will allow us to
better assess which combinations of face to face and computer-mediated technologies are truly
“the best of both worlds” (Bele & Rugeli, 2007).

SCALE DEVELOPMENT TO MEASURE ENGAGEMENT 103
References
Agarwal, R., & Karahanna, E. (2000). Time flies when you’re having fun: Cognitive absorption
and beliefs about information technology usage. MIS Quarterly, 24(4), 665–694. Retrieved
from http://www.jstor.org/stable/3250951
Aspden, L., & Helm, P. (2004). Making the connection in a blended learning environment.
Educational Media International, 41(3), 245–252. doi:10.1080/09523980410001680851
Astin, A. W. (1984). Student involvement: A developmental theory for higher education. Journal
of College Student Personnel, 40(5), 518–529. Retrieved from
https://www.middlesex.mass.edu/tutoringservices/downloads/astininv.pdf
Baker, R. S. J. d., D’Mello, S. K., Rodrigo, M. M. T., & Graesser, A. C. (2010). Better to be
frustrated than bored: The incidence, persistence, and impact of learners’ cognitive–
affective states during interactions with three different computer-based learning
environments. International Journal of Human-Computer Studies, 68(4), 223–241.
Bartlett, M. S. (1954). A note on multiplying factors for various chi-squared approximations.
Journal of the Royal Statistical Society, 16(Series B), 296–298.
Bele, J. L., & Rugelj, J. (2007). Blended learning—an opportunity to take the best of both
worlds. International Journal of Emerging Technologies in Learning, 2(3).
doi:10.3991%2Fijet.v2i3.133.
Berger, J. B., & Milem, J. F. (1999). The role of student involvement and perceptions of
integration in a causal model of student persistence. Research in Higher Education, 40(6),
641–664. Retrieved from http://link.springer.com/article/10.1023/A%3A1018708813711
Brown, T. (2006). Confirmatory factor analysis for applied research. New York: Guildford.

SCALE DEVELOPMENT TO MEASURE ENGAGEMENT 104
Browne, M. W., & Cudeck, R. (1993). Alternative ways of assessing model fit. In K. A. Bollen
& J. S. Long (Eds.), Testing structural equation models (pp.136–162). London: Sage
Publications.
Byrne, B. M. (2013). Structural equation modeling with LISREL, PRELIS, and SIMPLIS: Basic
concepts, applications, and programming. Lawrence Erlbaum Associates, Inc., Mahwah,
NJ.
Campanelli, P. (2008). Testing survey questions. In E. D. de Leeuw, J. J. Hox, & D. A. Dillman
(Eds.), International handbook of survey methodology (pp. 176-200). New York, NY:
Lawrence Erlbaum Associates.
Coates, H. (2006). Student engagement in campus-based and online education: University
connections. New York, NY: Routledge.
Csikszentmihalyi, M. (1990). Flow: The psychology of optimal experience. New York, NY:
Harper- Perennial.
Davis, M. H., & McPartland, J. M. (2012). High school reform and student engagement. In S. L.
Christenson, A. L., Reschly, & C. Wylie (Eds.), Handbook of research on student
engagement (pp. 515-539). New York, NY: Springer.
Dillman, D. A., Smith, J. D., & Christian, L. M. (2009). Internet, mail, and mixed-mode surveys:
The tailored design method (3rd ed.). Hoboken, NJ: John Wiley & Sons.
D’Mello, S. (2013). A selective meta-analysis on the relative incidence of discrete affective
states during learning with technology. Journal of Educational Psychology, 105(4), 1082–
1099. doi:10.1037/a0032674
D’Mello, S. K., Lehman, B., Pekrun, R., & Graesser, A. (2014). Confusion can be beneficial for
learning. Learning and Instruction, 29, 153–170. doi:10.1016/j.learninstruc.2012.05.003

SCALE DEVELOPMENT TO MEASURE ENGAGEMENT 105
Dornbusch, S. M., & Steinberg, L. D. (2011). School Engagement Scale (School Engagement
Questionnaire [SEQ]). Scale given in Fredricks, McCo!skey, Meli, Mordica, Montrosse, &
Mooney, 2011.
Feldman Barrett, L., & Russell, J. A. (1998). Independence and bipolarity in the structure of
current affect. Journal of Personality and Social Psychology, 74(4), 967–984.
doi:10.1207/s15327752jpa8502
Filak, V. F., & Sheldon, K. M. (2008). Teacher support, student motivation, student need
satisfaction, and college teacher course evaluations: Testing a sequential path model.
Educational Psychology, 28(6), 711–724. doi:10.1080/01443410802337794
Finn, J. D., Boyd-zaharias, J., Fish, R. M., & Gerber, S. B. (2007). Project STAR and Beyond :
Database User’s Guide. Lebanon.
Floyd, F. J., & Widaman, K. F. (1995). Factor analysis in the development and refinement of
clinical assessment instruments. Psychological Assessment, 7(3), 286–299.
doi:10.1037//1040-3590.7.3.286
Fredricks, J., McCo!skey, W., Meli, J., Mordica, J., Montrosse, B., & Mooney, K. (2011).
Measuring student engagement in upper elementary through high school: A description
of 21 instruments (Issues & Answers Report, REL 2011-No. 098). Washington, DC: U.S.
Department of Education, Institute of Education Sciences, National Center for Education
Evaluation and Regional Assistance, Regional Educational Laboratory Southeast.
Retrieved from http://www.talkgroups-mentors.org/pdfs/research/2011 Student
Engagement UNC.pdf
Gable, R. K. (1986). Instrument development in the affective domain. Boston, MA: Kluwer-
Nijhoff Pub.
SCALE DEVELOPMENT TO MEASURE ENGAGEMENT 106
Halverson, L. R., & Graham, C. R. (revisions submitted). Learner engagement in blended
learning environments: A conceptual framework. Educational Technology Research and
Development.
Henrie, C. R., Halverson, L. R., & Graham, C. R. (2015). Measuring student engagement in
technology-mediated learning: A review. Computers & Education, 90, 36-53.
doi:10.1016/j.compedu.2015.09.005
Henrie, C. R., Larsen, R., Manwaring, K., Halverson, L. R., & Graham, C. R. (under review).
Validation of a longitudinal activity-level measure of student engagement. Contemporary
Educational Psychology.
Hu, L. T., & Bentler, P. M. (1998). Fit indices in covariance structure modeling: Sensitivity to
under-parameterized model misspecification. Psychological Methods, 3, 424–453.
doi:10.1037/1082-989x.3.4.424
Hu, L. T., & Bentler, P. M. (1999). Cutoff criteria for fit indexes in covariance structure analysis:
Conventional criteria versus new alternatives. Structural Equation Modeling: A
Multidisciplinary Journal, 6, 1–55. doi:10.1080/10705519909540118
Hughes, J. N., Luo, W., Kwok, O.-M., & Loyd, L. K. (2008). Teacher-student support, effortful
engagement, and achievement: A 3-year longitudinal study. Journal of Educational
Psychology, 100(1), 1–14. doi:10.1037/0022-0663.100.1.1
Janosz, M. (2012). Part IV commentary: Outcomes of engagement and engagement as an
outcome: Some consensus, divergences, and unanswered questions. In S. L. Christenson, A.
L., Reschly, & C. Wylie (Eds.), Handbook of research on student engagement (pp. 695-
703). New York, NY: Springer.

SCALE DEVELOPMENT TO MEASURE ENGAGEMENT 107
Jayanti, R. K., McManamon, M. K., & Whipple, T. W. (2004). The effects of aging on brand
attitude measurement. Journal of Consumer Marketing, 21(4), 264–273.
Kahu, E. R. (2013). Framing student engagement in higher education. Studies in Higher
Education, 38(5), 758–773. doi:10.1080/03075079.2011.598505
Kaiser, H. F. (1958). The varimax criterion for analytic rotation in factor analysis.
Psychometrika, 23, 187–200.
Keller, J. M. (2008). First principles of motivation to learn and e3-learning. Distance Education,
29(2), 175–185. doi:10.1080/01587910802154970
Kline, R. B. (2011). Principles and practice of structural equation modelling, 3rd Ed. New York,
NY: Guilford.
Kuh, G. D. (2009, Spring). The national survey of student engagement: Conceptual and
empirical foundations. New Directions for Institutional Research, 141, 5–20. doi:10.1002/ir
Kuh, G. D., Cruce, T. M., Shoup, R., Kinzie, J., Gonyea, R. M., & Gonyea, M. (2008).
Unmasking the effects of student engagement on first-year college grades and persistence.
The Journal of Higher Education, 79(5), 540–563.
MacCullum, R.C., Browne, M.W., and Sugawara, H.M. (1996) Power analysis and
determination of sample size for covariance structure modeling. Psychological Methods, 1,
13-149.
Martin, A. J. (2009). Motivation and engagement across the academic life span: A
developmental construct validity study of elementary school, high school, and
university/college students [MES]. Educational and Psychological Measurement, 69(5),
794–824. doi:10.1177/0013164409332214

SCALE DEVELOPMENT TO MEASURE ENGAGEMENT 108
Mokhtari, K., & Reichard, C. A. (2002). Assessing students’ metacognitive awareness of reading
strategies. Journal of Educational Psychology, 94, 249–259.
Murphy, R., Snow, E., Mislevy, J., Gallagher, L., Krumm, A., & Wei, X. (2014). Blended
learning report: May 2014. Retrieved from Michael and Susan Dell Foundation website:
http://5a03f68e230384a218e0-938ec019df699e606c950a5614b999bd.r33.cf2.rackcdn.com/
MSDF-Blended-Learning-Report-May-2014.pdf
Nunnally, J. C. (1978). Psychometirc theory. New York: McGraw-Hill.
Oliver, R. (2007). Engaging first year students using a Web-supported inquiry-based learning
setting. Higher Education, 55(3), 285–301. doi:10.1007/s10734-007-9055-7
Pekrun, R., & Linnenbrink-Garcia, L. (2012). Academic emotions and student engagement. In S.
L. Christenson, A. L., Reschly, & C. Wylie (Eds.), Handbook of research on student
engagement (pp. 259–282). New York, NY: Springer. Retrieved from
http://www.springerlink.com/index/TJ336T5302680662.pdf
Picciano, A. G., Seaman, J., Shea, P., & Swan, K. (2012). Examining the extent and nature of
online learning in American K-12 education: The research initiatives of the Alfred P. Sloan
Foundation. The Internet and Higher Education, 15(2), 127–135.
doi:10.1016/j.iheduc.2011.07.004
Pintrich, P. R., & De Groot, E. V. (1990). Motivational and self-regulated learning components
of classroom academic performance. Journal of Educational Psychology, 82(1), 33–40.
doi:10.1037//0022-0663.82.1.33
Pintrich, P. R., Smith, D. A. F., Garcia, T., & McKeachie, W. J. (1991). A manual for the use of
the Motivated Strategies for Learning Questionnaire (MSLQ). Ann Arbor, MI: The
University of Michigan.

SCALE DEVELOPMENT TO MEASURE ENGAGEMENT 109
Rowe, J. P., Shores, L. R., Mott, B. W., & Lester, J. C. (2011). Integrating learning, problem
solving, and engagement in narrative-centered learning environments. International Journal
of Artificial Intelligence in Education, 21(2), 115–133. doi:10.3233/JAI-2011-019
Satorra, A., & Bentler, P. M. (2001). A scaled difference chi-squared test statistic for moment
structure analysis. Psychometrika, 66(4), 507–514. doi:10.1007/BF02296192
Schumacker, R. E., & Lomax, R. G. (2010). A beginner’s guide to structural equation modeling.
NY: Routledge.
Schunk, D. H., & Mullen, C. A. (2012). Self-efficacy as an engaged learner. In S. L. Christenson,
A. L. Reschly, & C. Wylie (Eds.), Handbook of research on student engagement (pp. 219-
235). New York, NY: Springer. doi:10.1007/978-1-4614-2018-7
Sinatra, G. M., Heddy, B. C., & Lombardi, D. (2015). The challenges of defining and measuring
student engagement. Educational Psychologist, 50(1), 1–13.
doi:10.1080/00461520.2014.1002924
Singh, K., Granville, M., & Dika, S. (2002). Mathematics and science achievement: Effects of
motivation, interest, and academic engagement. Journal of Educational Research, 95(6),
323–332.
Skinner, E., Furrer, C., Marchand, G., & Kindermann, T. (2008). Engagement and disaffection in
the classroom: Part of a larger motivational dynamic? Journal of Educational Psychology,
100(4), 765–781. doi:10.1037/a0012840
Skinner, E. A., Kindermann, T. A., & Furrer, C. J. (2009). A motivational perspective on
engagement and disaffection: Conceptualization and assessment of children’s behavioral
and emotional participation in academic activities in the classroom. Educational and
Psychological Measurement, 69(3), 493–525. doi:10.1177/0013164408323233

SCALE DEVELOPMENT TO MEASURE ENGAGEMENT 110
Skinner, E. A. & Pitzer, J. (2012). Developmental dynamics of student engagement, coping, and
everyday resilience. In S. L. Christenson, A. L. Reschly, & C. Wylie (Eds.), Handbook of
research on student engagement (pp. 21-44). New York, NY: Springer.
Staker, H., Chan, E., Clayton, M., Hernandez, A., Horn, M. B., & Mackey, K. (2011). The rise of
K–12 blended learning: Profiles of emerging models. Learning. Retrieved from
http://www.innosightinstitute.org/innosight/wp-content/uploads/2011/05/The-Rise-of-K-12-
Blended-Learning.pdf
Sun, J. C.-Y., & Rueda, R. (2012). Situational interest, computer self-efficacy and self-
regulation: Their impact on student engagement in distance education. British Journal of
Educational Technology, 43(2), 191–204. doi:10.1111/j.1467-8535.2010.01157.x
Tabachnick, B. G., & Fidell, L. S. (1989). Using multivariate statistics (2nd ed.). New York, NY:
Harper & Row.
Wang, J., & Wang, X. (2012). Structural equation modeling: Applications using Mplus. John
Wiley & Sons.
Wolters, C. A. (2004). Advancing achievement goal theory: Using goal structures and goal
orientations to predict students’ motivation, cognition, and achievement. Journal of
Educational Psychology, 96(2), 236–250. doi:10.1037/0022-0663.96.2.236
Zimmerman, B. J. (2002). Becoming a self-regulated learner: An overview. Theory into Practice,
41(2), 64–70. doi: 0.1207/s15430421tip4102_2
Zimmerman, B. J., & Kitsantas, A. (1997). Developmental phases in self-regulation: Shifting
from process goals to outcome goals. Journal of Educational Psychology, 89(1), 29–36.
doi:10.1037//0022-0663.89.1.29

SCALE DEVELOPMENT TO MEASURE ENGAGEMENT 111
Appendix
Blended Learning Course Engagement Survey
1A. My mind wandered during face-to-face class.
a. Never b. Rarely c. Sometimes d. Often e. All the time 1B. My mind wandered while completing online assignments.
a. Never b. Rarely c. Sometimes d. Often e. All the time 2A. Something we discussed in face-to-face class “stuck with me” and continues to be of interest to me.
a. Never b. Rarely c. Sometimes d. Often e. All the time 2B. Something I read or watched online for this course “stuck with me” and continues to be of interest to me.
a. Never b. Rarely c. Sometimes d. Often e. All the time 3A. I felt confused in face-to-face class.
a. Never b. Rarely c. Sometimes d. Often e. All the time 3B. I felt confused while doing the online assignments for this course.
a. Never b. Rarely c. Sometimes d. Often e. All the time 4A. Compared to other courses, the effort I put into face-to-face class activities has been:
a. Extremely low (probably the least amount of effort I’ve ever put into a class) b. Low c. About average d. High e. Extremely high (probably as much effort as I’ve ever put into a class)
4B. Compared to other courses, the effort I put into online activities for this course has been: a. Extremely low (probably the least amount of effort I’ve ever put into a course) b. Low c. About average d. High e. Extremely high (probably as much effort as I’ve ever put into a course)
5A. When in face-to-face class, I felt bored.
a. Never b. Rarely c. Sometimes d. Often e. All the time 5B. During online activities for this course, I felt bored.
a. Never b. Rarely c. Sometimes d. Often e. All the time

SCALE DEVELOPMENT TO MEASURE ENGAGEMENT 112
6A. During face-to-face class, I consciously tried to make the different ideas fit together and make sense in my mind.
a. Never b. Rarely c. Sometimes d. Often e. All the time 6B. During online instruction, I consciously tried to make the different ideas fit together and make sense in my mind.
a. Never b. Rarely c. Sometimes d. Often e. All the time 7A. I felt happy during face-to-face learning activities.
a. Never b. Rarely c. Sometimes d. Often e. All the time 7B. I felt happy during online learning activities.
a. Never b. Rarely c. Sometimes d. Often e. All the time 8A. I became absorbed in face-to-face learning activities for this course.
a. Not at all absorbed b. Not very absorbed c. Moderately absorbed d. Quite absorbed e. Extremely absorbed
8B. I became absorbed in online learning activities for this course. b. Not at all absorbed b. Not very absorbed c. Moderately absorbed e. Quite absorbed e. Extremely absorbed
9A. Face-to-face class stressed me out.
a. Never b. Rarely c. Sometimes d. Often e. All the time 9B. Online work for this course stressed me out.
a. Never b. Rarely c. Sometimes d. Often e. All the time 10A. After attending face-to-face class, I felt confident about my ability to succeed in this course.
a. Never b. Rarely c. Sometimes d. Often e. All the time 10B. After completing online activities, I felt confident about my ability to succeed in this course.
a. Never b. Rarely c. Sometimes d. Often e. All the time 11A. During face-to-face class, my curiosity was piqued and I wanted to know more about principles and concepts being taught.
a. Never b. Rarely c. Sometimes d. Often e. All the time 11B. During online learning activities, my curiosity was piqued and I wanted to know more about principles and concepts being taught.
a. Never b. Rarely c. Sometimes d. Often e. All the time

SCALE DEVELOPMENT TO MEASURE ENGAGEMENT 113
12A. Even when the face-to-face class was uninteresting, I made an effort to learn.
a. Never b. Rarely c. Sometimes d. Often e. All the time 12B. Even when the online work for this course was uninteresting, I made an effort to learn.
a. Never b. Rarely c. Sometimes d. Often e. All the time 13A. I looked forward to going to face-to-face class.
a. Never b. Rarely c. Sometimes d. Often e. All the time 13B. I looked forward to online learning activities for this course.
a. Never b. Rarely c. Sometimes d. Often e. All the time 14A. If I didn't understand something in face-to-face class, I listened more closely in order to better understand.
a. Never b. Rarely c. Sometimes d. Often e. All the time 14B: If I didn't understand something in online work for this course, I kept working at it until I thought I'd solved it.
a. Never b. Rarely c. Sometimes d. Often e. All the time *15A. Face-to-face time in class challenged me to do my best work.
a. Never b. Rarely c. Sometimes d. Often e. All the time *15B. Online requirements for this course challenged me to do my best work.
a. Never b. Rarely c. Sometimes d. Often e. All the time 16A. I felt puzzled in face-to-face class.
a. Never b. Rarely c. Sometimes d. Often e. All the time 16B. I felt puzzled while doing online assignments for this course.
a. Never b. Rarely c. Sometimes d. Often e. All the time 17A. I enjoyed the face-to-face time I spent in this class.
a. Never b. Rarely c. Sometimes d. Often e. All the time 17B. I enjoyed the online activities for this course.
a. Never b. Rarely c. Sometimes d. Often e. All the time 18A. How confident did you feel that you could understand the most difficult material presented in face-to-face class?
a. Not at all confident b. Not very confident c. Moderately confident f. Quite confident e. Extremely confident
18B. How confident did you feel that you could learn the most difficult course material presented online?
a. Not at all confident b. Not very confident c. Moderately confident

SCALE DEVELOPMENT TO MEASURE ENGAGEMENT 114
d. Quite confident e. Extremely confident *19A. How relevant to your life is what you learned in face-to-face class?
a. Not at all relevant b. Not very relevant c. Moderately relevant d. Quite relevant e. Extremely relevant
*19B. How relevant to your life is what you learned in online work for this course? a. Not at all relevant b. Not very relevant c. Moderately relevant d. Quite relevant e. Extremely relevant
20A. How interesting was the material covered in face-to-face class?
a. Not at all interesting b. Not very interesting c. Moderately interesting g. Quite interesting e. Extremely interesting
20A. How interesting was the material covered in online work for this course? a. Not at all interesting b. Not very interesting c. Moderately interesting d. Quite interesting e. Extremely interesting
*21A. How challenged were you by the face-to-face class material?
a. Not at all challenged b. Not very challenged c. Moderately challenged d. Quite challenged e. Extremely challenged
*21B. How challenged were you by the online work for this course? a. Not at all challenged b. Not very challenged c. Moderately challenged d. Quite challenged e. Extremely challenged
22A. How often did you lose track of time when in face-to-face class?
a. Never b. Rarely c. Sometimes d. Often e. All the time 22B. How often did you lose track of time when doing online activities for this course?
a. Never b. Rarely c. Sometimes d. Often e. All the time 23A. To what extent did you feel frustrated while in class?
a. Not at all frustrated b. Not very frustrated c. Moderately frustrated d. Quite frustrated e. Extremely frustrated
23B. To what extent did you feel frustrated during the online work for the course? a. Not at all frustrated b. Not very frustrated c. Moderately frustrated d. Quite frustrated e. Extremely frustrated
24A. How often did you take notes while in class to help you understand what you were learning?
a. Never b. Rarely c. Sometimes d. Often e. All the time 24B. How often did you take notes while reading or listening online to help you understand what you were learning?
a. Never b. Rarely c. Sometimes d. Often e. All the time

SCALE DEVELOPMENT TO MEASURE ENGAGEMENT 115
25A. How often did you feel like sitting in class was a waste of your time?
a. Never b. Rarely c. Sometimes d. Often e. All the time 25B. How often did you feel like online work for this course was a waste of your time?
a. Never b. Rarely c. Sometimes d. Often e. All the time 26A. To what extent did you feel glad during face-to-face class?
a. Not at all glad b. Not very glad c. Moderately glad d. Quite glad e. Extremely glad
26B. To what extent did you feel glad during online learning activities? a. Not at all glad b. Not very glad c. Moderately glad d. Quite glad e. Extremely glad
27A. How often did you work on other things during face-to-face class time?
a. Never b. Rarely c. Sometimes d. Often e. All the time 27B. How often did you multitask on other screens while completing the online work for this course?
a. Never b. Rarely c. Sometimes d. Often e. All the time 28A. How persistent were you in trying to understand the material in face-to-face class?
a. Not at all persistent b. Not very persistent c. Moderately persistent d. Quite persistent e. Extremely persistent
28B. How persistent were you in trying to understand the material online for this course? a. Not at all persistent b. Not very persistent c. Moderately persistent d. Quite persistent e. Extremely persistent
29A. How worried did you feel while in face-to-face class?
a. Not at all worried b. Not very worried c. Moderately worried d. Quite worried e. Extremely worried
29B. How worried did you feel during online work for this course? a. Not at all worried b. Not very worried c. Moderately worried d. Quite worried e. Extremely worried
30A. To what degree did you thoughtfully analyze and evaluate the information presented in face-to-face class?
a. Not at all thoughtfully b. Not very thoughtfully c. Moderately thoughtfully d. Quite thoughtfully e. Extremely thoughtfully
30B. To what degree did you thoughtfully analyze and evaluate the information presented in online instruction?
a. Not at all thoughtfully b. Not very thoughtfully c. Moderately thoughtfully

SCALE DEVELOPMENT TO MEASURE ENGAGEMENT 116
d. Quite thoughtfully e. Extremely thoughtfully 31A. Face-to-face class was dull.
a. Never b. Rarely c. Sometimes d. Often e. All the time 31B. The online materials for this course were dull.
a. Never b. Rarely c. Sometimes d. Often e. All the time 32A. How confident did you feel that you could understand the basic concepts presented in face-to-face class?
a. Not at all confident b. Not very confident c. Moderately confident d. Quite confident e. Extremely confident
32B. How confident did you feel that you could understand the basic concepts presented online? a. Not at all confident b. Not very confident c. Moderately confident d. Quite confident e. Extremely confident
33A. In an average week, how much time did you spend in class for this course?
a. 0 – 60 minutes b. 61 – 120 minutes c. 121 – 180 minutes d. 181 – 240 minutes e. More than 4 hours
33B. In an average week, how much time did you spend in online activities for this course? a. 0 – 60 minutes b. 61 – 120 minutes c. 121 – 180 minutes d. 181 – 240 minutes e. More than 4 hours
34A. Describe your level of attentiveness during face-to-face class.
a. Not at all attentive b. Not very attentive c. Moderately attentive d. Quite attentive e. Extremely attentive
34B. Describe your level of attentiveness during online work for this course. a. Not at all attentive b. Not very attentive c. Moderately attentive d. Quite attentive e. Extremely attentive
35A. Describe your general frustration during face-to-face class.
a. Not at all frustrated b. Not very frustrated c. Moderately frustrated d. Quite frustrated e. Extremely frustrated
35B. Describe your general frustration during online work for this course. a. Not at all frustrated b. Not very frustrated c. Moderately frustrated d. Quite frustrated e. Extremely frustrated

SCALE DEVELOPMENT TO MEASURE ENGAGEMENT 117
36A. Describe your level of happiness during face-to-face class.
a. Not at all happy b. Not very happy c. Moderately happy d. Quite happy e. Extremely happy
36B. Describe your level of happiness during online work for this course. a. Not at all happy b. Not very happy c. Moderately happy d. Quite happy e. Extremely happy
37A. Describe your level of absorption/deep concentration during face-to-face class.
a. Not at all absorbed b. Not very absorbed c. Moderately absorbed d. Quite absorbed e. Extremely absorbed
37B. Describe your level of absorption/deep concentration during online work for this course. a. Not at all absorbed b. Not very absorbed c. Moderately absorbed d. Quite absorbed e. Extremely absorbed
38A. Describe your general boredom during face-to-face class.
a. Not at all bored b. Not very bored c. Moderately bored d. Quite bored e. Extremely bored
38B. Describe your general boredom during online work for this course. a. Not at all bored b. Not very bored c. Moderately bored d. Quite bored e. Extremely bored
39A. Describe your level of curiosity during face-to-face class.
a. Not at all curious b. Not very curious c. Moderately curious d. Quite curious e. Extremely curious
39B. Describe your level of curiosity during online work for this course. a. Not at all curious b. Not very curious c. Moderately curious d. Quite curious e. Extremely curious
40A. Describe your general anxiety during face-to-face class.
a. Not at all anxious b. Not very anxious c. Moderately anxious d. Quite anxious e. Extremely anxious
40B. Describe your general anxiety during online work for this course. a. Not at all anxious b. Not very anxious c. Moderately anxious d. Quite anxious e. Extremely anxious
41A. Describe your level of interest during face-to-face class.
a. Not at all interested b. Not very interested c. Moderately interested d. Quite interested e. Extremely interested

SCALE DEVELOPMENT TO MEASURE ENGAGEMENT 118
41B. Describe your level of interest during online work for this course.
a. Not at all interested b. Not very interested c. Moderately interested d. Quite interested e. Extremely interested
42A. Describe your general confusion during face-to-face class.
a. Not at all confused b. Not very confused c. Moderately confused d. Quite confused e. Extremely confused
42B. Describe your general confusion during online work for this course. a. Not at all confused b. Not very confused c. Moderately confused d. Quite confused e. Extremely confused
43A. How often did you spend the expected amount of time in face-to-face class?
a. Never b. Rarely c. Sometimes d. Often e. All the time 43B. How often did you spend the expected amount of time completing online work for this course?
a. Never b. Rarely c. Sometimes d. Often e. All the time *44A. How likely are you to apply the concepts and principles taught in this class to real problems or challenges in your life outside of class?
a. Not at all likely b. Not very likely c. Moderately likely d. Quite likely e. Extremely likely
* 44B. How personally meaningful was the content of this course? a. Not at all likely b. Not very likely c. Moderately likely d. Quite likely e. Extremely likely
* Items excluded from Halverson and Graham’s theoretical framework and not analyzed in this research.

DISSERTATION CONCLUSION
The purpose of this study was to propose, operationalize, and test a theoretical framework
for learner engagement in blended learning environments. Despite widespread interest in learner
engagement, a comprehensive framework for understanding engagement is elusive in general
contexts and even less understood in those settings, which combine face-to-face and computer-
mediated instruction. Current engagement models and instruments are inadequate due to
contextual affordances (course and activity level vs. institutional) and to insufficient clarity about
constructs and subconstructs of engagement. Clarifying definitions and constructs not only gives
researchers a common language but provides guidance for future research in blended settings.
In Article 1, “Learner Engagement in Blended Learning Environments: A Conceptual
Framework,” we reviewed the existent literature on learner engagement. Finding a “duplication
of concepts and lack of differentiation in definitions” (Fredricks, Blumenfeld, & Paris, 2004, p.
65), we expanded our review from the fields of educational psychology and human development,
to also include disciplines with intersections with blended learning, such as artificial intelligence,
human-computer interaction, and educational technology. Drawing upon this broadened base,
we advanced several first order factors for cognitive and emotional engagement that might best
encompass the affordances of blended context. We proposed that cognitive engagement is
composed of attention, effort and persistence, time on task, cognitive strategy use, absorption,
and curiosity. Emotional engagement, we suggested, is composed of positive energy indicators,
including interest and enjoyment, happiness, and confidence, and negative energy indicators,
including boredom, frustration, and anxiety. We advocated investigating the first order factor of
confusion in greater detail, since depending upon the learner’s feelings about the learning
activity, confusion may indicate positive or negative energy (Baker, D’Mello, Rodrigo, &
Graesser, 2010; D’Mello, Lehman, Pekrun, & Graesser, 2014). We did not separate indicators
by context in this model.
The purpose of Article 2, “Scale Development to Measure Learner Engagement in
Blended Learning Environments,” was to operationalize and test the proposed model of blended
learning engagement using exploratory and confirmatory factor analysis. We developed and
investigated the structural validity of a new end-of-course self-report instrument, which we called
the Blended Learning Course Engagement Survey. The instrument accounted for context (online
or face-to-face) and the cognitive and emotional aspects of learner engagement. Indicators
measured their respective factors fairly well. However, results indicated that the original model
be adjusted to separate factors by context, suggesting that face-to-face engagement indicators are
not equivalent to online engagement indicators: flow perceived in a face-to-face context, for
example, is somehow different from flow perceived in an online setting.
In addition, lack of discriminant validity between first order factors led to a respecification
of the original models. We found it interesting that cognitive strategy use, conceived in various
other frameworks as the core element of cognitive engagement, correlated highly with attention
(.905) and effort and persistence (.994), both of which have been deemed behavioral engagement
in alternative models (see also Henrie, Halverson, & Graham, 2015). This gives support to our
assertion in Article 1 that these factors converge under cognitive engagement, “the expenditure
and reception of mental energy” (Halverson & Graham, under review). Two comparable
cognitive engagement models emerged. CE Model 3 was comprised of the factors of focused
attention (specified by attention, effort and persistence, cognitive strategy use, and absorption)
and curiosity; CE Model 4 was comprised of the factors of effort (specified by attention, effort
and persistence, and cognitive strategy use) and flow (specified by absorption and curiosity).

First order factors in emotional engagement likewise converged under three constructs:
positive emotional engagement (specified by enjoyment, happiness, and lack of detachment),
negative emotional engagement (specified by anxiety, frustration, and confusion), and
confidence. Since those indicators falling under positive emotional engagement are all positive
activating emotions or their orthogonal opposites, negative deactivating emotions, and those
specifying negative emotional engagement are classified as negative activating emotions
(Feldman Barrett & Russell, 1998; Pekrun & Linnenbrink-Garcia, 2012), new questions arise as
to the impact of energy-producing emotions (enjoyment, happiness, and attachment) and energy-
depleting emotions (frustration, anxiety, and confusion) upon learner engagement.
Our revised theoretical framework for blended learning engagement is only the first step
towards understanding how engagement is indicated in contexts that combine face-to-face and
technology-mediated instruction. Further refinements to the engagement scale would produce
even better measurements, especially in regards to the construct of flow. We utilized an end-of-
course survey in this research, which attempted to measure course-level engagement (see
Skinner & Pitzer, 2012, for further discussion of the levels at which student engagement has
been studied). However, to measure engagement at the moment of the learning activity, further
activity-level measures of engagement must be explored (Henrie, Larsen, Manwaring,
Halverson, & Graham, under review; Sinatra, Heddy, & Lombardi, 2015; Wang, Bergin, &
Bergin, 2014).
In conclusion, this dissertation has offered important insights to our understanding of
blended learning engagement. We have found that context matters when learners report on their
own engagement in settings that combine face-to-face and technology-mediated learning
activities. We also found empirical support for our argument that the behavior and cognitive

engagement models can be combined into one and the underlying construct—cognitive
engagement—considered the root of behavioral manifestations of learner engagement. These
findings can inform how we conceptualize and measure engagement in blended settings.

DISSERTATION REFERENCES
Astin, A. W. (1984). Student involvement: A developmental theory for higher education. Journal
of College Student Personnel, 40(5), 518–529. Retrieved from
https://www.middlesex.mass.edu/tutoringservices/downloads/astininv.pdf
Baker, R. S. J. d., D’Mello, S. K., Rodrigo, M. M. T., & Graesser, A. C. (2010). Better to be
frustrated than bored: The incidence, persistence, and impact of learners’ cognitive–
affective states during interactions with three different computer-based learning
environments. International Journal of Human-Computer Studies, 68(4), 223–241.
doi:10.1016/j.ijhcs.2009.12.003
D’Mello, S. K., Lehman, B., Pekrun, R., & Graesser, A. (2014). Confusion can be beneficial for
learning. Learning and Instruction, 29, 153–170. doi:10.1016/j.learninstruc.2012.05.003
Feldman Barrett, L., & Russell, J. A. (1998). Independence and bipolarity in the structure of
current affect. Journal of Personality and Social Psychology, 74(4), 967–984.
doi:10.1207/s15327752jpa8502
Filak, V. F., & Sheldon, K. M. (2008). Teacher support, student motivation, student need
satisfaction, and college teacher course evaluations: Testing a sequential path model.
Educational Psychology, 28(6), 711–724. doi:10.1080/01443410802337794
Floyd, F. J., & Widaman, K. F. (1995). Factor analysis in the development and refinement of
clinical assessment instruments. Psychological Assessment, 7(3), 286–299.
doi:10.1037//1040-3590.7.3.286
Fredricks, J. A., Blumenfeld, P. C., & Paris, A. H. (2004). School engagement: Potential of the
concept, state of the evidence. Review of Educational Research, 74(1), 59–109. Retrieved
from http://rer.sagepub.com/content/74/1/59.short

Gable, R. K. (1986). Instrument development in the affective domain. Boston, MA: Kluwer-
Nijhoff Pub.
Halverson, L. R., & Graham, C. R. (under review). Learner engagement in blended learning
environments: A conceptual framework. Educational Technology Research and
Development.
Henrie, C. R., Halverson, L. R., & Graham, C. R. (2015). Measuring student engagement in
technology-mediated learning: A review. Computers & Education, 90, 36–53.
doi:10.1016/j.compedu.2015.09.005
Henrie, C. R., Larsen, R., Manwaring, K., Halverson, L. R., & Graham, C. R. (under review).
Validation of a longitudinal activity-level measure of student engagement. Contemporary
Educational Psychology.
Hughes, J. N., Luo, W., Kwok, O.-M., & Loyd, L. K. (2008). Teacher-student support, effortful
engagement, and achievement: A 3-year longitudinal study. Journal of Educational
Psychology, 100(1), 1–14. doi:10.1037/0022-0663.100.1.1
Janosz, M. (2012). Part IV commentary: Outcomes of engagement and engagement as an
outcome: Some consensus, divergences, and unanswered questions. In S. L. Christenson,
A. L., Reschly, & C. Wylie (Eds.), Handbook of research on student engagement (pp.
695-703). New York, NY: Springer.
Kuh, G. D., Cruce, T. M., Shoup, R., Kinzie, J., Gonyea, R. M., & Gonyea, M. (2008).
Unmasking the effects of student engagement on first-year college grades and
persistence. The Journal of Higher Education, 79(5), 540–563.

Oncu, S., & Cakir, H. (2011). Research in online learning environments: Priorities and
methodologies. Computers & Education, 57, 1098–1108.
doi:10.1016/j.compedu.2010.12.009
Pekrun, R., & Linnenbrink-Garcia, L. (2012). Academic emotions and student engagement. In S.
L. Christenson, A. L., Reschly, & C. Wylie (Eds.), Handbook of research on student
engagement (pp. 259–282). New York, NY: Springer. Retrieved from
http://www.springerlink.com/index/TJ336T5302680662.pdf
Reschly, A. L., & Christenson, S. L. (2012). Jingle, jangle, and conceptual haziness: Evolution
and future directions of the engagement construct. In S. L. Christenson, A. L. Reschly, &
C. Wylie (Eds.), Handbook of research on student engagement (pp. 3-19). New York,
NY: Springer.
Schunk, D. H., & Mullen, C. A. (2012). Self-efficacy as an engaged learner. In S. L. Christenson,
A. L. Reschly, & C. Wylie (Eds.), Handbook of research on student engagement (pp.
219-235). New York, NY: Springer. doi:10.1007/978-1-4614-2018-7
Sinatra, G. M., Heddy, B. C., & Lombardi, D. (2015). The challenges of defining and measuring
student engagement. Educational Psychologist, 50(1), 1–13.
doi:10.1080/00461520.2014.1002924
Skinner, E. A. & Pitzer, J. (2012). Developmental dynamics of student engagement, coping, and
everyday resilience. In S. L. Christenson, A. L. Reschly, & C. Wylie (Eds.), Handbook of
research on student engagement (pp. 21-44). New York, NY: Springer.
Wang, Z., Bergin, C., & Bergin, D. A. (2014). Measuring engagement in fourth to twelfth grade
classrooms: The classroom engagement inventory. School Psychology Quarterly, 29,
517–535. doi:10.1037/spq0000050