Embed Size (px)
Citation preview
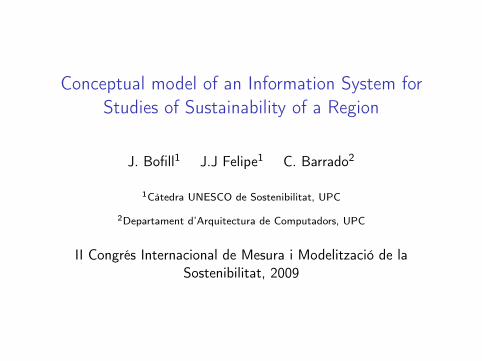
Conceptual model of an Information System forStudies of Sustainability of a Region
J. Bofill1 J.J Felipe1 C. Barrado2
1Càtedra UNESCO de Sostenibilitat, UPC
2Departament d’Arquitectura de Computadors, UPC
II Congrés Internacional de Mesura i Modelització de laSostenibilitat, 2009
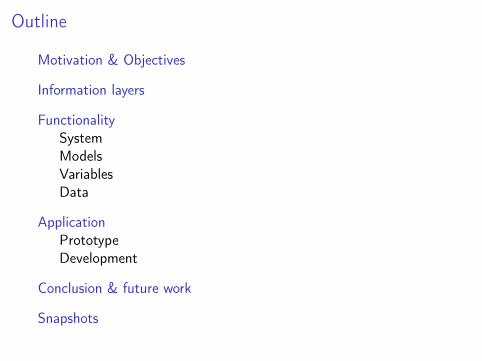
Outline
Motivation & Objectives
Information layers
FunctionalitySystemModelsVariablesData
ApplicationPrototypeDevelopment
Conclusion & future work
Snapshots
Motivation
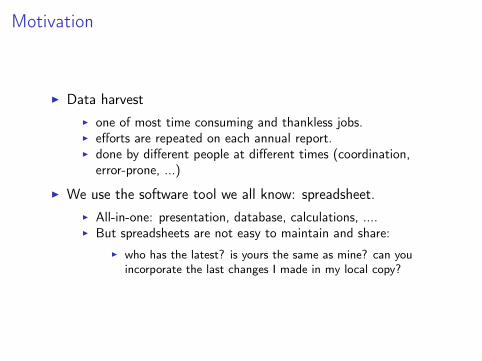
I Data harvestI one of most time consuming and thankless jobs.I efforts are repeated on each annual report.I done by different people at different times (coordination,
error-prone, ...)
I We use the software tool we all know: spreadsheet.I All-in-one: presentation, database, calculations, ....I But spreadsheets are not easy to maintain and share:
I who has the latest? is yours the same as mine? can youincorporate the last changes I made in my local copy?
Objectives
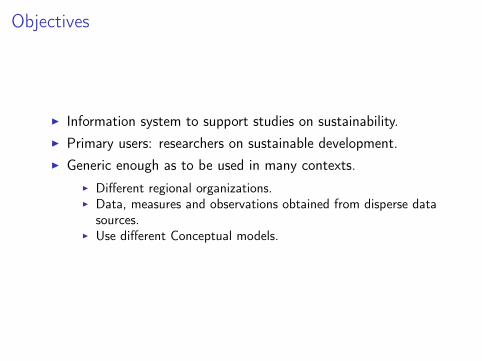
I Information system to support studies on sustainability.I Primary users: researchers on sustainable development.I Generic enough as to be used in many contexts.
I Different regional organizations.I Data, measures and observations obtained from disperse data
sources.I Use different Conceptual models.
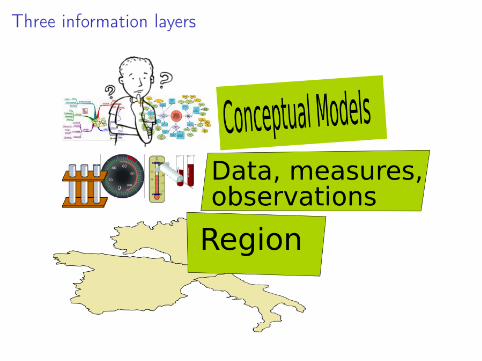
Three information layers
Data, measures and observations
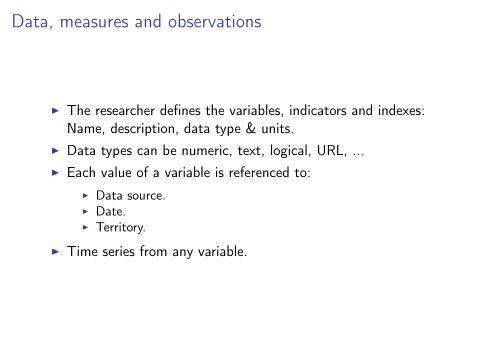
I The researcher defines the variables, indicators and indexes:Name, description, data type & units.
I Data types can be numeric, text, logical, URL, ...I Each value of a variable is referenced to:
I Data source.I Date.I Territory.
I Time series from any variable.
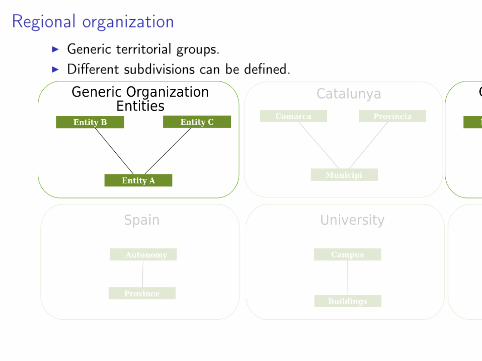
Regional organizationI Generic territorial groups.I Different subdivisions can be defined.
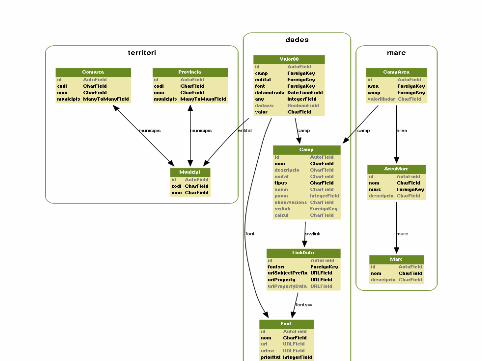
Conceptual Models
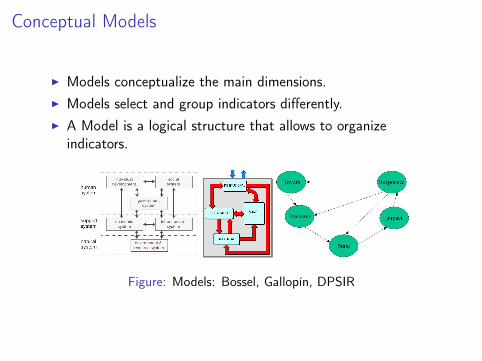
I Models conceptualize the main dimensions.I Models select and group indicators differently.I A Model is a logical structure that allows to organize
indicators.
Figure: Models: Bossel, Gallopín, DPSIR
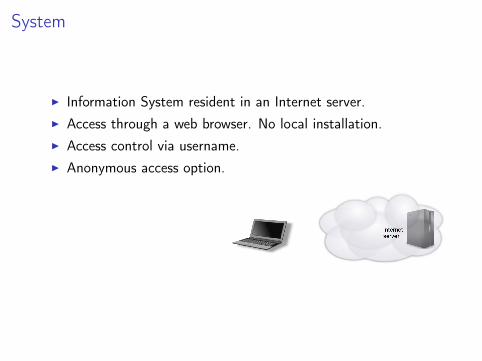
System
I Information System resident in an Internet server.I Access through a web browser. No local installation.I Access control via username.I Anonymous access option.
Conceptual Models
As a researcher, you can:I Use a previously defined conceptual model.I Define your team conceptual model.I Use your own model. Try a new model.I Use them simultaneously.
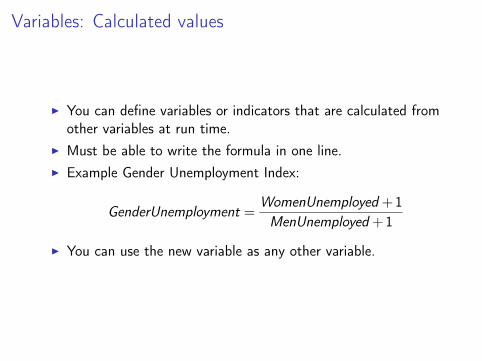
Variables: Calculated values
I You can define variables or indicators that are calculated fromother variables at run time.
I Must be able to write the formula in one line.I Example Gender Unemployment Index:
GenderUnemployment =WomenUnemployed +1
MenUnemployed +1
I You can use the new variable as any other variable.
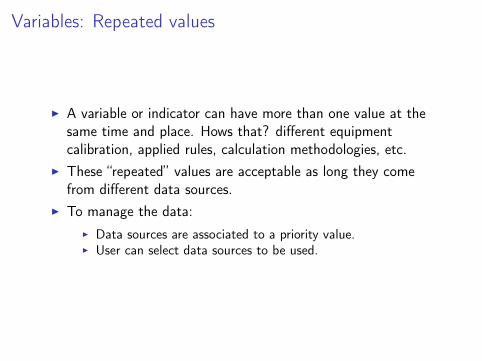
Variables: Repeated values
I A variable or indicator can have more than one value at thesame time and place. Hows that? different equipmentcalibration, applied rules, calculation methodologies, etc.
I These “repeated” values are acceptable as long they comefrom different data sources.
I To manage the data:I Data sources are associated to a priority value.I User can select data sources to be used.
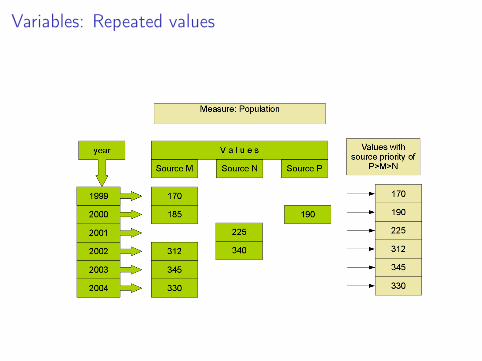
Variables: Repeated values
Variables: Repeated values
You can ..I Create your own values for experimentation,I Assign them as you own data source, ...
thenI Simulate different data scenariosI Create future scenarios ...
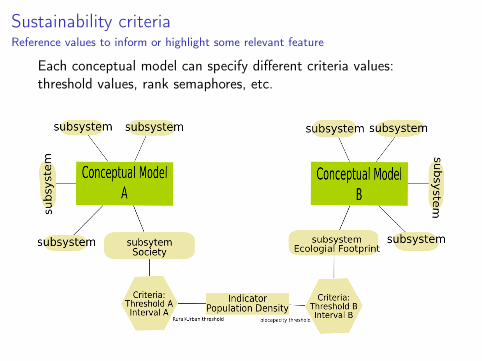
Sustainability criteriaReference values to inform or highlight some relevant feature
Each conceptual model can specify different criteria values:threshold values, rank semaphores, etc.
Working with data
I Daily work with data is done preferably with spreadsheets(excel, calc, ....)
I You can download data of any selection of indicators andregions.
I You can filter and select data by:I Conceptual modelI Indicators of subsystem of a conceptual modelI Regional subdivisionsI Data sources
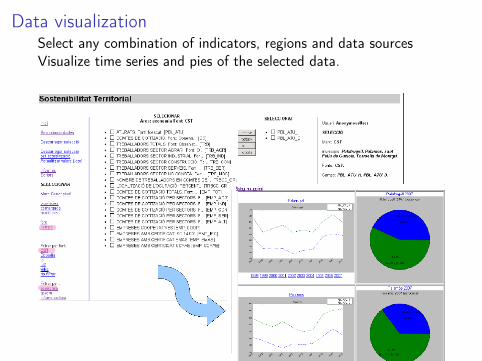
Data visualizationSelect any combination of indicators, regions and data sourcesVisualize time series and pies of the selected data.
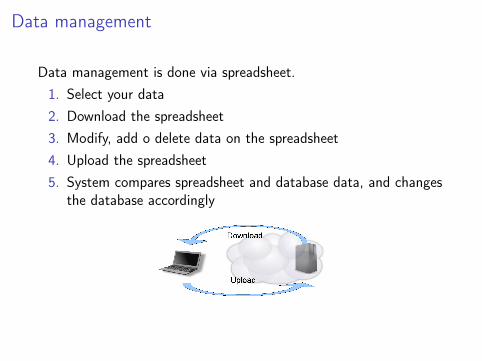
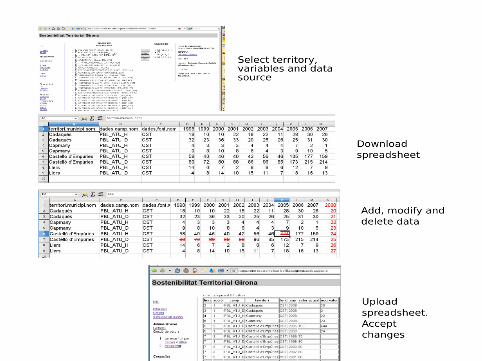
Data management
Data management is done via spreadsheet.1. Select your data2. Download the spreadsheet3. Modify, add o delete data on the spreadsheet4. Upload the spreadsheet5. System compares spreadsheet and database data, and changes
the database accordingly
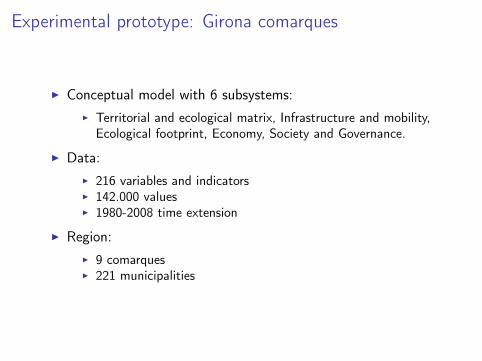
Experimental prototype: Girona comarques
I Conceptual model with 6 subsystems:I Territorial and ecological matrix, Infrastructure and mobility,
Ecological footprint, Economy, Society and Governance.
I Data:I 216 variables and indicatorsI 142.000 valuesI 1980-2008 time extension
I Region:I 9 comarquesI 221 municipalities
Software Development
I Only Free Software in thedevelopment and deployment.
I The end application will have a freesoftware license.
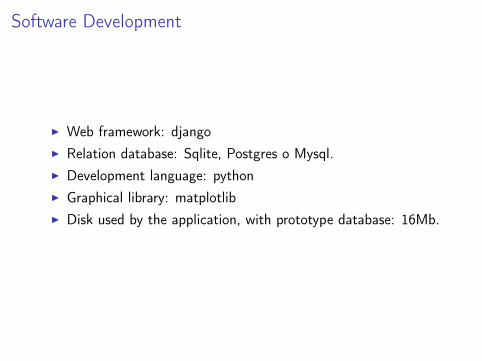
Software Development
I Web framework: djangoI Relation database: Sqlite, Postgres o Mysql.I Development language: pythonI Graphical library: matplotlibI Disk used by the application, with prototype database: 16Mb.
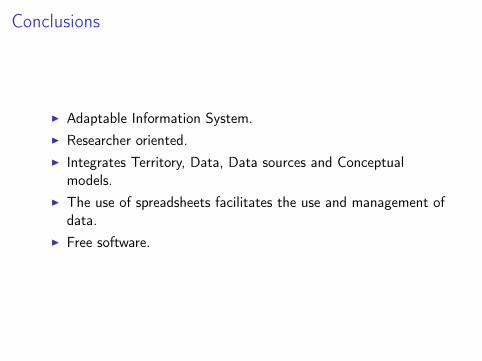
Conclusions
I Adaptable Information System.I Researcher oriented.I Integrates Territory, Data, Data sources and Conceptual
models.I The use of spreadsheets facilitates the use and management of
data.I Free software.
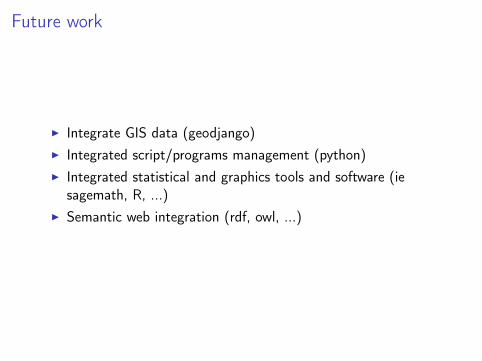
Future work
I Integrate GIS data (geodjango)I Integrated script/programs management (python)I Integrated statistical and graphics tools and software (ie
sagemath, R, ...)I Semantic web integration (rdf, owl, ...)
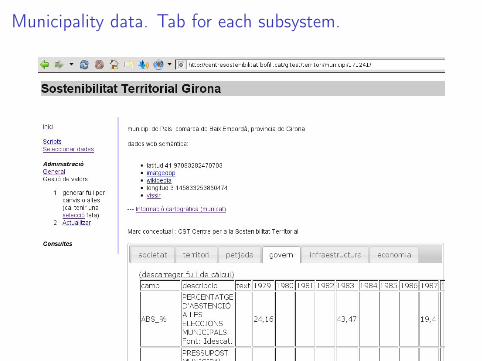
Municipality data. Tab for each subsystem.
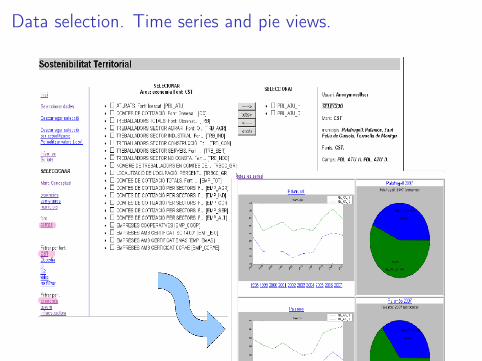
Data selection. Time series and pie views.
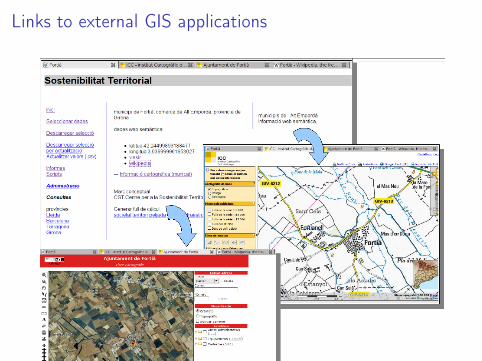
Links to external GIS applications
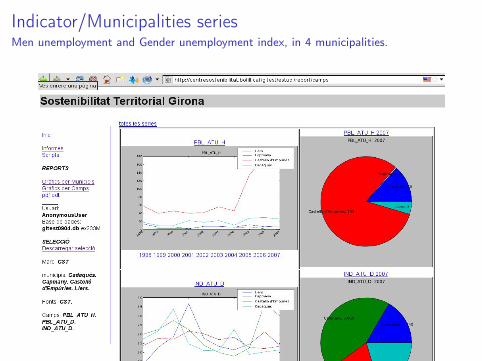
Indicator/Municipalities seriesMen unemployment and Gender unemployment index, in 4 municipalities.
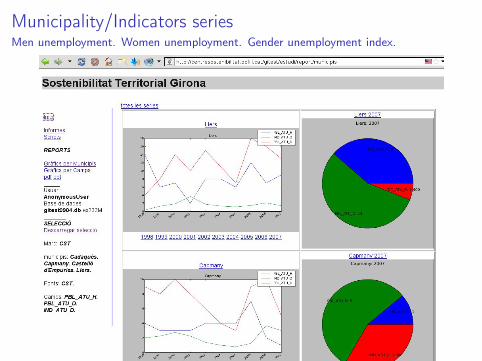
Municipality/Indicators seriesMen unemployment. Women unemployment. Gender unemployment index.