Embed Size (px)
Citation preview

Poverty in India: Concepts, Measurement and Trends
Manoj PandaCentre for Economic and Social Studies
(CESS), Hyderabad

Coverage• Introduction• Concepts of Poverty and Poverty Line• Measurement of Poverty • Trends in Poverty over Time• Variations across States and Social
Groups• Inequality: Concept and Measurement • Some Policy Issues

IntroductionIndia’s economic structure has changed dramatically over last 5-6 decades; among the most dynamic economies recently.
Benefits of growth not widely spread to various sections in society, reached only marginally to low income groups.
Similar experience of other countries too.Question then arose: Can we guarantee to all at least a minimum level of living necessary for physical and social development of a person?
Absolute poverty literature grew out of this question.
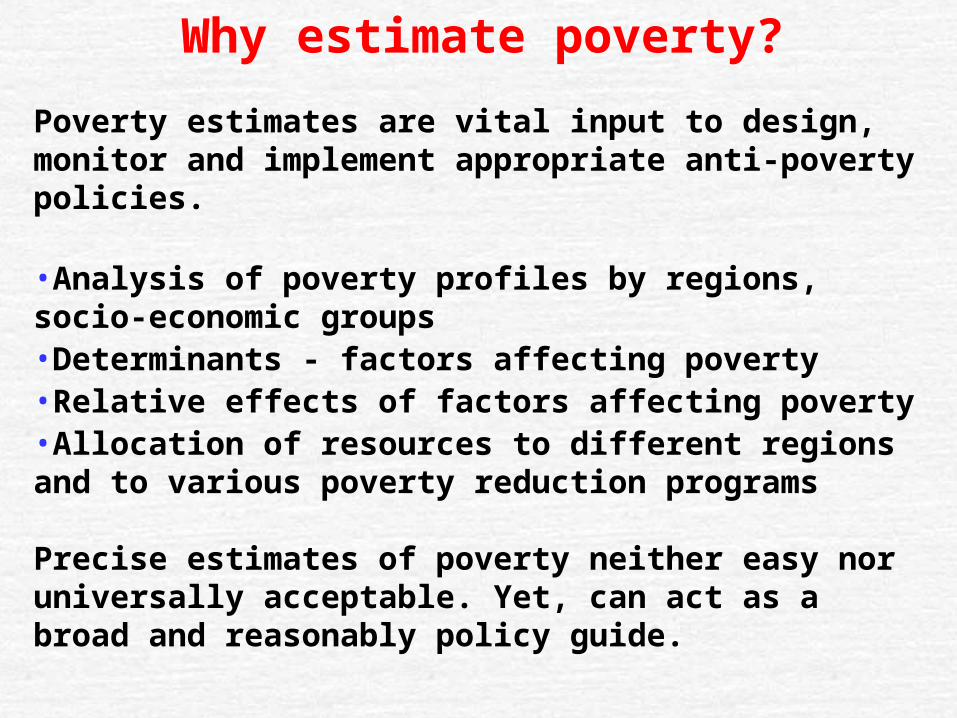
Why estimate poverty?Poverty estimates are vital input to design, monitor and implement appropriate anti-poverty policies.
•Analysis of poverty profiles by regions, socio-economic groups •Determinants - factors affecting poverty •Relative effects of factors affecting poverty•Allocation of resources to different regions and to various poverty reduction programs Precise estimates of poverty neither easy nor universally acceptable. Yet, can act as a broad and reasonably policy guide.

Intellectual genesis of poverty very oldAdam Smith, Ricardo, Marx: subsistence wage concept
An early empirical work by Dadabhai Naoroji, 1901
Estimated an income level “necessary for the bare wants of a human being, to keep him in ordinary good health and decency”. Estimated cost of food, clothing, hut, oil for lamp, barber and domestic utensils to arrive at ‘subsistence per head’.
In the absence of income distribution data, Naoroji compared computed subsistence level with per capita production to draw attention to mass poverty.
Remarkable work that parallels an early work on British poverty by Rowntree, 1901.

Poverty is multidimensionalDeprivation in income, illiteracy, malnutrition, mortality, morbidity, access to water and sanitation, vulnerability to economic shocks.
Income deprivation is linked in many cases to other forms of deprivation, but do not always move together with others. This discussion focuses on Income poverty.

Measurement of Poverty (Percentage of Poor)
Two basic ingredients in measuring poverty:
(1)Poverty Line: definition of threshold income or consumption level
(2)Data on size distribution of income or consumption (collected by a sample survey representative of the population)

Poverty Line (PL): Absolute vs. Relative
Relative PL defined in relative terms with reference to level of living of another person; or, in relation to an income distribution parameter.Examples: 50% of mean income or median, mean minus one standard deviation.
Absolute PL refers to a threshold income (consumption) level defined in absolute terms. Persons below a pre-defined threshold income are called poor.

Indian Poverty Line A minimum level of living necessary for physical and social development of a person.
Estimated as: total consumption expenditure level that meets energy (calorie) need of an average person.
•PL comprises of both food and non-food components of consumption.
•Considers non-food expenditure actually incurred corresponding to this total expenditure.
•Difficult to consider minimum non-food needs entirely on an objective basis
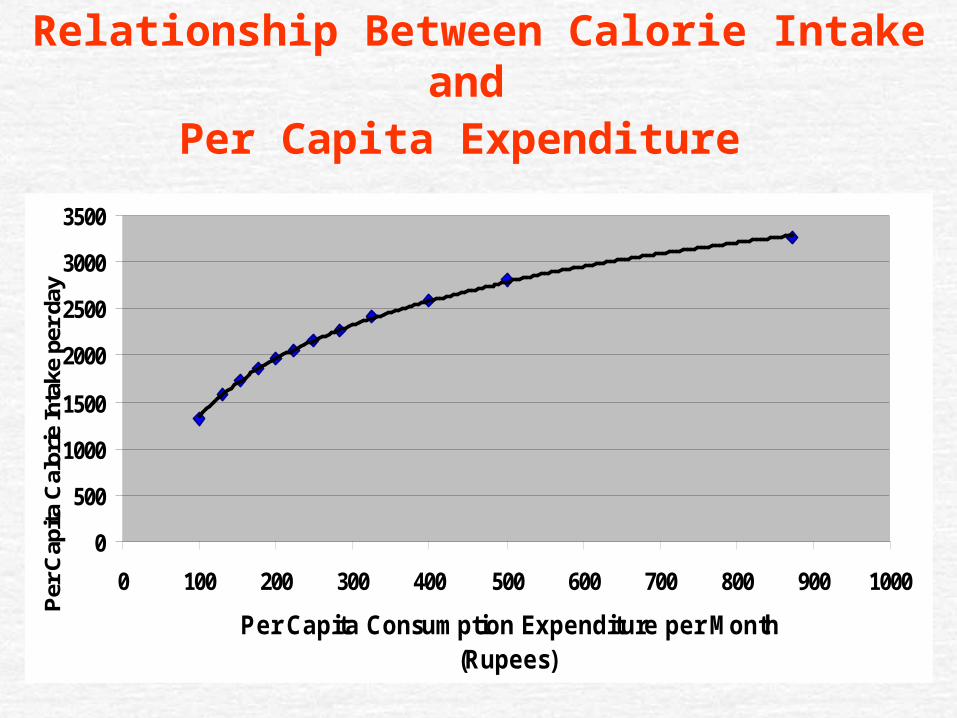
Relationship Between Calorie Intake and Per Capita Expenditure
0
500
1000
1500
2000
2500
3000
3500
0 100 200 300 400 500 600 700 800 900 1000
Per Capita Consumption Expenditure per Month(Rupees)
Per C
apita
Cal
orie
Inta
ke p
er d
ay

An Example of Size Distribution of Consumption Expenditure
MPCE %Population
0-150 3.2150-200 4.0200-250 6.5250-300 8.6300-340 10.0 (half of 10% are below poverty line 320)340-400 11.3400-450 8.6450-500 9.2500-550 9.3550-650 11.4650-800 8.9800-1000 5.0Above 1000 4.0All classes 100.0MPCE: Monthly Per Capita Consumption Expenditure
Poverty Line: Rs. 320 per capita per monthHCR= 3.2+4.0+6.5+8.6+5.0 = 27.3%

Incidence of poverty Vs. Under-nutrition
Classification of Population by Poverty Line and Calorie Norm - Rural India, 1977-78
Below Poverty
Line
Above Poverty
Line
Total
Below Calorie Norm
45.32 12.47 57.79
Above Calorie Norm
12.31 29.21 42.21
Total 57.63 42.37 100.00 Source: Government of India (1993): Report of Expert Group.

Official PL in IndiaOriginally estimated for 1973-74: Rs 49 and 56 for rural and urban areas respectively. Updated using an appropriate price index (CPIAL for rural India, CPIIW for urban). A monthly per capita consumption expenditure of Rs. 356 and 539 for rural and urban areas respectively for 2004-05. More than a quarter of India’s population remain below PL in 2004-05. 28.3% Rural 25.7% Urban 27.5% TotalAbsolute no.: 302 million in 2004-05

Poverty in India: Changes over time
Up to mid-1970s – fluctuations with cyclesSince mid-1970s – continuous fall
Except a few years immediately after start of reforms (early 1990s)Controversies around estimates for 1999-2000 (under estimates poverty)
2025303540455055606570
1960
1963
1966
1969
1972
1975
1978
1981
1984
1987
1990
1993
1996
1999
2002
2005
% p
opul
atio
n be
low
PL Rural HCR
Urban HCR

Data Contamination in 1999-20007-Day Recall versus 30-Day Recall
NSSO expenditure data collected on 7-day recall period basis during 51st-54th rounds 13-18% larger than that from the 30-day recall period basis.
This difference is reduced to 3 to 4% in the 55th round. Critics attribute this reduction to mix up of recall periods by respondents affecting comparability with previous large-scale surveys.
The 7-day recall period reports more food expenditure and very significant fall in poverty.
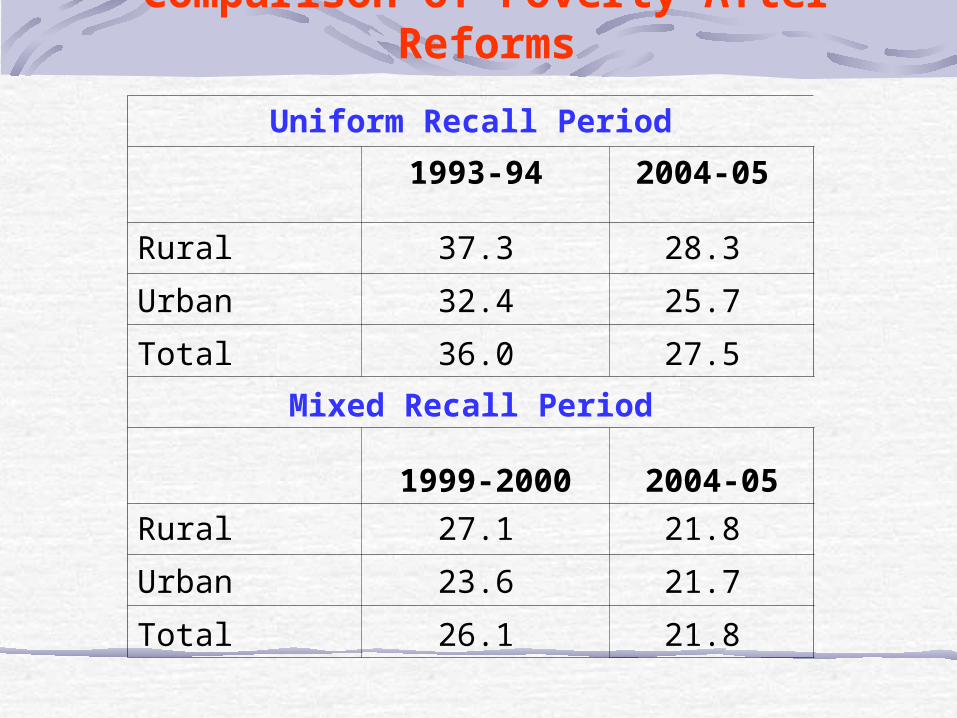
Comparison of Poverty After Reforms
Uniform Recall Period1993-94 2004-05
Rural 37.3 28.3
Urban 32.4 25.7
Total 36.0 27.5
Mixed Recall Period
1999-2000 2004-05Rural 27.1 21.8
Urban 23.6 21.7
Total 26.1 21.8

Poverty Head Count Ratio: Major Indian States

Poverty By Social Groups: Rural 2004-05
States ST SC OBC OTHERSAndhra Pradesh 30.5 15.4 9.5 4.1Assam 14.1 27.7 18.8 25.4Bihar 53.3 64 37.8 26.6Chhattisgarh 54.7 32.7 33.9 29.2Delhi 0.0 0.0 0.0 10.6Gujarat 34.7 21.8 19.1 4.8Haryana 0.0 26.8 13.9 4.2Himachal Pradesh 14.9 19.6 9.1 6.4Jammu & Kashmir 8.8 5.2 10.0 3.3Jharkhand 54.2 57.9 40.2 37.1Karnataka 23.5 31.8 20.9 13.8Kerala 44.3 21.6 13.7 6.6Madhya Pradesh 58.6 42.8 29.6 13.4Maharashtra 56.6 44.8 23.9 18.9Orissa 75.6 50.2 36.9 23.4Punjab 30.7 14.6 10.6 2.2Rajasthan 32.6 28.7 13.1 8.2Tamil Nadu 32.1 31.2 19.8 19.1Uttar Pradesh 32.4 44.8 32.9 19.7Uttarakhand 43.2 54.2 44.8 33.5West Bengal 42.4 29.5 18.3 27.5All India 47.2 36.8 26.7 16.1

Poverty By Social Groups: Urban 2004-05
States ST SC OBC OTHERSAndhra Pradesh 50 39.9 28.9 20.6Assam 4.8 8.6 8.6 4.2Bihar 57.2 67.2 41.4 18.3Chhattisgarh 41.0 52.0 52.7 21.4Delhi 9.4 35.8 18.3 6.4Gujarat 21.4 16 22.9 7.0Haryana 4.6 33.4 22.5 5.9Himachal Pradesh 2.4 5.6 10.1 2.0Jammu & Kashmir 0.0 13.7 4.8 7.8Jharkhand 45.1 47.2 19.1 9.2Karnataka 58.3 50.6 39.1 20.3Kerala 19.2 32.5 24.3 7.8Madhya Pradesh 44.7 67.3 55.5 20.8Maharashtra 40.4 43.2 35.6 26.8Orissa 61.8 72.6 50.2 28.9Punjab 2.1 16.1 8.4 2.9Rajasthan 24.1 52.1 35.6 20.7Tamil Nadu 32.5 40.2 20.9 6.5Uttar Pradesh 37.4 44.9 36.6 19.2Uttarakhand 64.4 65.7 46.5 25.5West Bengal 25.7 28.5 10.4 13.0All India 33.3 39.9 31.4 16.0

Poverty MeasuresHead Count Ratio (HCR),
Poverty Gap (PG) and squared poverty gap (SPG)
nmHCR
Poverty MeasuresHead Count Ratio (HCR), Poverty Gap (PG) and Squared Poverty Gap (SPG)
)(11
m
i
i
zyz
nPG
2
1
1
m
i
i
zyz
nSPG
m= no. of poor population, n = total population,z= poverty line, yi =income of i-th person
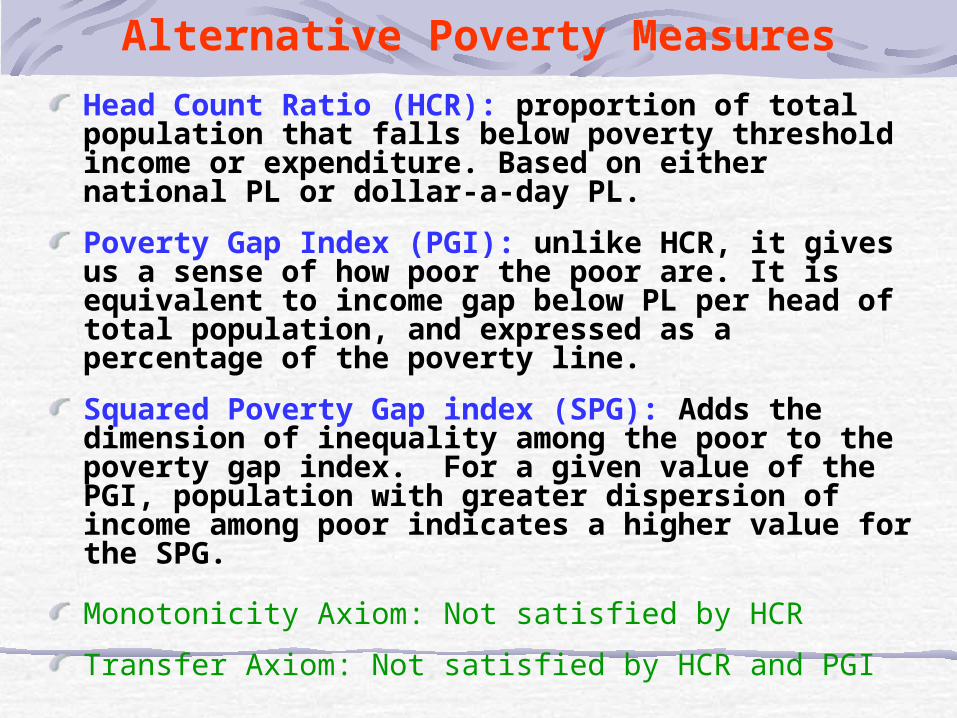
Alternative Poverty MeasuresHead Count Ratio (HCR): proportion of total population that falls below poverty threshold income or expenditure. Based on either national PL or dollar-a-day PL.Poverty Gap Index (PGI): unlike HCR, it gives us a sense of how poor the poor are. It is equivalent to income gap below PL per head of total population, and expressed as a percentage of the poverty line. Squared Poverty Gap index (SPG): Adds the dimension of inequality among the poor to the poverty gap index. For a given value of the PGI, population with greater dispersion of income among poor indicates a higher value for the SPG.
Monotonicity Axiom: Not satisfied by HCR Transfer Axiom: Not satisfied by HCR and PGI

Incidence of poverty affected by two factors:
(1)Growth in average income (2)Distribution.
Poverty reduction fast when average income rises and inequality falls.
Fluctuations in poverty incidence till early 1970s primarily due to slow per capita income growth.
Incidence of poverty started to fall after mid-1970s when there was marked acceleration in per capita GDP growth rate to above 3 per cent.
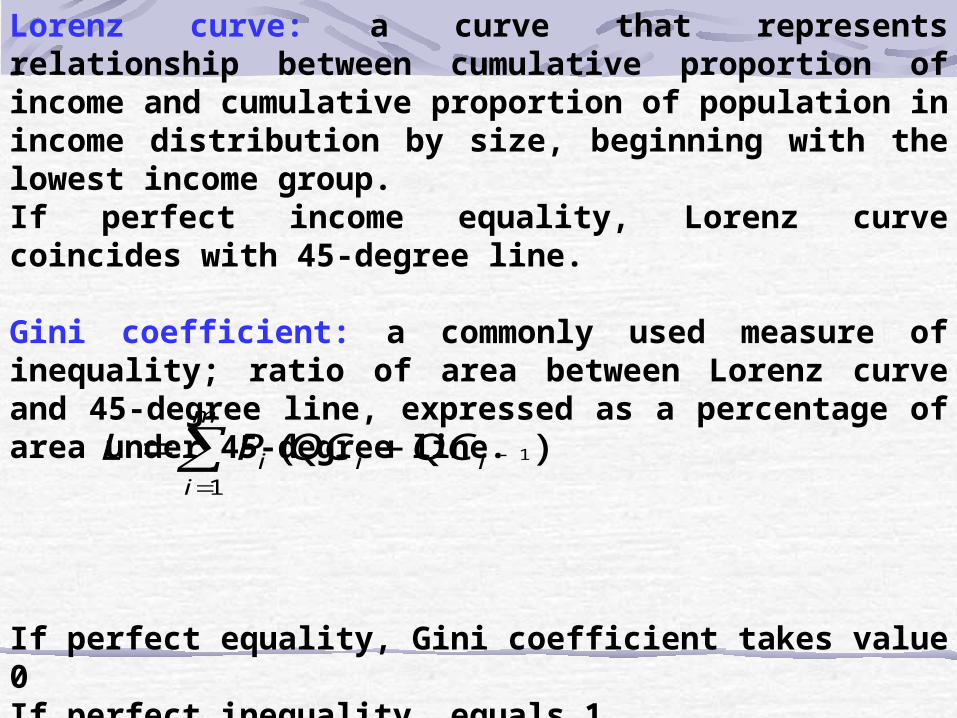
Lorenz curve: a curve that represents relationship between cumulative proportion of income and cumulative proportion of population in income distribution by size, beginning with the lowest income group. If perfect income equality, Lorenz curve coincides with 45-degree line. Gini coefficient: a commonly used measure of inequality; ratio of area between Lorenz curve and 45-degree line, expressed as a percentage of area under 45-degree line.
If perfect equality, Gini coefficient takes value 0If perfect inequality, equals 1. Internationally, Gini coeff. normallyranges between 0.25 & 0.7
)(1
1
m
iiii QCQCPL
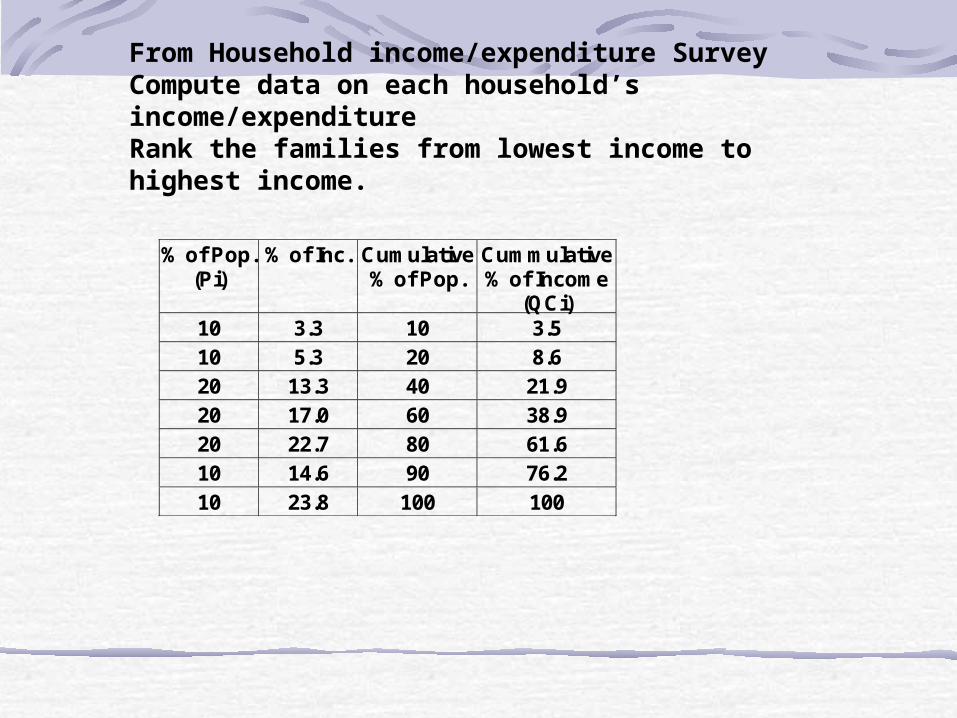
From Household income/expenditure SurveyCompute data on each household’s income/expenditureRank the families from lowest income to highest income.
% of Pop. (Pi)
% of Inc. Cumulative % of Pop.
Cummulative % of Income
(QCi) 10 3.3 10 3.5 10 5.3 20 8.6 20 13.3 40 21.9 20 17.0 60 38.9 20 22.7 80 61.6 10 14.6 90 76.2 10 23.8 100 100

Lorenz Curve
Cumulative % of Population
Cumulative % of Income
X=Area of the hatched region Gini coefficient = [X/50]100
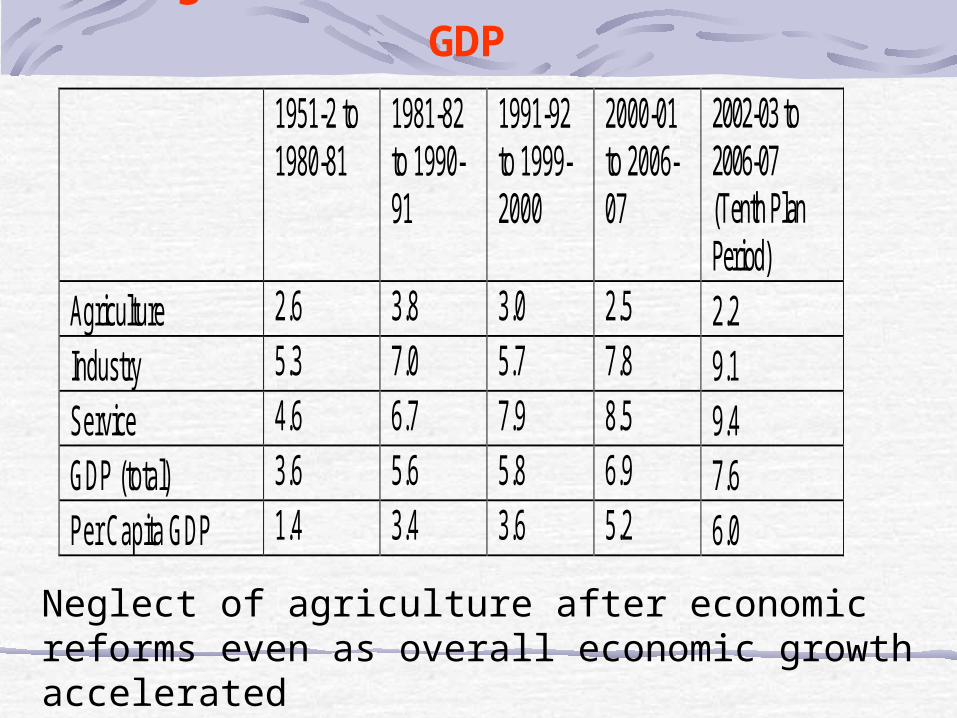
Average Annual Growth Rates: Real GDP
1951-2 to 1980-81
1981-82 to 1990-91
1991-92 to 1999-2000
2000-01 to 2006-07
2002-03 to 2006-07 (Tenth Plan Period)
Agriculture 2.6 3.8 3.0 2.5 2.2 Industry 5.3 7.0 5.7 7.8 9.1 Service 4.6 6.7 7.9 8.5 9.4 GDP (total) 3.6 5.6 5.8 6.9 7.6 Per Capita GDP 1.4 3.4 3.6 5.2 6.0
Neglect of agriculture after economic reforms even as overall economic growth accelerated

Average Annual Growth Rate in Per Capita GSDP Arranged by 1993-94 Per Capita GSDP
0
2000
4000
6000
8000
10000
12000
14000
16000P
unja
b
Mah
aras
htra
Har
yana
Guj
arat
Tam
il N
adu
Him
acha
l Pra
desh
Ker
ala
Kar
nata
ka
And
hra
Pra
desh
Jam
mu
and
Kas
hmir
Wes
t Ben
gal
Mad
hya
Pra
desh
Raj
asth
an
Ass
am
Utta
r Pra
desh
Oris
sa
Bih
ar
0.0
1.0
2.0
3.0
4.0
5.0
6.0
Per capita Income 1993-94 Growth Rate 1993-2004
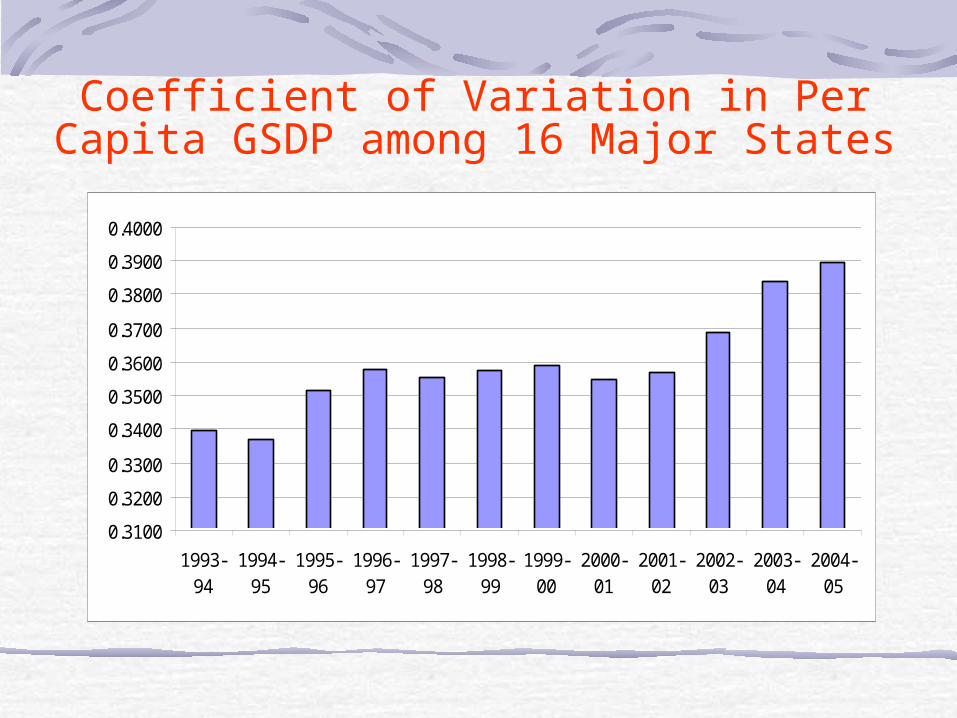
Coefficient of Variation in Per Capita GSDP among 16 Major States
0.3100
0.3200
0.3300
0.3400
0.3500
0.3600
0.3700
0.3800
0.3900
0.4000
1993-94
1994-95
1995-96
1996-97
1997-98
1998-99
1999-00
2000-01
2001-02
2002-03
2003-04
2004-05

States
Urban MPCE as % of Rural MPCE
1993-94 2004-05Andhra Pradesh 141.5 173.9
Assam 177.9 194.8
Bihar 142.9 166.9
Chhatishgarh 180.6 232.9
Gujarat 149.8 187.1
Haryana 123.1 132.3
Himachal Pradesh 212.8 174.2
Jharkhand 190.7 232.0
Karnataka 157.2 203.3
Kerala 126.7 127.4
Madhya Pradesh 155.7 205.9
Maharashtra 194.1 202.1
Orissa 183.2 189.7
Punjab 118.0 156.6
Rajasthan 132.0 163.1
Tamil Nadu 149.0 179.4
Uttar Pradesh 141.2 151.2
Uttaranchal 166.7 158.5
West Bengal 169.9 200.0
All India 163.0 188.2
Urban-Rural Differences in Mean Consumption Expenditure

Factors affecting PovertyPoverty depends on per capita household income which in turn affected by employment, wage rate, land productivity, industrialisation, expansion of service sector and other general growth and distribution factors
Special role of •per capita agricultural income•Employment and real wage rate
•Inflation rate and relative food prices
•Government expenditurePer capita development expenditureSocial sector expenditure

Indian growth process since 1950s more or less distribution neutral till 1980s. Importance of a critical minimum steady growth in per capita income for poverty reduction. Inequality increased in recent years after reforms.
Income elasticity of poverty has fallen. A given growth will be associated with more limited gains for the poorHigher growth might more than compensate the adverse effect if fall in elasticity is small.
Reasons for weak participation of poor: limited access to education, land, credit; low agrl growth, underdeveloped infrastructure such as irrigation, roads, electricity in poorer states

Demographic Dividend• AS fertility drops, ratio of workers to non-
workers rises. • Provides an window of opportunity provided
potential workers acquire skills and find productive employment
• About a fourth of poverty reduction could be attributed to demographic factors in India
• Right economic policies critical, otherwise the scenario could turn out to be demographic liability
• Dividend for 2-3 decades only since proportion of older population would eventually increase increasing dependency ratio again
Long term scenario for Poverty
• Long term growth prospects fairly optimistic: India likely to continue among the fasted growing economies, BRIC to dominate world economy
• India might surpass Japan and Germany in terms of total size of the economy, yet its per capita income would be less than world average for a long time
• Poverty could be reduced faster provided inequality is under control, labour intensive activities must grow, removal of rigidities in land and labour market critical for reallocation of resources
• Government can afford to devote more resources for poverty removal programmes: wage employment (NREGA) or self employment type (SJSY).

Thank You