Embed Size (px)
Citation preview

ConceptDraw DIAGRAM
Live Objects Lessons
CS Odessa corp.
ConceptDraw DIAGRAM Live Objects Lessons
2
Introduction ..................................................................................................................................... 3
Lesson 1. How to create an object with a managed separator ....................................................... 4
Lesson 2. Creating a text-driven object ........................................................................................... 5
Lesson 3. Creating a control point-driven object ............................................................................. 7
Lesson 4. Creating an object with a custom action ......................................................................... 8
Lesson 5. Creating an object that changes its form ........................................................................ 9
Lesson 6. Creating an object that changes its properties through an action ................................ 12
Lesson 7. Creating a list as an object ............................................................................................. 13
Lesson 8. Creating a divided bar object ......................................................................................... 16
Lesson 9. Creating a simple bar graph object ................................................................................ 19
Lesson 10. Creating a simple live object ........................................................................................ 31
Lesson 11. Creating a common live object .................................................................................... 32
Lesson 12. Creating a dynamic live object ..................................................................................... 34
Lesson 13. Creating a Rapid Draw object ...................................................................................... 44
ConceptDraw DIAGRAM Live Objects Lessons
3
Introduction
This document will guide you through the extensive options available to you when creating custom
objects using ConceptDraw DIAGRAM. Each chapter gives step-by-step information on a specific topic,
including lessons on STATIC STATE DRAWING, DYNAMIC STATE DRAWING, LIVE OBJECTS,
and RAPID DRAW
Lessons 1, 2, and 3 show you how to create special drawing objects;
Lessons 4, 5, and 6 show you how to create static state drawing objects;
Lessons 7, 8, and 9 show you how to create dynamic state drawing objects;
Lessons 10, 11, and 12 explain the methods behind creating complex live objects,
Lesson 13 shows you how to create Rapid Draw objects.
Overview
Lesson 1 describes the actions needed to create a simple object, with a part that depends on the
position of a control point.
Lesson 2 shows you how you can control the properties of an object. In the example given, we show
how a text value can change the dimensions of an object.
Lesson 3 continues the theme from lesson 1, this time describing a more complex example of the
relationship between object and control point.
Lesson 4 shows you how to create a simple custom action for an object, and how these actions affect
the object's properties.
Lesson 5 demonstrates a more elaborate result possible when using a custom action - in this case, the
action causes the object to change appearance completely.
Lesson 6 gives another example of using a custom action to control certain properties of an object, in
this case its angle on the page.
Lesson 7 shows the possibilities of interaction between a table of properties and CDBasic-script to
create a list of rows in the form of an object.
Lesson 8 explains how to create a divided bar object, to which you can add or delete sections, and input
values for the sections directly into the object.
Lesson 9 shows you how to create an object with a set of sub-objects, in this case a simple bar graph.
Lesson 10 explains the basics of working with a data source, and how to create a simple live object that
displays text from an external text file.
Lesson 11 shows how to work with CSV data sources, and how you can use them to set the properties of
an object.
Lesson 12 shows how the simple bar graph from lesson 9 can be turned into a live object that reads data
from an external CSV file of variable length.
Lesson 13 describes the function of Rapid Draw, and how you can create Rapid Draw objects from
common library objects.
ConceptDraw DIAGRAM Live Objects Lessons
4
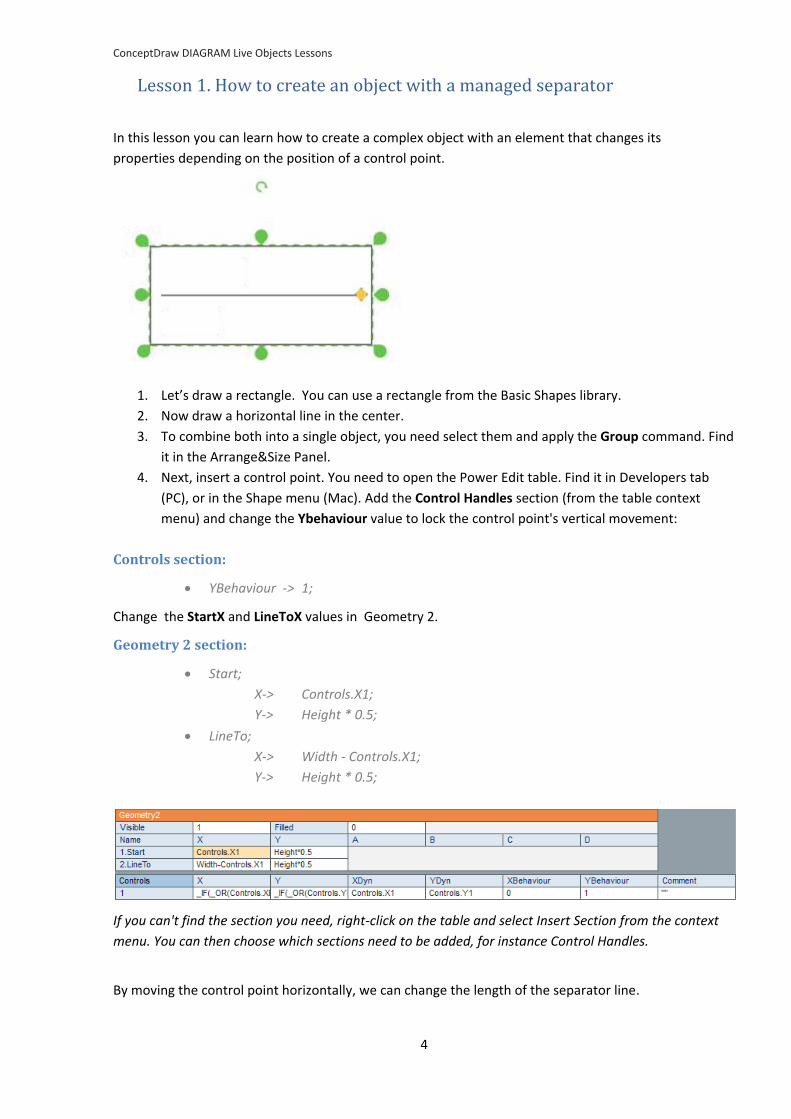
Lesson 1. How to create an object with a managed separator
In this lesson you can learn how to create a complex object with an element that changes its
properties depending on the position of a control point.
1. Let’s draw a rectangle. You can use a rectangle from the Basic Shapes library.
2. Now draw a horizontal line in the center.
3. To combine both into a single object, you need select them and apply the Group command. Find
it in the Arrange&Size Panel.
4. Next, insert a control point. You need to open the Power Edit table. Find it in Developers tab
(PC), or in the Shape menu (Mac). Add the Control Handles section (from the table context
menu) and change the Ybehaviour value to lock the control point's vertical movement:
Controls section:
YBehaviour -> 1;
Change the StartX and LineToX values in Geometry 2.
Geometry 2 section:
Start;
X-> Controls.X1;
Y-> Height * 0.5;
LineTo;
X-> Width - Controls.X1;
Y-> Height * 0.5;
If you can't find the section you need, right-click on the table and select Insert Section from the context
menu. You can then choose which sections need to be added, for instance Control Handles.
By moving the control point horizontally, we can change the length of the separator line.
ConceptDraw DIAGRAM Live Objects Lessons
5
Objects that can change their geometry according to a control point (similar to the above mentioned)
can be found in the Organizational Chart library provided with the Organizational Charts solution in the
Management area.
Lesson 2. Creating a text-driven object
In this lesson you will learn how to create an object that changes its width and height depending on the
numerical value entered into the object's text field.
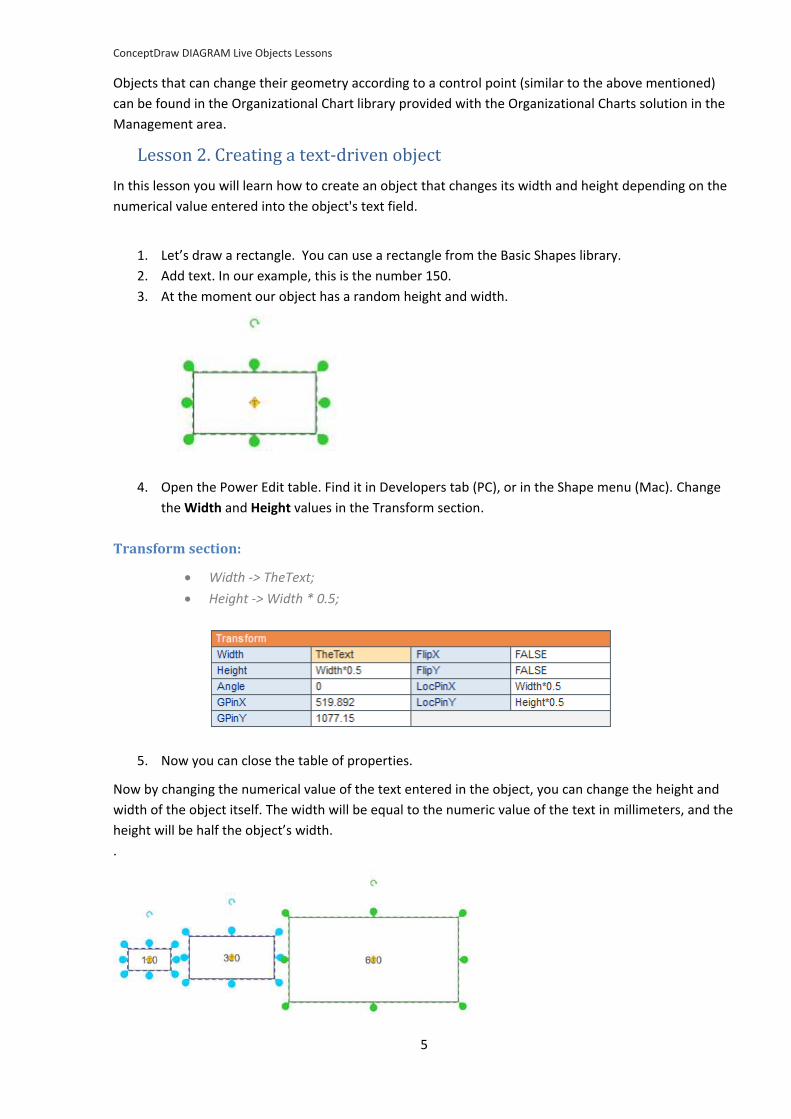
1. Let’s draw a rectangle. You can use a rectangle from the Basic Shapes library.
2. Add text. In our example, this is the number 150.
3. At the moment our object has a random height and width.
4. Open the Power Edit table. Find it in Developers tab (PC), or in the Shape menu (Mac). Change
the Width and Height values in the Transform section.
Transform section:
Width -> TheText;
Height -> Width * 0.5;
5. Now you can close the table of properties.
Now by changing the numerical value of the text entered in the object, you can change the height and
width of the object itself. The width will be equal to the numeric value of the text in millimeters, and the
height will be half the object’s width.
.
ConceptDraw DIAGRAM Live Objects Lessons
6
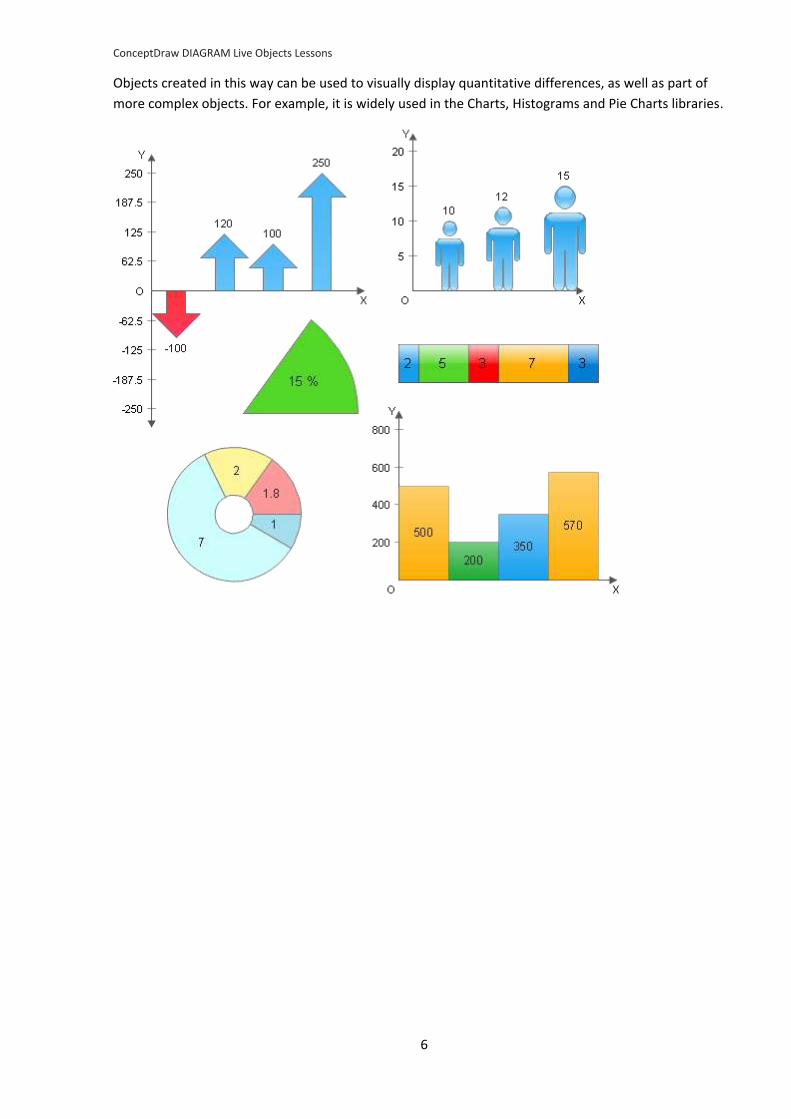
Objects created in this way can be used to visually display quantitative differences, as well as part of
more complex objects. For example, it is widely used in the Charts, Histograms and Pie Charts libraries.
ConceptDraw DIAGRAM Live Objects Lessons
7
Lesson 3. Creating a control point-driven object
This lesson describes how you can affect an object's properties - for instance, its fill color - by changing
the position of a control point.
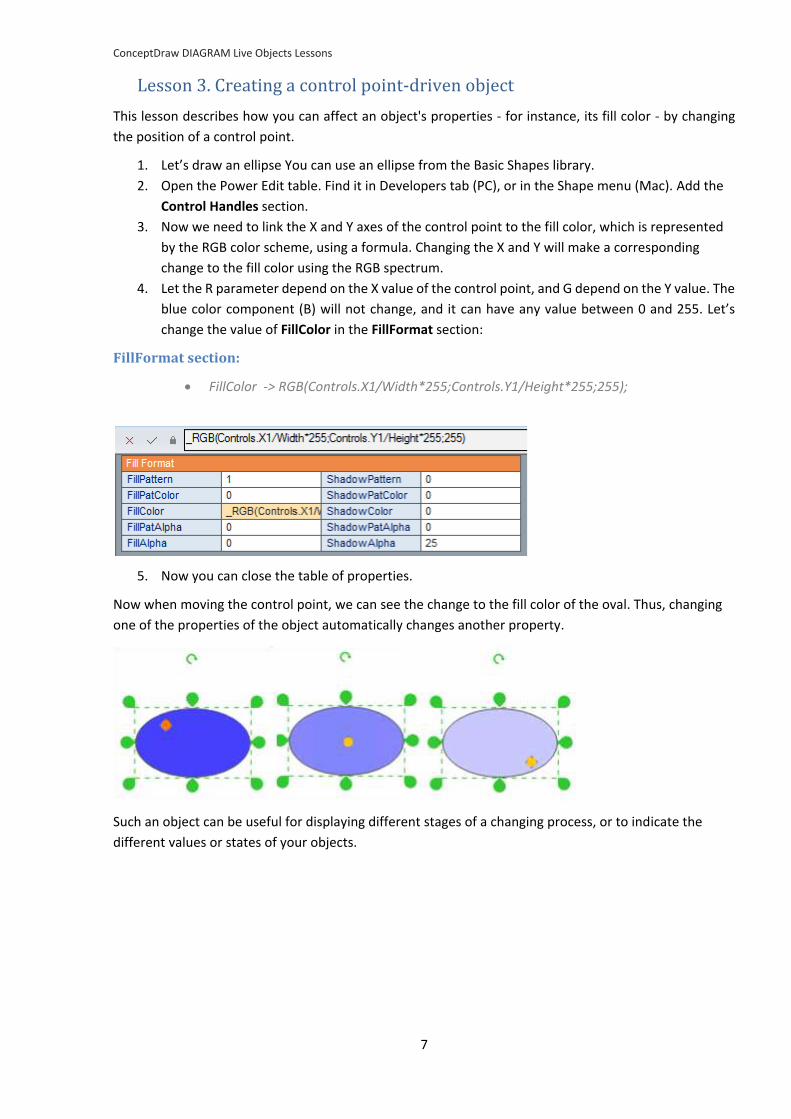
1. Let’s draw an ellipse You can use an ellipse from the Basic Shapes library.
2. Open the Power Edit table. Find it in Developers tab (PC), or in the Shape menu (Mac). Add the
Control Handles section.
3. Now we need to link the X and Y axes of the control point to the fill color, which is represented
by the RGB color scheme, using a formula. Changing the X and Y will make a corresponding
change to the fill color using the RGB spectrum.
4. Let the R parameter depend on the X value of the control point, and G depend on the Y value. The
blue color component (B) will not change, and it can have any value between 0 and 255. Let’s
change the value of FillColor in the FillFormat section:
FillFormat section:
FillColor -> RGB(Controls.X1/Width*255;Controls.Y1/Height*255;255);
5. Now you can close the table of properties.
Now when moving the control point, we can see the change to the fill color of the oval. Thus, changing
one of the properties of the object automatically changes another property.
Such an object can be useful for displaying different stages of a changing process, or to indicate the
different values or states of your objects.
ConceptDraw DIAGRAM Live Objects Lessons
8
Lesson 4. Creating an object with a custom action
This lesson shows you how to assign a custom action to an object. This example uses a custom action to
change the position of text in relation to the object.
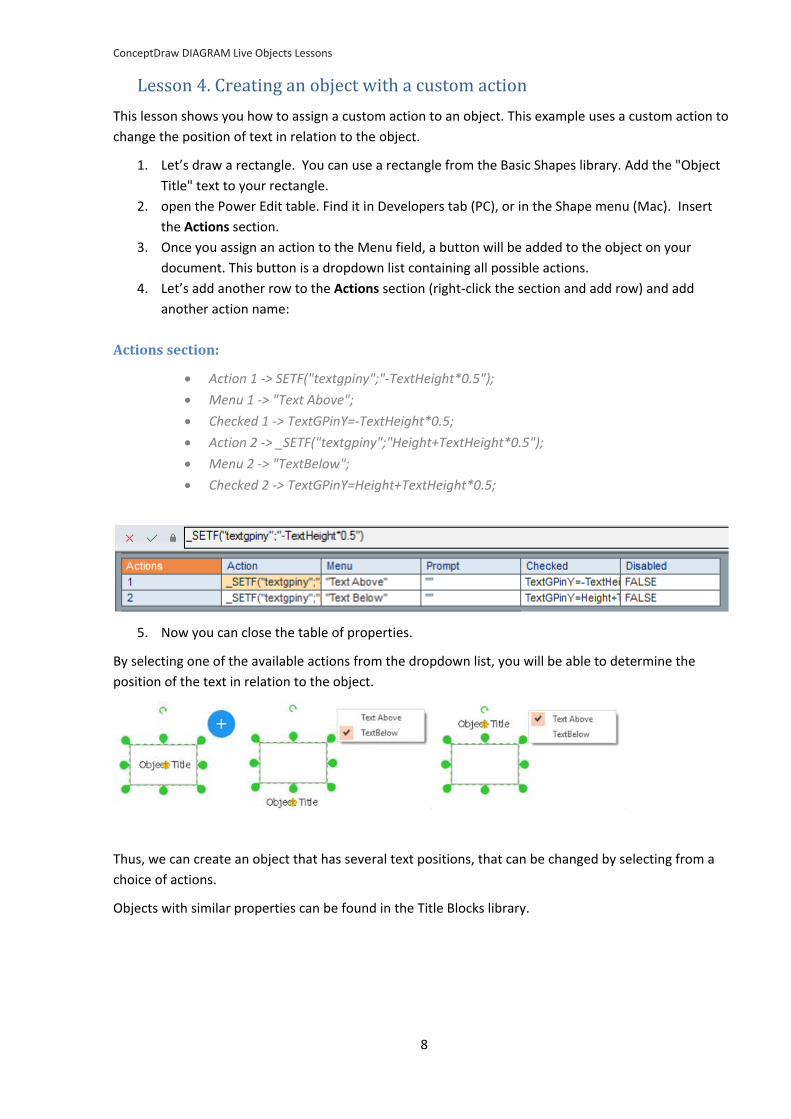
1. Let’s draw a rectangle. You can use a rectangle from the Basic Shapes library. Add the "Object
Title" text to your rectangle.
2. open the Power Edit table. Find it in Developers tab (PC), or in the Shape menu (Mac). Insert
the Actions section.
3. Once you assign an action to the Menu field, a button will be added to the object on your
document. This button is a dropdown list containing all possible actions.
4. Let’s add another row to the Actions section (right-click the section and add row) and add
another action name:
Actions section:
Action 1 -> SETF("textgpiny";"-TextHeight*0.5");
Menu 1 -> "Text Above";
Checked 1 -> TextGPinY=-TextHeight*0.5;
Action 2 -> _SETF("textgpiny";"Height+TextHeight*0.5");
Menu 2 -> "TextBelow";
Checked 2 -> TextGPinY=Height+TextHeight*0.5;
5. Now you can close the table of properties.
By selecting one of the available actions from the dropdown list, you will be able to determine the
position of the text in relation to the object.
Thus, we can create an object that has several text positions, that can be changed by selecting from a
choice of actions.
Objects with similar properties can be found in the Title Blocks library.
ConceptDraw DIAGRAM Live Objects Lessons
9
Lesson 5. Creating an object that changes its form
This lesson explains how to create an object that changes its appearance (its geometry), depending on
the selected action.
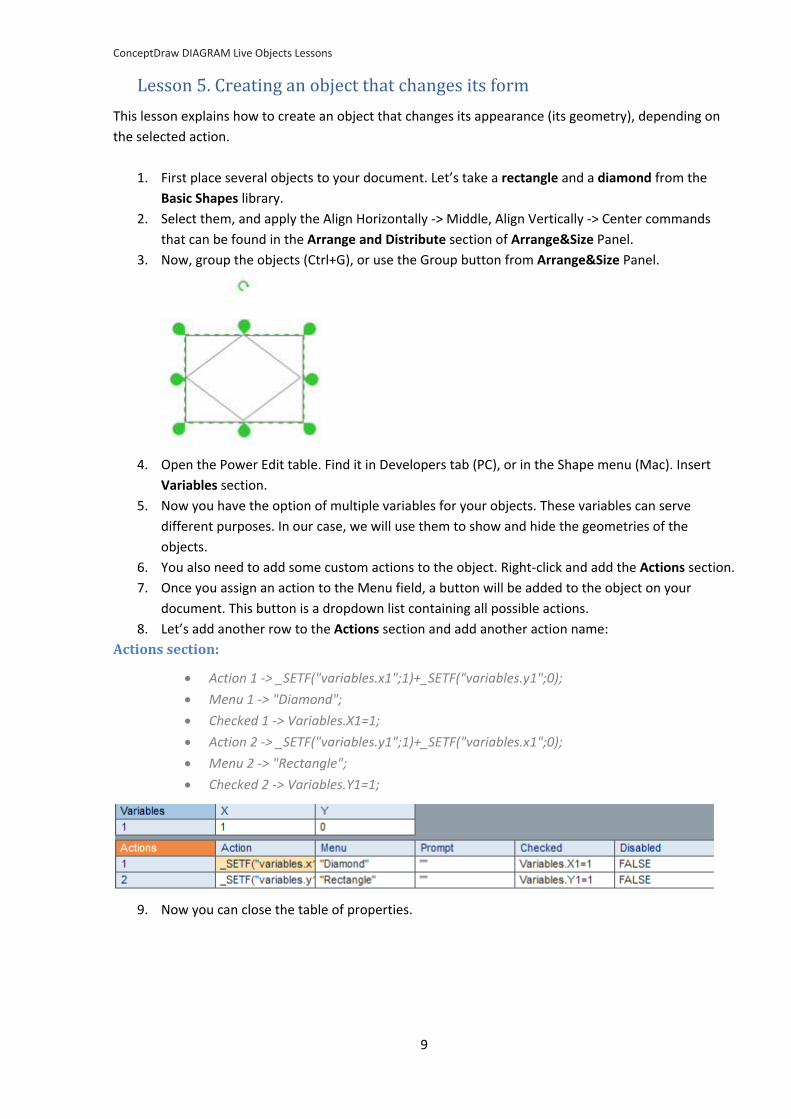
1. First place several objects to your document. Let’s take a rectangle and a diamond from the
Basic Shapes library.
2. Select them, and apply the Align Horizontally -> Middle, Align Vertically -> Center commands
that can be found in the Arrange and Distribute section of Arrange&Size Panel.
3. Now, group the objects (Ctrl+G), or use the Group button from Arrange&Size Panel.
4. Open the Power Edit table. Find it in Developers tab (PC), or in the Shape menu (Mac). Insert
Variables section.
5. Now you have the option of multiple variables for your objects. These variables can serve
different purposes. In our case, we will use them to show and hide the geometries of the
objects.
6. You also need to add some custom actions to the object. Right-click and add the Actions section.
7. Once you assign an action to the Menu field, a button will be added to the object on your
document. This button is a dropdown list containing all possible actions.
8. Let’s add another row to the Actions section and add another action name:
Actions section:
Action 1 -> _SETF("variables.x1";1)+_SETF("variables.y1";0);
Menu 1 -> "Diamond";
Checked 1 -> Variables.X1=1;
Action 2 -> _SETF("variables.y1";1)+_SETF("variables.x1";0);
Menu 2 -> "Rectangle";
Checked 2 -> Variables.Y1=1;
9. Now you can close the table of properties.
ConceptDraw DIAGRAM Live Objects Lessons
10
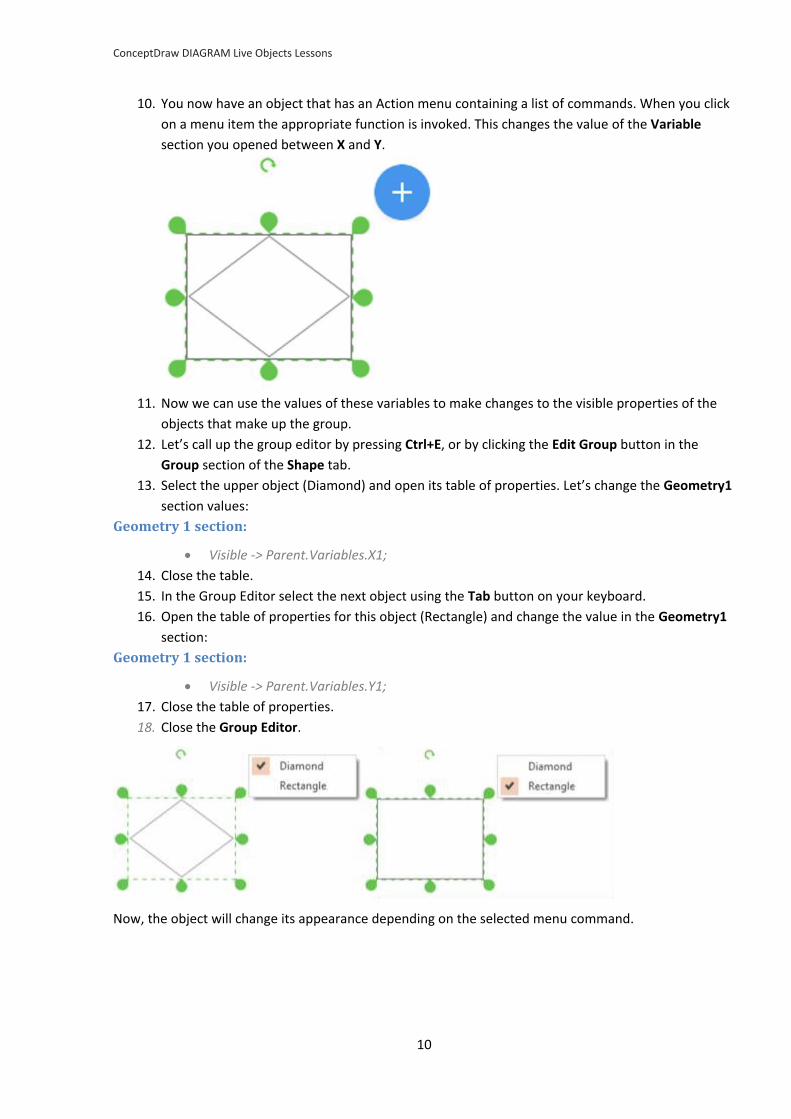
10. You now have an object that has an Action menu containing a list of commands. When you click
on a menu item the appropriate function is invoked. This changes the value of the Variable
section you opened between X and Y.
11. Now we can use the values of these variables to make changes to the visible properties of the
objects that make up the group.
12. Let’s call up the group editor by pressing Ctrl+E, or by clicking the Edit Group button in the
Group section of the Shape tab.
13. Select the upper object (Diamond) and open its table of properties. Let’s change the Geometry1
section values:
Geometry 1 section:
Visible -> Parent.Variables.X1;
14. Close the table.
15. In the Group Editor select the next object using the Tab button on your keyboard.
16. Open the table of properties for this object (Rectangle) and change the value in the Geometry1
section:
Geometry 1 section:
Visible -> Parent.Variables.Y1;
17. Close the table of properties.
18. Close the Group Editor.
Now, the object will change its appearance depending on the selected menu command.
ConceptDraw DIAGRAM Live Objects Lessons
11
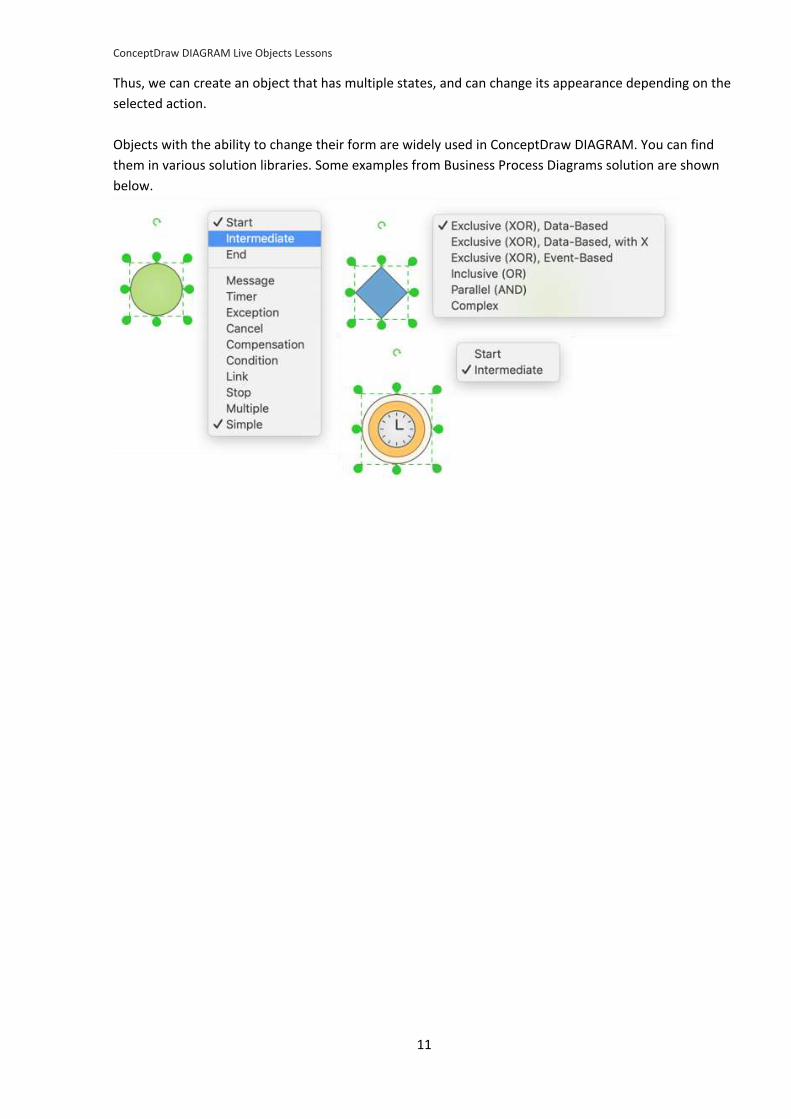
Thus, we can create an object that has multiple states, and can change its appearance depending on the
selected action.
Objects with the ability to change their form are widely used in ConceptDraw DIAGRAM. You can find
them in various solution libraries. Some examples from Business Process Diagrams solution are shown
below.
ConceptDraw DIAGRAM Live Objects Lessons
12
Lesson 6. Creating an object that changes its properties through an action
This lesson describes how to create an object that changes its angle according to the selected
action.
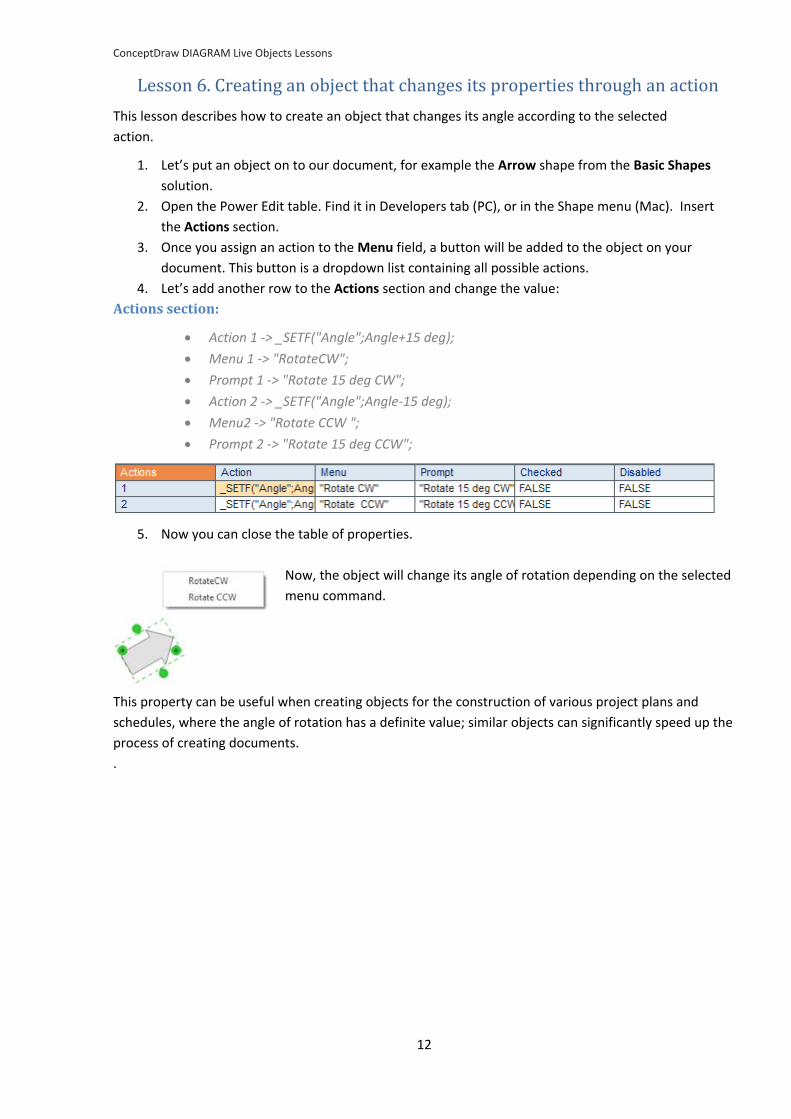
1. Let’s put an object on to our document, for example the Arrow shape from the Basic Shapes
solution.
2. Open the Power Edit table. Find it in Developers tab (PC), or in the Shape menu (Mac). Insert
the Actions section.
3. Once you assign an action to the Menu field, a button will be added to the object on your
document. This button is a dropdown list containing all possible actions.
4. Let’s add another row to the Actions section and change the value:
Actions section:
Action 1 -> _SETF("Angle";Angle+15 deg);
Menu 1 -> "RotateCW";
Prompt 1 -> "Rotate 15 deg CW";
Action 2 -> _SETF("Angle";Angle-15 deg);
Menu2 -> "Rotate CCW ";
Prompt 2 -> "Rotate 15 deg CCW";
5. Now you can close the table of properties.
Now, the object will change its angle of rotation depending on the selected
menu command.
This property can be useful when creating objects for the construction of various project plans and
schedules, where the angle of rotation has a definite value; similar objects can significantly speed up the
process of creating documents.
.
ConceptDraw DIAGRAM Live Objects Lessons
13
Lesson 7. Creating a list as an object
In this lesson you can learn how to create a list (single-cell table) as a single object. The object will
cause the BASIC function to add or remove table rows using the data in the table of properties.
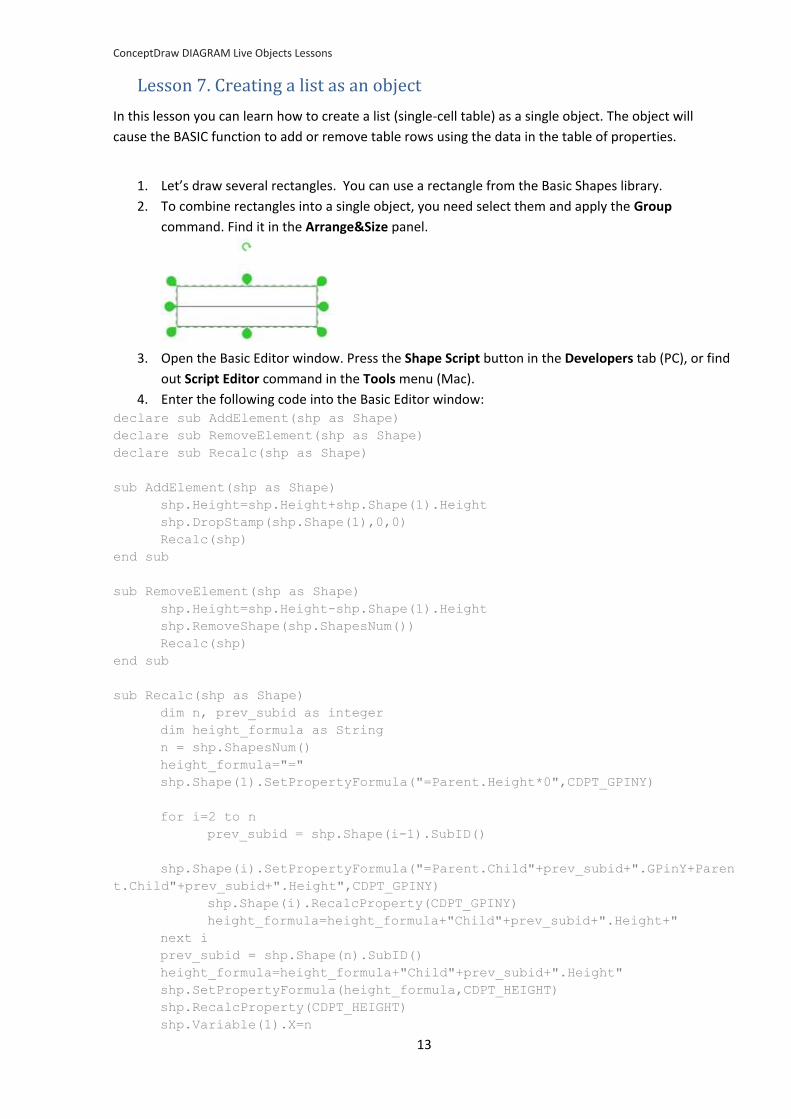
1. Let’s draw several rectangles. You can use a rectangle from the Basic Shapes library.
2. To combine rectangles into a single object, you need select them and apply the Group
command. Find it in the Arrange&Size panel.
3. Open the Basic Editor window. Press the Shape Script button in the Developers tab (PC), or find
out Script Editor command in the Tools menu (Mac).
4. Enter the following code into the Basic Editor window: declare sub AddElement(shp as Shape)
declare sub RemoveElement(shp as Shape)
declare sub Recalc(shp as Shape)
sub AddElement(shp as Shape)
shp.Height=shp.Height+shp.Shape(1).Height
shp.DropStamp(shp.Shape(1),0,0)
Recalc(shp)
end sub
sub RemoveElement(shp as Shape)
shp.Height=shp.Height-shp.Shape(1).Height
shp.RemoveShape(shp.ShapesNum())
Recalc(shp)
end sub
sub Recalc(shp as Shape)
dim n, prev_subid as integer
dim height_formula as String
n = shp.ShapesNum()
height_formula="="
shp.Shape(1).SetPropertyFormula("=Parent.Height*0",CDPT_GPINY)
for i=2 to n
prev_subid = shp.Shape(i-1).SubID()
shp.Shape(i).SetPropertyFormula("=Parent.Child"+prev_subid+".GPinY+Paren
t.Child"+prev_subid+".Height",CDPT_GPINY)
shp.Shape(i).RecalcProperty(CDPT_GPINY)
height_formula=height_formula+"Child"+prev_subid+".Height+"
next i
prev_subid = shp.Shape(n).SubID()
height_formula=height_formula+"Child"+prev_subid+".Height"
shp.SetPropertyFormula(height_formula,CDPT_HEIGHT)
shp.RecalcProperty(CDPT_HEIGHT)
shp.Variable(1).X=n
ConceptDraw DIAGRAM Live Objects Lessons
14
end sub
6. Press the Compile Script button on the toolbar and then the Close Basic View button.
7. The object now stores a code that adds and removes table rows (via Basic DropStamp function).
It can also recalculate the properties of the object. To ensure this code can function, it is
necessary to change some of the object's properties. Open the Power Edit table. Find it in
Developers tab (PC), or in the Shape menu (Mac).
8. You need to add the ability to store variables to the object. Add the Variables section by right-
clicking and selecting Insert Section. These variables can serve different purposes. In this case
the VariablesX1 fields will store the number of table rows.
9. As the table should have at least one row, we need make the Remove Row command inactive
when the value is VariablesX1<=1. Currently the first row of the table already exists, so let’s
change the value in the Variables section:
Variables section:
X 1 -> 1;
10. You need to add custom actions to the object. Add the Actions section to the properties table.
11. Once you assign an action to the Menu field, a button will be added to the object on your
document. This button is a dropdown list containing all possible actions.
12. Let’s add another row to the Actions section and add another action name:
Actions section:
Action 1 -> _CALLTHIS("AddElement");
Menu 1 -> "AddRow";
Action 2 -> _CALLTHIS("RemoveElement");
Menu 2 -> "RemoveRow";
Disabled -> Variables.X1<=1;
"AddElement" and "RemoveElement" are the Basic functions, which will be invoked by pressing the
corresponding menu item.
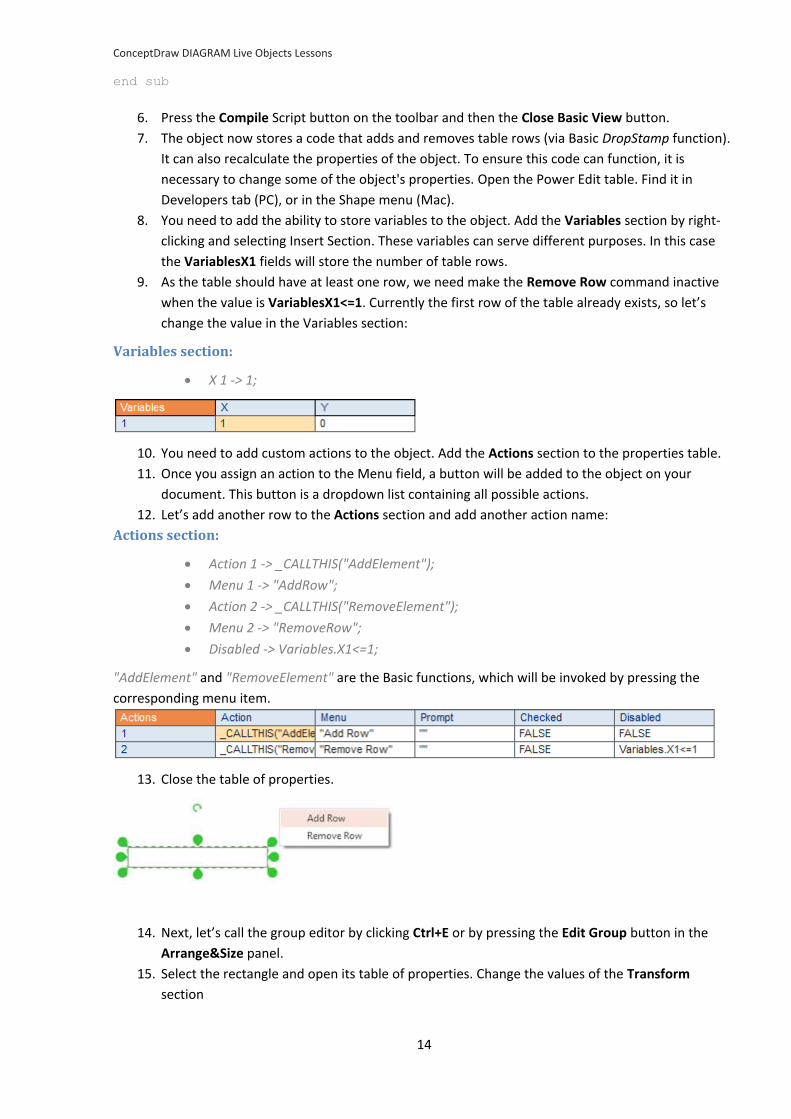
13. Close the table of properties.
14. Next, let’s call the group editor by clicking Ctrl+E or by pressing the Edit Group button in the
Arrange&Size panel.
15. Select the rectangle and open its table of properties. Change the values of the Transform
section
ConceptDraw DIAGRAM Live Objects Lessons
15
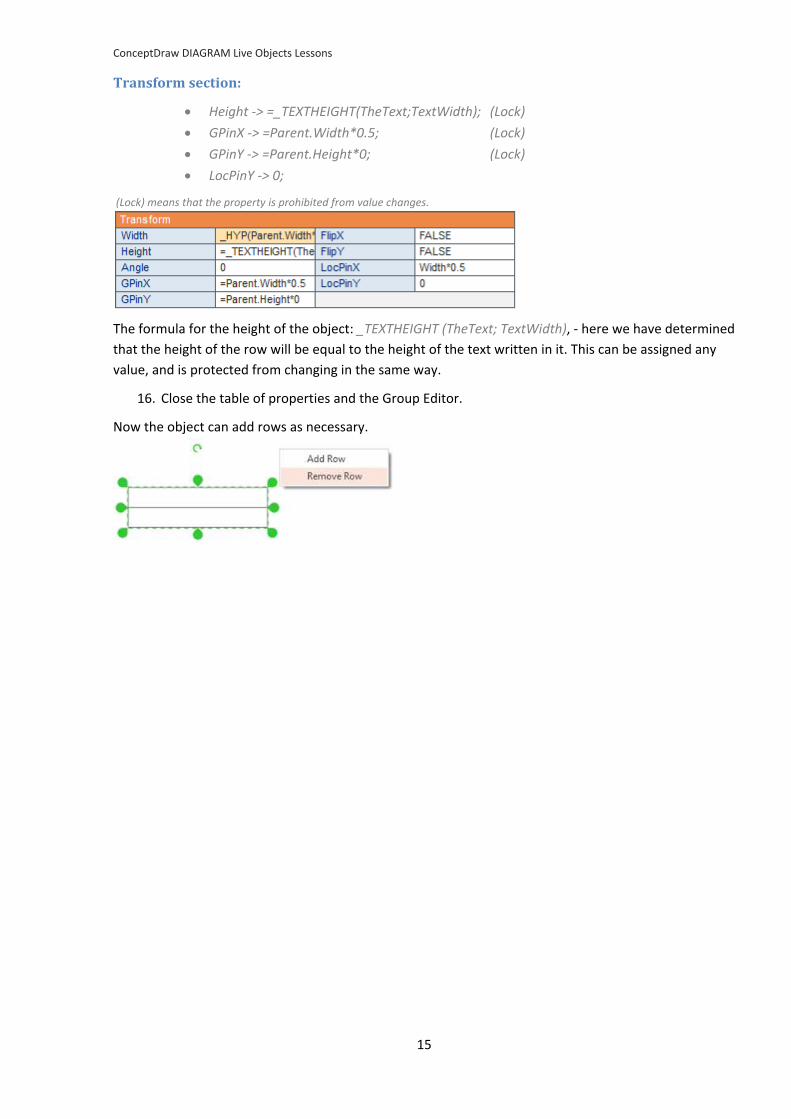
Transform section:
Height -> =_TEXTHEIGHT(TheText;TextWidth); (Lock)
GPinX -> =Parent.Width*0.5; (Lock)
GPinY -> =Parent.Height*0; (Lock)
LocPinY -> 0;
(Lock) means that the property is prohibited from value changes.
The formula for the height of the object: _TEXTHEIGHT (TheText; TextWidth), - here we have determined
that the height of the row will be equal to the height of the text written in it. This can be assigned any
value, and is protected from changing in the same way.
16. Close the table of properties and the Group Editor.
Now the object can add rows as necessary.

ConceptDraw DIAGRAM Live Objects Lessons
16
Lesson 8. Creating a divided bar object
In this lesson you will learn how to create a divided bar object with the capability to add and delete
sections, and to set values for those sections directly though the object.
1. Let’s draw several rectangles. You can use a rectangle from the Basic Shapes library.
2. To combine rectangles into a single object, you need select them and apply Group
command. Find it in the Arrange&Size panel.
3. Open the Basic Editor window. Press the Shape Script button in the Developers tab (PC), or
find out Script Editor command in the Tools menu (Mac).
4. Enter the following code into the Basic Editor window: declare sub AddElement(shp as Shape)
declare sub RemoveElement(shp as Shape)
declare sub Recalc(shp as Shape)
sub AddElement(shp as Shape)
shp.Width=shp.Width+shp.Shape(1).Width
shp.DropStamp(shp.Shape(1),0,0)
Recalc(shp)
end sub
sub RemoveElement(shp as Shape)
shp.Width=shp.Width-shp.Shape(1).Width
shp.RemoveShape(shp.ShapesNum())
Recalc(shp)
end sub
sub Recalc(shp as Shape)
dim n,prev_subid as integer
dim formula as String
n = shp.ShapesNum()
formula="="
shp.Shape(1).SetPropertyFormula("=Parent.Width*0",CDPT_GPINX)
for i=2 to n
prev_subid = shp.Shape(i-1).SubID()
shp.Shape(i).SetPropertyFormula("=Parent.Child"+prev_subid+".GPinX+Paren
t.ChildC"+prev_subid+".Width",CDPT_GPINX)
shp.Shape(i).RecalcProperty(CDPT_GPINX)
formula=formula+"Child"+prev_subid+".Variables.x1+"
next i
prev_subid = shp.Shape(n).SubID()
formula=formula+"Child"+prev_subid+".Variables.x1"
shp.SetPropertyFormula(formula,CDPT_VARIABLE_Y,1)
shp.RecalcProperty(CDPT_VARIABLE_Y,1)
shp.Variable(1).X=n
end sub
ConceptDraw DIAGRAM Live Objects Lessons
17
5. Press the Compile Script button on toolbar, and after that the Close Basic View button.
6. Now a code is stored in the object that adds and removes copies of the rectangle within the
group. It can also recalculate the properties of the object and its width depending on the
value entered into the object. To ensure that this code is invoked, it is necessary to change
some of the object properties. Open the Power Edit table. Find it in Developers tab (PC), or
in the Shape menu (Mac).
7. You need to add the ability to store variable to the object. These variables can serve
different purposes. In this case the VariablesX1 fields will store the number of divided bar
sections and the VariablesY1 will store the formula, calculated by script. Right click and add
the Variables section.
8. As the table should have at least one row, we need to make the Remove Segment
command inactive when the value is VariablesX1<=1. Currently the divided bar section
already exists, so let’s change the value in the Variables section:
Variables section:
X 1 -> 1;
9. You need to add custom actions to the object. Add the Actions section to the properties
table.
10. Once you assign an action to the Menu field, a button will be added to the object on your
document. This button is a dropdown list containing all possible actions.
11. Let’s add another row to the Actions section and add another action name:
Actions section:
Action 1 -> _CALLTHIS("AddElement");
Menu 1 -> "Add Segment ";
Action 2 -> _CALLTHIS("RemoveElement");
Menu 2 -> "Remove Segment ";
Disabled -> Variables.X1<=1;
"AddElement" and "RemoveElement"- are the Basic functions, which will be invoked by pressing the
corresponding menu item.
12. Close the table of properties.
13. Next, let’s call up the group editor by clicking Ctrl+E or pressing the Edit Group button in the
Arrange&Size panel.
14. Select the rectangle and open its table of properties. Change the values of the Transform
section:
Transform section:
Width -> Parent.Width*Variables.X1/Parent.Variables.Y1
Height -> Parent.Height
GPinX -> Parent.Width*0
GPinY -> Parent.Height*0.5
LocPinX -> Width*0
ConceptDraw DIAGRAM Live Objects Lessons
18
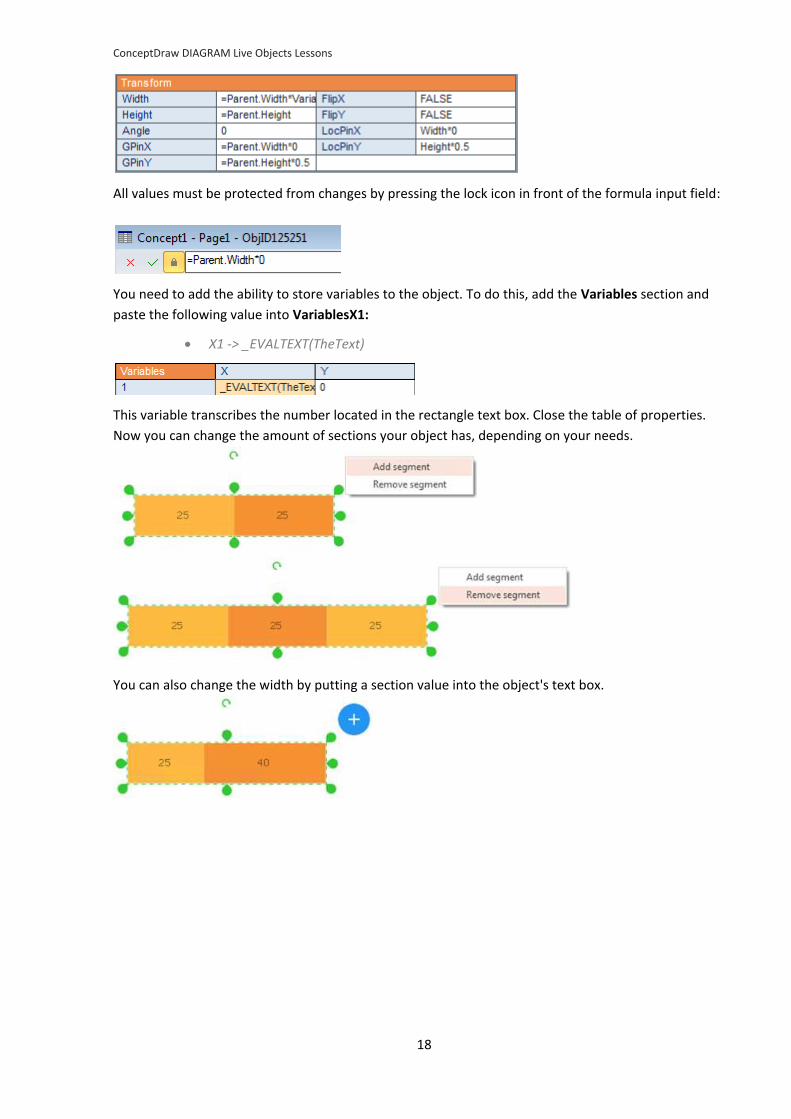
All values must be protected from changes by pressing the lock icon in front of the formula input field:
You need to add the ability to store variables to the object. To do this, add the Variables section and
paste the following value into VariablesX1:
X1 -> _EVALTEXT(TheText)
This variable transcribes the number located in the rectangle text box. Close the table of properties.
Now you can change the amount of sections your object has, depending on your needs.
You can also change the width by putting a section value into the object's text box.
ConceptDraw DIAGRAM Live Objects Lessons
19
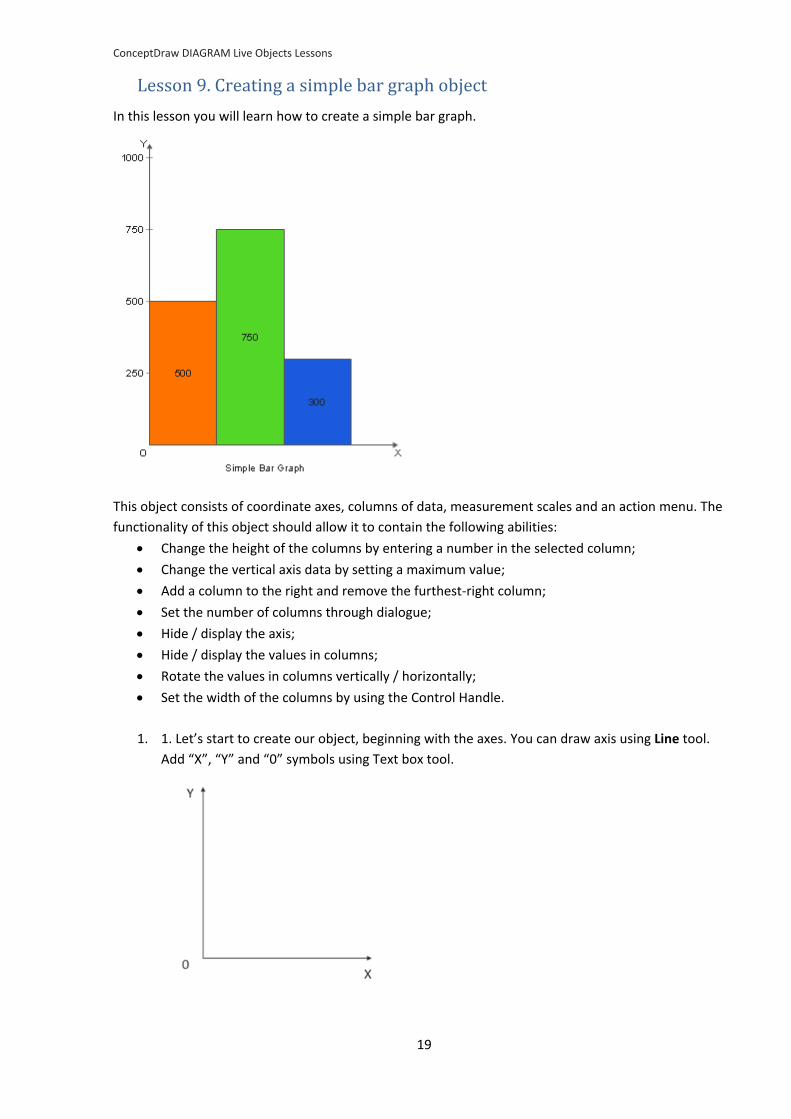
Lesson 9. Creating a simple bar graph object
In this lesson you will learn how to create a simple bar graph.
This object consists of coordinate axes, columns of data, measurement scales and an action menu. The
functionality of this object should allow it to contain the following abilities:
Change the height of the columns by entering a number in the selected column;
Change the vertical axis data by setting a maximum value;
Add a column to the right and remove the furthest-right column;
Set the number of columns through dialogue;
Hide / display the axis;
Hide / display the values in columns;
Rotate the values in columns vertically / horizontally;
Set the width of the columns by using the Control Handle.
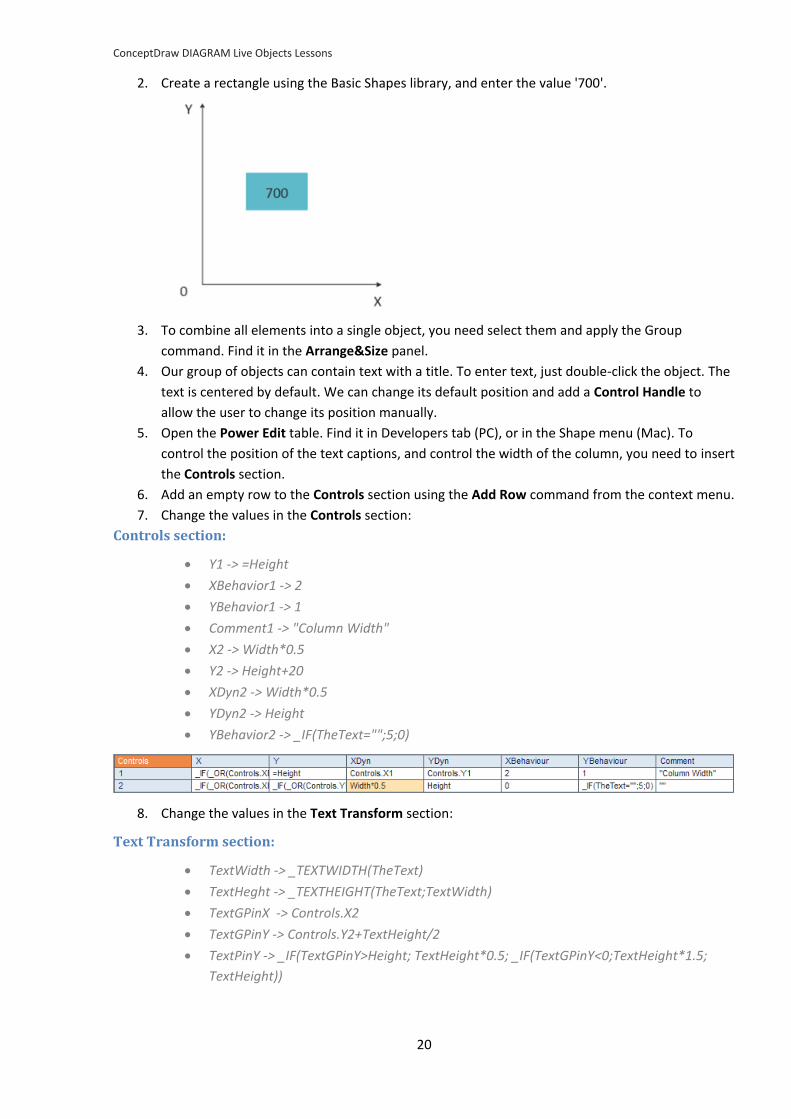
1. 1. Let’s start to create our object, beginning with the axes. You can draw axis using Line tool.
Add “X”, “Y” and “0” symbols using Text box tool.
ConceptDraw DIAGRAM Live Objects Lessons
20
2. Create a rectangle using the Basic Shapes library, and enter the value '700'.
3. To combine all elements into a single object, you need select them and apply the Group
command. Find it in the Arrange&Size panel.
4. Our group of objects can contain text with a title. To enter text, just double-click the object. The
text is centered by default. We can change its default position and add a Control Handle to
allow the user to change its position manually.
5. Open the Power Edit table. Find it in Developers tab (PC), or in the Shape menu (Mac). To
control the position of the text captions, and control the width of the column, you need to insert
the Controls section.
6. Add an empty row to the Controls section using the Add Row command from the context menu.
7. Change the values in the Controls section:
Controls section:
Y1 -> =Height
XBehavior1 -> 2
YBehavior1 -> 1
Comment1 -> "Column Width"
X2 -> Width*0.5
Y2 -> Height+20
XDyn2 -> Width*0.5
YDyn2 -> Height
YBehavior2 -> _IF(TheText="";5;0)
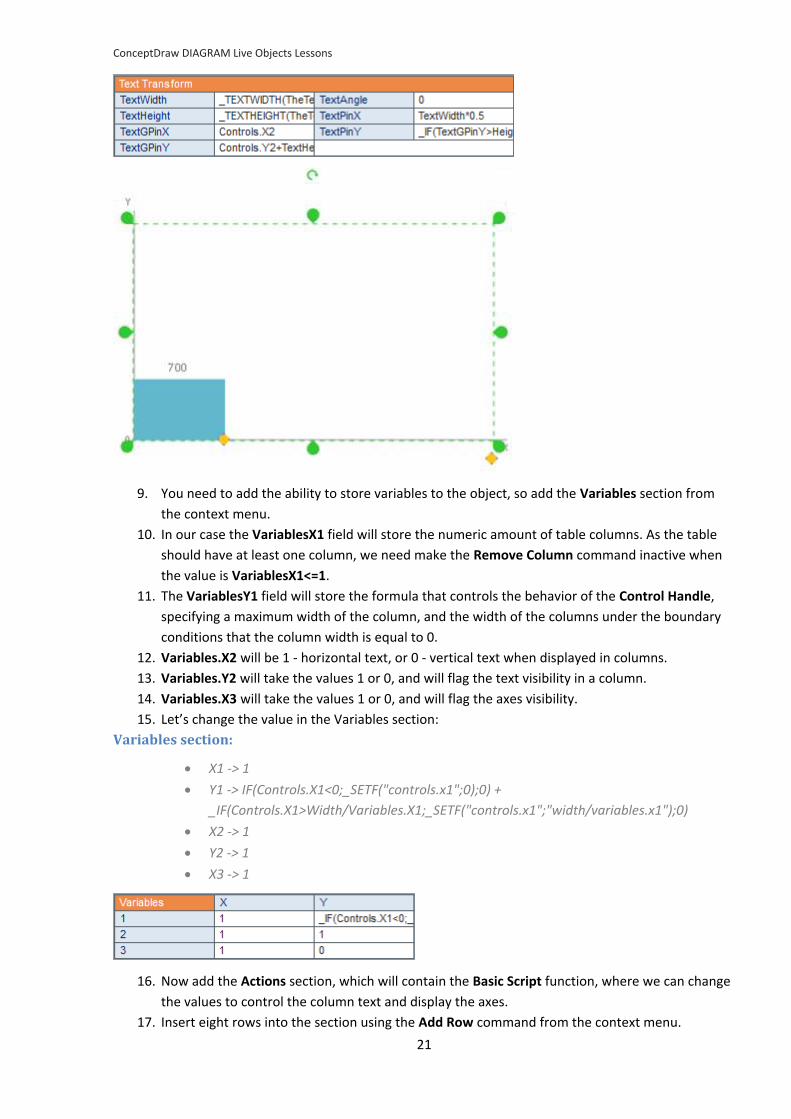
8. Change the values in the Text Transform section:
Text Transform section:
TextWidth -> _TEXTWIDTH(TheText)
TextHeght -> _TEXTHEIGHT(TheText;TextWidth)
TextGPinX -> Controls.X2
TextGPinY -> Controls.Y2+TextHeight/2
TextPinY -> _IF(TextGPinY>Height; TextHeight*0.5; _IF(TextGPinY<0;TextHeight*1.5;
TextHeight))
ConceptDraw DIAGRAM Live Objects Lessons
21
9. You need to add the ability to store variables to the object, so add the Variables section from
the context menu.
10. In our case the VariablesX1 field will store the numeric amount of table columns. As the table
should have at least one column, we need make the Remove Column command inactive when
the value is VariablesX1<=1.
11. The VariablesY1 field will store the formula that controls the behavior of the Control Handle,
specifying a maximum width of the column, and the width of the columns under the boundary
conditions that the column width is equal to 0.
12. Variables.X2 will be 1 - horizontal text, or 0 - vertical text when displayed in columns.
13. Variables.Y2 will take the values 1 or 0, and will flag the text visibility in a column.
14. Variables.X3 will take the values 1 or 0, and will flag the axes visibility.
15. Let’s change the value in the Variables section:
Variables section:
X1 -> 1
Y1 -> IF(Controls.X1<0;_SETF("controls.x1";0);0) +
_IF(Controls.X1>Width/Variables.X1;_SETF("controls.x1";"width/variables.x1");0)
X2 -> 1
Y2 -> 1
X3 -> 1
16. Now add the Actions section, which will contain the Basic Script function, where we can change
the values to control the column text and display the axes.
17. Insert eight rows into the section using the Add Row command from the context menu.
ConceptDraw DIAGRAM Live Objects Lessons
22
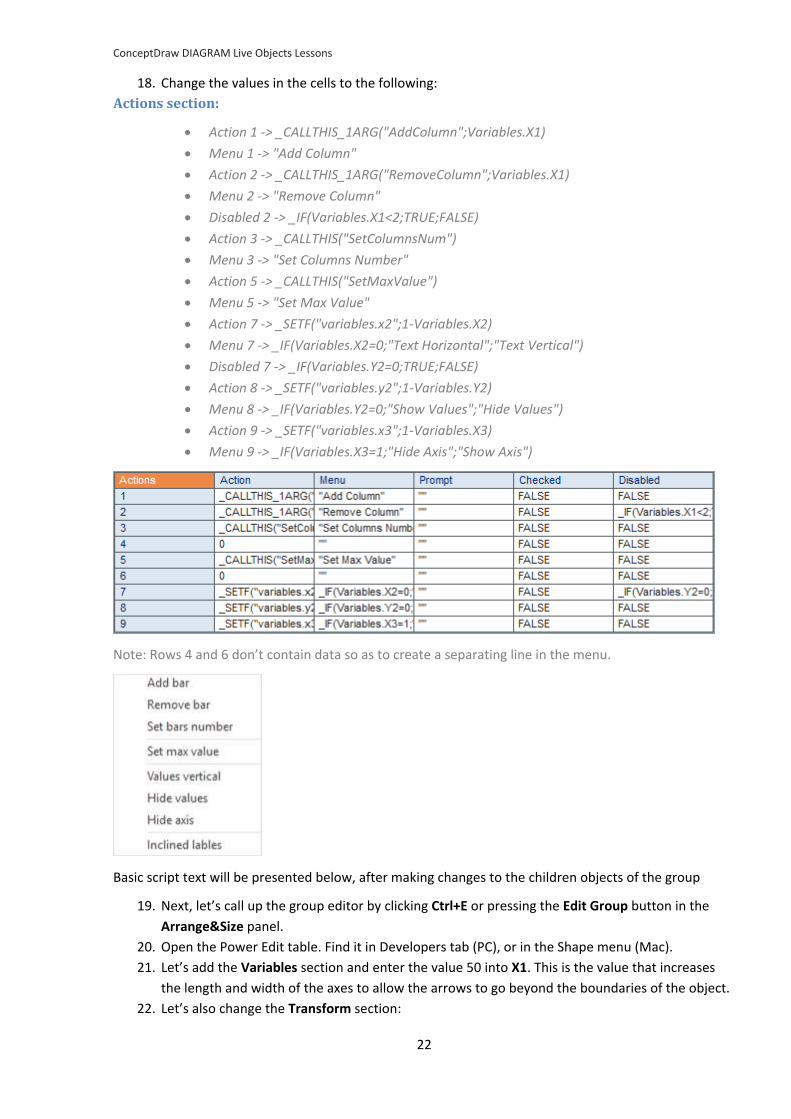
18. Change the values in the cells to the following:
Actions section:
Action 1 -> _CALLTHIS_1ARG("AddColumn";Variables.X1)
Menu 1 -> "Add Column"
Action 2 -> _CALLTHIS_1ARG("RemoveColumn";Variables.X1)
Menu 2 -> "Remove Column"
Disabled 2 -> _IF(Variables.X1<2;TRUE;FALSE)
Action 3 -> _CALLTHIS("SetColumnsNum")
Menu 3 -> "Set Columns Number"
Action 5 -> _CALLTHIS("SetMaxValue")
Menu 5 -> "Set Max Value"
Action 7 -> _SETF("variables.x2";1-Variables.X2)
Menu 7 -> _IF(Variables.X2=0;"Text Horizontal";"Text Vertical")
Disabled 7 -> _IF(Variables.Y2=0;TRUE;FALSE)
Action 8 -> _SETF("variables.y2";1-Variables.Y2)
Menu 8 -> _IF(Variables.Y2=0;"Show Values";"Hide Values")
Action 9 -> _SETF("variables.x3";1-Variables.X3)
Menu 9 -> _IF(Variables.X3=1;"Hide Axis";"Show Axis")
Note: Rows 4 and 6 don’t contain data so as to create a separating line in the menu.
Basic script text will be presented below, after making changes to the children objects of the group
19. Next, let’s call up the group editor by clicking Ctrl+E or pressing the Edit Group button in the
Arrange&Size panel.
20. Open the Power Edit table. Find it in Developers tab (PC), or in the Shape menu (Mac).
21. Let’s add the Variables section and enter the value 50 into X1. This is the value that increases
the length and width of the axes to allow the arrows to go beyond the boundaries of the object.
22. Let’s also change the Transform section:
ConceptDraw DIAGRAM Live Objects Lessons
23
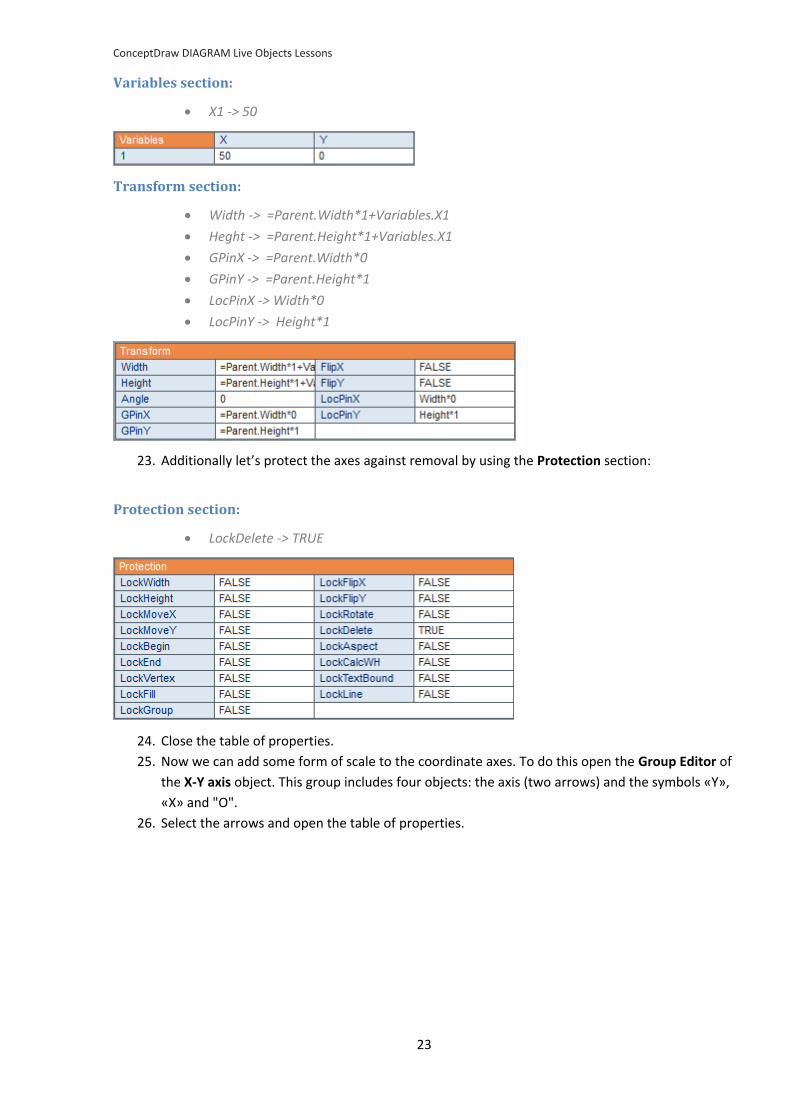
Variables section:
X1 -> 50
Transform section:
Width -> =Parent.Width*1+Variables.X1
Heght -> =Parent.Height*1+Variables.X1
GPinX -> =Parent.Width*0
GPinY -> =Parent.Height*1
LocPinX -> Width*0
LocPinY -> Height*1
23. Additionally let’s protect the axes against removal by using the Protection section:
Protection section:
LockDelete -> TRUE
24. Close the table of properties.
25. Now we can add some form of scale to the coordinate axes. To do this open the Group Editor of
the X-Y axis object. This group includes four objects: the axis (two arrows) and the symbols «Y»,
«X» and "O".
26. Select the arrows and open the table of properties.
ConceptDraw DIAGRAM Live Objects Lessons
24
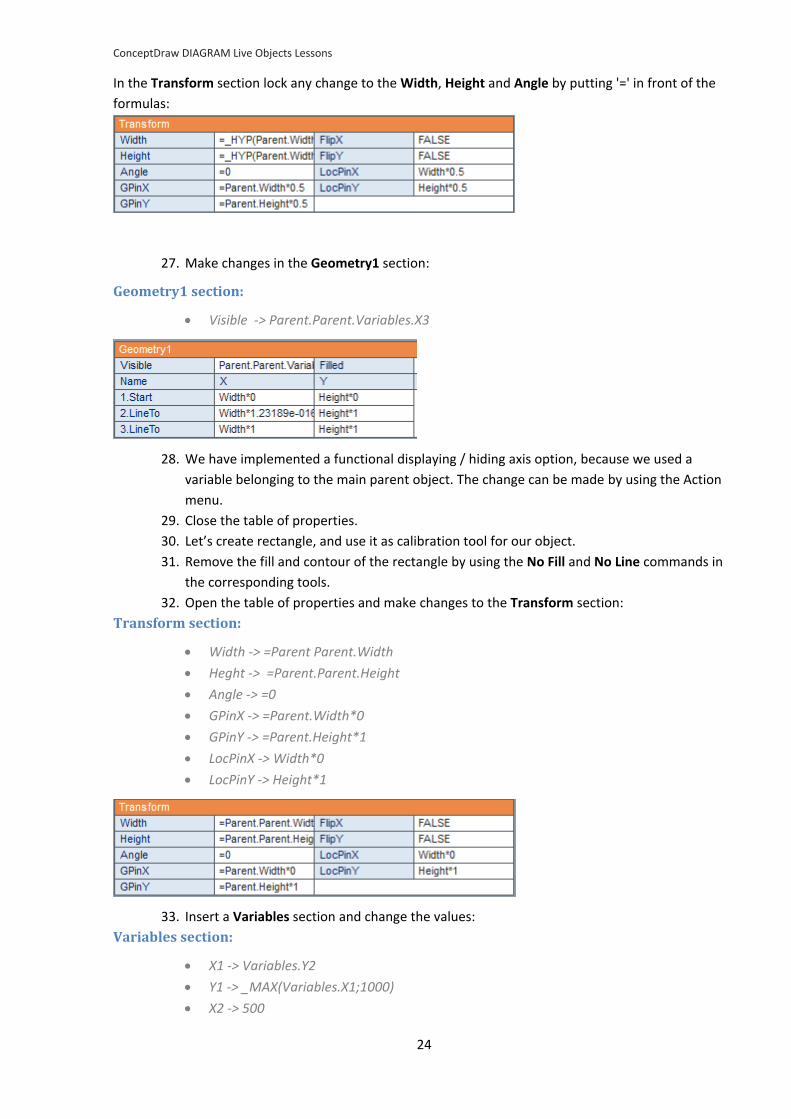
In the Transform section lock any change to the Width, Height and Angle by putting '=' in front of the
formulas:
27. Make changes in the Geometry1 section:
Geometry1 section:
Visible -> Parent.Parent.Variables.X3
28. We have implemented a functional displaying / hiding axis option, because we used a
variable belonging to the main parent object. The change can be made by using the Action
menu.
29. Close the table of properties.
30. Let’s create rectangle, and use it as calibration tool for our object.
31. Remove the fill and contour of the rectangle by using the No Fill and No Line commands in
the corresponding tools.
32. Open the table of properties and make changes to the Transform section:
Transform section:
Width -> =Parent Parent.Width
Heght -> =Parent.Parent.Height
Angle -> =0
GPinX -> =Parent.Width*0
GPinY -> =Parent.Height*1
LocPinX -> Width*0
LocPinY -> Height*1
33. Insert a Variables section and change the values:
Variables section:
X1 -> Variables.Y2
Y1 -> _MAX(Variables.X1;1000)
X2 -> 500
ConceptDraw DIAGRAM Live Objects Lessons
25
Y2 -> Variables.X2
These variables store the data involved in the Basic scripting facility.
34. Close the table of properties.
35. Draw a straight line and write in its text field "100". Open its table of properties and change
the value of the table in the following sections:
Transform section:
Width -> =20
Heght -> =0
Angle -> =0
GPinX -> =Parent.Width*0
GPinY -> =(Parent.Child8.Height)*0.75+Parent.Variables.X1
LocPinX -> Width*0,5
LocPinY -> Height
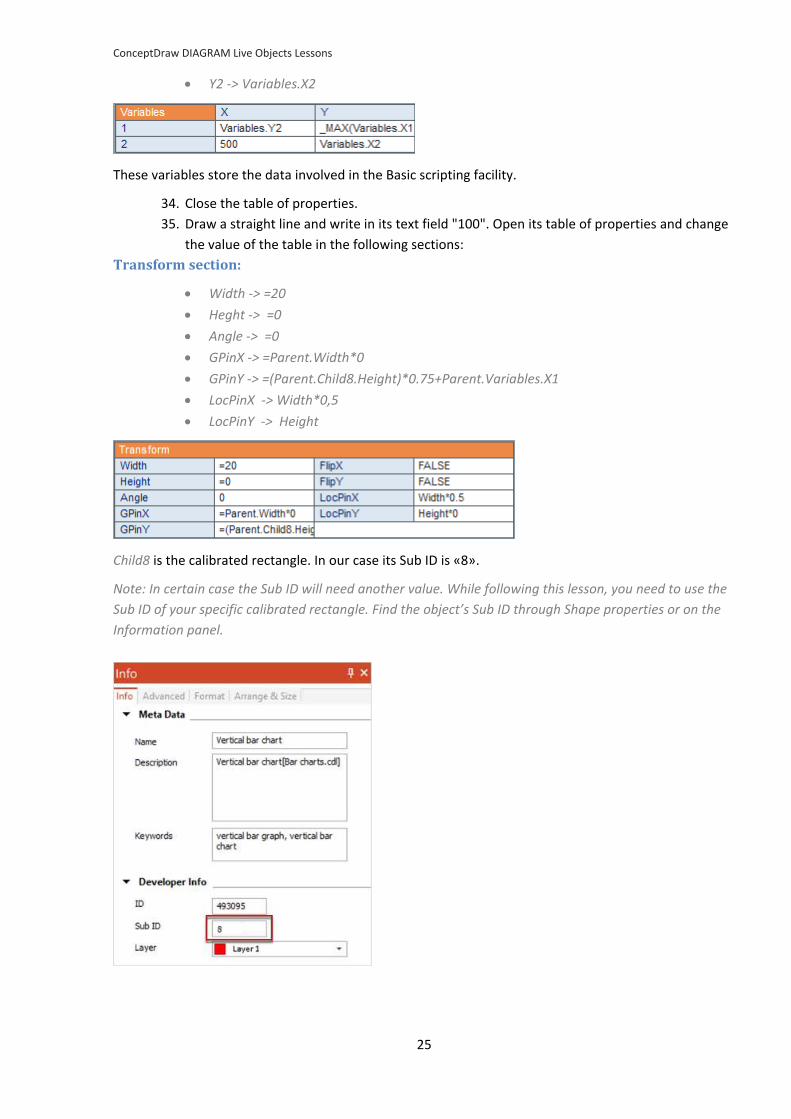
Child8 is the calibrated rectangle. In our case its Sub ID is «8».
Note: In certain case the Sub ID will need another value. While following this lesson, you need to use the
Sub ID of your specific calibrated rectangle. Find the object’s Sub ID through Shape properties or on the
Information panel.
ConceptDraw DIAGRAM Live Objects Lessons
26
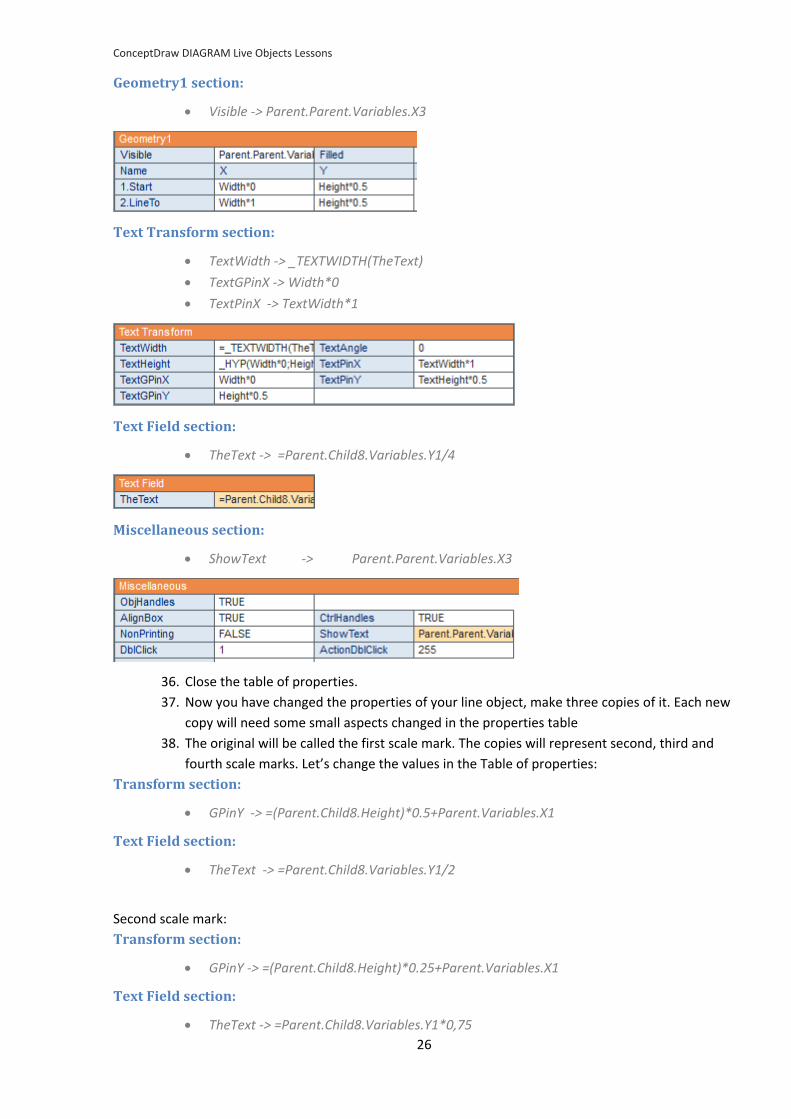
Geometry1 section:
Visible -> Parent.Parent.Variables.X3
Text Transform section:
TextWidth -> _TEXTWIDTH(TheText)
TextGPinX -> Width*0
TextPinX -> TextWidth*1
Text Field section:
TheText -> =Parent.Child8.Variables.Y1/4
Miscellaneous section:
ShowText -> Parent.Parent.Variables.X3
36. Close the table of properties.
37. Now you have changed the properties of your line object, make three copies of it. Each new
copy will need some small aspects changed in the properties table
38. The original will be called the first scale mark. The copies will represent second, third and
fourth scale marks. Let’s change the values in the Table of properties:
Transform section:
GPinY -> =(Parent.Child8.Height)*0.5+Parent.Variables.X1
Text Field section:
TheText -> =Parent.Child8.Variables.Y1/2
Second scale mark:
Transform section:
GPinY -> =(Parent.Child8.Height)*0.25+Parent.Variables.X1
Text Field section:
TheText -> =Parent.Child8.Variables.Y1*0,75
ConceptDraw DIAGRAM Live Objects Lessons
27
Third scale mark:
Transform section:
• GPinY -> =(Parent.Child8.Height)*0.25+Parent.Variables.X1
Text Field section:
• TheText -> =Parent.Child8.Variables.Y1*0,75
Fourth scale mark:
Transform section:
GPinY -> =(Parent.Child8.Height)*0+Parent.Variables.X1
Text Field section:
TheText -> =Parent.Child8.Variables.Y1
39. Close the table of properties.
We have now finished editing and adding functionality to the coordinate axes.
Next we need to create the columns for our bar graph object. We will use the rectangle that we created
earlier and with which we grouped together with axes.
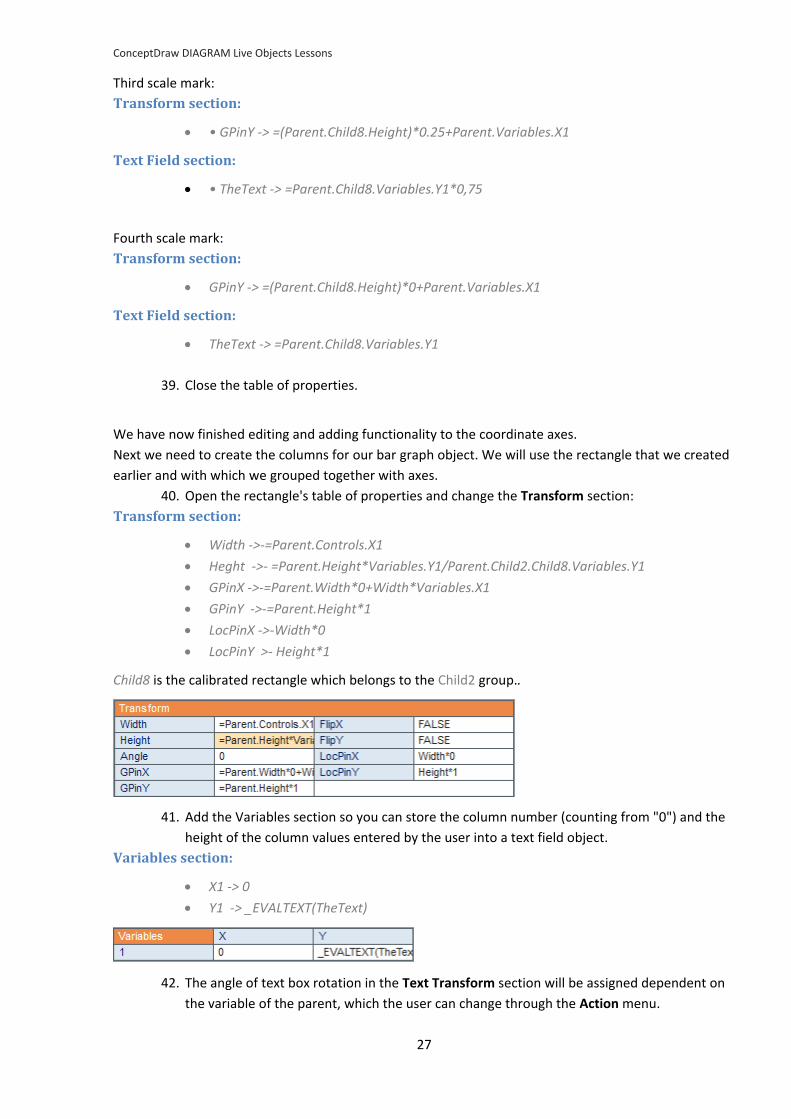
40. Open the rectangle's table of properties and change the Transform section:
Transform section:
Width ->-=Parent.Controls.X1
Heght ->- =Parent.Height*Variables.Y1/Parent.Child2.Child8.Variables.Y1
GPinX ->-=Parent.Width*0+Width*Variables.X1
GPinY ->-=Parent.Height*1
LocPinX ->-Width*0
LocPinY >- Height*1
Child8 is the calibrated rectangle which belongs to the Child2 group..
41. Add the Variables section so you can store the column number (counting from "0") and the
height of the column values entered by the user into a text field object.
Variables section:
X1 -> 0
Y1 -> _EVALTEXT(TheText)
42. The angle of text box rotation in the Text Transform section will be assigned dependent on
the variable of the parent, which the user can change through the Action menu.
ConceptDraw DIAGRAM Live Objects Lessons
28
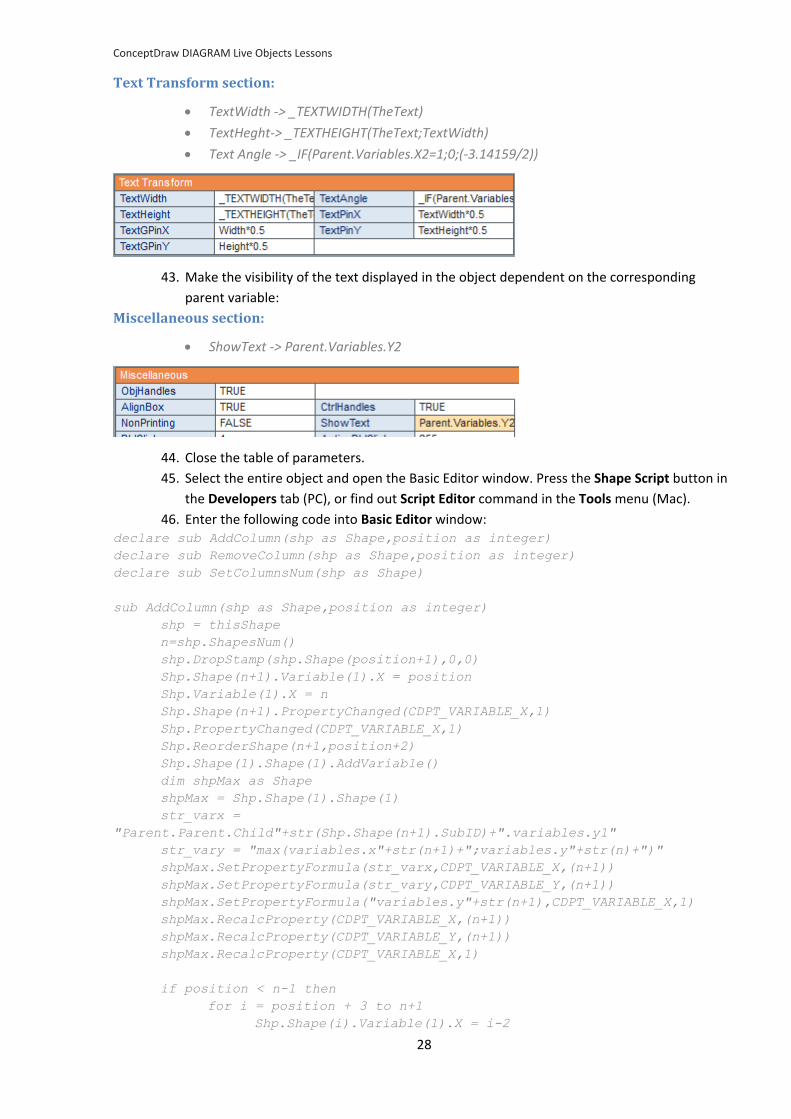
Text Transform section:
TextWidth -> _TEXTWIDTH(TheText)
TextHeght-> _TEXTHEIGHT(TheText;TextWidth)
Text Angle -> _IF(Parent.Variables.X2=1;0;(-3.14159/2))
43. Make the visibility of the text displayed in the object dependent on the corresponding
parent variable:
Miscellaneous section:
ShowText -> Parent.Variables.Y2
44. Close the table of parameters.
45. Select the entire object and open the Basic Editor window. Press the Shape Script button in
the Developers tab (PC), or find out Script Editor command in the Tools menu (Mac).
46. Enter the following code into Basic Editor window: declare sub AddColumn(shp as Shape,position as integer)
declare sub RemoveColumn(shp as Shape,position as integer)
declare sub SetColumnsNum(shp as Shape)
sub AddColumn(shp as Shape,position as integer)
shp = thisShape
n=shp.ShapesNum()
shp.DropStamp(shp.Shape(position+1),0,0)
Shp.Shape(n+1).Variable(1).X = position
Shp.Variable(1).X = n
Shp.Shape(n+1).PropertyChanged(CDPT_VARIABLE_X,1)
Shp.PropertyChanged(CDPT_VARIABLE_X,1)
Shp.ReorderShape(n+1,position+2)
Shp.Shape(1).Shape(1).AddVariable()
dim shpMax as Shape
shpMax = Shp.Shape(1).Shape(1)
str_varx =
"Parent.Parent.Child"+str(Shp.Shape(n+1).SubID)+".variables.y1"
str_vary = "max(variables.x"+str(n+1)+";variables.y"+str(n)+")"
shpMax.SetPropertyFormula(str_varx,CDPT_VARIABLE_X,(n+1))
shpMax.SetPropertyFormula(str_vary,CDPT_VARIABLE_Y,(n+1))
shpMax.SetPropertyFormula("variables.y"+str(n+1),CDPT_VARIABLE_X,1)
shpMax.RecalcProperty(CDPT_VARIABLE_X,(n+1))
shpMax.RecalcProperty(CDPT_VARIABLE_Y,(n+1))
shpMax.RecalcProperty(CDPT_VARIABLE_X,1)
if position < n-1 then
for i = position + 3 to n+1
Shp.Shape(i).Variable(1).X = i-2
ConceptDraw DIAGRAM Live Objects Lessons
29
Shp.Shape(i).PropertyChanged(CDPT_VARIABLE_X,1)
next
end if
end sub
sub RemoveColumn(shp as Shape,position as integer)
shp = thisShape
n=shp.ShapesNum()
shp.RemoveShape(position+1)
Shp.Variable(1).X = n-2
Shp.PropertyChanged(CDPT_VARIABLE_X,1)
Shp.Shape(1).Shape(1).RemoveVariable(n)
Shp.Shape(1).Shape(1).SetPropertyFormula("variables.y"+str(n-
1),CDPT_VARIABLE_X,1)
Shp.Shape(1).Shape(1).RecalcProperty(CDPT_VARIABLE_X,1)
if position + 1 < n then
for i = position + 1 to n-1
Shp.Shape(i).Variable(1).X = i-2
Shp.Shape(i).PropertyChanged(CDPT_VARIABLE_X,1)
next
end if
end sub
sub SetColumnsNum(shp as Shape)
dim cnum, InValue, n, Default as integer
dim Message, Title
Message = "Enter the quantity of Columns (1 or more):"
Title = "Quantity of Columns"
Default = shp.GetIntegerProperty(CDPT_VARIABLE_X,1)
InValue = InputBox(Message, Title, Default)
if (InValue > 0)and(InValue <> Default) then
cnum = InValue
else
exit sub
end if
n = shp.ShapesNum
if n-1 < cnum then
for i = 1 to cnum - n +1
AddColumn (shp, n+i-2)
next i
else
for i = 1 to n - cnum - 1
RemoveColumn (shp,n-i)
next i
end if
end Sub
sub SetMaxValue(shp as Shape)
dim vmax, InValue, Default as integer
dim Message, Title
Message = "Set Maximum Value"

ConceptDraw DIAGRAM Live Objects Lessons
30
Title = "Max Value"
Default = shp.shape(1).shape(1).GetIntegerProperty(CDPT_VARIABLE_Y,1)
InValue = InputBox(Message, Title, Default)
if (InValue > 0)and(InValue <> Default) then
shp.shape(1).shape(1).SetPropertyFormula("max(variables.x1;"+InValue+")"
,CDPT_VARIABLE_Y,1)
shp.shape(1).shape(1).RecalcProperty(CDPT_VARIABLE_X,1)
else
exit sub
end if
end Sub
47. Press the Compile Script button on the toolbar and after that the Close Basic View button.
Now our object stores a code that adds and removes the column to the right, the ability to specify an
arbitrary number of columns, and the ability to set the maximum value for the vertical scale.
Note: Once you have created your bar graph, there are a number of options available should you wish to
customize your design. You can repaint the columns using a palette of colors, change the font styles of
text blocks, and choose the style of the shape lines.
ConceptDraw DIAGRAM Live Objects Lessons
31
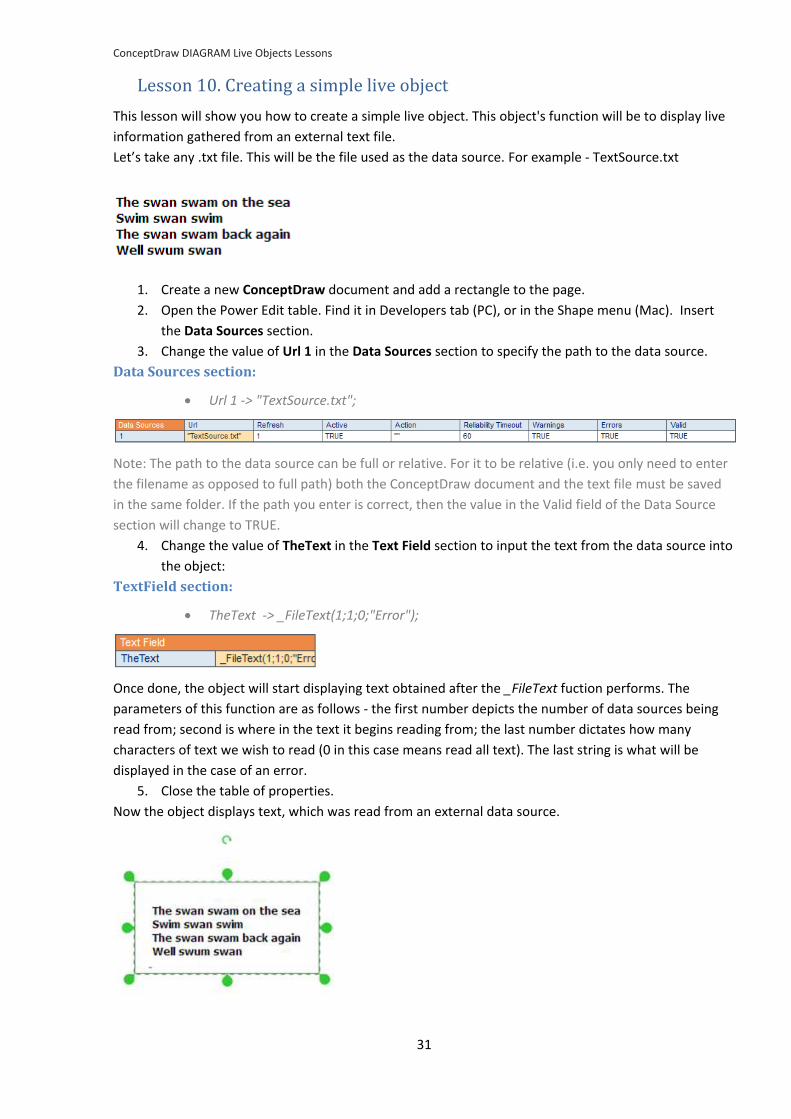
Lesson 10. Creating a simple live object
This lesson will show you how to create a simple live object. This object's function will be to display live
information gathered from an external text file.
Let’s take any .txt file. This will be the file used as the data source. For example - TextSource.txt
1. Create a new ConceptDraw document and add a rectangle to the page.
2. Open the Power Edit table. Find it in Developers tab (PC), or in the Shape menu (Mac). Insert
the Data Sources section.
3. Change the value of Url 1 in the Data Sources section to specify the path to the data source.
Data Sources section:
Url 1 -> "TextSource.txt";
Note: The path to the data source can be full or relative. For it to be relative (i.e. you only need to enter
the filename as opposed to full path) both the ConceptDraw document and the text file must be saved
in the same folder. If the path you enter is correct, then the value in the Valid field of the Data Source
section will change to TRUE.
4. Change the value of TheText in the Text Field section to input the text from the data source into
the object:
TextField section:
TheText -> _FileText(1;1;0;"Error");
Once done, the object will start displaying text obtained after the _FileText fuction performs. The
parameters of this function are as follows - the first number depicts the number of data sources being
read from; second is where in the text it begins reading from; the last number dictates how many
characters of text we wish to read (0 in this case means read all text). The last string is what will be
displayed in the case of an error.
5. Close the table of properties.
Now the object displays text, which was read from an external data source.
ConceptDraw DIAGRAM Live Objects Lessons
32
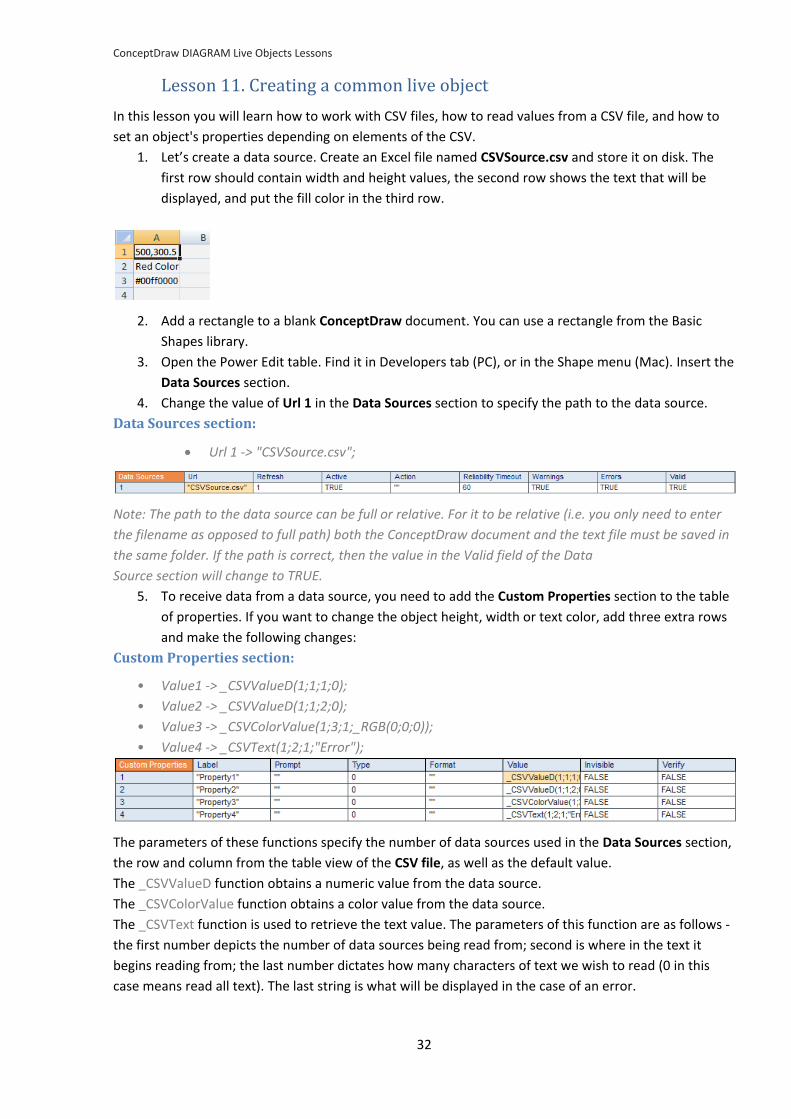
Lesson 11. Creating a common live object
In this lesson you will learn how to work with CSV files, how to read values from a CSV file, and how to
set an object's properties depending on elements of the CSV.
1. Let’s create a data source. Create an Excel file named CSVSource.csv and store it on disk. The
first row should contain width and height values, the second row shows the text that will be
displayed, and put the fill color in the third row.
2. Add a rectangle to a blank ConceptDraw document. You can use a rectangle from the Basic
Shapes library.
3. Open the Power Edit table. Find it in Developers tab (PC), or in the Shape menu (Mac). Insert the
Data Sources section.
4. Change the value of Url 1 in the Data Sources section to specify the path to the data source.
Data Sources section:
Url 1 -> "CSVSource.csv";
Note: The path to the data source can be full or relative. For it to be relative (i.e. you only need to enter
the filename as opposed to full path) both the ConceptDraw document and the text file must be saved in
the same folder. If the path is correct, then the value in the Valid field of the Data
Source section will change to TRUE.
5. To receive data from a data source, you need to add the Custom Properties section to the table
of properties. If you want to change the object height, width or text color, add three extra rows
and make the following changes:
Custom Properties section:
• Value1 -> _CSVValueD(1;1;1;0);
• Value2 -> _CSVValueD(1;1;2;0);
• Value3 -> _CSVColorValue(1;3;1;_RGB(0;0;0));
• Value4 -> _CSVText(1;2;1;"Error");
The parameters of these functions specify the number of data sources used in the Data Sources section,
the row and column from the table view of the CSV file, as well as the default value.
The _CSVValueD function obtains a numeric value from the data source.
The _CSVColorValue function obtains a color value from the data source.
The _CSVText function is used to retrieve the text value. The parameters of this function are as follows -
the first number depicts the number of data sources being read from; second is where in the text it
begins reading from; the last number dictates how many characters of text we wish to read (0 in this
case means read all text). The last string is what will be displayed in the case of an error.
ConceptDraw DIAGRAM Live Objects Lessons
33
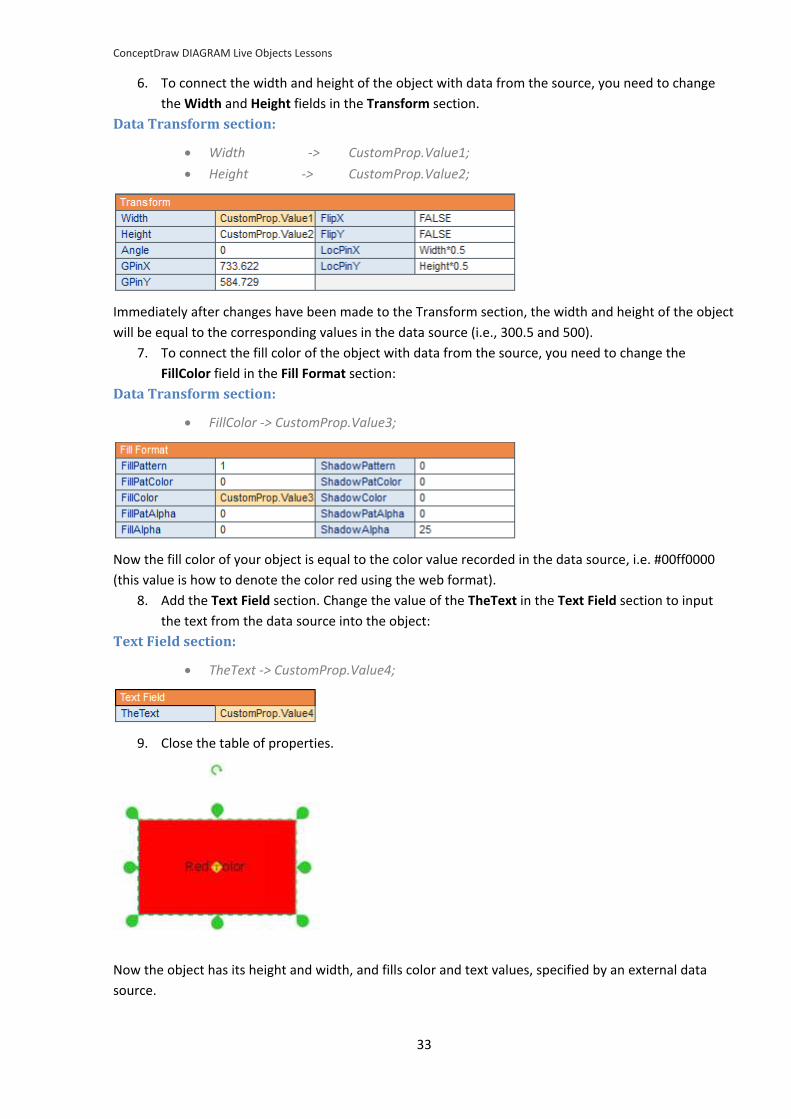
6. To connect the width and height of the object with data from the source, you need to change
the Width and Height fields in the Transform section.
Data Transform section:
Width -> CustomProp.Value1;
Height -> CustomProp.Value2;
Immediately after changes have been made to the Transform section, the width and height of the object
will be equal to the corresponding values in the data source (i.e., 300.5 and 500).
7. To connect the fill color of the object with data from the source, you need to change the
FillColor field in the Fill Format section:
Data Transform section:
FillColor -> CustomProp.Value3;
Now the fill color of your object is equal to the color value recorded in the data source, i.e. #00ff0000
(this value is how to denote the color red using the web format).
8. Add the Text Field section. Change the value of the TheText in the Text Field section to input
the text from the data source into the object:
Text Field section:
TheText -> CustomProp.Value4;
9. Close the table of properties.
Now the object has its height and width, and fills color and text values, specified by an external data
source.
ConceptDraw DIAGRAM Live Objects Lessons
34
Lesson 12. Creating a dynamic live object
In this lesson we will learn how to create a live object that reads data from a CSV file of variable
length, and builds a simple bar graph according the data. To create these objects you will need to
combine the functions of tables and CDBasic.
You can learn how to create simple bar graph in Lesson 9. Create this object and use it as the base for
the live object in this lesson.
This object consists of coordinate axes, columns of data, measurement scales and an Action menu. We
will change the functionality of this object by replacing the ability to add / remove columns with the
option to load data from an external CSV file of variable length. The functionality of this dynamic live
object should contain the following abilities:
• Load data from an external CSV file of variable length;
• Change the number of columns depending on the downloaded data;
• Modify data on the vertical axis, set a maximum value, and make an automatic
adjustment of the height of the column;
• Hide / display the axis;
• Hide / display the values on the axes;
• Hide / display the values in columns;
• Specify the width of columns by using the Control Handle.
You need to apply a Basic script to that object we created in Lesson 9. You also need to change certain
values in the properties table.
1. Select the object, and open the Basic Editor window: Press the Shape Script button in the
Developers tab (PC), or find out Script Editor command in the Tools menu (Mac).
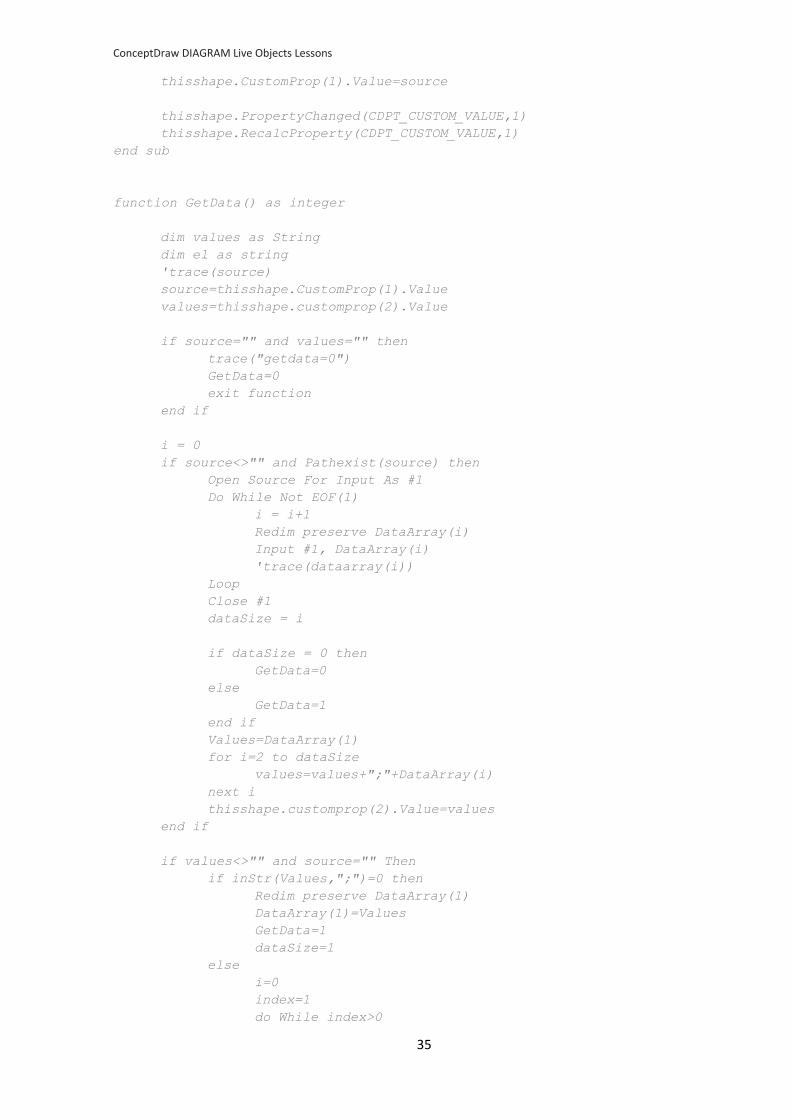
2. Enter the following code into Basic Editor window: declare sub AddColumn(shp as Shape)
declare sub RemoveColumn(shp as Shape)
declare sub Recalc(shp as Shape)
declare sub SetDataSource()
declare function GetData() as integer
declare sub SetData(shp as Shape)
declare function GetMaxValue(shp as Shape) as double
declare sub SetMaxValue(shp as Shape)
const FirstShpNum as integer = 2
static Source as string
dim DataArray() as string
dim DataSize as integer
Source=""
sub SetDataSource()
Source = GetOpenFileName("txt|csv", "Text Files|Coma Separated Files")
ConceptDraw DIAGRAM Live Objects Lessons
35
thisshape.CustomProp(1).Value=source
thisshape.PropertyChanged(CDPT_CUSTOM_VALUE,1)
thisshape.RecalcProperty(CDPT_CUSTOM_VALUE,1)
end sub
function GetData() as integer
dim values as String
dim el as string
'trace(source)
source=thisshape.CustomProp(1).Value
values=thisshape.customprop(2).Value
if source="" and values="" then
trace("getdata=0")
GetData=0
exit function
end if
i = 0
if source<>"" and Pathexist(source) then
Open Source For Input As #1
Do While Not EOF(1)
i = i+1
Redim preserve DataArray(i)
Input #1, DataArray(i)
'trace(dataarray(i))
Loop
Close #1
dataSize = i
if dataSize = 0 then
GetData=0
else
GetData=1
end if
Values=DataArray(1)
for i=2 to dataSize
values=values+";"+DataArray(i)
next i
thisshape.customprop(2).Value=values
end if
if values<>"" and source="" Then
if inStr(Values,";")=0 then
Redim preserve DataArray(1)
DataArray(1)=Values
GetData=1
dataSize=1
else
i=0
index=1
do While index>0
ConceptDraw DIAGRAM Live Objects Lessons
36
i=i+1
index=inStr(Values,";")
el=left(Values,index-1)
Redim preserve DataArray(i)
DataArray(i)=el
values=right(values,len(values)-index)
'trace(DataArray(i))
'trace("i="+i)
Loop
Redim preserve DataArray(i)
DataArray(i)=values
'trace(DataArray(i))
'trace("i="+i)
GetData=1
dataSize=i
end if
end If
end function
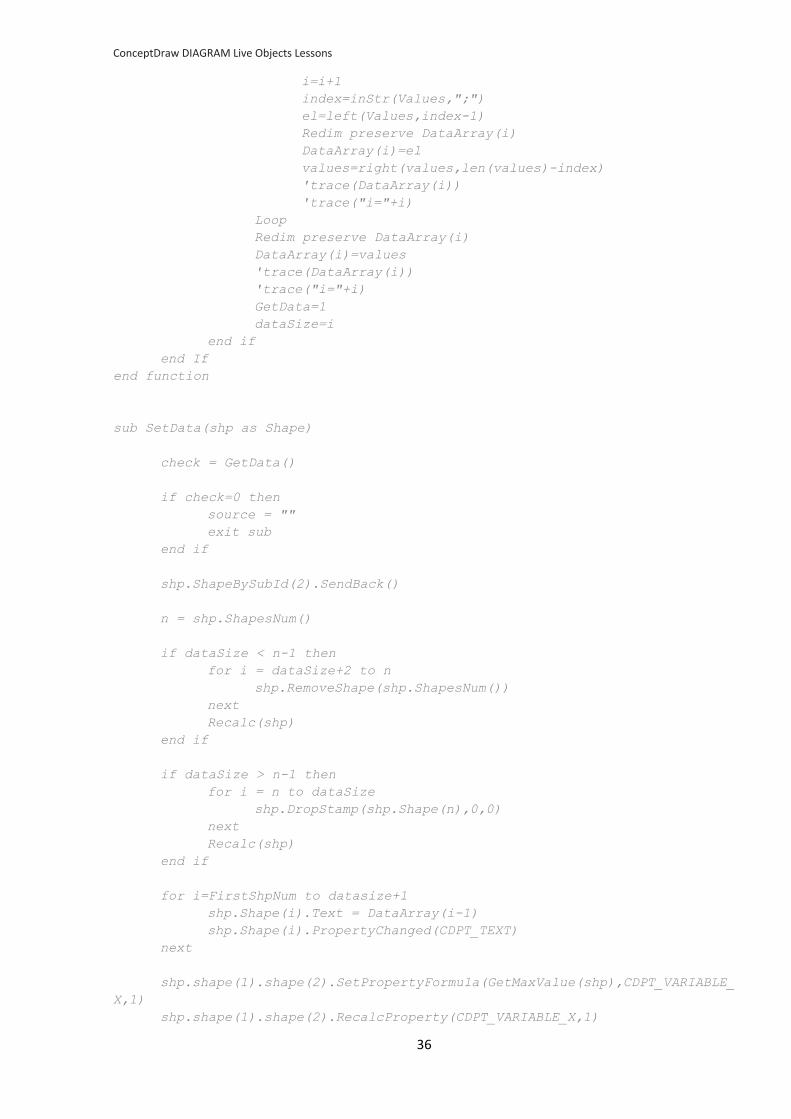
sub SetData(shp as Shape)
check = GetData()
if check=0 then
source = ""
exit sub
end if
shp.ShapeBySubId(2).SendBack()
n = shp.ShapesNum()
if dataSize < n-1 then
for i = dataSize+2 to n
shp.RemoveShape(shp.ShapesNum())
next
Recalc(shp)
end if
if dataSize > n-1 then
for i = n to dataSize
shp.DropStamp(shp.Shape(n),0,0)
next
Recalc(shp)
end if
for i=FirstShpNum to datasize+1
shp.Shape(i).Text = DataArray(i-1)
shp.Shape(i).PropertyChanged(CDPT_TEXT)
next
shp.shape(1).shape(2).SetPropertyFormula(GetMaxValue(shp),CDPT_VARIABLE_
X,1)
shp.shape(1).shape(2).RecalcProperty(CDPT_VARIABLE_X,1)
ConceptDraw DIAGRAM Live Objects Lessons
37
end sub
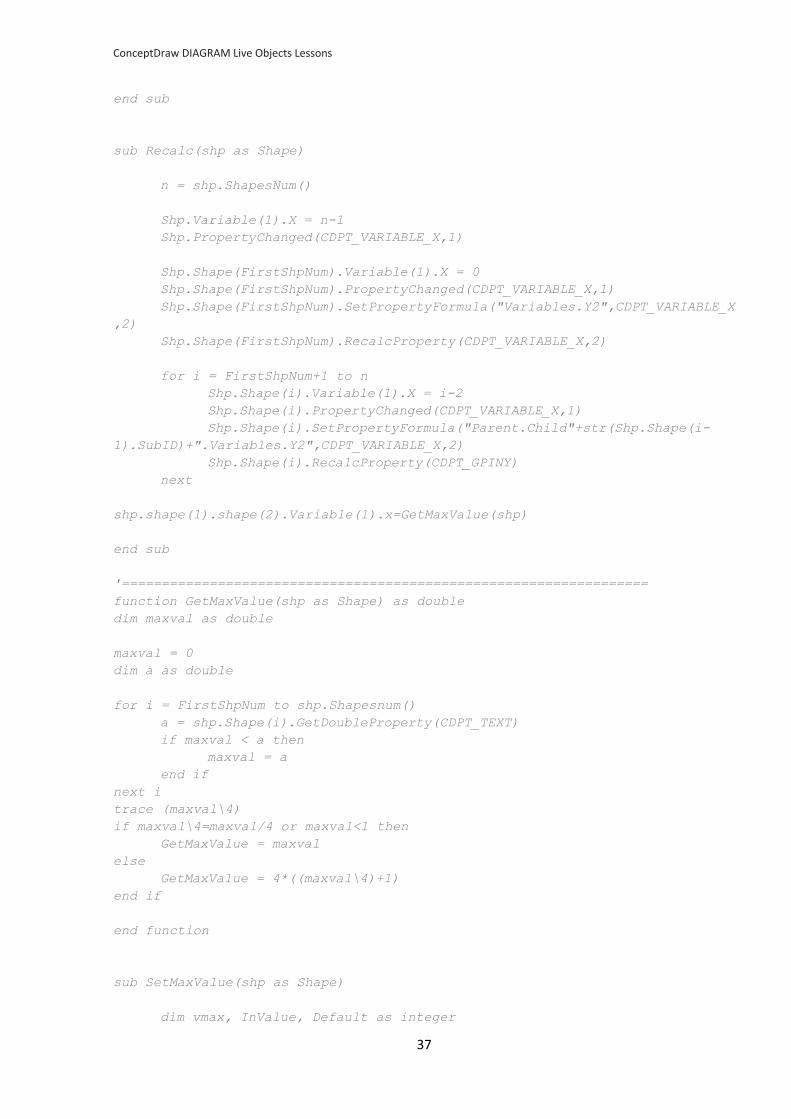
sub Recalc(shp as Shape)
n = shp.ShapesNum()
Shp.Variable(1).X = n-1
Shp.PropertyChanged(CDPT_VARIABLE_X,1)
Shp.Shape(FirstShpNum).Variable(1).X = 0
Shp.Shape(FirstShpNum).PropertyChanged(CDPT_VARIABLE_X,1)
Shp.Shape(FirstShpNum).SetPropertyFormula("Variables.Y2",CDPT_VARIABLE_X
,2)
Shp.Shape(FirstShpNum).RecalcProperty(CDPT_VARIABLE_X,2)
for i = FirstShpNum+1 to n
Shp.Shape(i).Variable(1).X = i-2
Shp.Shape(i).PropertyChanged(CDPT_VARIABLE_X,1)
Shp.Shape(i).SetPropertyFormula("Parent.Child"+str(Shp.Shape(i-
1).SubID)+".Variables.Y2",CDPT_VARIABLE_X,2)
Shp.Shape(i).RecalcProperty(CDPT_GPINY)
next
shp.shape(1).shape(2).Variable(1).x=GetMaxValue(shp)
end sub
'==================================================================
function GetMaxValue(shp as Shape) as double
dim maxval as double
maxval = 0
dim a as double
for i = FirstShpNum to shp.Shapesnum()
a = shp.Shape(i).GetDoubleProperty(CDPT_TEXT)
if maxval < a then
maxval = a
end if
next i
trace (maxval\4)
if maxval\4=maxval/4 or maxval<1 then
GetMaxValue = maxval
else
GetMaxValue = 4*((maxval\4)+1)
end if
end function
sub SetMaxValue(shp as Shape)
dim vmax, InValue, Default as integer
ConceptDraw DIAGRAM Live Objects Lessons
38
dim Message, Title
Message = "Set Maximum Value"
Title = "Max Value"
Default = GetMaxValue(shp)
InValue = InputBox(Message, Title, Default)
if (InValue > 0) then
shp.shape(1).shape(2).SetPropertyFormula(InValue,CDPT_VARIABLE_X,1)
shp.shape(1).shape(2).RecalcProperty(CDPT_VARIABLE_X,1)
else
exit sub
end if
end Sub
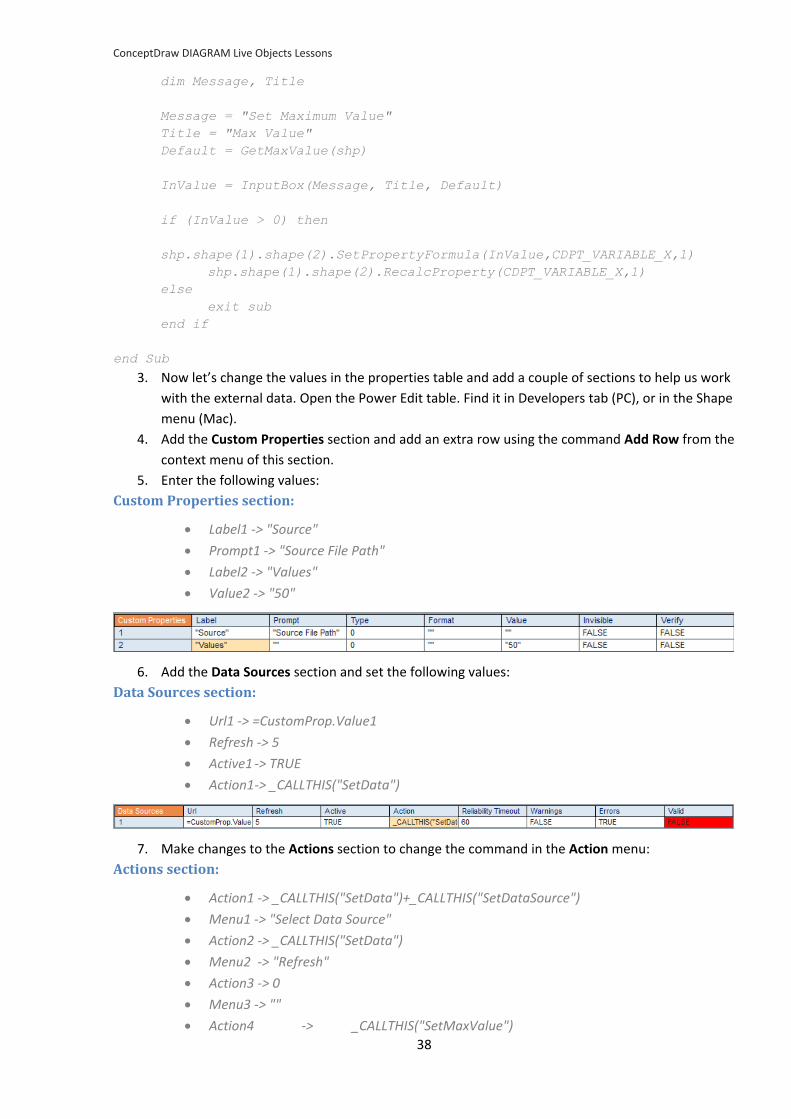
3. Now let’s change the values in the properties table and add a couple of sections to help us work
with the external data. Open the Power Edit table. Find it in Developers tab (PC), or in the Shape
menu (Mac).
4. Add the Custom Properties section and add an extra row using the command Add Row from the
context menu of this section.
5. Enter the following values:
Custom Properties section:
Label1 -> "Source"
Prompt1 -> "Source File Path"
Label2 -> "Values"
Value2 -> "50"
6. Add the Data Sources section and set the following values:
Data Sources section:
Url1 -> =CustomProp.Value1
Refresh -> 5
Active1 -> TRUE
Action1 -> _CALLTHIS("SetData")
7. Make changes to the Actions section to change the command in the Action menu:
Actions section:
Action1 -> _CALLTHIS("SetData")+_CALLTHIS("SetDataSource")
Menu1 -> "Select Data Source"
Action2 -> _CALLTHIS("SetData")
Menu2 -> "Refresh"
Action3 -> 0
Menu3 -> ""
Action4 -> _CALLTHIS("SetMaxValue")
ConceptDraw DIAGRAM Live Objects Lessons
39
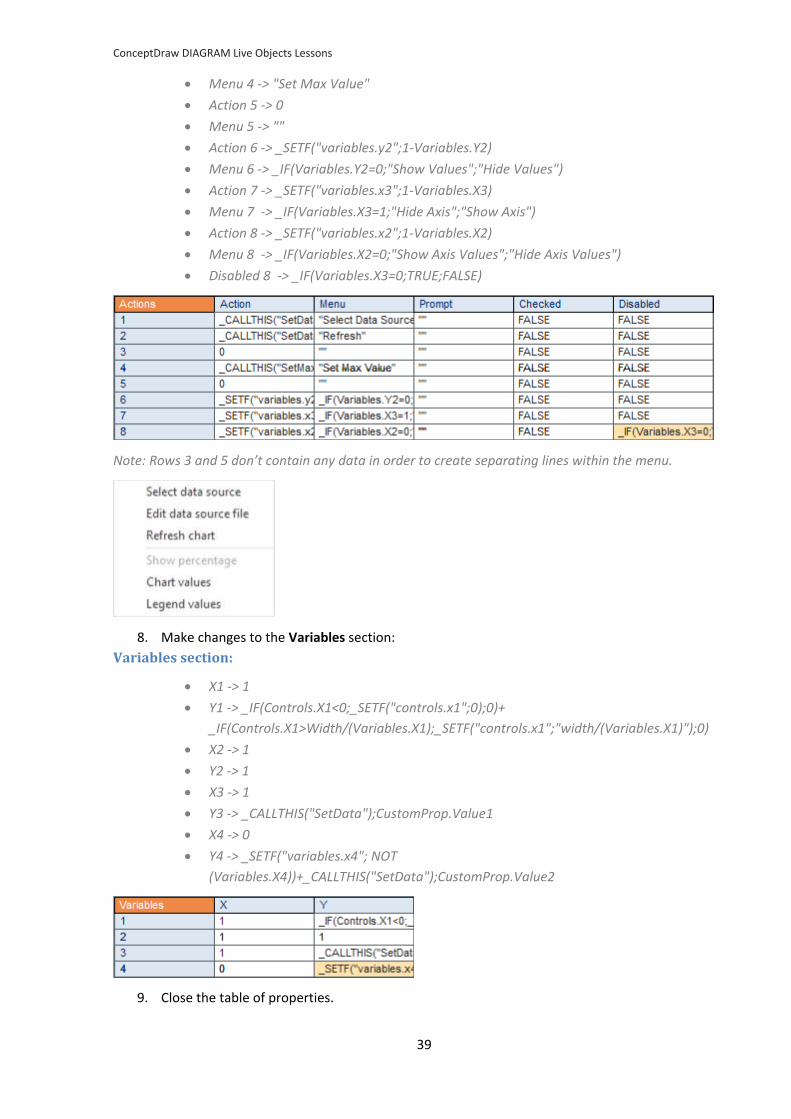
Menu 4 -> "Set Max Value"
Action 5 -> 0
Menu 5 -> ""
Action 6 -> _SETF("variables.y2";1-Variables.Y2)
Menu 6 -> _IF(Variables.Y2=0;"Show Values";"Hide Values")
Action 7 -> _SETF("variables.x3";1-Variables.X3)
Menu 7 -> _IF(Variables.X3=1;"Hide Axis";"Show Axis")
Action 8 -> _SETF("variables.x2";1-Variables.X2)
Menu 8 -> _IF(Variables.X2=0;"Show Axis Values";"Hide Axis Values")
Disabled 8 -> _IF(Variables.X3=0;TRUE;FALSE)
Note: Rows 3 and 5 don’t contain any data in order to create separating lines within the menu.
8. Make changes to the Variables section:
Variables section:
X1 -> 1
Y1 -> _IF(Controls.X1<0;_SETF("controls.x1";0);0)+
_IF(Controls.X1>Width/(Variables.X1);_SETF("controls.x1";"width/(Variables.X1)");0)
X2 -> 1
Y2 -> 1
X3 -> 1
Y3 -> _CALLTHIS("SetData");CustomProp.Value1
X4 -> 0
Y4 -> _SETF("variables.x4"; NOT
(Variables.X4))+_CALLTHIS("SetData");CustomProp.Value2
9. Close the table of properties.
ConceptDraw DIAGRAM Live Objects Lessons
40
10. Next, let’s open the group editor by clicking Ctrl+E or by pressing the Edit Group button in the
Group section of the Shape tab.
11. Open the table of properties for the X-Y axis (F3 or use the Power Edit button in the Properties
group of the Shape tab). (see Lesson 9)
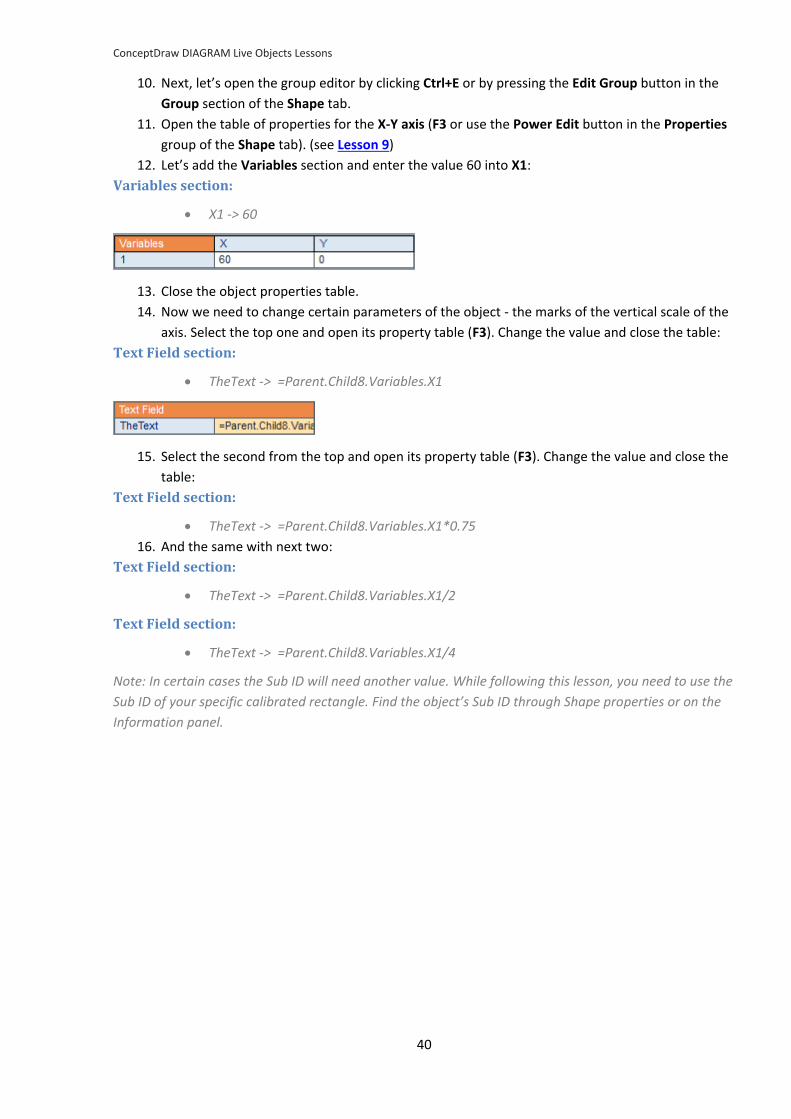
12. Let’s add the Variables section and enter the value 60 into X1:
Variables section:
X1 -> 60
13. Close the object properties table.
14. Now we need to change certain parameters of the object - the marks of the vertical scale of the
axis. Select the top one and open its property table (F3). Change the value and close the table:
Text Field section:
TheText -> =Parent.Child8.Variables.X1
15. Select the second from the top and open its property table (F3). Change the value and close the
table:
Text Field section:
TheText -> =Parent.Child8.Variables.X1*0.75
16. And the same with next two:
Text Field section:
TheText -> =Parent.Child8.Variables.X1/2
Text Field section:
TheText -> =Parent.Child8.Variables.X1/4
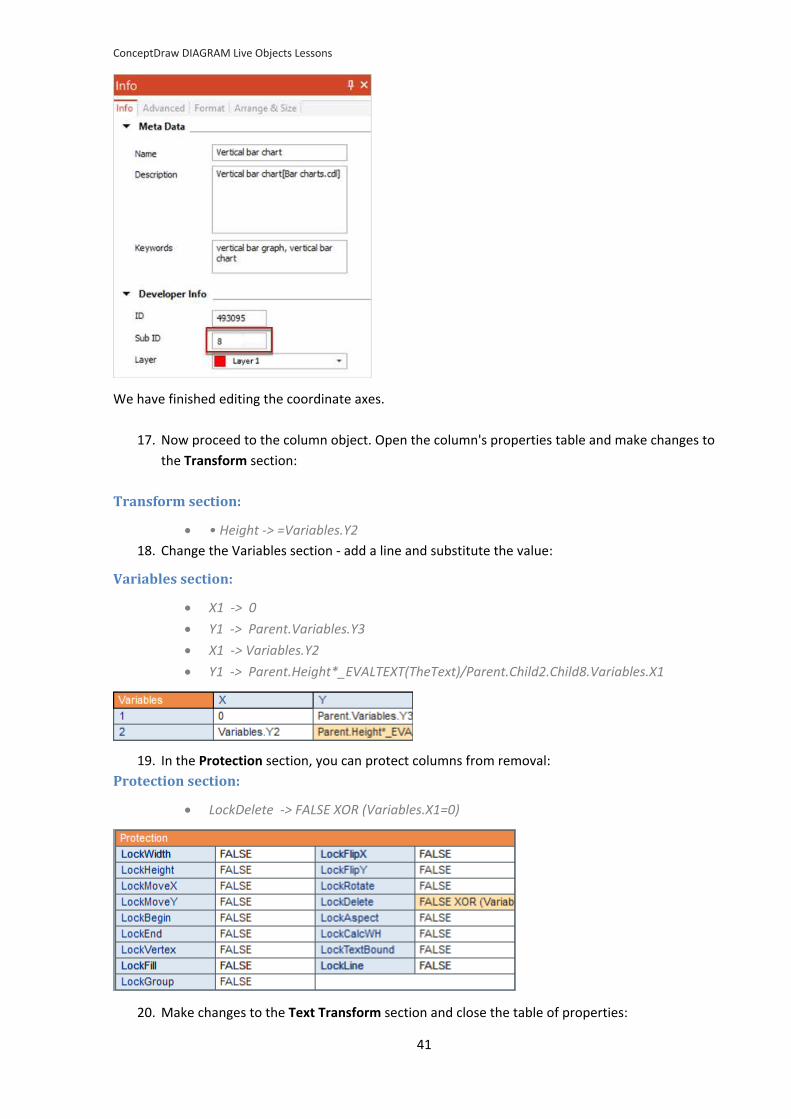
Note: In certain cases the Sub ID will need another value. While following this lesson, you need to use the
Sub ID of your specific calibrated rectangle. Find the object’s Sub ID through Shape properties or on the
Information panel.
ConceptDraw DIAGRAM Live Objects Lessons
41
We have finished editing the coordinate axes.
17. Now proceed to the column object. Open the column's properties table and make changes to
the Transform section:
Transform section:
• Height -> =Variables.Y2
18. Change the Variables section - add a line and substitute the value:
Variables section:
X1 -> 0
Y1 -> Parent.Variables.Y3
X1 -> Variables.Y2
Y1 -> Parent.Height*_EVALTEXT(TheText)/Parent.Child2.Child8.Variables.X1
19. In the Protection section, you can protect columns from removal:
Protection section:
LockDelete -> FALSE XOR (Variables.X1=0)
20. Make changes to the Text Transform section and close the table of properties:
ConceptDraw DIAGRAM Live Objects Lessons
42
Text Transform section:
Text Angle -> -Angle
To test the object, open the properties table of the object and change the following parameter in the
Custom Properties section:
Custom Properties section:
Value2 -> "45;67;23;78"
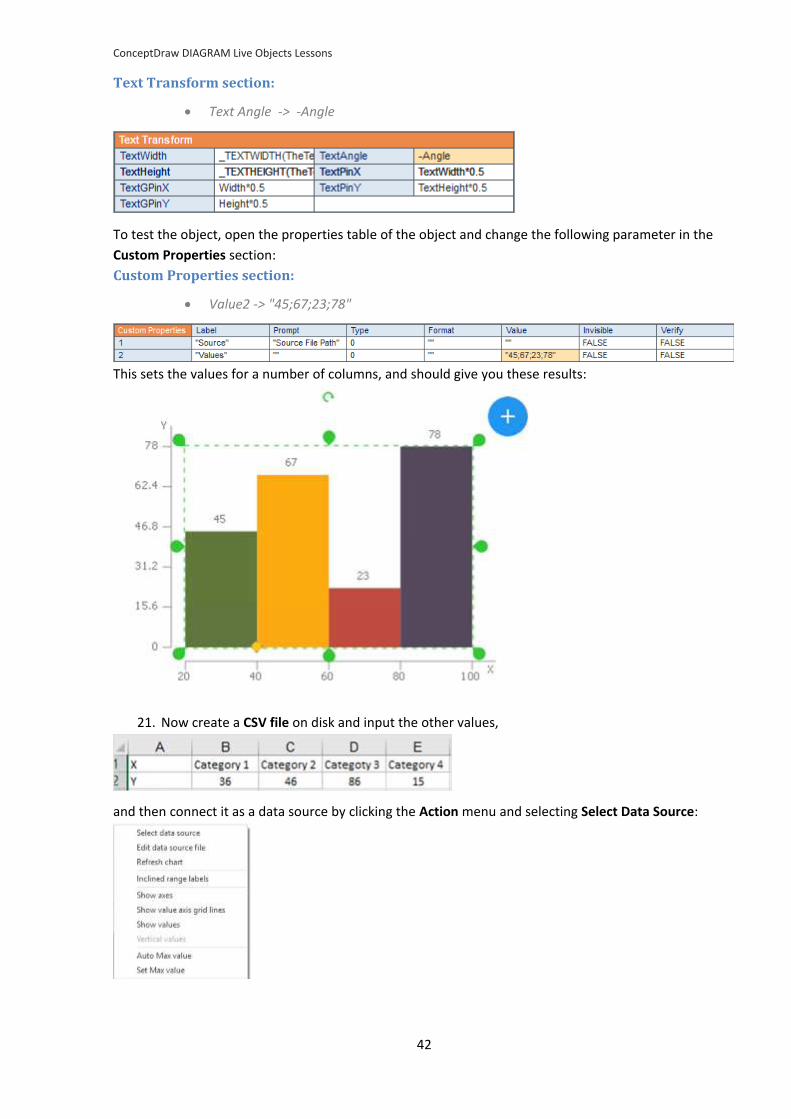
This sets the values for a number of columns, and should give you these results:
21. Now create a CSV file on disk and input the other values,
and then connect it as a data source by clicking the Action menu and selecting Select Data Source:
ConceptDraw DIAGRAM Live Objects Lessons
43
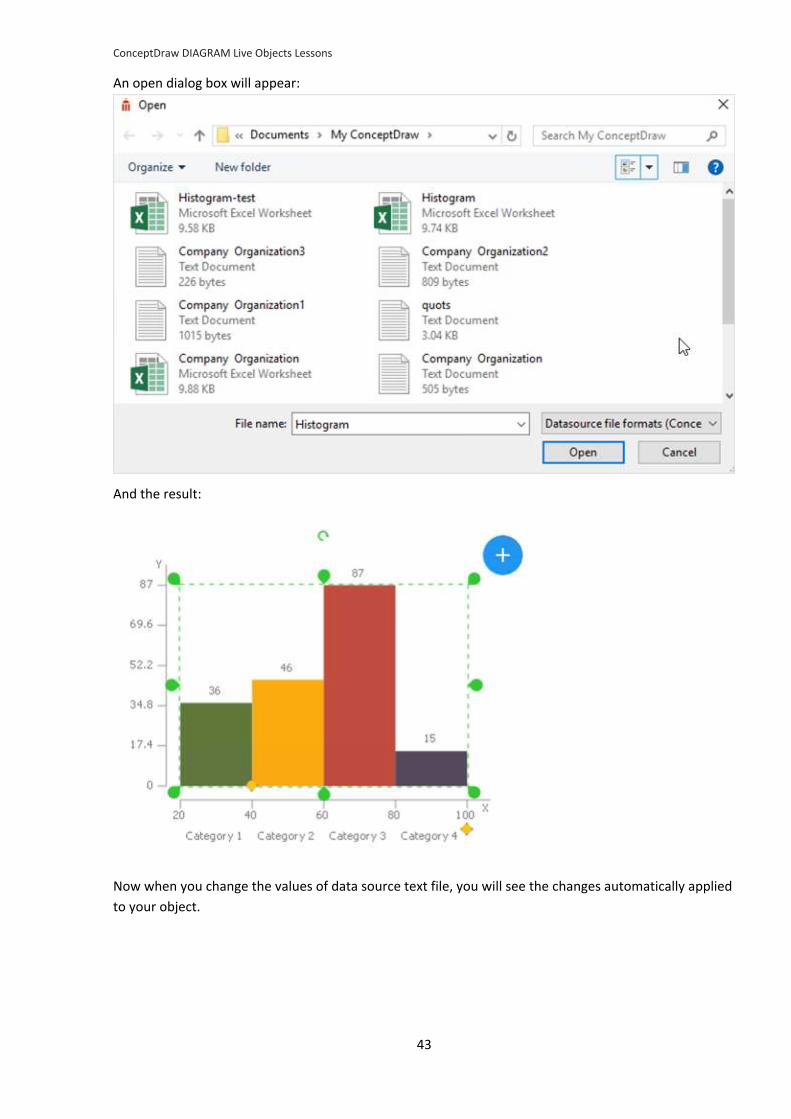
An open dialog box will appear:
And the result:
Now when you change the values of data source text file, you will see the changes automatically applied
to your object.
ConceptDraw DIAGRAM Live Objects Lessons
44
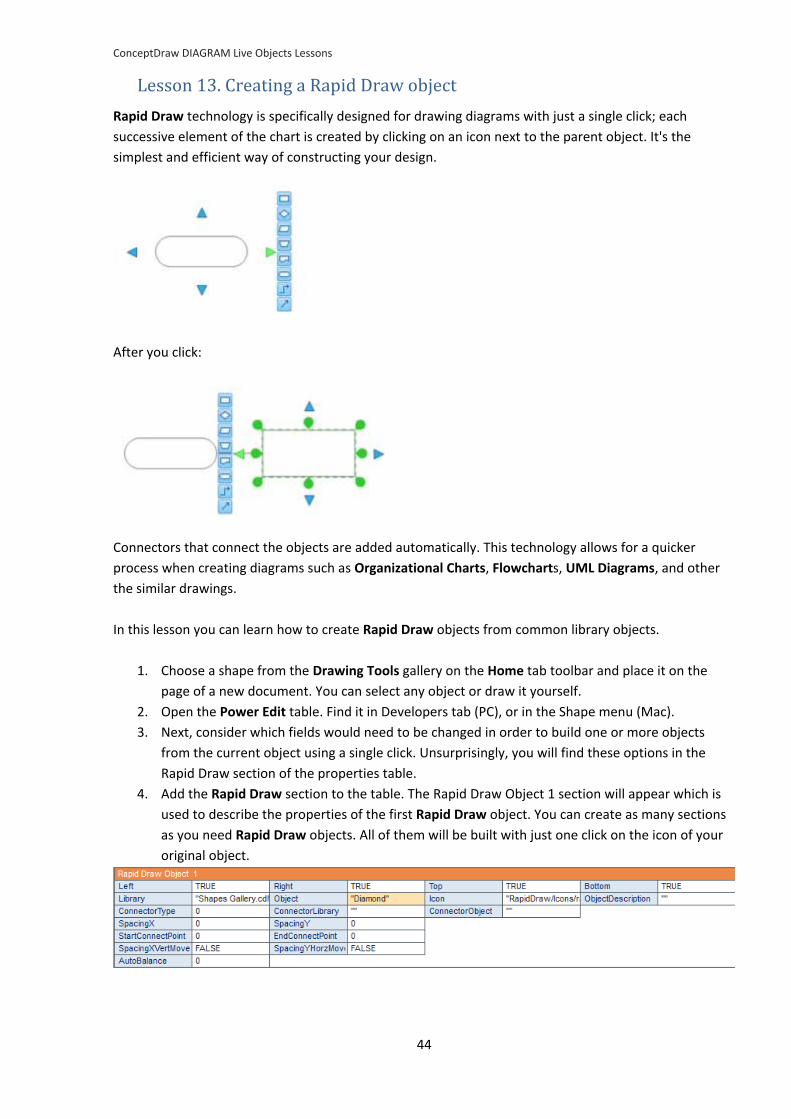
Lesson 13. Creating a Rapid Draw object
Rapid Draw technology is specifically designed for drawing diagrams with just a single click; each
successive element of the chart is created by clicking on an icon next to the parent object. It's the
simplest and efficient way of constructing your design.
After you click:
Connectors that connect the objects are added automatically. This technology allows for a quicker
process when creating diagrams such as Organizational Charts, Flowcharts, UML Diagrams, and other
the similar drawings.
In this lesson you can learn how to create Rapid Draw objects from common library objects.
1. Choose a shape from the Drawing Tools gallery on the Home tab toolbar and place it on the
page of a new document. You can select any object or draw it yourself.
2. Open the Power Edit table. Find it in Developers tab (PC), or in the Shape menu (Mac).
3. Next, consider which fields would need to be changed in order to build one or more objects
from the current object using a single click. Unsurprisingly, you will find these options in the
Rapid Draw section of the properties table.
4. Add the Rapid Draw section to the table. The Rapid Draw Object 1 section will appear which is
used to describe the properties of the first Rapid Draw object. You can create as many sections
as you need Rapid Draw objects. All of them will be built with just one click on the icon of your
original object.
ConceptDraw DIAGRAM Live Objects Lessons
45
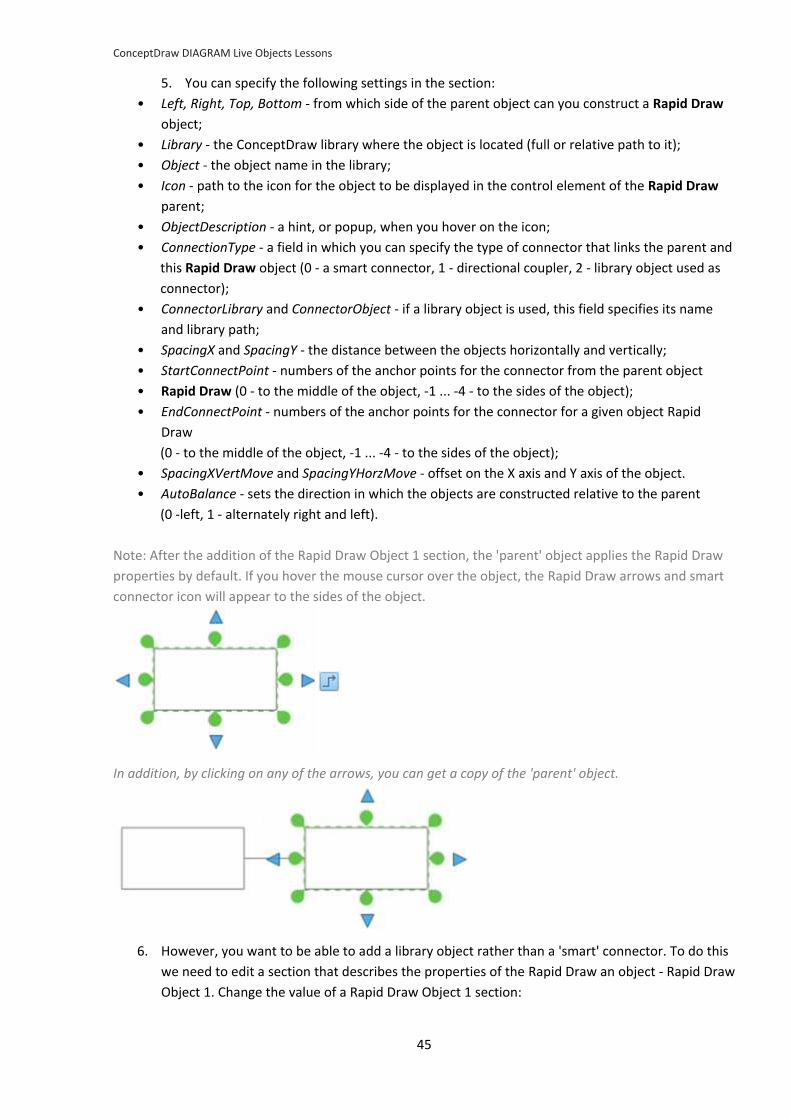
5. You can specify the following settings in the section:
• Left, Right, Top, Bottom - from which side of the parent object can you construct a Rapid Draw
object;
• Library - the ConceptDraw library where the object is located (full or relative path to it);
• Object - the object name in the library;
• Icon - path to the icon for the object to be displayed in the control element of the Rapid Draw
parent;
• ObjectDescription - a hint, or popup, when you hover on the icon;
• ConnectionType - a field in which you can specify the type of connector that links the parent and
this Rapid Draw object (0 - a smart connector, 1 - directional coupler, 2 - library object used as
connector);
• ConnectorLibrary and ConnectorObject - if a library object is used, this field specifies its name
and library path;
• SpacingX and SpacingY - the distance between the objects horizontally and vertically;
• StartConnectPoint - numbers of the anchor points for the connector from the parent object
• Rapid Draw (0 - to the middle of the object, -1 ... -4 - to the sides of the object);
• EndConnectPoint - numbers of the anchor points for the connector for a given object Rapid
Draw
(0 - to the middle of the object, -1 ... -4 - to the sides of the object);
• SpacingXVertMove and SpacingYHorzMove - offset on the X axis and Y axis of the object.
• AutoBalance - sets the direction in which the objects are constructed relative to the parent
(0 -left, 1 - alternately right and left).
Note: After the addition of the Rapid Draw Object 1 section, the 'parent' object applies the Rapid Draw
properties by default. If you hover the mouse cursor over the object, the Rapid Draw arrows and smart
connector icon will appear to the sides of the object.
In addition, by clicking on any of the arrows, you can get a copy of the 'parent' object.
6. However, you want to be able to add a library object rather than a 'smart' connector. To do this
we need to edit a section that describes the properties of the Rapid Draw an object - Rapid Draw
Object 1. Change the value of a Rapid Draw Object 1 section:
ConceptDraw DIAGRAM Live Objects Lessons
46
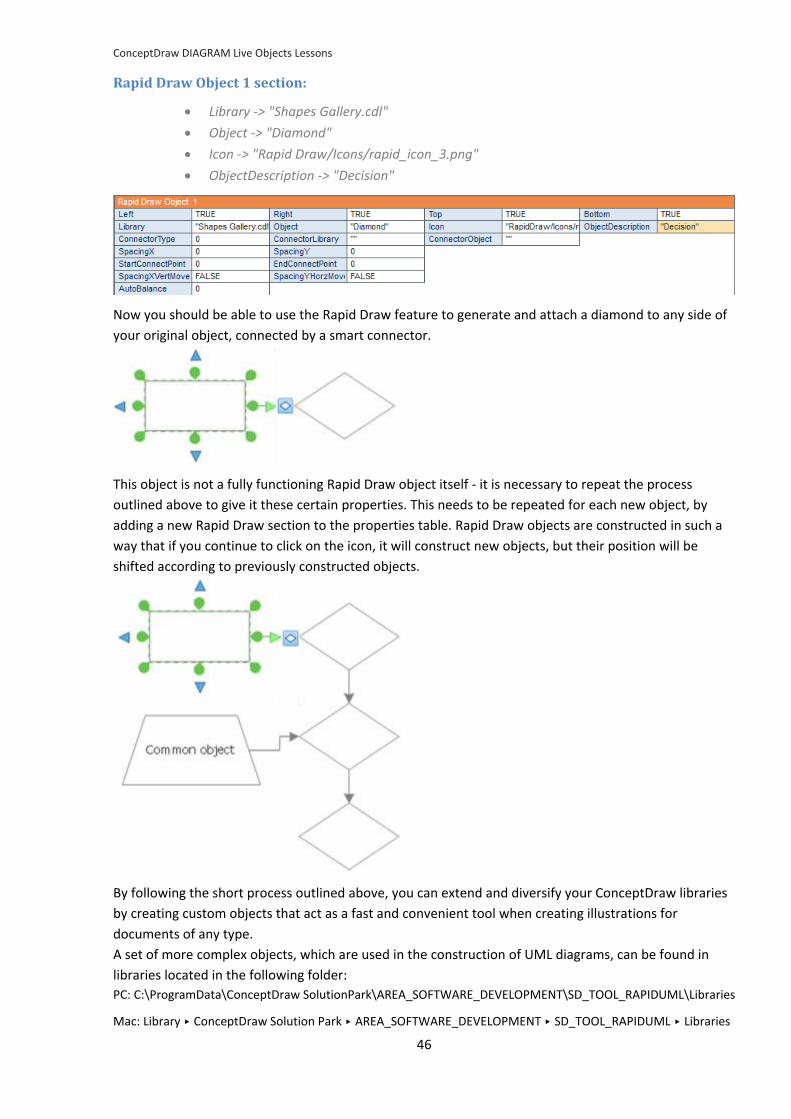
Rapid Draw Object 1 section:
Library -> "Shapes Gallery.cdl"
Object -> "Diamond"
Icon -> "Rapid Draw/Icons/rapid_icon_3.png"
ObjectDescription -> "Decision"
Now you should be able to use the Rapid Draw feature to generate and attach a diamond to any side of
your original object, connected by a smart connector.
This object is not a fully functioning Rapid Draw object itself - it is necessary to repeat the process
outlined above to give it these certain properties. This needs to be repeated for each new object, by
adding a new Rapid Draw section to the properties table. Rapid Draw objects are constructed in such a
way that if you continue to click on the icon, it will construct new objects, but their position will be
shifted according to previously constructed objects.
By following the short process outlined above, you can extend and diversify your ConceptDraw libraries
by creating custom objects that act as a fast and convenient tool when creating illustrations for
documents of any type.
A set of more complex objects, which are used in the construction of UML diagrams, can be found in
libraries located in the following folder:
PC: C:\ProgramData\ConceptDraw SolutionPark\AREA_SOFTWARE_DEVELOPMENT\SD_TOOL_RAPIDUML\Libraries
Mac: Library ▸ ConceptDraw Solution Park ▸ AREA_SOFTWARE_DEVELOPMENT ▸ SD_TOOL_RAPIDUML ▸ Libraries