Embed Size (px)
DESCRIPTION
Financial Ratio Analysis
Citation preview

6-1
Financial Statement Financial Statement AnalysisAnalysis
Financial Statement Financial Statement AnalysisAnalysis
6-2
Topic to be CoveredTopic to be Covered
Understand the purpose of basic financial statements and their contents.
Explain why financial statement analysis is important to the firm and to outside suppliers of capital.
Define, calculate, and categorize (according to liquidity, financial leverage, coverage, activity, and profitability) the major financial ratios and understand what they can tell us about the firm.
Define, calculate, and discuss a firm’s operating cycle and cash cycle.
Use ratios to analyze a firm's health and then recommend reasonable alternative courses of action to improve the health of the firm.
Analyze a firm’s return on investment (i.e., “earning power”) and return on equity using a DuPont approach.
Understand the limitations of financial ratio analysis. Use trend analysis, common-size analysis to gain additional
insights into a firm's performance.
6-3
Financial Financial Statement AnalysisStatement AnalysisFinancial Financial Statement AnalysisStatement Analysis
Financial Statements
A Possible Framework for Analysis
Balance Sheet Ratios
Income Statement and Income Statement/Balance Sheet Ratios
Trend Analysis
Common-Size and Index Analysis
Financial Statements
A Possible Framework for Analysis
Balance Sheet Ratios
Income Statement and Income Statement/Balance Sheet Ratios
Trend Analysis
Common-Size and Index Analysis
6-4
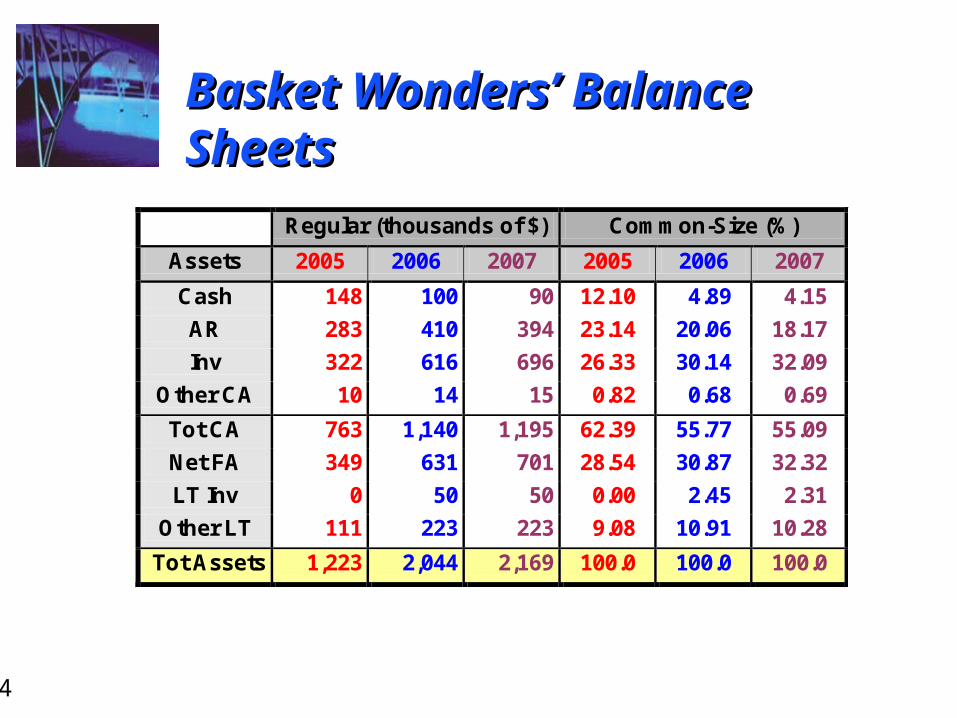
Basket Wonders’ Balance Basket Wonders’ Balance SheetsSheets
Regular (thousands of $) Common-Size (%)
Assets 2005 2006 2007 2005 2006 2007
Cash 148 100 90 12.10 4.89 4.15
AR 283 410 394 23.14 20.06 18.17
Inv 322 616 696 26.33 30.14 32.09
Other CA 10 14 15 0.82 0.68 0.69
Tot CA 763 1,140 1,195 62.39 55.77 55.09
Net FA 349 631 701 28.54 30.87 32.32
LT Inv 0 50 50 0.00 2.45 2.31
Other LT 111 223 223 9.08 10.91 10.28
Tot Assets 1,223 2,044 2,169 100.0 100.0 100.0
6-5
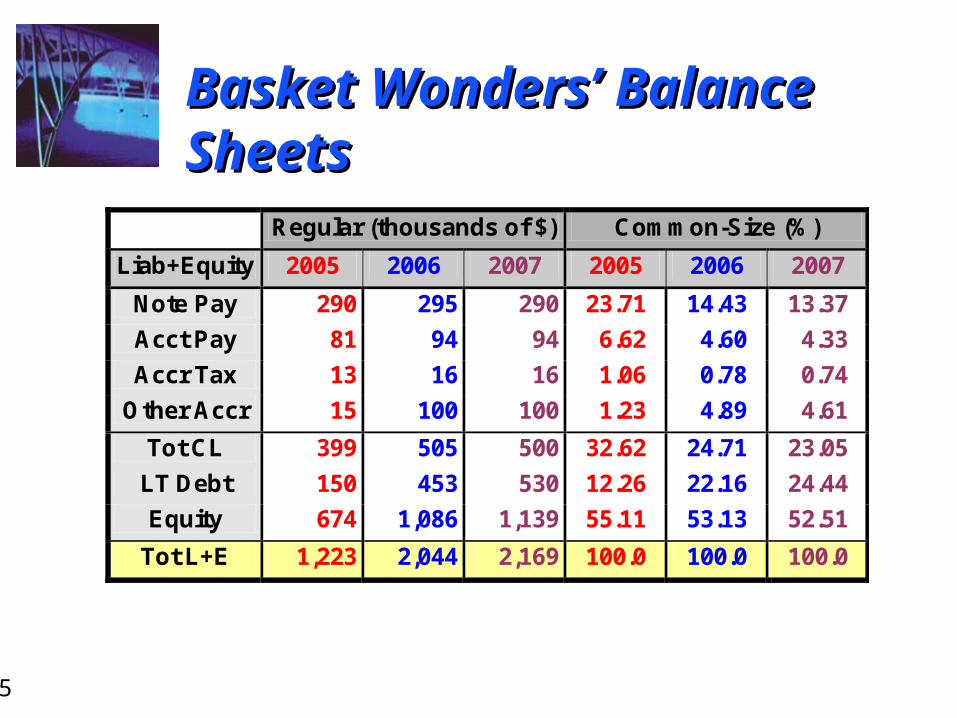
Basket Wonders’ Balance Basket Wonders’ Balance SheetsSheets Regular (thousands of $) Common-Size (%)
Liab+Equity 2005 2006 2007 2005 2006 2007
Note Pay 290 295 290 23.71 14.43 13.37
Acct Pay 81 94 94 6.62 4.60 4.33
Accr Tax 13 16 16 1.06 0.78 0.74
Other Accr 15 100 100 1.23 4.89 4.61
Tot CL 399 505 500 32.62 24.71 23.05
LT Debt 150 453 530 12.26 22.16 24.44
Equity 674 1,086 1,139 55.11 53.13 52.51
Tot L+E 1,223 2,044 2,169 100.0 100.0 100.0
6-6
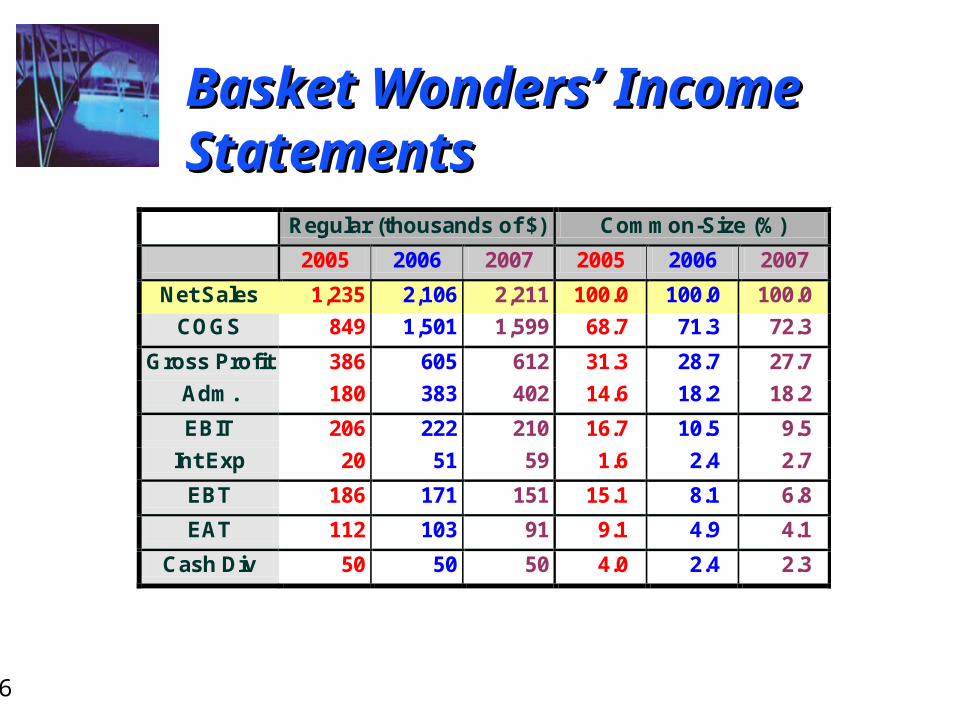
Basket Wonders’ Income Basket Wonders’ Income StatementsStatements
Regular (thousands of $) Common-Size (%)
2005 2006 2007 2005 2006 2007
Net Sales 1,235 2,106 2,211 100.0 100.0 100.0
COGS 849 1,501 1,599 68.7 71.3 72.3
Gross Profit 386 605 612 31.3 28.7 27.7
Adm. 180 383 402 14.6 18.2 18.2
EBIT 206 222 210 16.7 10.5 9.5
Int Exp 20 51 59 1.6 2.4 2.7
EBT 186 171 151 15.1 8.1 6.8
EAT 112 103 91 9.1 4.9 4.1
Cash Div 50 50 50 4.0 2.4 2.3
6-7
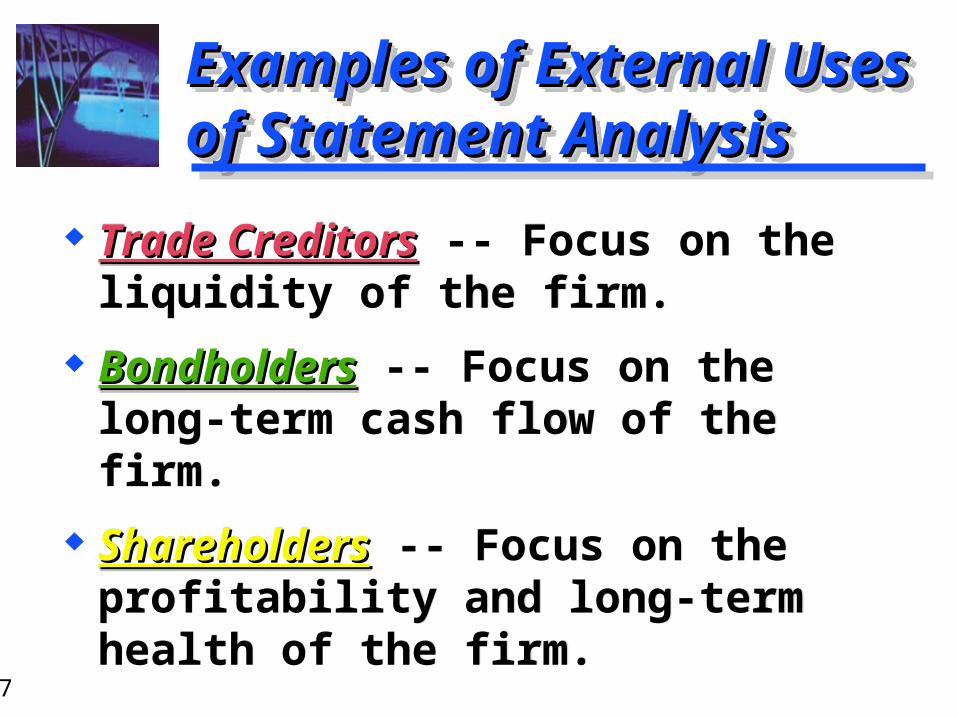
Examples of External Uses Examples of External Uses of Statement Analysisof Statement AnalysisExamples of External Uses Examples of External Uses of Statement Analysisof Statement Analysis
Trade CreditorsTrade Creditors -- Focus on the liquidity of the firm.
BondholdersBondholders -- Focus on the long-term cash flow of the firm.
ShareholdersShareholders -- Focus on the profitability and long-term health of the firm.
Trade CreditorsTrade Creditors -- Focus on the liquidity of the firm.
BondholdersBondholders -- Focus on the long-term cash flow of the firm.
ShareholdersShareholders -- Focus on the profitability and long-term health of the firm.
6-8
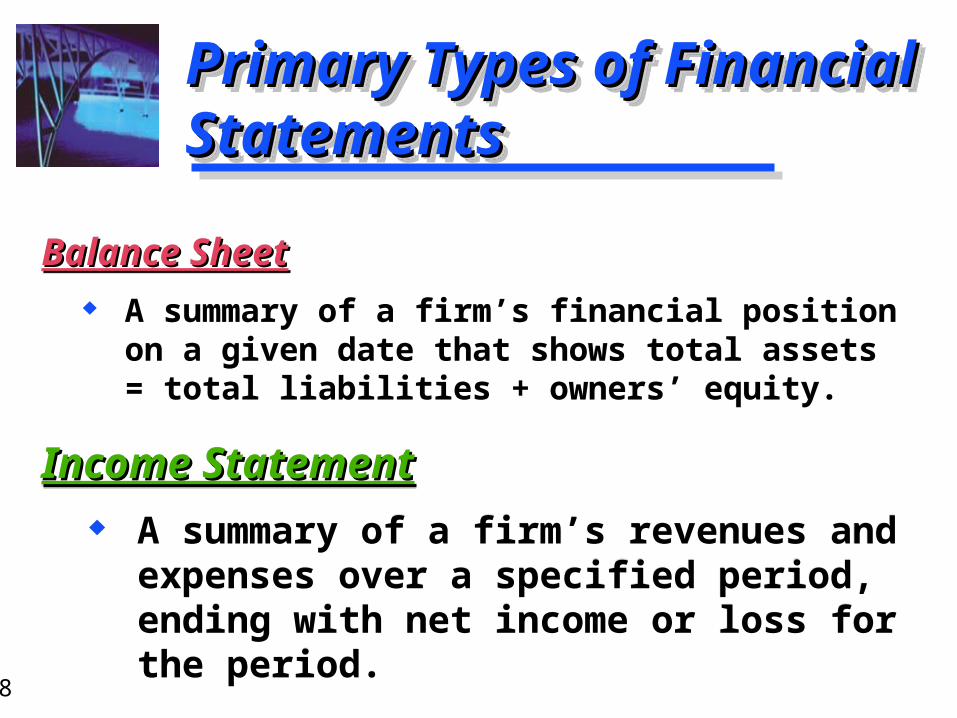
Primary Types of Primary Types of Financial StatementsFinancial StatementsPrimary Types of Primary Types of Financial StatementsFinancial Statements
Income StatementIncome Statement A summary of a firm’s revenues and
expenses over a specified period, ending with net income or loss for the period.
Income StatementIncome Statement A summary of a firm’s revenues and
expenses over a specified period, ending with net income or loss for the period.
Balance SheetBalance Sheet A summary of a firm’s financial position on
a given date that shows total assets = total liabilities + owners’ equity.
Balance SheetBalance Sheet A summary of a firm’s financial position on
a given date that shows total assets = total liabilities + owners’ equity.
6-9
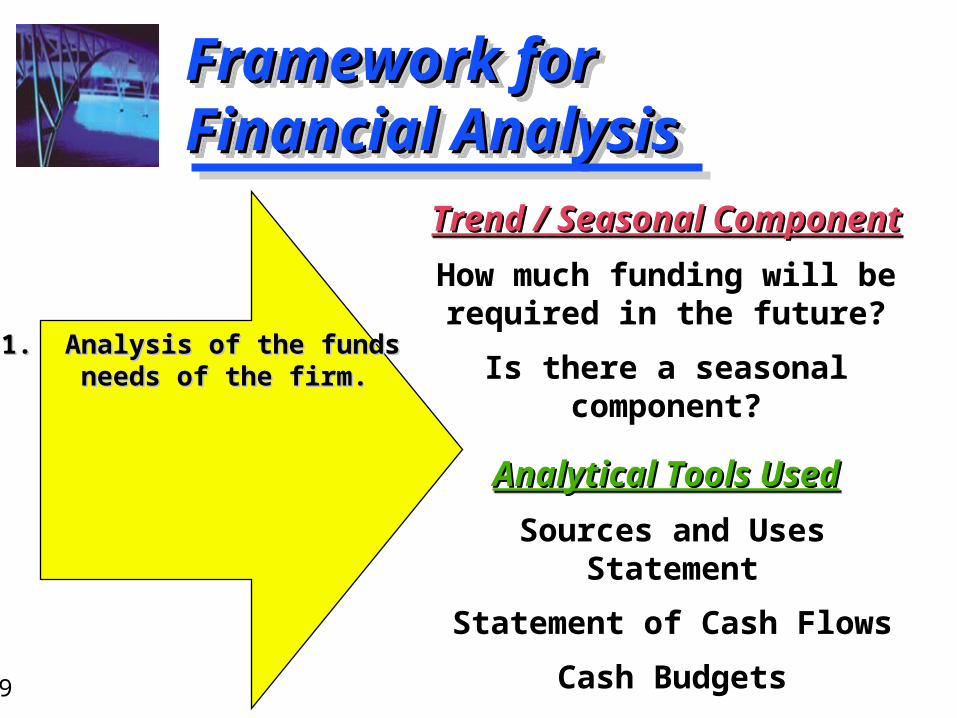
Framework for Framework for Financial AnalysisFinancial AnalysisFramework for Framework for Financial AnalysisFinancial Analysis
Analytical Tools UsedAnalytical Tools Used
Sources and Uses Statement
Statement of Cash Flows
Cash Budgets
Analytical Tools UsedAnalytical Tools Used
Sources and Uses Statement
Statement of Cash Flows
Cash Budgets
1. Analysis of the funds1. Analysis of the funds needs of the firm.needs of the firm.
Trend / Seasonal ComponentTrend / Seasonal Component
How much funding will be required in the future?
Is there a seasonal component?
Trend / Seasonal ComponentTrend / Seasonal Component
How much funding will be required in the future?
Is there a seasonal component?
6-10
Framework for Framework for Financial AnalysisFinancial AnalysisFramework for Framework for Financial AnalysisFinancial Analysis
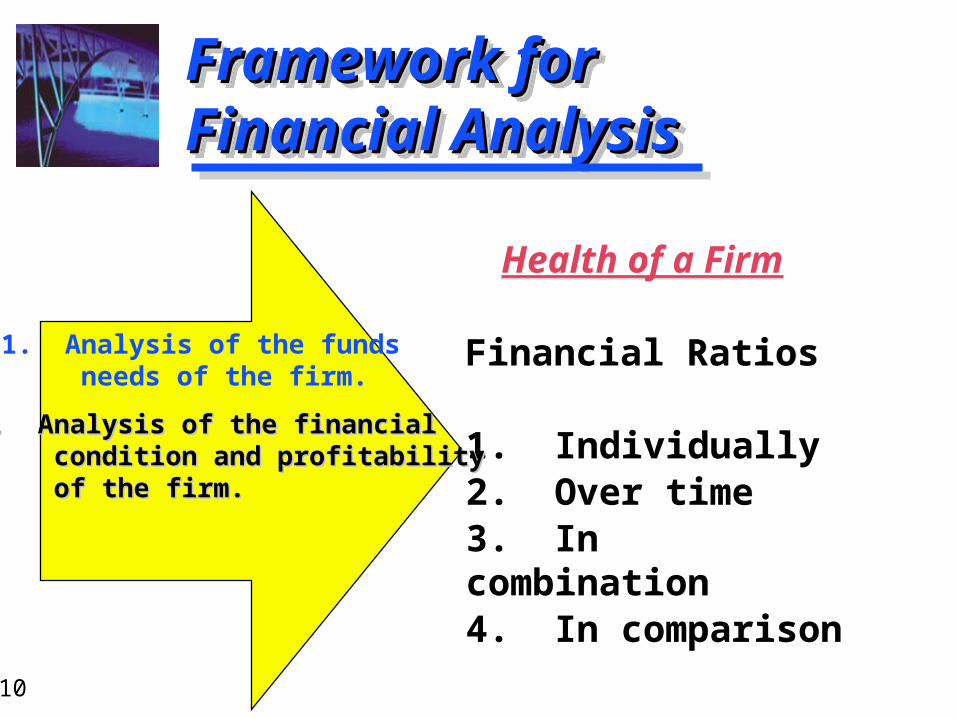
Health of a Firm
Financial Ratios
1. Individually2. Over time3. In combination4. In comparison
Health of a Firm
Financial Ratios
1. Individually2. Over time3. In combination4. In comparison
1. Analysis of the funds needs of the firm.
2. Analysis of the financial2. Analysis of the financial condition and profitabilitycondition and profitability of the firm.of the firm.
6-11
Framework for Framework for Financial AnalysisFinancial AnalysisFramework for Framework for Financial AnalysisFinancial Analysis
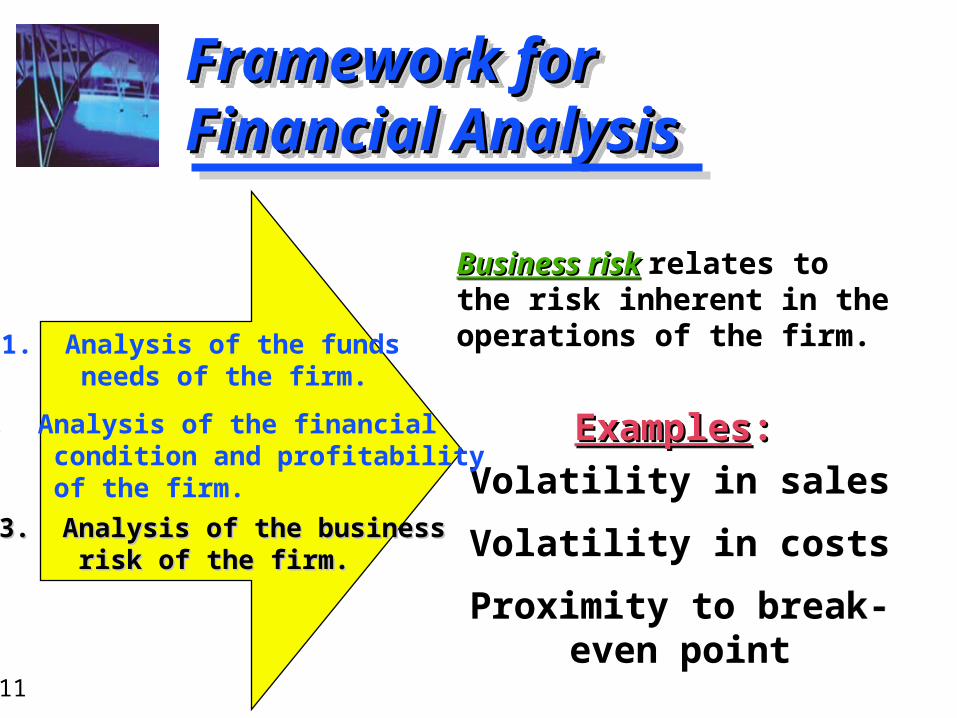
ExamplesExamples::
Volatility in sales
Volatility in costs
Proximity to break-even point
ExamplesExamples::
Volatility in sales
Volatility in costs
Proximity to break-even point
1. Analysis of the funds needs of the firm.
2. Analysis of the financial condition and profitability of the firm.
3. Analysis of the business3. Analysis of the business risk of the firm.risk of the firm.
Business riskBusiness risk relates to the risk inherent in the operations of the firm.
Business riskBusiness risk relates to the risk inherent in the operations of the firm.
6-12
Framework for Framework for Financial AnalysisFinancial AnalysisFramework for Framework for Financial AnalysisFinancial Analysis
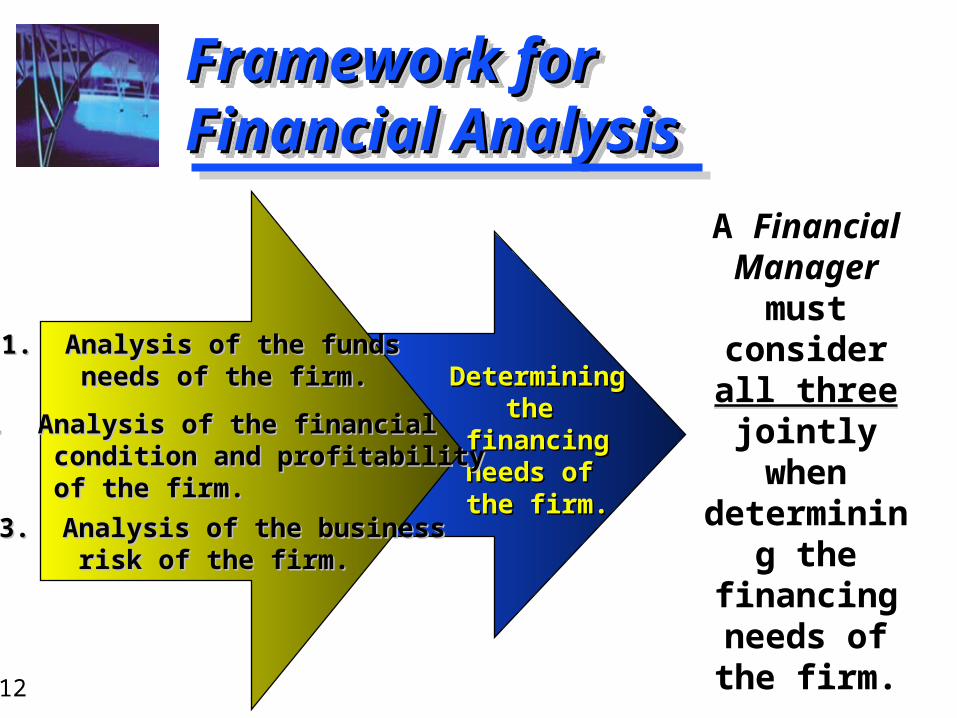
A Financial Manager
must consider all three jointly
when determining
the financing
needs of the firm.
A Financial Manager
must consider all three jointly
when determining
the financing
needs of the firm.
DeterminingDeterminingthe the
financingfinancingneeds of needs of the firm.the firm.
1. Analysis of the funds1. Analysis of the funds needs of the firm.needs of the firm.
2. Analysis of the financial2. Analysis of the financial condition and profitabilitycondition and profitability of the firm.of the firm.
3. Analysis of the business3. Analysis of the business risk of the firm.risk of the firm.
6-13
Framework for Framework for Financial AnalysisFinancial AnalysisFramework for Framework for Financial AnalysisFinancial Analysis
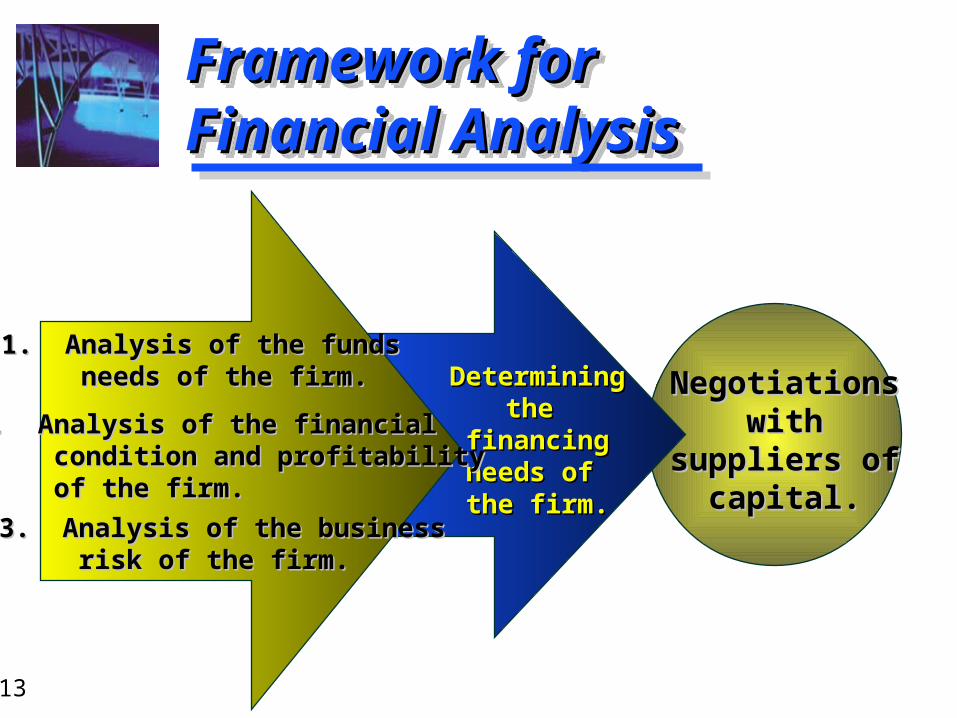
NegotiationsNegotiationswithwith
suppliers ofsuppliers ofcapital.capital.
DeterminingDeterminingthe the
financingfinancingneeds of needs of the firm.the firm.
1. Analysis of the funds1. Analysis of the funds needs of the firm.needs of the firm.
2. Analysis of the financial2. Analysis of the financial condition and profitabilitycondition and profitability of the firm.of the firm.
3. Analysis of the business3. Analysis of the business risk of the firm.risk of the firm.
6-14
Use of Financial RatiosUse of Financial RatiosUse of Financial RatiosUse of Financial Ratios
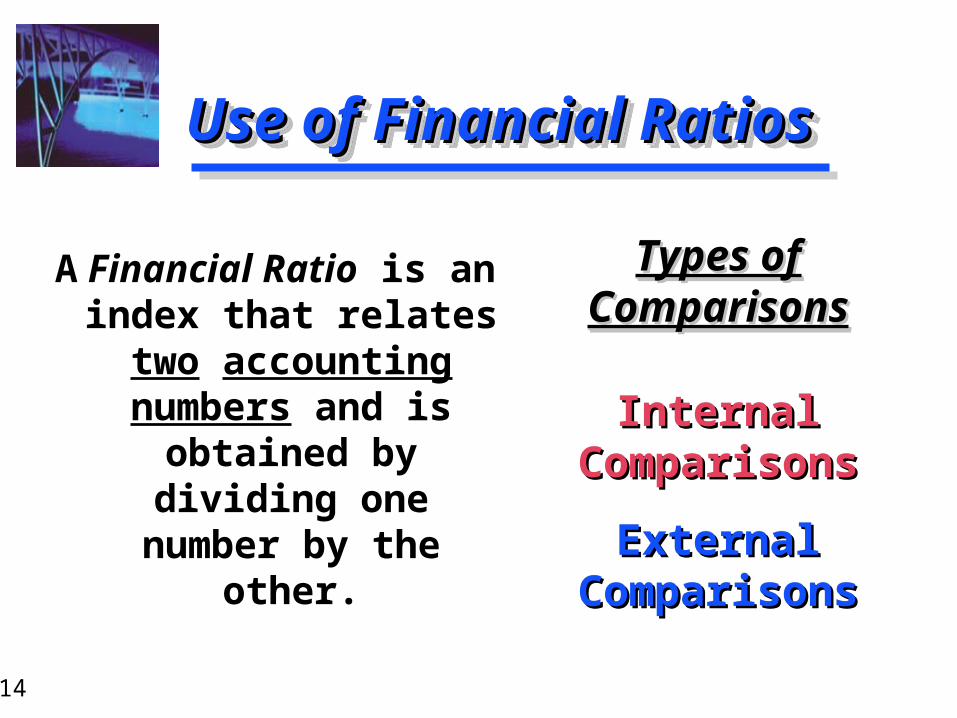
Types of Types of ComparisonsComparisons
Internal Internal ComparisonsComparisons
External External ComparisonsComparisons
Types of Types of ComparisonsComparisons
Internal Internal ComparisonsComparisons
External External ComparisonsComparisons
A Financial Ratio is an index that relates
two accounting numbers and is
obtained by dividing one number by the
other.
6-15
External Comparisons and External Comparisons and Sources of Industry RatiosSources of Industry RatiosExternal Comparisons and External Comparisons and Sources of Industry RatiosSources of Industry Ratios
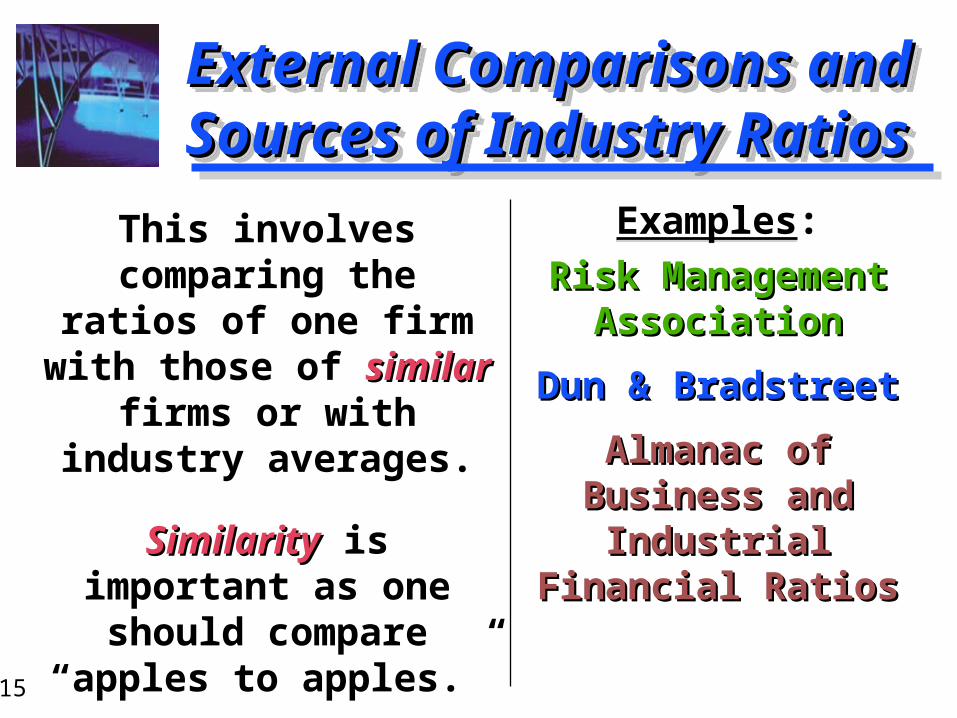
Examples:
Risk Management Risk Management AssociationAssociation
Dun & BradstreetDun & Bradstreet
Almanac of Almanac of Business and Business and
Industrial Industrial Financial RatiosFinancial Ratios
Examples:
Risk Management Risk Management AssociationAssociation
Dun & BradstreetDun & Bradstreet
Almanac of Almanac of Business and Business and
Industrial Industrial Financial RatiosFinancial Ratios
This involves comparing the ratios of one firm with those of similarsimilar firms or with
industry averages.
SimilaritySimilarity is important as one should
compare “apples to apples.”
6-16
Liquidity RatiosLiquidity RatiosLiquidity RatiosLiquidity Ratios
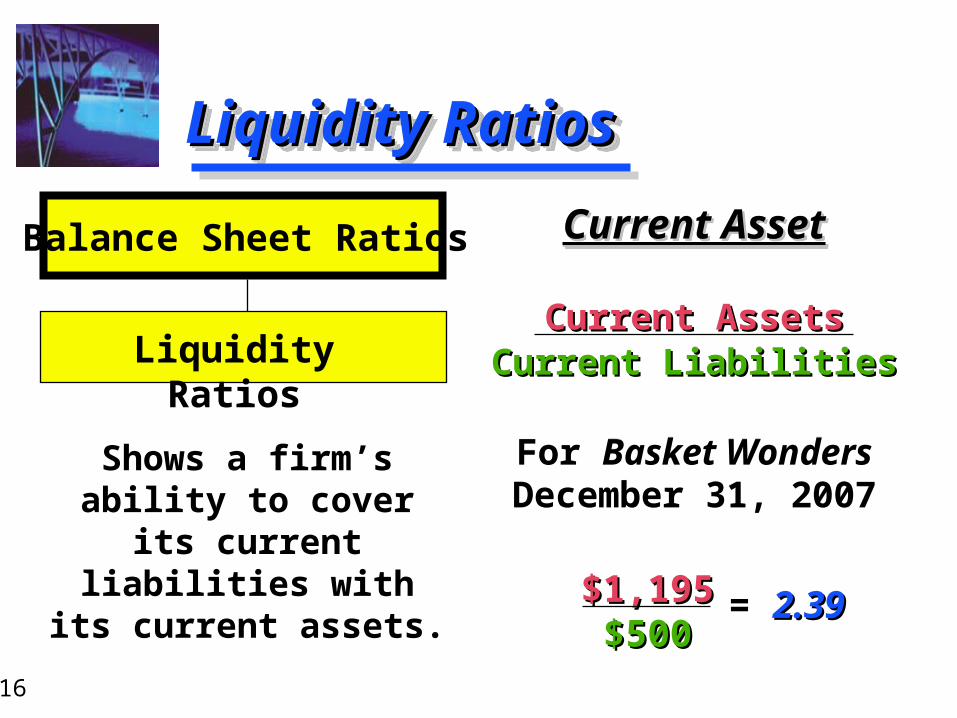
Current AssetCurrent Asset
Current AssetsCurrent AssetsCurrent LiabilitiesCurrent Liabilities
For Basket Wonders December 31, 2007
Current AssetCurrent Asset
Current AssetsCurrent AssetsCurrent LiabilitiesCurrent Liabilities
For Basket Wonders December 31, 2007
Shows a firm’s ability to cover its current liabilities with its current
assets.
Balance Sheet Ratios
Liquidity Ratios
$1,195$1,195$500$500
= 2.392.39
6-17
Liquidity Ratio Liquidity Ratio ComparisonsComparisonsLiquidity Ratio Liquidity Ratio ComparisonsComparisons
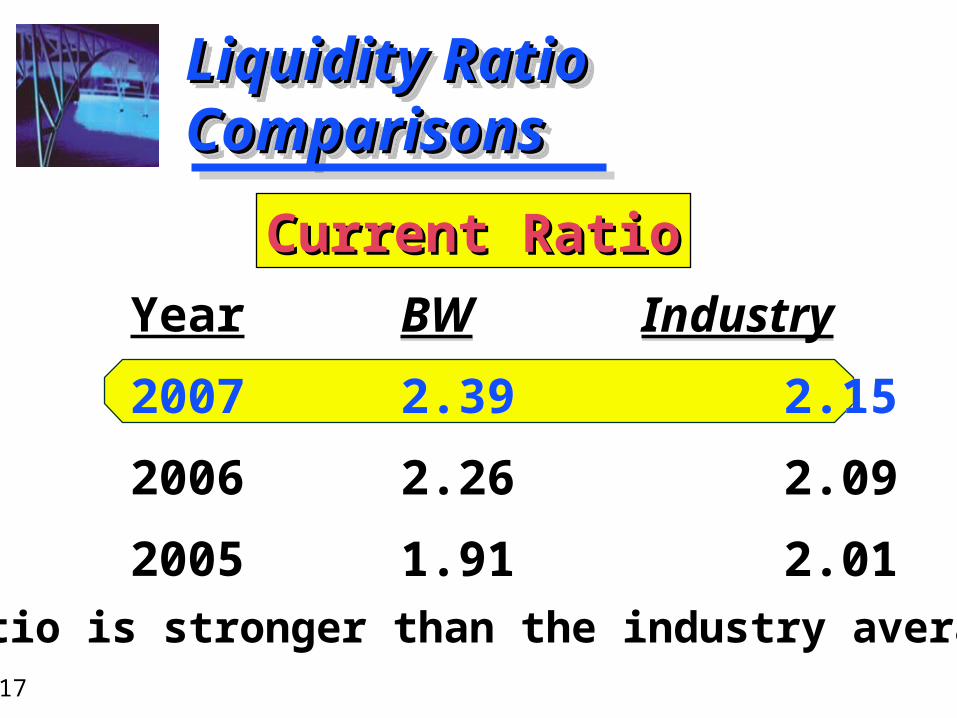
BW Industry
2.39 2.15
2.26 2.09
1.91 2.01
BW Industry
2.39 2.15
2.26 2.09
1.91 2.01
Year
2007
2006
2005
CurrentCurrent RatioRatio
Ratio is stronger than the industry average.
6-18
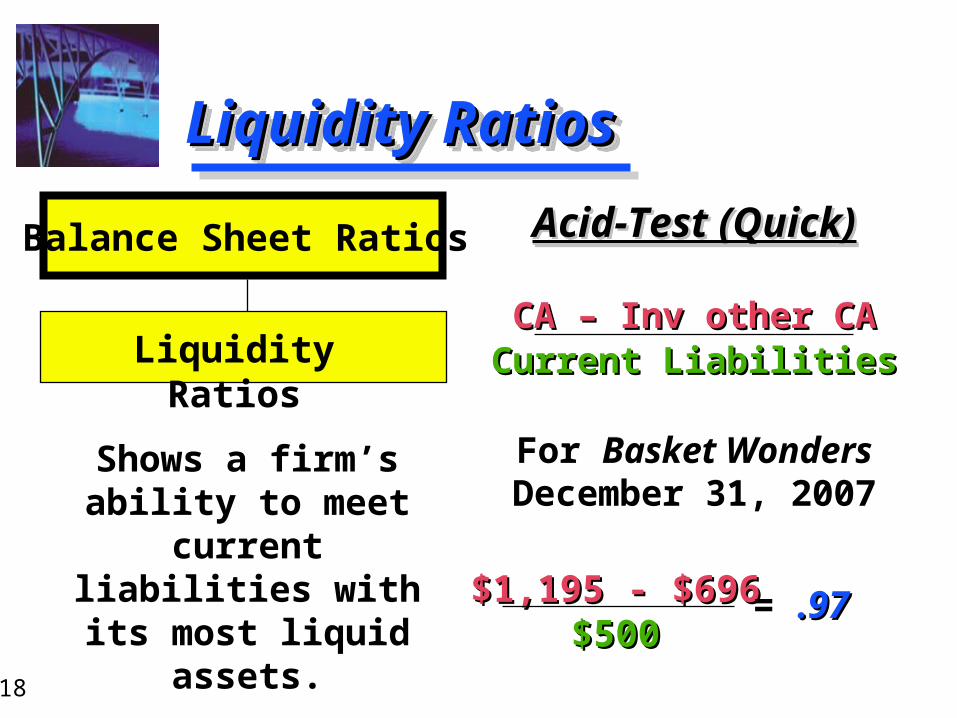
Liquidity RatiosLiquidity RatiosLiquidity RatiosLiquidity Ratios
Acid-Test (Quick)Acid-Test (Quick)
CA – Inv other CACA – Inv other CACurrent LiabilitiesCurrent Liabilities
For Basket Wonders December 31, 2007
Acid-Test (Quick)Acid-Test (Quick)
CA – Inv other CACA – Inv other CACurrent LiabilitiesCurrent Liabilities
For Basket Wonders December 31, 2007
Shows a firm’s ability to meet
current liabilities with its most liquid
assets.
Balance Sheet Ratios
Liquidity Ratios
$1,195 - $696$1,195 - $696$500$500
= .97.97
6-19
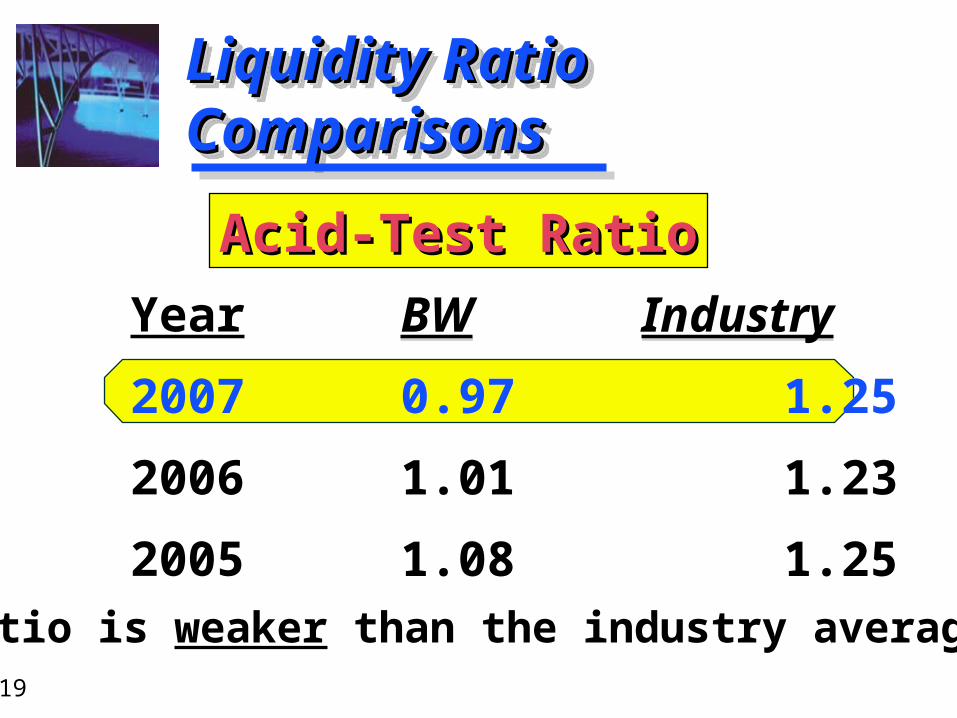
Liquidity Ratio Liquidity Ratio ComparisonsComparisonsLiquidity Ratio Liquidity Ratio ComparisonsComparisons
BW Industry
0.97 1.25
1.01 1.23
1.08 1.25
BW Industry
0.97 1.25
1.01 1.23
1.08 1.25
Year
2007
2006
2005
Acid-Test RatioAcid-Test Ratio
Ratio is weaker than the industry average.
6-20
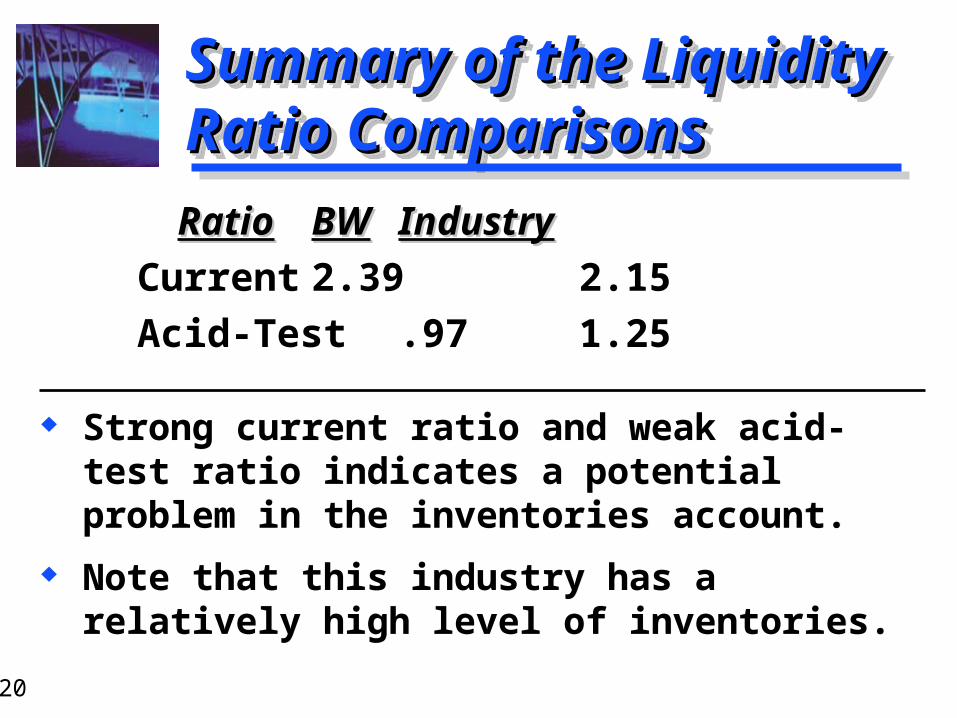
Summary of the Liquidity Summary of the Liquidity Ratio ComparisonsRatio ComparisonsSummary of the Liquidity Summary of the Liquidity Ratio ComparisonsRatio Comparisons
Strong current ratio and weak acid-test ratio indicates a potential problem in the inventories account.
Note that this industry has a relatively high level of inventories.
Strong current ratio and weak acid-test ratio indicates a potential problem in the inventories account.
Note that this industry has a relatively high level of inventories.
RatioRatio BWBW IndustryIndustry
Current 2.39 2.15
Acid-Test .97 1.25
6-21
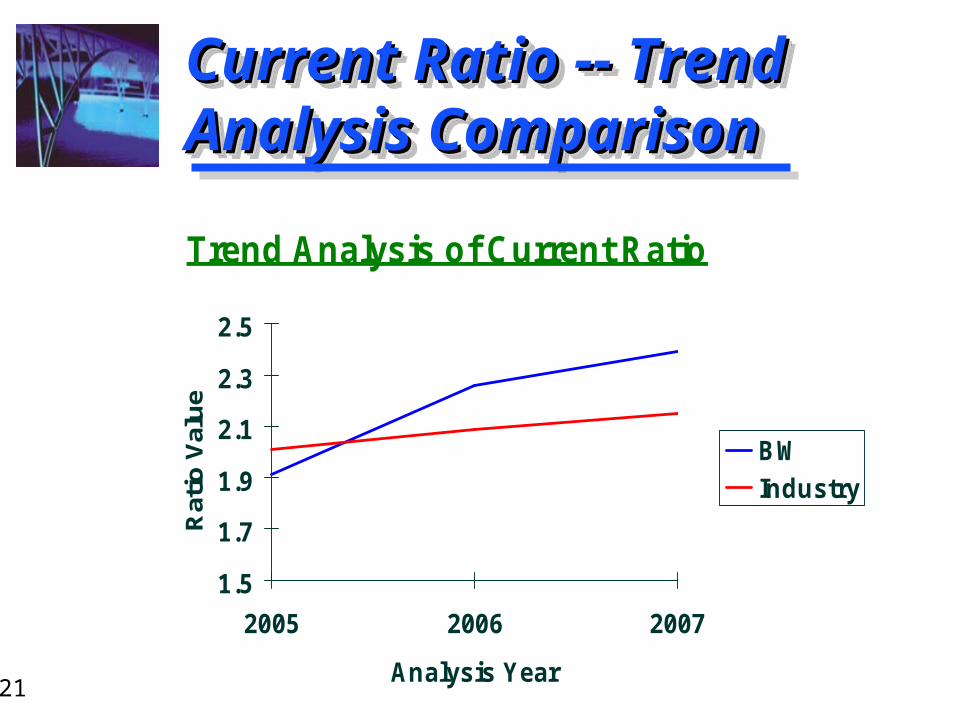
Current Ratio -- Trend Current Ratio -- Trend Analysis ComparisonAnalysis ComparisonCurrent Ratio -- Trend Current Ratio -- Trend Analysis ComparisonAnalysis Comparison
Trend Analysis of Current Ratio
1.5
1.7
1.9
2.1
2.3
2.5
2005 2006 2007
Analysis Year
Rat
io V
alu
e
BW
Industry
6-22
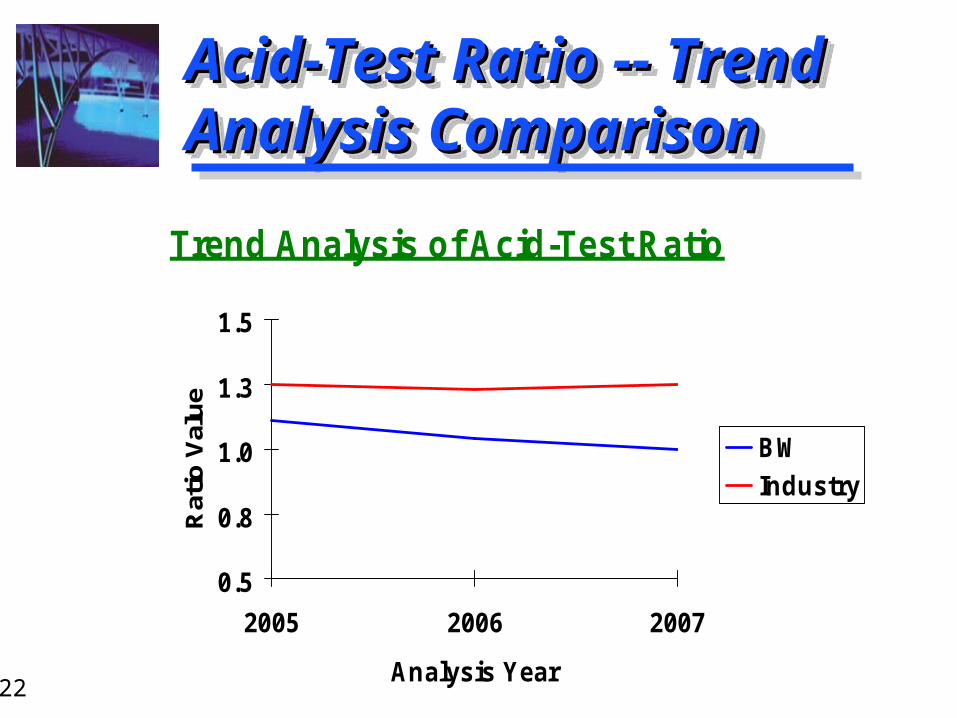
Acid-Test Ratio -- Trend Acid-Test Ratio -- Trend Analysis ComparisonAnalysis ComparisonAcid-Test Ratio -- Trend Acid-Test Ratio -- Trend Analysis ComparisonAnalysis Comparison
Trend Analysis of Acid-Test Ratio
0.5
0.8
1.0
1.3
1.5
2005 2006 2007
Analysis Year
Rat
io V
alu
e
BW
Industry
6-23
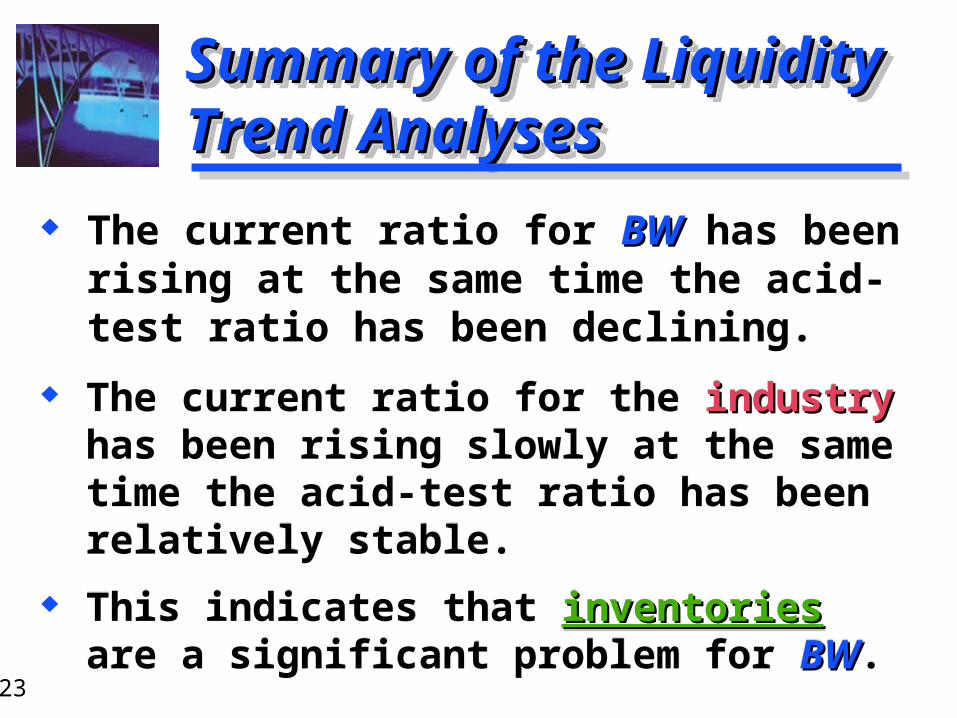
Summary of the Liquidity Summary of the Liquidity Trend AnalysesTrend AnalysesSummary of the Liquidity Summary of the Liquidity Trend AnalysesTrend Analyses
The current ratio for the industryindustry has been rising slowly at the same time the acid-test ratio has been relatively stable.
This indicates that inventoriesinventories are a significant problem for BWBW.
The current ratio for the industryindustry has been rising slowly at the same time the acid-test ratio has been relatively stable.
This indicates that inventoriesinventories are a significant problem for BWBW.
The current ratio for BWBW has been rising at the same time the acid-test ratio has been declining.
The current ratio for BWBW has been rising at the same time the acid-test ratio has been declining.
6-24
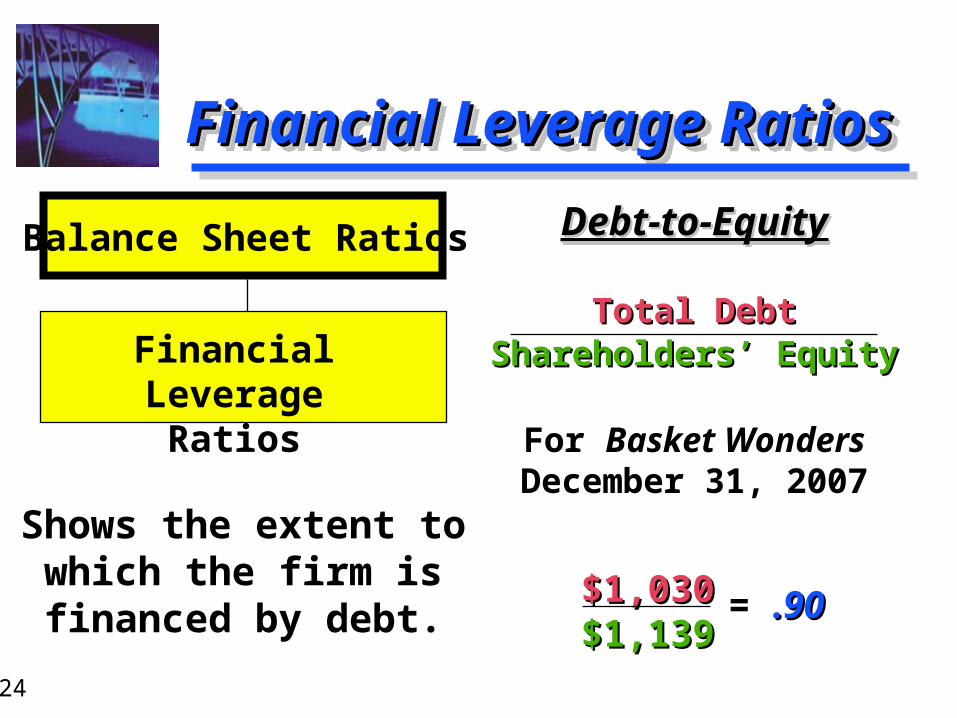
Financial Leverage RatiosFinancial Leverage RatiosFinancial Leverage RatiosFinancial Leverage Ratios
Debt-to-EquityDebt-to-Equity
Total DebtTotal DebtShareholders’ EquityShareholders’ Equity
For Basket Wonders December 31, 2007
Debt-to-EquityDebt-to-Equity
Total DebtTotal DebtShareholders’ EquityShareholders’ Equity
For Basket Wonders December 31, 2007Shows the extent to
which the firm is financed by debt.
Balance Sheet Ratios
Financial LeverageRatios
$1,030$1,030$1,139$1,139
= .90.90
6-25
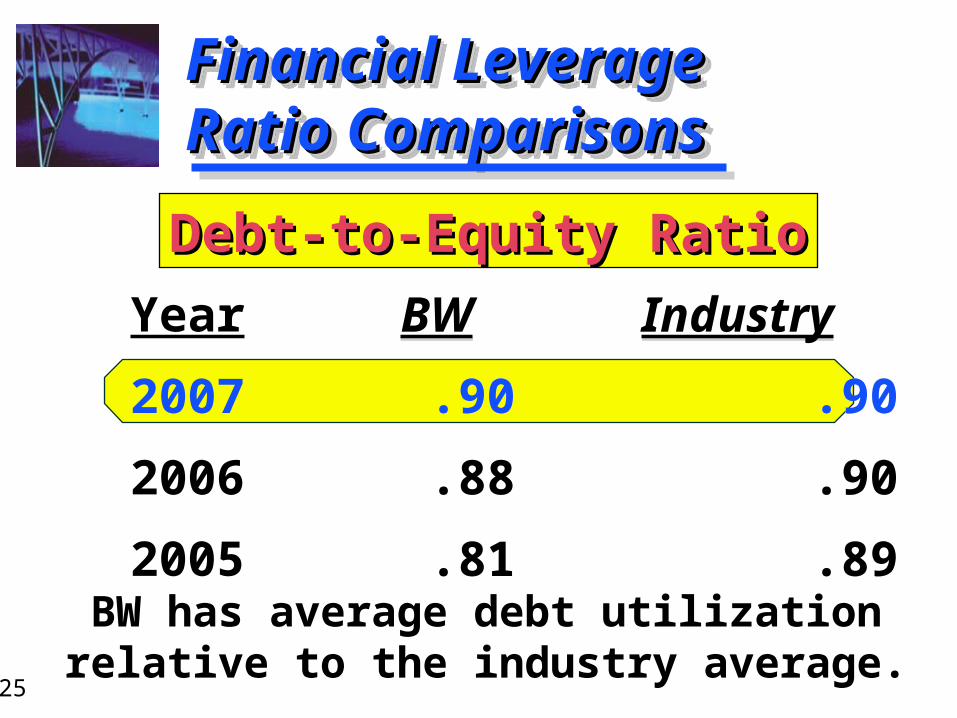
Financial Leverage Financial Leverage Ratio ComparisonsRatio ComparisonsFinancial Leverage Financial Leverage Ratio ComparisonsRatio Comparisons
BW Industry
.90 .90
.88 .90
.81 .89
BW Industry
.90 .90
.88 .90
.81 .89
Year
2007
2006
2005
Debt-to-Equity RatioDebt-to-Equity Ratio
BW has average debt utilizationrelative to the industry average.
6-26
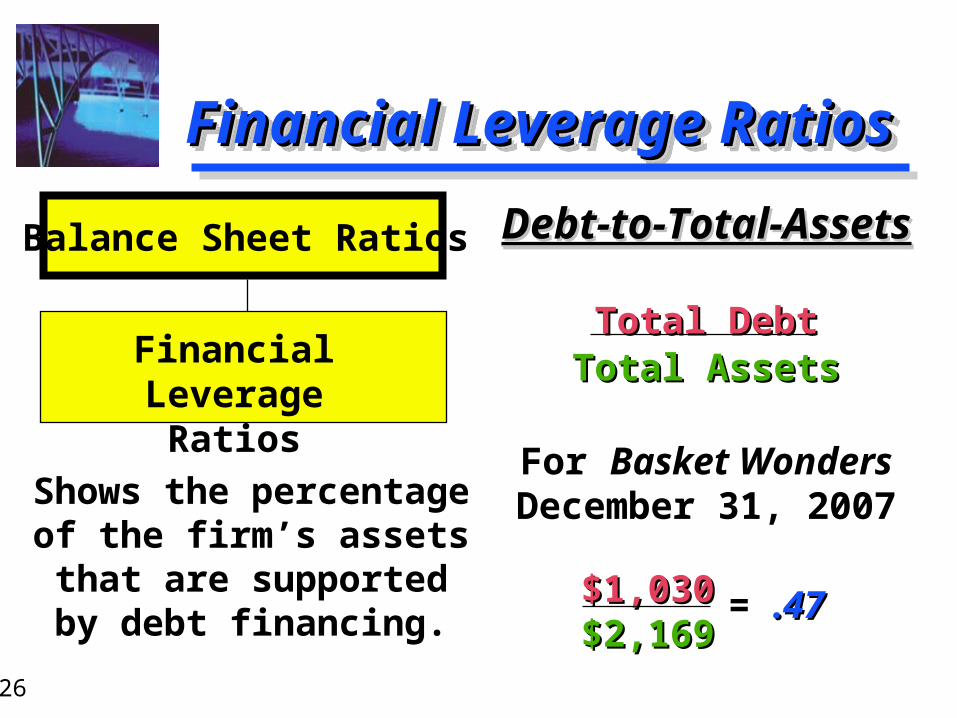
Financial Leverage RatiosFinancial Leverage RatiosFinancial Leverage RatiosFinancial Leverage Ratios
Debt-to-Total-AssetsDebt-to-Total-Assets
Total DebtTotal DebtTotal AssetsTotal Assets
For Basket Wonders December 31, 2007
Debt-to-Total-AssetsDebt-to-Total-Assets
Total DebtTotal DebtTotal AssetsTotal Assets
For Basket Wonders December 31, 2007Shows the percentage
of the firm’s assets that are supported by
debt financing.
Balance Sheet Ratios
Financial LeverageRatios
$1,030$1,030$2,169$2,169
= .47.47
6-27
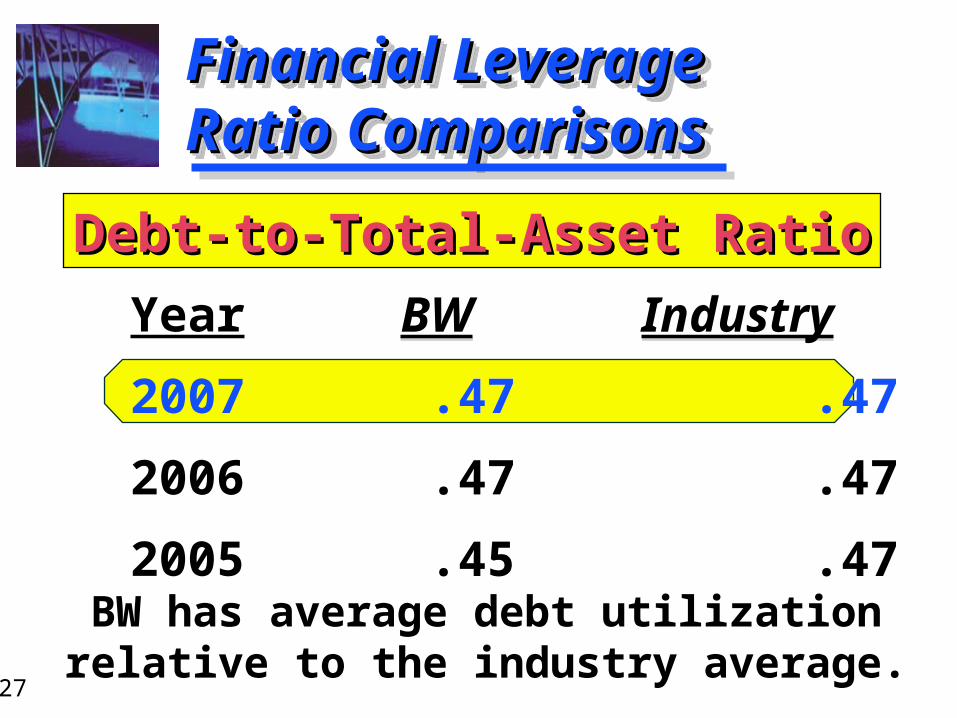
Financial Leverage Financial Leverage Ratio ComparisonsRatio ComparisonsFinancial Leverage Financial Leverage Ratio ComparisonsRatio Comparisons
BW Industry
.47 .47
.47 .47
.45 .47
BW Industry
.47 .47
.47 .47
.45 .47
Year
2007
2006
2005
Debt-to-Total-Asset RatioDebt-to-Total-Asset Ratio
BW has average debt utilizationrelative to the industry average.
6-28
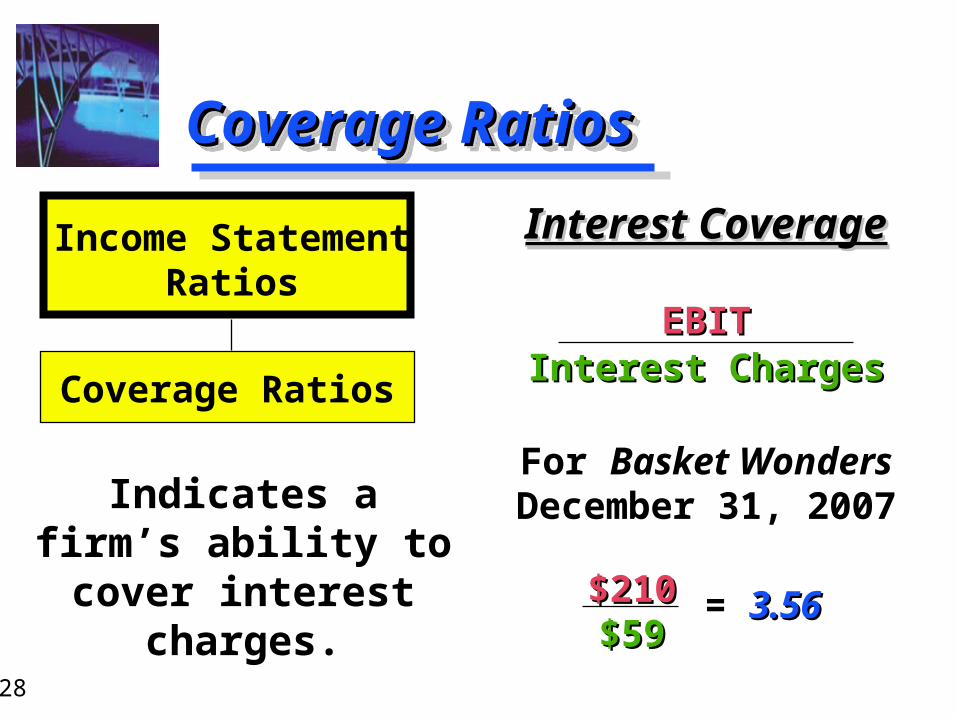
Coverage RatiosCoverage RatiosCoverage RatiosCoverage Ratios
Interest CoverageInterest Coverage
EBITEBITInterest ChargesInterest Charges
For Basket Wonders December 31, 2007
Interest CoverageInterest Coverage
EBITEBITInterest ChargesInterest Charges
For Basket Wonders December 31, 2007Indicates a firm’s
ability to cover interest charges.
Income StatementRatios
Coverage Ratios
$210$210$59$59
= 3.563.56
6-29
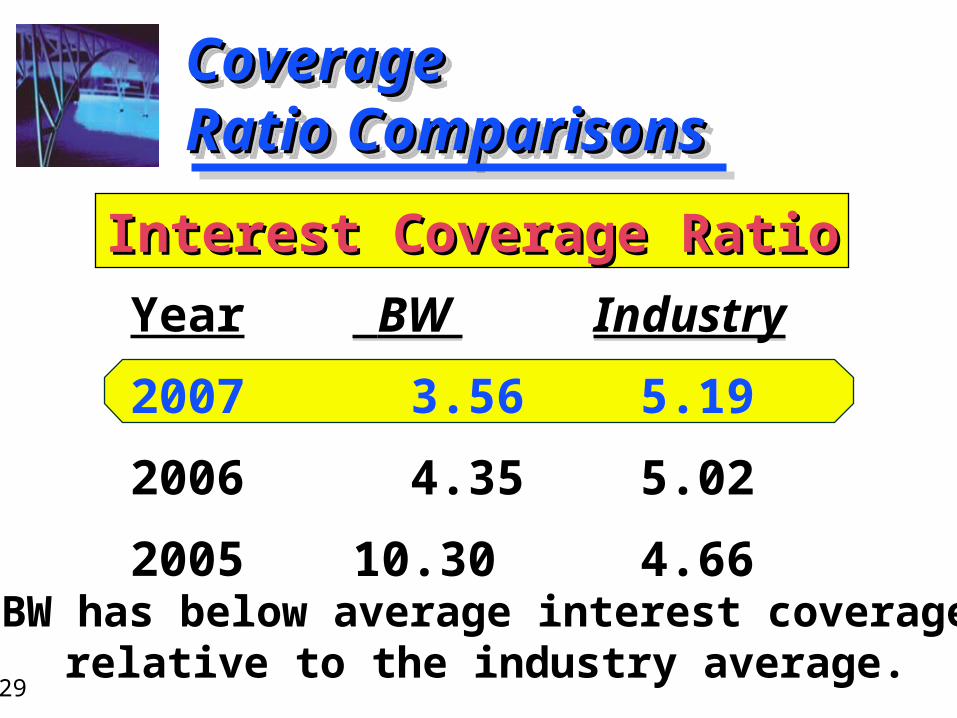
CoverageCoverageRatio ComparisonsRatio ComparisonsCoverageCoverageRatio ComparisonsRatio Comparisons
BW Industry
3.56 5.19
4.35 5.02
10.30 4.66
BW Industry
3.56 5.19
4.35 5.02
10.30 4.66
Year
2007
2006
2005
Interest Coverage RatioInterest Coverage Ratio
BW has below average interest coveragerelative to the industry average.
6-30
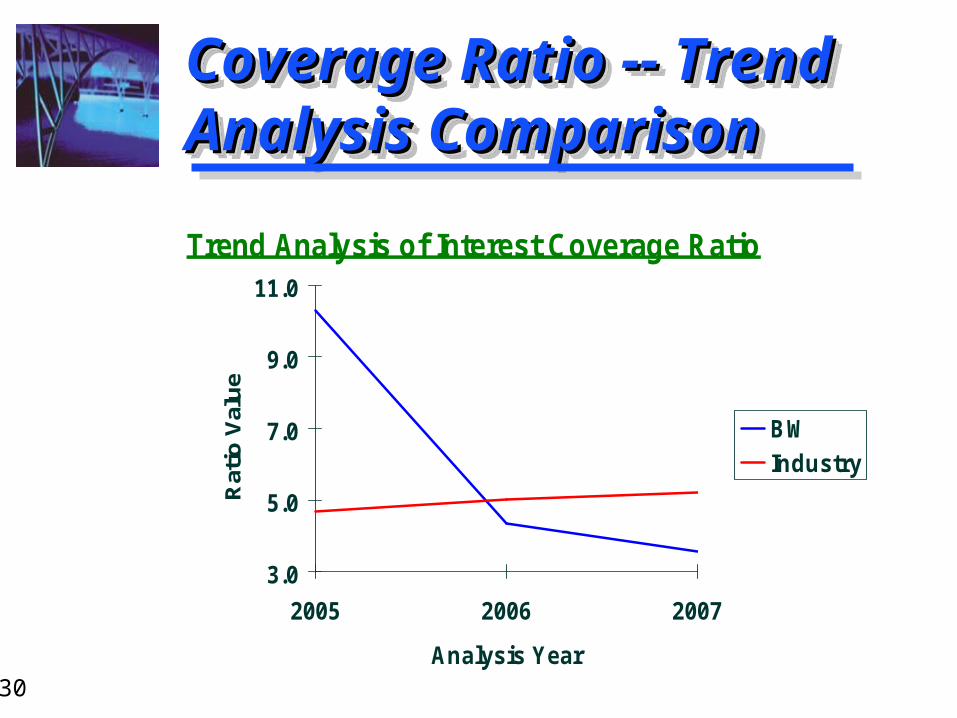
Coverage Ratio -- Trend Coverage Ratio -- Trend Analysis ComparisonAnalysis ComparisonCoverage Ratio -- Trend Coverage Ratio -- Trend Analysis ComparisonAnalysis Comparison
Trend Analysis of Interest Coverage Ratio
3.0
5.0
7.0
9.0
11.0
2005 2006 2007
Analysis Year
Rat
io V
alu
e
BW
Industry
6-31
Summary of the Coverage Summary of the Coverage Trend AnalysisTrend AnalysisSummary of the Coverage Summary of the Coverage Trend AnalysisTrend Analysis
This indicates that low earnings low earnings (EBIT) may be a potential problem for BWBW.
Note, we know that debt levels debt levels are in line with the industryindustry averages.
This indicates that low earnings low earnings (EBIT) may be a potential problem for BWBW.
Note, we know that debt levels debt levels are in line with the industryindustry averages.
The interest coverage ratio for BWBW has been falling since 2005. It has been below industryindustry averages for the past two years.
The interest coverage ratio for BWBW has been falling since 2005. It has been below industryindustry averages for the past two years.
6-32
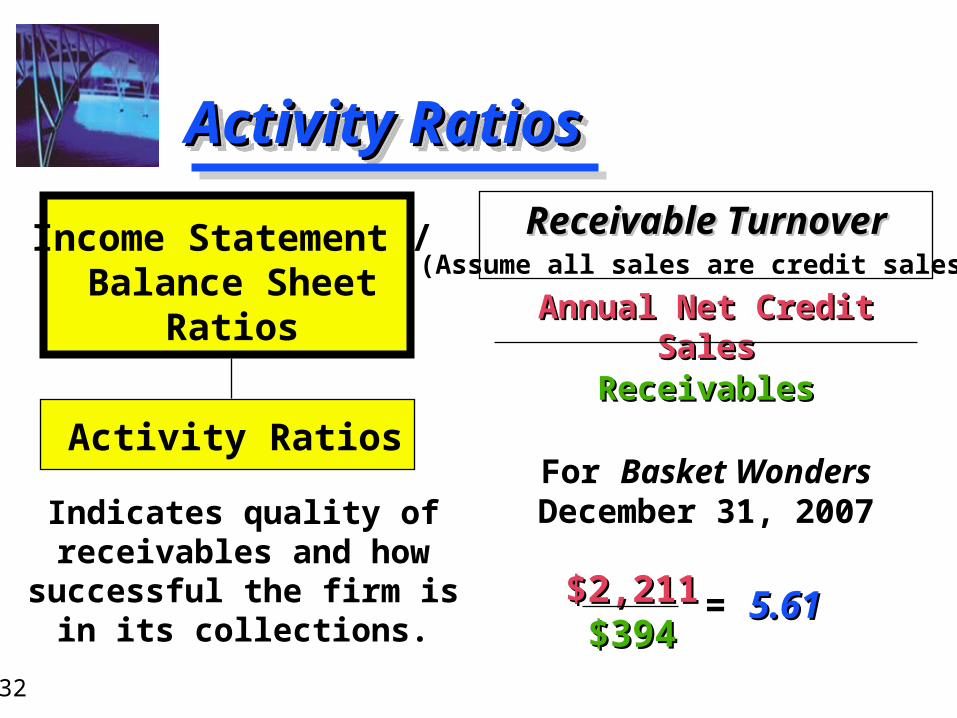
Activity RatiosActivity RatiosActivity RatiosActivity Ratios
Receivable TurnoverReceivable Turnover
Annual Net Credit SalesAnnual Net Credit SalesReceivablesReceivables
For Basket Wonders December 31, 2007
Receivable TurnoverReceivable Turnover
Annual Net Credit SalesAnnual Net Credit SalesReceivablesReceivables
For Basket Wonders December 31, 2007Indicates quality of
receivables and how successful the firm is in
its collections.
Income Statement /Balance Sheet
Ratios
Activity Ratios
$2,211$2,211$394$394
= 5.615.61
(Assume all sales are credit sales.)
6-33
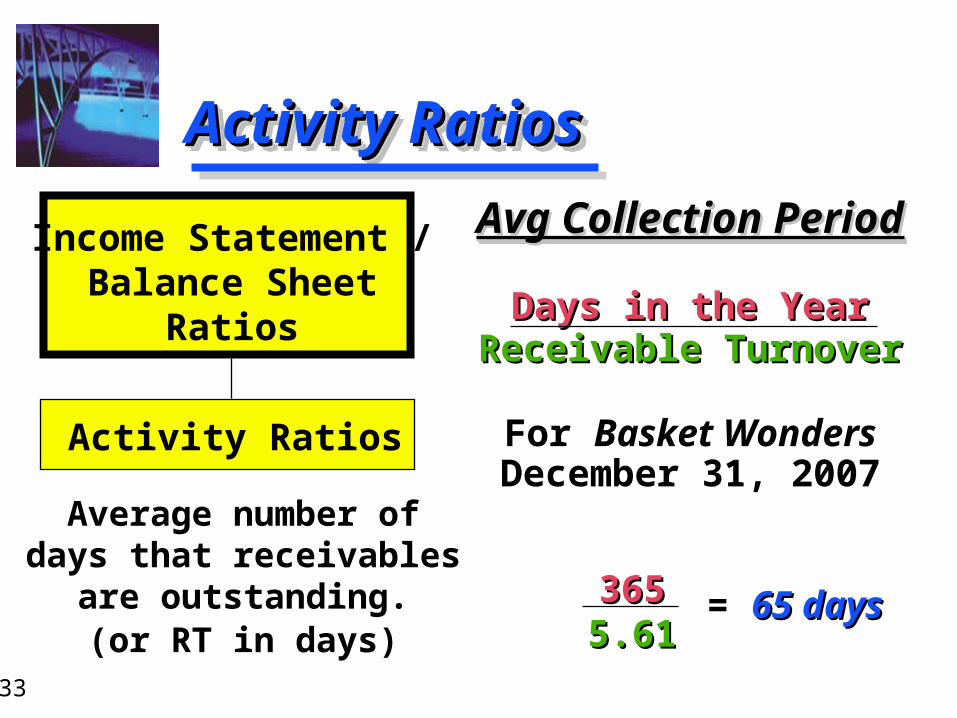
Activity RatiosActivity RatiosActivity RatiosActivity Ratios
Avg Collection PeriodAvg Collection Period
Days in the YearDays in the YearReceivable TurnoverReceivable Turnover
For Basket Wonders December 31, 2007
Avg Collection PeriodAvg Collection Period
Days in the YearDays in the YearReceivable TurnoverReceivable Turnover
For Basket Wonders December 31, 2007
Average number of days that receivables are
outstanding.(or RT in days)
Income Statement /Balance Sheet
Ratios
Activity Ratios
3653655.615.61
= 65 days65 days
6-34
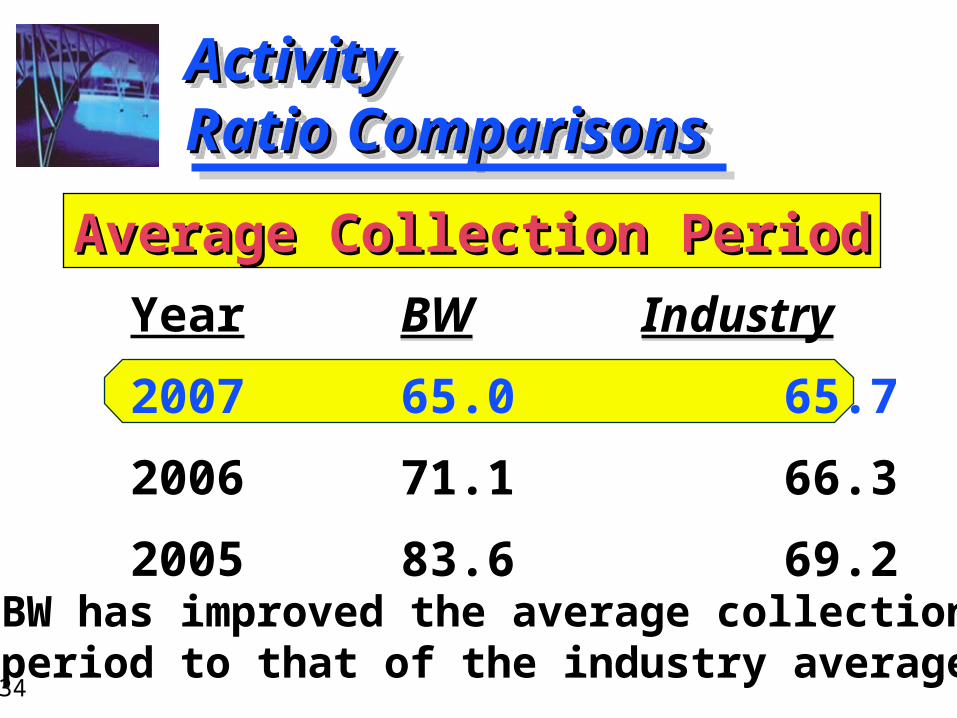
ActivityActivityRatio ComparisonsRatio ComparisonsActivityActivityRatio ComparisonsRatio Comparisons
BW Industry
65.0 65.7
71.1 66.3
83.6 69.2
BW Industry
65.0 65.7
71.1 66.3
83.6 69.2
Year
2007
2006
2005
Average Collection PeriodAverage Collection Period
BW has improved the average collection period to that of the industry average.
6-35
Activity RatiosActivity RatiosActivity RatiosActivity Ratios
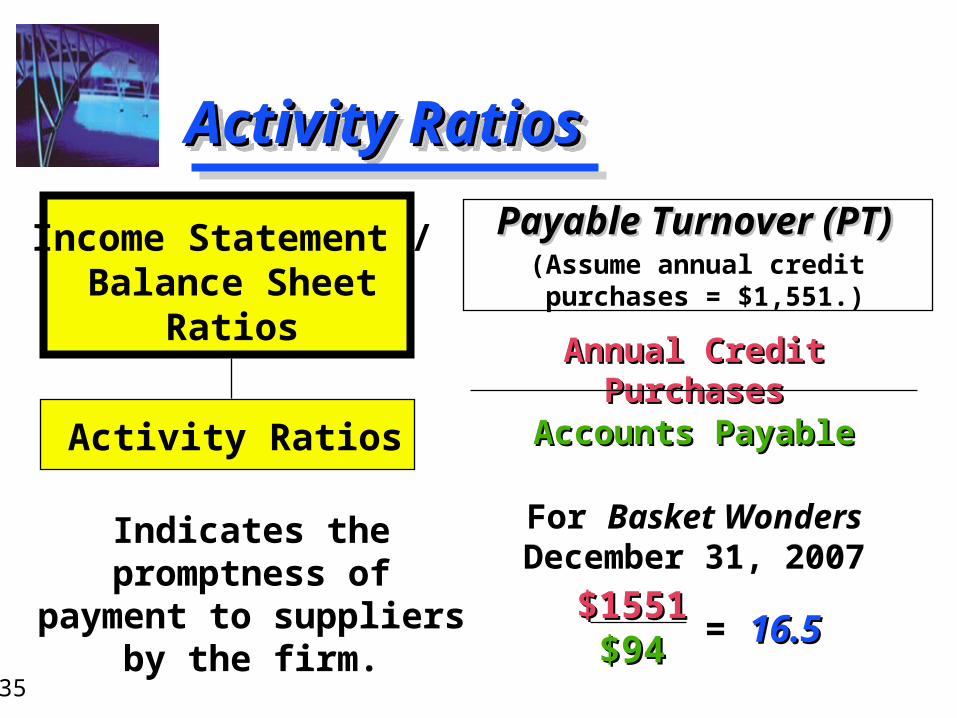
Payable Turnover (PT)Payable Turnover (PT)
Annual Credit PurchasesAnnual Credit PurchasesAccounts PayableAccounts Payable
For Basket Wonders December 31, 2007
Payable Turnover (PT)Payable Turnover (PT)
Annual Credit PurchasesAnnual Credit PurchasesAccounts PayableAccounts Payable
For Basket Wonders December 31, 2007
Indicates the promptness of payment to suppliers by the firm.
Income Statement /Balance Sheet
Ratios
Activity Ratios
$1551$1551$94$94 = 16.516.5
(Assume annual credit purchases = $1,551.)
6-36
Activity RatiosActivity RatiosActivity RatiosActivity Ratios
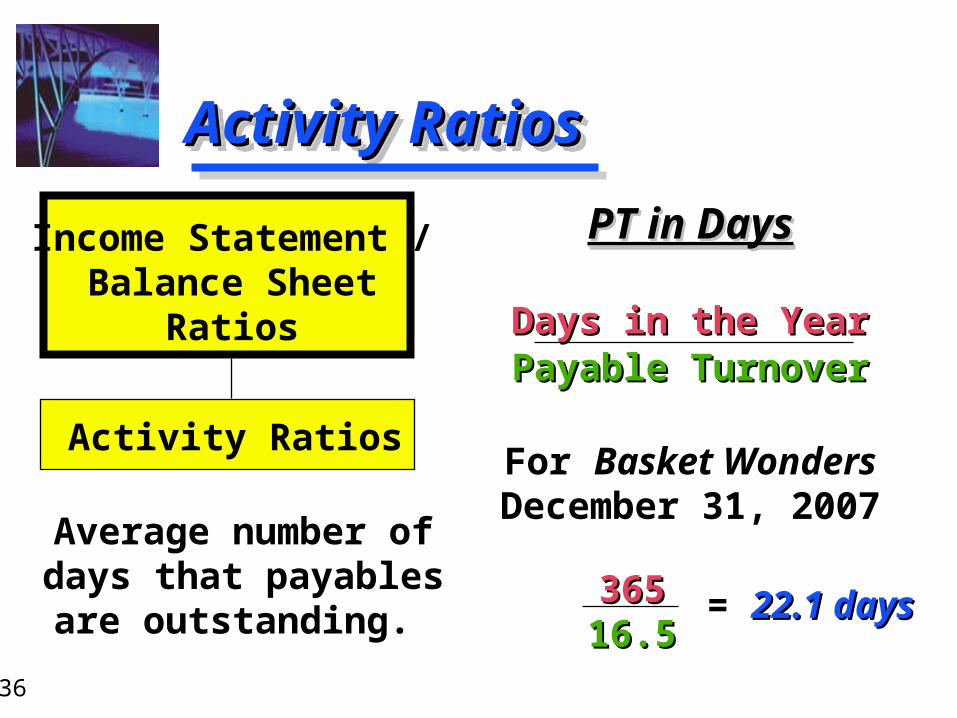
PT in DaysPT in Days
Days in the YearDays in the YearPayable TurnoverPayable Turnover
For Basket Wonders December 31, 2007
PT in DaysPT in Days
Days in the YearDays in the YearPayable TurnoverPayable Turnover
For Basket Wonders December 31, 2007
Average number of days that payables are
outstanding.
Income Statement /Balance Sheet
Ratios
Activity Ratios
36536516.516.5
= 22.1 days22.1 days
6-37
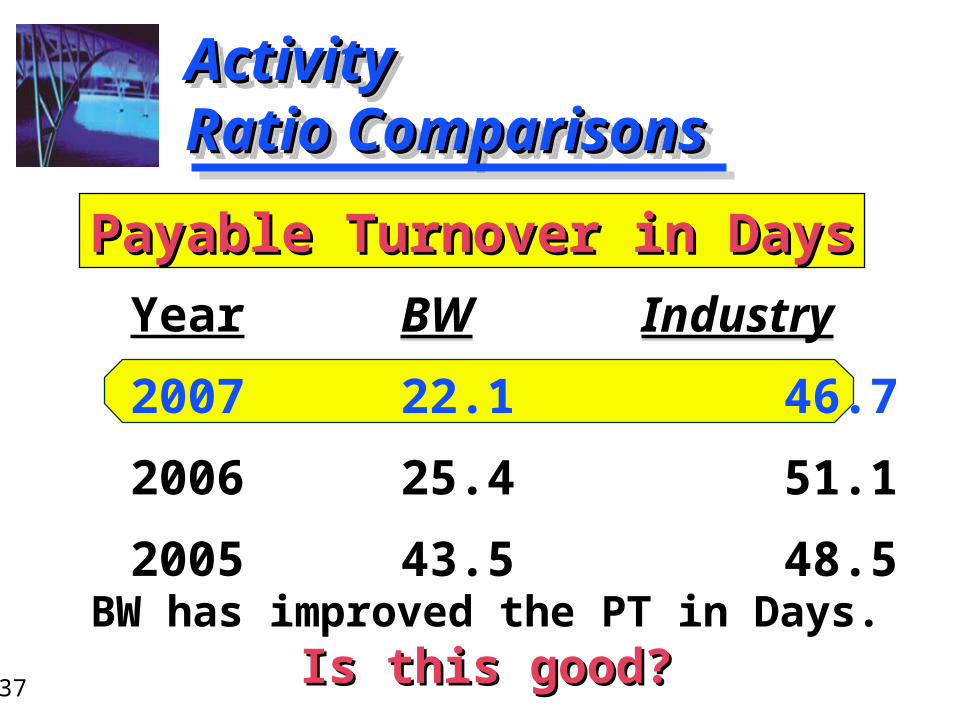
ActivityActivityRatio ComparisonsRatio ComparisonsActivityActivityRatio ComparisonsRatio Comparisons
BW Industry
22.1 46.7
25.4 51.1
43.5 48.5
BW Industry
22.1 46.7
25.4 51.1
43.5 48.5
Year
2007
2006
2005
Payable Turnover in DaysPayable Turnover in Days
BW has improved the PT in Days.Is this good?Is this good?
6-38
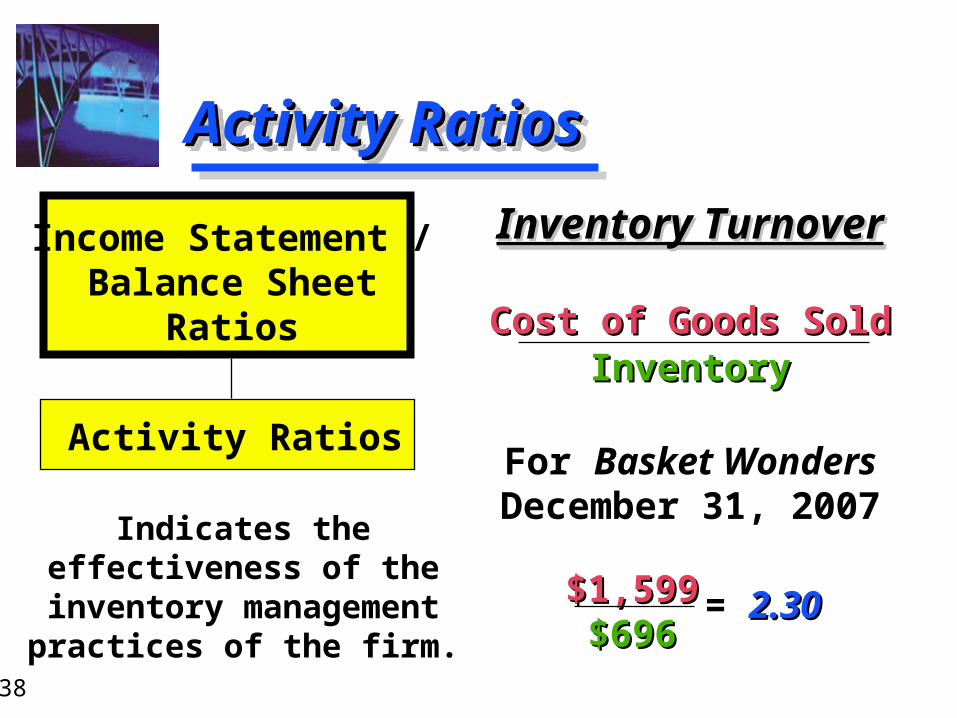
Activity RatiosActivity RatiosActivity RatiosActivity Ratios
Inventory TurnoverInventory Turnover
Cost of Goods SoldCost of Goods SoldInventoryInventory
For Basket Wonders December 31, 2007
Inventory TurnoverInventory Turnover
Cost of Goods SoldCost of Goods SoldInventoryInventory
For Basket Wonders December 31, 2007
Indicates the effectiveness of the
inventory management practices of the firm.
Income Statement /Balance Sheet
Ratios
Activity Ratios
$1,599$1,599$696$696
= 2.302.30
6-39
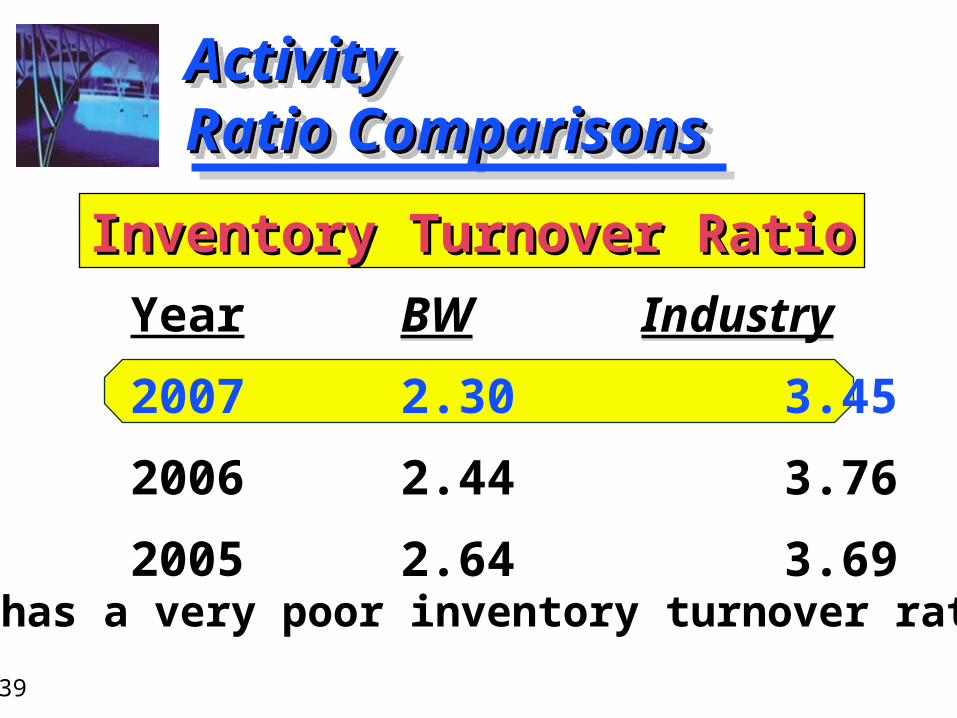
ActivityActivityRatio ComparisonsRatio ComparisonsActivityActivityRatio ComparisonsRatio Comparisons
BW Industry
2.30 3.45
2.44 3.76
2.64 3.69
BW Industry
2.30 3.45
2.44 3.76
2.64 3.69
Year
2007
2006
2005
Inventory Turnover RatioInventory Turnover Ratio
BW has a very poor inventory turnover ratio.
6-40
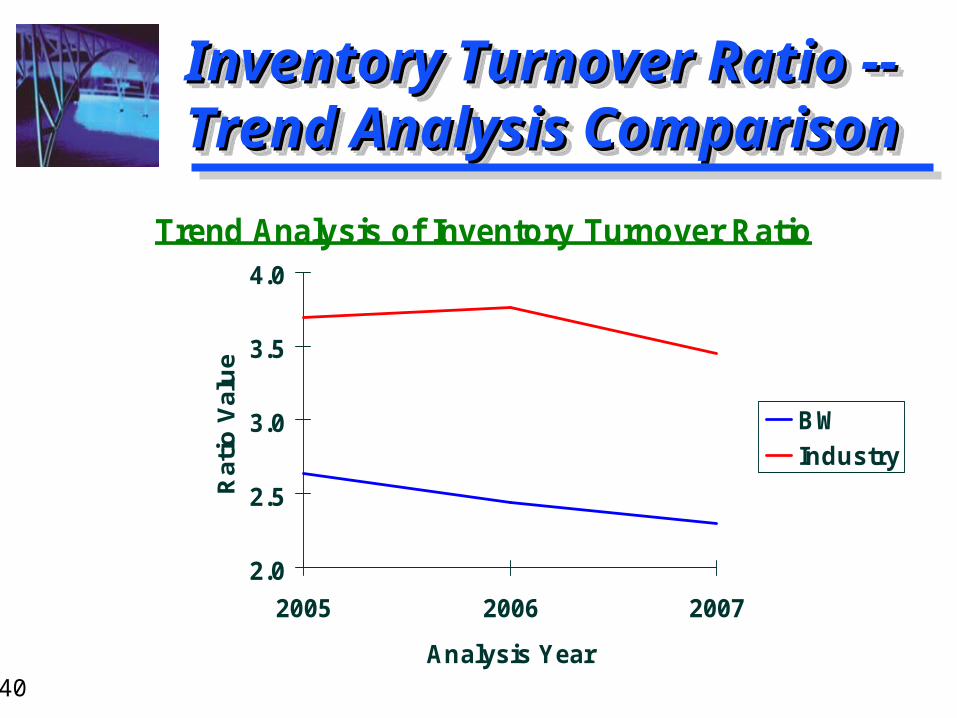
Inventory Turnover Ratio --Inventory Turnover Ratio --Trend Analysis ComparisonTrend Analysis ComparisonInventory Turnover Ratio --Inventory Turnover Ratio --Trend Analysis ComparisonTrend Analysis Comparison
Trend Analysis of Inventory Turnover Ratio
2.0
2.5
3.0
3.5
4.0
2005 2006 2007
Analysis Year
Rat
io V
alu
e
BW
Industry
6-41
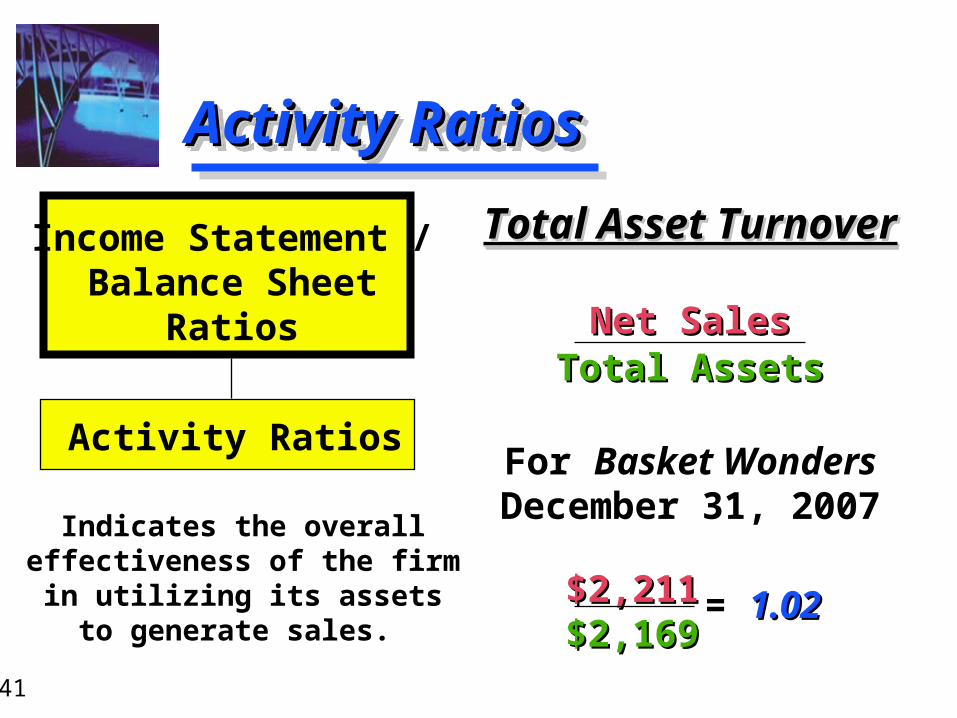
Activity RatiosActivity RatiosActivity RatiosActivity Ratios
Total Asset TurnoverTotal Asset Turnover
Net SalesNet SalesTotal AssetsTotal Assets
For Basket Wonders December 31, 2007
Total Asset TurnoverTotal Asset Turnover
Net SalesNet SalesTotal AssetsTotal Assets
For Basket Wonders December 31, 2007
Indicates the overall effectiveness of the firm in utilizing its assets to
generate sales.
Income Statement /Balance Sheet
Ratios
Activity Ratios
$2,211$2,211$2,169$2,169
= 1.021.02
6-42
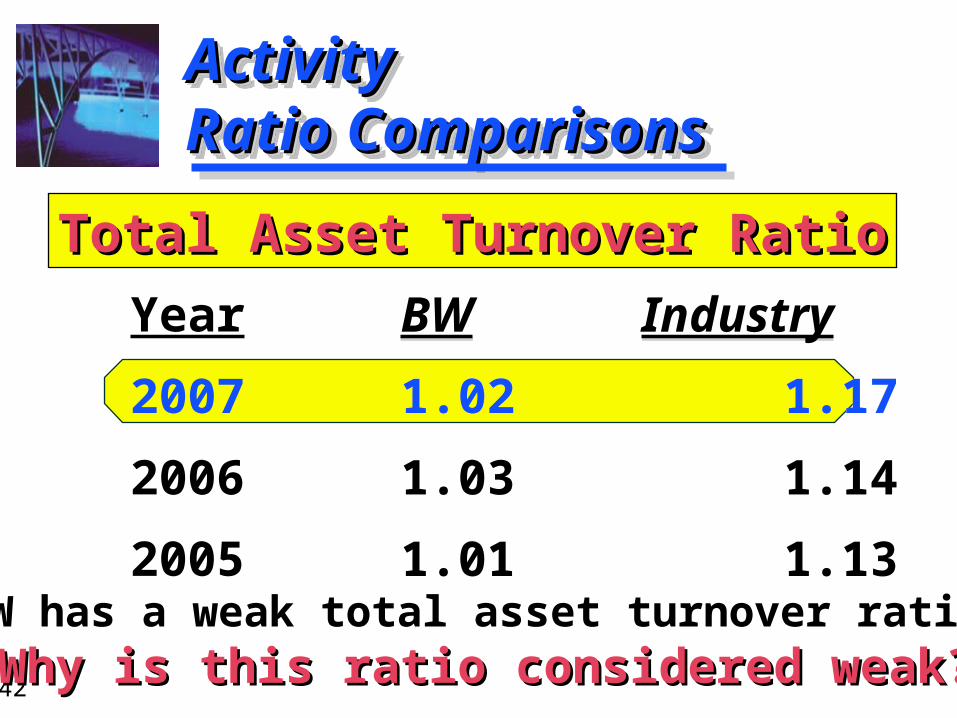
ActivityActivityRatio ComparisonsRatio ComparisonsActivityActivityRatio ComparisonsRatio Comparisons
BW Industry
1.02 1.17
1.03 1.14
1.01 1.13
BW Industry
1.02 1.17
1.03 1.14
1.01 1.13
Year
2007
2006
2005
Total Asset Turnover RatioTotal Asset Turnover Ratio
BW has a weak total asset turnover ratio.Why is this ratio considered weak?Why is this ratio considered weak?
6-43
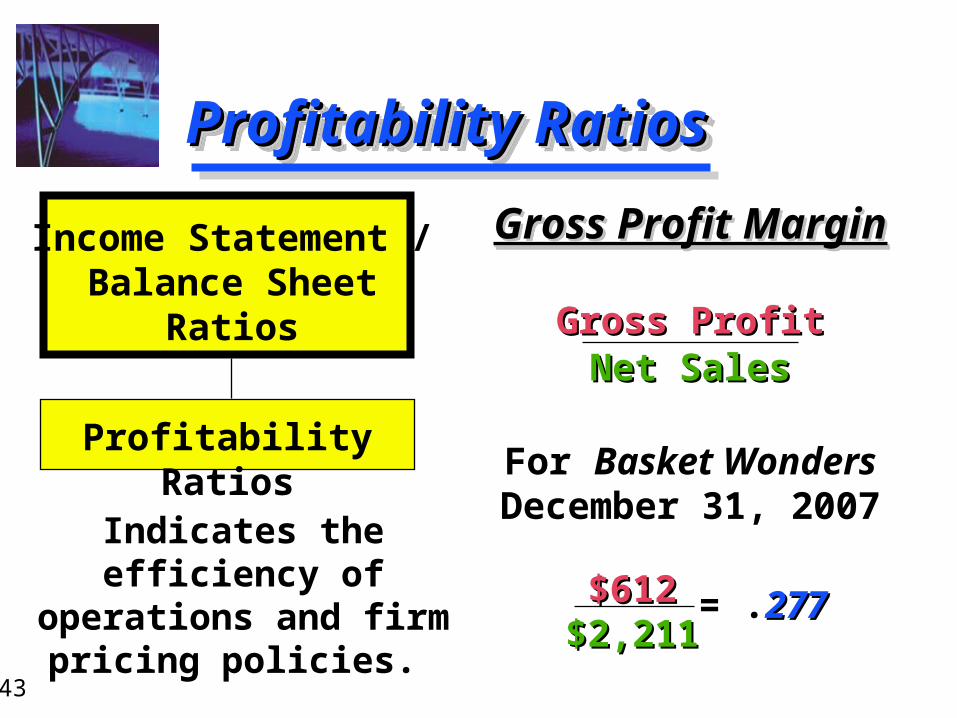
Profitability RatiosProfitability RatiosProfitability RatiosProfitability Ratios
Gross Profit MarginGross Profit Margin
Gross ProfitGross ProfitNet SalesNet Sales
For Basket Wonders December 31, 2007
Gross Profit MarginGross Profit Margin
Gross ProfitGross ProfitNet SalesNet Sales
For Basket Wonders December 31, 2007
Indicates the efficiency of operations and firm
pricing policies.
Income Statement /Balance Sheet
Ratios
Profitability Ratios
$612$612$2,211$2,211
= .277277
6-44
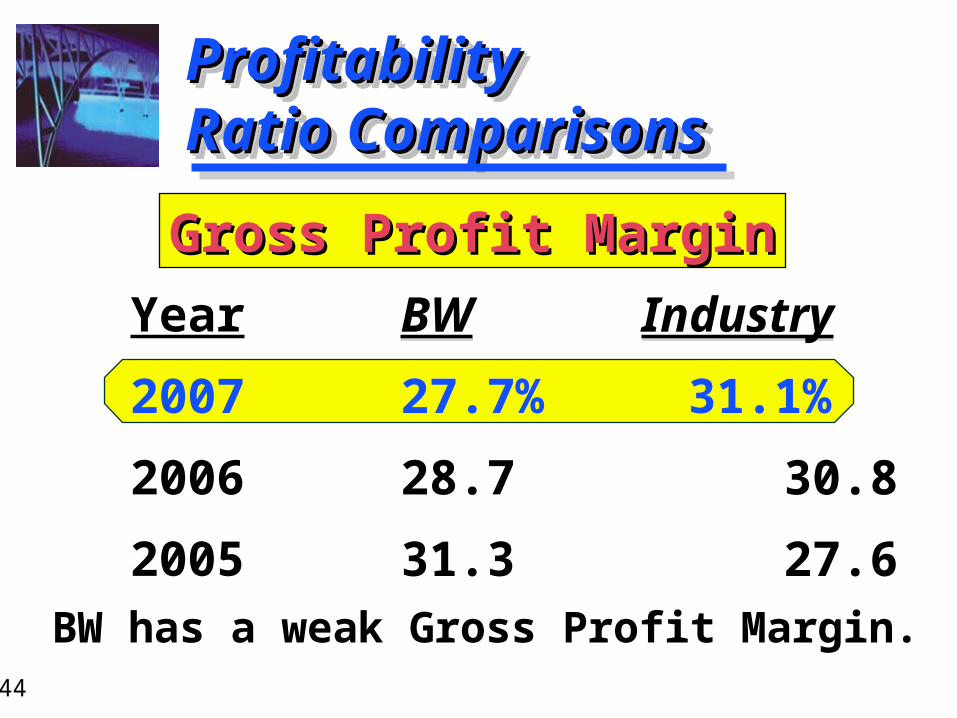
ProfitabilityProfitabilityRatio ComparisonsRatio ComparisonsProfitabilityProfitabilityRatio ComparisonsRatio Comparisons
BW Industry
27.7% 31.1%
28.7 30.8
31.3 27.6
BW Industry
27.7% 31.1%
28.7 30.8
31.3 27.6
Year
2007
2006
2005
Gross Profit MarginGross Profit Margin
BW has a weak Gross Profit Margin.
6-45
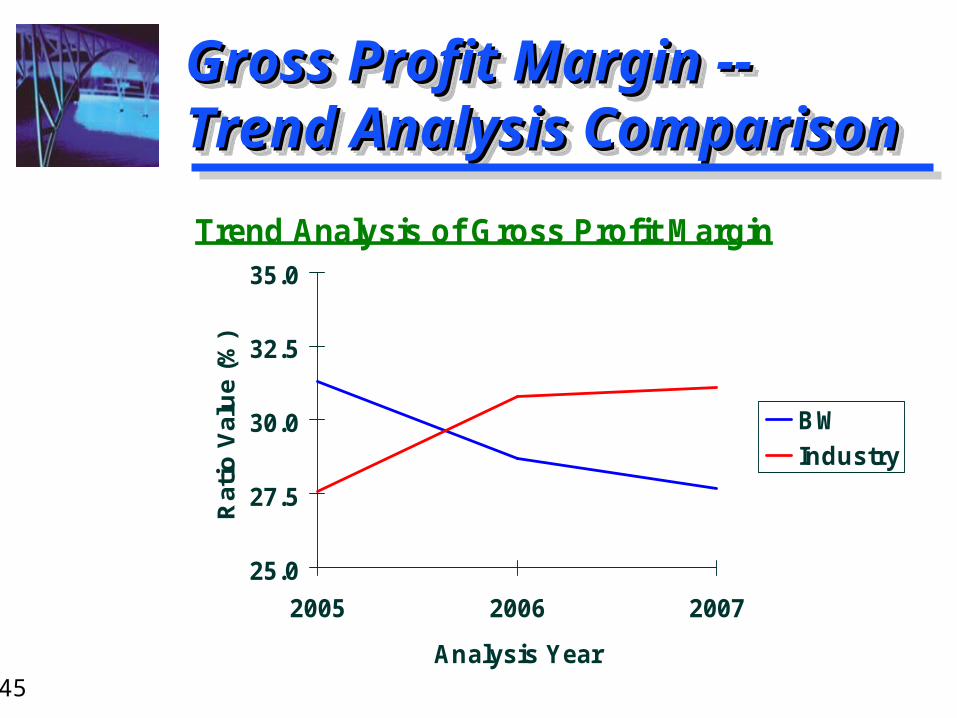
Gross Profit Margin --Gross Profit Margin --Trend Analysis ComparisonTrend Analysis ComparisonGross Profit Margin --Gross Profit Margin --Trend Analysis ComparisonTrend Analysis Comparison
Trend Analysis of Gross Profit Margin
25.0
27.5
30.0
32.5
35.0
2005 2006 2007
Analysis Year
Rat
io V
alu
e (%
)
BW
Industry
6-46
Profitability RatiosProfitability RatiosProfitability RatiosProfitability Ratios
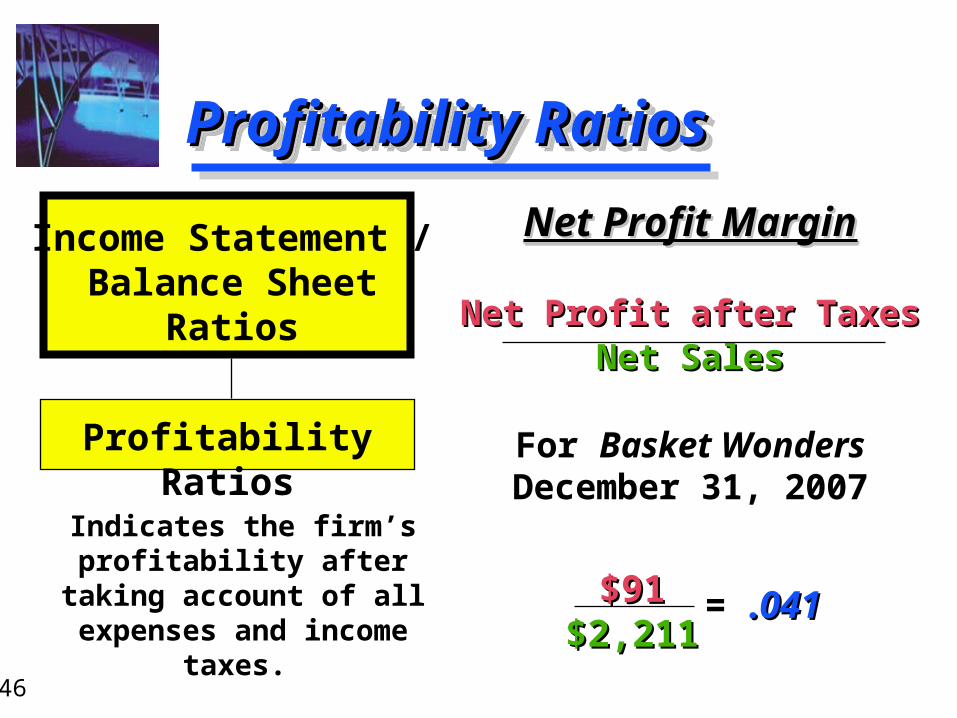
Net Profit MarginNet Profit Margin
Net Profit after TaxesNet Profit after TaxesNet SalesNet Sales
For Basket Wonders December 31, 2007
Net Profit MarginNet Profit Margin
Net Profit after TaxesNet Profit after TaxesNet SalesNet Sales
For Basket Wonders December 31, 2007
Indicates the firm’s profitability after taking account of all expenses
and income taxes.
Income Statement /Balance Sheet
Ratios
Profitability Ratios
$91$91$2,211$2,211
= .041.041
6-47
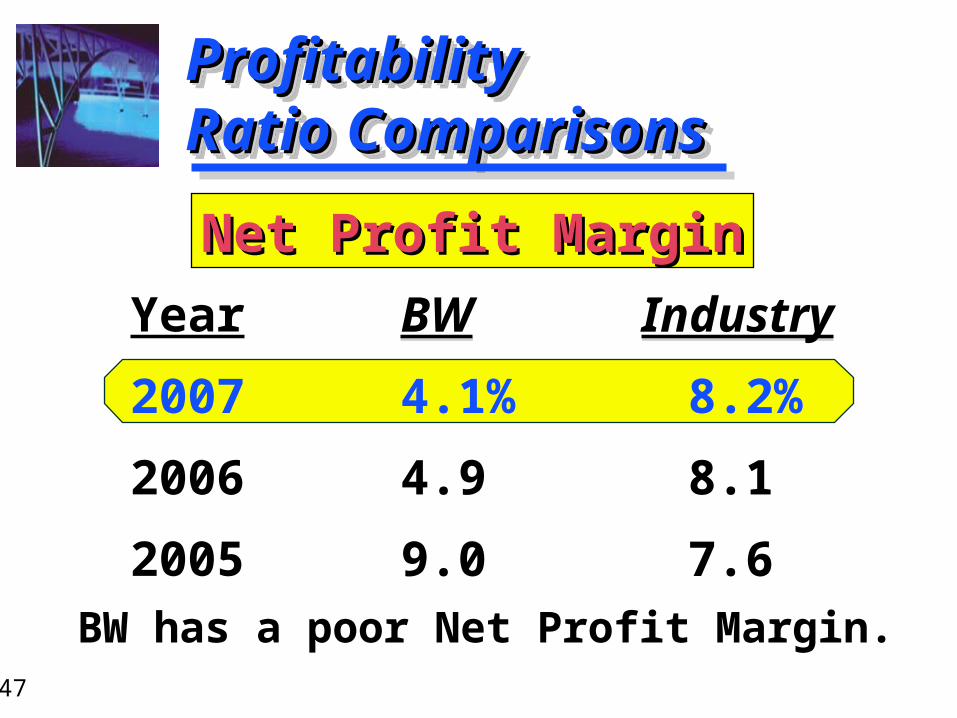
ProfitabilityProfitability Ratio ComparisonsRatio ComparisonsProfitabilityProfitability Ratio ComparisonsRatio Comparisons
BW Industry
4.1% 8.2%
4.9 8.1
9.0 7.6
BW Industry
4.1% 8.2%
4.9 8.1
9.0 7.6
Year
2007
2006
2005
Net Profit MarginNet Profit Margin
BW has a poor Net Profit Margin.
6-48
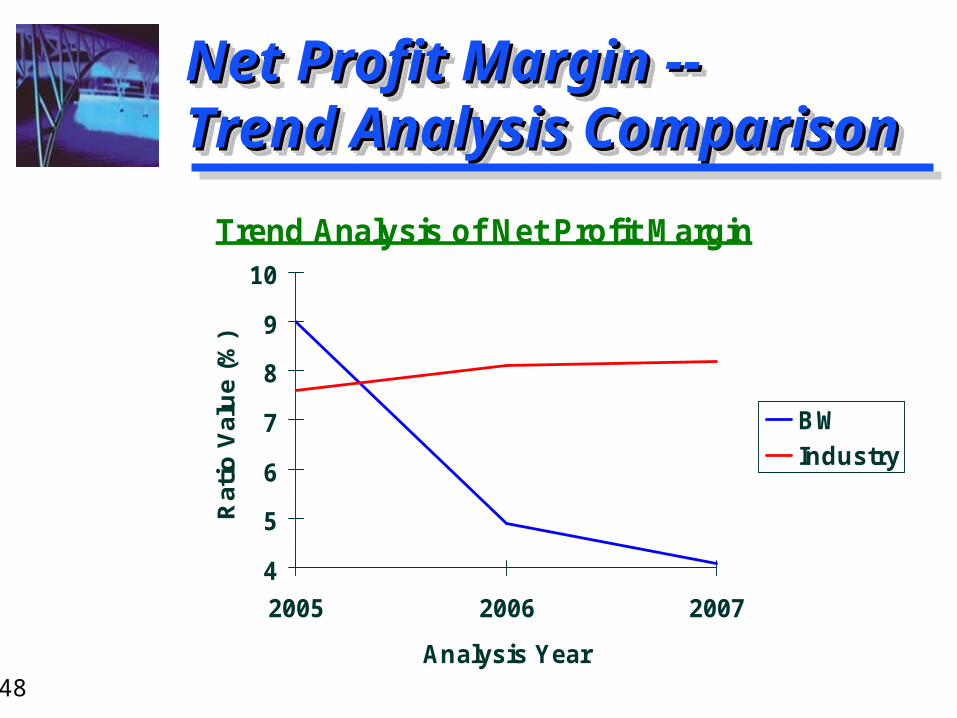
Net Profit Margin --Net Profit Margin --Trend Analysis ComparisonTrend Analysis ComparisonNet Profit Margin --Net Profit Margin --Trend Analysis ComparisonTrend Analysis Comparison
Trend Analysis of Net Profit Margin
4
5
6
7
8
9
10
2005 2006 2007
Analysis Year
Rat
io V
alu
e (%
)
BW
Industry
6-49
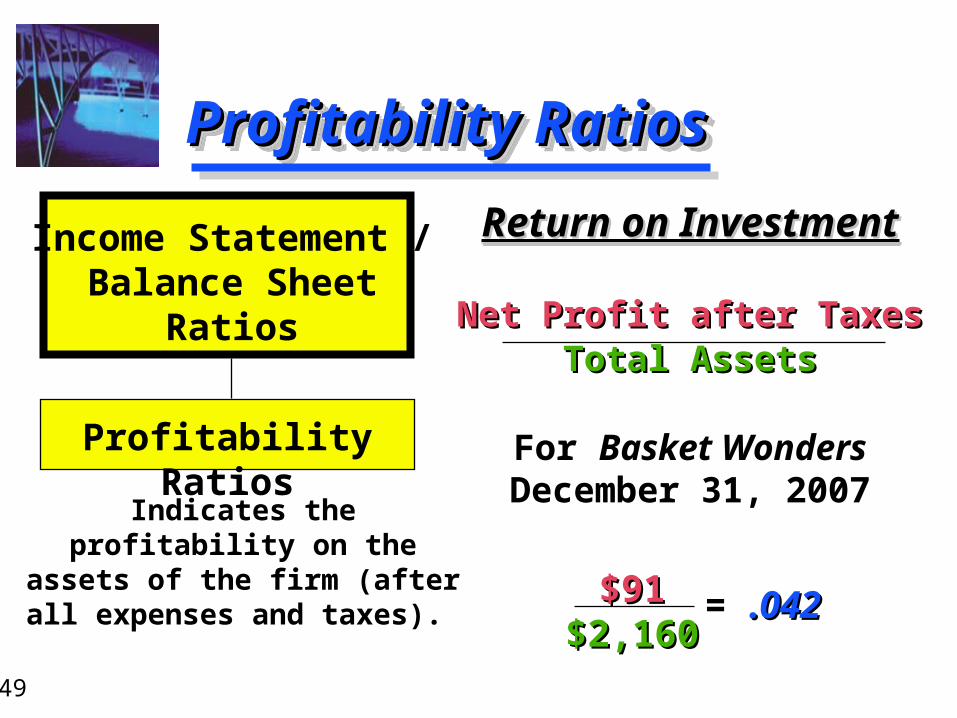
Profitability RatiosProfitability RatiosProfitability RatiosProfitability Ratios
Return on InvestmentReturn on Investment
Net Profit after TaxesNet Profit after TaxesTotal AssetsTotal Assets
For Basket Wonders December 31, 2007
Return on InvestmentReturn on Investment
Net Profit after TaxesNet Profit after TaxesTotal AssetsTotal Assets
For Basket Wonders December 31, 2007Indicates the
profitability on the assets of the firm (after all expenses and taxes).
Income Statement /Balance Sheet
Ratios
Profitability Ratios
$91$91$2,160$2,160
= .042.042
6-50
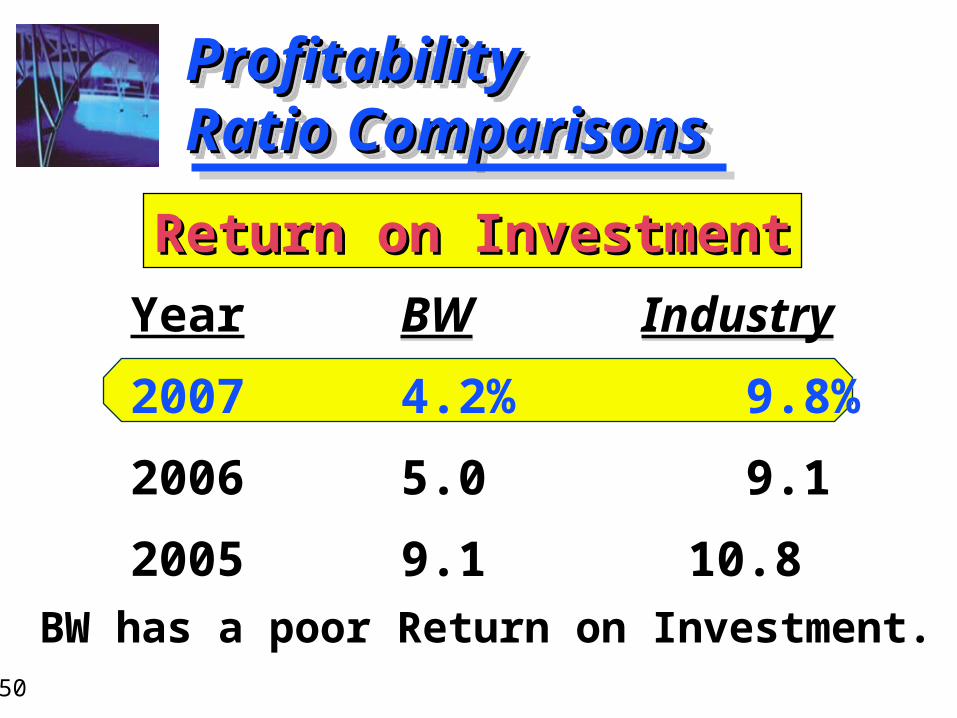
ProfitabilityProfitability Ratio ComparisonsRatio ComparisonsProfitabilityProfitability Ratio ComparisonsRatio Comparisons
BW Industry
4.2% 9.8%
5.0 9.1
9.1 10.8
BW Industry
4.2% 9.8%
5.0 9.1
9.1 10.8
Year
2007
2006
2005
Return on InvestmentReturn on Investment
BW has a poor Return on Investment.
6-51
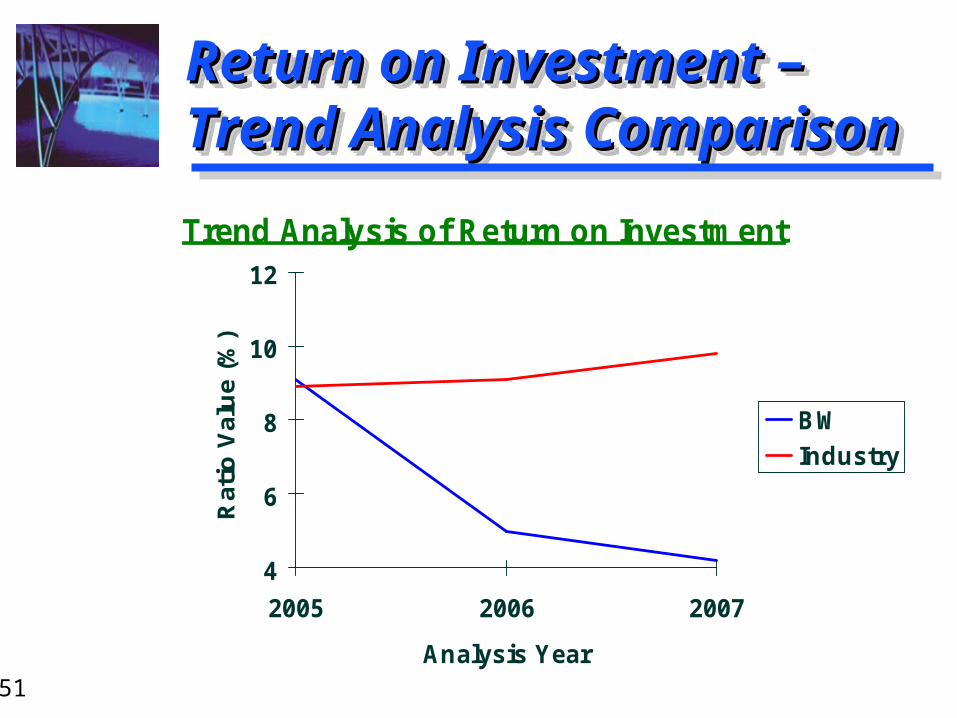
Return on Investment –Return on Investment –Trend Analysis ComparisonTrend Analysis ComparisonReturn on Investment –Return on Investment –Trend Analysis ComparisonTrend Analysis Comparison
Trend Analysis of Return on Investment
4
6
8
10
12
2005 2006 2007
Analysis Year
Rat
io V
alu
e (%
)
BW
Industry
6-52
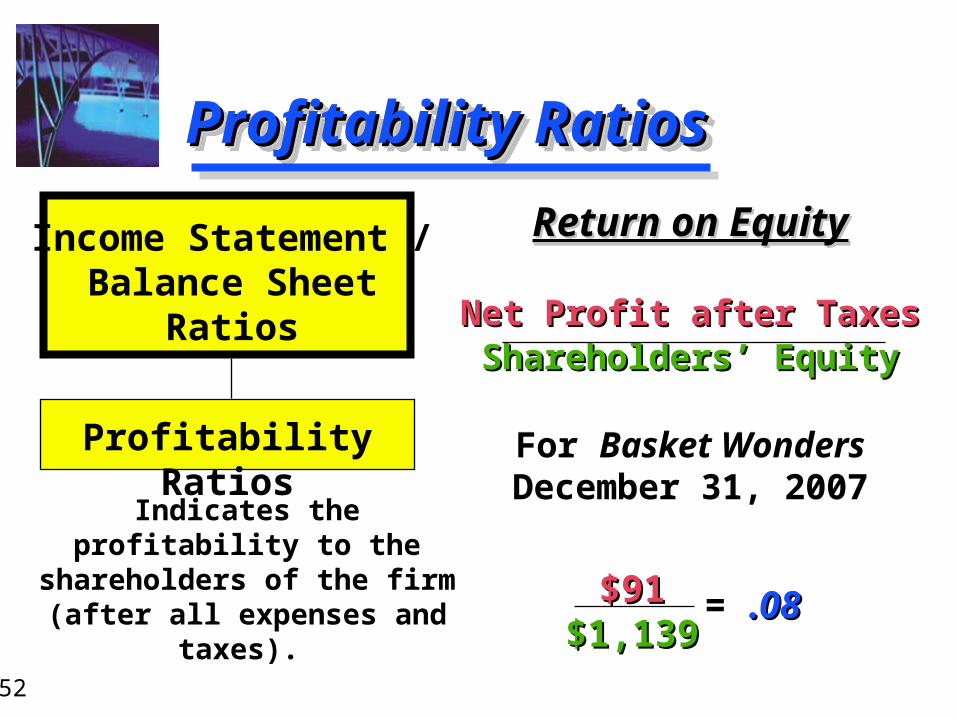
Profitability RatiosProfitability RatiosProfitability RatiosProfitability Ratios
Return on EquityReturn on Equity
Net Profit after TaxesNet Profit after TaxesShareholders’ EquityShareholders’ Equity
For Basket Wonders December 31, 2007
Return on EquityReturn on Equity
Net Profit after TaxesNet Profit after TaxesShareholders’ EquityShareholders’ Equity
For Basket Wonders December 31, 2007Indicates the profitability
to the shareholders of the firm (after all
expenses and taxes).
Income Statement /Balance Sheet
Ratios
Profitability Ratios
$91$91$1,139$1,139
= .08.08
6-53
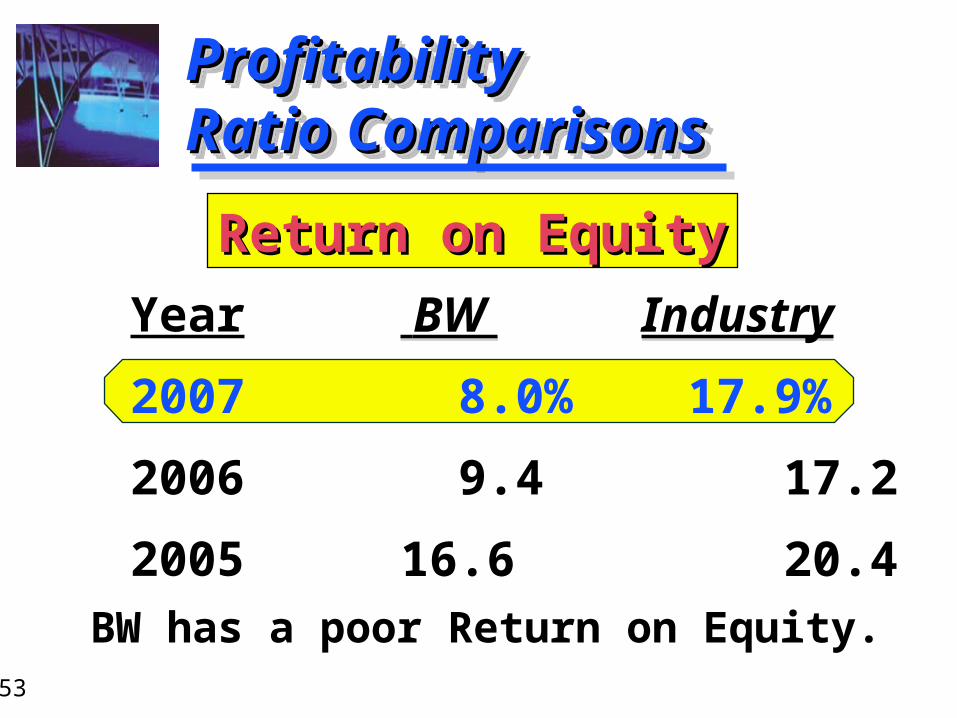
ProfitabilityProfitability Ratio ComparisonsRatio ComparisonsProfitabilityProfitability Ratio ComparisonsRatio Comparisons
BW Industry
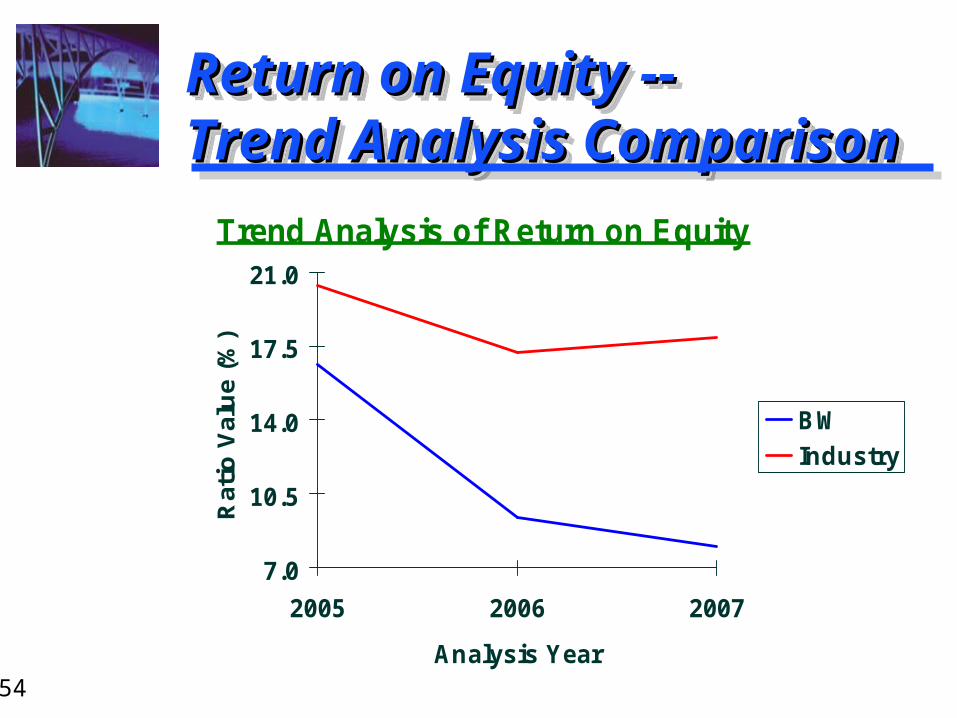
8.0% 17.9%
9.4 17.2
16.6 20.4
BW Industry
8.0% 17.9%
9.4 17.2
16.6 20.4
Year
2007
2006
2005
Return on EquityReturn on Equity
BW has a poor Return on Equity.
6-54
Return on Equity --Return on Equity --Trend Analysis ComparisonTrend Analysis ComparisonReturn on Equity --Return on Equity --Trend Analysis ComparisonTrend Analysis Comparison
Trend Analysis of Return on Equity
7.0
10.5
14.0
17.5
21.0
2005 2006 2007
Analysis Year
Rat
io V
alu
e (%
)
BW
Industry
6-55
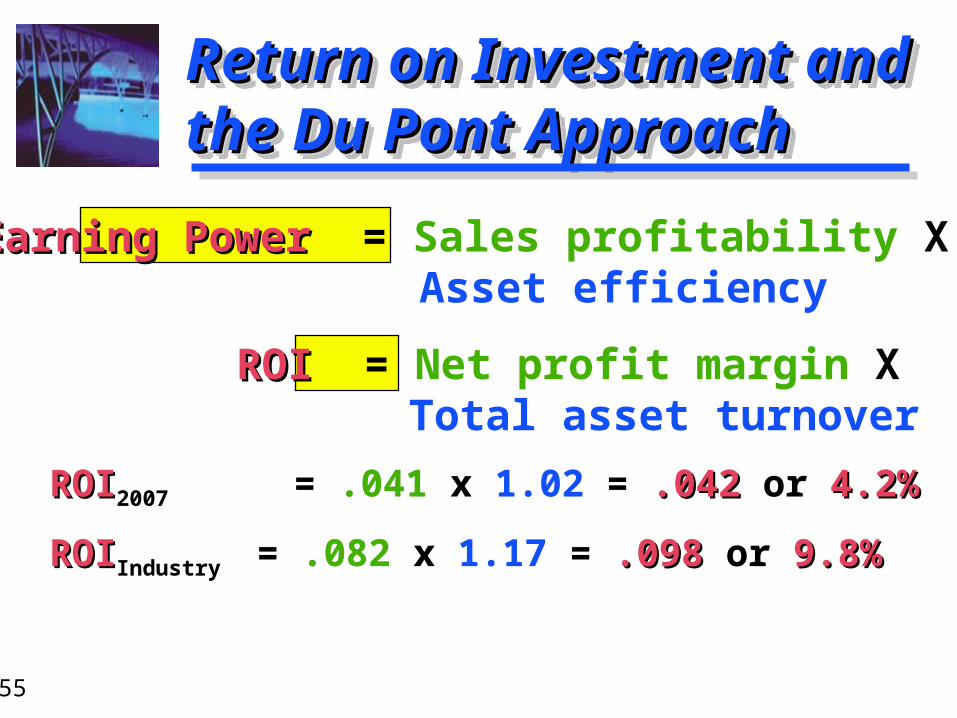
Return on Investment and Return on Investment and the Du Pont Approachthe Du Pont ApproachReturn on Investment and Return on Investment and the Du Pont Approachthe Du Pont Approach
ROIROI2007 = .041 x 1.02 = .042.042 or 4.2%4.2%
ROIROIIndustry = .082 x 1.17 = .098.098 or 9.8%9.8%
ROIROI2007 = .041 x 1.02 = .042.042 or 4.2%4.2%
ROIROIIndustry = .082 x 1.17 = .098.098 or 9.8%9.8%
ROI ROI = Net profit margin X Total asset turnover
Earning Power Earning Power = Sales profitability X Asset efficiency
6-56
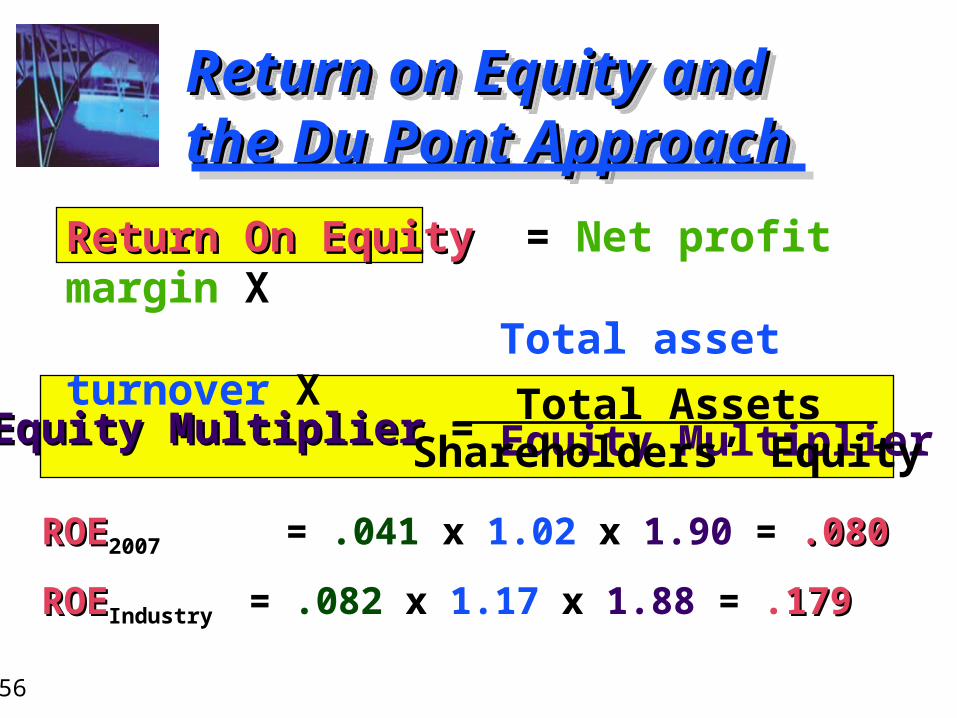
Return on Equity and Return on Equity and the Du Pont Approachthe Du Pont ApproachReturn on Equity and Return on Equity and the Du Pont Approachthe Du Pont Approach
ROEROE2007 = .041 x 1.02 x 1.90 = .080.080
ROEROEIndustry = .082 x 1.17 x 1.88 = .179179
ROEROE2007 = .041 x 1.02 x 1.90 = .080.080
ROEROEIndustry = .082 x 1.17 x 1.88 = .179179
Return On Equity Return On Equity = Net profit margin X Total asset turnover X
Equity Multiplier
Equity Multiplier Equity Multiplier = Total Assets
Shareholders’ Equity
6-57
Summary of the Profitability Summary of the Profitability Trend AnalysesTrend AnalysesSummary of the Profitability Summary of the Profitability Trend AnalysesTrend Analyses
The profitability ratios for BWBW have ALL been falling since 2005. Each has been below the industryindustry averages for the past three years.
This indicates that COGSCOGS and administrative costsadministrative costs may both be too high and a potential problem for BWBW.
Note, this result is consistent with the low interest coverage ratio.
6-58
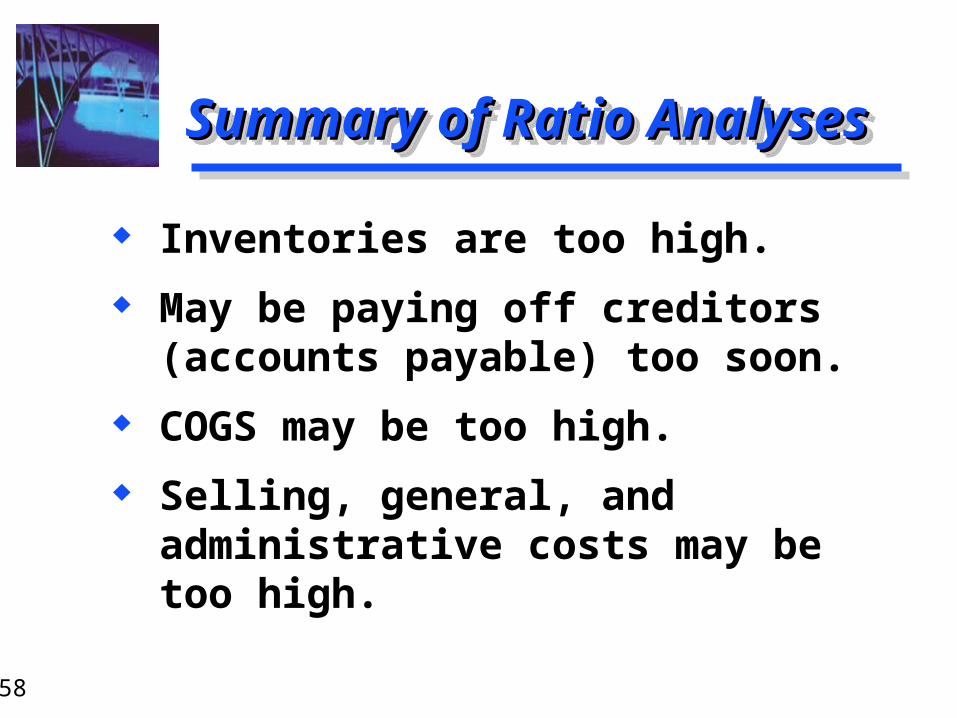
Summary of Ratio AnalysesSummary of Ratio AnalysesSummary of Ratio AnalysesSummary of Ratio Analyses
Inventories are too high.
May be paying off creditors (accounts payable) too soon.
COGS may be too high.
Selling, general, and administrative costs may be too high.
Inventories are too high.
May be paying off creditors (accounts payable) too soon.
COGS may be too high.
Selling, general, and administrative costs may be too high.
6-59
Common-size AnalysisCommon-size AnalysisCommon-size AnalysisCommon-size Analysis
An analysis of percentage financial statements where all
balance sheet items are divided by total assets and all income statement items are divided by
net sales or revenues.
An analysis of percentage financial statements where all
balance sheet items are divided by total assets and all income statement items are divided by
net sales or revenues.
6-60
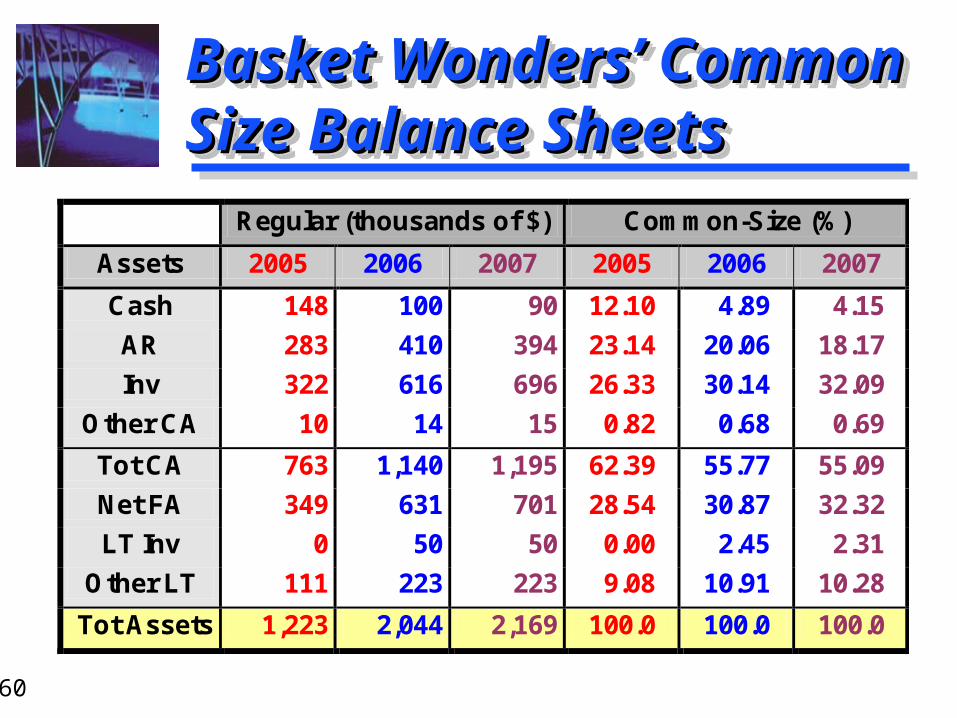
Basket Wonders’ Common Basket Wonders’ Common Size Balance SheetsSize Balance SheetsBasket Wonders’ Common Basket Wonders’ Common Size Balance SheetsSize Balance Sheets
Regular (thousands of $) Common-Size (%)
Assets 2005 2006 2007 2005 2006 2007
Cash 148 100 90 12.10 4.89 4.15
AR 283 410 394 23.14 20.06 18.17
Inv 322 616 696 26.33 30.14 32.09
Other CA 10 14 15 0.82 0.68 0.69
Tot CA 763 1,140 1,195 62.39 55.77 55.09
Net FA 349 631 701 28.54 30.87 32.32
LT Inv 0 50 50 0.00 2.45 2.31
Other LT 111 223 223 9.08 10.91 10.28
Tot Assets 1,223 2,044 2,169 100.0 100.0 100.0
6-61
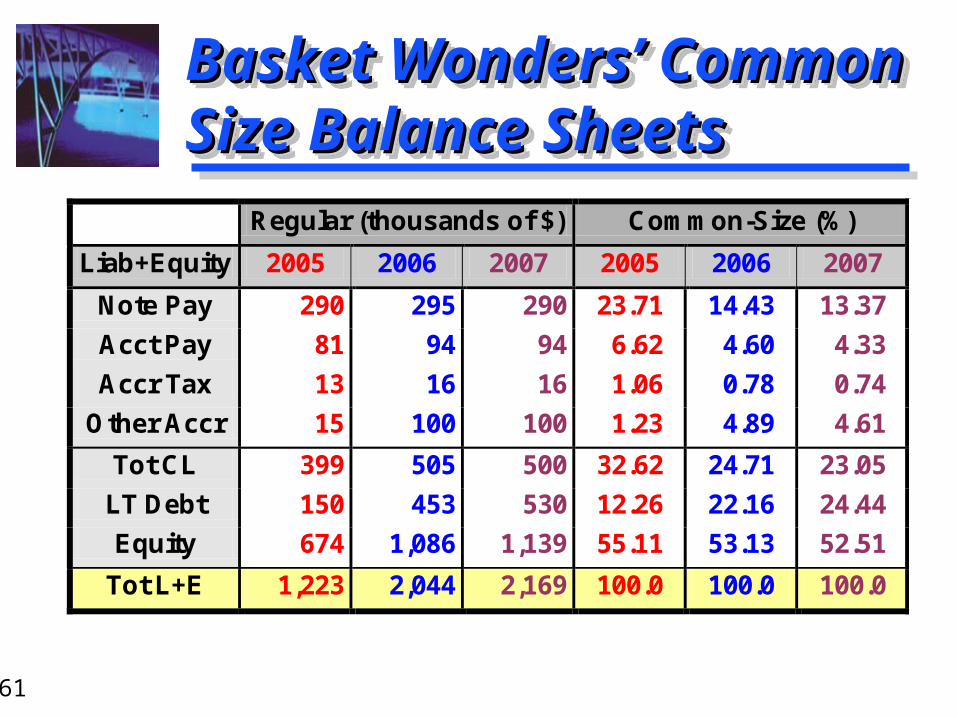
Basket Wonders’ Common Basket Wonders’ Common Size Balance SheetsSize Balance SheetsBasket Wonders’ Common Basket Wonders’ Common Size Balance SheetsSize Balance Sheets
Regular (thousands of $) Common-Size (%)
Liab+Equity 2005 2006 2007 2005 2006 2007
Note Pay 290 295 290 23.71 14.43 13.37
Acct Pay 81 94 94 6.62 4.60 4.33
Accr Tax 13 16 16 1.06 0.78 0.74
Other Accr 15 100 100 1.23 4.89 4.61
Tot CL 399 505 500 32.62 24.71 23.05
LT Debt 150 453 530 12.26 22.16 24.44
Equity 674 1,086 1,139 55.11 53.13 52.51
Tot L+E 1,223 2,044 2,169 100.0 100.0 100.0
6-62
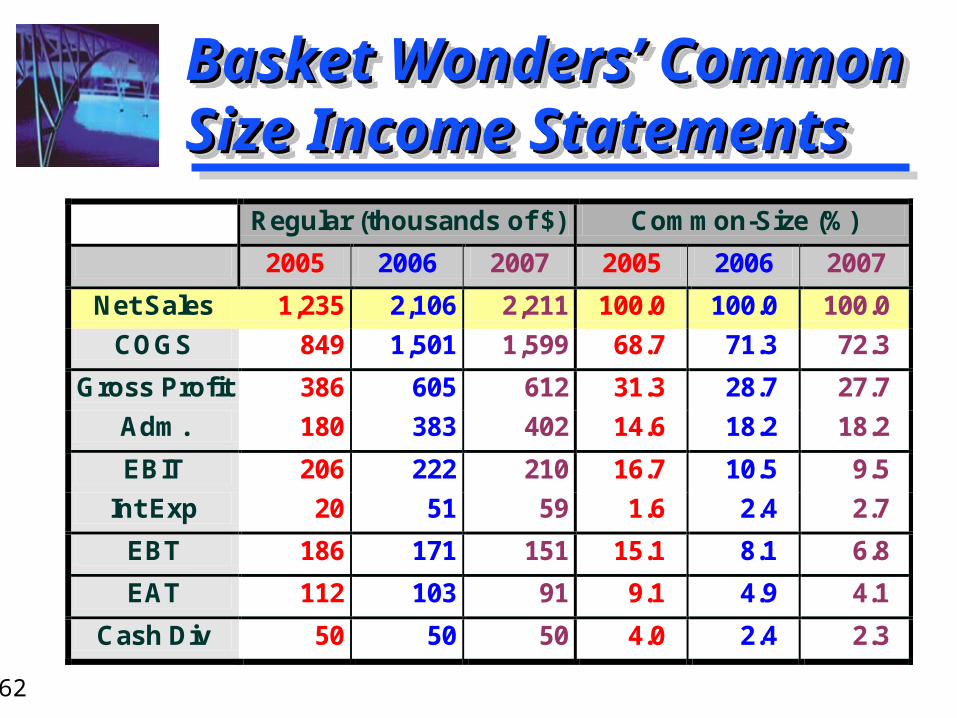
Basket Wonders’ Common Basket Wonders’ Common Size Income StatementsSize Income StatementsBasket Wonders’ Common Basket Wonders’ Common Size Income StatementsSize Income Statements
Regular (thousands of $) Common-Size (%)
2005 2006 2007 2005 2006 2007
Net Sales 1,235 2,106 2,211 100.0 100.0 100.0
COGS 849 1,501 1,599 68.7 71.3 72.3
Gross Profit 386 605 612 31.3 28.7 27.7
Adm. 180 383 402 14.6 18.2 18.2
EBIT 206 222 210 16.7 10.5 9.5
Int Exp 20 51 59 1.6 2.4 2.7
EBT 186 171 151 15.1 8.1 6.8
EAT 112 103 91 9.1 4.9 4.1
Cash Div 50 50 50 4.0 2.4 2.3