Embed Size (px)
Citation preview
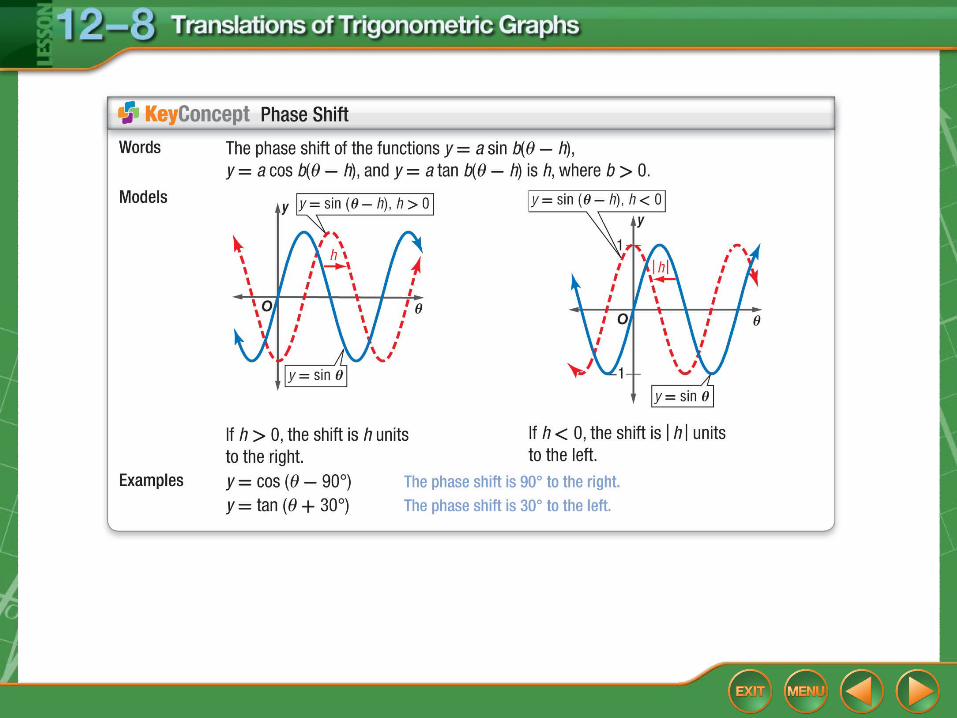
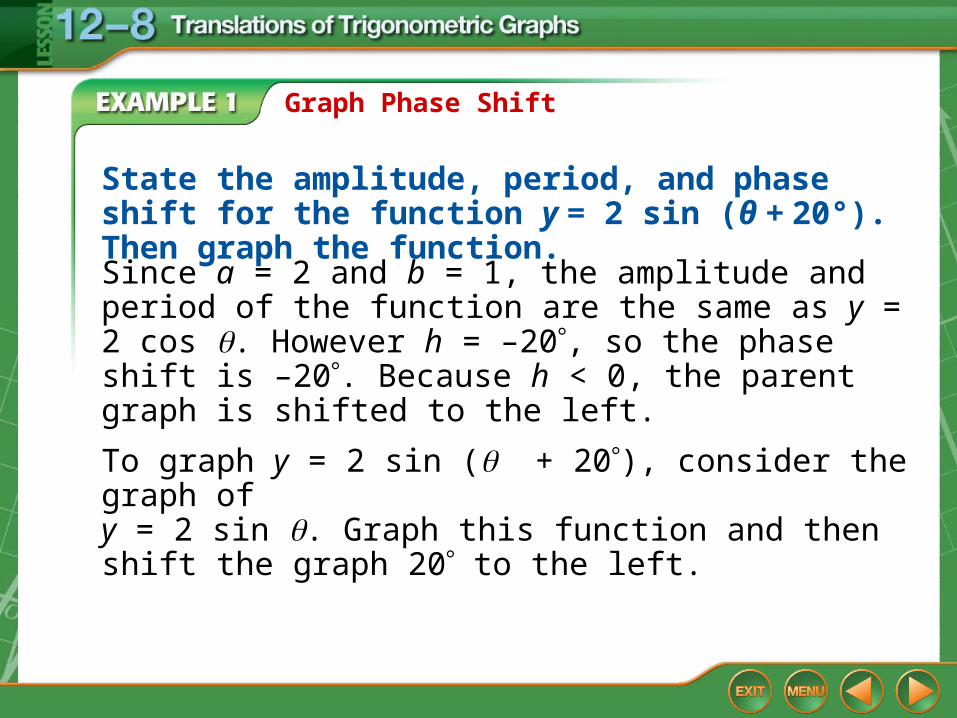
Graph Phase Shift
State the amplitude, period, and phase shift for the function y = 2 sin (θ + 20°). Then graph the function.
Since a = 2 and b = 1, the amplitude and period of the function are the same as y = 2 cos . However h = –20, so the phase shift is –20. Because h < 0, the parent graph is shifted to the left.
To graph y = 2 sin ( + 20), consider the graph of y = 2 sin . Graph this function and then shift the graph 20 to the left.
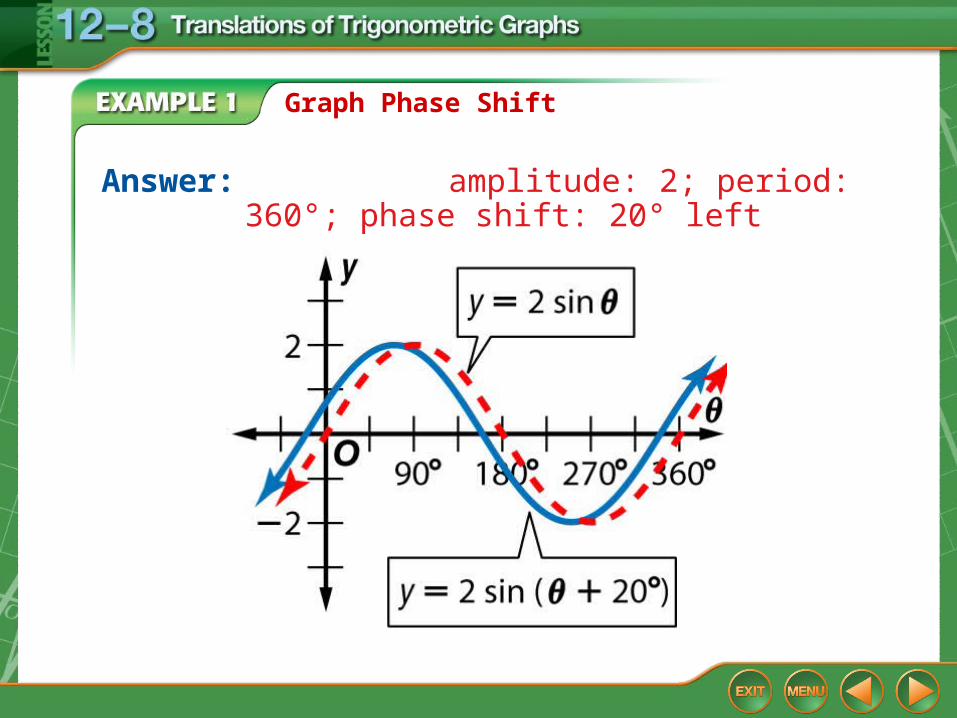
Answer: amplitude: 2; period: 360°; phase shift: 20° left
Graph Phase Shift
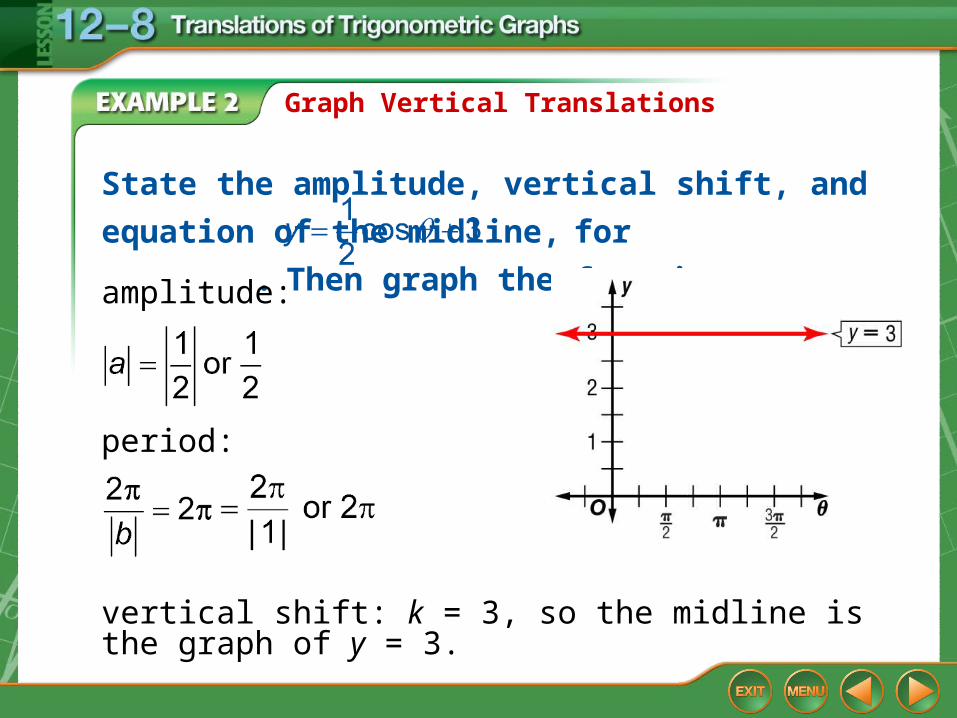
Graph Vertical Translations
State the amplitude, vertical shift, and equation of the
midline, for . Then graph the function.
vertical shift: k = 3, so the midline is the graph of y = 3.
amplitude:
period:
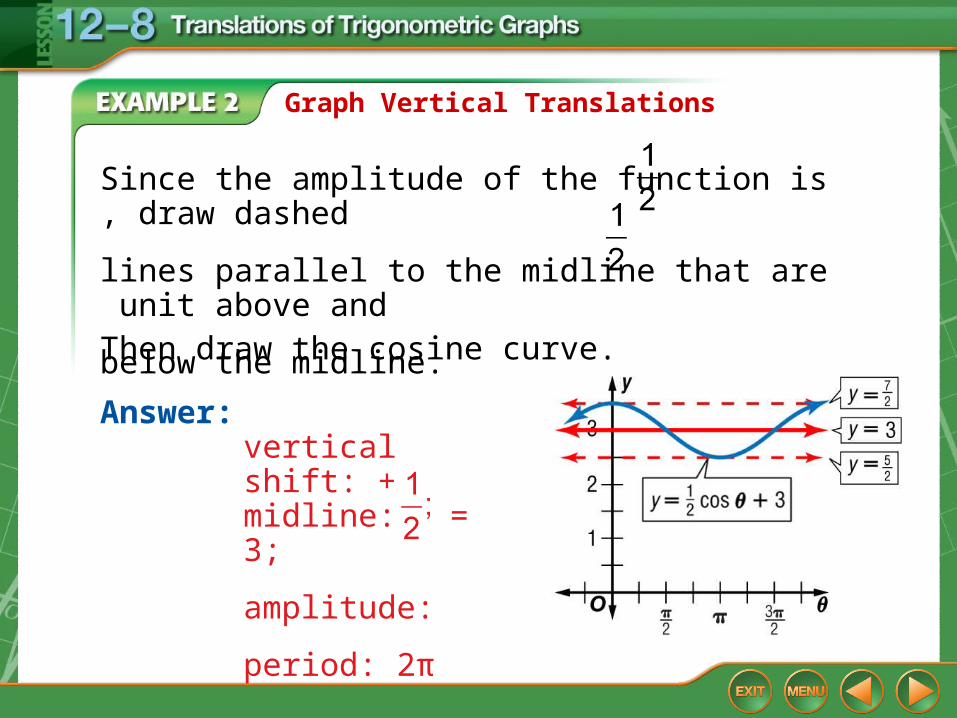
Graph Vertical Translations
Since the amplitude of the function is , draw dashed
lines parallel to the midline that are unit above and
below the midline.
Then draw the cosine curve.
Answer: vertical shift: +3; midline: y = 3;
amplitude:
period: 2π
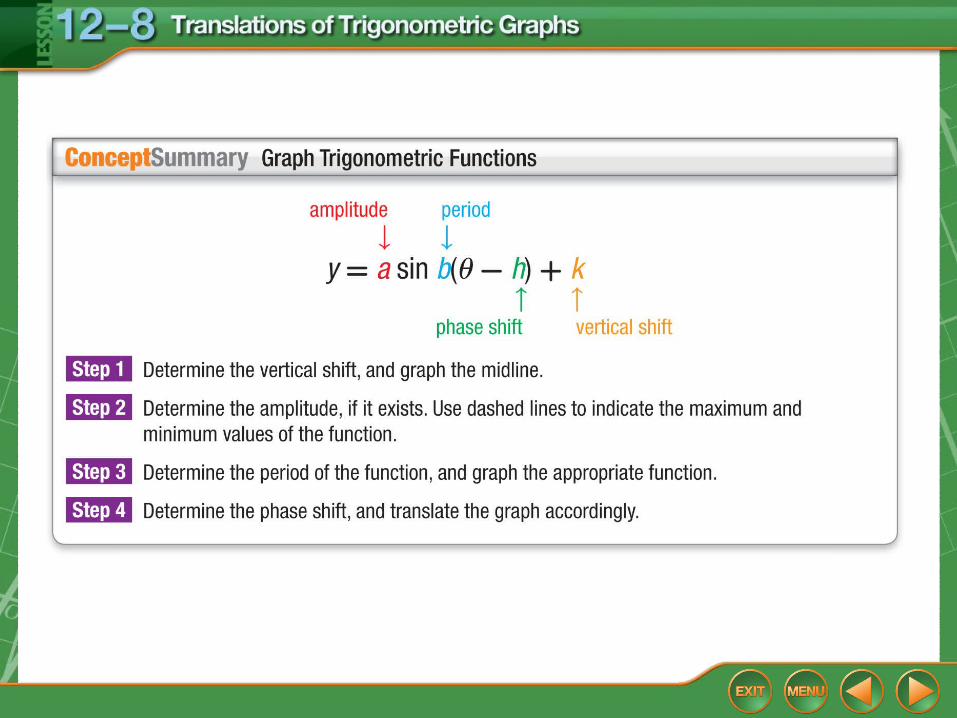
Graph Transformations
State the amplitude, period, phase shift, and vertical
shift for Then graph the
function.The function is written in the form y = a cos [b(θ – h) + k].Identify the values of a, b, and k.
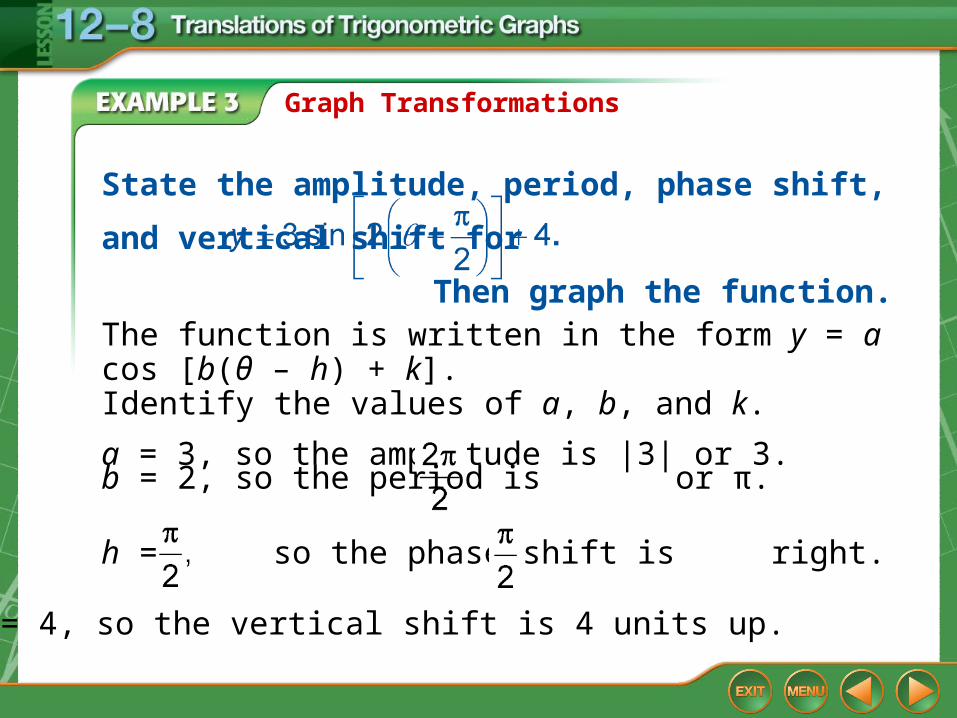
a = 3, so the amplitude is |3| or 3.
b = 2, so the period is or π.
h = so the phase shift is right.
k = 4, so the vertical shift is 4 units up.
Graph Transformations
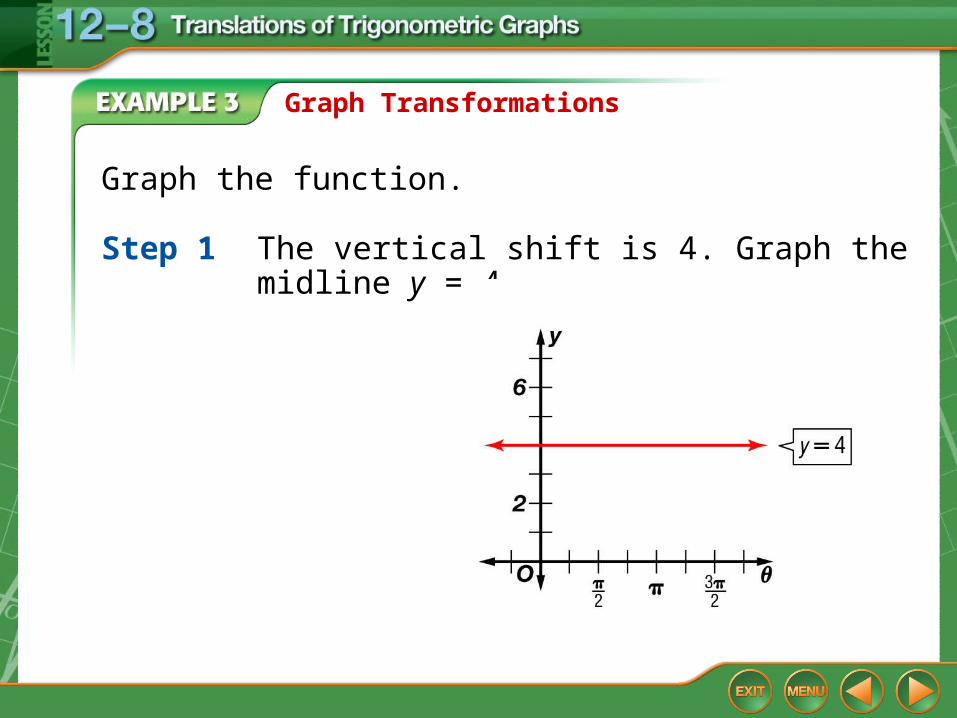
Graph the function.
Step 1 The vertical shift is 4. Graph the midline y = 4.
Graph Transformations
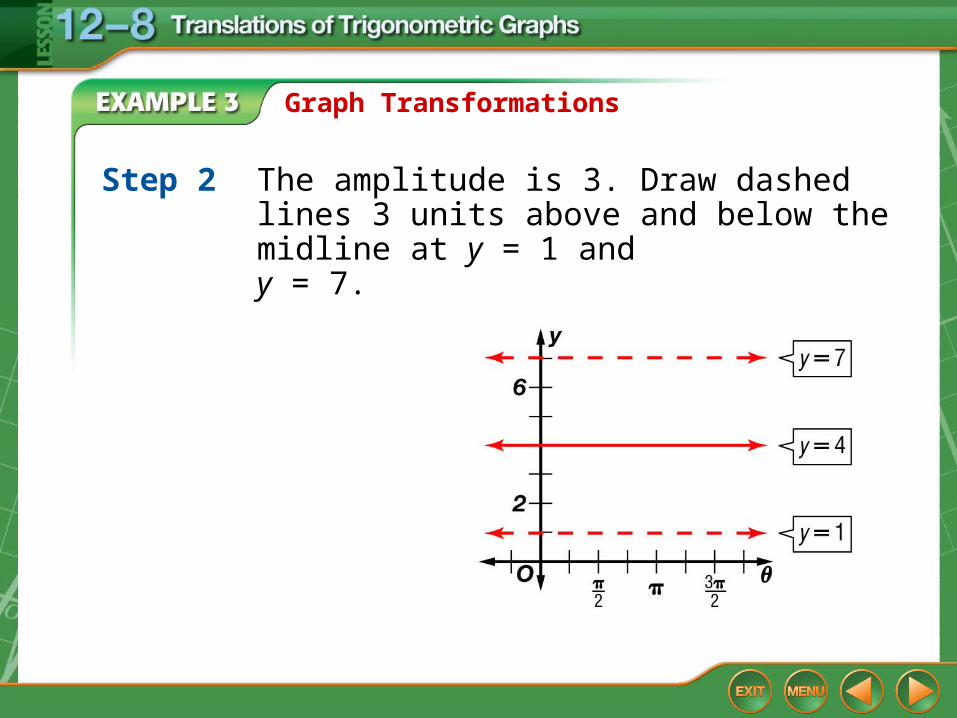
Step 2 The amplitude is 3. Draw dashed lines 3 units above and below the midline at y = 1 and y = 7.
Graph Transformations
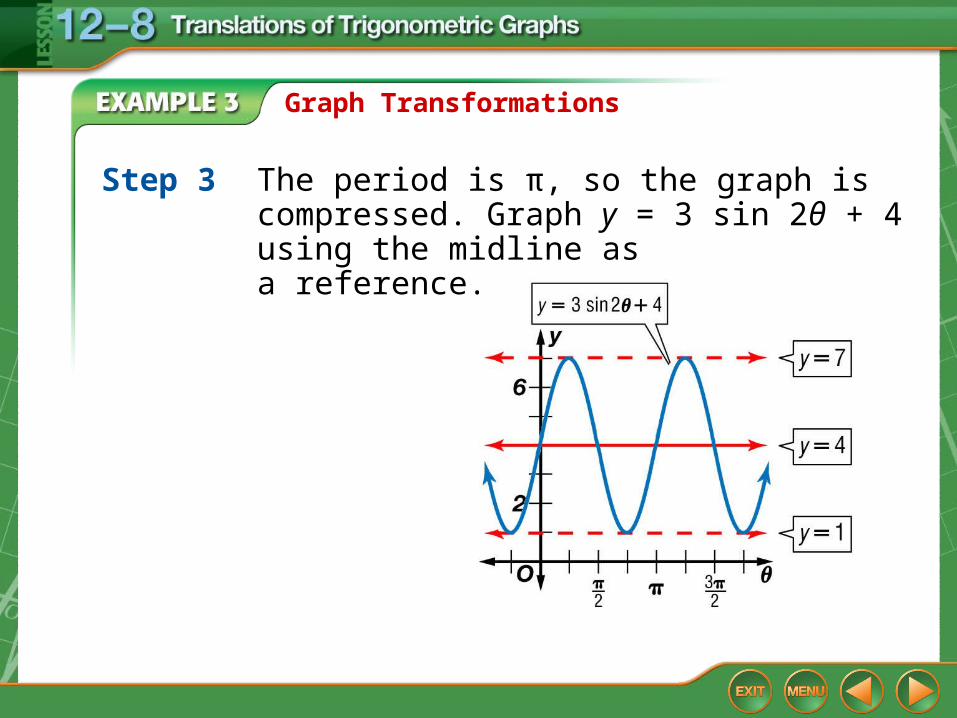
Step 3 The period is π, so the graph is compressed. Graph y = 3 sin 2θ + 4 using the midline as a reference.
Graph Transformations
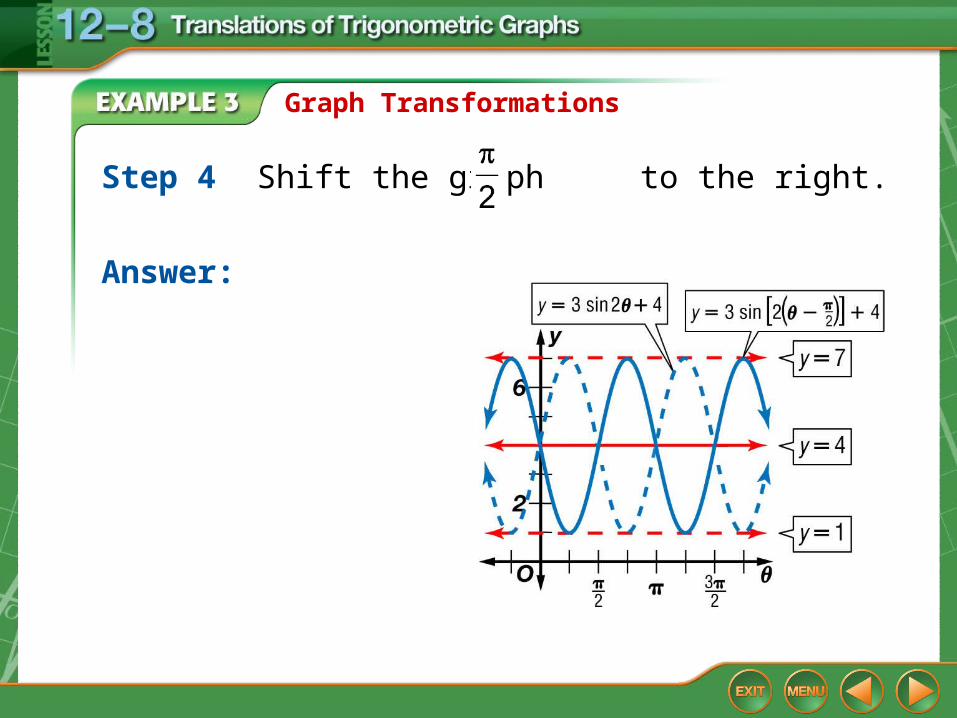
Step 4 Shift the graph to the right.
Answer: