Embed Size (px)
Citation preview

Concept design of a Fast Inspection Repair and Maintenance vessel 11/22/2013 K.W. van der Leij

1
Concept design of a Fast Inspection Repair and Maintenance vessel
22-11-2013 Technical University Delft
Damen Shipyard Gorinchem

2
Abstract
This report describes the design of an Inspection, Repair and Maintenance (IRM) vessel for the offshore oil
and gas market with the possibility to sail at a maximum speed of 25 knots. The idea came from an operator who wanted to investigate the possibility of a relatively high speed offshore vessel to decrease the transit time in order to increase the amount of working days and in case of emergency response. The problem that arose was that existing IRM vessels have a hull shape which is not built for speed, it had to be investigated which design is suitable for both speed and stationary crane operations at sea.
All the requirements of the vessels were summed up and a market analysis of the offshore oil and gas market was made to get an insight of the operations and supporting vessels, this resulted in the design of two concept vessels, a mono-hull and a catamaran. Both mono-hull and catamaran were designed as a displacement type vessel. The two concepts vessels were tested to each other on several criteria and eventually the mono-hull was chosen because of a significantly lower resistance.
Subsequently the mono-hull concept was evaluated and improvements have been made to solve some problems that arose for the first design. Eventually a final concept vessel was designed. Initially the linesplan was based on a fast displacement parent hull form developed by Marwood and Bailey. The lines were altered to fit all the components, but still very slim for an offshore vessel. Over the length of the work deck “sponsoons” were integrated in the hull, so the operator can increase the waterplane area and displacement of the vessel during hoisting operations and create extra transverse stability by increasing the draft of the vessel.
It can be concluded that a Fast Inspection Repair and Maintenance vessel with a speed requirement of 25 knots is technically possible. However it is very likely that about 90% of the operational time only a limited percentage of the entire installed propulsion power is used, making it a very expensive vessel to buy and operate. On the other hand the day rates of these vessels are in the order of millions, which makes it possible to earn back the investment.
The report is subdivided into six chapters. The first chapter provides an introduction into the offshore oil
and gas market through a market analyses. This market analyses together with the initial requirements for the vessel will form the design questions for this project. Chapter two covers the design process of a mono-hull concept. All design aspects like for instance hull form design, resistance calculation, stability calculations and seaway calculations are discussed. The third chapter covers the same design process but now for a catamaran design. Eventually these two concepts are compared to each other in Chapter 4 from which one design is chosen. This design is than evaluated and improved in Chapter 5 leading to the final design for this vessel. The last chapter provides a conclusion and future recommendations for this project.

3
Table of Contents
Abstract ............................................................................................................................................................ 2 List of figures .................................................................................................................................................... 5 List of tables ..................................................................................................................................................... 7 1. Main challenges and problem description ............................................................................................ 9
1.1 Market analyses: The offshore oil and gas market ......................................................................... 10 1.1.1 Processes and supporting vessels .......................................................................................... 10
1.1.2 Offshore (support) vessels ...................................................................................................... 12
1.1.3 Inspection Repair and Maintenance ....................................................................................... 16
1.2 Initial requirements / Design criteria FIRM ..................................................................................... 17 1.3 Design questions: ............................................................................................................................ 18 1.4 Concepts .......................................................................................................................................... 18
2. Design mono-hull concept ................................................................................................................... 19 2.1 Choice of hull form type and linesplan ............................................................................................ 19
2.1.1 Marwood and Bailey hull ........................................................................................................ 22
2.2.2 Linesplan ...................................................................................................................................... 23
2.2.3 Preliminary general arrangement plan ........................................................................................ 25
2.2 Resistance calculation ..................................................................................................................... 26 2.3 Power speed analyses and propulsion system ................................................................................ 28 2.4 Auxiliary Systems and electric load balance .................................................................................... 31 2.5 Tank capacity ................................................................................................................................... 32 2.6 Weight calculation........................................................................................................................... 33
2.6.1 Results .................................................................................................................................... 34
2.7 Hydrostatics..................................................................................................................................... 35 2.8 Stability calculations ........................................................................................................................ 36
2.8.1 Intact stability calculations ..................................................................................................... 36
2.8.2 Accidental loss of load stability calculation ............................................................................ 38
2.8.3 Damage stability calculations ................................................................................................. 39
2.8.4 Tank arrangement .................................................................................................................. 40
2.9 Seakeeping ...................................................................................................................................... 41 2.9.1 Approach and criteria ............................................................................................................. 41
2.9.2 Results .................................................................................................................................... 42
2.10 Dynamic positioning ................................................................................................................... 45 2.10.1 Calculation of forces and moments ........................................................................................ 45
2.10.2 Thruster forces and static equilibrium ................................................................................... 48
3. Design catamaran concept .................................................................................................................. 50 3.1 Catamaran comparison and main dimension estimation ............................................................... 51 3.2 Determination of main particulars .................................................................................................. 53 3.3 Hull design and lines ........................................................................................................................ 55 3.4 Resistance calculation ..................................................................................................................... 56 3.5 Weight calculation........................................................................................................................... 58 3.6 Hydrostatics..................................................................................................................................... 59 3.7 Stability ............................................................................................................................................ 60
4. Selection .............................................................................................................................................. 61 5. Mono-hull concept optimization and final design ............................................................................... 62
5.1 Resistance reduction ....................................................................................................................... 62 5.2 Increase stability for DP .................................................................................................................. 64 5.3 New design ...................................................................................................................................... 65
5.3.1 Hull design and lines ............................................................................................................... 66

4
5.3.2 Resistance ............................................................................................................................... 67
5.3.3 Power speed analyses and propulsion system ....................................................................... 69
5.3.4 Auxiliary systems and electric load balance ........................................................................... 71
5.3.5 Weight calculation .................................................................................................................. 72
5.3.6 Hydrostatics ............................................................................................................................ 73
5.3.7 Stability ................................................................................................................................... 75
5.3.8 Dynamic positioning ............................................................................................................... 78
5.3.9 General arrangement plan and tank arrangement ................................................................ 80
5.3.10 Artists impressions ................................................................................................................. 85
6 Conclusion ........................................................................................................................................... 89 Latest developments ...................................................................................................................................... 90
Specification sheet Damen FIRM 120 ....................................................................................................... 91 Artists impressions and photo Damen FIRM 120 ...................................................................................... 93
References ..................................................................................................................................................... 97 Appendices I Design hydrostatics report mono-hull. ........................................................................................................ 99 II Tank volumes mono-hull concept ............................................................................................................. 101 III Weight calculation mono-hull concept .................................................................................................... 102 IV Extensive hydrostatics report mono-hull concept ................................................................................... 107 V Rules and regulations intact stability calculations .................................................................................... 110
VI.A IMO A.749(18) ................................................................................................................................. 110 VI.B Accidental loss of load (DNV) ........................................................................................................... 111
VI Intact Stability calculations mono-hull .................................................................................................... 112 VII Loss of load calculation mono-hull ......................................................................................................... 133 VIII Background information Strip Theory ................................................................................................... 139 IX Seakeeping performances indices (NORDFORSK) .................................................................................... 141 X Dynamic positioning calculations mono-hull ............................................................................................ 144
X.ABackground information on DP ......................................................................................................... 144 X.B DP calculations mono-hull ................................................................................................................ 147
XI Catamaran database ................................................................................................................................ 150 XI.A Trendlines ........................................................................................................................................ 154
XII Design hydrostatics report catamaran. ................................................................................................... 158 XIII Resistance prediction catamaran design ............................................................................................... 160 XIV Weight calculation catamaran ............................................................................................................... 163
XIV.A Weight of structure between demi-hulls ...................................................................................... 163 XIV.B Bare hull weight catamaran ........................................................................................................... 165
XV Extensive hydrostatics report catamaran .............................................................................................. 166 XVI Intact stability calculations catamaran .................................................................................................. 169 XVII Design hydrostatics report final design. ............................................................................................... 172 XVIII Extensive hydrostatics report final design ........................................................................................... 174 XIX Weight calculation final design .............................................................................................................. 177 XX Intact stability calculations final design .................................................................................................. 182 XXI Loss of load calculation final design ....................................................................................................... 206 XXII Dynamic positioning calculations final design ...................................................................................... 212 XXIII Technical tender document knuckle boom crane ............................................................................... 213

5
List of figures
Figure 1, Offshore oil and gas processes and supporting vessels .................................................................. 12 Figure 2, Modern IRM vessel ......................................................................................................................... 16 Figure 3, Typical curves of CTL for a displacement hull, a semi-displacement hull and a fully planing hull.. . 19 Figure 4, Basic layout IRM vessel ................................................................................................................... 20 Figure 5, Basic layout main deck .................................................................................................................... 21 Figure 6, Linesplan Marwood and Bailey parent hull form ............................................................................ 22 Figure 7, Linesplan mono-hull concept .......................................................................................................... 24 Figure 8, Tanktop, Tween deck and Main deck.............................................................................................. 25 Figure 9, A- B- C- and Bridge deck .................................................................................................................. 25 Figure 10, Resistance mono-hull concept ...................................................................................................... 27 Figure 11, Effective power mono-hull concept .............................................................................................. 28 Figure 12, Schematic overview propulsion power and efficiencies ............................................................... 29 Figure 13, Schematic overview propulsion system mono-hull ...................................................................... 30 Figure 14, GZ curve DNV loss of load calculation ........................................................................................... 38 Figure 15, G'M limit curve mono-hull ............................................................................................................ 39 Figure 16, Tank arrangement mono-hull ....................................................................................................... 40 Figure 17, Operability mono-hull, 0 knots ..................................................................................................... 42 Figure 18, Operability mono-hull, 15 knots ................................................................................................... 43 Figure 19, Operability mono-hull, 25 knots ................................................................................................... 44 Figure 20, Cd coefficients mono-hull ............................................................................................................. 45 Figure 21, Contour mono-hull ........................................................................................................................ 46 Figure 22, Forces on mono-hull ..................................................................................................................... 47 Figure 23, Moments on mono-hull ................................................................................................................ 47 Figure 24, Thrust vectors mono-hull Figure 25, Orientation forces, moments and heading .................... 48 Figure 26, Catamaran Fn vs Lwl ..................................................................................................................... 51 Figure 27, Basic main deck layout catamaran ................................................................................................ 53 Figure 28, Resistance catamaran ................................................................................................................... 54 Figure 29, Linesplan catamaran ..................................................................................................................... 55 Figure 30, Total resistance catamaran ........................................................................................................... 57 Figure 31, Map op North-West Europe .......................................................................................................... 62 Figure 32, Resistance mono-hull T=5.50m ..................................................................................................... 63 Figure 33, Linesplan final design .................................................................................................................... 66 Figure 34, Resistance light service draft final design ..................................................................................... 67 Figure 35, Resistance design draft final design .............................................................................................. 67 Figure 36, Schematic overview propulsion system final design .................................................................... 70 Figure 37, Artists impression propulsion system final design ........................................................................ 70 Figure 38, G'M limit curve final design .......................................................................................................... 77 Figure 39, Forces on final design .................................................................................................................... 78 Figure 40, Moments on final design .............................................................................................................. 78 Figure 41, Thrust vectors final design Figure 42, Orientation forces, moments and heading ............... 79 Figure 43, GA plan final design 1 .................................................................................................................... 81 Figure 44, GA plan final design 2 .................................................................................................................... 82 Figure 45, GA plan final design 3 .................................................................................................................... 83 Figure 46, Tank arrangement final design ..................................................................................................... 84 Figure 47, Artists impression final design 1 ................................................................................................... 85 Figure 48, Artists impression final design 2 ................................................................................................... 85 Figure 49, Artists impression final design 3 ................................................................................................... 86 Figure 50, Artists impression final design 4 ................................................................................................... 86 Figure 51, Artists impression final design 5 ................................................................................................... 87 Figure 52, Artists impression final design 6 ................................................................................................... 87 Figure 53, Artists impression final design 7 ................................................................................................... 88 Figure 54, Artists impression 1 Damen FIRM 120 concept ............................................................................ 93 Figure 55, Artists impression 2 Damen FIRM 120 concept ............................................................................ 93 Figure 56, Artists impression 3 Damen FIRM 120 concept ............................................................................ 94 Figure 57, Artists impression 4 Damen FIRM 120 concept ............................................................................ 94

6
Figure 58, Artists impression 5 Damen FIRM 120 concept ............................................................................ 95 Figure 59, Artists impression 6 Damen FIRM 120 concept ............................................................................ 95 Figure 60, Artists impression 7 Damen FIRM 120 concept ............................................................................ 96 Figure 61, Scale model Damen FIRM 120 concept......................................................................................... 96 Figure 62, Stability with loss of crane load .................................................................................................. 111 Figure 63, Definition of ship motions ........................................................................................................... 139 Figure 64, Definition of vessel cross sections, strip theory .......................................................................... 140 Figure 65, Cd coëfficient ellipse ................................................................................................................... 147 Figure 66, Stations mono-hull mirrored ....................................................................................................... 147 Figure 67, Trendline catamaran database, Fn vs lwl .................................................................................... 154 Figure 68, Trendline catamaran database, DWT vs lwl ................................................................................ 154 Figure 69, Trendline catamaran database, lwl/Bdemi vs lwl ...................................................................... 155 Figure 70, Trendline catamaran database, lwl/B vs lwl ............................................................................... 155 Figure 71, Trendline catamaran database, B/T vs lwl .................................................................................. 156 Figure 72, Trendline catamaran database, Cb vs lwl ................................................................................... 156 Figure 73, Trendline catamaran database, Pb vs lwl.................................................................................... 157 Figure 74, Models for resistance prediction Molland .................................................................................. 160 Figure 75, Notation and Main Parameters of Models, Molland .................................................................. 160 Figure 76, Details of Models, Molland ......................................................................................................... 160 Figure 77, Resistance componants Model 3b, Mono-hull ........................................................................... 161 Figure 78, Resistance componants Model 4a, Mono-hull ........................................................................... 161 Figure 79, Resistance componants Model 4b, Mono-hull ........................................................................... 161 Figure 80, Resistance componants Model 3b, S/L=0.2 ................................................................................ 162 Figure 81, Resistance componants Model 4a, S/L=0.2 ................................................................................ 162 Figure 82, Resistance componants Model 4b, S/L=0.2 ................................................................................ 162 Figure 83, Equilibrium of forces on catamaran hull ..................................................................................... 163 Figure 84, simplyfied equilibrium of forces on catamaran hull ................................................................... 164 Figure 85, Vergeet me nietjes ...................................................................................................................... 164

7
List of tables
Table 1, IRM vessels ....................................................................................................................................... 16 Table 2, Deck layout ....................................................................................................................................... 20 Table 3, Parameters Marwood and Bailey parent hull form .......................................................................... 22 Table 4, Design challenges ............................................................................................................................. 23 Table 5, Main particulars mono-hull concept ................................................................................................ 24 Table 6, Holtrop and Mennen applicability area ........................................................................................... 26 Table 7, Main engines mono-hull .................................................................................................................. 30 Table 8, Main consumers mono-hull ............................................................................................................. 31 Table 9, Auxiliary generator sets mono-hull 1 (2x) ........................................................................................ 31 Table 10, Auxiliary generator sets mono-hull 2 (2x) ...................................................................................... 31 Table 11, Emergency generator set mono-hull .............................................................................................. 31 Table 12, Fuel consumption mono-hull ......................................................................................................... 32 Table 13, Total light ship weight and CoG mono-hull .................................................................................... 34 Table 14, Hydrostatics mono-hull .................................................................................................................. 35 Table 15, Intact stability criteria .................................................................................................................... 36 Table 16, Intact stability calculation mono-hull results ................................................................................. 37 Table 17, Results loss of load calculation mono-hull ..................................................................................... 38 Table 18, Drafts and G'M values for probabilistic damage stability calculation ............................................ 39 Table 19, Operability mono-hull, 0 knots ....................................................................................................... 42 Table 20, Operability mono-hull, 15 knots ..................................................................................................... 43 Table 21, Operability mono-hull, 25 knots ..................................................................................................... 44 Table 22, Environmental forces and moments mono-hull ............................................................................ 48 Table 23, Thruster forces mono-hull .............................................................................................................. 49 Table 24, Initial main dimensions catamaran ................................................................................................ 54 Table 25, Main particulars catamaran ........................................................................................................... 55 Table 26, Comparison model catamaran and FIRM catamaran ..................................................................... 56 Table 27, Resistance coefficients catamaran models .................................................................................... 56 Table 28, Total resistance coefficient H&M and Damen resistance prediction tool ..................................... 56 Table 29, Total resistance catamaran ............................................................................................................ 57 Table 30, Summary weight calculation .......................................................................................................... 58 Table 31, Hydrostatics catamaran ................................................................................................................. 59 Table 32, Crane operation heel comparison .................................................................................................. 60 Table 33, Main particulars final design .......................................................................................................... 66 Table 34, Main engines final design ............................................................................................................... 70 Table 35, Main consumers final design .......................................................................................................... 71 Table 36, Auxiliary generator sets mono-hull 1 (2x) ...................................................................................... 71 Table 37, Auxiliary generator sets mono-hull 2 (2x) ...................................................................................... 71 Table 38, Emergency generator set mono-hull .............................................................................................. 71 Table 39, Total light ship weight and CoG final design .................................................................................. 72 Table 40, Design hydrostatics final design T=5.15 m ..................................................................................... 73 Table 41, Design hydrostatics final design T=5.80 m ..................................................................................... 73 Table 42, Design hydrostatics final design T=6.6 m ....................................................................................... 74 Table 43, Intact stability calculation final design results ............................................................................... 75 Table 44, Results loss of load calculation mono-hull ..................................................................................... 76 Table 45, Drafts and G'M values for probabilistic damage stability calculation ............................................ 77 Table 46, Environmental forces and moment on final design ....................................................................... 79 Table 47, Thruster forces final design ............................................................................................................ 79 Table 48, Weight factor comparison ............................................................................................................ 102 Table 49, Weight calculation mono-hull 100 ............................................................................................... 102 Table 50, Steel weight calculation mono-hull Westers ................................................................................ 103 Table 51, Weight calculation mono-hull 200 ............................................................................................... 103 Table 52, Weight calculation mono-hull 300 ............................................................................................... 104 Table 53, Weight calculation mono-hull 400 ............................................................................................... 105 Table 54, Weight calculation mono-hull 500 ............................................................................................... 105 Table 55, Weight calculation mono-hull 600 ............................................................................................... 106
8
Table 56, Weight calculation mono-hull 700 ............................................................................................... 106 Table 57, Weight calculation mono-hull 800 ............................................................................................... 106 Table 58, Current forces and moments mono-hull ...................................................................................... 148 Table 59, Wind forces and moments mono-hull ......................................................................................... 149 Table 60, H-profile parameters .................................................................................................................... 164 Table 61, Weight calculation catamaran 100 .............................................................................................. 165 Table 62, Weight calculation final design 100 ............................................................................................. 177 Table 63, Weight calculation final design 200 ............................................................................................. 178 Table 64, Weight calculation final design 300 ............................................................................................. 179 Table 65, Weight calculation final design 400 ............................................................................................. 180 Table 66, Weight calculation final design 500 ............................................................................................. 180 Table 67, Weight calculation final design 600 ............................................................................................. 181 Table 68, Weight calculation final design 700 ............................................................................................. 181 Table 69, Weight calculation final design 800 ............................................................................................. 181 Table 70, Current forces and moments final design .................................................................................... 212

9
1. Main challenges and problem description
The goal for this thesis is to design a concept vessel of an Inspection Repair & Maintenance vessel (IRM) for
the offshore oil and gas market. These vessels are deployed worldwide and often have to cope with large transit distances. The idea for this concept is a vessel with all the capabilities of a regular IRM vessel and the ability to sail at 25 knots. This new type of vessel will be called FIRM, Fast Inspection Repair and Maintenance vessel. The speed of 25 knots should give this vessel an advantage over other competitive vessels and will be unique in the offshore oil and gas market.
The main challenge for this concept vessel lies in the speed requirement. Current IRM vessels sail at a maximum speed which lies around 16 knots; this is significantly lower than the required 25 knots for this vessel. Resulting in a design that has to be able to reach this speed and has enough stability to perform crane operations while stationary at sea.
To be able to design a concept vessel, first a market analyses was made which covers the oil and gas
winning processes and supporting vessels. This market analyses together with the initial requirements from Damen leads to a series of design questions. On the basis of these criteria and questions the design process is started.

10
1.1 Market analyses: The offshore oil and gas market
To get a good picture of the offshore oil and gas industry a market analyses has been made. This market
analyses is performed to get a better insight of the offshore oil and gas market. Is gives an overview of the processes involved and the vessels used in the support of these processes.
The offshore oil and gas winning process is depending on a variety of technically advanced vessels. Each
step of the process, from locating the fields till supplying the rigs, needs dedicated vessels to make offshore oil and gas winning possible. To get a good impression of the entire process an overview is made that shows each step in the chain with the corresponding vessels and their specific tasks. This way it is possible to “fit” the FIRM into the chain and see where the concept can be implemented.
The process of finding and producing oil and bringing it to shore are categorized into upstream and downstream activities. In case of offshore oil and gas winning, all activities from searching and finding hydrocarbons and/or gas till production and bringing it to shore are called upstream activities. Downstream activities cover the moment the product reaches the refinery till the final product flows into for example a car. This analysis focuses on the offshore activities, so downstream activities are not considered.
1.1.1 Processes and supporting vessels
Upstream activities are categorized in two main activities, exploration and exploitation. In order to
complete the chain of offshore activities, also decommissioning, abandonment and removal off offshore installations is added.
Exploration Exploration starts with a geological study of the environment, if geologists conclude that oil and gas may
have formed in that area seismic research vessels will perform a seismic investigation to visualize the layers of the earth’s crust. If the outcome of this investigation reveals the potential entrapment of hydrocarbons, it is necessary to perform exploration drillings. These drillings are the only irrefutable way to prove the presence of oil and gas. Drilling an exploration well on the seabed requires a platform above water with a drilling rig.
Geophysical survey/seismic surveying Oil companies’ basic assets are oil and gas containing reservoirs, and detection of these fields by
geophysical research are of vital importance. There are several tools available to carry out such a research, variations in the earth gravity- or magnetic field can be measured with airborne equipment and air photographs. More precise are seismic surveys, which in case of an offshore field have to be carried out by seismic research vessels. Reflected seismic waves are used to reveal the earth layers, called horizons by geologists, in order to find in particular anticline structures, faults, salt dome outcroppings etc.
Exploration drilling If a geophysical survey gives an expectation of a possible oil or gas accumulation under the sea bed a test
drill is made to determine the size, potential productivity and to test the formation. This procedure can be carried out by rigs or Mobile Drilling Units (MODU). A MODU is an integrated unit with a drilling rig and all necessary auxiliaries, accommodation and stores. This type of rig was first used in the 1950s and costs far less money than a standard drilling rig, because it can easily be relocated and used for several drillings.
There is a significant difference between shallow water drilling on bottom supported rigs and deep water on floating rigs. Drilling on bottom supported rigs resembles drilling on land and is less complex than drilling on floating rigs or vessels. This is because the drilling process largely determines the machinery and stores on a rig or vessel, and this is far greater on a floating platform.

11
Exploitation
If exploration determines the presence of hydrocarbons and it is economically attractive to extract these from the earth, a production platform is placed to start exploitation of the well. There are several types of production platforms of witch the jacket is the most common. A jacket is a steel structure that is piled into the seabed and has a platform well above the highest wave crests. Other types of platforms are: Compliant towers; Gravity based structures; Tension leg-platforms; Semi-submersible platforms; Spar platforms; Sub-sea installations. After drilling a production well the actual production process starts. This consists of bringing the oil or gas to the surface, transporting it to shore and refining it to an end product. In this thesis, refining is not considered because it’s an on shore process and the focus is on off shore activities.
Production drilling Production drilling is the same operation as explorations drilling, only know it is sure that hydrocarbons are
present and the best location in the field is chosen for the placement of the production platform. There are several types of platforms, as explained above, and they are either floating or non-floating. For deep water offshore operations, non-floating platform are required. Shallow water operations usually have a non-floating platform, which is more stable than a floating one.
Production Production of oil and gas is process from bringing the product from the underground reservoirs to the sales
point. Drilling, both onshore and offshore, forms a major cost and time expense in the development of oil and gas fields, but offshore and especially in deep water may be multiple of land drilling costs. The exploration wells which were used to determine the presence and quality of hydrocarbons are not used for production, because their position in the field isn’t optimized for flow. Therefore a number of so called development wells are drilled, mostly vertical or even horizontally. For both well types, the drilling technology is identical, the difference starts with the well completion, when one or more tubes are lowered into the cased hole and the casing is perforated to provide access for the reservoir fluids to the hole.
Transportation There are basically two ways of transporting the oil and gas to shore. First is a pipeline, but is often
commercially or technically impossible, because of the temperature that is needed to keep the oil liquid. Second is the use of vessels, the oil and gas is then transported by shuttle tankers, this is the most common used method.
Decommissioning
Like all marine constructions, an offshore oil platform also has an economical or technical lifetime. Regardless of the reason, if one of these lifetimes has come to an end the structure has to be removed. The easiest way is to abandon the platform and leaf it to the elements, or to destroy it with explosives and let it sink to the sea floor. This was a common method in former timer, but nowadays with increasingly stringent environmental regulations most governments demand that the platform is decommissioned properly to minimize the damage to the environment. This process can be done by heavy lift semi-submersible cranes, which are also used during hook-up. Momentarily the Dutch offshore company Allseas is working on the world’s first purpose built decommissioning vessel, which is able to remove old production platforms in an economically efficient way.

12
1.1.2 Offshore (support) vessels
Offshore oil and gas winning is dependent on a variety of vessels supporting the different processes. An
overview of the processes and vessels is given below.
Figure 1, Offshore oil and gas processes and supporting vessels

13
Seismic research vessels
Seismic research vessels are specialized ships, purpose-built for seismic survey of the ocean floor, often characterized by a wide stern. Streamers containing hydrophones are towed behind the vessel. While the vessel works a grid at a steady speed, an air gun generates sound waves directed towards the seabed. Echo’s retuning from the seabed are detected by the hydrophones and recorded for further analyses. These recordings are used to map the seabed and detect deeper layers in the earth’s crust.
PSV’s and AHTS
The Platform Supply Vessel (PSV) and Anchor Handling Towing Supplier (AHTS) are the workhorses of the industry. They are characterized by a superstructure on the bow and a long, low freeboard aft deck to transport containers, anchors, chains etc. The vessels are used to supply platforms with all kind of supplies like equipment, powdered products for the drilling process like cement and bentonite, but also fuel and fresh water. Equipment is stored on the aft deck, while other products are stored below deck in dedicated tanks. In case of an AHTS the vessel has a large towing winch aft of the superstructure to hoist and move the anchors of a platform.
Crew transportation vessels
This are small high speed vessels used to bring relieve crews and small supplies to offshore platform. They are used for short daily trips only and mostly in benign areas like the Gulf of Mexico and Lake Maracaibo. On the North Sea, helicopters are mostly used to perform crew changes.
Accommodation jack-ups and semi submersibles/vessels (flotels)
During hook-up a lot of temporary crew like welders, electricians and fitters work on the platform. It wouldn’t be logical to provide accommodation for these workmen on the production platform itself and waste valuable space. Therefore mobile crew accommodation is provided in the form of a jack-up in shallow waters and semi-submersibles (flotels) in deeper waters. These structures are placed alongside and connected to the production platform by a walk bridge. In case of a flotel a telescopic bridge is used to compensate the relative motions between the platform and the floating structure.
Repair and maintenance jack-ups, semi’s
Special designed jack-ups and semi submersibles are used to repair and do maintenance of offshore platforms. These platforms often have a large accommodation area to provide accommodation for the platform’s crew. Other distinct features are usually a large crane with a wide reach and sometimes a diving system with a decompression chamber, so special deep sea divers can do inspection and repair at great depths.
ROV support vessels
Nowadays a lot of subsea installation, inspection and maintenance is done by remotely operated vehicles or ROV’s instead of divers. These ROV’s are operated from a vessel through an umbilical which is connected to both the vessel and ROV. Vessel used for these operations are called ROV support vessels and have a crane or A frame for launching and recovery of the ROV, often through a moon pool.
Heavy lift cranes For the installation of jacket platforms a floating crane in needed for lifting and positioning the jacket,
driving piles, deck structures and modules containing for example the living quarters. Hook-up at sea is very expensive, so pre assembly of modules on shore will gain a lot of money. The size of these floating cranes has increased in time together with the increasing size of the platforms. The first heavy lift floating cranes had a mono hull ship-shaped floater with a large crane at the aft of the vessel, leaving deck space for the transportation of equipment. This design was due to a limited breadth of the vessel very sensitive to sea motions and because positioning a module on a jacket is a very precise and subtle job, the weather frame especially on the North Sea was limited. More recent crane vessels are semi submersibles and have the virtue of a large breadth, so the weather downtime was decreased significantly.
The design of a semi-submersible crane vessel is a compromise between a high GM for slewing under load
and a preferred low GM for the rolling behavior of the vessel. This can be problem can be solved by using an active healing system that can move ballast water quickly to prevent healing without the need of a high GM. Modern crane vessels like the Balder and Hermod use this system.

14
Pipe laying vessels
When there is a need for a pipeline from an offshore structure or well you need a pipe laying vessel. There are basically two different techniques of pipe laying, J-lay and S-lay. Reeling or J-lay, is used for small pipes up to about 19” in diameter. The standard 12m pipe lengths are joined together on shore and spooled into a reel, which is later unreeled onto the sea floor. This technique forms less horizontal tension on the pipe than S-lay and is therefore preferred for deep-water applications. J-lay vessels are characterized by a large reel on deck, which can be unreeled amidships under and angle of about 45 degrees. S-lay requires a long vessel with a pipe assembly line onboard, where the 12 meter sections of up to 60” are assembled and lowered as a continues pipe onto the sea floor. S-lay vessels are characterized by the large stinger on the front or aft of the vessel that guides the pipe from the vessel to the bottom.
Well stimulation vessels
This are dedicated vessels used for cleaning and stimulation production wells. There are only a limited number of vessels in the world and only a few companies who offer this specialized work. The vessels have a laboratory onboard, high pressure pumps for fracturing rock and tanks for chemicals.
Trenchers and rock dumpers
To protect or thermally isolate pipelines it is possible to bury the pipeline. In some areas like the North Sea it is even required the bury pipelines up to 16” in diameter. Two types of vessel are needed for this process, a trencher and a rock dumper. Trenchers use several techniques to make a trench like water jets, mechanical cutting with cutters or chain cutters, ploughs and cutter-suction dredgers. Each technique requires a different kind of vessels which aren’t discussed in this thesis. If the trench is made a rock dumper, which is a large vessel due to the amount of rocks needed, covers the trenched pipeline with rocks. The rocks are dumped through a fall pipe, often with thrusters at the end to precisely maneuver the fall pipe over the trench.
Semi sub transport vessels
To transport large modules or complete offshore units like jack-ups or semi submersibles special ships have been built, which can submerse to some 10-12 meter water above deck. The loading and unloading operation is always performed in calm waters due to the high risk of the procedure. When fully submersed, only the forecastle and the aft funnels of the vessel remain above the water. Once emerged the vessel can support huge loads and has sufficient initial stability. Only the dynamical stability is limited due to the low freeboard of the vessel, however the load (e.g. a semi-submersible platform) adds to the stability at large rolling angles. The vessels are characterized by a large breadth, superstructure at the front and the funnels at the aft. The design is governed by stability considerations, the ballast tanks have to be subdivided in such a way that free surface effects during (de)ballasting are limited. The deck has to be able to handle high local loads and the hull has to have sufficient collapse resistance to be submersed.
Diving support vessels
The first diving support vessels were built in the 1960s, until than diving operations were performed from mobile oil platforms or vessels like pipe-layers and crane barges. Because the deck space of an oil platform is very valuable and the expectation of continuing diving operations is low, specialized ships for diving operations emerged. Key components of a diving support vessel are dynamic positioning to maintain a position without the use of anchors and a saturation diving system. This system is used for diving operations in deep water. Below 50m divers use a mixture of helium and oxygen to eliminate the narcotic effect of nitrogen under pressure. The divers are lowered trough a moon pool in the bottom of the vessel to the site in a diving bell. Besides these two systems, diving support vessels often have a ROV and also heavy lifting equipment onboard.

15
Construction support vessels
Construction support vessels or CSV’s are generally significantly larger (size between 110-160 meters in length) and more specialized than other offshore support vessels and are principally used to support complex deep water sub-sea construction, installation, maintenance, repair decommissioning and other sophisticated operations. CSVs also support remotely operated vehicles (ROV’s), diving activities, well intervention, platform decommissioning and other complex construction operations. Generally, AHTSs and CSVs command higher day rates than PSVs due to their larger relative size and versatility, as well as higher construction and operating costs.
Main tasks of a construction support vessel are: Support in pipe laying; burial and the installation of
flowlines; laying control umbilical’s as an umbilical lay vessel; installation of distribution pipelines and subsea connections; monitoring of Touch Down Point (TDP); subsea preparation.

16
1.1.3 Inspection Repair and Maintenance
The goal of Inspection, Repair and Maintenance (IRM) is to maximize the economic returns from an
offshore field development by optimizing the production available from a reservoir. The practice extends throughout the whole life of the field and encompasses the offloading of production reserves, integrity monitoring of risers and seabed settlement monitoring.
IRM activities are conducted in an on-going program of inspection, repair and maintenance. Vessels require subsea positioning for divers and ROVs undertaking surveys whilst dedicated well stimulation vessels require wireless control of bespoke tooling deployed to revitalize production from ageing wells.
Vessel tasks: Pipeline inspection, repair and maintenance
Cable inspection, repair and maintenance
Structure inspection
Emergency response
ROV operations
Repair and maintenance of subsea systems
Equipment transportation
General repair operations
IRM vessel comparison A few modern IRM vessels are listed in the table below
Vessel name
Loa [m]
B [m]
T [m]
D [m]
Crane ROV Moonpool Deck area [m²]
Personnel Speed [kn]
Acercy Petrel
76.45 15 - 8.8 27t AHC Yes Yes 350 50 11.5
Acercy Viking
98 20 7.3 9.6 100t AHC Yes Yes 770 60 16
Acercy legend
64.8 18.9 4.1 5.03 30t and 40t A-frame
Yes No 450 54 10
Island Enforcer
122.4 23 6 100t and 200t
Yes Yes 1100 120 17
Seisranger 85 20 6.56 10 50t and 40t A-frame
Yes Yes 520 69 14
Table 1, IRM vessels
An analysis of the vessels in table 1 shows that IRM vessels have a crane for (subsea) hoisting operations;
launch and recovery systems (LARS) for ROV operations; a moonpool; working deck area and a large accommodation. Figure 2 is a photo of the Acercy Viking and shows the typical lay-out of an IRM vessel.
Figure 2, Modern IRM vessel

17
1.2 Initial requirements / Design criteria FIRM
Next to the market analyses and IRM vessel comparison there is a set of initial requirements for the
concept vessel, which will form the design criteria of the vessel. The requirements are limited leaving space to design any kind of vessel that meets these requirements and is practical for the purpose of the vessel. The list below sums up the requirements as set by Damen for this project
Basic function of vehicle 1. Required dead-weight, volume and area’s
600 m² deck area;
600 ton deck load, CoG 1m above deck;
Approximately 1450 ton max deadweight. 2. Required speed
To be at least 25 knots maximum speed. 3. Dynamic Positioning
DP 2 notation;
Sea state 4/5;
North sea area, (JONSWAP spectrum);
30kn wind speed;
2kn current;
H1/3 2,5m, with a period of (7-11) seconds. 4. Range of vessel and operational profile
Endurance 30 days i. 5% full speed (25 knots)
ii. 15% cruising speed (15 knots) iii. 70% DP iv. 10% Harbor
5. Special tasks
ROV operations, fully enclosed LARS (Launch And Recovery System);
Lifting operations, Offshore crane, 100 ton at 15m and 30 ton at 3000m depth AHC (Active heave Compensation);
Subsea inspection, repair and maintenance operations;
Transport of supplies and crew to offshore production platforms;
Emergency response 6. Passengers and level of luxury
+- 70 personnel
Maximum of 2 persons per cabin 7. Maneuverability
Dynamic Positioning capabilities
Economic environment 1. Goods to be carried
Supplies for oil and gas platforms
Equipment
Containers 2. Added value of speed or other specific vehicle qualities
Use high speed to arrive quickly at the site to save money and time. 3. Possible unique selling points of vessel
Significant higher speed than current Inspection Repair and Maintenance vessels 4. Available budget
No restrictions

18
Crew 1. Number
19 2. Level of luxury
Western European standard
Sailing area 1. Traffic intensity
North/Norwegian sea 2. No limitations of main dimensions by means of canals, locks, harbors etc. 3. No wash and wake limitations 4. Sailing limitations due to wind are allowed
All of the requirements for the FIRM can be related to the IRM vessels in table 1, except the speed
requirement that stands out. It can be concluded that the vessel distinguishes itself from other IRM vessels due to the requirement to sail at 25 knots.
1.3 Design questions:
In addition to the design criteria a series of design questions are formulated. The answer to these
questions will help in the design process of the concept vessel.
Hull form design. How to get both speed and stability? Enough space to fit all the equipment?
Resistance calculation, which method can best be applied?
How to get a good approximation of the lightweight of the vessel?
Which stability rules have to be complied to?
How will the vessel behave in seaway?
Choice of propulsion system, how much power is needed for maximum speed and dynamic positioning?
Which type of crane is most suitable for subsea hoisting operations?
1.4 Concepts
Two possible concept vessels have been investigated for this project. At first a mono-hull concept, current
IRM vessels are all mono-hulls and this is therefore the most obvious option for this vessel. The mono-hull is based on a fast displacement hull form and is described in chapter 2. The second option is a catamaran, because catamarans are known for their high speeds and good transverse stability. Catamarans haven’t been applied as IRM vessels yet and little is known about the applicability for this purpose, making it a unique design.

19
2. Design mono-hull concept
This chapter describes the design process of the mono-hull concept. First the choice of hull form and hull
form design are described, followed by calculations concerning resistance; propulsion; weight; hydrostatics; stability; seakeeping and dynamic positioning.
It should be mentioned that the design of a vessel is an iterative process in which many aspects of the design are done parallel to each other. To make this report clearly the different parts of design are ordered by chapter, this should not always be taken as the chronological order of the total design process.
2.1 Choice of hull form type and linesplan
Most IRM vessels are set to sail at low speeds (10 to 16 knots maximum) and are able to use a hull form
with a high block coefficient and low L/B value, which is beneficial for the space onboard. For this design we had to look for a hull form that is suitable to sail at 25 knots. Considering the speed range of the vessel a decision had to be made to use a displacement, semi-displacement or maybe even a planing hull-form. The so-called Telfer Coefficient (Telfer 1963) is considered to be a convenient method to compare resistance data for different types of vessels.
Below a graph is shown for a number of vessel types versus the Froude number. It can be seen that a displacement hull form shows superior resistance characteristics over planning and semi-displacement hull forms up to a Froude number of FN = 0.45. For Froude numbers over FN = 0.45, semi-displacement and fully planning hulls perform better, in this area the wave making resistance becomes far too high for a displacement vessel.
Figure 3, Typical curves of CTL for a displacement hull, a semi-displacement hull and a fully planing hull. Reprinted
from ”Motor yacht hull form design for the displacement to semi-displacement speed range,” by Perry van Oossanen, Justus Heimann, Juryk Henrichs and Karsten Hochkirch, 2009, p631.
20
Preliminary layout and main dimensions assessment The main particulars of this vessel are based on a few requirements. First the vessel has to be large enough
to meet the requirements and fit all equipment and personnel. Second the vessel has to be able to reach the speed of 25 knots and be stable enough for crane operations.
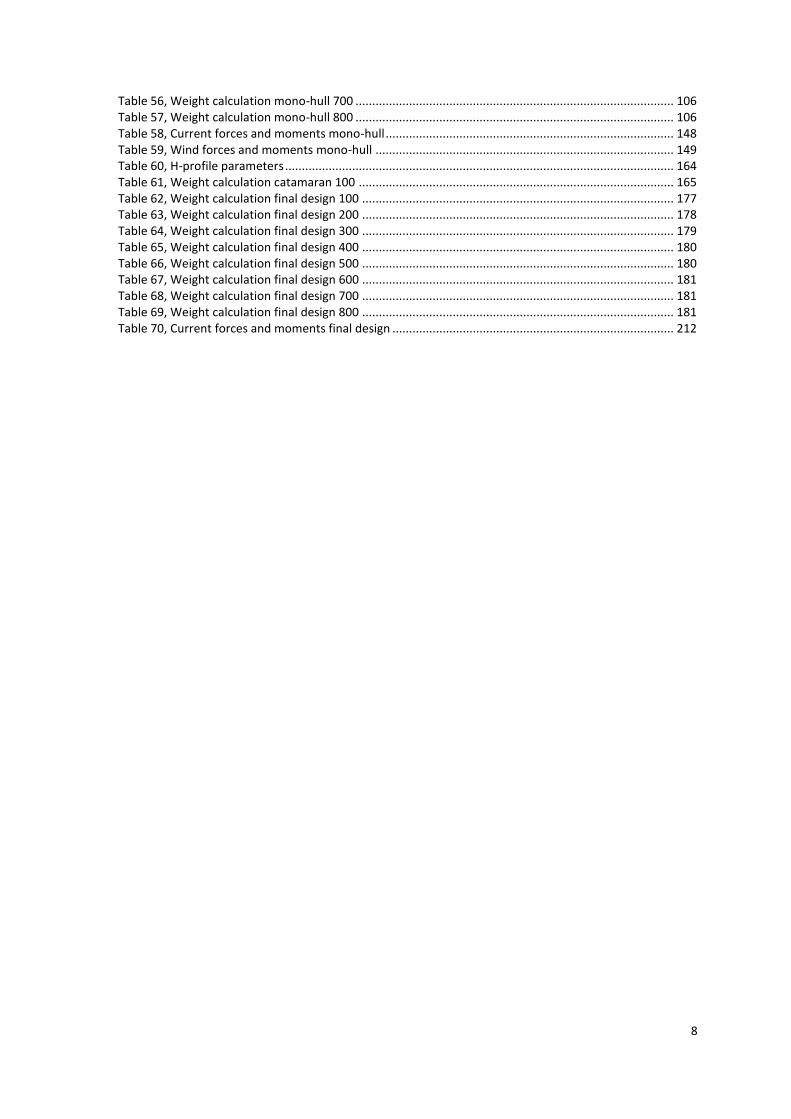
The basic layout (side view) of the vessel is given in figure 4, which is based on other IRM vessels like the ones in table 1. The hull up to the main deck is divided into three decks, the tanktop, a tween deck and the main deck. The superstructure of the vessel is located in front of the working deck area. The superstructure consists of the ROV hangar and deployment system, accommodation (together with offices and other facilities) and bridge deck.
Figure 4, Basic layout IRM vessel
A preliminary deck layout which is given in table 2 gives an impression of the subdivision of the ship’s
compartments. At the main deck the 600 m2 of deck area is situated aft of the superstructure. The
superstructure includes a bridge and three decks for mostly accommodation space, 70 personnel and 19 crew members require about 2225 m
2 of accommodation space. This includes all spaces like cabin space, mesh
rooms, etc. 25 m2 per person is a rule of thumb used at Damen to estimate accommodation space in a
preliminary design stage. The ROV hangar with the deployment davit and the moonpool is a large installation which covers three
decks, main- A- and B-Deck (the moonpool also takes up space below the main deck) over a length of approximately 20 meters. This system should be located around the CoG of the vessel where the ship motions are lowest. It is therefore placed between the accommodation area and the work deck of the vessel.
Deck Compartments/spaces/equipment
Tanktop Tanks, ballast water; fuel oil; fresh water Engine room Bowthruster room Moonpool
Tween deck Tanks, ballast water; fresh water Engine room Switchboard room ECR Workshop(s) Steering gear room Moonpool
Main deck Work deck Accommodation space (+-30%) ROV deployment system Moonpool Crane
A-Deck Accommodation space (+-30%) ROV deployment system
B-deck Accommodation space (+/-20%) ROV deployment system Life boats
C-Deck Accommodation space (+/-20%) Life boats
Bridge Table 2, Deck layout
21
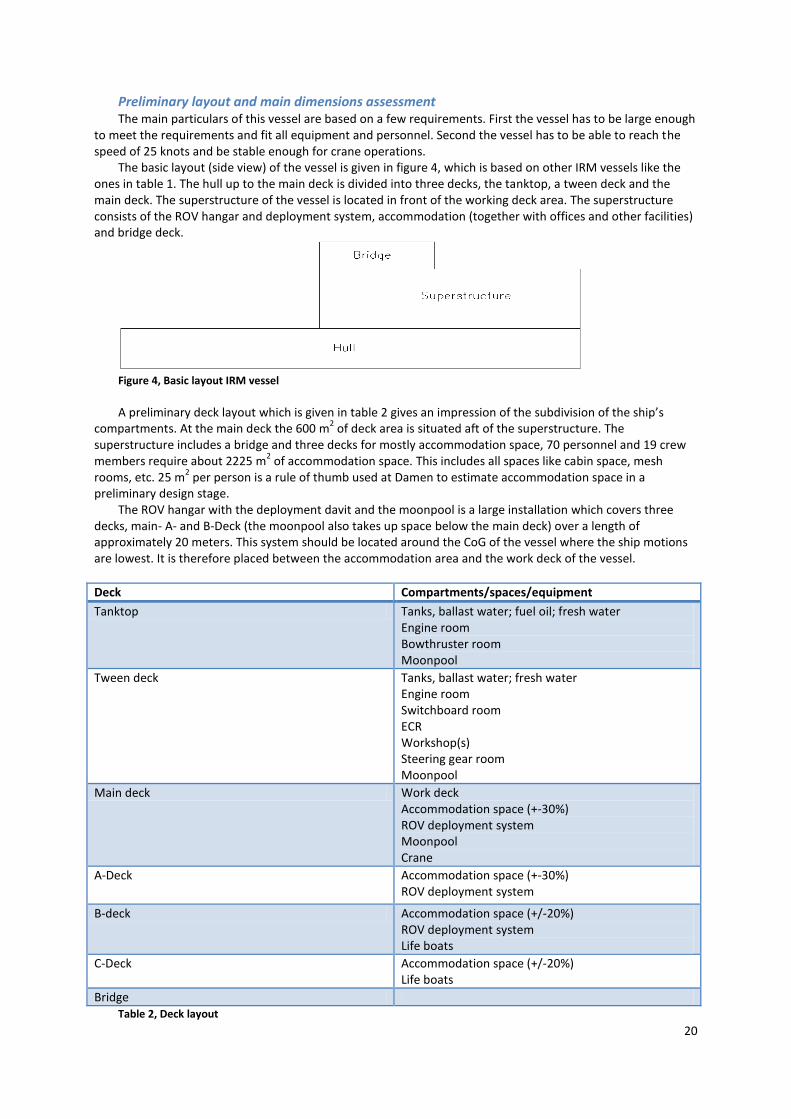
Figure 3 showed that displacement vessels are superior to semi-displacement vessels up to a Froude number of FN =0.45. For a speed of 25 knots the waterline length at this Froude number is 83 meters, below this length a semi-displacement vessel is better, above this length a (fast) displacement vessel is the better choice.
An analysis of the main deck layout in figure 5 leads to a rough estimate of the minimum length of the vessel. The average breadth of the vessel is set at 15 meters, this is based on the vessels in table 1 and compensates for the lost space in the forward section of the vessel and cargo rails at the aft.
Figure 5, Basic layout main deck
This first assessment indicated that the waterline length of the vessel would be over 83 meters and a (fast)
displacement hull form is most suitable for this concept.

22
2.1.1 Marwood and Bailey hull
The decision for a (fast) displacement hull form lead to two possibilities, a hard chine or a round bilge hull.
Significant research has been carried out regarding the advantages and disadvantages of round bilge and hard chine hull forms by Bailey (1974) and Blount (1995 and 2009). Blount stated that from a seakeeping point of view, round bilge hulls are supposed to be superior at displacement speeds, but at semi-displacement speeds there is no consensus about the superiority of round bilge or hard chine hulls. This same conclusion is drawn by Keuning (1984). An advantage of a hard chine hull is the lower building costs compared to a round bilge. However the savings are minimal compared to the total costs of such a vessel and better seakeeping performances are considered far more important. Considering the above a round bilge hull has been adopted for this design.
The initial linesplan was based on a Marwood and Bailey type vessel, which is a round bilge high speed
displacement hull form, suitable for speeds ranging from FN 0.3 to 1.2. In 1969 Marwood and Bailey published test results of a systematic series of 22 models, carried out at the Ship Division of the British National Physical Laboratory. In this series L/B and B/T values were varied, other main hull parameters were kept constant, see table 3. Figure 8 displays the linesplan which was used as a parent for this concept design, throughout the design process this parent has evolved into the hull form which will be discussed in chapter 2.2.2.
Figure 6, Linesplan Marwood and Bailey parent hull form Distinctive parameters Marwood and Bailey systematic series are:
Fixed parameters
CB 0.4 [-]
CP 0.69 [-]
CX 0.57 [-]
LCB/L 0.44 fwd. AP [-]
LE/L 0.60 [-]
Variable parameters
FnL, L, L/B, B/T, L/1/3, ie [-]
Table 3, Parameters Marwood and Bailey parent hull form
23
2.2.2 Linesplan
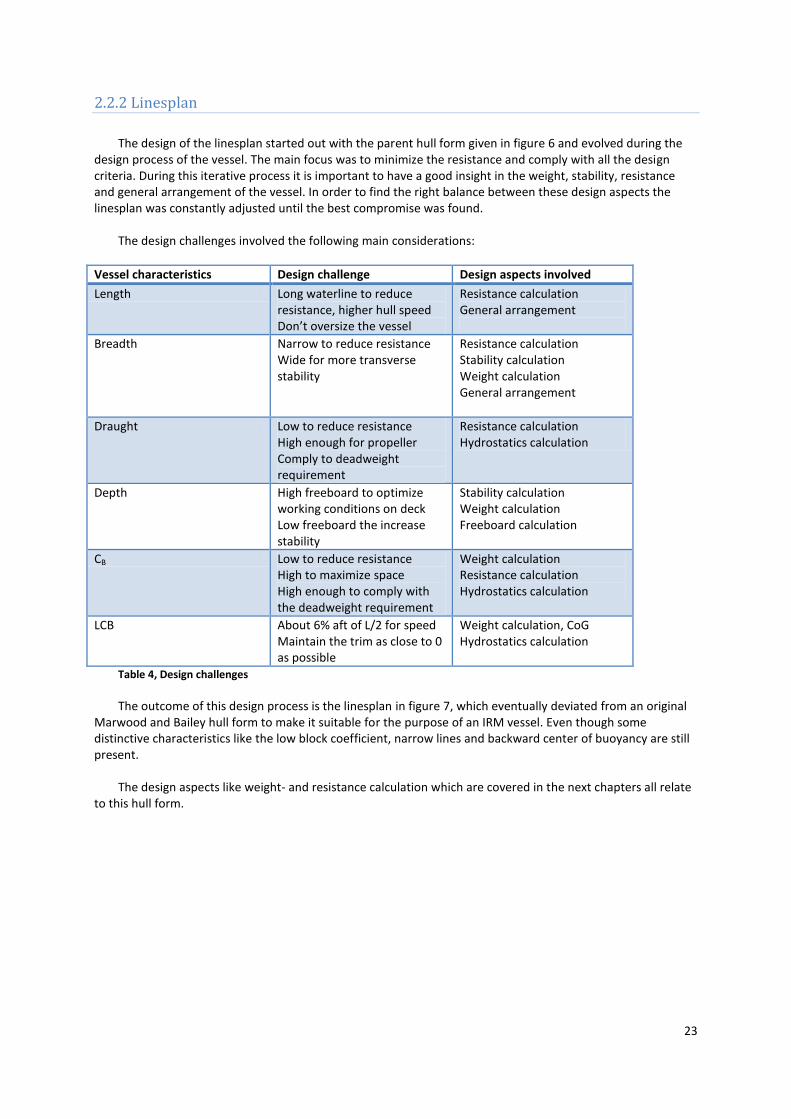
The design of the linesplan started out with the parent hull form given in figure 6 and evolved during the
design process of the vessel. The main focus was to minimize the resistance and comply with all the design criteria. During this iterative process it is important to have a good insight in the weight, stability, resistance and general arrangement of the vessel. In order to find the right balance between these design aspects the linesplan was constantly adjusted until the best compromise was found.
The design challenges involved the following main considerations:
Vessel characteristics Design challenge Design aspects involved
Length Long waterline to reduce resistance, higher hull speed Don’t oversize the vessel
Resistance calculation General arrangement
Breadth Narrow to reduce resistance Wide for more transverse stability
Resistance calculation Stability calculation Weight calculation General arrangement
Draught Low to reduce resistance High enough for propeller Comply to deadweight requirement
Resistance calculation Hydrostatics calculation
Depth High freeboard to optimize working conditions on deck Low freeboard the increase stability
Stability calculation Weight calculation Freeboard calculation
CB Low to reduce resistance High to maximize space High enough to comply with the deadweight requirement
Weight calculation Resistance calculation Hydrostatics calculation
LCB About 6% aft of L/2 for speed Maintain the trim as close to 0 as possible
Weight calculation, CoG Hydrostatics calculation
Table 4, Design challenges
The outcome of this design process is the linesplan in figure 7, which eventually deviated from an original
Marwood and Bailey hull form to make it suitable for the purpose of an IRM vessel. Even though some distinctive characteristics like the low block coefficient, narrow lines and backward center of buoyancy are still present.
The design aspects like weight- and resistance calculation which are covered in the next chapters all relate
to this hull form.

24
Main particulars
Loa 120 [m]
Lpp 116 [m]
Lwl 115 [m]
B 19 [m]
Tdesign 6 [m]
D 8 [m]
Displacement, at Tdesign 6256 [t]
Cb 0.4462 [-]
Cp 0.642 [-]
Wetted area 2288.2 [m²]
Waterplane area 1715.3 [m²]
LCB -4.347 % Table 5, Main particulars mono-hull concept
The complete list of the hull properties can be found in Appendices I.
Figure 7, Linesplan mono-hull concept

25
2.2.3 Preliminary general arrangement plan
The preliminary general arrangement plan for the vessel is given below, the lines follow from the hull form
of Chapter 2.2.2. Figure 8 and 9 give a top view of the preliminary deck arrangement. This is still a basic layout to check if all systems and compartments will fit. The total available space for accommodation and deck area comply with the requirements given in Chapter 1.2.
Figure 8, Tanktop, Tween deck and Main deck
Figure 9, A- B- C- and Bridge deck

26
2.2 Resistance calculation
The hull form design is derived of a systematic series of hull forms which have been tested in a model
basin, the Marwood Bailey series. Therefore it seems to be logical to use this data for the resistance prediction of the concept vessel. However due to alterations to the hull-form, fixed parameters like for instance CB and LCB, deviate from a standard Bailey hull. Making this a hull form that has a lot of resemblance with a Bailey hull, but doesn’t meet the exact requirements and therefore another method has been used to predict the resistance of the vessel.
In the past a number of methods have been developed of which the method of Holtrop and Mennen is probably the best known. J. Holtrop and G.G.J. Mennen have developed a resistance prediction method through regression analyses of random model experiments and full scale data. The method uses a subdivision of the total resistance in several components:
1
1
(1 )
Frictional resistance according to the ITTC-1957 formula
(1 ) Form factor describing the viscous resistance of the hull form in relation to
Resistance of ap
total F APP W B TR A
F
F
APP
R R k R R R R R
R
k R
R
pendages
Wave-making and wave-breaking resistance
Additional pressure resistance of bulbous bow near the water surface
Additional pressure resistance of immersed transom stern
Model-ship corr
W
B
TR
A
R
R
R
R elation resistance
The summation of these individual resistance components forms the total resistance of the vessel. For the
entire method and explanation of the calculation of the resistance components we refer to the publication of Holtrop and Mennen (1982/1984). This method has been implemented into an Excel sheet to quickly calculate the resistance of the concept.
The reason to use this particular method for the concept vessel is because the hull form characteristics fit into applicability area and its past proven accuracy.
Midship coefficient between 0.5 and 1.0
Lwl/B between 3.5 and 9.5
LCB between -5% and +5% wrt L/2
CP between 0.40 and 0.93
Fn Up to 0.45 Table 6, Holtrop and Mennen applicability area

27
Results The resistance curve of the vessel in for a speed range between 12 and 25 knots is given below.
Figure 10, Resistance mono-hull concept
0,00
200,00
400,00
600,00
800,00
1000,00
1200,00
12 13 14 15 16 17 18 19 20 21 22 23 24 25
Re
sist
ance
[kN
]
Speed [kn]
Total resistance V Rtotal
[knots] [kN]
12 147
13 176
14 209
15 250
16 297
17 353
18 429
19 520
20 609
21 684
22 755
23 842
24 964
25 1139

28
2.3 Power speed analyses and propulsion system
With the resistance prediction and speed requirement one can calculate the required power of the vessel
by starting at the propeller side of the propulsion train. For this concept a diesel direct propulsion system with open propellers is chosen. A diesel direct system is more efficient and cheaper than a diesel electric system and open propellers are most suitable for the speed range. The power speed calculation for this concept is considered to be basic but sufficient for this stage of the vessel design.
The effective power (PE) or required thrust is calculated by multiplying the speed (in m/s) with the resistance (kN). The desired break power (PB) and amount of propellers is calculated by taking efficiency losses into account for the propeller, shaft and gearbox. Values for the efficiencies follow from the book of Klein Woud and Stapersma (2002).
After the calculations the main engines and gearboxes are chosen which are suitable for this propulsion concept. The reason to choose a specific engine and gearbox in this early design stage is primarily for the weight calculation in Chapter 2.6. Finally a schematic overview of the complete propulsion system is given to give a visual impression.
Effective power The effective power versus the speed is displayed in figure 11.
Figure 11, Effective power mono-hull concept
Propellers The maximum propeller diameter of the design is 4 meters. In propeller design the aim is always to keep
the propeller diameter as large as possible to lower the propeller load, which results in lower fuel consumption and less power needed for propulsion.
Damen has developed a set of guidelines for maximum propeller load, based on the diameter of the
propeller; these guidelines are used to determine the amount of propellers. For practical reasons (efficiency, vibrations, noise) it is recommended that larger displacement vessels should not exceed ca. 400 kW/m², which is shaft power (PS) divided by the diameter squared. The maximum propeller load is to some extend related to the Damen Standard blade area ratio’s AE/A0. With higher blade area ratio’s, higher propeller loads can be allowed to some extent. However, higher propeller loads at low speed will generate less tons thrust per kW. Damen standard creates an acceptable efficiency combined with acceptable noise and vibration levels.
0
2000
4000
6000
8000
10000
12000
14000
16000
12 13 14 15 16 17 18 19 20 21 22 23 24 25
Effe
ctiv
e p
ow
er
[kW
]
Speed [kn]
Pe
Mono-hull

29
Assuming an estimated propulsive efficiency of 0.65 and shaft efficiency of 0.98: PE = 15000 kW PS = 23500 kW
Number of propellers:
2
2
Max prop load = 400
Max propeller diameter = 4
max 400 4 6400
235003.67
6400
S
kW
mm
P kW
The minimum amount of propellers is 4.
Power calculation main engines. To determine the total break power of the main engines we consider a basic diesel direct concept with
four shaft lines, four main engines and reduction gear. The calculation below deals with a maximum speed of 25 knots at trial condition.
Given a shaft loss of 2%, a gearbox loss of 3% and propulsive efficiency of 0.65
15000
0.65
0.98
0.97
For one shaftline:
( / 4)5770
58880.98
6070 (shaft and gearbox losses included)0.97
24280
E
D
S
GB
EP
D
PS
SB
B
P kW
PP kW
PP kW
PP kW
P total kW
PB
0.97 6070
PP
0.65 5770
PE
Efficiency [-] - Power [kW] 3750
Gearbox Main engine
PS
0.98 5887
Figure 12, Schematic overview propulsion power and efficiencies

30
Main engines Four diesel engines, with a minimum power of 6070kW each are required according to the power
calculation. The Wärtsila 9L38 is a medium speed diesel engine with 6525kW output and suitable for this concept.
Make Wärtsila
Type 9L38
Output 6525kW
Speed 600 rpm
Specific fuel consumption 176 g/kWh
Weight 72 ton Table 7, Main engines mono-hull
Gearbox 4x single in, single out Wärtsila SCV85, weight 14.5 ton each.
Propulsion system layout
The propulsion system layout is given in a sketch in figure 13. This figure shows one shaft line and the electrical system together with the bow and stern thrusters. The main components of the propulsion system and power generating system are listed below:
4 main engines 4 shaft lines 4 gearboxes 4 propellers 2 Bow thrusters 2 Stern thrusters 4 generator sets 1 Emergency generator set
Figure 13, Schematic overview propulsion system mono-hull
Main engine
Drive
Electrical network
Generator sets
Bow and stern thruster(s)
Gearbox

31
2.4 Auxiliary Systems and electric load balance
The schematic overview in the past chapter already showed generator sets which are needed to provide
power to the auxiliary systems. An electric load balance leads up to the total amount of power which is needed. In this load balance the main consumers are listed, together with a post “hotel load” which covers all small consumers.
For this basic load balance we consider a DP condition, with a crane operation. In this condition all relevant consumers should be able to be turned on at full power at the same time. Because the tunnel thrusters and crane are the main electrical consumers, the amount of power that has to be installed for this condition is considered to be sufficient for all other conditions as well.
Load balance Three main consumers are listed in table 8. The power for the hotel load is based on a comparable Damen
vessel. The power for the tunnel thrusters is the maximum power needed for station keeping, calculated in Chapter 2.10 (DP calculations mono-hull). The power needed for the crane is based on the technical tender document from Cargotec for a knuckle boom crane which complies with the crane requirements stated in Chapter 1.2. The complete tender for the crane with all the specifications can be found in Appendices XXIII.
Consumer Power
Hotel load 500 kW
Crane 1661 kW
Tunnel thrusters 5400 kW
Total 7561 kW Table 8, Main consumers mono-hull
Generators
Based on the electric load balance a set of generator sets is chosen to provide the electrical power for the vessel. Two large generators and two smaller ones are installed which allows the operator to switch between different settings, based on the amount of power needed at the time. The emergency generator set for the vessel is given in table 11, it is mandatory to have one onboard according to class.
Make Wärtsila Type 8L20 Output 1405 ekW Speed 900-1000 rpm Specific fuel consumption 185g/kWh Weight 20.7 t Table 9, Auxiliary generator sets mono-hull 1 (2x)
Make Wärtsila Type 8L26 Output 2495 ekW Speed 900-1000 rpm Specific fuel consumption 184g/kWh Weight 45 t Table 10, Auxiliary generator sets mono-hull 2 (2x)
Make Caterpillar Type C18 Output 547 ekW Speed 1800 rpm Specific fuel consumption 133.2 l/h Weight 1.9 t Table 11, Emergency generator set mono-hull

32
2.5 Tank capacity
The tank capacity calculation involves the main consumables, fuel oil and fresh water, which are needed to
comply with the endurance requirement of 30 days operation and contributes to two aspects of the vessel design. First of all does the outcome give an insight of the size of the fuel oil and fresh water tanks, which have to be taken into account in the tank arrangement. Second it contributes to the deadweight requirement of the vessel. This being a conceptual design we only consider main consumables and sewage capacity which are the largest tanks, other small tanks like for instance lubrication oil and sludge tanks are left outside the scope.
Fuel capacity The fuel oil capacity is related to the operational profile of the vessel. The specific fuel consumption of the
engines is based on data given by the engine manufacturer, 175g/kWh for the main engines and 185g/kWh for the auxiliary generator sets. The amount of kW’s used per operational state are based on the power speed curve and DP analyses.
Operational profile: Endurance 30 days, 24 hours per day
5% full speed (25 knots)
15% economical speed (14 knots)
70% Dynamic Positioning
10% Harbor
Operational state Percentage of time Fuel consumption Full speed 5% 160 ton Economical speed (14 knots) 15% 57 ton Dynamic Positioning 70% 420 ton Harbor 10% 2 ton Total 100% 639 ton Table 12, Fuel consumption mono-hull
Fresh water capacity
The capacity of the fresh water tanks is calculated for 89 persons, 19 crew members and 70 special personnel. The consumption per person is set at 135 liters per day, which is based on standard Damen figures. The range is the same as previously mentioned in the fuel oil capacity calculation, 30days. A fresh water generator with a capacity of 12000 L/day is installed and taken into the calculation. This means that the fresh water generator can generate the same amount of water per day as the maximum amount of water that will be used by crew and passengers. To create a buffer the fresh water tank capacity is set at 100 m³ which is sufficient to provide water to all persons onboard for over a week.
Total fresh water capacity: 100 m³
Sewage capacity
The sewage tank is calculated for 4 days with maximum amount of crew and special personnel. A sewage treatment plant is necessary to minimize the size of the sewage tank. The amount of sewage per person onboard per day is equal to the amount of fresh water used, 135 liter.
Sewage tank capacity: 50 m³ Sewage treatment plant capacity: 12000 L/day

33
2.6 Weight calculation
The weight estimation is used to determine the center of gravity and the light ship weight of the vessel.
The center of gravity of the vessel is essential for other calculations like stability, dynamic positioning and seaway. The light ship weight plus the required deadweight has to equal the displacement at a certain draft, if this is not the case the designer has to alter the vessels geometry, and it is therefore essential to make a reliable weight estimation.
There are many methods developed to estimate the steel weight of the vessel. These methods can be very useful if the designer has no or little information about weights of comparable vessels. Damen Shipyards has built a lot of vessels of all kinds in the past and has therefore a database of “as built” vessel weights which are very accurate. Based on this information the company had established weight factors for all kinds of vessels. This means that the steel weight of the vessel is estimated by multiplying the volume with a weight factor (kg/m³).
Besides the steel weight of the hull and superstructure, other components like for instance the main engines are listed and accumulated to the bare hull weight. Also the positions of the components in the vessel are taken into account to calculate the CoG. Most of the components have known weights, others like for instance piping are taken as a percentage of the total equipment weight which uses the piping. The percentage is again based on experience within the company.
Eventually all individual weights are summed up and will form the total light ship weight, for safety a margin of 5% is taken over the total weight. This 5% margin is the result of experience with previously built vessels, most of the time the actual weight of the vessel turns out to be higher than the original estimation. The center of gravity of the vessel is the result of the sum of all the separate components, again for safety a margin of 30cm is added to the vertical center of gravity (VCG), stability calculations are made with this safety margin.
To verify the method with weight factors the steel weight estimation method of Westers, which is a weight estimation method for the early design stage, is used.
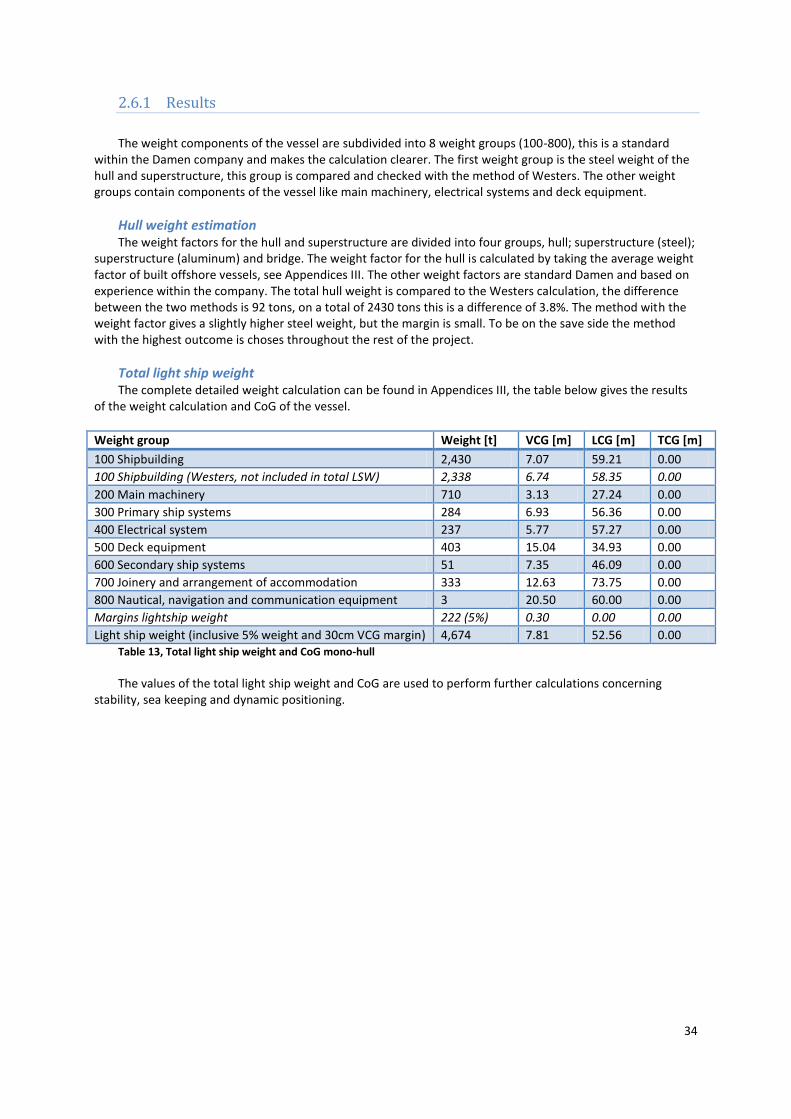
34
2.6.1 Results
The weight components of the vessel are subdivided into 8 weight groups (100-800), this is a standard
within the Damen company and makes the calculation clearer. The first weight group is the steel weight of the hull and superstructure, this group is compared and checked with the method of Westers. The other weight groups contain components of the vessel like main machinery, electrical systems and deck equipment.
Hull weight estimation The weight factors for the hull and superstructure are divided into four groups, hull; superstructure (steel);
superstructure (aluminum) and bridge. The weight factor for the hull is calculated by taking the average weight factor of built offshore vessels, see Appendices III. The other weight factors are standard Damen and based on experience within the company. The total hull weight is compared to the Westers calculation, the difference between the two methods is 92 tons, on a total of 2430 tons this is a difference of 3.8%. The method with the weight factor gives a slightly higher steel weight, but the margin is small. To be on the save side the method with the highest outcome is choses throughout the rest of the project.
Total light ship weight The complete detailed weight calculation can be found in Appendices III, the table below gives the results
of the weight calculation and CoG of the vessel.
Weight group Weight [t] VCG [m] LCG [m] TCG [m]
100 Shipbuilding 2,430 7.07 59.21 0.00
100 Shipbuilding (Westers, not included in total LSW) 2,338 6.74 58.35 0.00
200 Main machinery 710 3.13 27.24 0.00
300 Primary ship systems 284 6.93 56.36 0.00
400 Electrical system 237 5.77 57.27 0.00
500 Deck equipment 403 15.04 34.93 0.00
600 Secondary ship systems 51 7.35 46.09 0.00
700 Joinery and arrangement of accommodation 333 12.63 73.75 0.00
800 Nautical, navigation and communication equipment 3 20.50 60.00 0.00
Margins lightship weight 222 (5%) 0.30 0.00 0.00
Light ship weight (inclusive 5% weight and 30cm VCG margin) 4,674 7.81 52.56 0.00 Table 13, Total light ship weight and CoG mono-hull
The values of the total light ship weight and CoG are used to perform further calculations concerning
stability, sea keeping and dynamic positioning.

35
2.7 Hydrostatics
The hull form, light ship weight and deadweight requirement are now known. This chapter sums up all the
components to display if the vessel complies with the deadweight requirement. The results are presented in table 14.
HYDROSTATICS LCG VCG
Light ship weight (incl margin) 4,674 t 52.56 7.81 m
Deadweight
Deck cargo 600 t 23.00 9.00 m
Fuel oil 639 t 62.28 4.40 m
Fresh water 100 t 96.18 5.43 m
Sewage 50 t 55.00 1.75 m
Crew and stores 15 t 75.00 14.00 m
Total 1404 t 47.78 6.45 m
Displacement (wanted) 6,078 t
LCB VCB
Available displacement (T = 6.00 m) 6,253 t 52.19 3.81 m
Margin 175 t
Table 14, Hydrostatics mono-hull
The results show a margin of 175 ton, which can be used as ballast water to adjust the trim of the vessel. A
complete list of the vessel hydrostatics for several drafts is given in Appendices IV.

36
2.8 Stability calculations
Because of safety requirements the vessel has to comply with stability regulations, which are divided into
intact and damage stability calculations. The requirements vary with the type and purpose of a vessel, this concept vessel has to comply to the intact stability code for vessels with a large B/H ratio and with the code for special purpose ships (SPS2008) for damage stability because of the number of special personnel onboard. The consequence of the SPS2008 code is that we have to cope with probabilistic damage stability calculations instead of deterministic calculations. These calculations are extensive, especially during this stage of the design process. To make sure the vessel will comply with probabilistic calculations a simple method is developed based on minimum G’M values of the loading conditions.
Additional to the intact and damage stability calculations and because the vessel has to handle high loads and makes use of counter ballast, a “Loss of load” calculation is made. The rules regarding this matter are not mandatory and only Det Norske Veritas (DNV) have made a set of regulations which are given in Appendices VI.B.
2.8.1 Intact stability calculations
The concept vessels have to apply to standard stability criteria for vessels with a large B/H value. These
criteria are used for all offshore vessels designed at Damen, and consist of the General intact stability criteria for all ships (IMO Resolution A.749(18)), with addition of IMO’s A.562 weather criteria and a maximum statical angle restricted by deck immersion, see table 15. For the calculations a wind pressure of 51.40 kg/m² is used.
Intact Stability Code for vessels with a large B/H ratio
Criterion
Minimum metacentric height G'M 0.150 meter
Maximum GZ at 30 degrees or more 0.200 meter
Top of the GZ curve at least at 15.000 degrees
Area under the GZ curve up to 30 degrees 0.055 mrad
Area under the GZ curve between 30 and 40 degrees 0.030 mrad
Maximum angle of inclination acc. to IMO's A.562 weather criterion 50.000 degrees
Maximum statical angle due to wind 16o or 0.8*angle
of deck immersion, whichever is less.
degrees
Maximum statical angle 80% of angle of deck immersion 0.8*angle of deck immersion
degrees
Table 15, Intact stability criteria
The stability calculations are made with PIAS. This requires a transformation of the hull form into PIAS, a
tank arrangement, light ship weight and CoG of the vessel and definition of the openings. An overview of the tank arrangement is given in figure 16. The light ship weight and CoG of the vessel follow directly from the weight calculation.
A set of loading conditions is made for the most common and most extreme cases the vessel will have to cope with during its lifespan.
1.1 Ballast condition Tdesign = 6m
2.1 Departure 100% consumables
2.2 Arrival 10% consumables
3.1 Departure 100% consumables 600t deck load, 1m above main deck
3.2 Arrival 10% consumables 600t deck load, 1m above main deck
4.1 Crane operation 100t@15m, Departure 100% consumables (heel compensated)
4.2 Crane operation 100t@15m, Arrival 10% consumables (heel compensated) (Note: 100t@15m means 100t at 15m outreach of the crane, this is 20.5m out of the centerline of the ship).

37
RESULTS The extensive results of the intact stability calculations can be found in Appendices VII, below in table 16 a
summary of the results is given.
Condition Tmean [m]
Trim [m]
Min G’M [m]
Max GZ [m]
Top GZ [degrees]
Area under GZ up to 30
0
[mrad]
Area under GZ between 30
0 and
400 [mrad]
Max angle of inclination [degrees]
Max. stat. angle [degrees]
1.1 6.000 0.026 3.430 1.352 51.040 0.368 0.206 25.731 1.833
2.1 5.605 0.036 3.138 1.090 51.466 0.325 0.173 26.405 2.310
2.2 5.173 -0.268 2.970 0.938 52.475 0.302 0.155 28.763 2.876
3.1 5.983 -0.017 3.017 1.032 48.589 0.313 0.164 27.225 2.097
3.2 5.768 0.055 2.879 0.905 49.017 0.292 0.148 27.421 2.373
4.1 5.969 -0.279 2.644 0.741 44.956 0.260 0.124 29.537 2.405
4.2 5.747 -0.411 2.657 0.698 45.885 0.260 0.120 29.493 2.585 Table 16, Intact stability calculation mono-hull results The vessel complies with all the intact stability criteria. It is notable that the G’M values are high for this
kind of vessel, this could lead to high transvers accelerations which is unpleasant for crew and passengers.
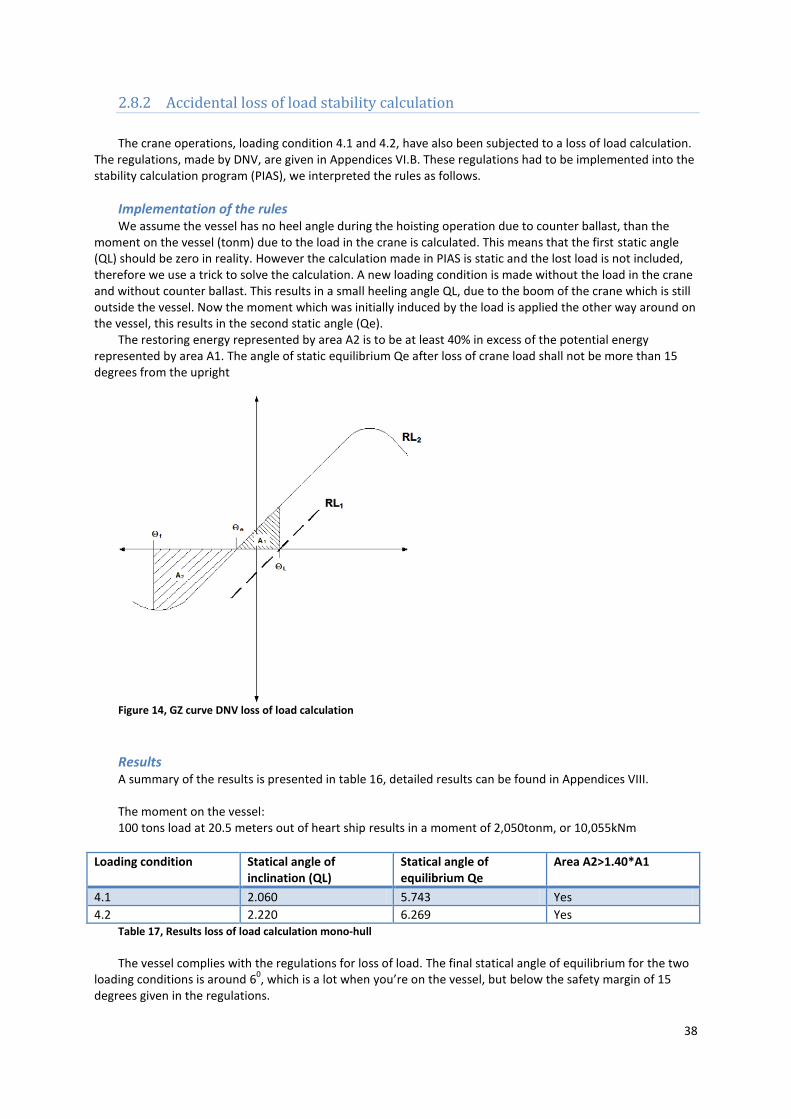
38
2.8.2 Accidental loss of load stability calculation
The crane operations, loading condition 4.1 and 4.2, have also been subjected to a loss of load calculation.
The regulations, made by DNV, are given in Appendices VI.B. These regulations had to be implemented into the stability calculation program (PIAS), we interpreted the rules as follows.
Implementation of the rules We assume the vessel has no heel angle during the hoisting operation due to counter ballast, than the
moment on the vessel (tonm) due to the load in the crane is calculated. This means that the first static angle (QL) should be zero in reality. However the calculation made in PIAS is static and the lost load is not included, therefore we use a trick to solve the calculation. A new loading condition is made without the load in the crane and without counter ballast. This results in a small heeling angle QL, due to the boom of the crane which is still outside the vessel. Now the moment which was initially induced by the load is applied the other way around on the vessel, this results in the second static angle (Qe).
The restoring energy represented by area A2 is to be at least 40% in excess of the potential energy represented by area A1. The angle of static equilibrium Qe after loss of crane load shall not be more than 15 degrees from the upright
Figure 14, GZ curve DNV loss of load calculation
Results A summary of the results is presented in table 16, detailed results can be found in Appendices VIII. The moment on the vessel: 100 tons load at 20.5 meters out of heart ship results in a moment of 2,050tonm, or 10,055kNm
Loading condition Statical angle of inclination (QL)
Statical angle of equilibrium Qe
Area A2>1.40*A1
4.1 2.060 5.743 Yes
4.2 2.220 6.269 Yes Table 17, Results loss of load calculation mono-hull The vessel complies with the regulations for loss of load. The final statical angle of equilibrium for the two
loading conditions is around 60, which is a lot when you’re on the vessel, but below the safety margin of 15
degrees given in the regulations.

39
2.8.3 Damage stability calculations
One of the requirements of the vessel is to accommodate 70 special personnel. A consequence of this
requirement is that the vessel has to comply with the code of safety for special purpose ships 2008 (SPS 2008), which requires probabilistic damage stability calculations. Because of the extensive nature of these calculations they are not yet done in this stage of the design process. To be sure the vessel will comply with these regulations in the future we developed a simple method based on the G’M values of the loading conditions and experience with these calculations.
It is mandatory for probabilistic calculations make a G’M limit curve, based on the loading conditions. The graph, given in figure 15, shows the G’M values for all loading conditions versus the draft of the vessel for that specific loading condition. Probabilistic damage stability calculations are performed for three drafts of the vessel, the lightest service draft; the design draft and a condition at 60% between the two previous drafts. For each of these drafts the minimum G’M is determined using the G’M limit curve. Experience with probabilistic damage calculations tells us that the minimum G’M value for this kind of vessels should be higher than 1.5 meter. If this is the case the vessel layout can be assigned in such a way that it will comply with the regulations
Figure 15, G'M limit curve mono-hull
Condition Tmean G'M
Lightest service draft (dl) 5.215 3.220
Partial subdivision draft (dp) 5.686 3.000
Deepest subdivion draft (ds) 6.000 3.300 Table 18, Drafts and G'M values for probabilistic damage stability calculation
For all three drafts the G’M value is significantly higher than 1.5 meters, therefore it should comply with
the regulations of the SPS code for damage stability.
2,400
2,600
2,800
3,000
3,200
3,400
3,600
5,000 5,200 5,400 5,600 5,800 6,000 6,200
G'M
Mean draft
G'M Limit Curve for multiple trims
Loadcases
G'M limit curve

40
2.8.4 Tank arrangement
This is the tank arrangement and vessel contour used for the stability calculations.
Figure 16, Tank arrangement mono-hull

41
2.9 Seakeeping
The seakeeping behavior of the concept vessel is predicted using the computer program OCTOPUS, which
uses strip theory. The reason to use this method is because it has proven to be very accurate for slender bodies, like this concept vessel, and it can deliver results quickly. A short background on strip theory can be found in Appendices IX.
2.9.1 Approach and criteria
In order to get results regarding the see keeping characteristics of the concepts vessel there are a few
steps that need to be taken within the program. Because these steps give a better insight of the calculations, but aren’t very important for this thesis, they are only covered shortly.
Import hull model into Octopus. The hull model made in DelftShip is imported to Octopus as a .dxf file and later meshed. Only the part of the hull below the waterline is used, because strip theory only deals with this part of the hull. Besides the actual hull form also all the parameters of the hull like main dimensions and displacement are entered.
Calculate RAO’s. The program than calculates the Response Amplitude Operators (RAO’s) for all ship motions and for several speeds and headings.
Simulate waves. There are a few possibilities to simulate the waves that encounter the vessel, both regular and irregular. It was decided to specify a the sailing area (North- and Norwegian- sea) and use the corresponding wave scatter diagram to simulate the situation as accurate as possible.
Specify points on the vessel to calculate motions, velocities and accelerations. As a result of the sea keeping calculations we want to know the magnitude of the motions, velocities and accelerations at a certain point on the vessel. One can imagine that for instance vertical accelerations at the bow are higher than at the bridge which is closer to the CoG.
Determine operability by use of criteria set by Nordforsk (1987). In the 70’s a group of Norwegian scientists at Marintek have determined a set of criteria for ship motions which are still used today. These criteria give a maximum acceleration or motion for a certain space on the vessel and type of work done at that space. A copy of the paper can be found in Appendices X. These criteria are used to determine the operability of the vessel for the given region expressed in a percentage of the total operating time.
Visualize results. After the calculation is made and the motions and accelerations of the vessel for a variety of speeds at the given points are known the results are plotted in the wave scatter diagram. This shows the maximum significant wave height for a certain wave period in which the vessel can still operate.
Note: The calculations can be considered conservative because all possible headings are taken into account
which means that the worst possible heading will give the outcome of the operability. In practice a captain has, and most certainly will also use, the ability to change course in order to avoid the worst scenario.

42
2.9.2 Results
The results of the sea keeping calculations are visualized in a table and a graph per operational state,
dynamic positioning; transit speed and full speed. The table shows the criteria and location for which the criterion is calculated. Example, “Vert. acc. Rms, FP” means the Rms (root mean square) value of the vertical acceleration at the bow. The limit for this criterion as set by Nordforsk is given in the second column and the third column describes the type of work that should be possible at this position, which is also normative for the limit. Finally the last column shows the possible operability of the vessel as a percentage of the total operating time.
The graph visualizes the limiting criteria vs the wave scatter diagram which was used for the calculations. This gives a good impression of the critical significant wave height and period for this vessel.
Operability limiting criteria FIRM DP (0 knots) Limit Description Operability Vert. acc. Rms, FP 0.15g Heavy manual work 99.00% Vert. acc. Rms, Bridge 0.15g Merchant vessel criteria 100.00% Lat. Acc. Rms, Bridge 0.12g Merchant vessel criteria 84.00% Roll rms 4 deg Heavy manual work 57.00% Slamming, bow, crit prob 0.01 Merchant vessel criteria 97.00% Deck wetn. Crit. Prob. 1/3L 0.05 Merchant vessel criteria 63.00% Deck wetn. Crit. Prob. 1/2L 0.05 Merchant vessel criteria 64.00% Vert. acc. Rms. 1/3L 0.15g Heavy manual work 95.00% Vert. acc. Rms. 1/2L 0.15g Heavy manual work 95.00% Lat. Acc. Rms. 1/3L 0.07g Heavy manual work 99.00% Lat. Acc. Rms. 1/2L 0.07g Heavy manual work 99.00% Vert. acc. Rms. Accommodation 0.15g Merchant vessel criteria 93.00% Lat. acc. Rms. Accommodation 0.12g Merchant vessel criteria 98.00%
Table 19, Operability mono-hull, 0 knots
Figure 17, Operability mono-hull, 0 knots
0
1
2
3
4
5
6
7
8
9
10
11
12
13
14
15
3 4 5 6 7 8 9 10 11 12 13 14
Hs [m]
Tz [s.]
motion operability
Bow (Z-Acc) 99%
Bridge (Z-Acc) 100%
Bridge (Y-Acc) 84%
Roll Motion 57%
Bowslamming 97%
1/3L (Z-Mot) 63%
1/2L (Z-Mot) 64%
1/3L (Z-Acc) 95%
1/2L (Z-Acc) 95%
1/3L (Y-Acc) 99%

43
Operability limiting criteria FIRM transit (15 knots) Limit Description Operability Vert. acc. Rms, FP 0.2g Light manual work 84.00% Vert. acc. Rms, Bridge 0.15g Merchant vessel criteria 100.00% Lat. Acc. Rms, Bridge 0.12g Merchant vessel criteria 82.00% Roll rms 6 deg Light manual work 87.00% Slamming, bow, crit prob 0.01 Merchant vessel criteria 84.00% Deck wetn. Crit. Prob. 1/3L 0.05 Merchant vessel criteria 65.00% Deck wetn. Crit. Prob. 1/2L 0.05 Merchant vessel criteria 66.00% Vert. acc. Rms. Accommodation 0.15g Merchant vessel criteria 88.00% Lat. acc. Rms. Accommodation 0.12g Merchant vessel criteria 99.00%
Table 20, Operability mono-hull, 15 knots
Figure 18, Operability mono-hull, 15 knots
0
1
2
3
4
5
6
7
8
9
10
11
12
13
14
15
3 4 5 6 7 8 9 10 11 12 13 14
Hs [m]
Tz [s.]
motion operability
Bow (Z-Acc) 84%
Bridge (Z-Acc) 100%
Bridge (Y-Acc) 82%
Roll Motion 87%
Bowslamming 84%
1/3L (Z-Mot) 65%
1/2L (Z-Mot) 66%
Acco 2/3L (Z-Acc) 88%
Acco 2/3L (Y-Acc) 99%

44
Operability limiting criteria FIRM transit (25 knots) Limit Description Operability Vert. acc. Rms, FP 0.2g Light manual work 69.00% Vert. acc. Rms, Bridge 0.15g Merchant vessel criteria 93.00% Lat. Acc. Rms, Bridge 0.12g Merchant vessel criteria 81.00% Roll rms 6 deg Light manual work 89.00% Slamming, bow, crit prob 0.01 Merchant vessel criteria 77.00% Deck wetn. Crit. Prob. 1/3L 0.05 Merchant vessel criteria 65.00% Deck wetn. Crit. Prob. 1/2L 0.05 Merchant vessel criteria 65.00% Vert. acc. Rms. Accommodation 0.15g Merchant vessel criteria 75.00% Lat. acc. Rms. Accommodation 0.12g Merchant vessel criteria 100.00%
Table 21, Operability mono-hull, 25 knots
Figure 19, Operability mono-hull, 25 knots
The results show that the rolling motions at DP and deck wetness are the major limiting factors for the
operability. At DP the captain is often not able to adjust the heading of the vessel due to the proximity of a platform. The low operability for transit and full speed due to vertical accelerations can be assigned to bad headings and can most of the time be corrected by intervention of the captain. The lateral accelerations at transit also contribute to a decline of operability, this is most likely the result of the high G’M of the vessel.
0
1
2
3
4
5
6
7
8
9
10
11
12
13
14
15
3 4 5 6 7 8 9 10 11 12 13 14
Hs [m]
Tz [s.]
motion operability
Bow (Z-Acc) 69%
Bridge (Z-Acc) 93%
Bridge (Y-Acc) 81%
Roll Motion 89%
Bowslamming 77%
1/3L (Z-Mot) 65%
1/2L (Z-Mot) 65%
Acco 2/3L (Z-Acc) 75%
Acco 2/3L (Y-Acc) 100%

45
2.10 Dynamic positioning
The operational profile indicates that the vessel will be at DP for 70% of the time. It is therefore necessary
to investigate the environmental forces on the vessel in order to determine the amount, size and power of the transverse tunnel thrusters. In Appendices X.A a short overview of the theoretical background on dynamic positioning is given.
The best way to calculate the environmental forces on a vessel is to perform model tests or make 3D diffraction calculations at zero speed. Both of these recourses where unavailable, making it impossible to come up with the right transfer functions for the mean second order wave drift forces. This meant that one of the three environmental forces couldn’t be calculated. The other two, wind and current, could be estimated to certain accuracy. Based on these two forces it was possible to make an estimation of the required thruster power by adding 20% for the unknown wave drift forces.
2.10.1 Calculation of forces and moments
The results of the forces and moments calculation for current and wind are listed below, the complete
detailed calculation can be found in Appendices X.B.
Current The current force (FC) is calculated with Bernoulli’s law, the moment induced by this force MC is a result of
the force times the distance from L/2.
21( )
2 C D C CF dX v AC M F n dX
The velocity v of the current was set in Chapter 1.4 at a speed of 2 knots. The cross section of a vessel varies over its length, in order to define the right drag coefficient (CD) the
vessel has been subdivided into sections dX of 5 meter in length and the drag coefficient per section is determined. Various shapes have been tested in the past and the CD value of a certain (2D) shape for a certain Reynolds number can be read from a graph. The mono-hull concept has an ellipse shape and the corresponding CD coefficient per section depends on the ratio B/2T (see Appendices). The determined CD coefficients for this vessel are given in figure 20.
Figure 20, Cd coefficients mono-hull
The current force and moment on the vessel are calculated for a 90
0 heading, the reason to look only at
this heading is that 900 is in most cases the worst possible heading and the worst case is decisive for the
thruster choice. Calculating other headings requires other CD coefficients which is a time-consuming effort and not relevant for this case.
0,00
1,00
2,00
3,00
0 10 20 30 40 50 60 70 80 90 100 110 120
CD [
-]
Vessel length [m]
CD coefficients
Cd

46
Wind Wind forces on the lateral plane of the vessel (90
0 heading), at the design draft T=6m, are also calculated
with Bernoulli. The CD coefficient is determined at 1.2 and the wind speed is given in Chapter 1.2 (30 knots). See Appendices X.B for the complete calculation.
21
2W DF v AC
The vessel has been subdivided in the same way as for current calculations, the vessel contour with subdivision of the section is given in figure 21.
Figure 21, Contour mono-hull

47
Results The forces and moments for wind and current are visualized in the graphs below. It shows the force on the
vessel induced by wind and current at a specific part on the vessel. It becomes clear that the force on the front is larger than the force at the aft of the vessel. This corresponds to the expectation one has when looking at the vessel contour.
Figure 22, Forces on mono-hull
Figure 23, Moments on mono-hull
0,00
5,00
10,00
15,00
20,00
25,00
30,00
35,00
40,00
45,00
50,00
0 10 20 30 40 50 60 70 80 90 100 110 120
Forc
e [
kN]
Vessel length [m]
dF current [kN] dF wind [kN] Total force
-1000,00
-500,00
0,00
500,00
1000,00
1500,00
2000,00
2500,00
0 10 20 30 40 50 60 70 80 90 100 110 120
Mo
me
nt
[kN
m]
Vessel length [m]
M current [kNm] M wind [kN] Total moment

48
2.10.2 Thruster forces and static equilibrium
The environmental forces on the vessel have to be counteracted by the vessels thrusters. We use a static
approach of the problem and calculate the amount of thrust by finding a static equilibrium; the sum of the force and moment on the vessel has to be 0. Table 22 shows the total applied environmental force and moment on the vessel.
Forces wrt COG
waves current wind total
Fx 0 0 0 0 kN
Fy 0 322 235 557 kN
Mz 0 5984 3292 9276 kNm
Table 22, Environmental forces and moments mono-hull
Figure 24, Thrust vectors mono-hull Figure 25, Orientation forces, moments and heading
-80
-60
-40
-20
0
20
40
60
80
-20020
Thrust vectors
Ship
tun1
tun2
tun3
tun4
prop1
prop2
prop3
prop4

49
Thruster forces: Because we only look at an incoming angle of 90
0 for both current and wind there is no thrust delivered by
the main propulsion. The amount of power installed to reach 25 knots is considered to be more than sufficient for station keeping in the X direction. The 5400kW installed for bow- and stern thrusters is used for 80% in this situation and leaves 20% margin for mean wave drift forces.
actual min max
Thrust tunnel 1 -154.6 -191.3 191.3 kN -81%
Thrust tunnel 2 -157.1 -191.3 191.3 kN -82%
Thrust tunnel 3 -121.6 -153 153 kN -79%
Thrust tunnel 4 -122.1 -153 153 kN -80%
Total applied power 4457 0 30600 kW 15%
Table 23, Thruster forces mono-hull
The propulsion configuration will be: 4x Propellers with rudders for forward and backward thrust 6300kW each 2x Bow thruster 1500kW each 2x Stern thruster 1200kW each

50
3. Design catamaran concept
This chapter describes the design process of the catamaran concept. The structure of the chapter is similar
to the previous in which the mono-hull design was described. The methods used in the design of the catamaran are similar to the methods used for the mono-hull, unless otherwise indicated, and are therefore not described and substantiated in this chapter.
A multi-hull design like a catamaran has several positive characteristics that are favorable for the FIRM
concept. Catamarans have a larger breadth compared to mono-hull vessel, this leads to a lower overall length and higher transverse GM of the vessel. The hull forms are usually slim, have a large L/B ratio and are therefore able to reach high speeds. These characteristics make it possible to design a smaller vessel in length if compared to a similar mono-hull vessel. A disadvantage of catamaran vessels is the lower deadweight capability.
In this chapter a design for a FIRM catamaran is made to investigate the possibilities of a multi hull for this concept. The final catamaran design is than compared to the mono hull design and a choice is made between the two concept vessels.

51
3.1 Catamaran comparison and main dimension estimation
A catamaran design of an IRM vessel currently does not exist; all known IRM vessels and comparable
offshore vessels are mono-hulls. The idea to analyze the possibility for a catamaran design is the speed requirement of the vessel, possible good transverse stability characteristics and possible decrease in size. The resistance for conventional displacement vessels steeply increases beyond a certain point which usually corresponds with FN=0.4, which is close to the FN of the previous mono-hull design. This suggests that for this vessel and speed the mono-hull design is still in the good area. A catamaran has a larger breadth than a mono-hull and can therefore be smaller in length and will operate at higher Froude numbers for the same speed. The resistance hump that mono-hulls experience when sailing over FN=0.40 is attributed to the generation of increasingly large gravity waves in the free surface. Catamarans minimize the waves generated in the free surface by having extremely slender hulls.
Catamarans as mono-hull vessels can be categorized in displacement, semi-displacement and planning
types. The type of vessel depends on the Froude number the vessel operates at. For low to moderate Froude numbers (FN<0.7) catamarans tend to be of displacement form. In this region the phenomenon of destructive interference is of great importance, which is particularly severe for Froude numbers between 0.3<FN<0.4 and should be avoided. For higher Froude numbers (FN>0.7) catamarans generate dynamic lift and become semi-displacement or planning vessels. To get an impression of the region this vessel is in the Froude numbers for a range of waterline lengths for the top speed of 25 knots is plotted in figure 26.
Figure 26, Catamaran Fn vs Lwl
A quick interpretation of the graph and knowledge above shows that the concept design will likely be a
displacement catamaran with a maximum waterline length of 100 meters. Above 100 meters the vessel enters the region of destructive interference and only below a waterline length of 35 meters, which is very small for the purpose, the catamaran becomes a semi-displacement craft.
0,30
0,35
0,40
0,45
0,50
0,55
0,60
0,65
0,70
0,75
30 50 70 90 110
Fn
Lwl
Vs=25 knots

52
Catamaran comparison analyses A wide range of catamarans used for different purposes and lengths ranging from 30 up to 125 meters has
been collected and put into a database in order to estimate the main dimensions and other characteristics of the vessel. This database can be found in Appendices XI. In Appendices XI.A a number of trend lines are produced with the data of the catamaran database. These trend lines have been used to determine the design parameters of the FIRM catamaran.
An analysis of the data resulted in the following findings:
All catamarans in the database sail at a higher maximum speed than the speed required for the FIRM, resulting in higher Froude numbers.
The majority of the catamarans are semi-displacement hull forms.
Only 5 have a higher deadweight capability than 1000 ton and none of the catamarans have a deadweight capability as high as the mono-hull design.
Almost all catamarans in the database have water jet propulsion These findings lead to the conclusion that most catamarans are high speed marine craft, designed to
transport people and/or low weight loads. The purpose of the FIRM catamaran is completely different and the design will therefore deviate from most current catamarans. Still the possible advantages of a catamaran as stated in the beginning of this chapter make it worthwhile to design a catamaran concept of the FIRM which can be compared to the mono-hull design.

53
3.2 Determination of main particulars
The initial requirements for the catamaran design are similar to the mono-hull design. The main
requirements which are determinative for the size of the vessel are:
600m² deck area
2225m² of accommodation space
ROV handling system and moonpool
Offshore crane 100t @ 15m
+- 1450 ton deadweight As a design start a few assumptions were made, these assumptions are based on information on
catamaran design, consultation with the Damen Ferries and Damen Research departments and the catamaran database in Appendices XI.
The L/B ratio (for 1 demi-hull) for this catamaran should be chosen between 9 and 12, below 8 results in increased wave making and above 12 are values for racing catamarans (Woods). The Damen database of built catamarans shows L/B ratios between 10 and 13. Initially set at 11.5.
The L/B ratio (for the overall breadth) was initially set at 3.5, based on the trend lines in Appendices XII.A.
The B/T value should be between 1.5 and 2.8; a value near 2 minimizes the friction resistance (Woods). Initially set at 2.
The depth equals the draft plus the significant wave height of 2.5 meter for minimum wet deck clearance and an additional meter for the structure between the demi-hulls. The significant wave height of 2.5m is given in the initial requirements of Chapter 1.2.
The CB value of one demi-hull is initially set at 0.5, based on the trend lines and Damen vessel information. This value can considered being high for a catamaran, however almost all catamarans are semi-displacement vessels and the FIRM catamaran is a displacement vessel with higher deadweight requirements than the comparison vessels.
Initial deck layout The initial deck layout is similar to the mono-hull design. The demi-hulls consist of a tanktop, tween deck
and a main-deck. The superstructure has three decks A- B- and C-deck, mainly used for accommodation. The ROV system and “moonpool” are considered to occupy 20 meters of the vessel’s length, similar to the mono-hull. The moonpool is modeled as a hole in the deck with the same dimensions as the moonpool for the mono-hull design. A sketch of the main-deck layout is made to estimate the main particulars. This sets the overall length and breadth of the catamaran at 85m and 24.3m.
Figure 27, Basic main deck layout catamaran

54
Main particulars In accordance with the ratios the preliminary main particulars for the catamaran would be:
Main particulars
L 85 m
B 24.3 m
T 3.7 m
D 7.2 m
B demi 7.4 m
CB 0.5
Displacement 2380 t Table 24, Initial main dimensions catamaran
This results in a design with a total predicted resistance of 830kN at 25 knots, which is favorable over the
mono-hull design, see figure 28.
Figure 28, Resistance catamaran
However the problem arose that the vessel has far to less displacement for its purpose, see Chapter 3.6 for
the hydrostatics calculation. This is because all known catamarans of this size, which were used to determine the main particulars, have a completely different purpose than the FIRM catamaran. They are mainly light weight high speed ferries, with low deadweight requirements built out of aluminum.
The FIRM catamaran is an offshore vessel constructed out of steel, because it has to perform heavy duty offshore operations alongside platforms. The approximated deadweight requirement is 1450 ton, according to the initial requirements. The lightship weight of the FIRM is far higher than the other catamarans, making the required displacement higher and making this concept vessel a unique case. Therefore the main particulars have to deviate from the ones in table 24, changing some of the ratios given earlier.
In accordance with the basic layout of the main deck the overall length and breadth of the vessel remain
the same. Increasing these parameters would lead to a vessel too large vessel. It was therefore chosen to increase the draft and CB of the demi-hulls to gain displacement. Another option was to increase the breadth of the demi-hulls without increasing the overall breadth of the catamaran. This would bring the demi-hulls closer together which is destructive for the resistance of the vessel due to hull interference.
0
200
400
600
800
1.000
1.200
1.400
10,00 15,00 20,00 25,00 30,00
[kN]
V [kn]
Rtotal

55
3.3 Hull design and lines
The final linesplan and the main particulars of the catamaran are given in table 25 and figure 29. Striking
characteristics of this vessel, compared to other catamarans, are the low B/T ratio and high CB.
Main particulars
Loa 85 [m]
Lwl 85 [m]
Lpp 82 [m]
B demi-hull 7.4 [m]
Boa 24.3 [m]
Tdesign 6.0 [m]
D 9.5 [m]
Displacement, at Tdesign 5270 [t]
CB, Demi-hull 0.68 [-]
L/Boverall 3.5 [-]
L/BDemi-hull 11.5 [-]
B/TDemi-hull 1.23 [-]
Wetted area 2547 [m²]
Waterplane area 1090 [m²]
LCB -1.14 % Table 25, Main particulars catamaran
The complete list of the hull properties can be found in Appendices XII.
Figure 29, Linesplan catamaran

56
3.4 Resistance calculation
Compared to a mono-hull vessel there are far less methods available to predict the resistance of a
catamaran. Within Damen a resistance prediction tool is used, which is based on model test results of Damen catamarans and data of systematic catamaran series. A result of this tool is given in figure 28, where it was used to determine the resistance of a catamaran based on the initial parameters given in Chapter 3.2. Another method which can be used is described by Molland (1994). He tested a series of systematic catamaran models and compared the resistance of the catamaran with the resistance of only 1 demi-hull. This way it is possible to use a program like Holtrop and Mennen to calculate the single hull resistance, multiply is by 2, and use the research of Molland to predict the extra resistance generated by hull interference.
Molland Resistance prediction with the method of Molland (1994) for high speed displacement catamarans. In this
research a number of systematic models were tested. All 10 models have the same prismatic coefficient of CP = 0.693, and are varied by length/displacement (L/
1/3) and breadth/draft (B/T) ratio. The three models that
come closest to the FIRM catamaran are given in table 26, where the parameters are compared to the parameters of the FIRM.
Parameter FIRM catamaran Model 3b Model 4a Model 4b
L/1/3
4.88 6.27 7.4 7.41
B/T 1.23 2 1.5 1.5
CP 0.757 0.693 0.693 0.693
CB 0.68 0.397 0.397 0.397 Table 26, Comparison model catamaran and FIRM catamaran
Table 26 shows that the parameters of the models do not match with the FIRM catamaran and
interpolation between the models is impossible because the FIRM falls outside the range of tested models. Therefore the results of the model tests are used to make an educated guess of the increased resistance due to hull interference, by examining the dimensionless friction coefficient (CT) of the tested models. Table 26 gives the CT coefficients for the three models, for both the mono-hull test and the catamaran test. The coefficients are for a speed of 25 knots, which corresponds to a Froude number of FN = 0.45, and a separation/length (S/L) ratio of 0.2. See Appendices XIV for the complete results of the model tests.
Model CT demi-hull x1000 [-] CT catamaran x1000 [-] Difference [%]
3b 12 16.5 37.5
4a 9.25 12 29.7
4b 9.25 11.7 26.5 Table 27, Resistance coefficients catamaran models
The results show an average increase of 31% of the total resistance coefficient for the catamaran. The CT
values of the model tests are compared to the CT values of the resistance prediction according to the method of Holtrop & Mennen and the Damen catamaran resistance prediction tool, which are presented in table 28.
Method CT x1000
Damen catamaran prediction tool 12.2
Holtrop and Mennen, 1 demi-hull 7.8 Table 28, Total resistance coefficient H&M and Damen resistance prediction tool

57
Results The resistance predictions for the FIRM catamaran according to the three methods are plotted in figure 30.
The red line shows the results of the Damen resistance prediction tool. The blue line is the total resistance according to Holtrop and Mennen for 1 demi hull, multiplied by 2. The green line shows the results of the method of Molland, which is the total resistance according to Holtrop and Mennen multiplied with a correction factor for hull interference.
Figure 30, Total resistance catamaran
Method Resistance at 25 knots [kN]
Holtrop & Mennen 1684
Molland 2184
Damen catamaran resistance prediction tool 2645 Table 29, Total resistance catamaran
Evaluation of resistance results The FIRM catamaran falls outside the applicability area for Holtrop and Mennen and the Damen catamaran
resistance prediction tool, therefore the results in figure 30 should be regarded as estimations. The only correct way to predict the resistance would be by doing model tests. Unfortunately this is not possible, making the estimations above the only reference for the resistance of the catamaran design. The blue line is considered to be the lower boundary and the red line the upper boundary. The total resistance of the FIRM catamaran should lie between these two boundaries.
After studying the research done by Molland it became clear that L/
1/3 is the predominant hull
parameter. If this is increased, the resistance decreases rapidly. This corresponds to the results in figure 28. Unfortunately the FIRM catamaran has a high L/
1/3 ratio due to its deadweight requirements and respectively
high lightship weight. This could be decreased by increasing the length of the vessel. Increasing the length also lowers the Froude number, which is positive for the total resistance coefficient, as is goes down for lower Froude numbers. However an increase of the length would lead to a vessel that is too big for its purpose.
Due to the high uncertainty of the resistance a power speed analyses becomes meaningless. It is
recommended that model tests are performed first before proceeding with this design.
0
500
1000
1500
2000
2500
3000
3500
10 15 20 25 30
Rto
tal [
kN]
Vs [kn]
FIRM Cat
H&M
Cat. res. tool
Molland
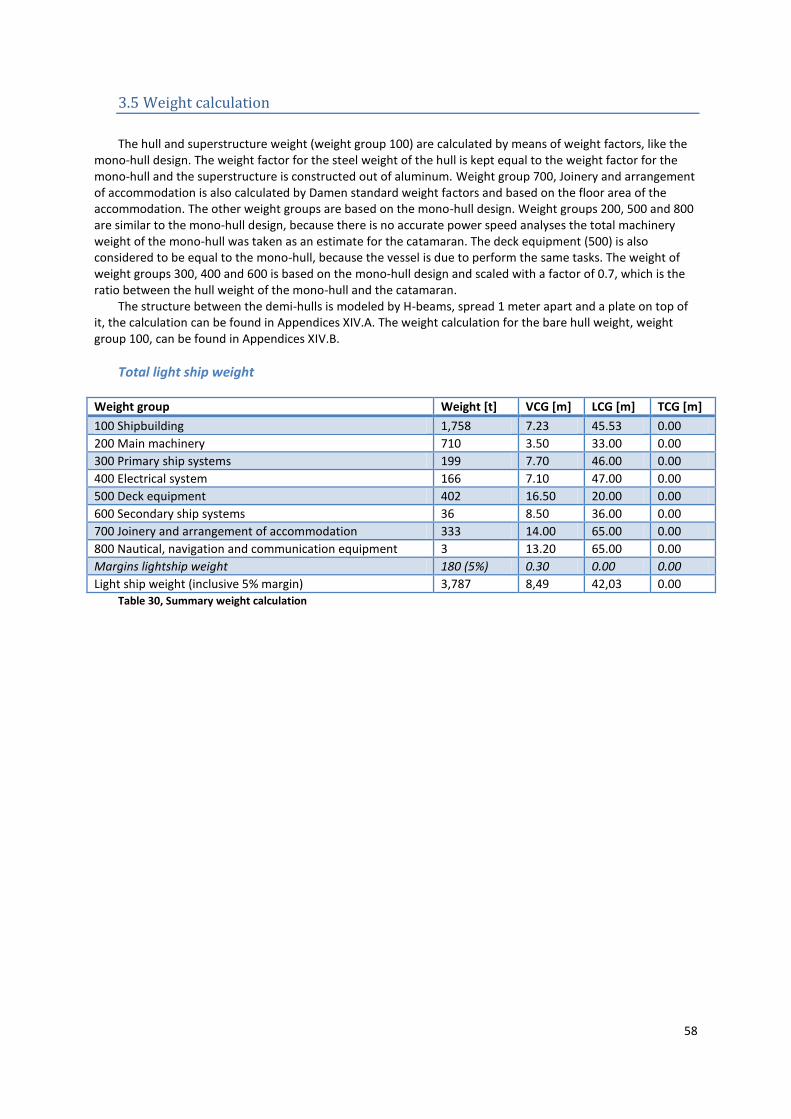
58
3.5 Weight calculation
The hull and superstructure weight (weight group 100) are calculated by means of weight factors, like the
mono-hull design. The weight factor for the steel weight of the hull is kept equal to the weight factor for the mono-hull and the superstructure is constructed out of aluminum. Weight group 700, Joinery and arrangement of accommodation is also calculated by Damen standard weight factors and based on the floor area of the accommodation. The other weight groups are based on the mono-hull design. Weight groups 200, 500 and 800 are similar to the mono-hull design, because there is no accurate power speed analyses the total machinery weight of the mono-hull was taken as an estimate for the catamaran. The deck equipment (500) is also considered to be equal to the mono-hull, because the vessel is due to perform the same tasks. The weight of weight groups 300, 400 and 600 is based on the mono-hull design and scaled with a factor of 0.7, which is the ratio between the hull weight of the mono-hull and the catamaran.
The structure between the demi-hulls is modeled by H-beams, spread 1 meter apart and a plate on top of it, the calculation can be found in Appendices XIV.A. The weight calculation for the bare hull weight, weight group 100, can be found in Appendices XIV.B.
Total light ship weight
Weight group Weight [t] VCG [m] LCG [m] TCG [m]
100 Shipbuilding 1,758 7.23 45.53 0.00
200 Main machinery 710 3.50 33.00 0.00
300 Primary ship systems 199 7.70 46.00 0.00
400 Electrical system 166 7.10 47.00 0.00
500 Deck equipment 402 16.50 20.00 0.00
600 Secondary ship systems 36 8.50 36.00 0.00
700 Joinery and arrangement of accommodation 333 14.00 65.00 0.00
800 Nautical, navigation and communication equipment 3 13.20 65.00 0.00
Margins lightship weight 180 (5%) 0.30 0.00 0.00
Light ship weight (inclusive 5% margin) 3,787 8,49 42,03 0.00 Table 30, Summary weight calculation

59
3.6 Hydrostatics
This is a summary of the hydrostatics at the design draft, an extensive hydrostatics report can be found in
Appendices XV. The deadweight is based on the initial requirements of Chapter 1.2.
HYDROSTATICS LCG VCG
Light ship weight (incl margin) 3787 t 42.03 8.49
Deadweight (approx) 1450 t 42.00 7.75
Displacement (wanted) 5237 t
LCB VCB
Available displacement (T = 6 m) 5270 t 41.53 3.42
Margin 33 t
Table 31, Hydrostatics catamaran

60
3.7 Stability
One of the reasons to design a catamaran concept for the FIRM was the good transverse stability
characteristics of a catamaran. Catamarans are known to be very stable due to the two demi-hulls which are apart from each other, resulting in high GM values. In Appendices XVI a stability calculation is made for a crane operation with the catamaran design, without heel compensation. This loading condition is compared to the crane operation condition (100t @ 15m) of the mono-hull without heel compensation. The results are given in table 32.
Vessel Heeling angle G’M Tmean Trim
Mono-hull 7.53 2.613 5.819 -0.326
Catamaran 2.84 12.055 5.83 -0.011 Table 32, Crane operation heel comparison
Looking at the results it can be concluded that the catamaran is much more stable than the mono-hull and
therefore better suitable to perform crane operations. The catamaran doesn’t need heel compensation and the mono-hull without heel compensation won’t even comply with the stability requirements.

61
4. Selection
In the two preceding chapters the two concept designs of the mono-hull and the catamaran FIRM have
been evaluated. Both vessels have positive and negative aspects. In this chapter these aspects are discussed which leads to a choice of concept. The final concept is than evaluated and improved in Chapter 5.
With the start of this project the reason to design a catamaran concept was the high transverse stability
and high speed of this type of vessel. Looking at the stability this was correct, a catamaran does have a higher GM than a mono-hull and is more stable for crane operations. On the other hand the speed of a catamaran is mostly due to dynamic lift, making it a semi-displacement vessel. Most catamarans are lightweight vessels with a low deadweight requirement. The FIRM catamaran is an offshore vessel with high deadweight requirements and the “high” speed of 25 knots turned out to be a lot slower than most catamarans can go, making it sail at a lower Froude number. Due to the size, weight and speed, making it a displacement catamaran the vessel turned out to have a very high resistance. In Chapter 3.4 the resistance of the catamaran is calculated with three different methods and even with the method that resulted in the lowest resistance (Holtrop and Mennen, without taking hull interference into account) the resistance of the catamaran turned out to be almost 50% higher than the mono-hull at 25 knots. This leads to only one conclusion, a catamaran is an infeasible solution for this particular vessel and therefore the mono-hull concept is chosen.
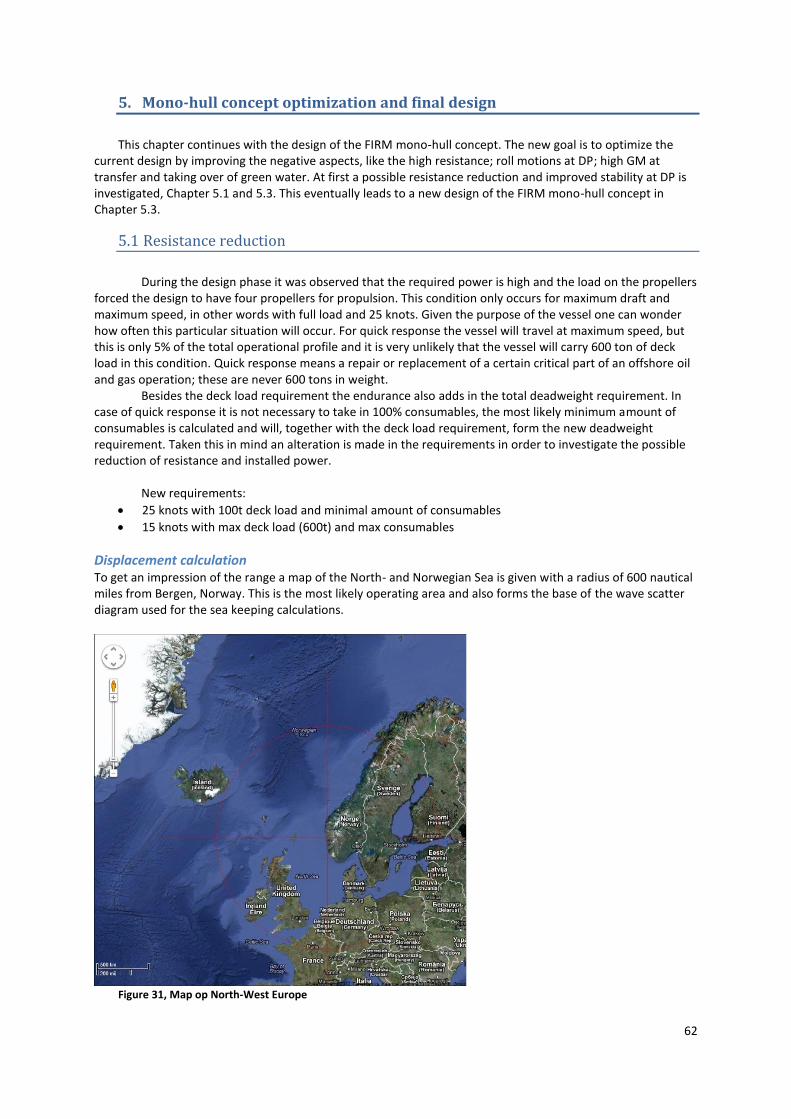
62
5. Mono-hull concept optimization and final design
This chapter continues with the design of the FIRM mono-hull concept. The new goal is to optimize the
current design by improving the negative aspects, like the high resistance; roll motions at DP; high GM at transfer and taking over of green water. At first a possible resistance reduction and improved stability at DP is investigated, Chapter 5.1 and 5.3. This eventually leads to a new design of the FIRM mono-hull concept in Chapter 5.3.
5.1 Resistance reduction
During the design phase it was observed that the required power is high and the load on the propellers
forced the design to have four propellers for propulsion. This condition only occurs for maximum draft and maximum speed, in other words with full load and 25 knots. Given the purpose of the vessel one can wonder how often this particular situation will occur. For quick response the vessel will travel at maximum speed, but this is only 5% of the total operational profile and it is very unlikely that the vessel will carry 600 ton of deck load in this condition. Quick response means a repair or replacement of a certain critical part of an offshore oil and gas operation; these are never 600 tons in weight.
Besides the deck load requirement the endurance also adds in the total deadweight requirement. In case of quick response it is not necessary to take in 100% consumables, the most likely minimum amount of consumables is calculated and will, together with the deck load requirement, form the new deadweight requirement. Taken this in mind an alteration is made in the requirements in order to investigate the possible reduction of resistance and installed power.
New requirements:
25 knots with 100t deck load and minimal amount of consumables
15 knots with max deck load (600t) and max consumables
Displacement calculation To get an impression of the range a map of the North- and Norwegian Sea is given with a radius of 600 nautical miles from Bergen, Norway. This is the most likely operating area and also forms the base of the wave scatter diagram used for the sea keeping calculations.
Figure 31, Map op North-West Europe

63
The required deadweight and displacement for this new situation: Fuel capacity for 1200 miles full speed and 2 days DP = 265 ton Fresh water = 50 ton Sewage = 50 ton Deck load = 100 ton Crew and stores = 17 ton + Total = 482 ton Light ship weight = 4646 ton Deadweight = 482 ton + Displacement needed = 5128 ton The design is kept similar and the above summation allows a draft reduction of the vessel which results in
a resistance reduction. The new draft for this light service condition is set at 5.5 meters.
Resistance New resistance calculation according to Holtrop & Mennen (1984), for Tlight=5,5m.
Figure 32, Resistance mono-hull T=5.50m
Resistance reduction = 86 kN PB reduction, approximately = 1850 kW On a total required break power 24280 kW this is a decrease of +/- 7.5%. This results in a reduction of fuel
consumption of 324 kg every hour while sailing at full speed. Besides the fuel saving it allows the designer to fit smaller engines into the design.
0,00
200,00
400,00
600,00
800,00
1000,00
1200,00
12 13 14 15 16 17 18 19 20 21 22 23 24 25
Re
sist
ance
[kN
]
Speed [kn]
Total resistance
Mono-hull
V Rtotal
[kn] [kN]
12 114.54
13 137.02
14 164.05
15 197.36
16 237.83
17 289.36
18 354.09
19 424.16
20 490.19
21 554.71
22 629.92
23 729.77
24 867.16
25 1053.24

64
5.2 Increase stability for DP
One of the weak points of the mono-hull compared to the catamaran was transverse stability; this was for
instance expressed in the seaway calculations for DP condition. The criterion for roll is 4 degrees RMS and the calculation showed an operability at DP of only 57%. This calculation already included a passive anti-roll tank and bilge keels. Looking at the differential equation for the roll motion of a vessel it becomes clear what could be done to improve this.
Roll motion:
4 44 44 44 4
4
2 2 2 244 4 44 44
44
24
4
44
44
( )
cos( )( ( ) )
Moment of inertia for roll
Added inertia coëfficient for roll
Non-dimensional damping coëfficient for
ei t
e
e e
t
xx
I A B C F e
Ft
C I A B
C GM g
I k
I
A
B
44
4
roll
Hydrostatic restoring coëfficient for roll
Roll exciting moment at the encounter frequency
Instantaneous roll displacement
Instantaneous roll velocity
Instantaneous roll acceleratio
e
C
F
n
The damping and/or the restoring coefficient have to be increased to decrease the roll motions. To increase the restoring coefficient the GM of the vessel has to be increased. However we always have to keep in mind that a too large GM results in high transverse accelerations which are unpleasant for the people onboard and will also affect the operability. The damping coefficient can be increased by adding for instance a keel, active fin stabilizers, or a larger passive anti rolling tank.
Increase of hydrostatic restoring coefficient.
GM KB BM KG
There are two ways to increase the GM and both require a change in the vessels geometry. First possibility
is to lower the CoG, for instance by using lightweight materials in the upper decks or placing heavy equipment lower in the vessel. Second option is to alter the design in such a way that the metacentric height increases, this can be done by increasing the displacement. The negative side of this option is that it will increase the vessels resistance as well.
The best solution is to design a hull form that has the same resistance, or maybe even lower than the current design in transit and has a higher displacement at DP. The next chapter covers a new loop through the design spiral in which the mono-hull design is optimized.

65
5.3 New design
The new approach of the design requirements, the selection procedure and other knowledge attained in
the previous chapters results in a new, final, concept design of the FIRM. This design is based on the previous mono-hull and has the following improvements and alterations:
Reduction of roll motions The new design has a keel and integrated sponsoons. The keel increases the damping coefficient of the vessel and reduces the roll motions. The sponsoons are integrated in the hull over the length of the cargo deck. When the vessel is stationary it can increase the draft by pumping ballast water into the vessel, the waterplane area and displacement are than increased due to the geometry of the vessel. This results in an increase of the transverse stability (higher GM) and reduction of roll motions.
Reduce green water overtaking and decrease GM at transit, higher freeboard The sea keeping calculations also showed a low percentage of operability due to green water overtaking at the cargo deck. Given this information and the idea to increase the draft at DP for increased stability led to an increase of the depth of 1 meter. By increasing the depth the VCG will increase resulting in a lower GM. This decreases the transverse accelerations which is pleasant for crew and passengers during transit.
Definition of a light service draft for high speed In an attempt to reduce the resistance of the vessel the requirements are altered. The maximum speed of 25 knots has to be reached in a loading condition with only 100 tons of deadweight. The maximum deadweight requirement and corresponding 600t deck load will be reached at another draft.
Vertical bow The new design has a vertical bow, this has two reasons. First esthetically, the new line of Damen vessels all have a vertical bow. This is a result of the Axe-Bow concept, applied to small high speed crafts. These vessels have a deeper fore foot (below the baseline) to prevent the bow from emerging out of the water in seaway and prevent corresponding slamming, which results in lower vertical accelerations. The deeper forefoot is unnecessary for larger vessels, because the bow emerges far less out of the water. The second reason is to increase the waterline, which results in a higher hull speed and less resistance. On the other hand the vertical bow raises the wet surface area which is detrimental for the frictional resistance.
The use of high tensile steel (recommendation) The alterations to the hull, sponsoons, keel and increased Depth, have a negative effect on the light ship weight. As a result the displacement increases together with the resistance, to counter this effect a recommendation in done to investigate to use of high tensile steel in the hull construction to save weight. For this thesis this option is left out of the scope.

66
5.3.1 Hull design and lines
The new hull form has integrated sponsoons over the length of the cargo deck and a higher depth of 9
meter instead of 8 to decrease green water overtaking. Due to the sponsoons the total breadth of the vessel in increased with 2 meters, the breadth on the waterline remains same. Due to space requirements in the engine room and at the bow it was necessary to increase the block coefficient, which resulted in a higher displacement and corresponding higher resistance. As a result of the new displacement and light ship weight the design draft is lowered to 5.8 meters.
Main particulars
Loa 120 [m]
Lpp 117 [m]
Lwl 120 [m]
Bmax 21 [m]
Tdesign 5.8 [m]
D 9.0 [m]
Displacement, at Tdesign 6785 [t]
Cb 0.501 [-]
Cp 0.677 [-]
Wetted area 2498 [m²]
Waterplane area 1782 [m²]
LCB -3.0 %
Table 33, Main particulars final design The complete list of the hull properties can be found in Appendices XVII.
Linesplan
Figure 33, Linesplan final design

67
5.3.2 Resistance
One of the new design considerations was the introduction of a light service draft for quick response
operations. This concept was mentioned in Chapter 5.1 for the old mono-hull design. The idea behind this concept is that the vessel only has the ability to sail at 25 knots at this draft, with a restricted amount of deck load and fuel oil onboard. This way the resistance at full speed is lowered and the needed propulsion power is also lowered.
Below the resistance curves of the vessel for this light service draft (T=5.15 m) and the design draft are given, both calculated according to the method of Holtrop & Mennen (1984). In the light service draft condition the vessel has 100 ton of deck load and fuel oil for 1200 nautical miles and 2 days at DP. For the design draft the deadweight requirement is as mentioned in Chapter 1.4, 600 ton of deck load and enough fuel for an endurance of 30 days according to the operational profile. An overview of the hydrostatics for these conditions is given in Chapter 5.3.6.
V Rtotal
[kn] [kN]
12 132
13 158
14 190
15 228
16 274
17 328
18 399
19 487
20 575
21 651
22 721
23 803
24 914
25 1069
V Rtotal
[kn] [kN]
12 145
13 175
14 211
15 256
16 310
17 373
18 456
19 565
20 682
21 783
22 867
23 956
24 1077
25 1248
0
200
400
600
800
1000
1200
12 13 14 15 16 17 18 19 20 21 22 23 24 25
Re
sist
ance
[kN
]
Speed [kn]
Total resistance TDesign=5.8 m
0
200
400
600
800
1000
1200
12 13 14 15 16 17 18 19 20 21 22 23 24 25
Re
sist
ance
[kN
]
Speed [kn]
Total resistance TLight=5.15 m
Figure 34, Resistance light service draft final design
Figure 35, Resistance design draft final design

68
The results of the resistance calculation show an increase of total resistance for the design draft, compared with the first mono-hull design. This is a result of the new geometry of the vessel with the sponsoons. Due to the new requirements this doesn’t matter, for lower speeds like the economical speed of 15 knots the vessel has a low resistance. The light service draft has an almost identical resistance at 25 knots as the first mono-hull had at a light service draft, see Chapter 5.1. This is also a result of the new geometry, the new design has more displacement allowing a draft decrease.

69
5.3.3 Power speed analyses and propulsion system
The power calculation is focused on the maximum speed for the light service draft and the propulsion
system is layed out to reach this speed for this condition. This amount of power is sufficient to reach economical speed at the design draft.
Power calculation main engines The total break power is:
13750
0.65
0.98
0.97
1489321152
215830.98
222510.97
E
D
S
GB
P
D
PS
SB
P kW
P kW
PP kW
PP kW
Propulsion system
Previously the propulsions system consisted of four propellers in a diesel direct lay-out. This turned out to be unpractical and other options had to be considered for the propulsion system. Three possible solutions are:
Use contra rotating pods, this way it is possible to fit two propellers on one pod.
Increase the propeller diameter.
Increase the propeller load The second option had preference over the first because it is easier to apply in the current design and the third option requires an advanced propeller design. The minimum diameter for a double propeller configuration is:
2
10791.52
Maximum propeller load = 400 /
10791.55.20
400
SPkW
kW D
m
Minimum tip clearance (C) with the hull according to DNV for twin propeller vessels: 0.26D
0.26 5.20 1.35C m
The design of the vessel hull had to be adapted due to this alteration, unfortunately this wasn’t enough
and the decision was made to rotate the propulsion train and set it under an angle of 4 degrees. Together with the fact that there is no draft restriction on the vessel lead to the decision to let the propellers protrude under the baseline of the vessel. Now it is possible to fit two propellers with a diameter of 5.20 meters, instead of only 4 meters.

70
Propulsion concept: Four main engines: Wärtsila 8L38
Make Wärtsila
Type 8L38
Output 5800kW
Speed 600 rpm
Specific fuel consumption 176 g/kWh
Weight 63 ton Table 34, Main engines final design
Reduction gear : Wärtsila TCH310 twin in single out Propellers : CPS145/C CPP
Schematic
Figure 36, Schematic overview propulsion system final design
Artist impression
Figure 37, Artists impression propulsion system final design
Main engine 1
Main engine 2
Drive
Electrical network
Generator sets

71
5.3.4 Auxiliary systems and electric load balance
The auxiliary system is almost similar to the previous mono-hull system. The difference lies in the tunnel
thruster power, which is slightly higher for the new design, see Chapter 5.3.8.
Load balance
Consumer Power
Hotel load 500 kW
Crane 1350 kW
Tunnel thrusters 6000 kW
Total (with 5% margin) 8283 kW Table 35, Main consumers final design
Generators
Make Wärtsila Type 8L20 Output 1405 ekW Speed 900-1000 rpm Specific fuel consumption 185g/kWh Weight 20.7 t
Table 36, Auxiliary generator sets mono-hull 1 (2x)
Make Wärtsila Type 9L26 Output 2810 ekW Speed 900-1000 rpm Specific fuel consumption 184g/kWh Weight 50 t
Table 37, Auxiliary generator sets mono-hull 2 (2x)
Make Caterpillar Type C18 Output 547 ekW Speed 1800 rpm Specific fuel consumption 133.2 l/h Weight 1.9 t
Table 38, Emergency generator set mono-hull

72
5.3.5 Weight calculation
Due to modifications the weight calculation had to be revised. The alterations can be divided into weight
increase and weight reduction measures: Weight increase:
Keel The weight of the keel is estimated roughly by multiplying the total area of the keel with the specific weight of steel and a plate thickness of 9 mm.
Higher depth
Larger beam due to sponsoons
Counter ballast for knuckle boom crane This was initially left out of the weight calculation. It is however necessary to counter ballast the vessel for the crane, which is place 5.5 meters out of heart ship, to avoid an initial heeling angle.
Weight reduction:
Lighter main engines
Two instead of four shaft lines and propellers
Two instead of four gearboxes
Potential weight reduction, recommendation, not implemented into the design:
Use of high tensile steel The specific weight of high tensile steel is similar to that of mild steel. The weight gain lies within the higher strength of the material which allows us to reduce the thickness of the plates. The tensile strength of normal steel is 400MPa, high tensile steel has a tensile strength of 760MPa, an increase of 90%.
Besides the alteration in the weight of the vessel there will also be a shift in the CoG, mainly due to the
larger depth.
New light ship weight and CoG The new light ship weight and CoG is given in table 39, the complete weight calculation can be found in
Appendices XIX.
Weight group Weight [t] VCG [m] LCG [m] TCG [m]
100 Shipbuilding 2,838 7.54 59.29 0.00
200 Main machinery 552 3.18 31.85 0.00
300 Primary ship systems 284 7.66 56.36 0.00
400 Electrical system 237 6.55 57.27 0.00
500 Deck equipment 592 12.84 30.16 0.00
600 Secondary ship systems 51 8.03 46.09 0.00
700 Joinery and arrangement of accommodation 333 13.61 73.75 0.00
800 Nautical, navigation and communication equipment 3 22.50 60.00 0.00
Margins lightship weight 246 (5%) 0.30 0.00 0.00
Light ship weight (inclusive 5% margin) 5,135 8.37 53.24 0.00 Table 39, Total light ship weight and CoG final design

73
5.3.6 Hydrostatics
The hydrostatic calculations for this design are more extensive than the previous mono-hull concept. For
each draft a summary of the hydrostatics is made which can be seen in tables 40 until 42.
HYDROSTATICS T=5.15m LCG VCG
Light ship weight (incl margin) 5,135 t 53.24 8.37
Deadweight
Deck cargo 100 t 23.00 10.00
Fuel oil 265 t 79.07 4.09
Fresh water 50 t 97.30 3.25
Sewage 50 t 55.00 1.75
Crew and stores 17 t 75.00 13.50
Total 482 t 66.69 5.32
Displacement (wanted) 5,617 t
LCB VCB
Available displacement (T = 5.15 m) 5,643 t 54.70 3.09
Margin 26 t
Table 40, Design hydrostatics final design T=5.15 m
HYDROSTATICS T=5.80m LCG VCG
Light ship weight (incl margin) 5,135 t 53.24 8.37
Deadweight
Deck cargo 600 t 23.00 10.00
Fuel oil 770 t 62.28 4.75
Fresh water 100 t 97.29 3.85
Sewage 50 t 55.00 1.75
Crew and stores 17 t 75.00 13.50
Total 1537 t 49.13 6.74
Displacement (wanted) 6,672 t
LCB VCB
Available displacement (T = 5.80 m) 6,794 t 53.51 3.50
Margin 122 t
Table 41, Design hydrostatics final design T=5.80 m

74
Summary of hydrostatics for crane operation and DP draft, T=6.6m The philosophy behind the new design with the sponsoons and keel is a reduction of the roll motions at
DP. Increasing the draft of the vessel results in a larger waterplane area and rapid increase of displacement which leads to more stability, see Chapter 5.2. Therefore a third draft for the vessel is defined, the crane operation and DP draft. To reach this draft ballast water is pumped into the vessel. Table 42 gives an overview of the hydrostatics for this condition.
HYDROSTATICS T=6.60m LCG VCG
Light ship weight (incl margin) 5,135 t 53.24 8.37
Deadweight
Deck cargo 600 t 23.00 10.00
Fuel oil 770 t 62.28 4.75
Fresh water 100 t 97.29 3.85
Sewage 50 t 55.00 1.75
Crew and stores 17 t 75.00 13.50
Ballast water 1606 t 55.41 2.30
Total 3143 t 52.34 3.30
Displacement (wanted) 8278 t
LCB VCB
Available displacement (T = 6.60 m) 8283 t 52.30 3.98
Margin 5 t
Table 42, Design hydrostatics final design T=6.6 m

75
5.3.7 Stability
A new design requires a new look at the stability of the vessel. The criteria for the mono-hull given in
Chapter 2.8 are also valid for this vessel. The chapter covers intact stability calculations, loss of load calculations for crane operations and a prediction concerning the outcome of future damage stability calculations.
Intact stability calculations The initial mono-hull design complied with all the stability requirements. The thing that struck was the high
G’M for all loading conditions, this is good for the stability, but also leads to high transverse accelerations that are unpleasant for the crew. The new design has a higher VCG due to the higher freeboard, resulting in lower G’M values for the light service draft and design draft. Only the deepest, DP, draft still has a high G’M because the CoG is lowered due to the large amount of ballast water taken into the double bottom of the vessel.
The loading conditions are in accordance with the conditions given in the previous chapter: Light service draft, maximum mean draft (Lpp/2) = 5,15 meters
1.1 Departure, 100t deck load
2.2 Arrival, 100t deck load Design draft, maximum mean draft (Lpp/2) =5.80 meters
2.1 Departure, 600t deck load
2.2 Arrival, 600t deck load DP operation draft, maximum mean draft (Lpp/2) = 6.6meters
3.1 Departure, 600t deck load
3.2 Arrival, 600t deck load Crane operation
4.1 Crane operation 100t@15m, 100% consumables, 550t deck load
4.2 Crane operation 100t@15m, 10% consumables, 550t deck load All loading conditions comply with the stability criteria and the extensive results can be found in
Appendices XX.
Condition Tmean [m]
Min G’M [m]
Max GZ [m]
Top GZ [degrees]
Area under GZ up to 30
0
[mrad]
Area under GZ between 30
0 and 40
0
[mrad]
Max angle of inclination [degrees]
Max. stat. angle [degrees]
1.1 5.093 1.684 0.746 59.387 0.215 0.124 27.472 5.15
1.2 4.981 1.660 0.686 60.000 0.209 0.118 28.639 5.459
2.1 5.796 2.151 0.922 51.727 0.262 0.149 24.291 3.144
2.2 5.466 1.754 0.669 30.38 0.212 0.115 26.183 4.371
3.1 6.596 3.078 1.554 52.449 0.375 0.229 23.484 1.684
3.2 6.131 3.111 1.591 54.007 0.383 0.233 22.915 1.933
4.1 6.600 2.770 1.271 50.310 0.329 0.193 24.236 1.870
4.2 6.263 2.865 1.295 51.573 0.340 0.196 24.173 2.009 Table 43, Intact stability calculation final design results
The loading conditions for free sailing conditions have lower G’M values than the original mono-hull
design, resulting in a less cruel vessel. For the DP and crane operations the G’M is high for good stability. This is an improvement compared with the original design.

76
Loss of load calculation The loss of load calculation is performed for loading condition Loss of load calculation, maximum mean draft (Lpp/2) = 6.5meters
5.1 Loss of load calculation for loading condition 4.1
5.2 Loss of load calculation for loading condition 4.2 A summary of the results is presented in table 44, detailed results can be found in Appendices XXI. The moment on the vessel: 100 tons load at 20.5 meters out of heart ship results in a moment of 2,050tm, or 20,111kNm
Loading condition Statical angle of inclination (QL)
Statical angle of equilibrium Qe
Area A2>A1
4.1 1.51 4.086 Yes
4.2 1.73 4.689 Yes Table 44, Results loss of load calculation mono-hull The vessel complies with the regulations for loss of load and has a smaller statical angle of inclination and
equilibrium than the initial design. The new design heels less due to the sponsoons and performs better than the initial mono-hull design.

77
Damage stability calculations The same method as for the original design is used to predict if the vessel will comply with the SPS code
(2008).
Figure 38, G'M limit curve final design
Condition Tmean G'M
Lightest service draft (dl) 4.981 1.500
Partial subdivision draft (dp) 5.952 1.700
Deepest subdivion draft (ds) 6.600 2.600 Table 45, Drafts and G'M values for probabilistic damage stability calculation
The G’M limit curve visualizes the difference between the free sailing conditions and the crane operation
condition. A lower G’M for free sailing results in lower transverse accelerations, which is pleasant for crew and passengers. The higher G’M for the higher drafts gives more stability which is needed for crane operations. All the G’M values for the three drafts are higher than 1.5, this makes it very likely that the vessel will comply with the regulations.
1,500
1,700
1,900
2,100
2,300
2,500
2,700
2,900
3,100
4,900 5,400 5,900 6,400
G'M
Mean draft
G'M Limit Curve for multiple trims
Loadcases
G'M limit curve

78
5.3.8 Dynamic positioning
The calculations concerning dynamic positioning are similar to the mono-hull calculations earlier in this
report, the big difference lies in the addition of a keel to the model, which results in higher current forces on the aft of the vessel.
Results The environmental forces and moments on the vessel are given in figures 39 and 40, as a comparison the
forces and moments on the original mono-hull design without a keel are also given in the same graph. The contour of the vessel is similar to the original design, resulting in the same wind forces. The complete table with calculations of the forces and moments is given in Appendices XXII.
Figure 39, Forces on final design
Figure 40, Moments on final design
-10,00
0,00
10,00
20,00
30,00
40,00
50,00
0 5 10 15 20 25 30 35 40 45 50 55 60 65 70 75 80 85 90 95 100105110115120
Forc
e [
kN]
Vessel length [m]
dF current [kN] dF current keel [kN] dF wind [kN] Total force
-1500,00
-1000,00
-500,00
0,00
500,00
1000,00
1500,00
2000,00
2500,00
0 5 10 15 20 25 30 35 40 45 50 55 60 65 70 75 80 85 90 95 100105110115120Mo
me
nt
[kN
m]
Vessel length [m]
M current [kNm] M current keel [kNm] M wind [kN] Total moment

79
Thruster forces and static equilibrium
Forces wrt COG
waves current wind total
Fx 0 0 0 0 kN
Fy 0 378 235 613 kN
Mz 0 3597 3292 6888 kNm
Table 46, Environmental forces and moment on final design
Figure 41, Thrust vectors final design Figure 42, Orientation forces, moments and heading
Thruster forces:
actual min max
Thrust tunnel 1 -155.9 -191.3 191.3 kN -82%
Thrust tunnel 2 -157.1 -191.3 191.3 kN -82%
Thrust tunnel 3 -150.0 -191 191 kN -78%
Thrust tunnel 4 -150.0 -191 191 kN -78%
Total applied power 4848 0 31200 kW 16%
Table 47, Thruster forces final design
The propulsion configuration will be: 2x Propellers with rudders for forward and backward thrust 11600kW each 2x Bow thruster 1500kW each 2x Stern thruster 1500kW each Due to the keel the current forces on the vessel are higher resulting in larger stern thrusters. The moment
on the vessel due to these forces is lower, also because of the keel. The applied force is divided more equal over the length of the vessel.
-80
-60
-40
-20
0
20
40
60
80
-20020
Thrust vectors
Ship
tun1
tun2
tun3
tun4
prop1
prop2

80
5.3.9 General arrangement plan and tank arrangement
For this final design a general arrangement plan has been made, figure 43 until 45. This gives a 2D
overview of the arrangement of the decks. Figure 43 shows the tanktop, tween deck and main deck of the vessel. Main areas below the main deck are the engine room, bowthruster room and switchboard room. The top view of the main deck gives an overview of the deck layout with the crane, some accommodations space and the ROV launch and recovery system. Figure 44 shows the decks of the superstructure, which are mainly used for accommodation space, and the bridge. The last figure is the side view of the vessel in which the contour of the new design becomes visible.
The tank arrangement is given in figure 46. The tanks below the tanktop and the wingtanks are mainly ballast water tanks which are used for trimming and draft increase for the crane operations. All the fuel oil tanks are placed before the engine room between tanktop and tween deck and separated from the hull by ballast water tanks or voids according to class. Fresh water tanks are placed at the front of the vessel as a wingtank and separated from the fuel oil tanks by a cofferdam.
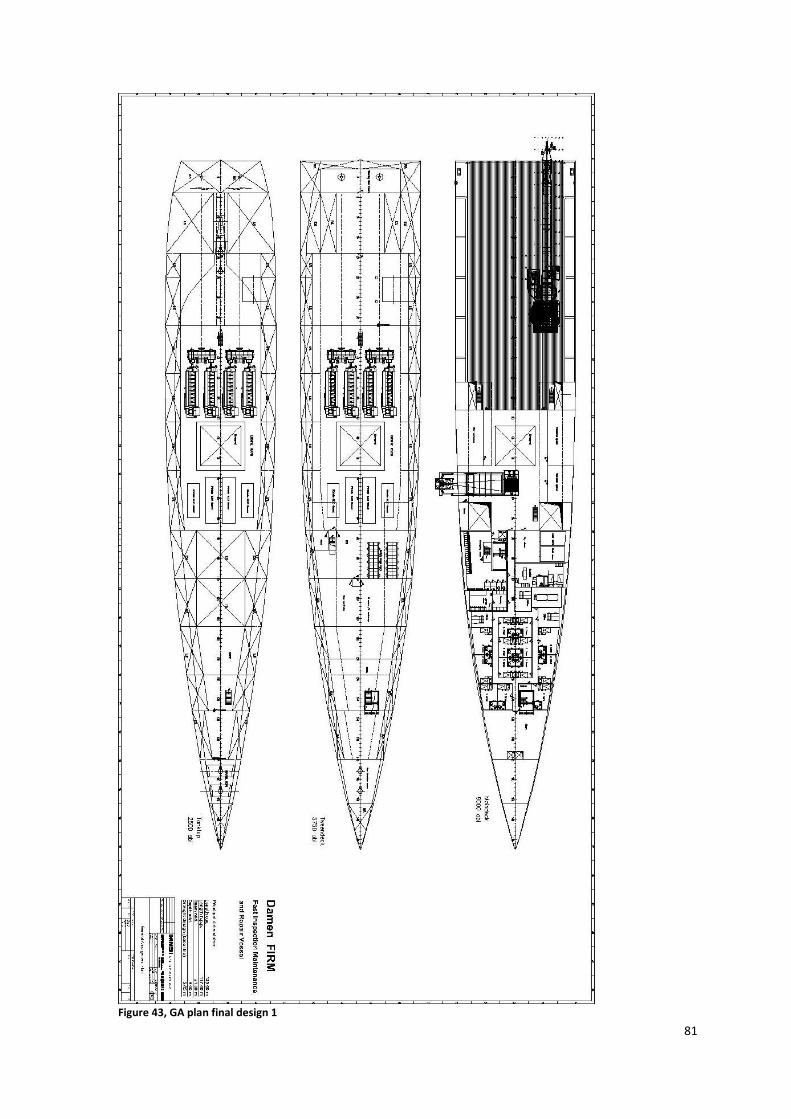
81
Figure 43, GA plan final design 1

82
Figure 44, GA plan final design 2

83
Figure 45, GA plan final design 3

84
Tank arrangement plan
Figure 46, Tank arrangement final design

85
5.3.10 Artists impressions
The structural design of the vessel is shown above in 2D. Besides the 2D general arrangement plan, a 3D
model has been made to give a better impression of the structural design of the vessel. The 3D model is basic, without any details and only meant to give an idea of the appearance of the final concept as a complement to the general arrangement plan.
Figure 47, Artists impression final design 1
Figure 48, Artists impression final design 2

86
Figure 49, Artists impression final design 3
Figure 50, Artists impression final design 4

87
Figure 51, Artists impression final design 5
Figure 52, Artists impression final design 6

88
Figure 53, Artists impression final design 7

89
6 Conclusion
The outcome of this report shows that it is technically possible to design an Inspection Repair and
Maintenance vessel with a maximum speed requirement of 25 knots. At first two design were made which were compared to each other, the outcome of this comparison was that a mono-hull design is preferable over a catamaran due to the significantly lower resistance. The high resistance makes the catamaran an infeasible solution for this design.
The design is based on a fast displacement Marwood and Bailey hull form, which is suitable for the high speed requirement. Integrated sponsoons were implemented, this results in better performance for both stationary operations as well as free sailing conditions. By taking in ballast water the draft of the vessel can be adjusted for the right condition. A lower draft results in a lower G’M which reduces the lateral accelerations at free sailing, optimizing the seaway characteristics. It also reduces the resistance making it possible to reach the maximum speed of 25 knots. A higher draft lowers the vertical center of gravity of the vessel and increases the G’M which is favorable for stationary operations because the vessel becomes more stable. This is especially interesting for crane operations over the side, because the static heeling angle is reduced significantly.
The final design of the FIRM is still a concept vessel, which was the goal for this project. This means that all main characteristics of the vessel are set and checked by means of various calculations. If any interest in this vessel is shown in the future it should be worked out further in detail. If this is the case a few future recommendations are made which might improve the design and also might require an alteration of the initial design criteria.
Future recommendations The amount of power needed to reach 25 knots is extremely high and according to the operational profile
the vessel will only sail at this speed for 5% of the time. With a small reduction of the maximum speed by only a few knots it is possible to install a propulsion system with approximately 20 to 25% less power. The vessel will still be fast in comparison to its competitors.
The propulsion system that was implemented for this design is very basic with a separate power
generation system for the electrical system. The main propulsion engines could also be used to generate electrical power by for instance shaft generators. Another possibility is to design a diesel electric system, this can be combined with the use of POD propellers which makes the aft tunnel thrusters redundant.
It can be interesting to investigate the possibility to use high tensile steel for the hull construction. This
might lower the light ship weight and results in lower draft and resistance.

90
Latest developments
Outside the scope of this thesis the FIRM concept has evolved the last few months, this new FIRM design
won’t be discussed in detail, but it’s nice to mention it shortly. The requirements for the vessel were adjusted to the demands of a new Norwegian customer. The major changes in the requirements were:
Maximum speed reduces to 22 knots instead of 25 knots;
Two ROV LARS systems over the side (PS and SB), fully enclosed in a hangar;
Addition of a heli-deck, amidships;
A second 5x5 m moonpool for ROV LARS operations;
800 m² deck space instead of 600 m²;
Addition of a module handling tower over the 7.2x7.2 m moonpool. This resulted in major changes in the design, like the addition of an extra deck layer in the superstructure
and relocation of the bridge. The vessel is also has a diesel electric propulsion system with POD (pulling) propulsors. The result was a concept vessel which was presented at the Europort 2013 in Rotterdam. The specification sheet, some artists impressions and a photo of the scale model are given below to get an impression.

91
Specification sheet Damen FIRM 120

92

93
Artists impressions and photo Damen FIRM 120
Figure 54, Artists impression 1 Damen FIRM 120 concept
Figure 55, Artists impression 2 Damen FIRM 120 concept

94
Figure 56, Artists impression 3 Damen FIRM 120 concept
Figure 57, Artists impression 4 Damen FIRM 120 concept

95
Figure 58, Artists impression 5 Damen FIRM 120 concept
Figure 59, Artists impression 6 Damen FIRM 120 concept

96
Figure 60, Artists impression 7 Damen FIRM 120 concept
Figure 61, Scale model Damen FIRM 120 concept

97
References
A.F. Molland, J. W. (1994). Resistance Experiments on a Systematic Series of High Speed Displacement Catamaran Forms: Variation of Length-Displacement Ratio and Breadth-Draught Ratio. Southampton: University of Southampton.
Bailey, D. (1976). The NPL High Speed Round Bilge. Royal Institution of Naval Architects. Erik Kasper, T. K. (1987). Assessment of Ship Performances in Seaway. Copenhagen: NORDFORSK. Gerritsma, P. i. (2003). Bewegingen en Sturen. Delft: Faculteit 3mE. H. Klein Woud, D. S. (2002). Design of Propulsion and Electric Power Generation Systems. Delft: IMarEST. Hermand, A. J. (1998). Low-frequency second-order wave-drift forces and damping. Delft: Kluwer. Hoerner, D. I. (1965). Fuid-Dynamic Drag. Bakersfield: Hoerner fluid dynamics. ir. J. Pinkster, i. C. (2005). Geometrie en Stabiliteit. Delft: Faculteit 3mE. J. Holtrop, G. M. (1982). An Approximate Power Prediction Method. Jenson, F. (2011). OSV for Deepwater. Kristiansand: National Oilwell Varco. Journée, J. (1992). Quick Strip Theory Calculations in Ship Design. Delft: Delft University of Technology. Kuiper, P. D. (2003). Resistance and Propulsion. Delft: Faculty of design, Engineering and Production. M. Insel, A. M. (1991). An investigation into the resistance componants of high speed displacement catamarans.
London: Royal institute of Naval Architects. Oossanen, D. P. (sd). Resistance prediction of small high-speed displacement vessels: State of the art. Perry van Oossanen, J. H. (2009). Motor yacht hull form design for the displacement to semi-displacement
speed range. Athens: 10th International Conference on Fast Sea Transportation. Peter van Oossanen, J. B. (1984). MARIN-Systematic series of highspeed displacement ship hullforms.
Wageningen: MARIN. Prof. Dr. Ir. D. Stapersma, I. J. (2000). Design of advanced marine vehicles. Delft: Faculty of 3mE. Prof. ir. C.A. Willemse, i. H. (sd). An Introduction to Offshore Structures and Systems. Delft: Offshore
Engineering. Rose, R. S. (2011). Future Characteristics of Offshore Support Vessel. Cambridge: Massachusetts Institute of
Technology. Ventura, M. (2009). Hullform design. Instituto Superior Technico. Versluis, A. (2004). Moederscheepsvormen. Delft: Faculteit Ontwerp, Constructie en Produktie. Wood, R. (sd). Catalac Catamaran Information Website.

98
Appendices

99
I Design hydrostatics report mono-hull.
Design length 120.00 (m) Midship location 60.000 (m)
Length over all 120.00 (m) Relative water density 1.025
Design beam 19.000 (m) Mean shell thickness 0.0000 (m)
Maximum beam 19.000 (m) Appendage coefficient 1.0000
Design draft 6.000 (m)
Volume properties Waterplane properties
Moulded volume 6103.6 (m^3) Length on waterline 115.34 (m)
Total displaced volume 6103.6 (m^3) Beam on waterline 18.515 (m)
Displacement 6256.2 (tonnes) Entrance angle 51.693 (Degr.)
Block coefficient 0.4462 Waterplane area 1715.3 (m^2)
Prismatic coefficient 0.6419 Waterplane coefficient 0.7523
Vert. prismatic coefficient 0.5931 Waterplane center of floatation 47.962 (m)
Wetted surface area 2288.2 (m^2) Transverse moment of inertia 41174 (m^4)
Longitudinal center of buoyancy 54.986 (m) Longitudinal moment of inertia 1435649 (m^4)
Longitudinal center of buoyancy -4.347 %
Vertical center of buoyancy 3.807 (m)
Midship properties Initial stability
Midship section area 79.241 (m^2) Transverse metacentric height 10.553 (m)
Midship coefficient 0.6951 Longitudinal metacentric height 239.02 (m)
Lateral plane
Lateral area 583.10 (m^2)
Longitudinal center of effort 64.268 (m)
Vertical center of effort 3.244 (m)
The following layer properties are calculated for both sides of the ship
Location Area Thickness Weight VCG LCG TCG
(m^2) (tonnes) (m) (m) (m)
Layer 0 3950.1 0.000 0.000 5.881 61.018 0.000 (CL)
Sectional areas
Location Area Location Area Location Area Location Area Location Area
(m) (m^2) (m) (m^2) (m) (m^2) (m) (m^2) (m) (m^2)
0.000 11.726 24.000 58.530 48.000 79.884 72.000 70.616 96.000 37.048
2.000 14.190 26.000 61.939 50.000 80.294 74.000 68.516 98.000 33.808
4.000 16.852 28.000 65.014 52.000 80.523 76.000 66.241 100.000 30.519
6.000 19.866 30.000 67.773 54.000 80.554 78.000 63.803 102.000 27.172
8.000 23.367 32.000 70.201 56.000 80.362 80.000 61.203 104.000 23.738
10.000 27.358 34.000 72.277 58.000 79.923 82.000 58.467 106.000 20.172
12.000 31.771 36.000 74.006 60.000 79.241 84.000 55.614 108.000 16.401
14.000 36.503 38.000 75.445 62.000 78.325 86.000 52.660 110.000 12.241
16.000 41.342 40.000 76.654 64.000 77.185 88.000 49.633 112.000 7.234
18.000 46.097 42.000 77.694 66.000 75.833 90.000 46.551 114.000 1.597
20.000 50.612 44.000 78.578 68.000 74.280 92.000 43.422 116.000 0.000
22.000 54.766 46.000 79.309 70.000 72.537 94.000 40.252

100
NOTE 1: Draft (and all other vertical heights) is measured above base Z=0.00! NOTE 2: All calculated coefficients based on project length, draft and beam.
0 10 20 30 40 50 60 70 80 90 100 110
Distance from app (m)
0.0
5.0
10.0
15.0
20.0
25.0
30.0
35.0
40.0
45.0
50.0
55.0
60.0
65.0
70.0
75.0
80.0
Are
a (
m^
2)
Sectional areas
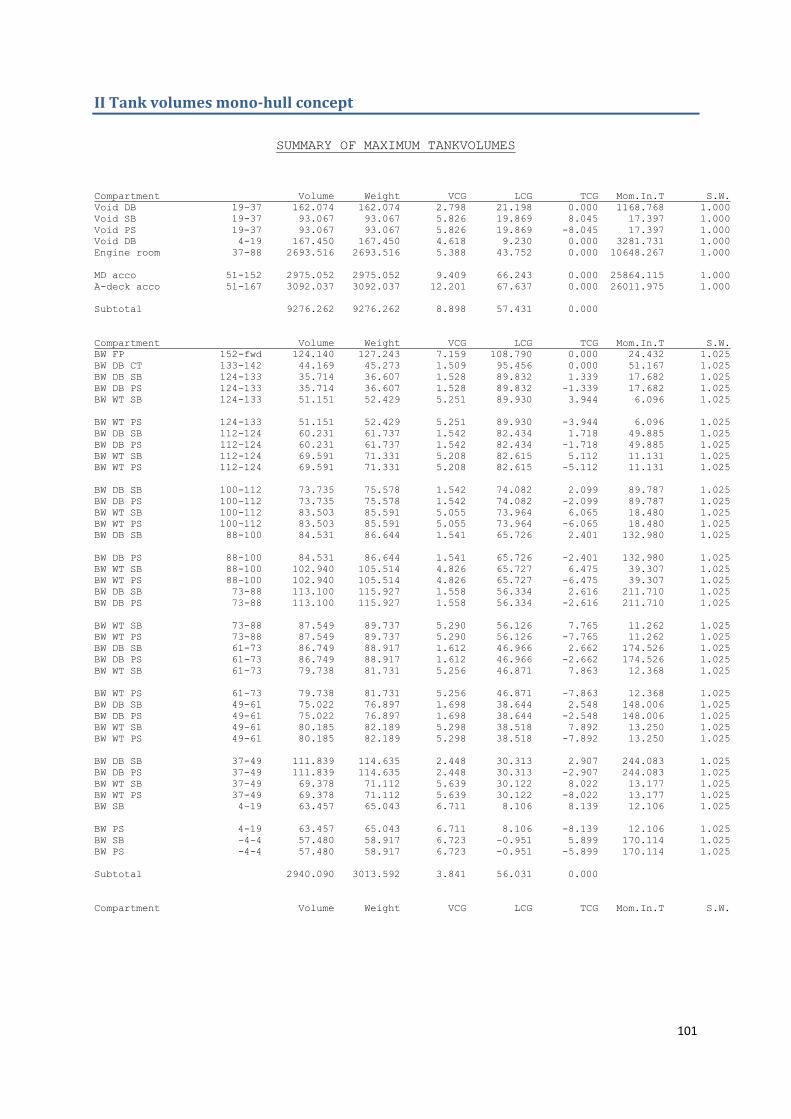
101
II Tank volumes mono-hull concept
SUMMARY OF MAXIMUM TANKVOLUMES
Compartment Volume Weight VCG LCG TCG Mom.In.T S.W.
Void DB 19-37 162.074 162.074 2.798 21.198 0.000 1168.768 1.000
Void SB 19-37 93.067 93.067 5.826 19.869 8.045 17.397 1.000
Void PS 19-37 93.067 93.067 5.826 19.869 -8.045 17.397 1.000
Void DB 4-19 167.450 167.450 4.618 9.230 0.000 3281.731 1.000
Engine room 37-88 2693.516 2693.516 5.388 43.752 0.000 10648.267 1.000
MD acco 51-152 2975.052 2975.052 9.409 66.243 0.000 25864.115 1.000
A-deck acco 51-167 3092.037 3092.037 12.201 67.637 0.000 26011.975 1.000
Subtotal 9276.262 9276.262 8.898 57.431 0.000
Compartment Volume Weight VCG LCG TCG Mom.In.T S.W.
BW FP 152-fwd 124.140 127.243 7.159 108.790 0.000 24.432 1.025
BW DB CT 133-142 44.169 45.273 1.509 95.456 0.000 51.167 1.025
BW DB SB 124-133 35.714 36.607 1.528 89.832 1.339 17.682 1.025
BW DB PS 124-133 35.714 36.607 1.528 89.832 -1.339 17.682 1.025
BW WT SB 124-133 51.151 52.429 5.251 89.930 3.944 6.096 1.025
BW WT PS 124-133 51.151 52.429 5.251 89.930 -3.944 6.096 1.025
BW DB SB 112-124 60.231 61.737 1.542 82.434 1.718 49.885 1.025
BW DB PS 112-124 60.231 61.737 1.542 82.434 -1.718 49.885 1.025
BW WT SB 112-124 69.591 71.331 5.208 82.615 5.112 11.131 1.025
BW WT PS 112-124 69.591 71.331 5.208 82.615 -5.112 11.131 1.025
BW DB SB 100-112 73.735 75.578 1.542 74.082 2.099 89.787 1.025
BW DB PS 100-112 73.735 75.578 1.542 74.082 -2.099 89.787 1.025
BW WT SB 100-112 83.503 85.591 5.055 73.964 6.065 18.480 1.025
BW WT PS 100-112 83.503 85.591 5.055 73.964 -6.065 18.480 1.025
BW DB SB 88-100 84.531 86.644 1.541 65.726 2.401 132.980 1.025
BW DB PS 88-100 84.531 86.644 1.541 65.726 -2.401 132.980 1.025
BW WT SB 88-100 102.940 105.514 4.826 65.727 6.475 39.307 1.025
BW WT PS 88-100 102.940 105.514 4.826 65.727 -6.475 39.307 1.025
BW DB SB 73-88 113.100 115.927 1.558 56.334 2.616 211.710 1.025
BW DB PS 73-88 113.100 115.927 1.558 56.334 -2.616 211.710 1.025
BW WT SB 73-88 87.549 89.737 5.290 56.126 7.765 11.262 1.025
BW WT PS 73-88 87.549 89.737 5.290 56.126 -7.765 11.262 1.025
BW DB SB 61-73 86.749 88.917 1.612 46.966 2.662 174.526 1.025
BW DB PS 61-73 86.749 88.917 1.612 46.966 -2.662 174.526 1.025
BW WT SB 61-73 79.738 81.731 5.256 46.871 7.863 12.368 1.025
BW WT PS 61-73 79.738 81.731 5.256 46.871 -7.863 12.368 1.025
BW DB SB 49-61 75.022 76.897 1.698 38.644 2.548 148.006 1.025
BW DB PS 49-61 75.022 76.897 1.698 38.644 -2.548 148.006 1.025
BW WT SB 49-61 80.185 82.189 5.298 38.518 7.892 13.250 1.025
BW WT PS 49-61 80.185 82.189 5.298 38.518 -7.892 13.250 1.025
BW DB SB 37-49 111.839 114.635 2.448 30.313 2.907 244.083 1.025
BW DB PS 37-49 111.839 114.635 2.448 30.313 -2.907 244.083 1.025
BW WT SB 37-49 69.378 71.112 5.639 30.122 8.022 13.177 1.025
BW WT PS 37-49 69.378 71.112 5.639 30.122 -8.022 13.177 1.025
BW SB 4-19 63.457 65.043 6.711 8.106 8.139 12.106 1.025
BW PS 4-19 63.457 65.043 6.711 8.106 -8.139 12.106 1.025
BW SB -4-4 57.480 58.917 6.723 -0.951 5.899 170.114 1.025
BW PS -4-4 57.480 58.917 6.723 -0.951 -5.899 170.114 1.025
Subtotal 2940.090 3013.592 3.841 56.031 0.000
Compartment Volume Weight VCG LCG TCG Mom.In.T S.W.

102
III Weight calculation mono-hull concept
Name Type Hull weight up to D [kg]
L [m] B[m] D[m] Tdesign [m] Weight factor [kg/m³]
SD Victoria WSS 8316 754995 83 16 7.2 4.25 79
Seveiros Fragata PSV 7216 768176 71.8 16 7.5 5 89
Pool Expres PSV 7216 812799 71.8 16 7.5 5 94
Vos Tracker SSV 4711 205620 47.98 11 5.5 4.25 71
Barend Biesheuvel PV 6111 340009 61.25 11 5.8 4 87
World Diamond PSV 3300 925223 80.2 16.2 7.5 6.15 95
Fairplayer DP Heavy lift vessel
4374571 133.8 26.5 14.1 8.1 88
Pharuehatsabodi HRV 6613 452595 66.33 13.2 6.5 3 80
Tran Dai Nghia HSV 6613 453526 66.33 13.2 6.5 3 80
Hr. Ms. Pelikaan LSV 6513 449203 65.33 13.2 6.5 3 80
Med Otto AHTS 6114 489759 60.36 13.5 6 4.5 100
Brodospas Alfa AHTS 130 677795 66.88 15 6.75 5 100
Average 87 Table 48, Weight factor comparison
Code Description Number Weight Weight VCG LCG TCG
[-] [kg/m3] [kg] [m] [m] [m]
[m3] AB fr 0 SB = +
100 Shipbuilding
110 Hull 18240 m3 87 kg/m3 1,586,880 5.00 55.30
110 MD-AD 4203 m3 50 kg/m3 210,140 9.50 71.00
110 AD-BD 4256 m3 50 kg/m3 212,800 12.30 71.00
Total hull Total volume 26699 m3
Factor 2009820 kg
75 kg/m3
120 BD-CD Aluminium 2128 m3 30 kg/m3 63,840 15.10 71.00
120 CD-Bridge deck Aluminium 1702 m3 30 kg/m3 51,072 17.90 67.00
120 Wheelhouse Aluminium 798 m3 48 kg/m3 38,304 22.50 61.00
Total superstructure Total volume 4628 m3
Factor 153216 kg
33 kg/m3
130 Small steelwork 2163036 6.0% 129,782 7.07 59.21
161 Paint 2292818 1.5% 34,392 7.07 59.21
Rolling margin & welding material 2292818 4.5% 103,177 7.07 59.21
Shipbuilding total 2,430,387 7.07 59.21 Table 49, Weight calculation mono-hull 100

103
Description Mass [t] VCG LCG
Basic hull 942.33 4.58 58
Double bottom 278.24 1.77 62.13
Shaft tunnel 9.00 2.5 23.2
Tween deck 99.96 5.25 53
Steel fenders 1.05 8.55 58.50
Transverse bulkheads 79.15 4.58 55.5
Wing tanks 49.1 5.25 49.00
Bridge 64.33 20.5 61.00
Superstructure 533.06 14.1 71.00
Natural Hold vent. 10.64 4.58 58.00
Aux. Foundations 101.55 4.38 39.9
Hull finishing 36.40 4.58 58.00
Engine room finishing 15.20 3.00 39.9
Stem/Stern/Rudder 43.50 3.00 55.68
Shaft brackets 74.55 1.50 4.64
Total 2337.98 6.74 58.35 Table 50, Steel weight calculation mono-hull Westers
Code Description Number Weight Weight VCG LCG TCG
[-] [kg] [kg] [m] [m] [m]
AB fr 0 SB = +
200 Main machinery
211 Main engines Wartsila 9L38 4 72000 288,000 4.00 38.00
212 Gearboxes Single in single out 4 14500 58,000 3.50 30.00
213 Propellers 4000 mm CPP 4 8000 32,000 2.00 2.00
213 Shafts & stern tubes 4 40000 160,000 2.00 12.00
213 Seals & bearings 4 2500 10,000 2.00 12.00
221 Rudders 4 15000 60,000 2.00 0.00
222 Steering gear 4 5000 20,000 6.00 0.00
223 Bow thruster - 1 1500 kW 1 10600 10,600 1.50 103.00
223 Bow thruster - 2 1500 kW 1 10600 10,600 1.50 98.50
223 Sternthruster - 1 1500 kW 1 10600 10,600 2.00 12.00
223 Stern thruster - 2 1500 kW 1 10600 10,600 2.00 8.00
223 E motor bow thruster - 1 1500 kW 1 8000 8,000 3.50 103.00
223 E motor bow thruster - 2 1500 kW 1 8000 8,000 3.50 98.50
223 E motor sternthruster - 1 1500 kW 1 8000 8,000 4.00 12.00
223 E motor stern thruster - 2 1500 kW 1 8000 8,000 4.00 8.00
223 Drive bow thruster - 1 1 2000 2,000 3.50 103.00
223 Drive bow thruster - 2 1 2000 2,000 3.50 98.50
223 Drive sternthruster - 1 1 2000 2,000 4.00 12.00
223 Drive stern thruster - 2 1 2000 2,000 4.00 8.00
Main machinery total 710,400 3.13 27.24 Table 51, Weight calculation mono-hull 200

104
Code Description Number Weight Weight VCG LCG TCG
[-] [kg] [kg] [m] [m] [m]
AB fr 0 SB = +
300 Primary ship systems
310 Bilge ballast piping 1 25000 25,000 3.75 55.00
310 Fifi piping 1 7500 7,500 8.00 58.00
320 Fuel oil piping 1 10000 10,000 3.75 45.00
330 Cooling water piping 1 20000 20,000 3.00 48.00
340 Fresh water piping 1 2000 2,000 11.00 75.00
340 Sewage piping 1 8000 8,000 11.00 75.00
340 Deck scupper piping 1 5000 5,000 10.50 58.00
350 Tank sounding/filling piping 1 17500 17,500 6.00 58.00
360 Lub oil piping 1 8000 8,000 3.50 47.00
380 Exhaust piping ER 2 4000 8,000 10.50 50.00
380 Exhaust piping PR 4 3500 14,000 13.50 57.00
390 Miscellaneous piping 1 20000 20,000 5.00 58.00
300 System fillings 145,000 20% 29,000 7.17 55.23
300 Appendages 145,000 20% 29,000 7.17 55.23
0
310 Bilge ballast equipment 1 2000 2,000 4.00 55.00
310 Fifi equipment 1 1000 1,000 8.00 58.00
320 Fuel oil equipment 1 3000 3,000 3.50 45.00
330 Cooling water equipment 1 12000 12,000 3.00 48.00
340 Fresh water equipment 1 3000 3,000 11.00 75.00
340 Sewage plant 1 6000 6,000 3.50 75.00
340 Other sewage equipment 1 1000 1,000 4.00 83.00
350 Tank sounding/filling equipment 1 1000 1,000 6.50 58.00
360 Lub oil equipment 1 2500 2,500 3.50 47.00
370 HVAC piping (spiro) 1 10000 10,000 13.50 75.00
370 HVAC unit 1 6500 6,500 13.50 55.00
370 Other HVAC equipment 1 3000 3,000 13.50 95.00
380 Exhaust equipment 6 2500 15,000 10.50 48.00
390 Remaining primary ship systems 1 15000 15,000 5.00 58.00
Primary ship systems total 284,000 6.93 56.36
Table 52, Weight calculation mono-hull 300

105
Code Description Number Weight Weight VCG LCG TCG
[-] [kg] [kg] [m] [m] [m]
AB fr 0 SB = +
400 Electrical system
410 Generator set Wartsila 8L20 2 20700 41,400 4.00 56.00
410 Generator set Wartsila 8L26 2 45000 90,000 4.00 56.00
410 Emergency set Cat C18 1 1905 1,905 17.50 54.00
420 Cables & cable trays below main deck 1 32000 32,000 5.00 55.00
420 Cables & cable trays above maindeck 1 22000 22,000 12.50 55.00
430 Main switchboard 4 5500 22,000 6.50 65.00
430 Other switchboards 1 10000 10,000 6.50 65.00
450 Lighting 1 3000 3,000 13.50 70.00
490 Remaining items 1 15000 15,000 8.50 58.00
Electrical system total 237,305 5.77 57.27
Table 53, Weight calculation mono-hull 400
Code Description Number Weight Weight VCG LCG TCG
[-] [kg] [kg] [m] [m] [m]
AB fr 0 SB = +
500 Deck equipment
510 Anchor winch 1 5000 5,000 12.50 108.00
510 Anchors 2 3000 6,000 10.50 113.00
510 Chain 1 25000 25,000 6.50 110.00
510 Chain stoppers 2 650 1,300 11.50 111.00
510 Mooring winches aft 2 6000 12,000 9.00 2.00
520 Capstans aft 2 1200 2,400 9.00 2.00
540 Deck crane (subsea execution) 1 275000 275,000 17.20 20.00
540 Deck crane Pedestal Incl 1 0
540 Store crane 1 5000 5,000 14.50 94.50
550 Tugger winches 2 4000 8,000 9.00 38.50
560 ROV Davit 1 15000 15,000 11.50 56.00
570 Fast rescue boat + davit 1 8000 8,000 12.50 49.70
570 Life boat + davits 2 10000 20,000 15.50 66.50
570 MOB boat + davit 1 2000 2,000 11.50 42.00
570 life rafts 6 500 3,000 8.50 41.00
590 Remaining items 1 15000 15,000 8.00 58.00
Deck equipment total 402,700 15.04 34.93
Table 54, Weight calculation mono-hull 500

106
Code Description Number Weight Weight VCG LCG TCG
[-] [kg] [kg] [m] [m] [m]
AB fr 0 SB = +
600 Secondary ship systems
610 Hydraulic piping 1 5000 5,000 9.00 40.00
620 Compressed air piping 6 2000 12,000 8.00 45.00
660 Pre-wetting piping Local protection 1 3000 3,000 4.00 45.00
670 CO2 piping 1 1000 1,000 9.00 45.00
680 Cold & freeze piping 1 1000 1,000 9.50 64.50
680 Remaining systems 1 10000 10,000 4.00 50.00
600 System fillings 22,000 20% 4,400 8.45 44.75
600 Appendages 22,000 20% 4,400 8.45 44.75
0
610 Hydraulic equipment 1 5000 5,000 9.50 45.50
620 Compressed air equipment 1 3000 3,000 6.50 40.00
670 CO2 equipment 1 1000 1,000 10.00 42.00
680 Cold & freeze equipment 1 1500 1,500 9.50 64.50
Secondary ship systems total 51,300 7.35 46.09
Table 55, Weight calculation mono-hull 600
Code Description Number Weight Weight VCG LCG TCG
[m2] [kg/m2] [kg] [m] [m] [m]
AB fr 0 SB = +
700 Joinery and arrangement of accommodation
710 Joinery main deck 650 m2 150 97,500 9.00 77.00
710 Joinery A - deck 650 m2 150 97,500 11.80 75.00
710 Joinery B - deck 450 m2 120 54,000 14.60 75.00
710 Joinery C - deck 450 m2 120 54,000 17.40 72.50
710 Joinery bridge deck 190 m2 100 19,000 21.50 59.50
730 Floor plates Steel 250 m2 43 10,750 3.50 58.00
Joinery and arrangement of accommodation total
332,750 12.63 73.75
Table 56, Weight calculation mono-hull 700
Code Description Number Weight Weight VCG LCG TCG
[-] [kg] [kg] [m] [m] [m]
AB fr 0 SB = +
800 Nautical, navigation and communication equipment
1 3000 3,000 21.50 60.00
Nautical, navigation and communication equipment total
3,000 21.50 60.00
Table 57, Weight calculation mono-hull 800

107
IV Extensive hydrostatics report mono-hull concept
HYDROSTATIC PARTICULARS
FIRM
Trim = 0.000 m
Draft from base 4.500 4.600 4.700 4.800 4.900
Waterplane area 1418.63 1443.16 1469.80 1497.27 1526.03
Centre of flotation 49.724 49.308 48.812 48.303 47.745
Mom. of inertia long. 946018 980167 1016863 1056758 1100417
Mom. of inertia tran. 27930 28873 29840 30821 31824
Ton/cm immersion 14.54 14.79 15.07 15.35 15.64
Volume 3705.62 3848.57 3994.10 4142.30 4293.30
Volume & appendages 3705.62 3848.57 3994.10 4142.30 4293.30
Displacement 3798.26 3944.79 4093.95 4245.86 4400.63
Vert. Centre Buoyancy 2.859 2.921 2.984 3.048 3.111
Long. Centre Buoyancy 55.840 55.605 55.368 55.125 54.877
Trans.Centre Buoyancy 0.000 0.000 0.000 0.000 0.000
KM transverse 10.396 10.424 10.455 10.488 10.523
KM longitudinal 258.151 257.604 257.576 258.161 259.421
Mom change trim 1 cm 84.32 87.36 90.63 94.19 98.08
Wetted surface 1748.3 1785.5 1824.9 1865.4 1907.5
Block coefficient 0.3769 0.3829 0.3889 0.3950 0.4010
Hor.prism.coef 0.5988 0.6026 0.6064 0.6103 0.6142
Vert.prism.coef 0.5805 0.5797 0.5782 0.5764 0.5742
Midship coefficient 0.6293 0.6354 0.6414 0.6472 0.6528
Waterplane coef. 0.6493 0.6605 0.6727 0.6852 0.6984
Waterplane coef. fore 0.5036 0.5074 0.5112 0.5149 0.5186
Draft from base 5.000 5.100 5.200 5.300 5.400
Waterplane area 1556.35 1585.94 1611.13 1632.08 1649.27
Centre of flotation 47.147 46.563 46.115 45.788 45.557
Mom. of inertia long. 1148431 1200393 1250259 1292200 1325936
Mom. of inertia tran. 32861 33921 34992 36035 37003
Ton/cm immersion 15.95 16.26 16.51 16.73 16.90
Volume 4447.25 4604.24 4764.00 4926.09 5090.11
Volume & appendages 4447.25 4604.24 4764.00 4926.09 5090.11
Displacement 4558.44 4719.35 4883.10 5049.24 5217.37
Vert. Centre Buoyancy 3.175 3.239 3.303 3.367 3.431
Long. Centre Buoyancy 54.621 54.356 54.088 53.820 53.558
Trans.Centre Buoyancy 0.000 0.000 0.000 0.000 0.000
KM transverse 10.564 10.606 10.648 10.682 10.700
KM longitudinal 261.408 263.953 265.742 265.684 263.923
Mom change trim 1 cm 102.36 106.99 111.44 115.17 118.18
Wetted surface 1951.5 1995.3 2035.1 2071.1 2103.8
Block coefficient 0.4071 0.4132 0.4193 0.4254 0.4314
Hor.prism.coef 0.6183 0.6225 0.6268 0.6310 0.6353
Vert.prism.coef 0.5715 0.5692 0.5686 0.5695 0.5715
Midship coefficient 0.6584 0.6637 0.6690 0.6741 0.6791
Waterplane coef. 0.7123 0.7258 0.7374 0.7469 0.7548
Waterplane coef. fore 0.5222 0.5256 0.5292 0.5326 0.5360
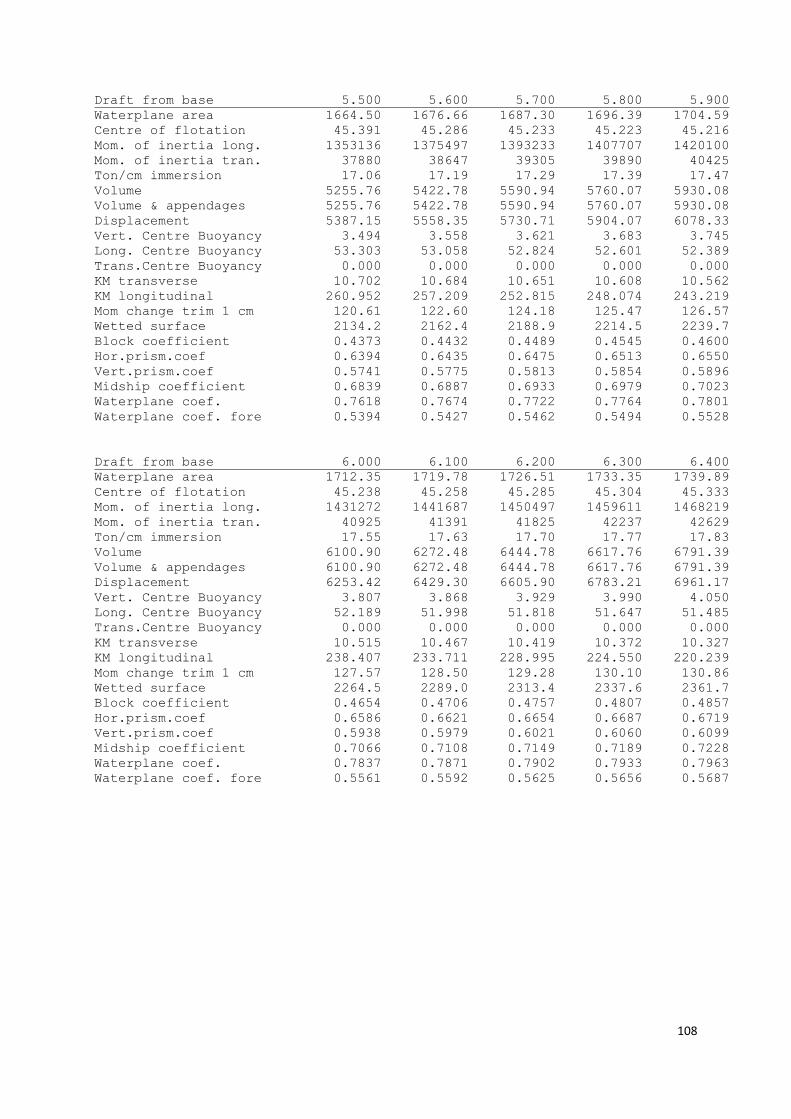
108
Draft from base 5.500 5.600 5.700 5.800 5.900
Waterplane area 1664.50 1676.66 1687.30 1696.39 1704.59
Centre of flotation 45.391 45.286 45.233 45.223 45.216
Mom. of inertia long. 1353136 1375497 1393233 1407707 1420100
Mom. of inertia tran. 37880 38647 39305 39890 40425
Ton/cm immersion 17.06 17.19 17.29 17.39 17.47
Volume 5255.76 5422.78 5590.94 5760.07 5930.08
Volume & appendages 5255.76 5422.78 5590.94 5760.07 5930.08
Displacement 5387.15 5558.35 5730.71 5904.07 6078.33
Vert. Centre Buoyancy 3.494 3.558 3.621 3.683 3.745
Long. Centre Buoyancy 53.303 53.058 52.824 52.601 52.389
Trans.Centre Buoyancy 0.000 0.000 0.000 0.000 0.000
KM transverse 10.702 10.684 10.651 10.608 10.562
KM longitudinal 260.952 257.209 252.815 248.074 243.219
Mom change trim 1 cm 120.61 122.60 124.18 125.47 126.57
Wetted surface 2134.2 2162.4 2188.9 2214.5 2239.7
Block coefficient 0.4373 0.4432 0.4489 0.4545 0.4600
Hor.prism.coef 0.6394 0.6435 0.6475 0.6513 0.6550
Vert.prism.coef 0.5741 0.5775 0.5813 0.5854 0.5896
Midship coefficient 0.6839 0.6887 0.6933 0.6979 0.7023
Waterplane coef. 0.7618 0.7674 0.7722 0.7764 0.7801
Waterplane coef. fore 0.5394 0.5427 0.5462 0.5494 0.5528
Draft from base 6.000 6.100 6.200 6.300 6.400
Waterplane area 1712.35 1719.78 1726.51 1733.35 1739.89
Centre of flotation 45.238 45.258 45.285 45.304 45.333
Mom. of inertia long. 1431272 1441687 1450497 1459611 1468219
Mom. of inertia tran. 40925 41391 41825 42237 42629
Ton/cm immersion 17.55 17.63 17.70 17.77 17.83
Volume 6100.90 6272.48 6444.78 6617.76 6791.39
Volume & appendages 6100.90 6272.48 6444.78 6617.76 6791.39
Displacement 6253.42 6429.30 6605.90 6783.21 6961.17
Vert. Centre Buoyancy 3.807 3.868 3.929 3.990 4.050
Long. Centre Buoyancy 52.189 51.998 51.818 51.647 51.485
Trans.Centre Buoyancy 0.000 0.000 0.000 0.000 0.000
KM transverse 10.515 10.467 10.419 10.372 10.327
KM longitudinal 238.407 233.711 228.995 224.550 220.239
Mom change trim 1 cm 127.57 128.50 129.28 130.10 130.86
Wetted surface 2264.5 2289.0 2313.4 2337.6 2361.7
Block coefficient 0.4654 0.4706 0.4757 0.4807 0.4857
Hor.prism.coef 0.6586 0.6621 0.6654 0.6687 0.6719
Vert.prism.coef 0.5938 0.5979 0.6021 0.6060 0.6099
Midship coefficient 0.7066 0.7108 0.7149 0.7189 0.7228
Waterplane coef. 0.7837 0.7871 0.7902 0.7933 0.7963
Waterplane coef. fore 0.5561 0.5592 0.5625 0.5656 0.5687

109
Draft from base 6.500 6.600 6.700 6.800 6.900
Waterplane area 1746.19 1751.32 1757.37 1762.35 1767.68
Centre of flotation 45.350 45.405 45.424 45.488 45.526
Mom. of inertia long. 1476283 1484542 1491841 1499340 1506372
Mom. of inertia tran. 43000 43355 43682 44006 44307
Ton/cm immersion 17.90 17.95 18.01 18.06 18.12
Volume 6965.63 7140.46 7315.85 7491.78 7668.23
Volume & appendages 6965.63 7140.46 7315.85 7491.78 7668.23
Displacement 7139.77 7318.97 7498.74 7679.07 7859.94
Vert. Centre Buoyancy 4.110 4.170 4.230 4.289 4.348
Long. Centre Buoyancy 51.332 51.186 51.048 50.917 50.792
Trans.Centre Buoyancy 0.000 0.000 0.000 0.000 0.000
KM transverse 10.283 10.242 10.200 10.163 10.126
KM longitudinal 216.049 212.076 208.149 204.420 200.791
Mom change trim 1 cm 131.58 132.32 132.97 133.64 134.26
Wetted surface 2385.7 2409.7 2433.5 2457.3 2481.0
Block coefficient 0.4905 0.4951 0.4997 0.5042 0.5086
Hor.prism.coef 0.6749 0.6779 0.6808 0.6836 0.6863
Vert.prism.coef 0.6137 0.6178 0.6213 0.6251 0.6287
Midship coefficient 0.7267 0.7304 0.7341 0.7376 0.7411
Waterplane coef. 0.7992 0.8015 0.8043 0.8066 0.8090
Waterplane coef. fore 0.5718 0.5750 0.5778 0.5811 0.5838
Draft from base 7.000
Waterplane area 1772.27
Centre of flotation 45.589
Mom. of inertia long. 1513467
Mom. of inertia tran. 44595
Ton/cm immersion 18.17
Volume 7845.19
Volume & appendages 7845.19
Displacement 8041.32
Vert. Centre Buoyancy 4.406
Long. Centre Buoyancy 50.674
Trans.Centre Buoyancy 0.000
KM transverse 10.091
KM longitudinal 197.323
Mom change trim 1 cm 134.90
Wetted surface 2504.9
Block coefficient 0.5129
Hor.prism.coef 0.6889
Vert.prism.coef 0.6324
Midship coefficient 0.7445
Waterplane coef. 0.8111
Waterplane coef. fore 0.5868

110
V Rules and regulations intact stability calculations
VI.A IMO A.749(18)
3.1 General intact stability criteria for all ships 3.1.1 Scope . The following criteria are recommended for passenger and cargo ships.
3.1.2 Recommended general criteria 3.1.2.1. The area under the righting lever curve (GZ curve) should not be less than 0.055 metre-radians up to θ = 30° angle of heel and not less than 0.09 metre-radians up to θ = 40° or the angle of downflooding θf
see footnote if this angle is less than 40°. Additionally, the area under the righting lever curve (GZ curve)
between the angles of heel of 30° and 40° or between 30° and θf, if this angle is less than 40°, should not be less than 0.03 metre-radians. 3.1.2.2. The righting lever GZ should be at least 0.20 m at an angle of heel equal to or greater than 30°. 3.1.2.3. The maximum righting arm should occur at an angle of heel preferably exceeding 30° but not less than 25°. 3.1.2.4. The initial metacentric height GMo should not be less than 0.15 m.

111
VI.B Accidental loss of load (DNV)
Rules (DNV): Pt.5 Ch.7 Sec.17 D 200Accidental load drop Pt.5 Ch.7 Sec.17 D 201 The effect of accidental drop of crane load shall be investigated and shall meet the following criteria:
The restoring energy represented by area A2 in Fig.1 is to be at least 40% in excess of the potential energy represented by area A1.
The angle of static equilibrium Qe after loss of crane load shall not be more than 15 degrees from the upright.
Figure 62, Stability with loss of crane load
RL1 = Net righting lever (GZ) curve for the condition before loss of crane load, corrected for crane heeling moment and for the righting moment provided by the counter ballast if applicable.
RL2= Net righting lever (GZ) curve for the condition after loss of crane load, corrected for the transverse moment provided by the counter ballast if applicable.
QL= Static angle of equilibrium before loss of crane load. QL may alternatively be determined by the equation:
QL = arctan (TCG/GMt) If this results in a small angle of heel. TCG is then to be taken as the vessel's transverse centre of gravity before loss of crane load, and GMt is the
corrected transverse metacentric height in the same condition. Qe= Static angle of equilibrium after loss of crane load Qf= Angle of down flooding as defined in Pt.3 Ch.3 Sec.9. Guidance note: Net righting lever implies that the calculation of the GZ curve includes the vessel's true transverse centre of gravity as function of the angle of heel.

112
VI Intact Stability calculations mono-hull
TRIM AND STABILITY CALCULATION
FIRM
11 Jun 2013 14:45:04
Condition : 1.1 Ballast condition T=6m
Description Weight VCG LCG TCG FSM
ton m m m tonm
Empty ship 4674.000 7.810 52.200 0.000 0.000
Subtotals for group : Ballast water
BW FP 152-fwd 0.000 0.006 106.845 0.000 0.000
BW DB CT 133-142 28.522 1.100 95.462 0.000 46.161
BW DB SB 124-133 0.000 -0.000 89.873 0.115 0.000
BW DB PS 124-133 0.000 -0.000 89.873 -0.115 0.000
BW WT SB 124-133 0.000 2.500 89.957 3.058 0.000
BW WT PS 124-133 0.000 2.500 89.957 -3.058 0.000
BW DB SB 112-124 0.000 -0.000 82.488 0.133 0.000
BW DB PS 112-124 0.000 -0.000 82.488 -0.133 0.000
BW WT SB 112-124 0.000 2.500 82.667 4.083 0.000
BW WT PS 112-124 0.000 2.500 82.667 -4.083 0.000
BW DB SB 100-112 0.000 -0.000 74.228 0.150 0.000
BW DB PS 100-112 0.000 -0.000 74.228 -0.150 0.000
BW WT SB 100-112 0.000 2.500 73.745 4.922 0.000
BW WT PS 100-112 0.000 2.500 73.745 -4.922 0.000
BW DB SB 88-100 0.000 -0.000 66.838 0.124 0.000
BW DB PS 88-100 0.000 -0.000 66.838 -0.124 0.000
BW WT SB 88-100 0.000 2.500 65.590 5.297 0.000
BW WT PS 88-100 0.000 2.500 65.590 -5.297 0.000
BW DB SB 73-88 0.000 0.006 60.835 0.073 0.000
BW DB PS 73-88 0.000 0.006 60.835 -0.073 0.000
BW WT SB 73-88 0.000 2.500 55.809 6.620 0.000
BW WT PS 73-88 0.000 2.500 55.809 -6.620 0.000
BW DB SB 61-73 88.917 1.612 46.966 2.662 0.000
BW DB PS 61-73 88.917 1.612 46.966 -2.662 0.000
BW WT SB 61-73 81.731 5.256 46.871 7.863 0.000
BW WT PS 61-73 81.731 5.256 46.871 -7.863 0.000
BW DB SB 49-61 76.897 1.698 38.644 2.548 0.000
BW DB PS 49-61 76.897 1.698 38.644 -2.548 0.000
BW WT SB 49-61 82.189 5.298 38.518 7.892 0.000
BW WT PS 49-61 82.189 5.298 38.518 -7.892 0.000
BW SB 4-19 65.043 6.711 8.106 8.139 0.000
BW PS 4-19 65.043 6.711 8.106 -8.139 0.000
SUBTOTAL 818.079 3.890 39.197 -0.000 46.161
Subtotals for group : Fuel oil
FO CT 124-133 71.281 3.847 89.765 0.000 59.115
FO CT 112-124 134.176 3.847 82.367 0.000 221.059
FO CT 100-112 156.539 3.847 74.200 0.000 341.541
FO CT 88-100 156.539 3.847 65.800 0.000 341.541
FO SB 4-19 65.224 6.597 8.050 5.600 15.812
FO PS 4-19 65.224 6.597 8.050 -5.600 15.812
SUBTOTAL 648.982 4.400 62.275 0.000 994.881
Subtotals for group : Fresh water
FW WT SB 133-142 46.074 5.113 96.184 2.851 1.797
FW WT PS 133-142 46.074 5.113 96.184 -2.851 1.797
SUBTOTAL 92.149 5.113 96.184 -0.000 3.594

113
Subtotals for group : Crew and stores
Crew and stores 15.000 14.000 75.000 0.000 0.000
SUBTOTAL 15.000 14.000 75.000 0.000 0.000
TOTAL 6248.210 6.918 52.247 -0.000 1044.635
Hydrostatics Drafts and trim
Volume 6095.862 m3 Drafts above base :
LCF 45.226 m Draft mean (Lpp/2) 6.000 m
Mom. change trim 127.551 tonm/cm Draft aft (App) 5.987 m
Ton/cm immersion 17.555 ton/cm Draft fore (Fpp) 6.013 m
Specific weight 1.025 ton/m3 Trim 0.026 m
Transverse stability
KM transverse 10.514 m
VCG 6.918 m
GM solid 3.597 m
GG' correction 0.167 m
G'M liquid 3.430 m VCG' 7.085 m
The stability values are calculated for the actual trim.
Statical and dynamical stability, calculated with constant LCB :
Angle(SB) Draft mld. Trim KNsinφ VCG'sinφ TCGcosφ G'Nsinφ Area
degrees m m m m m m mrad
0.00 6.000 0.026 0.000 0.000 -0.000 0.000 0.000
2.00 5.998 0.029 0.367 0.247 -0.000 0.120 0.002
5.00 5.990 0.045 0.913 0.617 -0.000 0.296 0.013
10.00 5.959 0.126 1.799 1.230 -0.000 0.569 0.051
15.00 5.903 0.259 2.634 1.834 -0.000 0.801 0.111
20.00 5.840 0.288 3.366 2.423 -0.000 0.943 0.188
25.00 5.762 0.232 4.032 2.994 -0.000 1.038 0.274
30.00 5.657 0.120 4.655 3.542 -0.000 1.112 0.368
35.00 5.514 -0.028 5.244 4.064 -0.000 1.180 0.468
40.00 5.317 -0.203 5.810 4.554 -0.000 1.256 0.575
50.00 4.749 -0.694 6.779 5.427 -0.000 1.351 0.804
60.00 3.926 -1.500 7.389 6.136 -0.000 1.253 1.035
Statical angle of inclination is 0.000 degrees to starboard
Contour : FIRM
Opening is submerged at [degrees]
ER Vent in 55.35

114
Summary
Hydrostatics Criterion Value
Draft mld. 6.000 6.000 m
Trim 0.026 m
Statical angle of inclination 0.00 degrees SB
Flooding angle 55.35 degrees
Intact Stability Code for vessels with a large B/H ratio Criterion Value
Minimum metacentric height G'M 0.150 3.430 meter
Maximum GZ at 30 degrees or more 0.200 1.352 meter
Top of the GZ curve at least at 15.000 51.042 degrees
Area under the GZ curve up to 30 degrees 0.055 0.368 mrad
Area under the GZ curve between 30 and 40 degrees 0.030 0.206 mrad
Maximum angle of inclination acc. to IMO's A.562 weathercriterion50.00025.731 degrees
Maximum statical angle due to wind 13.231 1.833 degrees
Maximum statical angle 80% of angle of deck immersion 9.984 1.833 degrees
VCG'
Actual 7.085 m
Maximum allowable 8.612 m
Loading condition complies with the stated criteria.
Angle of inclination in degrees 1/4.92
0.0 25.0 50.00.0
Righting lever 1/26
0.0
1.0
0.0
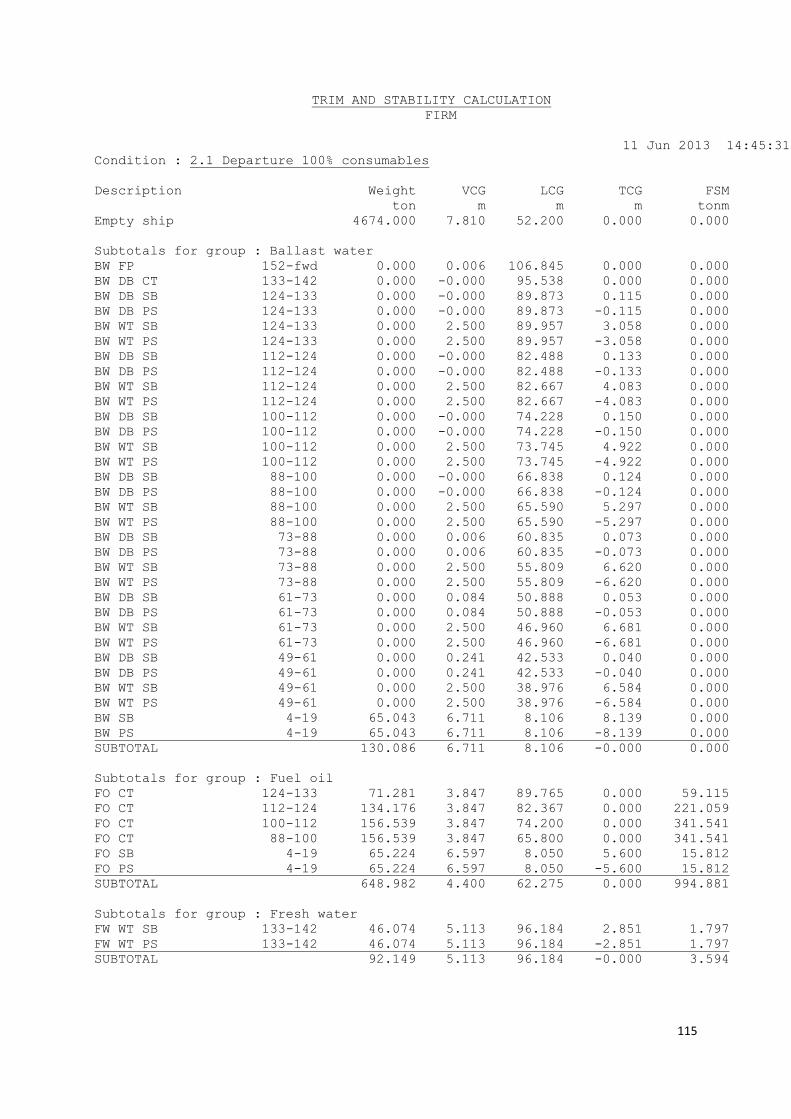
115
TRIM AND STABILITY CALCULATION
FIRM
11 Jun 2013 14:45:31
Condition : 2.1 Departure 100% consumables
Description Weight VCG LCG TCG FSM
ton m m m tonm
Empty ship 4674.000 7.810 52.200 0.000 0.000
Subtotals for group : Ballast water
BW FP 152-fwd 0.000 0.006 106.845 0.000 0.000
BW DB CT 133-142 0.000 -0.000 95.538 0.000 0.000
BW DB SB 124-133 0.000 -0.000 89.873 0.115 0.000
BW DB PS 124-133 0.000 -0.000 89.873 -0.115 0.000
BW WT SB 124-133 0.000 2.500 89.957 3.058 0.000
BW WT PS 124-133 0.000 2.500 89.957 -3.058 0.000
BW DB SB 112-124 0.000 -0.000 82.488 0.133 0.000
BW DB PS 112-124 0.000 -0.000 82.488 -0.133 0.000
BW WT SB 112-124 0.000 2.500 82.667 4.083 0.000
BW WT PS 112-124 0.000 2.500 82.667 -4.083 0.000
BW DB SB 100-112 0.000 -0.000 74.228 0.150 0.000
BW DB PS 100-112 0.000 -0.000 74.228 -0.150 0.000
BW WT SB 100-112 0.000 2.500 73.745 4.922 0.000
BW WT PS 100-112 0.000 2.500 73.745 -4.922 0.000
BW DB SB 88-100 0.000 -0.000 66.838 0.124 0.000
BW DB PS 88-100 0.000 -0.000 66.838 -0.124 0.000
BW WT SB 88-100 0.000 2.500 65.590 5.297 0.000
BW WT PS 88-100 0.000 2.500 65.590 -5.297 0.000
BW DB SB 73-88 0.000 0.006 60.835 0.073 0.000
BW DB PS 73-88 0.000 0.006 60.835 -0.073 0.000
BW WT SB 73-88 0.000 2.500 55.809 6.620 0.000
BW WT PS 73-88 0.000 2.500 55.809 -6.620 0.000
BW DB SB 61-73 0.000 0.084 50.888 0.053 0.000
BW DB PS 61-73 0.000 0.084 50.888 -0.053 0.000
BW WT SB 61-73 0.000 2.500 46.960 6.681 0.000
BW WT PS 61-73 0.000 2.500 46.960 -6.681 0.000
BW DB SB 49-61 0.000 0.241 42.533 0.040 0.000
BW DB PS 49-61 0.000 0.241 42.533 -0.040 0.000
BW WT SB 49-61 0.000 2.500 38.976 6.584 0.000
BW WT PS 49-61 0.000 2.500 38.976 -6.584 0.000
BW SB 4-19 65.043 6.711 8.106 8.139 0.000
BW PS 4-19 65.043 6.711 8.106 -8.139 0.000
SUBTOTAL 130.086 6.711 8.106 -0.000 0.000
Subtotals for group : Fuel oil
FO CT 124-133 71.281 3.847 89.765 0.000 59.115
FO CT 112-124 134.176 3.847 82.367 0.000 221.059
FO CT 100-112 156.539 3.847 74.200 0.000 341.541
FO CT 88-100 156.539 3.847 65.800 0.000 341.541
FO SB 4-19 65.224 6.597 8.050 5.600 15.812
FO PS 4-19 65.224 6.597 8.050 -5.600 15.812
SUBTOTAL 648.982 4.400 62.275 0.000 994.881
Subtotals for group : Fresh water
FW WT SB 133-142 46.074 5.113 96.184 2.851 1.797
FW WT PS 133-142 46.074 5.113 96.184 -2.851 1.797
SUBTOTAL 92.149 5.113 96.184 -0.000 3.594

116
Subtotals for group : Crew and stores
Crew and stores 15.000 14.000 75.000 0.000 0.000
SUBTOTAL 15.000 14.000 75.000 0.000 0.000
TOTAL 5560.217 7.358 53.135 -0.000 998.475
Hydrostatics Drafts and trim
Volume 5424.743 m3 Drafts above base :
LCF 45.328 m Draft mean (Lpp/2) 5.605 m
Mom. change trim 122.509 tonm/cm Draft aft (App) 5.587 m
Ton/cm immersion 17.182 ton/cm Draft fore (Fpp) 5.623 m
Specific weight 1.025 ton/m3 Trim 0.036 m
Transverse stability
KM transverse 10.676 m
VCG 7.358 m
GM solid 3.318 m
GG' correction 0.180 m
G'M liquid 3.138 m VCG' 7.538 m
The stability values are calculated for the actual trim.
Statical and dynamical stability, calculated with constant LCB :
Angle(SB) Draft mld. Trim KNsinφ VCG'sinφ TCGcosφ G'Nsinφ Area
degrees m m m m m m mrad
0.00 5.605 0.036 0.000 0.000 -0.000 0.000 0.000
2.00 5.603 0.043 0.372 0.263 -0.000 0.109 0.002
5.00 5.593 0.083 0.922 0.657 -0.000 0.265 0.012
10.00 5.554 0.222 1.808 1.309 -0.000 0.499 0.045
15.00 5.485 0.438 2.650 1.951 -0.000 0.699 0.098
20.00 5.389 0.667 3.421 2.578 -0.000 0.843 0.166
25.00 5.275 0.807 4.105 3.186 -0.000 0.919 0.243
30.00 5.130 0.892 4.730 3.769 -0.000 0.961 0.325
35.00 4.943 0.946 5.312 4.324 -0.000 0.988 0.410
40.00 4.695 0.985 5.863 4.845 -0.000 1.018 0.498
50.00 3.947 1.043 6.863 5.774 -0.000 1.088 0.682
60.00 2.803 1.051 7.518 6.528 -0.000 0.990 0.868
Statical angle of inclination is 0.000 degrees to starboard
Contour : FIRM
Opening is submerged at [degrees]
ER Vent in 58.59

117
Summary
Hydrostatics Criterion Value
Draft mld. 6.000 5.605 m
Trim 0.036 m
Statical angle of inclination 0.00 degrees SB
Flooding angle 58.59 degrees
Intact Stability Code for vessels with a large B/H ratio Criterion Value
Minimum metacentric height G'M 0.150 3.138 meter
Maximum GZ at 30 degrees or more 0.200 1.090 meter
Top of the GZ curve at least at 15.000 51.469 degrees
Area under the GZ curve up to 30 degrees 0.055 0.325 mrad
Area under the GZ curve between 30 and 40 degrees 0.030 0.173 mrad
Maximum angle of inclination acc. to IMO's A.562 weathercriterion50.00026.405 degrees
Maximum statical angle due to wind 16.000 2.310 degrees
Maximum statical angle 80% of angle of deck immersion 12.268 2.310 degrees
VCG'
Actual 7.538 m
Maximum allowable 8.685 m
Loading condition complies with the stated criteria.
Angle of inclination in degrees 1/4.92
0.0 25.0 50.00.0
Righting lever 1/22
0.0
1.0
0.0

118
TRIM AND STABILITY CALCULATION
FIRM
11 Jun 2013 14:45:56
Condition : 2.2 Arrival 10% consumables
Description Weight VCG LCG TCG FSM
ton m m m tonm
Empty ship 4674.000 7.810 52.200 0.000 0.000
Subtotals for group : Ballast water
BW FP 152-fwd 0.000 0.006 106.845 0.000 0.000
BW DB CT 133-142 45.273 1.509 95.456 0.000 0.000
BW DB SB 124-133 36.607 1.528 89.832 1.339 0.000
BW DB PS 124-133 36.607 1.528 89.832 -1.339 0.000
BW WT SB 124-133 0.000 2.500 89.957 3.058 0.000
BW WT PS 124-133 0.000 2.500 89.957 -3.058 0.000
BW DB SB 112-124 0.000 -0.000 82.488 0.133 0.000
BW DB PS 112-124 0.000 -0.000 82.488 -0.133 0.000
BW WT SB 112-124 0.000 2.500 82.667 4.083 0.000
BW WT PS 112-124 0.000 2.500 82.667 -4.083 0.000
BW DB SB 100-112 0.000 -0.000 74.228 0.150 0.000
BW DB PS 100-112 0.000 -0.000 74.228 -0.150 0.000
BW WT SB 100-112 0.000 2.500 73.745 4.922 0.000
BW WT PS 100-112 0.000 2.500 73.745 -4.922 0.000
BW DB SB 88-100 0.000 -0.000 66.838 0.124 0.000
BW DB PS 88-100 0.000 -0.000 66.838 -0.124 0.000
BW WT SB 88-100 0.000 2.500 65.590 5.297 0.000
BW WT PS 88-100 0.000 2.500 65.590 -5.297 0.000
BW DB SB 73-88 0.000 0.006 60.835 0.073 0.000
BW DB PS 73-88 0.000 0.006 60.835 -0.073 0.000
BW WT SB 73-88 0.000 2.500 55.809 6.620 0.000
BW WT PS 73-88 0.000 2.500 55.809 -6.620 0.000
BW DB SB 61-73 0.000 0.084 50.888 0.053 0.000
BW DB PS 61-73 0.000 0.084 50.888 -0.053 0.000
BW WT SB 61-73 0.000 2.500 46.960 6.681 0.000
BW WT PS 61-73 0.000 2.500 46.960 -6.681 0.000
BW DB SB 49-61 0.000 0.241 42.533 0.040 0.000
BW DB PS 49-61 0.000 0.241 42.533 -0.040 0.000
BW WT SB 49-61 0.000 2.500 38.976 6.584 0.000
BW WT PS 49-61 0.000 2.500 38.976 -6.584 0.000
BW SB 4-19 0.000 5.250 8.706 7.765 0.000
BW PS 4-19 0.000 5.250 8.706 -7.765 0.000
SUBTOTAL 118.488 1.521 91.980 -0.000 0.000
Subtotals for group : Fuel oil
FO CT 124-133 7.274 2.637 89.765 0.000 59.115
FO CT 112-124 13.691 2.638 82.367 0.000 221.055
FO CT 100-112 15.973 2.638 74.200 0.000 341.540
FO CT 88-100 15.973 2.637 65.800 0.000 341.540
FO SB 4-19 6.656 5.387 8.050 5.600 15.812
FO PS 4-19 6.656 5.387 8.050 -5.600 15.812
SUBTOTAL 66.223 3.190 62.275 -0.000 994.875
Subtotals for group : Fresh water
FW WT SB 133-142 4.701 2.816 96.292 2.181 1.999
FW WT PS 133-142 4.701 2.816 96.292 -2.181 1.999
SUBTOTAL 9.403 2.816 96.292 0.000 3.997

119
Subtotals for group : Crew and stores
Crew and stores 15.000 14.000 75.000 0.000 0.000
SUBTOTAL 15.000 14.000 75.000 0.000 0.000
TOTAL 4883.113 7.604 53.457 -0.000 998.872
Hydrostatics Drafts and trim
Volume 4764.014 m3 Drafts above base :
LCF 45.624 m Draft mean (Lpp/2) 5.173 m
Mom. change trim 114.257 tonm/cm Draft aft (App) 5.307 m
Ton/cm immersion 16.640 ton/cm Draft fore (Fpp) 5.039 m
Specific weight 1.025 ton/m3 Trim -0.268 m
Transverse stability
KM transverse 10.778 m
VCG 7.604 m
GM solid 3.174 m
GG' correction 0.205 m
G'M liquid 2.970 m VCG' 7.809 m
The stability values are calculated for the actual trim.
Statical and dynamical stability, calculated with constant LCB :
Angle(SB) Draft mld. Trim KNsinφ VCG'sinφ TCGcosφ G'Nsinφ Area
degrees m m m m m m mrad
0.00 5.173 -0.268 0.000 0.000 -0.000 0.000 0.000
2.00 5.170 -0.255 0.376 0.273 -0.000 0.103 0.002
5.00 5.158 -0.193 0.931 0.681 -0.000 0.251 0.011
10.00 5.112 -0.007 1.822 1.356 -0.000 0.466 0.043
15.00 5.033 0.258 2.664 2.021 -0.000 0.643 0.091
20.00 4.916 0.588 3.455 2.671 -0.000 0.784 0.154
25.00 4.770 0.884 4.159 3.300 -0.000 0.859 0.226
30.00 4.590 1.121 4.789 3.904 -0.000 0.885 0.302
35.00 4.361 1.332 5.367 4.479 -0.000 0.888 0.380
40.00 4.066 1.535 5.906 5.019 -0.000 0.887 0.457
50.00 3.171 1.993 6.915 5.982 -0.000 0.933 0.616
60.00 1.728 2.600 7.635 6.763 -0.000 0.873 0.777
Statical angle of inclination is 0.000 degrees to starboard
Contour : FIRM

120
Summary
Hydrostatics Criterion Value
Draft mld. 6.000 5.173 m
Trim -0.268 m
Statical angle of inclination 0.00 degrees SB
Flooding angle 60.00 degrees
Intact Stability Code for vessels with a large B/H ratio Criterion Value
Minimum metacentric height G'M 0.150 2.970 meter
Maximum GZ at 30 degrees or more 0.200 0.938 meter
Top of the GZ curve at least at 15.000 52.479 degrees
Area under the GZ curve up to 30 degrees 0.055 0.302 mrad
Area under the GZ curve between 30 and 40 degrees 0.030 0.155 mrad
Maximum angle of inclination acc. to IMO's A.562 weathercriterion50.00028.763 degrees
Maximum statical angle due to wind 16.000 2.867 degrees
Maximum statical angle 80% of angle of deck immersion 14.566 2.867 degrees
VCG'
Actual 7.809 m
Maximum allowable 8.665 m
Loading condition complies with the stated criteria.
Angle of inclination in degrees 1/4.92
0.0 25.0 50.00.0
Righting lever 1/19
0.0
0.0

121
TRIM AND STABILITY CALCULATION
FIRM
11 Jun 2013 14:46:17
Condition : 3.1 Departure 600t deckload
Description Weight VCG LCG TCG FSM
ton m m m tonm
Empty ship 4674.000 7.810 52.200 0.000 0.000
Subtotals for group : Ballast water
BW FP 152-fwd 0.000 0.006 106.845 0.000 0.000
BW DB CT 133-142 0.000 -0.000 95.538 0.000 0.000
BW DB SB 124-133 36.607 1.528 89.832 1.339 0.000
BW DB PS 124-133 36.607 1.528 89.832 -1.339 0.000
BW WT SB 124-133 0.000 2.500 89.957 3.058 0.000
BW WT PS 124-133 0.000 2.500 89.957 -3.058 0.000
BW DB SB 112-124 61.737 1.542 82.434 1.718 0.000
BW DB PS 112-124 61.737 1.542 82.434 -1.718 0.000
BW WT SB 112-124 0.000 2.500 82.667 4.083 0.000
BW WT PS 112-124 0.000 2.500 82.667 -4.083 0.000
BW DB SB 100-112 0.000 -0.000 74.228 0.150 0.000
BW DB PS 100-112 0.000 -0.000 74.228 -0.150 0.000
BW WT SB 100-112 0.000 2.500 73.745 4.922 0.000
BW WT PS 100-112 0.000 2.500 73.745 -4.922 0.000
BW DB SB 88-100 0.000 -0.000 66.838 0.124 0.000
BW DB PS 88-100 0.000 -0.000 66.838 -0.124 0.000
BW WT SB 88-100 0.000 2.500 65.590 5.297 0.000
BW WT PS 88-100 0.000 2.500 65.590 -5.297 0.000
BW DB SB 73-88 0.000 0.006 60.835 0.073 0.000
BW DB PS 73-88 0.000 0.006 60.835 -0.073 0.000
BW WT SB 73-88 0.000 2.500 55.809 6.620 0.000
BW WT PS 73-88 0.000 2.500 55.809 -6.620 0.000
BW DB SB 61-73 0.000 0.084 50.888 0.053 0.000
BW DB PS 61-73 0.000 0.084 50.888 -0.053 0.000
BW WT SB 61-73 0.000 2.500 46.960 6.681 0.000
BW WT PS 61-73 0.000 2.500 46.960 -6.681 0.000
BW DB SB 49-61 0.000 0.241 42.533 0.040 0.000
BW DB PS 49-61 0.000 0.241 42.533 -0.040 0.000
BW WT SB 49-61 0.000 2.500 38.976 6.584 0.000
BW WT PS 49-61 0.000 2.500 38.976 -6.584 0.000
BW SB 4-19 0.000 5.250 8.706 7.765 0.000
BW PS 4-19 0.000 5.250 8.706 -7.765 0.000
SUBTOTAL 196.688 1.537 85.188 -0.000 0.000
Subtotals for group : Fuel oil
FO CT 124-133 71.281 3.847 89.765 0.000 59.115
FO CT 112-124 134.176 3.847 82.367 0.000 221.059
FO CT 100-112 156.539 3.847 74.200 0.000 341.541
FO CT 88-100 156.539 3.847 65.800 0.000 341.541
FO SB 4-19 65.224 6.597 8.050 5.600 15.812
FO PS 4-19 65.224 6.597 8.050 -5.600 15.812
SUBTOTAL 648.982 4.400 62.275 0.000 994.881
Subtotals for group : Fresh water
FW WT SB 133-142 46.074 5.113 96.184 2.851 1.797
FW WT PS 133-142 46.074 5.113 96.184 -2.851 1.797
SUBTOTAL 92.149 5.113 96.184 -0.000 3.594

122
Subtotals for group : Crew and stores
Crew and stores 15.000 14.000 75.000 0.000 0.000
SUBTOTAL 15.000 14.000 75.000 0.000 0.000
Subtotals for group : Deck load
Deckload 600.000 9.000 23.000 0.000 0.000
SUBTOTAL 600.000 9.000 23.000 0.000 0.000
TOTAL 6226.818 7.346 52.184 -0.000 998.475
Hydrostatics Drafts and trim
Volume 6075.012 m3 Drafts above base :
LCF 45.219 m Draft mean (Lpp/2) 5.983 m
Mom. change trim 127.416 tonm/cm Draft aft (App) 5.991 m
Ton/cm immersion 17.544 ton/cm Draft fore (Fpp) 5.975 m
Specific weight 1.025 ton/m3 Trim -0.017 m
Transverse stability
KM transverse 10.523 m
VCG 7.346 m
GM solid 3.177 m
GG' correction 0.160 m
G'M liquid 3.017 m VCG' 7.506 m
The stability values are calculated for the actual trim.
Statical and dynamical stability, calculated with constant LCB :
Angle(SB) Draft mld. Trim KNsinφ VCG'sinφ TCGcosφ G'Nsinφ Area
degrees m m m m m m mrad
0.00 5.983 -0.017 0.000 0.000 0.000 -0.000 0.000
2.00 5.982 -0.014 0.367 0.262 0.000 0.105 0.002
5.00 5.974 0.002 0.914 0.654 0.000 0.260 0.011
10.00 5.942 0.083 1.801 1.303 0.000 0.497 0.045
15.00 5.886 0.215 2.636 1.943 0.000 0.693 0.097
20.00 5.823 0.244 3.368 2.567 0.000 0.801 0.163
25.00 5.744 0.187 4.034 3.172 0.000 0.862 0.236
30.00 5.639 0.076 4.656 3.753 0.000 0.903 0.313
35.00 5.495 -0.072 5.245 4.306 0.000 0.940 0.393
40.00 5.297 -0.248 5.811 4.825 0.000 0.986 0.477
50.00 4.725 -0.740 6.780 5.750 0.000 1.030 0.655
60.00 3.894 -1.552 7.391 6.501 0.000 0.891 0.826
Statical angle of inclination is 0.000 degrees to starboard
Contour : FIRM
Opening is submerged at [degrees]
ER Vent in 55.42

123
Summary
Hydrostatics Criterion Value
Draft mld. 6.000 5.983 m
Trim -0.017 m
Statical angle of inclination 0.00 degrees SB
Flooding angle 55.42 degrees
Intact Stability Code for vessels with a large B/H ratio Criterion Value
Minimum metacentric height G'M 0.150 3.017 meter
Maximum GZ at 30 degrees or more 0.200 1.032 meter
Top of the GZ curve at least at 15.000 48.583 degrees
Area under the GZ curve up to 30 degrees 0.055 0.313 mrad
Area under the GZ curve between 30 and 40 degrees 0.030 0.164 mrad
Maximum angle of inclination acc. to IMO's A.562 weathercriterion50.00027.225 degrees
Maximum statical angle due to wind 13.288 2.097 degrees
Maximum statical angle 80% of angle of deck immersion 10.029 2.097 degrees
VCG'
Actual 7.506 m
Maximum allowable 8.611 m
Loading condition complies with the stated criteria.
Angle of inclination in degrees 1/4.92
0.0 25.0 50.00.0
Righting lever 1/21
0.0
1.0
0.0
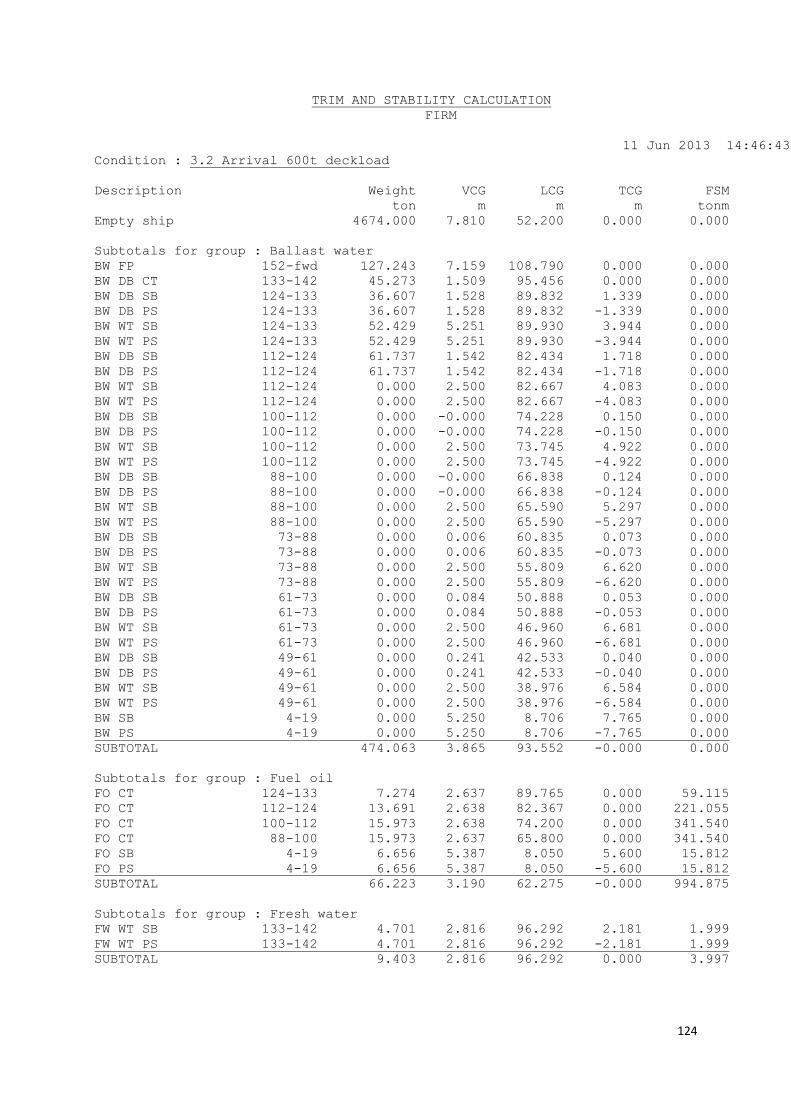
124
TRIM AND STABILITY CALCULATION
FIRM
11 Jun 2013 14:46:43
Condition : 3.2 Arrival 600t deckload
Description Weight VCG LCG TCG FSM
ton m m m tonm
Empty ship 4674.000 7.810 52.200 0.000 0.000
Subtotals for group : Ballast water
BW FP 152-fwd 127.243 7.159 108.790 0.000 0.000
BW DB CT 133-142 45.273 1.509 95.456 0.000 0.000
BW DB SB 124-133 36.607 1.528 89.832 1.339 0.000
BW DB PS 124-133 36.607 1.528 89.832 -1.339 0.000
BW WT SB 124-133 52.429 5.251 89.930 3.944 0.000
BW WT PS 124-133 52.429 5.251 89.930 -3.944 0.000
BW DB SB 112-124 61.737 1.542 82.434 1.718 0.000
BW DB PS 112-124 61.737 1.542 82.434 -1.718 0.000
BW WT SB 112-124 0.000 2.500 82.667 4.083 0.000
BW WT PS 112-124 0.000 2.500 82.667 -4.083 0.000
BW DB SB 100-112 0.000 -0.000 74.228 0.150 0.000
BW DB PS 100-112 0.000 -0.000 74.228 -0.150 0.000
BW WT SB 100-112 0.000 2.500 73.745 4.922 0.000
BW WT PS 100-112 0.000 2.500 73.745 -4.922 0.000
BW DB SB 88-100 0.000 -0.000 66.838 0.124 0.000
BW DB PS 88-100 0.000 -0.000 66.838 -0.124 0.000
BW WT SB 88-100 0.000 2.500 65.590 5.297 0.000
BW WT PS 88-100 0.000 2.500 65.590 -5.297 0.000
BW DB SB 73-88 0.000 0.006 60.835 0.073 0.000
BW DB PS 73-88 0.000 0.006 60.835 -0.073 0.000
BW WT SB 73-88 0.000 2.500 55.809 6.620 0.000
BW WT PS 73-88 0.000 2.500 55.809 -6.620 0.000
BW DB SB 61-73 0.000 0.084 50.888 0.053 0.000
BW DB PS 61-73 0.000 0.084 50.888 -0.053 0.000
BW WT SB 61-73 0.000 2.500 46.960 6.681 0.000
BW WT PS 61-73 0.000 2.500 46.960 -6.681 0.000
BW DB SB 49-61 0.000 0.241 42.533 0.040 0.000
BW DB PS 49-61 0.000 0.241 42.533 -0.040 0.000
BW WT SB 49-61 0.000 2.500 38.976 6.584 0.000
BW WT PS 49-61 0.000 2.500 38.976 -6.584 0.000
BW SB 4-19 0.000 5.250 8.706 7.765 0.000
BW PS 4-19 0.000 5.250 8.706 -7.765 0.000
SUBTOTAL 474.063 3.865 93.552 -0.000 0.000
Subtotals for group : Fuel oil
FO CT 124-133 7.274 2.637 89.765 0.000 59.115
FO CT 112-124 13.691 2.638 82.367 0.000 221.055
FO CT 100-112 15.973 2.638 74.200 0.000 341.540
FO CT 88-100 15.973 2.637 65.800 0.000 341.540
FO SB 4-19 6.656 5.387 8.050 5.600 15.812
FO PS 4-19 6.656 5.387 8.050 -5.600 15.812
SUBTOTAL 66.223 3.190 62.275 -0.000 994.875
Subtotals for group : Fresh water
FW WT SB 133-142 4.701 2.816 96.292 2.181 1.999
FW WT PS 133-142 4.701 2.816 96.292 -2.181 1.999
SUBTOTAL 9.403 2.816 96.292 0.000 3.997

125
Subtotals for group : Crew and stores
Crew and stores 15.000 14.000 75.000 0.000 0.000
SUBTOTAL 15.000 14.000 75.000 0.000 0.000
Subtotals for group : Deck load
Deckload 600.000 9.000 23.000 0.000 0.000
SUBTOTAL 600.000 9.000 23.000 0.000 0.000
TOTAL 5838.688 7.567 52.801 -0.000 998.872
Hydrostatics Drafts and trim
Volume 5696.363 m3 Drafts above base :
LCF 45.279 m Draft mean (Lpp/2) 5.768 m
Mom. change trim 124.970 tonm/cm Draft aft (App) 5.741 m
Ton/cm immersion 17.348 ton/cm Draft fore (Fpp) 5.796 m
Specific weight 1.025 ton/m3 Trim 0.055 m
Transverse stability
KM transverse 10.618 m
VCG 7.567 m
GM solid 3.051 m
GG' correction 0.171 m
G'M liquid 2.879 m VCG' 7.739 m
The stability values are calculated for the actual trim.
Statical and dynamical stability, calculated with constant LCB :
Angle(SB) Draft mld. Trim KNsinφ VCG'sinφ TCGcosφ G'Nsinφ Area
degrees m m m m m m mrad
0.00 5.768 0.055 0.000 0.000 -0.000 0.000 0.000
2.00 5.767 0.060 0.370 0.270 -0.000 0.100 0.002
5.00 5.757 0.089 0.919 0.674 -0.000 0.245 0.011
10.00 5.722 0.205 1.805 1.344 -0.000 0.461 0.042
15.00 5.657 0.397 2.648 2.003 -0.000 0.645 0.090
20.00 5.574 0.550 3.403 2.647 -0.000 0.756 0.152
25.00 5.474 0.613 4.079 3.270 -0.000 0.808 0.221
30.00 5.345 0.622 4.702 3.869 -0.000 0.833 0.292
35.00 5.175 0.597 5.287 4.439 -0.000 0.848 0.366
40.00 4.948 0.552 5.843 4.974 -0.000 0.869 0.441
50.00 4.270 0.400 6.832 5.928 -0.000 0.904 0.596
60.00 3.254 0.095 7.467 6.702 -0.000 0.765 0.746
Statical angle of inclination is 0.000 degrees to starboard
Contour : FIRM
Opening is submerged at [degrees]
ER Vent in 57.29

126
Summary
Hydrostatics Criterion Value
Draft mld. 6.000 5.768 m
Trim 0.055 m
Statical angle of inclination 0.00 degrees SB
Flooding angle 57.29 degrees
Intact Stability Code for vessels with a large B/H ratio Criterion Value
Minimum metacentric height G'M 0.150 2.879 meter
Maximum GZ at 30 degrees or more 0.200 0.905 meter
Top of the GZ curve at least at 15.000 49.012 degrees
Area under the GZ curve up to 30 degrees 0.055 0.292 mrad
Area under the GZ curve between 30 and 40 degrees 0.030 0.148 mrad
Maximum angle of inclination acc. to IMO's A.562 weathercriterion50.00027.421 degrees
Maximum statical angle due to wind 15.055 2.373 degrees
Maximum statical angle 80% of angle of deck immersion 11.334 2.373 degrees
VCG'
Actual 7.739 m
Maximum allowable 8.667 m
Loading condition complies with the stated criteria.
Angle of inclination in degrees 1/4.92
0.0 25.0 50.00.0
Righting lever 1/19
0.0
0.0

127
TRIM AND STABILITY CALCULATION
FIRM
11 Jun 2013 14:47:08
Condition : 4.1 Crane operation 100t@15m 100% consumables
Description Weight VCG LCG TCG FSM
ton m m m tonm
Empty ship 4674.000 7.810 52.200 0.000 0.000
Subtotals for group : Ballast water
BW FP 152-fwd 0.000 0.006 106.845 0.000 0.000
BW DB CT 133-142 45.273 1.509 95.456 0.000 0.000
BW DB SB 124-133 0.000 -0.000 89.873 0.115 0.000
BW DB PS 124-133 0.000 -0.000 89.873 -0.115 0.000
BW WT SB 124-133 0.000 2.500 89.957 3.058 0.000
BW WT PS 124-133 0.000 2.500 89.957 -3.058 0.000
BW DB SB 112-124 0.000 -0.000 82.488 0.133 0.000
BW DB PS 112-124 0.000 -0.000 82.488 -0.133 0.000
BW WT SB 112-124 0.000 2.500 82.667 4.083 0.000
BW WT PS 112-124 0.000 2.500 82.667 -4.083 0.000
BW DB SB 100-112 0.000 -0.000 74.228 0.150 0.000
BW DB PS 100-112 0.000 -0.000 74.228 -0.150 0.000
BW WT SB 100-112 0.000 2.500 73.745 4.922 0.000
BW WT PS 100-112 0.000 2.500 73.745 -4.922 0.000
BW DB SB 88-100 0.000 -0.000 66.838 0.124 0.000
BW DB PS 88-100 0.000 -0.000 66.838 -0.124 0.000
BW WT SB 88-100 0.000 2.500 65.590 5.297 0.000
BW WT PS 88-100 0.000 2.500 65.590 -5.297 0.000
BW DB SB 73-88 0.000 0.006 60.835 0.073 0.000
BW DB PS 73-88 0.000 0.006 60.835 -0.073 0.000
BW WT SB 73-88 89.737 5.290 56.126 7.765 0.000
BW WT PS 73-88 0.000 2.500 55.809 -6.620 0.000
BW DB SB 61-73 58.063 1.276 46.999 2.283 171.101
BW DB PS 61-73 0.000 0.084 50.888 -0.053 0.000
BW WT SB 61-73 81.731 5.256 46.871 7.863 0.000
BW WT PS 61-73 0.000 2.500 46.960 -6.681 0.000
BW DB SB 49-61 0.000 0.241 42.533 0.040 0.000
BW DB PS 49-61 0.000 0.241 42.533 -0.040 0.000
BW WT SB 49-61 82.189 5.298 38.518 7.892 0.000
BW WT PS 49-61 0.000 2.500 38.976 -6.584 0.000
BW SB 4-19 65.043 6.711 8.106 8.139 0.000
BW PS 4-19 0.000 5.250 8.706 -7.765 0.000
SUBTOTAL 422.037 4.546 46.467 6.279 171.101
Subtotals for group : Fuel oil
FO CT 124-133 71.281 3.847 89.765 0.000 59.115
FO CT 112-124 134.176 3.847 82.367 0.000 221.059
FO CT 100-112 156.539 3.847 74.200 0.000 341.541
FO CT 88-100 156.539 3.847 65.800 0.000 341.541
FO SB 4-19 65.224 6.597 8.050 5.600 15.812
FO PS 4-19 65.224 6.597 8.050 -5.600 15.812
SUBTOTAL 648.982 4.400 62.275 0.000 994.881
Subtotals for group : Fresh water
FW WT SB 133-142 46.074 5.113 96.184 2.851 1.797
FW WT PS 133-142 46.074 5.113 96.184 -2.851 1.797
SUBTOTAL 92.149 5.113 96.184 -0.000 3.594

128
Subtotals for group : Crew and stores
Crew and stores 15.000 14.000 75.000 0.000 0.000
SUBTOTAL 15.000 14.000 75.000 0.000 0.000
Subtotals for group : Deck load
Deckload 250t 250.000 9.000 23.000 0.000 0.000
SUBTOTAL 250.000 9.000 23.000 0.000 0.000
Subtotals for group : Crane
Crane load 100t 100.000 27.000 20.000 -20.500 0.000
Crane boom 50.000 25.000 20.000 -12.000 0.000
SUBTOTAL 150.000 26.333 20.000 -17.667 0.000
TOTAL 6252.168 7.703 51.622 0.000 1169.575
Hydrostatics Drafts and trim
Volume 6099.719 m3 Drafts above base :
LCF 45.096 m Draft mean (Lpp/2) 5.969 m
Mom. change trim 127.400 tonm/cm Draft aft (App) 6.109 m
Ton/cm immersion 17.544 ton/cm Draft fore (Fpp) 5.830 m
Specific weight 1.025 ton/m3 Trim -0.279 m
Transverse stability
KM transverse 10.534 m
VCG 7.703 m
GM solid 2.831 m
GG' correction 0.187 m
G'M liquid 2.644 m VCG' 7.890 m
The stability values are calculated for the actual trim.
Statical and dynamical stability, calculated with constant LCB :
Angle(SB) Draft mld. Trim KNsinφ VCG'sinφ TCGcosφ G'Nsinφ Area
degrees m m m m m m mrad
0.00 5.969 -0.279 0.000 0.000 0.000 -0.000 0.000
2.00 5.968 -0.277 0.367 0.275 0.000 0.092 0.002
5.00 5.960 -0.265 0.916 0.688 0.000 0.228 0.010
10.00 5.930 -0.197 1.806 1.370 0.000 0.436 0.039
15.00 5.878 -0.097 2.638 2.042 0.000 0.596 0.085
20.00 5.820 -0.115 3.363 2.699 0.000 0.665 0.140
25.00 5.746 -0.217 4.026 3.334 0.000 0.691 0.200
30.00 5.647 -0.374 4.646 3.945 0.000 0.701 0.260
35.00 5.509 -0.570 5.235 4.525 0.000 0.710 0.322
40.00 5.317 -0.798 5.801 5.072 0.000 0.730 0.385
50.00 4.762 -1.429 6.768 6.044 0.000 0.724 0.513
60.00 3.957 -2.464 7.379 6.833 0.000 0.546 0.627
Statical angle of inclination is 0.000 degrees to starboard
Contour : FIRM
Opening is submerged at [degrees]
ER Vent in 55.09

129
Summary
Hydrostatics Criterion Value
Draft mld. 6.000 5.969 m
Trim -0.279 m
Statical angle of inclination 0.00 degrees SB
Flooding angle 55.09 degrees
Intact Stability Code for vessels with a large B/H ratio Criterion Value
Minimum metacentric height G'M 0.150 2.644 meter
Maximum GZ at 30 degrees or more 0.200 0.741 meter
Top of the GZ curve at least at 15.000 44.956 degrees
Area under the GZ curve up to 30 degrees 0.055 0.260 mrad
Area under the GZ curve between 30 and 40 degrees 0.030 0.124 mrad
Maximum angle of inclination acc. to IMO's A.562 weathercriterion50.00029.537 degrees
Maximum statical angle due to wind 12.666 2.405 degrees
Maximum statical angle 80% of angle of deck immersion 9.546 2.405 degrees
VCG'
Actual 7.890 m
Maximum allowable 8.585 m
Loading condition complies with the stated criteria.
Angle of inclination in degrees 1/4.92
0.0 25.0 50.00.0
Righting lever 1/16
0.0
0.5
0.0
-0.5

130
TRIM AND STABILITY CALCULATION
FIRM
11 Jun 2013 14:47:32
Condition : 4.2 Crane operation 100t@15m 10% consumables
Description Weight VCG LCG TCG FSM
ton m m m tonm
Empty ship 4674.000 7.810 52.200 0.000 0.000
Subtotals for group : Ballast water
BW FP 152-fwd 0.000 0.006 106.845 0.000 0.000
BW DB CT 133-142 45.273 1.509 95.456 0.000 0.000
BW DB SB 124-133 36.607 1.528 89.832 1.339 0.000
BW DB PS 124-133 36.607 1.528 89.832 -1.339 0.000
BW WT SB 124-133 52.429 5.251 89.930 3.944 0.000
BW WT PS 124-133 52.429 5.251 89.930 -3.944 0.000
BW DB SB 112-124 61.737 1.542 82.434 1.718 0.000
BW DB PS 112-124 61.737 1.542 82.434 -1.718 0.000
BW WT SB 112-124 0.000 2.500 82.667 4.083 0.000
BW WT PS 112-124 0.000 2.500 82.667 -4.083 0.000
BW DB SB 100-112 0.000 -0.000 74.228 0.150 0.000
BW DB PS 100-112 0.000 -0.000 74.228 -0.150 0.000
BW WT SB 100-112 0.000 2.500 73.745 4.922 0.000
BW WT PS 100-112 0.000 2.500 73.745 -4.922 0.000
BW DB SB 88-100 0.000 -0.000 66.838 0.124 0.000
BW DB PS 88-100 0.000 -0.000 66.838 -0.124 0.000
BW WT SB 88-100 0.000 2.500 65.590 5.297 0.000
BW WT PS 88-100 0.000 2.500 65.590 -5.297 0.000
BW DB SB 73-88 0.000 0.006 60.835 0.073 0.000
BW DB PS 73-88 0.000 0.006 60.835 -0.073 0.000
BW WT SB 73-88 89.737 5.290 56.126 7.765 0.000
BW WT PS 73-88 0.000 2.500 55.809 -6.620 0.000
BW DB SB 61-73 58.063 1.276 46.999 2.283 171.101
BW DB PS 61-73 0.000 0.084 50.888 -0.053 0.000
BW WT SB 61-73 81.731 5.256 46.871 7.863 0.000
BW WT PS 61-73 0.000 2.500 46.960 -6.681 0.000
BW DB SB 49-61 0.000 0.241 42.533 0.040 0.000
BW DB PS 49-61 0.000 0.241 42.533 -0.040 0.000
BW WT SB 49-61 82.189 5.298 38.518 7.892 0.000
BW WT PS 49-61 0.000 2.500 38.976 -6.584 0.000
BW SB 4-19 65.043 6.711 8.106 8.139 0.000
BW PS 4-19 0.000 5.250 8.706 -7.765 0.000
SUBTOTAL 723.584 3.830 63.291 3.662 171.101
Subtotals for group : Fuel oil
FO CT 124-133 7.274 2.637 89.765 0.000 59.115
FO CT 112-124 13.691 2.638 82.367 0.000 221.055
FO CT 100-112 15.973 2.638 74.200 0.000 341.540
FO CT 88-100 15.973 2.637 65.800 0.000 341.540
FO SB 4-19 6.656 5.387 8.050 5.600 15.812
FO PS 4-19 6.656 5.387 8.050 -5.600 15.812
SUBTOTAL 66.223 3.190 62.275 -0.000 994.875
Subtotals for group : Fresh water
FW WT SB 133-142 4.701 2.816 96.292 2.181 1.999
FW WT PS 133-142 4.701 2.816 96.292 -2.181 1.999
SUBTOTAL 9.403 2.816 96.292 0.000 3.997

131
Subtotals for group : Crew and stores
Crew and stores 15.000 14.000 75.000 0.000 0.000
SUBTOTAL 15.000 14.000 75.000 0.000 0.000
Subtotals for group : Deck load
Deckload 250t 250.000 9.000 23.000 0.000 0.000
SUBTOTAL 250.000 9.000 23.000 0.000 0.000
Subtotals for group : Crane
Crane load 100t 100.000 27.000 20.000 -20.500 0.000
Crane boom 50.000 25.000 20.000 -12.000 0.000
SUBTOTAL 150.000 26.333 20.000 -17.667 0.000
TOTAL 5888.209 7.799 51.745 0.000 1169.973
Hydrostatics Drafts and trim
Volume 5744.709 m3 Drafts above base :
LCF 44.994 m Draft mean (Lpp/2) 5.747 m
Mom. change trim 125.351 tonm/cm Draft aft (App) 5.952 m
Ton/cm immersion 17.379 ton/cm Draft fore (Fpp) 5.541 m
Specific weight 1.025 ton/m3 Trim -0.411 m
Transverse stability
KM transverse 10.655 m
VCG 7.799 m
GM solid 2.856 m
GG' correction 0.199 m
G'M liquid 2.657 m VCG' 7.998 m
The stability values are calculated for the actual trim.
Statical and dynamical stability, calculated with constant LCB :
Angle(SB) Draft mld. Trim KNsinφ VCG'sinφ TCGcosφ G'Nsinφ Area
degrees m m m m m m mrad
0.00 5.747 -0.411 0.000 0.000 0.000 -0.000 0.000
2.00 5.745 -0.409 0.372 0.279 0.000 0.093 0.002
5.00 5.737 -0.390 0.924 0.697 0.000 0.227 0.010
10.00 5.703 -0.301 1.818 1.389 0.000 0.429 0.039
15.00 5.642 -0.146 2.663 2.070 0.000 0.593 0.084
20.00 5.569 -0.076 3.404 2.735 0.000 0.668 0.140
25.00 5.479 -0.093 4.071 3.380 0.000 0.691 0.199
30.00 5.361 -0.167 4.691 3.999 0.000 0.692 0.260
35.00 5.201 -0.278 5.274 4.587 0.000 0.687 0.320
40.00 4.985 -0.416 5.831 5.141 0.000 0.690 0.380
50.00 4.338 -0.813 6.816 6.127 0.000 0.689 0.501
60.00 3.369 -1.513 7.447 6.926 0.000 0.520 0.610
Statical angle of inclination is 0.000 degrees to starboard
Contour : FIRM
Opening is submerged at [degrees]
ER Vent in 56.69

132
Summary
Hydrostatics Criterion Value
Draft mld. 6.000 5.747 m
Trim -0.411 m
Statical angle of inclination 0.00 degrees SB
Flooding angle 56.69 degrees
Intact Stability Code for vessels with a large B/H ratio Criterion Value
Minimum metacentric height G'M 0.150 2.657 meter
Maximum GZ at 30 degrees or more 0.200 0.698 meter
Top of the GZ curve at least at 15.000 45.880 degrees
Area under the GZ curve up to 30 degrees 0.055 0.260 mrad
Area under the GZ curve between 30 and 40 degrees 0.030 0.120 mrad
Maximum angle of inclination acc. to IMO's A.562 weathercriterion50.00029.493 degrees
Maximum statical angle due to wind 14.050 2.585 degrees
Maximum statical angle 80% of angle of deck immersion 10.560 2.585 degrees
VCG'
Actual 7.998 m
Maximum allowable 8.631 m
Loading condition complies with the stated criteria.
Angle of inclination in degrees 1/4.92
0.0 25.0 50.00.0
Righting lever 1/15
0.0
0.5
0.0
-0.5

133
VII Loss of load calculation mono-hull
TRIM AND STABILITY CALCULATION
FIRM
11 Jun 2013 14:48:43
Condition : 5.1 Crane operation 100t@15m 100% consumables LOL Calc
Description Weight VCG LCG TCG FSM
ton m m m tonm
Empty ship 4674.000 7.810 52.200 0.000 0.000
Subtotals for group : Ballast water
BW FP 152-fwd 0.000 0.006 106.845 0.000 0.000
BW DB CT 133-142 45.273 1.509 95.456 0.000 0.000
BW DB SB 124-133 0.000 -0.000 89.873 0.115 0.000
BW DB PS 124-133 0.000 -0.000 89.873 -0.115 0.000
BW WT SB 124-133 0.000 2.500 89.957 3.058 0.000
BW WT PS 124-133 0.000 2.500 89.957 -3.058 0.000
BW DB SB 112-124 0.000 -0.000 82.488 0.133 0.000
BW DB PS 112-124 0.000 -0.000 82.488 -0.133 0.000
BW WT SB 112-124 0.000 2.500 82.667 4.083 0.000
BW WT PS 112-124 0.000 2.500 82.667 -4.083 0.000
BW DB SB 100-112 0.000 -0.000 74.228 0.150 0.000
BW DB PS 100-112 0.000 -0.000 74.228 -0.150 0.000
BW WT SB 100-112 0.000 2.500 73.745 4.922 0.000
BW WT PS 100-112 0.000 2.500 73.745 -4.922 0.000
BW DB SB 88-100 0.000 -0.000 66.838 0.124 0.000
BW DB PS 88-100 0.000 -0.000 66.838 -0.124 0.000
BW WT SB 88-100 0.000 2.500 65.590 5.297 0.000
BW WT PS 88-100 0.000 2.500 65.590 -5.297 0.000
BW DB SB 73-88 0.000 0.006 60.835 0.073 0.000
BW DB PS 73-88 0.000 0.006 60.835 -0.073 0.000
BW WT SB 73-88 0.000 2.500 55.809 6.620 0.000
BW WT PS 73-88 0.000 2.500 55.809 -6.620 0.000
BW DB SB 61-73 0.000 0.084 50.888 0.053 0.000
BW DB PS 61-73 0.000 0.084 50.888 -0.053 0.000
BW WT SB 61-73 0.000 2.500 46.960 6.681 0.000
BW WT PS 61-73 0.000 2.500 46.960 -6.681 0.000
BW DB SB 49-61 0.000 0.241 42.533 0.040 0.000
BW DB PS 49-61 0.000 0.241 42.533 -0.040 0.000
BW WT SB 49-61 0.000 2.500 38.976 6.584 0.000
BW WT PS 49-61 0.000 2.500 38.976 -6.584 0.000
BW SB 4-19 0.000 5.250 8.706 7.765 0.000
BW PS 4-19 0.000 5.250 8.706 -7.765 0.000
SUBTOTAL 45.273 1.509 95.455 0.000 0.000
Subtotals for group : Fuel oil
FO CT 124-133 71.281 3.847 89.765 0.000 59.115
FO CT 112-124 134.176 3.847 82.367 0.000 221.059
FO CT 100-112 156.539 3.847 74.200 0.000 341.541
FO CT 88-100 156.539 3.847 65.800 0.000 341.541
FO SB 4-19 65.224 6.597 8.050 5.600 15.812
FO PS 4-19 65.224 6.597 8.050 -5.600 15.812
SUBTOTAL 648.982 4.400 62.275 0.000 994.881
Subtotals for group : Fresh water
FW WT SB 133-142 46.074 5.113 96.184 2.851 1.797
FW WT PS 133-142 46.074 5.113 96.184 -2.851 1.797
SUBTOTAL 92.149 5.113 96.184 -0.000 3.594

134
Subtotals for group : Crew and stores
Crew and stores 15.000 14.000 75.000 0.000 0.000
SUBTOTAL 15.000 14.000 75.000 0.000 0.000
Subtotals for group : Deck load
Deckload 250t 250.000 9.000 23.000 0.000 0.000
SUBTOTAL 250.000 9.000 23.000 0.000 0.000
Subtotals for group : Crane
Crane boom 50.000 25.000 20.000 -12.000 0.000
SUBTOTAL 50.000 25.000 20.000 -12.000 0.000
TOTAL 5775.404 7.551 52.889 -0.104 998.475
Hydrostatics Drafts and trim
Volume 5634.659 m3 Drafts above base :
LCF 45.271 m Draft mean (Lpp/2) 5.732 m
Mom. change trim 124.475 tonm/cm Draft aft (App) 5.703 m
Ton/cm immersion 17.314 ton/cm Draft fore (Fpp) 5.761 m
Specific weight 1.025 ton/m3 Trim 0.058 m
Transverse stability
KM transverse 10.632 m
VCG 7.551 m
GM solid 3.081 m
GG' correction 0.173 m
G'M liquid 2.908 m VCG' 7.724 m
The stability values are calculated for the actual trim.
Statical and dynamical stability, calculated with constant LCB :
Angle(PS) Draft mld. Trim KNsinφ VCG'sinφ TCGcosφ G'Nsinφ Area
degrees m m m m m m mrad
0.00 5.732 0.058 0.000 0.000 0.104 -0.104 0.000
2.00 5.730 0.063 0.371 0.270 0.104 -0.003 0.000
5.00 5.721 0.094 0.920 0.673 0.103 0.143 0.004
10.00 5.684 0.216 1.805 1.341 0.102 0.362 0.026
15.00 5.618 0.414 2.648 1.999 0.100 0.549 0.066
20.00 5.532 0.587 3.408 2.642 0.098 0.668 0.120
25.00 5.429 0.672 4.085 3.264 0.094 0.727 0.181
30.00 5.297 0.696 4.709 3.862 0.090 0.757 0.246
35.00 5.123 0.690 5.293 4.430 0.085 0.777 0.313
40.00 4.891 0.665 5.848 4.965 0.080 0.804 0.382
50.00 4.196 0.564 6.840 5.917 0.067 0.856 0.527
60.00 3.151 0.335 7.479 6.689 0.052 0.738 0.671
Statical angle of inclination is 2.056 degrees to portside
Opening is submerged at [degrees]
ER Vent out 57.59

135
Summary
Hydrostatics Criterion Value
Draft mld. 6.000 5.732 m
Trim 0.058 m
Statical angle of inclination 2.06 degrees PS
Flooding angle 57.59 degrees
DNV loss load Criterion Value
DNV Loss of Load (Pt. 5 Ch. 7 Sec 17 D) Area A2> 1,4 A1 1.400 8.382 -
DNV Loss of Load, angle max 15 degrees 15.000 5.743 degrees
VCG'
A non-zero statical angle of equilibrium occurs,
No maximum allowable VCG' is calculated.
Loading condition complies with the stated criteria.
Angle of inclination in degrees 1/3.69
0.0 25.0 50.00.0
Righting lever 1/11
0.0
0.5
0.0

136
TRIM AND STABILITY CALCULATION
FIRM
11 Jun 2013 14:49:35
Condition : 5.2 Crane operation 100t@15m 10% consumables LOL Calc
Description Weight VCG LCG TCG FSM
ton m m m tonm
Empty ship 4674.000 7.810 52.200 0.000 0.000
Subtotals for group : Ballast water
BW FP 152-fwd 0.000 0.006 106.845 0.000 0.000
BW DB CT 133-142 45.273 1.509 95.456 0.000 0.000
BW DB SB 124-133 36.607 1.528 89.832 1.339 0.000
BW DB PS 124-133 36.607 1.528 89.832 -1.339 0.000
BW WT SB 124-133 52.429 5.251 89.930 3.944 0.000
BW WT PS 124-133 52.429 5.251 89.930 -3.944 0.000
BW DB SB 112-124 61.737 1.542 82.434 1.718 0.000
BW DB PS 112-124 61.737 1.542 82.434 -1.718 0.000
BW WT SB 112-124 0.000 2.500 82.667 4.083 0.000
BW WT PS 112-124 0.000 2.500 82.667 -4.083 0.000
BW DB SB 100-112 0.000 -0.000 74.228 0.150 0.000
BW DB PS 100-112 0.000 -0.000 74.228 -0.150 0.000
BW WT SB 100-112 0.000 2.500 73.745 4.922 0.000
BW WT PS 100-112 0.000 2.500 73.745 -4.922 0.000
BW DB SB 88-100 0.000 -0.000 66.838 0.124 0.000
BW DB PS 88-100 0.000 -0.000 66.838 -0.124 0.000
BW WT SB 88-100 0.000 2.500 65.590 5.297 0.000
BW WT PS 88-100 0.000 2.500 65.590 -5.297 0.000
BW DB SB 73-88 0.000 0.006 60.835 0.073 0.000
BW DB PS 73-88 0.000 0.006 60.835 -0.073 0.000
BW WT SB 73-88 0.000 2.500 55.809 6.620 0.000
BW WT PS 73-88 0.000 2.500 55.809 -6.620 0.000
BW DB SB 61-73 0.000 0.084 50.888 0.053 0.000
BW DB PS 61-73 0.000 0.084 50.888 -0.053 0.000
BW WT SB 61-73 0.000 2.500 46.960 6.681 0.000
BW WT PS 61-73 0.000 2.500 46.960 -6.681 0.000
BW DB SB 49-61 0.000 0.241 42.533 0.040 0.000
BW DB PS 49-61 0.000 0.241 42.533 -0.040 0.000
BW WT SB 49-61 0.000 2.500 38.976 6.584 0.000
BW WT PS 49-61 0.000 2.500 38.976 -6.584 0.000
BW SB 4-19 0.000 5.250 8.706 7.765 0.000
BW PS 4-19 0.000 5.250 8.706 -7.765 0.000
SUBTOTAL 346.820 2.656 87.962 -0.000 0.000
Subtotals for group : Fuel oil
FO CT 124-133 7.274 2.637 89.765 0.000 59.115
FO CT 112-124 13.691 2.638 82.367 0.000 221.055
FO CT 100-112 15.973 2.638 74.200 0.000 341.540
FO CT 88-100 15.973 2.637 65.800 0.000 341.540
FO SB 4-19 6.656 5.387 8.050 5.600 15.812
FO PS 4-19 6.656 5.387 8.050 -5.600 15.812
SUBTOTAL 66.223 3.190 62.275 -0.000 994.875
Subtotals for group : Fresh water
FW WT SB 133-142 4.701 2.816 96.292 2.181 1.999
FW WT PS 133-142 4.701 2.816 96.292 -2.181 1.999
SUBTOTAL 9.403 2.816 96.292 0.000 3.997

137
Subtotals for group : Crew and stores
Crew and stores 15.000 14.000 75.000 0.000 0.000
SUBTOTAL 15.000 14.000 75.000 0.000 0.000
Subtotals for group : Deck load
Deckload 250t 250.000 9.000 23.000 0.000 0.000
SUBTOTAL 250.000 9.000 23.000 0.000 0.000
Subtotals for group : Crane
Crane boom 50.000 25.000 20.000 -12.000 0.000
SUBTOTAL 50.000 25.000 20.000 -12.000 0.000
TOTAL 5411.445 7.645 53.109 -0.111 998.872
Hydrostatics Drafts and trim
Volume 5279.638 m3 Drafts above base :
LCF 45.309 m Draft mean (Lpp/2) 5.507 m
Mom. change trim 121.204 tonm/cm Draft aft (App) 5.542 m
Ton/cm immersion 17.090 ton/cm Draft fore (Fpp) 5.472 m
Specific weight 1.025 ton/m3 Trim -0.070 m
Transverse stability
KM transverse 10.720 m
VCG 7.645 m
GM solid 3.075 m
GG' correction 0.185 m
G'M liquid 2.890 m VCG' 7.830 m
The stability values are calculated for the actual trim.
Statical and dynamical stability, calculated with constant LCB :
Angle(PS) Draft mld. Trim KNsinφ VCG'sinφ TCGcosφ G'Nsinφ Area
degrees m m m m m m mrad
0.00 5.507 -0.070 0.000 0.000 0.111 -0.111 0.000
2.00 5.505 -0.062 0.373 0.273 0.111 -0.011 0.000
5.00 5.494 -0.019 0.925 0.682 0.110 0.132 0.003
10.00 5.454 0.128 1.813 1.360 0.109 0.344 0.024
15.00 5.383 0.353 2.655 2.027 0.107 0.522 0.062
20.00 5.283 0.603 3.432 2.678 0.104 0.650 0.114
25.00 5.162 0.771 4.119 3.309 0.100 0.709 0.174
30.00 5.010 0.885 4.744 3.915 0.096 0.733 0.237
35.00 4.814 0.968 5.325 4.491 0.091 0.743 0.301
40.00 4.557 1.035 5.872 5.033 0.085 0.754 0.366
50.00 3.777 1.165 6.876 5.998 0.071 0.806 0.503
60.00 2.569 1.274 7.543 6.781 0.055 0.707 0.639
Statical angle of inclination is 2.217 degrees to portside
Opening is submerged at [degrees]
ER Vent out 59.21

138
Summary
Hydrostatics Criterion Value
Draft mld. 6.000 5.507 m
Trim -0.070 m
Statical angle of inclination 2.22 degrees PS
Flooding angle 59.21 degrees
DNV loss load Criterion Value
DNV Loss of Load (Pt. 5 Ch. 7 Sec 17 D) Area A2> 1,4 A1 1.400 6.323 -
DNV Loss of Load, angle max 15 degrees 15.000 6.269 degrees
VCG'
A non-zero statical angle of equilibrium occurs,
No maximum allowable VCG' is calculated.
Loading condition complies with the stated criteria.
Angle of inclination in degrees 1/3.69
0.0 25.0 50.00.0
Righting lever 1/10
0.0
0.5
0.0

139
VIII Background information Strip Theory
A vessel sailing in waves has six degrees of freedom of and about the centre of gravity (CoG), as illustrated
in the figure below.
Figure 63, Definition of ship motions
The equations of motion of an oscillating ship with six degrees of freedom have to be written as follows
(Newton’s second law):
6
1
sum of all forces or moments in direction for: 1,...6ij ij
M x i i
1 = Surge 2 = Sway 3 = Heave 4 = Roll 5 = Pitch 6 = Yaw The right hand side of these equations consists of a superposition of:
Exciting wave forces and moments on the restrained body, and
Hydromechanic forces and moments, caused by a harmonic oscillation of the rigid body in the undisturbed surface of a fluid previously at rest.

140
Therefore a vessel moving in waves can be considered to be a linear mass-damper-spring system with frequency dependent coefficients and linear exciting forces and moments. Given Newton’s second law and the six degrees of freedom, the equations of motions become:
6
1
( ) for: 1,...6
Solid mass or solid mass moments of inertia
Added mass or added mass moments of inertia
Acceleration of harmonic oscillation in direc
ij ij i ij i ij i ij
ij
ij
i
M a x b x c x F i
M
a
x
tion i
Velocity of harmonic oscillation in direction i
Displacement of harmonic oscillation in direction i
Hydrodynamic damping coefficient
Spring coefficient
Harmonic exciting wave force
i
i
ij
ij
i
x
x
b
c
F
or moment in direction i
Strip theory divides the ship in a finite number of cross sections, which are rigidly connected to each
other, for which the 2 dimensional hydromechanics and exciting wave loads are calculated. These values are then integrated over the ships length numerically to obtain 3 dimensional values. Each 2 dimensional cross section is treated hydrodynamically as if it is a segment of an infinitely long floating cylinder;
Figure 64, Definition of vessel cross sections, strip theory
Assumptions:
For zero speed case, interactions between the cross sections are ignored.
All waves which are produced by the oscillating ship (hydromechanics loads) and the diffracted waves (wave loads) are assumed to travel parallel to the (y,z)-plane of the ship.
The fore and aft side of the body does not produce waves in the x-direction.
Strip theory is valid for long and slender bodies only.

141
IX Seakeeping performances indices (NORDFORSK)

142

143

144
X Dynamic positioning calculations mono-hull
X.ABackground information on DP
There are three types of forces acting on a vessel in DP:
Environmental forces
Fluid reaction forces
Thruster forces In an idealized situation the sum of all the forces is zero, so the acceleration of the forces is zero.
_environment reaction DPsystem generatedF F F
Environmental forces are excitation forces, forces that make the vessel move from target position. Due to
the mass of the vessel it is not responsive to fast variations of the exciting forces. Environmental forces are built up from three components:
Wind forces
Current forces
Wave forces
Wind Two types of wind forces:
Steady flow force
Dynamic wind The steady flow force is calculated with Bernoulli:
21
2DF v AC
The difficulty lies within the drag coefficient (CD) value which is shape dependent and determined using wind tunnel tests and estimation of empirical coefficients for “standard shapes”. The CD values are valid within a certain range of Reynolds numbers and a specific shape.
Dynamic wind (gusting) forces can be calculated using a wind spectrum:
Harris
Ochi Shin
DnV These are various wind spectrum formulations and the low frequency part is the most important and can
be quite different, depending on the spectral fit formulation. Wind is normally defined to be 1 hour sustained (mean) wind speed, but the 10 minute and 1 minute values are about 25 and 40% higher.
Current Current forces have similarity with wind flow forces and are calculated with the same equation.
21
2C DF v AC
In addition to the effects which were also found for wind (velocity profile, Reynolds number dependency, vortex shedding and dynamic effects due to turbulence) there is another strong effect: Keel clearance (water depth to draft ratio) effect for shallow waters.
Waves Third force on a vessel is caused by waves and is called wave drift forces; they are divided into two
components: First order wave drift forces
Second order wave drift forces The first order wave drift forces are oscillatory forces around zero mean and described by the following
equation:

145
Regular wave:
( ) sin( )
First order forces:
( ) sin( )
a
a
t t
F t F t
Second order wave drift forces: A floating body encounters incoming waves and these waves are reflected by the body. Second order wave
forces are caused by second order pressures: Bernoulli
Relative motion 2
0
1
2p p gz V
t
To calculate the wave drift forces, the pressure has to be integrated over the surface of the vessel. This force causes a body to slowly drift with the waves. For regular waves the wave drift forces are constant for a certain frequency and depend on the amplitude squared. In irregular waves it is more complicated, the drift forces slowly vary. The wave amplitude is dependent on the summation of multiple waves:
1
( ) sin( )n
i i ii
t
An example for 2 waves with different frequency and phase:
2
1
21 2
2 21 2 1 2
1 2
( ) sin( )
( ) ( ) ( )
2 cos( )
with
i i ii
t
A t t t
t
The low frequency part of the square of the wave envelope can now be defined as follows:
2
2
21 2
1 2
1 (definition of wave energy)
21
( ) (2 )2
8 ( ) ( )
n
A
S
S
S S
Generalization for an irregular wave train with infinite frequencies yields the following expression for the
spectral density of all wave groups with frequency difference µ:
2
0
( ) 8 ( ) ( )A
S S S d
The mean wave drift force in a regular wave with frequency ω and amplitude ς is given by: (2) 2
1i iiX P
In which Pii is the quadratic transfer function, this can be computed using diffraction theory at V=0.
Using 2
2 2 21 2 1 2
0
( ) 2 cos( )
( ) 8 ( ) ( )A
A t t
S S S d

146
It can be derived that:
(2)
1 1 0
2
0
2 ( ) ( , )
( ) 8 ( ) ( ) ( , )
n n
i i j iji j
i j
F
X P S P d
S S S P d
In which SF is the low frequency spectral density of the wave drift force [kN²m4s]. So in order to calculate
the wave drift forces on a vessel one needs to have a wave spectrum for a certain area and a transfer function of the mean second-order drift forces.
Other side of force balance The forces on the vessel created by wind, current and waves have to be opposed by thruster forces. The
types of thruster used are:
Azimuth thrusters, or rudder propellers, with or without nozzles
Podded thrusters
Main propellers in combination with rudders
Tunnel thrusters
Voith Schneider propeller Each of these systems are designed to accelerate water to create a reaction force. Open water thrust and
torque for a propeller are calculated with: 4 2
5 2
T
Q
T K D n
Q K D n
In which KT and KQ are the dimensionless thrust and torque coefficients for a certain propeller. In case of DP the advance speed is 0, similar as in bollard condition. This means that the advance coefficient J is also 0, so values for KT and KQ are high for zero speed. Given an open water propeller diagram for a B-series propeller:

147
X.B DP calculations mono-hull
Figure 65, Cd coëfficient ellipse
Stations: The vessels hull is subdivided in sections of 5 meters in length and a corresponding drag coefficient is
calculated. Below there is a picture of all stations, mirrored at the design waterline. It is clearly visible that an ellipse is a good comparison for the stations, with horizontal orientated ellipses in the aft and vertical oriented ellipses in the front of the vessel.
Figure 66, Stations mono-hull mirrored
0
0,2
0,4
0,6
0,8
1
1,2
1,4
0 2 4 6 8 10
CD
B/2T
CD coefficients for an ellipse
Series1

148
Section Shape T [m]
2T [m]
B [m] Re B/2T [-]
Cd [-]
dX [m]
dF [kN]
x wrt L/2 [m]
M [kNm]
1 Ellipse 0.97 1.94 17.65 14242 9.10 0.31 5 0.82 -57.5 -47.37
2 Ellipse 1.35 2.7 18.21 14694 6.74 0.25 5 0.91 -52.5 -47.58
3 Ellipse 2.02 4.04 18.38 14831 4.55 0.33 5 1.79 -47.5 -84.84
4 Ellipse 2.94 5.88 18.46 14895 3.14 0.42 5 3.33 -42.5 -141.41
5 Ellipse 3.86 7.72 18.5 14928 2.40 0.52 5 5.49 -37.5 -205.86
6 Ellipse 4.61 9.22 18.51 14936 2.01 0.62 5 7.80 -32.5 -253.43
7 Ellipse 5.14 10.3 18.51 14936 1.80 0.70 5 9.70 -27.5 -266.69
8 Ellipse 5.44 10.9 18.5 14928 1.70 0.74 5 10.87 -22.5 -244.48
9 Ellipse 5.6 11.2 18.49 14919 1.65 0.76 5 11.52 -17.5 -201.52
10 Ellipse 5.72 11.4 18.46 14895 1.61 0.78 5 12.03 -12.5 -150.34
11 Ellipse 5.85 11.7 18.35 14807 1.57 0.80 5 12.64 -7.5 -94.83
12 Ellipse 5.92 11.8 18.22 14702 1.54 0.81 5 13.03 -2.5 -32.58
13 Ellipse 5.97 11.9 17.93 14468 1.50 0.83 5 13.45 2.5 33.63
14 Ellipse 5.99 12 17.46 14088 1.46 0.85 5 13.88 7.5 104.10
15 Ellipse 6 12 16.76 13524 1.40 0.89 5 14.46 12.5 180.76
16 Ellipse 6 12 15.77 12725 1.31 0.94 5 15.27 17.5 267.26
17 Ellipse 6 12 14.48 11684 1.21 1.01 5 16.43 22.5 369.71
18 Ellipse 6 12 12.94 10441 1.08 1.10 5 17.98 27.5 494.47
19 Ellipse 6 12 11.26 9086 0.94 1.22 5 19.90 32.5 646.66
20 Ellipse 6 12 9.48 7649 0.79 1.36 5 22.21 37.5 833.04
21 Ellipse 6 12 7.63 6157 0.64 1.53 5 24.97 42.5 1061.30
22 Ellipse 6 12 5.69 4591 0.47 1.74 5 28.29 47.5 1343.84
23 Ellipse 5.99 12 3.57 2881 0.30 1.99 5 32.41 52.5 1701.76
24 Ellipse 2.16 4.32 0.92 742 0.21 2.13 5 12.50 57.5 718.60
SUM 0.94 321.67 5984.19 Table 58, Current forces and moments mono-hull

149
Section Shape A [m²] Cd dX [m] dF wind [kN]
x wrt L/2 [m]
M wind [kN]
1 Solid area 10 1.2 5 1.751 -57.5 -100.66
2 Solid area 10 1.2 5 1.751 -52.5 -91.911
3 Solid area 10 1.2 5 1.751 -47.5 -83.157
4 Solid area 10 1.2 5 1.751 -42.5 -74.404
5 Solid area 10 1.2 5 1.751 -37.5 -65.651
6 Solid area 10 1.2 5 1.751 -32.5 -56.897
7 Solid area 10 1.2 5 1.751 -27.5 -48.144
8 Solid area 19.36 1.2 5 3.389 -22.5 -76.26
9 Solid area 54.85 1.2 5 9.602 -17.5 -168.04
10 Solid area 66.04 1.2 5 11.56 -12.5 -144.52
11 Solid area 78.12 1.2 5 13.68 -7.5 -102.57
12 Solid area 110.1 1.2 5 19.28 -2.5 -48.192
13 Solid area 109.7 1.2 5 19.21 2.5 48.021
14 Solid area 103.1 1.2 5 18.04 7.5 135.31
15 Solid area 91.63 1.2 5 16.04 12.5 200.52
16 Solid area 84.72 1.2 5 14.83 17.5 259.56
17 Solid area 82.77 1.2 5 14.49 22.5 326.03
18 Solid area 78.38 1.2 5 13.72 27.5 377.35
19 Solid area 71.56 1.2 5 12.53 32.5 407.16
20 Solid area 74.42 1.2 5 13.03 37.5 488.57
21 Solid area 71.95 1.2 5 12.6 42.5 535.34
22 Solid area 68.98 1.2 5 12.08 47.5 573.62
23 Solid area 65.25 1.2 5 11.42 52.5 599.72
24 Solid area 39.82 1.2 5 6.971 57.5 400.84
SUM 1341 234.7 3291.6 Table 59, Wind forces and moments mono-hull

150
XI Catamaran database
Name Loa [m] Lwl [m] Beam [m] Beam demihull [m] Lwl/Bdemi Lwl/B
Sun Eagle 29.2 26.6 9.5 2.5 10.64 2.80
Jet Caraibe 35 31.3 9.4 3.8 8.24 3.33
Seamax 39.5 33.3 11.4 3.6 9.25 2.92
Dodekanisos Express 40.05 34.6 11.5 3.5 9.89 3.01
Royal ferry 40.25 37 9.3 3.2 11.56 3.98
CNM Evolution 43.1 40.1 10.4 2.4 16.71 3.86
Brelyan 44 39 12 3.41 11.44 3.25
Eid Travel 46 41.7 12 4.33 9.63 3.48
Jade Express 48 41.6 13 4.88 8.52 3.20
San Gwann (KvFj) 49 43.1 12.5 3.1 13.90 3.45
Madikera 49.45 43.6 14 3.11
SSTH 50 (d) IHI LTD 49.9 8
San Gwann (Fjellstrand) 51 48 12.5 3.3 14.55 3.84
FBM 53 Tricat 52.8 47.5 13 3.65
LA Viking Two 55 47.5 15.2 4.1 11.59 3.13
55m RO/RO PTE LTD 55 15
Autoexpress 56 56 49.8 14 3.56
K40 Incat (d) 58 52 14.5 3.59
Turgut Reis 1 59.9 51.2 17.5 4.5 11.38 2.93
Nordic Jet 60 54.5 16.5 3.95 13.80 3.30
Solidor 5 60 56.5 16.9 3.9 14.49 3.34
Sea Bird 62 56.6 15.4 3.4 16.65 3.68
63m RO/RO PTE LTD 63 16
Autoexpress 66 Austal 66.2 59 18.2 3.24
Juan Patricio 70.36 63.9 19.5 5 12.78 3.28
Highspeed 2 72 63.5 17.5 4.73 13.42 3.63
Ocean arrow 72.09 70.2 12.9 4.69 14.97 5.44
73m CAR FERRY (d) AMHS 73.4 63.8 18 3.54
Juan L 74.2 60.5 26 4.33 13.97 2.33
Mai Mols 76.12 63 23.4 4.6 13.70 2.69
HighSpeed 1 76.6 68 22.2 6.15 11.06 3.06
Luciano Fedderico L 77.32 69.9 19 5.65 12.37 3.68
Condor 11 77.5 63.9 26 4.33 14.76 2.46
Cat Link 3 78.6 66.5 23 4.3 15.47 2.89
Sunflower 79.25 72.3 19.5 5 14.46 3.71
A50 Afai ShipsLTD 80.1 72.3 19 5 14.46 3.81
Condor 12 81.15 66.3 26 4.33 15.31 2.55
Autoexpress82 82.3 69 23 5.2 13.27 3.00
INCAT 86 86.3 76.4 26 4.3 17.77 2.94
Autoexpress 86 86.6 74.2 24 5.31 13.97 3.09
Condor Express 86.62 76.4 26 4.33 17.64 2.94
Stena Charisma 88 76.4 30 7 10.91 2.55
90m Schelde (d0 89.8 81.6 24 3.40
Devil Cat 91.3 81.3 26 4.33 18.78 3.13
Highspeed 4 92.6 80.6 24 5.34 15.09 3.36
Incat Tasmania 92.7 92 26.6 4.33 21.25 3.46
Austal cargo 95 95 29
Autoexpress 96 Austal 95.8 82.5 24.2 3.41
Bonanza express 96 86 26.2 4.5 19.11 3.28
Hayabusa 99.78 89 20 5.79 15.37 4.45
Hayabusa AMD 100 20
Euroferrys Express 101 88.7 26.7 6.79 13.06 3.32
105m Schelde (d) 105.4 100.8 29.2 3.45
Austal Track Express 112 112 25
INCAT 112 (d) 112.6 105.6 30.2 3.50
INCAT 120m 120 117.5 29 4.05
Pacificat Explorer 122.5 96 25.8 6 16.00 3.72
Autoexpress 125 (d) 125 106.5 31.7 3.36

151
Name
Depth [m] Draft [m] B/T Tunnel width St [m] (St+Bdemi)/LWL Bdemi/Draft
Sun Eagle
1.5 1.67 4.5 0.26 1.67
Jet Caraibe 3.5 1.4 2.71 1.8 0.18 2.71
Seamax
1.9 1.89 4.2 0.23 1.89
Dodekanisos Express 3.2 1.81 1.93 4.5 0.23 1.93
Royal ferry 3.5 1.5 2.13 2.9 0.16 2.13
CNM Evolution 4.1 1.44 1.67 5.6 0.20 1.67
Brelyan
1.75 1.95 5.18 0.22 1.95
Eid Travel
3.34 0.18 Jade Express 4 1.4 3.49 3.24 0.20 3.49
San Gwann (KvFj) 4.65 1.95 1.59 6.3 0.22 1.59
Madikera
2.35
14 0.32 0.00
SSTH 50 (d) IHI LTD
8 San Gwann (Fjellstrand) 4.75 1.95 1.69 5.9 0.19 1.69
FBM 53 Tricat
1.62
13 0.27 LA Viking Two 4.5 2 2.05 7 0.23 2.05
55m RO/RO PTE LTD
2
15 Autoexpress 56
2.7
14 0.28
K40 Incat (d)
2
14.5 0.28 Turgut Reis 1 5.65 2 2.25 8.5 0.25 2.25
Nordic Jet 5.85 2.9 1.36 8.6 0.23 1.36
Solidor 5 5.85 2.7 1.44 9.1 0.23 1.44
Sea Bird 5.4 2.3 1.48 8.6 0.21 1.48
63m RO/RO PTE LTD
2
16 Autoexpress 66 Austal
2.5
18.2 0.31
Juan Patricio 5.65 2.1 2.38 9.5 0.23 2.38
Highspeed 2 5.9 2.5 1.89 8.04 0.20 1.89
Ocean arrow 4.5 2.05 2.29 3.52 0.12 2.29
73m CAR FERRY (d) AMHS
2.7
18 0.28 Juan L
3 1.44 17.34 0.36 1.44
Mai Mols 8.05 3.38 1.36 14.2 0.30 1.36
HighSpeed 1 7.2 3 2.05 9.9 0.24 2.05
Luciano Fedderico L
2.23 2.53 7.7 0.19 2.53
Condor 11 7.2 3.4 1.27 17.34 0.34 1.27
Cat Link 3 7 2.5 1.72 14.4 0.28 1.72
Sunflower
2.16 2.31 9.5 0.20 2.31
A50 Afai ShipsLTD
1.2 4.17 9 0.19 4.17
Condor 12
3 1.44 17.34 0.33 1.44
Autoexpress82 6.5 2.5 2.08 12.6 0.26 2.08
INCAT 86
3.5 1.23 17.4 0.28 1.23
Autoexpress 86 7.3 3.2 1.66 13.38 0.25 1.66
Condor Express 6.75 3.5 1.24 17.34 0.28 1.24
Stena Charisma 12.6 3.7 1.89 16 0.30 1.89
90m Schelde (d0
3.2
24 0.29 Devil Cat 6.8 3.7 1.17 17.34 0.27 1.17
Highspeed 4 7.8 3.9 1.37 13.32 0.23 1.37
Incat Tasmania
3.4 1.27 17.94 0.24 1.27
Austal cargo 95
4.1
29 Autoexpress 96 Austal
4.2
24.2 0.29
Bonanza express
3.7 1.22 17.2 0.25 1.22
Hayabusa 7.3 3.1 1.87 8.42 0.16 1.87
Hayabusa AMD
3.1
20 Euroferrys Express 9.4 4.2 1.62 13.12 0.22 1.62
105m Schelde (d)
3.4
29.2 0.29 Austal Track Express 112
3.6
25
INCAT 112 (d)
3.3
30.2 0.29 INCAT 120m
4.8
29 0.25
Pacificat Explorer 6.6 3.9 1.54 13.8 0.21 1.54
Autoexpress 125 (d)
4.9
31.7 0.30

152
Name
DWT [t] Displ [t] Vol/2 Cb LWL/(Vol/2)^(1/3) Light ship [t]
Sun Eagle
110 53.66 0.54 7.05 110
Jet Caraibe 30.7 121.8 59.41 0.36 8.02 91.1
Seamax
300 146.34 0.64 6.32 300
Dodekanisos Express
Royal ferry
CNM Evolution 60 Brelyan
Eid Travel 50 Jade Express 54 250 121.95 0.43 8.39 196
San Gwann (KvFj) 50 Madikera
SSTH 50 (d) IHI LTD
San Gwann (Fjellstrand) 89 FBM 53 Tricat 68 LA Viking Two 105 55m RO/RO PTE LTD
Autoexpress 56
K40 Incat (d) 100 Turgut Reis 1 173 680 331.71 0.72 7.40 507
Nordic Jet 135 Solidor 5 110 800 390.24 0.66 7.73 690
Sea Bird 140 63m RO/RO PTE LTD 340 Autoexpress 66 Austal
Juan Patricio 112 Highspeed 2 190 Ocean arrow 204 73m CAR FERRY (d) AMHS 200 Juan L 200 850 414.63 0.53 8.11 650
Mai Mols 250 890 434.15 0.44 8.32 640
HighSpeed 1 360 Luciano Fedderico L 142 721 351.71 0.40 9.90 579
Condor 11 250 950 463.41 0.49 8.26 700
Cat Link 3 350 1240 604.88 0.85 7.86 890
Sunflower 123 A50 Afai ShipsLTD
Condor 12 320 1100 536.59 0.62 8.16 780
Autoexpress82 327 1250 609.76 0.68 8.14 923
INCAT 86 380 Autoexpress 86 400 1380 673.17 0.53 8.47 980
Condor Express 345 1165 568.29 0.49 9.22 820
Stena Charisma 450 90m Schelde (d0 450 Devil Cat 500 1350 658.54 0.51 9.34 850
Highspeed 4 470 1600 780.49 0.46 8.75 1130
Incat Tasmania 650 1810 882.93 0.65 9.59 1160
Austal cargo 95 1172 Autoexpress 96 Austal 750 Bonanza express 800 1600 780.49 0.55 9.34 800
Hayabusa 570 Hayabusa AMD
Euroferrys Express 750 2000 975.61 0.39 8.94 1250
105m Schelde (d) 750 Austal Track Express 112 1393 INCAT 112 (d) 1500 INCAT 120m 1200 Pacificat Explorer
1816 885.85 0.39 10.00 1816
Autoexpress 125 (d) 1200
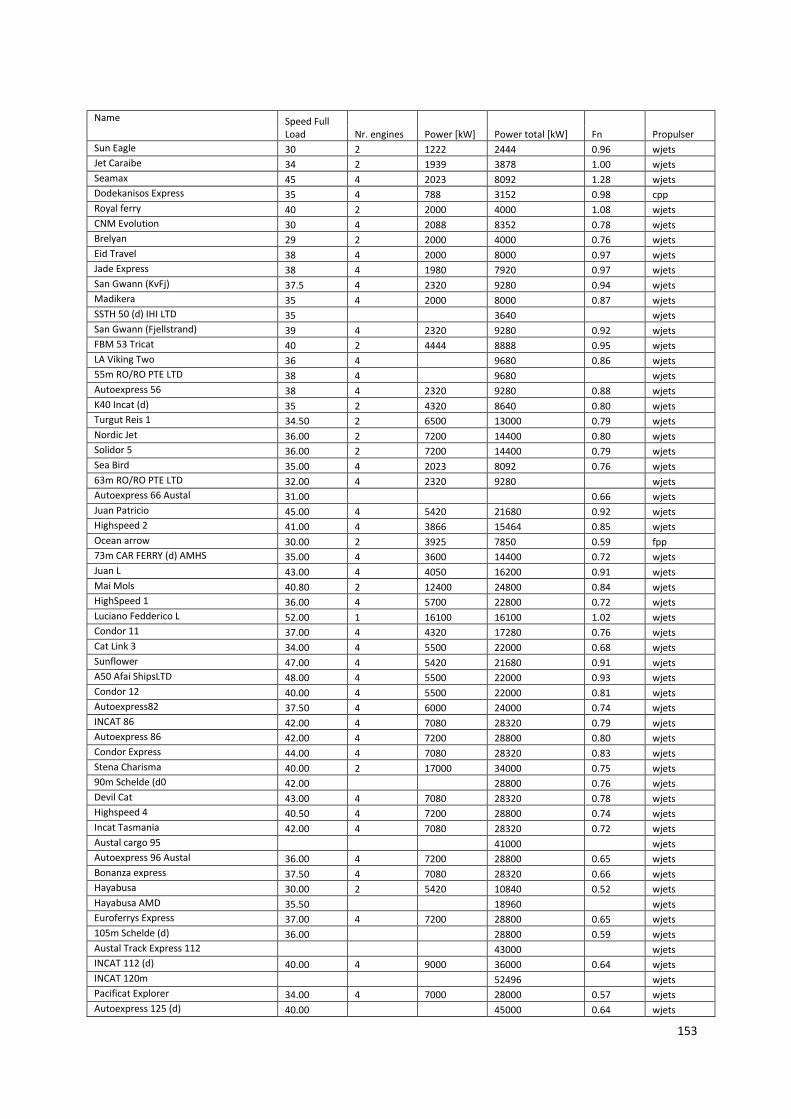
153
Name Speed Full
Load Nr. engines Power [kW] Power total [kW] Fn Propulser
Sun Eagle 30 2 1222 2444 0.96 wjets
Jet Caraibe 34 2 1939 3878 1.00 wjets
Seamax 45 4 2023 8092 1.28 wjets
Dodekanisos Express 35 4 788 3152 0.98 cpp
Royal ferry 40 2 2000 4000 1.08 wjets
CNM Evolution 30 4 2088 8352 0.78 wjets
Brelyan 29 2 2000 4000 0.76 wjets
Eid Travel 38 4 2000 8000 0.97 wjets
Jade Express 38 4 1980 7920 0.97 wjets
San Gwann (KvFj) 37.5 4 2320 9280 0.94 wjets
Madikera 35 4 2000 8000 0.87 wjets
SSTH 50 (d) IHI LTD 35
3640
wjets
San Gwann (Fjellstrand) 39 4 2320 9280 0.92 wjets
FBM 53 Tricat 40 2 4444 8888 0.95 wjets
LA Viking Two 36 4
9680 0.86 wjets
55m RO/RO PTE LTD 38 4
9680
wjets
Autoexpress 56 38 4 2320 9280 0.88 wjets
K40 Incat (d) 35 2 4320 8640 0.80 wjets
Turgut Reis 1 34.50 2 6500 13000 0.79 wjets
Nordic Jet 36.00 2 7200 14400 0.80 wjets
Solidor 5 36.00 2 7200 14400 0.79 wjets
Sea Bird 35.00 4 2023 8092 0.76 wjets
63m RO/RO PTE LTD 32.00 4 2320 9280
wjets
Autoexpress 66 Austal 31.00
0.66 wjets
Juan Patricio 45.00 4 5420 21680 0.92 wjets
Highspeed 2 41.00 4 3866 15464 0.85 wjets
Ocean arrow 30.00 2 3925 7850 0.59 fpp
73m CAR FERRY (d) AMHS 35.00 4 3600 14400 0.72 wjets
Juan L 43.00 4 4050 16200 0.91 wjets
Mai Mols 40.80 2 12400 24800 0.84 wjets
HighSpeed 1 36.00 4 5700 22800 0.72 wjets
Luciano Fedderico L 52.00 1 16100 16100 1.02 wjets
Condor 11 37.00 4 4320 17280 0.76 wjets
Cat Link 3 34.00 4 5500 22000 0.68 wjets
Sunflower 47.00 4 5420 21680 0.91 wjets
A50 Afai ShipsLTD 48.00 4 5500 22000 0.93 wjets
Condor 12 40.00 4 5500 22000 0.81 wjets
Autoexpress82 37.50 4 6000 24000 0.74 wjets
INCAT 86 42.00 4 7080 28320 0.79 wjets
Autoexpress 86 42.00 4 7200 28800 0.80 wjets
Condor Express 44.00 4 7080 28320 0.83 wjets
Stena Charisma 40.00 2 17000 34000 0.75 wjets
90m Schelde (d0 42.00
28800 0.76 wjets
Devil Cat 43.00 4 7080 28320 0.78 wjets
Highspeed 4 40.50 4 7200 28800 0.74 wjets
Incat Tasmania 42.00 4 7080 28320 0.72 wjets
Austal cargo 95
41000
wjets
Autoexpress 96 Austal 36.00 4 7200 28800 0.65 wjets
Bonanza express 37.50 4 7080 28320 0.66 wjets
Hayabusa 30.00 2 5420 10840 0.52 wjets
Hayabusa AMD 35.50
18960
wjets
Euroferrys Express 37.00 4 7200 28800 0.65 wjets
105m Schelde (d) 36.00
28800 0.59 wjets
Austal Track Express 112
43000
wjets
INCAT 112 (d) 40.00 4 9000 36000 0.64 wjets
INCAT 120m
52496
wjets
Pacificat Explorer 34.00 4 7000 28000 0.57 wjets
Autoexpress 125 (d) 40.00
45000 0.64 wjets

154
XI.A Trendlines
Figure 67, Trendline catamaran database, Fn vs lwl
Figure 68, Trendline catamaran database, DWT vs lwl
0,00
0,20
0,40
0,60
0,80
1,00
1,20
1,40
30 50 70 90 110
Fn vs Lwl
Series1
Expon. (Series1)
0
500
1000
1500
2000
2500
30 50 70 90 110
DWT vs Lwl
Series1
Expon. (Series1)

155
Figure 69, Trendline catamaran database, lwl/Bdemi vs lwl
Figure 70, Trendline catamaran database, lwl/B vs lwl
0,00
5,00
10,00
15,00
20,00
25,00
30 50 70 90 110
Lwl/Bdemi vs Lwl
Series1
Expon. (Series1)
0,00
1,00
2,00
3,00
4,00
5,00
6,00
0 50 100 150
Lwl/B vs Lwl
Lwl/B
Linear (Lwl/B)

156
Figure 71, Trendline catamaran database, B/T vs lwl
Figure 72, Trendline catamaran database, Cb vs lwl
0,00
0,50
1,00
1,50
2,00
2,50
3,00
3,50
4,00
4,50
0 50 100 150
B/T vs Lwl
B/T vs Lwl
Linear (B/T vs Lwl)
0,00
0,10
0,20
0,30
0,40
0,50
0,60
0,70
0,80
0,90
30 50 70 90 110
Cb vs Lwl
Series1
Expon. (Series1)

157
Figure 73, Trendline catamaran database, Pb vs lwl
0
10000
20000
30000
40000
50000
60000
0 50 100 150
Pb vs Lwl
Lwl vs Pb
Linear (Lwl vs Pb)

158
XII Design hydrostatics report catamaran.
Design length 85.000 (m) Midship location 42.500 (m) Length over all 85.000 (m) Relative water density 1.025 Design beam 7.400 (m) Mean shell thickness 0.0000 (m) Maximum beam 24.323 (m) Appendage coefficient 1.0000 Design draught 6.000 (m)
Volume properties Waterplane properties
Moulded volume 5141.2 (m3) Length on waterline 85.000 (m)
Total displaced volume 5141.2 (m3) Beam on waterline 24.294 (m)
Displacement 5269.7 (tonnes) Entrance angle 0.000 (Degr.) Block coefficient 1.3624 Waterplane area 1090.2 (m
2)
Prismatic coefficient 0.7429 Waterplane coefficient 1.7334 Vert. prismatic coefficient 0.7860 Waterplane center of floatation 39.164 (m) Wetted surface area 2547.1 (m
2) Transverse moment of inertia 81901 (m
4)
Longitudinal center of buoyancy 41.529 (m) Longitudinal moment of inertia 547110 (m4)
Longitudinal center of buoyancy -1.142 % Vertical center of buoyancy 3.415 (m)
Midship properties Initial stability
Midship section area 81.416 (m2) Transverse metacentric height 19.345 (m)
Midship coefficient 1.8339 Longitudinal metacentric height 109.83 (m)
Lateral plane
Lateral area 0.000 (m2)
Longitudinal center of effort 0.000 (m) Vertical center of effort 0.000 (m) The following layer properties are calculated for both sides of the ship Location Area Thickness Weight VCG LCG TCG (m2) (tonnes) (m) (m) (m)
Layer 0 4456.1 0.000 0.000 4.842 42.803 0.000 (CL)
Sectional areas Location Area Location Area Location Area Location Area Location Area (m) (m2) (m) (m2) (m) (m2) (m) (m2) (m) (m2)
0.000 11.397 18.700 74.069 37.400 81.760 56.100 73.307 74.800 41.930 1.700 15.106 20.400 75.991 39.100 81.777 57.800 71.632 76.500 37.911 3.400 19.310 22.100 77.354 40.800 81.686 59.500 69.670 78.200 33.735 5.100 24.318 23.800 78.385 42.500 81.416 61.200 67.372 79.900 29.056 6.800 30.344 25.500 79.188 44.200 80.864 62.900 64.727 81.600 23.253 8.500 37.470 27.200 79.840 45.900 80.026 64.600 61.855 83.300 15.048 10.200 45.621 28.900 80.404 47.600 79.074 66.300 58.858 85.000 68.727 11.900 53.885 30.600 80.874 49.300 78.112 68.000 55.770 13.600 61.123 32.300 81.232 51.000 77.084 69.700 52.586 15.300 66.939 34.000 81.490 52.700 75.975 71.400 49.272 17.000 71.164 35.700 81.664 54.400 74.761 73.100 45.726

159
NOTE 1: Draught (and all other vertical heights) is measured above base Z=
NOTE 2: All calculated coefficients based on project length, draught and beam.
0 5 10 15 20 25 30 35 40 45 50 55 60 65 70 75 80 85
Distance from app (m)
15
20
25
30
35
40
45
50
55
60
65
70
75
80
Are
a (
m2)
Sectional areas

160
XIII Resistance prediction catamaran design
Molland
Figure 74, Models for resistance prediction Molland
Figure 75, Notation and Main Parameters of Models, Molland
Figure 76, Details of Models, Molland

161
Figure 77, Resistance componants Model 3b, Mono-hull
Figure 78, Resistance componants Model 4a, Mono-hull
Figure 79, Resistance componants Model 4b, Mono-hull

162
Figure 80, Resistance componants Model 3b, S/L=0.2
Figure 81, Resistance componants Model 4a, S/L=0.2
Figure 82, Resistance componants Model 4b, S/L=0.2

163
XIV Weight calculation catamaran
XIV.A Weight of structure between demi-hulls
Total weight of the structure is the sum of the beams and a metal plate of 12mm thick. The problem is simplified by using a static approach of the situation and “Vergeet me nietjes”. The weight distribution is considered evenly over the length of the vessel, so the calculation is made for 1 section of the vessel of 1 meter.
Sketch 1
Figure 83, Equilibrium of forces on catamaran hull
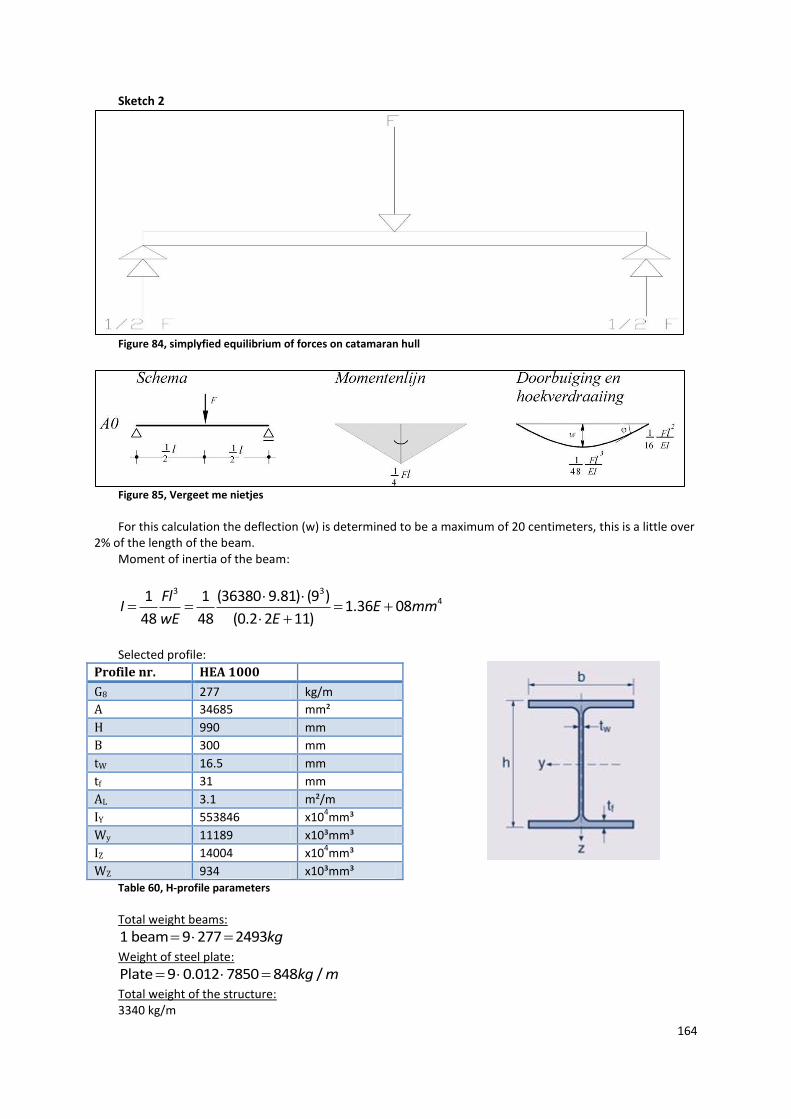
164
Sketch 2
Figure 84, simplyfied equilibrium of forces on catamaran hull
Figure 85, Vergeet me nietjes
For this calculation the deflection (w) is determined to be a maximum of 20 centimeters, this is a little over
2% of the length of the beam. Moment of inertia of the beam:
3 341 1 (36380 9.81) (9 )
1.36 0848 48 (0.2 2 11)
FlI E mm
wE E
Selected profile:
Profile nr. HEA 1000
G8 277 kg/m
A 34685 mm²
H 990 mm
B 300 mm
tW 16.5 mm
tf 31 mm
AL 3.1 m²/m
IY 553846 x104mm³
Wy 11189 x10³mm³
IZ 14004 x104mm³
WZ 934 x10³mm³ Table 60, H-profile parameters
Total weight beams:
1 beam 9 277 2493kg
Weight of steel plate:
Plate 9 0.012 7850 848 /kg m Total weight of the structure: 3340 kg/m

165
XIV.B Bare hull weight catamaran
Code Description Number Weight Weight VCG LCG TCG
[m³] [kg/m³] [kg] [m] [m] [m]
AB fr 0 SB = +
100 Shipbuilding
110 Demi-hull SB 5967 m3 87 kg/m3 519,166 4.75 42.50
110 Demi-hull PS 5967 m3 87 kg/m3 519,166 4.75 42.50
110 MD-AD Aluminium 2041 m3 30 kg/m3 61,236 10.90 63.75
110 AD-BD Aluminium 2041 m3 30 kg/m3 61,236 13.70 63.75
110 BD-CD Aluminium 1361 m3 30 kg/m3 40,824 16.50 58.75
110 CD-Bridge deck Aluminium 1361 m3 30 kg/m3 40,824 19.30 58.75
Total hull Total volume 18739 m3
Factor 1242452 kg
66 kg/m3
120 Structure between demi-hulls 85 m 3340 kg/m 283,900 9.00 42.50
120 Wheelhouse 798 m3 48 kg/m3 38,304 22.30 63.75
Total superstructure Total volume 883 m3
Factor 322204 kg
365 kg/m3
130 Small steelwork 1564656 6.0% 93,879 7.23 45.53
161 Paint 1658535 1.5% 24,878 7.23 45.53
Rolling margin & welding material 1658535 4.5% 74,634 7.23 45.53
Shipbuilding total 1,758,047 7.23 45.53 0.00 Table 61, Weight calculation catamaran 100

166
XV Extensive hydrostatics report catamaran
HYDROSTATIC PARTICULARS
FIRM Catamaran
Trim = 0.000 m 12 Jun 2013 13:42:06
Draft from base 4.000 4.100 4.200 4.300 4.400
Waterplane area 992.92 1000.95 1009.08 1017.16 1025.32
Centre of flotation 40.805 40.618 40.429 40.233 40.037
Mom. of inertia long. 431721 440547 449709 459258 469122
Mom. of inertia tran. 74455 75063 75662 76277 76894
Ton/cm immersion 10.18 10.26 10.34 10.43 10.51
Volume 3038.87 3138.51 3238.96 3340.23 3442.32
Volume & appendages 3038.87 3138.51 3238.96 3340.23 3442.32
Displacement 3114.84 3216.98 3319.94 3423.74 3528.38
Vert. Centre Buoyancy 2.304 2.359 2.415 2.470 2.526
Long. Centre Buoyancy 42.893 42.824 42.753 42.680 42.605
Trans.Centre Buoyancy 0.000 0.000 0.000 0.000 0.000
KM transverse 26.804 26.276 25.775 25.306 24.864
KM longitudinal 144.370 142.727 141.258 139.963 138.807
Mom change trim 1 cm 52.06 53.12 54.23 55.38 56.57
Wetted surface 1805.3 1842.4 1879.7 1917.4 1955.3
Block coefficient 0.3820 0.3849 0.3877 0.3905 0.3933
Hor.prism.coef 0.6791 0.6827 0.6862 0.6896 0.6931
Vert.prism.coef 0.7651 0.7648 0.7642 0.7637 0.7630
Midship coefficient 0.5624 0.5638 0.5651 0.5663 0.5675
Waterplane coef. 0.4992 0.5032 0.5073 0.5114 0.5155
Waterplane coef. fore 0.4643 0.4658 0.4672 0.4687 0.4701
Draft from base 4.500 4.600 4.700 4.800 4.900
Waterplane area 1033.08 1040.04 1046.39 1052.10 1057.13
Centre of flotation 39.861 39.704 39.577 39.457 39.374
Mom. of inertia long. 478937 487644 495853 503159 509738
Mom. of inertia tran. 77475 78003 78484 78920 79312
Ton/cm immersion 10.59 10.66 10.73 10.78 10.84
Volume 3545.21 3648.83 3753.13 3858.02 3963.46
Volume & appendages 3545.21 3648.83 3753.13 3858.02 3963.46
Displacement 3633.84 3740.05 3846.96 3954.47 4062.55
Vert. Centre Buoyancy 2.582 2.638 2.694 2.750 2.805
Long. Centre Buoyancy 42.528 42.450 42.372 42.294 42.218
Trans.Centre Buoyancy 0.000 0.000 0.000 0.000 0.000
KM transverse 24.435 24.015 23.605 23.206 22.816
KM longitudinal 137.676 136.282 134.811 133.169 131.415
Mom change trim 1 cm 57.75 58.80 59.79 60.68 61.47
Wetted surface 1993.0 2030.1 2066.7 2102.8 2138.4
Block coefficient 0.3961 0.3988 0.4015 0.4041 0.4067
Hor.prism.coef 0.6966 0.6999 0.7033 0.7066 0.7098
Vert.prism.coef 0.7626 0.7627 0.7631 0.7640 0.7652
Midship coefficient 0.5686 0.5698 0.5709 0.5719 0.5729
Waterplane coef. 0.5194 0.5229 0.5261 0.5290 0.5315
Waterplane coef. fore 0.4716 0.4729 0.4743 0.4756 0.4769

167
Draft from base 5.000 5.100 5.200 5.300 5.400
Waterplane area 1061.69 1065.58 1069.19 1072.51 1075.39
Centre of flotation 39.308 39.256 39.216 39.186 39.170
Mom. of inertia long. 515467 520387 524656 528420 531795
Mom. of inertia tran. 79658 79968 80245 80503 80737
Ton/cm immersion 10.88 10.92 10.96 10.99 11.02
Volume 4069.39 4175.74 4282.47 4389.55 4496.94
Volume & appendages 4069.39 4175.74 4282.47 4389.55 4496.94
Displacement 4171.12 4280.13 4389.53 4499.29 4609.37
Vert. Centre Buoyancy 2.861 2.917 2.973 3.028 3.084
Long. Centre Buoyancy 42.143 42.070 41.999 41.931 41.865
Trans.Centre Buoyancy 0.000 0.000 0.000 0.000 0.000
KM transverse 22.436 22.068 21.711 21.368 21.038
KM longitudinal 129.531 127.539 125.485 123.410 121.341
Mom change trim 1 cm 62.16 62.75 63.27 63.72 64.13
Wetted surface 2173.7 2208.7 2243.4 2277.9 2312.3
Block coefficient 0.4092 0.4117 0.4141 0.4164 0.4187
Hor.prism.coef 0.7130 0.7161 0.7191 0.7220 0.7249
Vert.prism.coef 0.7666 0.7684 0.7703 0.7722 0.7744
Midship coefficient 0.5739 0.5749 0.5758 0.5767 0.5776
Waterplane coef. 0.5338 0.5357 0.5376 0.5392 0.5407
Waterplane coef. fore 0.4783 0.4795 0.4809 0.4822 0.4834
Draft from base 5.500 5.600 5.700 5.800 5.900
Waterplane area 1078.42 1081.25 1083.30 1085.74 1088.13
Centre of flotation 39.151 39.147 39.148 39.152 39.144
Mom. of inertia long. 534757 537540 540095 542501 544712
Mom. of inertia tran. 80953 81155 81347 81530 81705
Ton/cm immersion 11.05 11.08 11.10 11.13 11.15
Volume 4604.63 4712.58 4820.80 4929.25 5037.94
Volume & appendages 4604.63 4712.58 4820.80 4929.25 5037.94
Displacement 4719.74 4830.40 4941.32 5052.48 5163.89
Vert. Centre Buoyancy 3.139 3.194 3.249 3.304 3.359
Long. Centre Buoyancy 41.802 41.741 41.683 41.627 41.574
Trans.Centre Buoyancy 0.000 0.000 0.000 0.000 0.000
KM transverse 20.720 20.415 20.124 19.844 19.577
KM longitudinal 119.274 117.259 115.284 113.362 111.481
Mom change trim 1 cm 64.49 64.82 65.13 65.42 65.69
Wetted surface 2346.6 2380.8 2414.9 2449.0 2483.1
Block coefficient 0.4209 0.4231 0.4252 0.4273 0.4293
Hor.prism.coef 0.7277 0.7304 0.7330 0.7356 0.7381
Vert.prism.coef 0.7763 0.7783 0.7807 0.7828 0.7847
Midship coefficient 0.5785 0.5793 0.5801 0.5809 0.5817
Waterplane coef. 0.5422 0.5436 0.5446 0.5459 0.5471
Waterplane coef. fore 0.4847 0.4859 0.4871 0.4885 0.4897

168
Draft from base 6.000 6.100 6.200 6.300 6.400
Waterplane area 1090.33 1092.43 1094.58 1096.53 1098.54
Centre of flotation 39.144 39.160 39.169 39.183 39.187
Mom. of inertia long. 546830 548959 550944 552925 554743
Mom. of inertia tran. 81870 82033 82190 82339 82487
Ton/cm immersion 11.18 11.20 11.22 11.24 11.26
Volume 5146.85 5255.98 5365.31 5474.85 5584.59
Volume & appendages 5146.85 5255.98 5365.31 5474.85 5584.59
Displacement 5275.52 5387.38 5499.45 5611.72 5724.20
Vert. Centre Buoyancy 3.414 3.469 3.524 3.578 3.633
Long. Centre Buoyancy 41.523 41.473 41.426 41.381 41.338
Trans.Centre Buoyancy 0.000 0.000 0.000 0.000 0.000
KM transverse 19.321 19.076 18.842 18.618 18.403
KM longitudinal 109.660 107.914 106.210 104.572 102.967
Mom change trim 1 cm 65.94 66.20 66.44 66.68 66.90
Wetted surface 2517.2 2551.3 2585.3 2619.3 2653.4
Block coefficient 0.4313 0.4332 0.4351 0.4369 0.4387
Hor.prism.coef 0.7404 0.7428 0.7450 0.7473 0.7494
Vert.prism.coef 0.7867 0.7887 0.7906 0.7925 0.7943
Midship coefficient 0.5825 0.5832 0.5840 0.5847 0.5854
Waterplane coef. 0.5482 0.5492 0.5503 0.5513 0.5523
Waterplane coef. fore 0.4909 0.4922 0.4933 0.4946 0.4959
Draft from base 6.500
Waterplane area 1100.29
Centre of flotation 39.200
Mom. of inertia long. 556571
Mom. of inertia tran. 82630
Ton/cm immersion 11.28
Volume 5694.52
Volume & appendages 5694.52
Displacement 5836.88
Vert. Centre Buoyancy 3.687
Long. Centre Buoyancy 41.297
Trans.Centre Buoyancy 0.000
KM transverse 18.197
KM longitudinal 101.425
Mom change trim 1 cm 67.12
Wetted surface 2687.4
Block coefficient 0.4405
Hor.prism.coef 0.7515
Vert.prism.coef 0.7962
Midship coefficient 0.5861
Waterplane coef. 0.5532
Waterplane coef. fore 0.4972

169
XVI Intact stability calculations catamaran
TRIM AND STABILITY CALCULATION
FIRM Catamaran
13 Jun 2013 15:30:46
Condition : crane operation + 650t deadweight + 250t deck load
Description Weight VCG LCG TCG FSM
ton m m m tonm
Empty ship 3769.000 7.600 41.711 0.000 0.000
Subtotals for group : Ballast water
FP SB 124.939 3.400 78.851 8.446 32.356
FP PS 124.939 3.400 78.851 -8.446 32.356
SUBTOTAL 249.879 3.400 78.851 0.000 64.712
Subtotals for group : Crew and stores
Crew and stores 17.000 14.000 60.000 0.000 0.000
SUBTOTAL 17.000 14.000 60.000 0.000 0.000
Subtotals for group : Deck load
Deck load 250t 250.000 10.500 15.000 0.000 0.000
SUBTOTAL 250.000 10.500 15.000 0.000 0.000
Subtotals for group : Crane
Crane load 100.000 28.500 15.000 -23.000 0.000
Crane boom 50.000 26.500 15.000 -15.000 0.000
SUBTOTAL 150.000 27.833 15.000 -20.333 0.000
Deadweight 650.000 4.000 42.500 0.000 0.000
TOTAL 5085.879 7.694 41.597 -0.600 64.712
Hydrostatics Drafts and trim
Volume 4962.121 m3 Drafts above base :
LCF 39.152 m Draft mean (Lpp/2) 5.830 m
Mom. change trim 65.504 tonm/cm Draft aft (App) 5.835 m
Ton/cm immersion 11.135 ton/cm Draft fore (Fpp) 5.824 m
Specific weight 1.025 ton/m3 Trim -0.011 m
Transverse stability
KM transverse 19.762 m
VCG 7.694 m
GM solid 12.068 m
GG' correction 0.013 m
G'M liquid 12.055 m VCG' 7.707 m
The stability values are calculated for the actual trim.

170
Statical and dynamical stability, calculated with constant LCB :
Angle(PS) Draft mld. Trim KNsinφ VCG'sinφ TCGcosφ G'Nsinφ Area
degrees m m m m m m mrad
0.00 5.830 -0.011 0.000 0.000 0.600 -0.600 0.000
2.00 5.829 -0.011 0.690 0.269 0.599 -0.178 0.000
5.00 5.823 -0.009 1.726 0.672 0.597 0.457 0.009
8.00 5.812 0.002 2.762 1.073 0.594 1.096 0.049
10.00 5.800 0.022 3.453 1.338 0.591 1.524 0.095
15.00 5.750 0.141 5.175 1.995 0.579 2.601 0.275
20.00 5.694 0.371 6.829 2.636 0.564 3.630 0.549
25.00 5.822 0.796 7.980 3.257 0.544 4.180 0.893
30.00 6.109 1.283 8.684 3.853 0.519 4.311 1.266
35.00 6.461 1.910 9.118 4.421 0.491 4.206 1.639
40.00 6.843 2.811 9.356 4.954 0.459 3.943 1.995
50.00 7.492 6.068 9.364 5.904 0.385 3.075 2.614
60.00 7.164 9.394 8.826 6.674 0.300 1.851 3.047
70.00 6.177 14.877 7.983 7.242 0.205 0.536 3.255
Statical angle of inclination is 2.845 degrees to portside
Summary
Hydrostatics Criterion Value
Draft mld. 6.000 5.830 m
Trim -0.011 m
Statical angle of inclination 2.84 degrees PS
Intact Stability Code for vessels with a large B/H ratio Criterion Value
Minimum metacentric height G'M 0.150 12.055 meter
Maximum GZ at 30 degrees or more 0.200 4.311 meter
Top of the GZ curve at least at 15.000 29.800 degrees
Area under GZ curve up to top of the curve (Supply vessel criterion) 0.055 1.251 mrad
Area under the GZ curve between 30 and 40 degrees 0.030 0.730 mrad
Maximum angle of inclination acc. to IMO's A.562 weathercriterion50.00022.649 degrees
Maximum statical angle due to wind 16.000 2.845 degrees
Maximum statical angle 80% of angle of deck immersion 13.753 2.845 degrees
VCG'
A non-zero statical angle of equilibrium occurs,
No maximum allowable VCG' is calculated.
Loading condition complies with the stated criteria.

171
Angle of inclination in degrees 1/5.54
0.0 25.0 50.00.0
Righting lever 1/102
0.0
0.0

172
XVII Design hydrostatics report final design.
Design length 120.00 (m) Midship location 60.000 (m) Length over all 120.00 (m) Relative water density 1.025 Design beam 21.000 (m) Mean shell thickness 0.0000 (m) Maximum beam 21.000 (m) Appendage coefficient 1.0000 Design draught 5.800 (m)
Volume properties Waterplane properties
Moulded volume 6619.2 (m3) Length on waterline 120.00 (m)
Total displaced volume 6619.2 (m3) Beam on waterline 19.375 (m)
Displacement 6784.6 (tonnes) Entrance angle 40.067 (Degr.) Block coefficient 0.4529 Waterplane area 1781.5 (m
2)
Prismatic coefficient 0.6755 Waterplane coefficient 0.7069 Vert. prismatic coefficient 0.6406 Waterplane center of floatation 49.701 (m) Wetted surface area 2497.7 (m
2) Transverse moment of inertia 43610 (m
4)
Longitudinal center of buoyancy 56.409 (m) Longitudinal moment of inertia 1566398 (m4)
Longitudinal center of buoyancy -2.992 % Vertical center of buoyancy 3.509 (m)
Midship properties Initial stability
Midship section area 81.656 (m2) Transverse metacentric height 10.097 (m)
Midship coefficient 0.6704 Longitudinal metacentric height 240.15 (m)
Lateral plane
Lateral area 655.61 (m2)
Longitudinal center of effort 63.321 (m) Vertical center of effort 2.916 (m) The following layer properties are calculated for both sides of the ship Location Area Thickness Weight VCG LCG TCG (m2) (tonnes) (m) (m) (m)
Layer 0 4295.0 0.000 0.000 5.439 59.983 0.000 (CL)
Sectional areas Location Area Location Area Location Area Location Area Location Area (m) (m2) (m) (m2) (m) (m2) (m) (m2) (m) (m2)
0.000 7.814 26.000 69.115 52.000 85.141 78.000 65.153 104.000 31.167 2.000 9.370 28.000 74.110 54.000 84.552 80.000 62.869 106.000 27.950 4.000 11.200 30.000 78.085 56.000 83.780 82.000 60.522 108.000 24.600 6.000 13.484 32.000 80.823 58.000 82.813 84.000 58.109 110.000 21.071 8.000 16.448 34.000 82.640 60.000 81.656 86.000 55.653 112.000 17.400 10.000 21.424 36.000 83.872 62.000 80.324 88.000 53.157 114.000 13.584 12.000 29.133 38.000 84.722 64.000 78.832 90.000 50.624 116.000 9.615 14.000 38.118 40.000 85.299 66.000 77.196 92.000 48.049 118.000 5.454 16.000 46.336 42.000 85.679 68.000 75.432 94.000 45.428 120.000 0.000 18.000 53.212 44.000 85.886 70.000 73.551 96.000 42.754 20.000 57.608 46.000 85.932 72.000 71.570 98.000 40.005 22.000 60.837 48.000 85.824 74.000 69.507 100.000 37.167 24.000 64.568 50.000 85.562 76.000 67.367 102.000 34.226

173
NOTE 1: Draught (and all other vertical heights) is measured above base Z= NOTE 2: All calculated coefficients based on project length, draught and beam.
0 10 20 30 40 50 60 70 80 90 100 110 120
Distance from app (m)
0
5
10
15
20
25
30
35
40
45
50
55
60
65
70
75
80
85
Are
a (
m2)
Sectional areas

174
XVIII Extensive hydrostatics report final design
HYDROSTATIC PARTICULARS
FIRM
Trim = 0.000 m
Draft from base 4.500 4.600 4.700 4.800 4.900
Waterplane area 1499.95 1522.95 1547.41 1575.34 1603.56
Centre of flotation 51.894 51.473 51.017 50.430 49.856
Mom. of inertia long. 1071093 1104254 1141854 1184899 1233486
Mom. of inertia tran. 31484 32266 33080 33930 34823
Ton/cm immersion 15.37 15.61 15.86 16.15 16.44
Volume 4477.94 4628.95 4782.34 4938.34 5097.17
Volume & appendages 4477.94 4628.95 4782.34 4938.34 5097.17
Displacement 4589.89 4744.67 4901.89 5061.80 5224.60
Vert. Centre Buoyancy 2.695 2.755 2.816 2.877 2.939
Long. Centre Buoyancy 55.710 55.580 55.441 55.293 55.133
Trans.Centre Buoyancy 0.000 0.000 0.000 0.000 0.000
KM transverse 9.726 9.726 9.733 9.748 9.771
KM longitudinal 241.888 241.309 241.581 242.816 244.933
Mom change trim 1 cm 93.84 96.74 100.03 103.81 108.06
Wetted surface 2015.3 2052.7 2092.4 2134.5 2177.6
Block coefficient 0.4050 0.4096 0.4141 0.4187 0.4234
Hor.prism.coef 0.6214 0.6238 0.6264 0.6290 0.6319
Vert.prism.coef 0.6634 0.6608 0.6576 0.6531 0.6487
Midship coefficient 0.6518 0.6565 0.6612 0.6657 0.6700
Waterplane coef. 0.6105 0.6198 0.6298 0.6412 0.6527
Waterplane coef. fore 0.4872 0.4903 0.4933 0.4962 0.4990
Draft from base 5.000 5.100 5.150 5.200 5.300
Waterplane area 1629.88 1654.98 1666.99 1678.17 1699.37
Centre of flotation 49.336 48.869 48.648 48.450 48.089
Mom. of inertia long. 1283376 1330067 1352087 1372970 1412078
Mom. of inertia tran. 35766 36750 37261 37774 38809
Ton/cm immersion 16.71 16.96 17.09 17.20 17.42
Volume 5258.73 5422.88 5505.87 5589.44 5758.23
Volume & appendages 5258.73 5422.88 5505.87 5589.44 5758.23
Displacement 5390.20 5558.45 5643.51 5729.17 5902.18
Vert. Centre Buoyancy 3.001 3.063 3.094 3.125 3.187
Long. Centre Buoyancy 54.964 54.787 54.696 54.604 54.419
Trans.Centre Buoyancy 0.000 0.000 0.000 0.000 0.000
KM transverse 9.802 9.839 9.861 9.883 9.927
KM longitudinal 247.047 248.332 248.666 248.761 248.415
Mom change trim 1 cm 112.43 116.52 118.45 120.28 123.71
Wetted surface 2219.3 2259.6 2279.3 2298.5 2335.5
Block coefficient 0.4281 0.4328 0.4351 0.4375 0.4422
Hor.prism.coef 0.6348 0.6378 0.6394 0.6410 0.6441
Vert.prism.coef 0.6453 0.6425 0.6413 0.6405 0.6393
Midship coefficient 0.6743 0.6785 0.6805 0.6826 0.6865
Waterplane coef. 0.6634 0.6736 0.6785 0.6830 0.6916
Waterplane coef. fore 0.5017 0.5045 0.5058 0.5070 0.5095

175
Draft from base 5.400 5.500 5.600 5.700 5.800
Waterplane area 1718.31 1735.01 1749.51 1763.77 1775.93
Centre of flotation 47.792 47.572 47.377 47.196 47.072
Mom. of inertia long. 1446869 1476746 1502389 1524745 1544233
Mom. of inertia tran. 39825 40796 41725 42617 43466
Ton/cm immersion 17.61 17.78 17.93 18.08 18.20
Volume 5929.03 6101.63 6275.82 6451.43 6628.35
Volume & appendages 5929.03 6101.63 6275.82 6451.43 6628.35
Displacement 6077.26 6254.17 6432.71 6612.72 6794.05
Vert. Centre Buoyancy 3.249 3.312 3.374 3.436 3.498
Long. Centre Buoyancy 54.233 54.047 53.865 53.686 53.511
Trans.Centre Buoyancy 0.000 0.000 0.000 0.000 0.000
KM transverse 9.966 9.998 10.022 10.042 10.055
KM longitudinal 247.281 245.337 242.767 239.778 236.472
Mom change trim 1 cm 126.76 129.37 131.62 133.58 135.29
Wetted surface 2370.4 2403.4 2434.7 2464.8 2493.8
Block coefficient 0.4469 0.4515 0.4561 0.4607 0.4651
Hor.prism.coef 0.6473 0.6504 0.6535 0.6566 0.6596
Vert.prism.coef 0.6390 0.6394 0.6406 0.6417 0.6435
Midship coefficient 0.6904 0.6942 0.6979 0.7016 0.7052
Waterplane coef. 0.6994 0.7061 0.7121 0.7179 0.7228
Waterplane coef. fore 0.5120 0.5144 0.5167 0.5189 0.5212
Draft from base 5.900 6.000 6.100 6.200 6.300
Waterplane area 1787.40 1797.80 1807.57 1817.38 1826.42
Centre of flotation 46.959 46.861 46.816 46.735 46.695
Mom. of inertia long. 1561180 1576227 1589735 1601926 1613256
Mom. of inertia tran. 44275 45052 45798 46521 47225
Ton/cm immersion 18.32 18.43 18.53 18.63 18.72
Volume 6806.45 6985.65 7165.87 7347.06 7529.18
Volume & appendages 6806.45 6985.65 7165.87 7347.06 7529.18
Displacement 6976.61 7160.29 7345.02 7530.74 7717.41
Vert. Centre Buoyancy 3.559 3.620 3.682 3.742 3.803
Long. Centre Buoyancy 53.341 53.177 53.017 52.864 52.715
Trans.Centre Buoyancy 0.000 0.000 0.000 0.000 0.000
KM transverse 10.064 10.070 10.073 10.074 10.075
KM longitudinal 232.927 229.258 225.530 221.779 218.070
Mom change trim 1 cm 136.77 138.09 139.27 140.34 141.33
Wetted surface 2521.9 2549.4 2576.3 2602.9 2629.2
Block coefficient 0.4695 0.4739 0.4781 0.4823 0.4864
Hor.prism.coef 0.6625 0.6654 0.6682 0.6709 0.6736
Vert.prism.coef 0.6454 0.6476 0.6499 0.6520 0.6543
Midship coefficient 0.7087 0.7121 0.7155 0.7189 0.7221
Waterplane coef. 0.7275 0.7317 0.7357 0.7397 0.7434
Waterplane coef. fore 0.5234 0.5256 0.5276 0.5298 0.5317

176
Draft from base 6.400 6.500 6.600 6.700 6.800
Waterplane area 1834.47 1843.65 1851.81 1859.57 1867.68
Centre of flotation 46.659 46.594 46.577 46.541 46.517
Mom. of inertia long. 1622776 1633661 1642177 1651169 1659943
Mom. of inertia tran. 47911 48585 49257 49909 50561
Ton/cm immersion 18.80 18.90 18.98 19.06 19.14
Volume 7712.19 7896.05 8080.75 8266.27 8452.58
Volume & appendages 7712.19 7896.05 8080.75 8266.27 8452.58
Displacement 7905.00 8093.45 8282.77 8472.93 8663.89
Vert. Centre Buoyancy 3.864 3.924 3.984 4.044 4.103
Long. Centre Buoyancy 52.572 52.433 52.300 52.171 52.047
Trans.Centre Buoyancy 0.000 0.000 0.000 0.000 0.000
KM transverse 10.076 10.077 10.079 10.081 10.085
KM longitudinal 214.281 210.820 207.205 203.791 200.486
Mom change trim 1 cm 142.17 143.12 143.87 144.65 145.42
Wetted surface 2655.2 2681.1 2706.9 2732.5 2758.0
Block coefficient 0.4904 0.4944 0.4983 0.5021 0.5059
Hor.prism.coef 0.6761 0.6786 0.6810 0.6834 0.6856
Vert.prism.coef 0.6569 0.6589 0.6612 0.6635 0.6655
Midship coefficient 0.7254 0.7286 0.7317 0.7348 0.7379
Waterplane coef. 0.7466 0.7504 0.7537 0.7568 0.7601
Waterplane coef. fore 0.5339 0.5359 0.5379 0.5399 0.5418
Draft from base 6.900 7.000
Waterplane area 1876.07 1882.62
Centre of flotation 46.469 46.467
Mom. of inertia long. 1668172 1676704
Mom. of inertia tran. 51211 51855
Ton/cm immersion 19.23 19.30
Volume 8639.68 8827.56
Volume & appendages 8639.68 8827.56
Displacement 8855.67 9048.25
Vert. Centre Buoyancy 4.163 4.222
Long. Centre Buoyancy 51.927 51.811
Trans.Centre Buoyancy 0.000 0.000
KM transverse 10.090 10.096
KM longitudinal 197.245 194.162
Mom change trim 1 cm 146.14 146.89
Wetted surface 2783.5 2808.8
Block coefficient 0.5096 0.5133
Hor.prism.coef 0.6878 0.6899
Vert.prism.coef 0.6674 0.6699
Midship coefficient 0.7409 0.7439
Waterplane coef. 0.7636 0.7662
Waterplane coef. fore 0.5440 0.5459

177
XIX Weight calculation final design
Code Description Number Weight Weight VCG LCG TCG
[-] [kg/m3] [kg] [m] [m] [m]
[m3] AB fr 0 SB = +
100 Shipbuilding
110 Hull 21600 m3 87 kg/m3 1,879,200 5.50 56.00
110 Skeg 2 m3 7850 kg/m3 14,036 2.25 14.50
110 MD-AD 4645 m3 50 kg/m3 232,260 10.50 71.00
110 AD-BD 4704 m3 50 kg/m3 235,200 13.30 71.00
Total hull Total volume 30951 m3
Factor 2360696 kg
76 kg/m3
120 BD-CD Aluminium 2352 m3 30 kg/m3 70,560 16.10 71.00
120 CD-Bridge deck Aluminium 1882 m3 30 kg/m3 56,448 18.90 67.00
120 Wheelhouse Aluminium 798 m3 48 kg/m3 38,304 23.50 61.00
120 Funnel 0 m3 0
Total superstructure Total volume 5032 m3
Factor 165312 kg
33 kg/m3
130 Small steelwork 2526008 6.0% 151,560 7.54 59.29
161 Paint 2677568 1.5% 40,164 7.54 59.29
161 Rolling margin & welding material 2677568 4.5% 120,491 7.54 59.29
Shipbuilding total 2,838,222 7.54 59.29 0.0 Table 62, Weight calculation final design 100

178
Code Description Number Weight Weight VCG LCG TCG
[-] [kg] [kg] [m] [m] [m]
AB fr 0 SB = +
200 Main machinery
211 Main engines Wärtsila 8L38 4 63000 252,000 4.00 38.00
212 Gearboxes Single in twin out 2 32000 64,000 3.50 30.00
213 Propellers 5350mm CPP 2 14500 29,000 0.50 1.60
213 Shafts & stern tubes 2 40000 80,000 2.00 13.00
213 Seals & bearings 2 2500 5,000 2.00 13.00
221 Rudders 2 15000 30,000 1.80 0.00
222 Steering gear 2 5000 10,000 6.00 0.00
223 Bow thruster - 1 1500 kW 1 10600 10,600 1.50 107.00
223 Bow thruster - 2 1500 kW 1 10600 10,600 1.50 103.50
223 Sternthruster - 1 1500 kW 1 10600 10,600 2.00 16.50
223 Stern thruster - 2 1500 kW 1 10600 10,600 2.00 13.00
223 E motor bow thruster - 1 1500 kW 1 8000 8,000 3.50 107.00
223 E motor bow thruster - 2 1500 kW 1 8000 8,000 3.50 103.50
223 E motor sternthruster - 1 1500 kW 1 8000 8,000 4.00 16.50
223 E motor stern thruster - 2 1500 kW 1 8000 8,000 4.00 13.00
223 Drive bow thruster - 1 1 2000 2,000 3.50 107.00
223 Drive bow thruster - 2 1 2000 2,000 3.50 103.50
223 Drive sternthruster - 1 1 2000 2,000 4.00 16.50
223 Drive stern thruster - 2 1 2000 2,000 4.00 13.00
256 Bottom doors Incl 110 0 15000 0 2.00 46.90
Main machinery total 552.400 3.18 31.85 0.00 Table 63, Weight calculation final design 200

179
Code Description Number Weight Weight VCG LCG TCG
[-] [kg] [kg] [m] [m] [m]
AB fr 0 SB = +
300 Primary ship systems
310 Bilge ballast piping 1 25000 25,000 4.50 55.00
310 Fifi piping 1 7500 7,500 9.50 58.00
320 Fuel oil piping 1 10000 10,000 4.00 45.00
330 Cooling water piping 1 20000 20,000 3.00 48.00
340 Fresh water piping 1 2000 2,000 12.50 75.00
340 Sewage piping 1 8000 8,000 12.50 75.00
340 Deck scupper piping 1 5000 5,000 12.00 58.00
350 Tank sounding/filling piping 1 17500 17,500 7.00 58.00
360 Lub oil piping 1 8000 8,000 4.00 47.00
380 Exhaust piping ER 2 4000 8,000 12.00 50.00
380 Exhaust piping PR 4 3500 14,000 15.00 57.00
390 Miscellaneous piping 1 20000 20,000 5.50 58.00
300 System fillings 145,000 20% 29,000 7.17 55.23
300 Appendages 145,000 20% 29,000 7.17 55.23 0.00
0 0.00
310 Bilge ballast equipment 1 2000 2,000 4.50 55.00
310 Fifi equipment 1 1000 1,000 9.50 58.00
320 Fuel oil equipment 1 3000 3,000 4.00 45.00
330 Cooling water equipment 1 12000 12,000 3.00 48.00
340 Fresh water equipment 1 3000 3,000 12.50 75.00
340 Sewage plant 1 6000 6,000 4.00 75.00
340 Other sewage equipment 1 1000 1,000 4.50 83.00
350 Tank sounding/filling equipment
1 1000 1,000 7.00 58.00
360 Lub oil equipment 1 2500 2,500 4.00 47.00
370 HVAC piping (spiro) 1 10000 10,000 15.00 75.00
370 HVAC unit 1 6500 6,500 15.00 55.00
370 Other HVAC equipment 1 3000 3,000 15.00 95.00
380 Exhaust equipment 6 2500 15,000 13.00 48.00
390 Remaining primary ship systems
1 15000 15,000 5.50 58.00
Primary ship systems total 284,000 7.66 56.36
Table 64, Weight calculation final design 300

180
Code Description Number Weight Weight VCG LCG TCG
[-] [kg] [kg] [m] [m] [m]
AB fr 0 SB = +
400 Electrical system
410 Generator set Wartsila 8L20 2 20700 41,400 4.50 56.00
410 Generator set Wartsila 8L26 2 45000 90,000 4.50 56.00
410 Emergency set Cat C18 1 1905 1,905 19.00 54.00
420 Cables & cable trays below main deck
1 32000 32,000 6.00 55.00
420 Cables & cable trays above maindeck
1 22000 22,000 14.00 55.00
430 Main switchboard 4 5500 22,000 7.50 65.00
430 Other switchboards 1 10000 10,000 7.50 65.00
450 Lighting 1 3000 3,000 15.00 70.00
490 Remaining items 1 15000 15,000 9.50 58.00
Electrical system total 237,305 6.55 57.27
Table 65, Weight calculation final design 400
Code Description Number Weight Weight VCG LCG TCG
[-] [kg] [kg] [m] [m] [m]
AB fr 0 SB = +
500 Deck equipment
510 Anchor winch 1 5000 5,000 13.50 108.00
510 Anchors 2 3000 6,000 11.50 113.00
510 Chain 1 25000 25,000 7.50 110.00
510 Chain stoppers 2 650 1,300 12.50 111.00
510 Mooring winches aft 2 6000 12,000 10.00 2.00
520 Capstans aft 2 1200 2,400 10.00 2.00
540 Deck crane (subsea execution) 1 275000 275,000 18.20 20.00 -5.50
540 Deck crane Pedestal Incl 0
540 Deck crane counter ballast 1 189000 189,000 6.00 20.00 8.00
540 Store crane 1 5000 5,000 15.50 94.50
550 Tugger winches 2 4000 8,000 10.00 38.50
560 ROV Davit 1 15000 15,000 12.50 56.00
570 Fast rescue boat + davit 1 8000 8,000 13.50 49.70
570 Life boat + davits 2 10000 20,000 16.50 66.50
570 MOB boat + davit 1 2000 2,000 12.50 42.00
570 life rafts 6 500 3,000 9.50 41.00
590 Remaining items 1 15000 15,000 9.00 58.00
Deck equipment total 591,700 12.84 30.16
Table 66, Weight calculation final design 500

181
Code Description Number Weight Weight VCG LCG TCG
[-] [kg] [kg] [m] [m] [m]
AB fr 0 SB = +
600 Secondary ship systems
610 Hydraulic piping 1 5000 5,000 10.00 40.00
620 Compressed air piping 6 2000 12,000 8.50 45.00
660 Pre-wetting piping Local protection
1 3000 3,000 4.50 45.00
670 CO2 piping 1 1000 1,000 10.00 45.00
680 Cold & freeze piping 1 1000 1,000 10.50 64.50
680 Remaining systems 1 10000 10,000 5.00 50.00 0.00
600 System fillings 22,000 20% 4,400 8.45 44.75 0.00
600 Appendages 22,000 20% 4,400 8.45 44.75
0
610 Hydraulic equipment 1 5000 5,000 10.50 45.50
620 Compressed air equipment 1 3000 3,000 7.50 40.00
670 CO2 equipment 1 1000 1,000 11.00 42.00
680 Cold & freeze equipment 1 1500 1,500 10.50 64.50
Secondary ship systems total 51,300 8.03 46.09
Table 67, Weight calculation final design 600
Code Description Number Weight Weight VCG LCG TCG
[m2] [kg/m2] [kg] [m] [m] [m]
AB fr 0 SB = +
700 Joinery and arrangement of accommodation
710 Joinery main deck 650 m2 150 97,500 10.00 77.00
710 Joinery A - deck 650 m2 150 97,500 12.80 75.00
710 Joinery B - deck 450 m2 120 54,000 15.60 75.00
710 Joinery C - deck 450 m2 120 54,000 18.40 72.50
710 Joinery bridge deck 190 m2 100 19,000 22.50 59.50
730 Floor plates Steel 250 m2 43 10,750 4.00 58.00
Joinery and arrangement of accommodation total
332.750 13,61 73,75
Table 68, Weight calculation final design 700
Code Description Number Weight Weight VCG LCG TCG
[-] [kg] [kg] [m] [m] [m]
AB fr 0 SB = +
800 Nautical, navigation and communication equipment
1 3000 3,000 22.50 60.00
Nautical, navigation and communication equipment total
3,000 22.50 60.00
Table 69, Weight calculation final design 800

182
XX Intact stability calculations final design
TRIM AND STABILITY CALCULATION
FIRM
14 Jun 2013 15:18:44
Condition : 1.1 Light service draft, Departure 100t deckload
Description Weight VCG LCG TCG FSM
ton m m m tonm
Empty ship 5135.000 8.370 53.241 0.000 0.000
Subtotals for group : Ballast water
BW FP 155-fwd 0.000 0.002 110.300 0.000 0.000
BW DB CT 133-145 0.000 -0.000 97.190 0.000 0.000
BW DB SB 124-133 0.000 -0.000 89.889 0.106 0.000
BW DB PS 124-133 0.000 -0.000 89.889 -0.106 0.000
BW WT SB 124-133 0.000 2.500 90.007 3.360 0.000
BW WT PS 124-133 0.000 2.500 90.007 -3.360 0.000
BW DB SB 112-124 0.000 -0.000 82.495 0.118 0.000
BW DB PS 112-124 0.000 -0.000 82.495 -0.118 0.000
BW WT SB 112-124 0.000 2.500 82.749 4.281 0.000
BW WT PS 112-124 0.000 2.500 82.749 -4.281 0.000
BW DB SB 100-112 0.000 -0.000 74.152 0.131 0.000
BW DB PS 100-112 0.000 -0.000 74.152 -0.131 0.000
BW WT SB 100-112 0.000 2.500 73.849 5.053 0.000
BW WT PS 100-112 0.000 2.500 73.849 -5.053 0.000
BW DB SB 88-100 0.000 -0.000 65.835 0.137 0.000
BW DB PS 88-100 0.000 -0.000 65.835 -0.137 0.000
BW WT SB 88-100 0.000 2.500 65.579 5.452 0.000
BW WT PS 88-100 0.000 2.500 65.579 -5.452 0.000
BW DB SB 73-88 0.000 -0.000 56.254 0.136 0.000
BW DB PS 73-88 0.000 -0.000 56.254 -0.136 0.000
BW WT SB 73-88 0.000 2.500 56.485 7.076 0.000
BW WT PS 73-88 0.000 2.500 56.485 -7.076 0.000
BW DB SB 61-73 0.000 -0.000 48.739 0.137 0.000
BW DB PS 61-73 0.000 -0.000 48.739 -0.137 0.000
BW WT SB 61-73 0.000 2.500 46.740 7.419 0.000
BW WT PS 61-73 0.000 2.500 46.740 -7.419 0.000
BW DB SB 49-61 0.000 0.015 42.024 0.203 0.000
BW DB PS 49-61 0.000 0.015 42.024 -0.203 0.000
BW WT SB 49-61 0.000 2.500 38.458 7.466 0.000
BW WT PS 49-61 0.000 2.500 38.458 -7.466 0.000
BW DB SB 37-49 0.000 0.123 34.063 0.144 0.000
BW DB PS 37-49 0.000 0.123 34.063 -0.144 0.000
BW WT SB 37-49 0.000 2.500 30.454 7.408 0.000
BW WT PS 37-49 0.000 2.500 30.454 -7.408 0.000
BW SB 4-19 0.000 5.750 8.540 8.034 0.000
BW PS 4-19 0.000 5.750 8.540 -8.034 0.000
BW SB -4-4 0.000 4.761 -1.533 0.033 0.000
BW PS -4-4 0.000 4.761 -1.533 -0.033 0.000
SUBTOTAL 0.000 0.000 0.000 0.000 0.000

183
Subtotals for group : Fuel oil
FO CT 124-133 84.241 4.092 89.765 0.000 0.000 !
FO CT 112-124 0.000 2.500 82.367 0.000 0.000
FO CT 100-112 185.000 4.092 74.200 0.000 341.545 !
FO CT 88-100 0.000 2.500 65.800 0.000 0.000
FO SB 4-19 0.000 5.750 8.050 5.600 0.000
FO PS 4-19 0.000 5.750 8.050 -5.600 0.000
SUBTOTAL 269.241 4.092 79.070 0.000 341.545
Subtotals for group : Fresh water
FW WT SB 133-145 24.788 3.254 97.303 2.544 15.764 !
FW WT PS 133-145 24.788 3.254 97.303 -2.544 15.764 !
SUBTOTAL 49.576 3.254 97.303 -0.000 31.528
Subtotals for group : Crew and stores
Crew and stores 17.000 13.500 75.000 0.000 0.000
SUBTOTAL 17.000 13.500 75.000 0.000 0.000
Subtotals for group : Deck load
Deckload 100t 100.000 10.000 23.000 0.000 0.000
SUBTOTAL 100.000 10.000 23.000 0.000 0.000
TOTAL 5570.817 8.163 54.405 -0.000 373.073
For FSM's marked with ! one of the following methods has been chosen :
1. FSM is set to zero, 2. FSM is set to the maximum, 3. FSM is set to zero
if filling percentage > 98%
Hydrostatics Drafts and trim
Volume 5434.946 m3 Drafts above base :
LCF 48.486 m Draft mean (Lpp/2) 5.093 m
Mom. change trim 118.834 tonm/cm Draft aft (App) 5.178 m
Ton/cm immersion 17.087 ton/cm Draft fore (Fpp) 5.008 m
Specific weight 1.025 ton/m3 Trim -0.171 m
Transverse stability
KM transverse 9.913 m
VCG 8.163 m
GM solid 1.751 m
GG' correction 0.067 m
G'M liquid 1.684 m VCG' 8.230 m
The stability values are calculated for the actual trim.
Statical and dynamical stability, calculated with constant LCB :
Angle(SB) Draft mld. Trim KNsinφ VCG'sinφ TCGcosφ G'Nsinφ Area
degrees m m m m m m mrad
0.00 5.093 -0.171 0.000 0.000 -0.000 0.000 0.000
2.00 5.090 -0.157 0.346 0.287 -0.000 0.059 0.001
5.00 5.077 -0.091 0.864 0.717 -0.000 0.147 0.006
7.00 5.062 -0.022 1.208 1.003 -0.000 0.205 0.013
10.00 5.030 0.115 1.721 1.429 -0.000 0.292 0.026
15.00 4.948 0.417 2.562 2.130 -0.000 0.432 0.057
20.00 4.826 0.814 3.376 2.815 -0.000 0.562 0.101
25.00 4.658 1.295 4.142 3.478 -0.000 0.664 0.155
30.00 4.447 1.784 4.827 4.115 -0.000 0.712 0.215
35.00 4.187 2.254 5.435 4.720 -0.000 0.715 0.277
40.00 3.860 2.730 5.991 5.290 -0.000 0.701 0.339
50.00 2.890 3.788 7.025 6.304 -0.000 0.721 0.462
60.00 1.261 5.098 7.873 7.127 -0.000 0.746 0.591

184
Statical angle of inclination is 0.000 degrees to starboard
Contour : FIRM
Summary
Hydrostatics Criterion Value
Draft mld. 6.600 5.093 m
Trim -0.171 m
Statical angle of inclination 0.00 degrees SB
Flooding angle 60.00 degrees
Intact Stability Code for vessels with a large B/H ratio Criterion Value
Minimum metacentric height G'M 0.150 1.684 meter
Maximum GZ at 30 degrees or more 0.200 0.746 meter
Top of the GZ curve at least at 15.000 59.390 degrees
Area under the GZ curve up to 30 degrees 0.055 0.215 mrad
Area under the GZ curve between 30 and 40 degrees 0.030 0.124 mrad
Maximum angle of inclination acc. to IMO's A.562 weathercriterion50.00027.473 degrees
Maximum statical angle due to wind 16.000 5.150 degrees
Maximum statical angle 80% of angle of deck immersion 18.511 5.150 degrees
VCG'
Actual 8.230 m
Maximum allowable 8.894 m
Loading condition complies with the stated criteria.
Angle of inclination in degrees 1/4.62
0.0 25.0 50.00.0
Righting lever 1/13
0.0
0.5
0.0

185
TRIM AND STABILITY CALCULATION
FIRM
14 Jun 2013 15:19:20
Condition : 1.2 Light service draft, Arrival 100t deckload
Description Weight VCG LCG TCG FSM
ton m m m tonm
Empty ship 5135.000 8.370 53.241 0.000 0.000
Subtotals for group : Ballast water
BW FP 155-fwd 0.000 0.002 110.300 0.000 0.000
BW DB CT 133-145 89.028 1.430 97.069 0.000 157.940
BW DB SB 124-133 0.000 -0.000 89.889 0.106 0.000
BW DB PS 124-133 0.000 -0.000 89.889 -0.106 0.000
BW WT SB 124-133 0.000 2.500 90.007 3.360 0.000
BW WT PS 124-133 0.000 2.500 90.007 -3.360 0.000
BW DB SB 112-124 0.000 -0.000 82.495 0.118 0.000
BW DB PS 112-124 0.000 -0.000 82.495 -0.118 0.000
BW WT SB 112-124 0.000 2.500 82.749 4.281 0.000
BW WT PS 112-124 0.000 2.500 82.749 -4.281 0.000
BW DB SB 100-112 0.000 -0.000 74.152 0.131 0.000
BW DB PS 100-112 0.000 -0.000 74.152 -0.131 0.000
BW WT SB 100-112 0.000 2.500 73.849 5.053 0.000
BW WT PS 100-112 0.000 2.500 73.849 -5.053 0.000
BW DB SB 88-100 0.000 -0.000 65.835 0.137 0.000
BW DB PS 88-100 0.000 -0.000 65.835 -0.137 0.000
BW WT SB 88-100 0.000 2.500 65.579 5.452 0.000
BW WT PS 88-100 0.000 2.500 65.579 -5.452 0.000
BW DB SB 73-88 0.000 -0.000 56.254 0.136 0.000
BW DB PS 73-88 0.000 -0.000 56.254 -0.136 0.000
BW WT SB 73-88 0.000 2.500 56.485 7.076 0.000
BW WT PS 73-88 0.000 2.500 56.485 -7.076 0.000
BW DB SB 61-73 0.000 -0.000 48.739 0.137 0.000
BW DB PS 61-73 0.000 -0.000 48.739 -0.137 0.000
BW WT SB 61-73 0.000 2.500 46.740 7.419 0.000
BW WT PS 61-73 0.000 2.500 46.740 -7.419 0.000
BW DB SB 49-61 0.000 0.015 42.024 0.203 0.000
BW DB PS 49-61 0.000 0.015 42.024 -0.203 0.000
BW WT SB 49-61 0.000 2.500 38.458 7.466 0.000
BW WT PS 49-61 0.000 2.500 38.458 -7.466 0.000
BW DB SB 37-49 0.000 0.123 34.063 0.144 0.000
BW DB PS 37-49 0.000 0.123 34.063 -0.144 0.000
BW WT SB 37-49 0.000 2.500 30.454 7.408 0.000
BW WT PS 37-49 0.000 2.500 30.454 -7.408 0.000
BW SB 4-19 0.000 5.750 8.540 8.034 0.000
BW PS 4-19 0.000 5.750 8.540 -8.034 0.000
BW SB -4-4 0.000 4.761 -1.533 0.033 0.000
BW PS -4-4 0.000 4.761 -1.533 -0.033 0.000
SUBTOTAL 89.028 1.430 97.069 0.000 157.940
Subtotals for group : Fuel oil
FO CT 124-133 8.596 2.662 89.765 0.000 0.000 !
FO CT 112-124 0.000 2.500 82.367 0.000 0.000
FO CT 100-112 18.878 2.662 74.200 0.000 341.545 !
FO CT 88-100 0.000 2.500 65.800 0.000 0.000
FO SB 4-19 0.000 5.750 8.050 5.600 0.000
FO PS 4-19 0.000 5.750 8.050 -5.600 0.000
SUBTOTAL 27.474 2.662 79.070 0.000 341.545

186
Subtotals for group : Fresh water
FW WT SB 133-145 24.788 3.254 97.303 2.544 15.764 !
FW WT PS 133-145 24.788 3.254 97.303 -2.544 15.764 !
SUBTOTAL 49.576 3.254 97.303 -0.000 31.528
Subtotals for group : Crew and stores
Crew and stores 17.000 13.500 75.000 0.000 0.000
SUBTOTAL 17.000 13.500 75.000 0.000 0.000
Subtotals for group : Deck load
Deckload 100t 100.000 10.000 23.000 0.000 0.000
SUBTOTAL 100.000 10.000 23.000 0.000 0.000
TOTAL 5418.078 8.226 54.005 -0.000 531.013
For FSM's marked with ! one of the following methods has been chosen :
1. FSM is set to zero, 2. FSM is set to the maximum, 3. FSM is set to zero
if filling percentage > 98%
Hydrostatics Drafts and trim
Volume 5285.932 m3 Drafts above base :
LCF 48.343 m Draft mean (Lpp/2) 4.981 m
Mom. change trim 118.387 tonm/cm Draft aft (App) 5.194 m
Ton/cm immersion 17.020 ton/cm Draft fore (Fpp) 4.769 m
Specific weight 1.025 ton/m3 Trim -0.426 m
Transverse stability
KM transverse 9.985 m
VCG 8.226 m
GM solid 1.758 m
GG' correction 0.098 m
G'M liquid 1.660 m VCG' 8.324 m
The stability values are calculated for the actual trim.
Statical and dynamical stability, calculated with constant LCB :
Angle(SB) Draft mld. Trim KNsinφ VCG'sinφ TCGcosφ G'Nsinφ Area
degrees m m m m m m mrad
0.00 4.981 -0.426 0.000 0.000 -0.000 0.000 0.000
2.00 4.979 -0.412 0.348 0.291 -0.000 0.058 0.001
5.00 4.965 -0.345 0.870 0.726 -0.000 0.145 0.006
7.00 4.950 -0.275 1.216 1.014 -0.000 0.202 0.012
10.00 4.917 -0.139 1.732 1.446 -0.000 0.286 0.025
15.00 4.835 0.162 2.576 2.155 -0.000 0.422 0.056
20.00 4.711 0.559 3.392 2.847 -0.000 0.545 0.098
25.00 4.539 1.040 4.159 3.518 -0.000 0.641 0.151
30.00 4.324 1.535 4.845 4.162 -0.000 0.683 0.209
35.00 4.059 2.009 5.452 4.775 -0.000 0.677 0.268
40.00 3.725 2.486 6.005 5.351 -0.000 0.654 0.326
50.00 2.737 3.541 7.033 6.377 -0.000 0.656 0.440
60.00 1.061 4.842 7.895 7.209 -0.000 0.686 0.557
Statical angle of inclination is 0.000 degrees to starboard
Contour : FIRM

187
Summary
Hydrostatics Criterion Value
Draft mld. 6.600 4.981 m
Trim -0.426 m
Statical angle of inclination 0.00 degrees SB
Flooding angle 60.00 degrees
Intact Stability Code for vessels with a large B/H ratio Criterion Value
Minimum metacentric height G'M 0.150 1.660 meter
Maximum GZ at 30 degrees or more 0.200 0.686 meter
Top of the GZ curve at least at 15.000 60.000 degrees
Area under the GZ curve up to 30 degrees 0.055 0.209 mrad
Area under the GZ curve between 30 and 40 degrees 0.030 0.118 mrad
Maximum angle of inclination acc. to IMO's A.562 weathercriterion50.00028.637 degrees
Maximum statical angle due to wind 16.000 5.459 degrees
Maximum statical angle 80% of angle of deck immersion 18.850 5.459 degrees
VCG'
Actual 8.324 m
Maximum allowable 8.887 m
Loading condition complies with the stated criteria.
Angle of inclination in degrees 1/4.62
0.0 25.0 50.00.0
Righting lever 1/12
0.0
0.5
0.0

188
TRIM AND STABILITY CALCULATION
FIRM
14 Jun 2013 15:19:58
Condition : 2.1 Design draft, Departure 100% consumables 600t deckload
Description Weight VCG LCG TCG FSM
ton m m m tonm
Empty ship 5135.000 8.370 53.241 0.000 0.000
Subtotals for group : Ballast water
BW FP 155-fwd 0.000 0.002 110.300 0.000 0.000
BW DB CT 133-145 95.217 1.498 97.069 0.000 0.000
BW DB SB 124-133 45.511 1.499 89.857 1.626 0.000
BW DB PS 124-133 45.511 1.499 89.857 -1.626 0.000
BW WT SB 124-133 0.000 2.500 90.007 3.360 0.000
BW WT PS 124-133 0.000 2.500 90.007 -3.360 0.000
BW DB SB 112-124 0.000 -0.000 82.495 0.118 0.000
BW DB PS 112-124 0.000 -0.000 82.495 -0.118 0.000
BW WT SB 112-124 0.000 2.500 82.749 4.281 0.000
BW WT PS 112-124 0.000 2.500 82.749 -4.281 0.000
BW DB SB 100-112 0.000 -0.000 74.152 0.131 0.000
BW DB PS 100-112 0.000 -0.000 74.152 -0.131 0.000
BW WT SB 100-112 0.000 2.500 73.849 5.053 0.000
BW WT PS 100-112 0.000 2.500 73.849 -5.053 0.000
BW DB SB 88-100 0.000 -0.000 65.835 0.137 0.000
BW DB PS 88-100 0.000 -0.000 65.835 -0.137 0.000
BW WT SB 88-100 0.000 2.500 65.579 5.452 0.000
BW WT PS 88-100 0.000 2.500 65.579 -5.452 0.000
BW DB SB 73-88 0.000 -0.000 56.254 0.136 0.000
BW DB PS 73-88 0.000 -0.000 56.254 -0.136 0.000
BW WT SB 73-88 0.000 2.500 56.485 7.076 0.000
BW WT PS 73-88 0.000 2.500 56.485 -7.076 0.000
BW DB SB 61-73 0.000 -0.000 48.739 0.137 0.000
BW DB PS 61-73 0.000 -0.000 48.739 -0.137 0.000
BW WT SB 61-73 0.000 2.500 46.740 7.419 0.000
BW WT PS 61-73 0.000 2.500 46.740 -7.419 0.000
BW DB SB 49-61 0.000 0.015 42.024 0.203 0.000
BW DB PS 49-61 0.000 0.015 42.024 -0.203 0.000
BW WT SB 49-61 0.000 2.500 38.458 7.466 0.000
BW WT PS 49-61 0.000 2.500 38.458 -7.466 0.000
BW DB SB 37-49 0.000 0.123 34.063 0.144 0.000
BW DB PS 37-49 0.000 0.123 34.063 -0.144 0.000
BW WT SB 37-49 0.000 2.500 30.454 7.408 0.000
BW WT PS 37-49 0.000 2.500 30.454 -7.408 0.000
BW SB 4-19 0.000 5.750 8.540 8.034 0.000
BW PS 4-19 0.000 5.750 8.540 -8.034 0.000
BW SB -4-4 0.000 4.761 -1.533 0.033 0.000
BW PS -4-4 0.000 4.761 -1.533 -0.033 0.000
SUBTOTAL 186.240 1.498 93.544 -0.000 0.000
Subtotals for group : Fuel oil
FO CT 124-133 84.241 4.092 89.765 0.000 0.000 !
FO CT 112-124 158.571 4.092 82.367 0.000 0.000 !
FO CT 100-112 185.000 4.092 74.200 0.000 341.545 !
FO CT 88-100 185.000 4.092 65.800 0.000 0.000 !
FO SB 4-19 77.084 7.342 8.050 5.600 0.000 !
FO PS 4-19 77.084 7.342 8.050 -5.600 0.000 !
SUBTOTAL 766.980 4.746 62.275 0.000 341.545

189
Subtotals for group : Fresh water
FW WT SB 133-145 47.216 3.848 97.285 2.648 15.764 !
FW WT PS 133-145 47.216 3.848 97.285 -2.648 15.764 !
SUBTOTAL 94.431 3.848 97.285 0.000 31.528
Subtotals for group : Crew and stores
Crew and stores 17.000 13.500 75.000 0.000 0.000
SUBTOTAL 17.000 13.500 75.000 0.000 0.000
Subtotals for group : Deck load
Deckload 600t 600.000 10.000 23.000 0.000 0.000
SUBTOTAL 600.000 10.000 23.000 0.000 0.000
TOTAL 6799.650 7.867 53.362 0.000 373.073
For FSM's marked with ! one of the following methods has been chosen :
1. FSM is set to zero, 2. FSM is set to the maximum, 3. FSM is set to zero
if filling percentage > 98%
Hydrostatics Drafts and trim
Volume 6634.102 m3 Drafts above base :
LCF 47.006 m Draft mean (Lpp/2) 5.796 m
Mom. change trim 135.574 tonm/cm Draft aft (App) 5.832 m
Ton/cm immersion 18.220 ton/cm Draft fore (Fpp) 5.760 m
Specific weight 1.025 ton/m3 Trim -0.073 m
Transverse stability
KM transverse 10.072 m
VCG 7.867 m
GM solid 2.206 m
GG' correction 0.055 m
G'M liquid 2.151 m VCG' 7.922 m
The stability values are calculated for the actual trim.
Statical and dynamical stability, calculated with constant LCB :
Angle(SB) Draft mld. Trim KNsinφ VCG'sinφ TCGcosφ G'Nsinφ Area
degrees m m m m m m mrad
0.00 5.796 -0.073 0.000 0.000 -0.000 0.000 0.000
2.00 5.794 -0.064 0.351 0.276 -0.000 0.075 0.001
5.00 5.783 -0.021 0.876 0.690 -0.000 0.185 0.008
7.00 5.771 0.029 1.222 0.965 -0.000 0.257 0.016
10.00 5.743 0.136 1.738 1.376 -0.000 0.363 0.032
15.00 5.673 0.387 2.587 2.050 -0.000 0.537 0.071
20.00 5.571 0.704 3.404 2.709 -0.000 0.694 0.125
25.00 5.448 0.991 4.138 3.348 -0.000 0.790 0.191
30.00 5.298 1.215 4.794 3.961 -0.000 0.833 0.262
35.00 5.107 1.417 5.396 4.544 -0.000 0.852 0.335
40.00 4.857 1.621 5.958 5.092 -0.000 0.866 0.410
50.00 4.096 2.076 6.988 6.068 -0.000 0.920 0.566
60.00 2.906 2.534 7.702 6.860 -0.000 0.842 0.724
Statical angle of inclination is 0.000 degrees to starboard
Contour : FIRM

190
Summary
Hydrostatics Criterion Value
User defined draft 5.900 5.796 m
Trim -0.073 m
Statical angle of inclination 0.00 degrees SB
Flooding angle 60.00 degrees
Intact Stability Code for vessels with a large B/H ratio Criterion Value
Minimum metacentric height G'M 0.150 2.151 meter
Maximum GZ at 30 degrees or more 0.200 0.922 meter
Top of the GZ curve at least at 15.000 51.726 degrees
Area under the GZ curve up to 30 degrees 0.055 0.262 mrad
Area under the GZ curve between 30 and 40 degrees 0.030 0.149 mrad
Maximum angle of inclination acc. to IMO's A.562 weathercriterion50.00024.291 degrees
Maximum statical angle due to wind 16.000 3.144 degrees
Maximum statical angle 80% of angle of deck immersion 14.794 3.144 degrees
VCG'
Actual 7.922 m
Maximum allowable 9.005 m
Loading condition complies with the stated criteria.
Angle of inclination in degrees 1/4.62
0.0 25.0 50.00.0
Righting lever 1/16
0.0
0.0
-0.5

191
TRIM AND STABILITY CALCULATION
FIRM
14 Jun 2013 15:20:31
Condition : 2.2 Design draft, Arrival 10% consumables 600t deckload
Description Weight VCG LCG TCG FSM
ton m m m tonm
Empty ship 5135.000 8.370 53.241 0.000 0.000
Subtotals for group : Ballast water
BW FP 155-fwd 199.539 6.137 111.550 0.000 0.000
BW DB CT 133-145 95.217 1.498 97.069 0.000 0.000
BW DB SB 124-133 45.511 1.499 89.857 1.626 0.000
BW DB PS 124-133 45.511 1.499 89.857 -1.626 0.000
BW WT SB 124-133 0.000 2.500 90.007 3.360 0.000
BW WT PS 124-133 0.000 2.500 90.007 -3.360 0.000
BW DB SB 112-124 0.000 -0.000 82.495 0.118 0.000
BW DB PS 112-124 0.000 -0.000 82.495 -0.118 0.000
BW WT SB 112-124 0.000 2.500 82.749 4.281 0.000
BW WT PS 112-124 0.000 2.500 82.749 -4.281 0.000
BW DB SB 100-112 0.000 -0.000 74.152 0.131 0.000
BW DB PS 100-112 0.000 -0.000 74.152 -0.131 0.000
BW WT SB 100-112 0.000 2.500 73.849 5.053 0.000
BW WT PS 100-112 0.000 2.500 73.849 -5.053 0.000
BW DB SB 88-100 0.000 -0.000 65.835 0.137 0.000
BW DB PS 88-100 0.000 -0.000 65.835 -0.137 0.000
BW WT SB 88-100 0.000 2.500 65.579 5.452 0.000
BW WT PS 88-100 0.000 2.500 65.579 -5.452 0.000
BW DB SB 73-88 0.000 -0.000 56.254 0.136 0.000
BW DB PS 73-88 0.000 -0.000 56.254 -0.136 0.000
BW WT SB 73-88 0.000 2.500 56.485 7.076 0.000
BW WT PS 73-88 0.000 2.500 56.485 -7.076 0.000
BW DB SB 61-73 0.000 -0.000 48.739 0.137 0.000
BW DB PS 61-73 0.000 -0.000 48.739 -0.137 0.000
BW WT SB 61-73 0.000 2.500 46.740 7.419 0.000
BW WT PS 61-73 0.000 2.500 46.740 -7.419 0.000
BW DB SB 49-61 0.000 0.015 42.024 0.203 0.000
BW DB PS 49-61 0.000 0.015 42.024 -0.203 0.000
BW WT SB 49-61 0.000 2.500 38.458 7.466 0.000
BW WT PS 49-61 0.000 2.500 38.458 -7.466 0.000
BW DB SB 37-49 0.000 0.123 34.063 0.144 0.000
BW DB PS 37-49 0.000 0.123 34.063 -0.144 0.000
BW WT SB 37-49 0.000 2.500 30.454 7.408 0.000
BW WT PS 37-49 0.000 2.500 30.454 -7.408 0.000
BW SB 4-19 0.000 5.750 8.540 8.034 0.000
BW PS 4-19 0.000 5.750 8.540 -8.034 0.000
BW SB -4-4 0.000 4.761 -1.533 0.033 0.000
BW PS -4-4 0.000 4.761 -1.533 -0.033 0.000
SUBTOTAL 385.779 3.898 102.858 -0.000 0.000
Subtotals for group : Fuel oil
FO CT 124-133 8.596 2.662 89.765 0.000 0.000 !
FO CT 112-124 16.181 2.662 82.367 0.000 0.000 !
FO CT 100-112 18.878 2.662 74.200 0.000 341.545 !
FO CT 88-100 18.878 2.662 65.800 0.000 341.541
FO SB 4-19 7.866 5.912 8.050 5.600 0.000 !
FO PS 4-19 7.866 5.912 8.050 -5.600 0.000 !
SUBTOTAL 78.263 3.316 62.275 0.000 683.086

192
Subtotals for group : Fresh water
FW WT SB 133-145 5.902 2.693 97.329 2.432 15.764 !
FW WT PS 133-145 5.902 2.693 97.329 -2.432 15.764 !
SUBTOTAL 11.804 2.693 97.329 -0.000 31.528
Subtotals for group : Crew and stores
Crew and stores 17.000 13.500 75.000 0.000 0.000
SUBTOTAL 17.000 13.500 75.000 0.000 0.000
Subtotals for group : Deck load
Deckload 600t 600.000 10.000 23.000 0.000 0.000
SUBTOTAL 600.000 10.000 23.000 0.000 0.000
TOTAL 6227.846 8.190 53.657 -0.000 714.614
For FSM's marked with ! one of the following methods has been chosen :
1. FSM is set to zero, 2. FSM is set to the maximum, 3. FSM is set to zero
if filling percentage > 98%
Hydrostatics Drafts and trim
Volume 6075.947 m3 Drafts above base :
LCF 47.364 m Draft mean (Lpp/2) 5.466 m
Mom. change trim 130.251 tonm/cm Draft aft (App) 5.566 m
Ton/cm immersion 17.819 ton/cm Draft fore (Fpp) 5.367 m
Specific weight 1.025 ton/m3 Trim -0.199 m
Transverse stability
KM transverse 10.058 m
VCG 8.190 m
GM solid 1.869 m
GG' correction 0.115 m
G'M liquid 1.754 m VCG' 8.304 m
The stability values are calculated for the actual trim.
Statical and dynamical stability, calculated with constant LCB :
Angle(SB) Draft mld. Trim KNsinφ VCG'sinφ TCGcosφ G'Nsinφ Area
degrees m m m m m m mrad
0.00 5.466 -0.199 0.000 0.000 -0.000 0.000 0.000
2.00 5.464 -0.188 0.351 0.290 -0.000 0.061 0.001
5.00 5.452 -0.133 0.874 0.724 -0.000 0.150 0.007
7.00 5.439 -0.074 1.220 1.012 -0.000 0.208 0.013
10.00 5.409 0.046 1.735 1.442 -0.000 0.293 0.026
15.00 5.334 0.320 2.582 2.149 -0.000 0.432 0.058
20.00 5.223 0.674 3.400 2.840 -0.000 0.560 0.101
25.00 5.077 1.061 4.155 3.510 -0.000 0.645 0.154
30.00 4.900 1.402 4.821 4.152 -0.000 0.669 0.212
35.00 4.678 1.722 5.423 4.763 -0.000 0.659 0.270
40.00 4.394 2.045 5.979 5.338 -0.000 0.641 0.327
50.00 3.533 2.765 7.013 6.362 -0.000 0.652 0.439
60.00 2.141 3.572 7.781 7.192 -0.000 0.589 0.550
Statical angle of inclination is 0.000 degrees to starboard
Contour : FIRM

193
Summary
Hydrostatics Criterion Value
User defined draft 5.900 5.466 m
Trim -0.199 m
Statical angle of inclination 0.00 degrees SB
Flooding angle 60.00 degrees
Intact Stability Code for vessels with a large B/H ratio Criterion Value
Minimum metacentric height G'M 0.150 1.754 meter
Maximum GZ at 30 degrees or more 0.200 0.669 meter
Top of the GZ curve at least at 15.000 30.363 degrees
Area under the GZ curve up to 30 degrees 0.055 0.212 mrad
Area under the GZ curve between 30 and 40 degrees 0.030 0.115 mrad
Maximum angle of inclination acc. to IMO's A.562 weathercriterion50.00026.183 degrees
Maximum statical angle due to wind 16.000 4.371 degrees
Maximum statical angle 80% of angle of deck immersion 16.406 4.371 degrees
VCG'
Actual 8.304 m
Maximum allowable 8.977 m
Loading condition complies with the stated criteria.
Angle of inclination in degrees 1/4.62
0.0 25.0 50.00.0
Righting lever 1/12
0.0
0.5
0.0

194
TRIM AND STABILITY CALCULATION
FIRM
14 Jun 2013 15:21:03
Condition : 3.1 DP draft, Departure 100% consumables 600t deckload
Description Weight VCG LCG TCG FSM
ton m m m tonm
Empty ship 5135.000 8.370 53.241 0.000 0.000
Subtotals for group : Ballast water
BW FP 155-fwd 0.000 0.002 110.300 0.000 0.000
BW DB CT 133-145 95.217 1.498 97.069 0.000 0.000
BW DB SB 124-133 45.511 1.499 89.857 1.626 0.000
BW DB PS 124-133 45.511 1.499 89.857 -1.626 0.000
BW WT SB 124-133 0.000 2.500 90.007 3.360 0.000
BW WT PS 124-133 0.000 2.500 90.007 -3.360 0.000
BW DB SB 112-124 73.001 1.494 82.466 1.951 0.000
BW DB PS 112-124 73.001 1.494 82.466 -1.951 0.000
BW WT SB 112-124 0.000 2.500 82.749 4.281 0.000
BW WT PS 112-124 0.000 2.500 82.749 -4.281 0.000
BW DB SB 100-112 86.731 1.487 74.092 2.301 0.000
BW DB PS 100-112 86.731 1.487 74.092 -2.301 0.000
BW WT SB 100-112 0.000 2.500 73.849 5.053 0.000
BW WT PS 100-112 0.000 2.500 73.849 -5.053 0.000
BW DB SB 88-100 99.317 1.484 65.718 2.627 0.000
BW DB PS 88-100 99.317 1.484 65.718 -2.627 0.000
BW WT SB 88-100 0.000 2.500 65.579 5.452 0.000
BW WT PS 88-100 0.000 2.500 65.579 -5.452 0.000
BW DB SB 73-88 137.750 1.489 56.277 2.926 0.000
BW DB PS 73-88 137.750 1.489 56.277 -2.926 0.000
BW WT SB 73-88 0.000 2.500 56.485 7.076 0.000
BW WT PS 73-88 0.000 2.500 56.485 -7.076 0.000
BW DB SB 61-73 114.709 1.499 46.898 3.070 0.000
BW DB PS 61-73 114.709 1.499 46.898 -3.070 0.000
BW WT SB 61-73 0.000 2.500 46.740 7.419 0.000
BW WT PS 61-73 0.000 2.500 46.740 -7.419 0.000
BW DB SB 49-61 0.000 0.015 42.024 0.203 0.000
BW DB PS 49-61 0.000 0.015 42.024 -0.203 0.000
BW WT SB 49-61 0.000 2.500 38.458 7.466 0.000
BW WT PS 49-61 0.000 2.500 38.458 -7.466 0.000
BW DB SB 37-49 93.743 1.659 30.346 2.994 0.000
BW DB PS 37-49 93.743 1.659 30.346 -2.994 0.000
BW WT SB 37-49 0.000 2.500 30.454 7.408 0.000
BW WT PS 37-49 0.000 2.500 30.454 -7.408 0.000
BW SB 4-19 104.916 7.507 8.120 8.566 0.000
BW PS 4-19 104.916 7.507 8.120 -8.566 0.000
BW SB -4-4 0.000 4.761 -1.533 0.033 0.000
BW PS -4-4 0.000 4.761 -1.533 -0.033 0.000
SUBTOTAL 1606.574 2.297 55.413 0.000 0.000
Subtotals for group : Fuel oil
FO CT 124-133 84.241 4.092 89.765 0.000 0.000 !
FO CT 112-124 158.571 4.092 82.367 0.000 0.000 !
FO CT 100-112 185.000 4.092 74.200 0.000 341.545 !
FO CT 88-100 185.000 4.092 65.800 0.000 0.000 !
FO SB 4-19 77.084 7.342 8.050 5.600 0.000 !
FO PS 4-19 77.084 7.342 8.050 -5.600 0.000 !
SUBTOTAL 766.980 4.746 62.275 0.000 341.545

195
Subtotals for group : Fresh water
FW WT SB 133-145 47.216 3.848 97.285 2.648 15.423
FW WT PS 133-145 47.216 3.848 97.285 -2.648 15.423
SUBTOTAL 94.431 3.848 97.285 0.000 30.846
Subtotals for group : Crew and stores
Crew and stores 17.000 13.500 75.000 0.000 0.000
SUBTOTAL 17.000 13.500 75.000 0.000 0.000
Subtotals for group : Deck load
Deckload 600t 600.000 10.000 23.000 0.000 0.000
SUBTOTAL 600.000 10.000 23.000 0.000 0.000
TOTAL 8219.984 6.922 52.852 0.000 372.391
For FSM's marked with ! one of the following methods has been chosen :
1. FSM is set to zero, 2. FSM is set to the maximum, 3. FSM is set to zero
if filling percentage > 98%
Hydrostatics Drafts and trim
Volume 8019.525 m3 Drafts above base :
LCF 46.694 m Draft mean (Lpp/2) 6.596 m
Mom. change trim 143.435 tonm/cm Draft aft (App) 6.451 m
Ton/cm immersion 18.934 ton/cm Draft fore (Fpp) 6.742 m
Specific weight 1.025 ton/m3 Trim 0.291 m
Transverse stability
KM transverse 10.046 m
VCG 6.922 m
GM solid 3.123 m
GG' correction 0.045 m
G'M liquid 3.078 m VCG' 6.968 m
The stability values are calculated for the actual trim.
Statical and dynamical stability, calculated with constant LCB :
Angle(SB) Draft mld. Trim KNsinφ VCG'sinφ TCGcosφ G'Nsinφ Area
degrees m m m m m m mrad
0.00 6.596 0.291 0.000 0.000 0.000 -0.000 0.000
2.00 6.595 0.296 0.351 0.243 0.000 0.107 0.002
5.00 6.585 0.322 0.876 0.607 0.000 0.269 0.012
7.00 6.574 0.355 1.225 0.849 0.000 0.376 0.023
10.00 6.551 0.429 1.745 1.210 0.000 0.535 0.047
15.00 6.493 0.610 2.590 1.803 0.000 0.787 0.105
20.00 6.430 0.731 3.358 2.383 0.000 0.975 0.182
25.00 6.361 0.750 4.052 2.945 0.000 1.107 0.273
30.00 6.274 0.705 4.698 3.484 0.000 1.214 0.375
35.00 6.154 0.629 5.309 3.997 0.000 1.312 0.485
40.00 5.987 0.535 5.895 4.479 0.000 1.416 0.604
50.00 5.515 0.243 6.885 5.338 0.000 1.548 0.865
60.00 4.847 -0.237 7.520 6.034 0.000 1.485 1.133
Statical angle of inclination is 0.000 degrees to starboard
Contour : FIRM
Opening is submerged at [degrees]
ER Vent in 56.02

196
Summary
Hydrostatics Criterion Value
Draft mld. 6.600 6.596 m
Trim 0.291 m
Statical angle of inclination 0.00 degrees SB
Flooding angle 56.02 degrees
Intact Stability Code for vessels with a large B/H ratio Criterion Value
Minimum metacentric height G'M 0.150 3.078 meter
Maximum GZ at 30 degrees or more 0.200 1.554 meter
Top of the GZ curve at least at 15.000 52.453 degrees
Area under the GZ curve up to 30 degrees 0.055 0.375 mrad
Area under the GZ curve between 30 and 40 degrees 0.030 0.229 mrad
Maximum angle of inclination acc. to IMO's A.562 weathercriterion50.00023.484 degrees
Maximum statical angle due to wind 16.000 1.684 degrees
Maximum statical angle 80% of angle of deck immersion 11.143 1.684 degrees
VCG'
Actual 6.968 m
Maximum allowable 8.886 m
Loading condition complies with the stated criteria.
Angle of inclination in degrees 1/4.92
0.0 25.0 50.00.0
Righting lever 1/29
0.0
1.0
0.0

197
TRIM AND STABILITY CALCULATION
FIRM
14 Jun 2013 15:21:30
Condition : 3.2 DP draft, Arrival 10% consumables 600t deckload
Description Weight VCG LCG TCG FSM
ton m m m tonm
Empty ship 5135.000 8.370 53.241 0.000 0.000
Subtotals for group : Ballast water
BW FP 155-fwd 0.000 0.002 110.300 0.000 0.000
BW DB CT 133-145 95.217 1.498 97.069 0.000 0.000
BW DB SB 124-133 45.511 1.499 89.857 1.626 0.000
BW DB PS 124-133 45.511 1.499 89.857 -1.626 0.000
BW WT SB 124-133 0.000 2.500 90.007 3.360 0.000
BW WT PS 124-133 0.000 2.500 90.007 -3.360 0.000
BW DB SB 112-124 73.001 1.494 82.466 1.951 0.000
BW DB PS 112-124 73.001 1.494 82.466 -1.951 0.000
BW WT SB 112-124 0.000 2.500 82.749 4.281 0.000
BW WT PS 112-124 0.000 2.500 82.749 -4.281 0.000
BW DB SB 100-112 86.731 1.487 74.092 2.301 0.000
BW DB PS 100-112 86.731 1.487 74.092 -2.301 0.000
BW WT SB 100-112 0.000 2.500 73.849 5.053 0.000
BW WT PS 100-112 0.000 2.500 73.849 -5.053 0.000
BW DB SB 88-100 99.317 1.484 65.718 2.627 0.000
BW DB PS 88-100 99.317 1.484 65.718 -2.627 0.000
BW WT SB 88-100 0.000 2.500 65.579 5.452 0.000
BW WT PS 88-100 0.000 2.500 65.579 -5.452 0.000
BW DB SB 73-88 137.750 1.489 56.277 2.926 0.000
BW DB PS 73-88 137.750 1.489 56.277 -2.926 0.000
BW WT SB 73-88 0.000 2.500 56.485 7.076 0.000
BW WT PS 73-88 0.000 2.500 56.485 -7.076 0.000
BW DB SB 61-73 114.709 1.499 46.898 3.070 0.000
BW DB PS 61-73 114.709 1.499 46.898 -3.070 0.000
BW WT SB 61-73 0.000 2.500 46.740 7.419 0.000
BW WT PS 61-73 0.000 2.500 46.740 -7.419 0.000
BW DB SB 49-61 111.381 1.533 38.547 3.077 0.000
BW DB PS 49-61 111.381 1.533 38.547 -3.077 0.000
BW WT SB 49-61 0.000 2.500 38.458 7.466 0.000
BW WT PS 49-61 0.000 2.500 38.458 -7.466 0.000
BW DB SB 37-49 93.743 1.659 30.346 2.994 0.000
BW DB PS 37-49 93.743 1.659 30.346 -2.994 0.000
BW WT SB 37-49 0.000 2.500 30.454 7.408 0.000
BW WT PS 37-49 0.000 2.500 30.454 -7.408 0.000
BW SB 4-19 0.000 5.750 8.540 8.034 0.000
BW PS 4-19 0.000 5.750 8.540 -8.034 0.000
BW SB -4-4 0.000 4.761 -1.533 0.033 0.000
BW PS -4-4 0.000 4.761 -1.533 -0.033 0.000
SUBTOTAL 1619.504 1.517 59.220 0.000 0.000
Subtotals for group : Fuel oil
FO CT 124-133 8.596 2.662 89.765 0.000 0.000 !
FO CT 112-124 16.181 2.662 82.367 0.000 0.000 !
FO CT 100-112 18.878 2.662 74.200 0.000 341.545 !
FO CT 88-100 18.878 2.662 65.800 0.000 0.000 !
FO SB 4-19 7.866 5.912 8.050 5.600 0.000 !
FO PS 4-19 7.866 5.912 8.050 -5.600 0.000 !
SUBTOTAL 78.263 3.316 62.275 0.000 341.545

198
Subtotals for group : Fresh water
FW WT SB 133-145 5.902 2.693 97.329 2.432 7.420
FW WT PS 133-145 5.902 2.693 97.329 -2.432 7.420
SUBTOTAL 11.804 2.693 97.329 -0.000 14.840
Subtotals for group : Crew and stores
Crew and stores 17.000 13.500 75.000 0.000 0.000
SUBTOTAL 17.000 13.500 75.000 0.000 0.000
Subtotals for group : Deck load
Deckload 600t 600.000 10.000 23.000 0.000 0.000
SUBTOTAL 600.000 10.000 23.000 0.000 0.000
TOTAL 7461.571 6.963 52.321 0.000 356.385
For FSM's marked with ! one of the following methods has been chosen :
1. FSM is set to zero, 2. FSM is set to the maximum, 3. FSM is set to zero
if filling percentage > 98%
Hydrostatics Drafts and trim
Volume 7279.650 m3 Drafts above base :
LCF 46.594 m Draft mean (Lpp/2) 6.131 m
Mom. change trim 140.384 tonm/cm Draft aft (App) 6.290 m
Ton/cm immersion 18.616 ton/cm Draft fore (Fpp) 5.972 m
Specific weight 1.025 ton/m3 Trim -0.318 m
Transverse stability
KM transverse 10.122 m
VCG 6.963 m
GM solid 3.158 m
GG' correction 0.048 m
G'M liquid 3.111 m VCG' 7.011 m
The stability values are calculated for the actual trim.
Statical and dynamical stability, calculated with constant LCB :
Angle(SB) Draft mld. Trim KNsinφ VCG'sinφ TCGcosφ G'Nsinφ Area
degrees m m m m m m mrad
0.00 6.131 -0.318 0.000 0.000 0.000 -0.000 0.000
2.00 6.129 -0.313 0.353 0.245 0.000 0.109 0.002
5.00 6.119 -0.283 0.882 0.611 0.000 0.271 0.012
7.00 6.108 -0.247 1.233 0.854 0.000 0.378 0.023
10.00 6.083 -0.164 1.755 1.217 0.000 0.538 0.047
15.00 6.020 0.040 2.607 1.815 0.000 0.793 0.105
20.00 5.937 0.249 3.402 2.398 0.000 1.004 0.184
25.00 5.846 0.354 4.108 2.963 0.000 1.145 0.278
30.00 5.731 0.401 4.754 3.506 0.000 1.249 0.383
35.00 5.580 0.415 5.357 4.021 0.000 1.336 0.496
40.00 5.376 0.418 5.929 4.507 0.000 1.422 0.616
50.00 4.758 0.384 6.943 5.371 0.000 1.572 0.879
60.00 3.821 0.207 7.608 6.072 0.000 1.536 1.154
Statical angle of inclination is 0.000 degrees to starboard
Contour : FIRM
Opening is submerged at [degrees]
ER Vent in 58.48

199
Summary
Hydrostatics Criterion Value
Draft mld. 6.600 6.131 m
Trim -0.318 m
Statical angle of inclination 0.00 degrees SB
Flooding angle 58.48 degrees
Intact Stability Code for vessels with a large B/H ratio Criterion Value
Minimum metacentric height G'M 0.150 3.111 meter
Maximum GZ at 30 degrees or more 0.200 1.591 meter
Top of the GZ curve at least at 15.000 54.002 degrees
Area under the GZ curve up to 30 degrees 0.055 0.383 mrad
Area under the GZ curve between 30 and 40 degrees 0.030 0.233 mrad
Maximum angle of inclination acc. to IMO's A.562 weathercriterion50.00022.915 degrees
Maximum statical angle due to wind 16.000 1.933 degrees
Maximum statical angle 80% of angle of deck immersion 12.805 1.933 degrees
VCG'
Actual 7.011 m
Maximum allowable 8.989 m
Loading condition complies with the stated criteria.
Angle of inclination in degrees 1/4.92
0.0 25.0 50.00.0
Righting lever 1/29
0.0
1.0
0.0
-1.0

200
TRIM AND STABILITY CALCULATION
FIRM
14 Jun 2013 15:33:32
Condition : 4.1 Crane operation 100t@15m 100% consumables 500t deckload
Description Weight VCG LCG TCG FSM
ton m m m tonm
Empty ship 5135.000 8.370 53.241 0.000 0.000
Subtotals for group : Ballast water
BW FP 155-fwd 0.000 0.002 110.300 0.000 0.000
BW DB CT 133-145 11.426 0.290 97.137 0.000 63.317
BW DB SB 124-133 45.511 1.499 89.857 1.626 0.000
BW DB PS 124-133 45.511 1.499 89.857 -1.626 0.000
BW WT SB 124-133 0.000 2.500 90.007 3.360 0.000
BW WT PS 124-133 0.000 2.500 90.007 -3.360 0.000
BW DB SB 112-124 73.001 1.494 82.466 1.951 0.000
BW DB PS 112-124 73.001 1.494 82.466 -1.951 0.000
BW WT SB 112-124 0.000 2.500 82.749 4.281 0.000
BW WT PS 112-124 0.000 2.500 82.749 -4.281 0.000
BW DB SB 100-112 86.731 1.487 74.092 2.301 0.000
BW DB PS 100-112 86.731 1.487 74.092 -2.301 0.000
BW WT SB 100-112 0.000 2.500 73.849 5.053 0.000
BW WT PS 100-112 0.000 2.500 73.849 -5.053 0.000
BW DB SB 88-100 99.317 1.484 65.718 2.627 0.000
BW DB PS 88-100 99.317 1.484 65.718 -2.627 0.000
BW WT SB 88-100 0.000 2.500 65.579 5.452 0.000
BW WT PS 88-100 0.000 2.500 65.579 -5.452 0.000
BW DB SB 73-88 137.750 1.489 56.277 2.926 0.000
BW DB PS 73-88 137.750 1.489 56.277 -2.926 0.000
BW WT SB 73-88 0.000 2.500 56.485 7.076 0.000
BW WT PS 73-88 0.000 2.500 56.485 -7.076 0.000
BW DB SB 61-73 114.709 1.499 46.898 3.070 0.000
BW DB PS 61-73 114.709 1.499 46.898 -3.070 0.000
BW WT SB 61-73 0.000 2.500 46.740 7.419 0.000
BW WT PS 61-73 0.000 2.500 46.740 -7.419 0.000
BW DB SB 49-61 0.000 0.015 42.024 0.203 0.000
BW DB PS 49-61 0.000 0.015 42.024 -0.203 0.000
BW WT SB 49-61 100.510 5.847 38.458 8.622 5.681
BW WT PS 49-61 0.000 2.500 38.458 -7.466 0.000
BW DB SB 37-49 93.743 1.659 30.346 2.994 0.000
BW DB PS 37-49 93.743 1.659 30.346 -2.994 0.000
BW WT SB 37-49 102.194 5.899 30.116 8.658 0.000
BW WT PS 37-49 0.000 2.500 30.454 -7.408 0.000
BW SB 4-19 104.916 7.507 8.120 8.566 0.000
BW PS 4-19 0.000 5.750 8.540 -8.034 0.000
BW SB -4-4 0.000 4.761 -1.533 0.033 0.000
BW PS -4-4 0.000 4.761 -1.533 -0.033 0.000
SUBTOTAL 1620.571 2.440 53.674 1.635 68.998
Subtotals for group : Fuel oil
FO CT 124-133 84.241 4.092 89.765 0.000 0.000 !
FO CT 112-124 158.571 4.092 82.367 0.000 0.000 !
FO CT 100-112 185.000 4.092 74.200 0.000 341.545 !
FO CT 88-100 185.000 4.092 65.800 0.000 0.000 !
FO SB 4-19 77.084 7.342 8.050 5.600 0.000 !
FO PS 4-19 77.084 7.342 8.050 -5.600 0.000 !
SUBTOTAL 766.980 4.746 62.275 0.000 341.545

201
Subtotals for group : Fresh water
FW WT SB 133-145 47.216 3.848 97.285 2.648 15.423
FW WT PS 133-145 47.216 3.848 97.285 -2.648 15.423
SUBTOTAL 94.431 3.848 97.285 0.000 30.846
Subtotals for group : Crew and stores
Crew and stores 17.000 13.500 75.000 0.000 0.000
SUBTOTAL 17.000 13.500 75.000 0.000 0.000
Subtotals for group : Crane
Crane load 100.000 27.000 20.000 -20.500 0.000
Crane boom 50.000 25.000 20.000 -12.000 0.000
SUBTOTAL 150.000 26.333 20.000 -17.667 0.000
Deckload 500t 500.000 10.000 23.000 0.000 0.000
TOTAL 8283.981 7.257 52.282 0.000 441.389
For FSM's marked with ! one of the following methods has been chosen :
1. FSM is set to zero, 2. FSM is set to the maximum, 3. FSM is set to zero
if filling percentage > 98%
Hydrostatics Drafts and trim
Volume 8081.957 m3 Drafts above base :
LCF 46.582 m Draft mean (Lpp/2) 6.600 m
Mom. change trim 143.887 tonm/cm Draft aft (App) 6.605 m
Ton/cm immersion 18.976 ton/cm Draft fore (Fpp) 6.595 m
Specific weight 1.025 ton/m3 Trim -0.010 m
Transverse stability
KM transverse 10.080 m
VCG 7.257 m
GM solid 2.823 m
GG' correction 0.053 m
G'M liquid 2.770 m VCG' 7.310 m
The stability values are calculated for the actual trim.
Statical and dynamical stability, calculated with constant LCB :
Angle(SB) Draft mld. Trim KNsinφ VCG'sinφ TCGcosφ G'Nsinφ Area
degrees m m m m m m mrad
0.00 6.600 -0.010 0.000 0.000 0.000 -0.000 0.000
2.00 6.598 -0.005 0.352 0.255 0.000 0.097 0.002
5.00 6.589 0.019 0.879 0.637 0.000 0.242 0.011
7.00 6.578 0.049 1.230 0.891 0.000 0.339 0.021
10.00 6.555 0.116 1.753 1.269 0.000 0.483 0.042
15.00 6.500 0.275 2.598 1.892 0.000 0.706 0.094
20.00 6.443 0.343 3.355 2.500 0.000 0.854 0.163
25.00 6.381 0.309 4.044 3.089 0.000 0.954 0.242
30.00 6.301 0.212 4.688 3.655 0.000 1.033 0.329
35.00 6.189 0.080 5.298 4.193 0.000 1.105 0.422
40.00 6.030 -0.074 5.885 4.699 0.000 1.187 0.522
50.00 5.586 -0.527 6.871 5.600 0.000 1.271 0.739
60.00 4.959 -1.255 7.504 6.331 0.000 1.173 0.955
Statical angle of inclination is 0.000 degrees to starboard
Contour : FIRM
Opening is submerged at [degrees]
ER Vent in 55.57
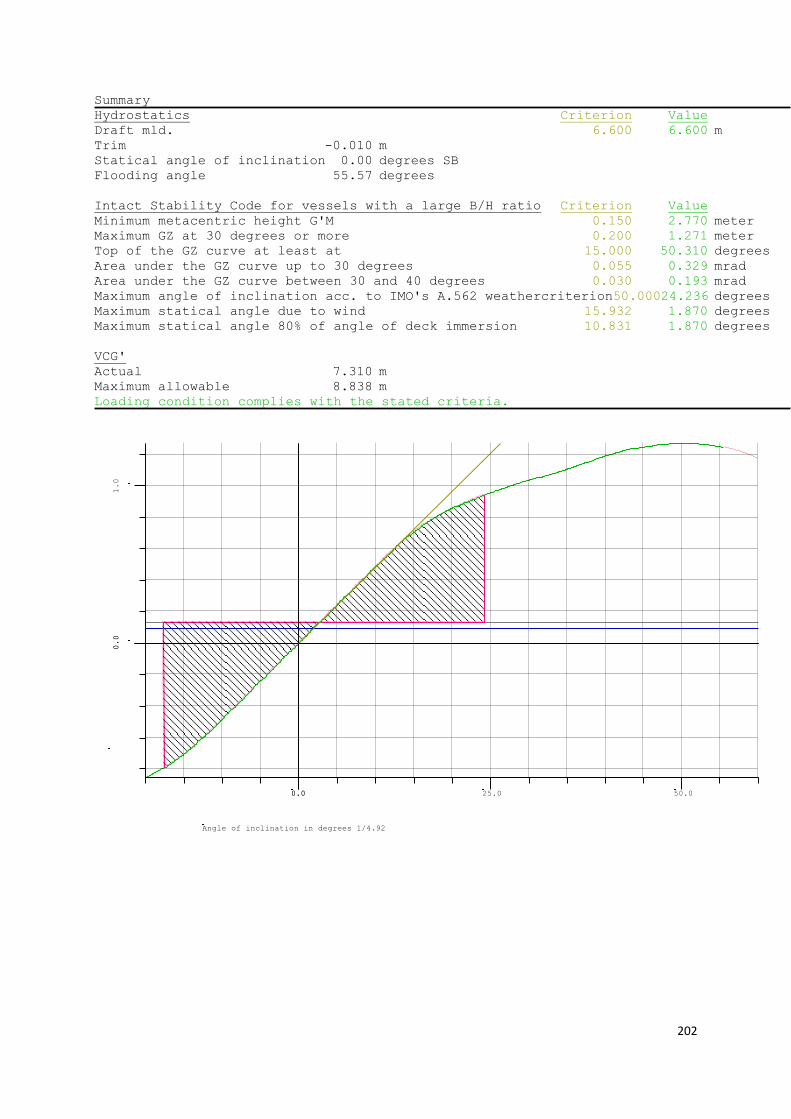
202
Summary
Hydrostatics Criterion Value
Draft mld. 6.600 6.600 m
Trim -0.010 m
Statical angle of inclination 0.00 degrees SB
Flooding angle 55.57 degrees
Intact Stability Code for vessels with a large B/H ratio Criterion Value
Minimum metacentric height G'M 0.150 2.770 meter
Maximum GZ at 30 degrees or more 0.200 1.271 meter
Top of the GZ curve at least at 15.000 50.310 degrees
Area under the GZ curve up to 30 degrees 0.055 0.329 mrad
Area under the GZ curve between 30 and 40 degrees 0.030 0.193 mrad
Maximum angle of inclination acc. to IMO's A.562 weathercriterion50.00024.236 degrees
Maximum statical angle due to wind 15.932 1.870 degrees
Maximum statical angle 80% of angle of deck immersion 10.831 1.870 degrees
VCG'
Actual 7.310 m
Maximum allowable 8.838 m
Loading condition complies with the stated criteria.
Angle of inclination in degrees 1/4.92
0.0 25.0 50.00.0
Righting lever 1/24
0.0
1.0
0.0

203
TRIM AND STABILITY CALCULATION
FIRM
14 Jun 2013 15:36:38
Condition : 4.2 Crane operation 100t@15m 50% consumables 500t deckload
Description Weight VCG LCG TCG FSM
ton m m m tonm
Empty ship 5135.000 8.370 53.241 0.000 0.000
Subtotals for group : Ballast water
BW FP 155-fwd 0.000 0.002 110.300 0.000 0.000
BW DB CT 133-145 95.217 1.498 97.069 0.000 0.000
BW DB SB 124-133 45.511 1.499 89.857 1.626 0.000
BW DB PS 124-133 45.511 1.499 89.857 -1.626 0.000
BW WT SB 124-133 0.000 2.500 90.007 3.360 0.000
BW WT PS 124-133 0.000 2.500 90.007 -3.360 0.000
BW DB SB 112-124 73.001 1.494 82.466 1.951 0.000
BW DB PS 112-124 73.001 1.494 82.466 -1.951 0.000
BW WT SB 112-124 0.000 2.500 82.749 4.281 0.000
BW WT PS 112-124 0.000 2.500 82.749 -4.281 0.000
BW DB SB 100-112 86.731 1.487 74.092 2.301 0.000
BW DB PS 100-112 86.731 1.487 74.092 -2.301 0.000
BW WT SB 100-112 0.000 2.500 73.849 5.053 0.000
BW WT PS 100-112 0.000 2.500 73.849 -5.053 0.000
BW DB SB 88-100 99.317 1.484 65.718 2.627 0.000
BW DB PS 88-100 99.317 1.484 65.718 -2.627 0.000
BW WT SB 88-100 0.000 2.500 65.579 5.452 0.000
BW WT PS 88-100 0.000 2.500 65.579 -5.452 0.000
BW DB SB 73-88 137.750 1.489 56.277 2.926 0.000
BW DB PS 73-88 137.750 1.489 56.277 -2.926 0.000
BW WT SB 73-88 0.000 2.500 56.485 7.076 0.000
BW WT PS 73-88 0.000 2.500 56.485 -7.076 0.000
BW DB SB 61-73 114.709 1.499 46.898 3.070 0.000
BW DB PS 61-73 114.709 1.499 46.898 -3.070 0.000
BW WT SB 61-73 0.000 2.500 46.740 7.419 0.000
BW WT PS 61-73 0.000 2.500 46.740 -7.419 0.000
BW DB SB 49-61 111.381 1.533 38.547 3.077 0.000
BW DB PS 49-61 111.381 1.533 38.547 -3.077 0.000
BW WT SB 49-61 100.510 5.847 38.458 8.622 5.681
BW WT PS 49-61 0.000 2.500 38.458 -7.466 0.000
BW DB SB 37-49 93.743 1.659 30.346 2.994 0.000
BW DB PS 37-49 93.743 1.659 30.346 -2.994 0.000
BW WT SB 37-49 102.194 5.899 30.116 8.658 0.000
BW WT PS 37-49 0.000 2.500 30.454 -7.408 0.000
BW SB 4-19 104.916 7.507 8.120 8.566 0.000
BW PS 4-19 0.000 5.750 8.540 -8.034 0.000
BW SB -4-4 0.000 4.761 -1.533 0.033 0.000
BW PS -4-4 0.000 4.761 -1.533 -0.033 0.000
SUBTOTAL 1927.124 2.301 53.812 1.375 5.681
Subtotals for group : Fuel oil
FO CT 124-133 8.596 2.662 89.765 0.000 0.000 !
FO CT 112-124 16.181 2.662 82.367 0.000 0.000 !
FO CT 100-112 18.878 2.662 74.200 0.000 341.545 !
FO CT 88-100 18.878 2.662 65.800 0.000 0.000 !
FO SB 4-19 7.866 5.912 8.050 5.600 0.000 !
FO PS 4-19 7.866 5.912 8.050 -5.600 0.000 !
SUBTOTAL 78.263 3.316 62.275 0.000 341.545

204
Subtotals for group : Fresh water
FW WT SB 133-145 5.902 2.693 97.329 2.432 7.420
FW WT PS 133-145 5.902 2.693 97.329 -2.432 7.420
SUBTOTAL 11.804 2.693 97.329 -0.000 14.840
Subtotals for group : Crew and stores
Crew and stores 17.000 13.500 75.000 0.000 0.000
SUBTOTAL 17.000 13.500 75.000 0.000 0.000
Subtotals for group : Crane
Crane load 100.000 27.000 20.000 -20.500 0.000
Crane boom 50.000 25.000 20.000 -12.000 0.000
SUBTOTAL 150.000 26.333 20.000 -17.667 0.000
Deckload 500t 500.000 10.000 23.000 0.000 0.000
TOTAL 7819.191 7.275 51.015 0.000 362.066
For FSM's marked with ! one of the following methods has been chosen :
1. FSM is set to zero, 2. FSM is set to the maximum, 3. FSM is set to zero
if filling percentage > 98%
Hydrostatics Drafts and trim
Volume 7628.518 m3 Drafts above base :
LCF 46.268 m Draft mean (Lpp/2) 6.263 m
Mom. change trim 142.469 tonm/cm Draft aft (App) 6.708 m
Ton/cm immersion 18.815 ton/cm Draft fore (Fpp) 5.817 m
Specific weight 1.025 ton/m3 Trim -0.891 m
Transverse stability
KM transverse 10.187 m
VCG 7.275 m
GM solid 2.912 m
GG' correction 0.046 m
G'M liquid 2.865 m VCG' 7.321 m
The stability values are calculated for the actual trim.
Statical and dynamical stability, calculated with constant LCB :
Angle(SB) Draft mld. Trim KNsinφ VCG'sinφ TCGcosφ G'Nsinφ Area
degrees m m m m m m mrad
0.00 6.263 -0.891 0.000 0.000 0.000 -0.000 0.000
2.00 6.261 -0.887 0.356 0.256 0.000 0.100 0.002
5.00 6.252 -0.863 0.889 0.638 0.000 0.251 0.011
7.00 6.241 -0.835 1.244 0.892 0.000 0.351 0.021
10.00 6.218 -0.772 1.772 1.271 0.000 0.501 0.044
15.00 6.161 -0.620 2.627 1.895 0.000 0.732 0.098
20.00 6.099 -0.563 3.389 2.504 0.000 0.885 0.169
25.00 6.030 -0.604 4.078 3.094 0.000 0.983 0.251
30.00 5.941 -0.717 4.718 3.661 0.000 1.057 0.340
35.00 5.817 -0.865 5.322 4.199 0.000 1.123 0.435
40.00 5.643 -1.036 5.901 4.706 0.000 1.195 0.536
50.00 5.126 -1.529 6.901 5.609 0.000 1.292 0.755
60.00 4.356 -2.377 7.550 6.341 0.000 1.210 0.977
Statical angle of inclination is 0.000 degrees to starboard
Contour : FIRM
Opening is submerged at [degrees]
ER Vent in 56.71

205
Summary
Hydrostatics Criterion Value
Draft mld. 6.600 6.263 m
Trim -0.891 m
Statical angle of inclination 0.00 degrees SB
Flooding angle 56.71 degrees
Intact Stability Code for vessels with a large B/H ratio Criterion Value
Minimum metacentric height G'M 0.150 2.865 meter
Maximum GZ at 30 degrees or more 0.200 1.295 meter
Top of the GZ curve at least at 15.000 51.573 degrees
Area under the GZ curve up to 30 degrees 0.055 0.340 mrad
Area under the GZ curve between 30 and 40 degrees 0.030 0.196 mrad
Maximum angle of inclination acc. to IMO's A.562 weathercriterion50.00024.173 degrees
Maximum statical angle due to wind 15.698 2.009 degrees
Maximum statical angle 80% of angle of deck immersion 10.589 2.009 degrees
VCG'
Actual 7.321 m
Maximum allowable 8.915 m
Loading condition complies with the stated criteria.
Angle of inclination in degrees 1/4.92
0.0 25.0 50.00.0
Righting lever 1/25
0.0
1.0
0.0

206
XXI Loss of load calculation final design
TRIM AND STABILITY CALCULATION
FIRM
14 Jun 2013 16:20:30
Condition : 5.1 Crane operation LoL calculation 100% consumables
Description Weight VCG LCG TCG FSM
ton m m m tonm
Empty ship 5135.000 8.370 53.241 0.000 0.000
Subtotals for group : Ballast water
BW FP 155-fwd 0.000 0.002 110.300 0.000 0.000
BW DB CT 133-145 11.426 0.290 97.137 0.000 63.317
BW DB SB 124-133 45.511 1.499 89.857 1.626 0.000
BW DB PS 124-133 45.511 1.499 89.857 -1.626 0.000
BW WT SB 124-133 0.000 2.500 90.007 3.360 0.000
BW WT PS 124-133 0.000 2.500 90.007 -3.360 0.000
BW DB SB 112-124 73.001 1.494 82.466 1.951 0.000
BW DB PS 112-124 73.001 1.494 82.466 -1.951 0.000
BW WT SB 112-124 0.000 2.500 82.749 4.281 0.000
BW WT PS 112-124 0.000 2.500 82.749 -4.281 0.000
BW DB SB 100-112 86.731 1.487 74.092 2.301 0.000
BW DB PS 100-112 86.731 1.487 74.092 -2.301 0.000
BW WT SB 100-112 0.000 2.500 73.849 5.053 0.000
BW WT PS 100-112 0.000 2.500 73.849 -5.053 0.000
BW DB SB 88-100 99.317 1.484 65.718 2.627 0.000
BW DB PS 88-100 99.317 1.484 65.718 -2.627 0.000
BW WT SB 88-100 0.000 2.500 65.579 5.452 0.000
BW WT PS 88-100 0.000 2.500 65.579 -5.452 0.000
BW DB SB 73-88 137.750 1.489 56.277 2.926 0.000
BW DB PS 73-88 137.750 1.489 56.277 -2.926 0.000
BW WT SB 73-88 0.000 2.500 56.485 7.076 0.000
BW WT PS 73-88 0.000 2.500 56.485 -7.076 0.000
BW DB SB 61-73 114.709 1.499 46.898 3.070 0.000
BW DB PS 61-73 114.709 1.499 46.898 -3.070 0.000
BW WT SB 61-73 0.000 2.500 46.740 7.419 0.000
BW WT PS 61-73 0.000 2.500 46.740 -7.419 0.000
BW DB SB 49-61 0.000 0.015 42.024 0.203 0.000
BW DB PS 49-61 0.000 0.015 42.024 -0.203 0.000
BW WT SB 49-61 0.000 2.500 38.458 7.466 0.000
BW WT PS 49-61 0.000 2.500 38.458 -7.466 0.000
BW DB SB 37-49 93.743 1.659 30.346 2.994 0.000
BW DB PS 37-49 93.743 1.659 30.346 -2.994 0.000
BW WT SB 37-49 0.000 2.500 30.454 7.408 0.000
BW WT PS 37-49 0.000 2.500 30.454 -7.408 0.000
BW SB 4-19 0.000 5.750 8.540 8.034 0.000
BW PS 4-19 0.000 5.750 8.540 -8.034 0.000
BW SB -4-4 0.000 4.761 -1.533 0.033 0.000
BW PS -4-4 0.000 4.761 -1.533 -0.033 0.000
SUBTOTAL 1312.951 1.505 60.313 0.000 63.317
Subtotals for group : Fuel oil
FO CT 124-133 84.241 4.092 89.765 0.000 0.000 !
FO CT 112-124 158.571 4.092 82.367 0.000 0.000 !
FO CT 100-112 185.000 4.092 74.200 0.000 341.545 !
FO CT 88-100 185.000 4.092 65.800 0.000 0.000 !
FO SB 4-19 77.084 7.342 8.050 5.600 0.000 !
FO PS 4-19 77.084 7.342 8.050 -5.600 0.000 !
SUBTOTAL 766.980 4.746 62.275 0.000 341.545

207
Subtotals for group : Fresh water
FW WT SB 133-145 47.216 3.848 97.285 2.648 15.423
FW WT PS 133-145 47.216 3.848 97.285 -2.648 15.423
SUBTOTAL 94.431 3.848 97.285 0.000 30.846
Subtotals for group : Crew and stores
Crew and stores 17.000 13.500 75.000 0.000 0.000
SUBTOTAL 17.000 13.500 75.000 0.000 0.000
Subtotals for group : Crane
Crane boom 50.000 25.000 20.000 -12.000 0.000
SUBTOTAL 50.000 25.000 20.000 -12.000 0.000
Deckload 500t 500.000 10.000 23.000 0.000 0.000
TOTAL 7876.361 7.039 53.744 -0.076 435.708
For FSM's marked with ! one of the following methods has been chosen :
1. FSM is set to zero, 2. FSM is set to the maximum, 3. FSM is set to zero
if filling percentage > 98%
Hydrostatics Drafts and trim
Volume 7684.337 m3 Drafts above base :
LCF 46.964 m Draft mean (Lpp/2) 6.449 m
Mom. change trim 141.238 tonm/cm Draft aft (App) 6.129 m
Ton/cm immersion 18.743 ton/cm Draft fore (Fpp) 6.768 m
Specific weight 1.025 ton/m3 Trim 0.638 m
Transverse stability
KM transverse 9.991 m
VCG 7.039 m
GM solid 2.953 m
GG' correction 0.055 m
G'M liquid 2.897 m VCG' 7.094 m
The stability values are calculated for the actual trim.
Statical and dynamical stability, calculated with constant LCB :
Angle(PS) Draft mld. Trim KNsinφ VCG'sinφ TCGcosφ G'Nsinφ Area
degrees m m m m m m mrad
0.00 6.449 0.638 0.000 0.000 0.076 -0.076 0.000
2.00 6.447 0.644 0.349 0.248 0.076 0.025 0.000
5.00 6.437 0.677 0.870 0.618 0.076 0.176 0.005
7.00 6.425 0.717 1.216 0.865 0.076 0.276 0.013
10.00 6.400 0.806 1.732 1.232 0.075 0.425 0.032
15.00 6.338 1.021 2.575 1.836 0.074 0.665 0.079
20.00 6.258 1.254 3.366 2.426 0.072 0.868 0.147
25.00 6.170 1.390 4.075 2.998 0.069 1.008 0.229
30.00 6.062 1.467 4.726 3.547 0.066 1.113 0.322
35.00 5.920 1.516 5.335 4.069 0.062 1.204 0.423
40.00 5.727 1.557 5.915 4.560 0.058 1.297 0.532
50.00 5.162 1.621 6.923 5.434 0.049 1.440 0.772
60.00 4.343 1.642 7.572 6.143 0.038 1.390 1.023
Statical angle of inclination is 1.506 degrees to portside
Opening is submerged at [degrees]
Er vent out 57.57

208
Summary
Hydrostatics Criterion Value
Draft mld. 6.600 6.449 m
Trim 0.638 m
Statical angle of inclination 1.51 degrees PS
Flooding angle 57.57 degrees
DNV loss load Criterion Value
DNV Loss of Load (Pt. 5 Ch. 7 Sec 17 D) Area A2> 1,4 A1 1.400 114.106 -
DNV Loss of Load, angle max 15 degrees 15.000 4.086 degrees
VCG'
Actual 7.094 m
Maximum allowable 8.941 m
Loading condition complies with the stated criteria.
Angle of inclination in degrees 1/3.69
0.0 25.0 50.00.0
Righting lever 1/17
0.0
1.0
0.0

209
TRIM AND STABILITY CALCULATION
FIRM
14 Jun 2013 16:21:28
Condition : 5.2 Crane operation LoL calculation 10% consumables
Description Weight VCG LCG TCG FSM
ton m m m tonm
Empty ship 5135.000 8.370 53.241 0.000 0.000
Subtotals for group : Ballast water
BW FP 155-fwd 0.000 0.002 110.300 0.000 0.000
BW DB CT 133-145 11.426 0.290 97.137 0.000 63.317
BW DB SB 124-133 45.511 1.499 89.857 1.626 0.000
BW DB PS 124-133 45.511 1.499 89.857 -1.626 0.000
BW WT SB 124-133 0.000 2.500 90.007 3.360 0.000
BW WT PS 124-133 0.000 2.500 90.007 -3.360 0.000
BW DB SB 112-124 73.001 1.494 82.466 1.951 0.000
BW DB PS 112-124 73.001 1.494 82.466 -1.951 0.000
BW WT SB 112-124 0.000 2.500 82.749 4.281 0.000
BW WT PS 112-124 0.000 2.500 82.749 -4.281 0.000
BW DB SB 100-112 86.731 1.487 74.092 2.301 0.000
BW DB PS 100-112 86.731 1.487 74.092 -2.301 0.000
BW WT SB 100-112 0.000 2.500 73.849 5.053 0.000
BW WT PS 100-112 0.000 2.500 73.849 -5.053 0.000
BW DB SB 88-100 99.317 1.484 65.718 2.627 0.000
BW DB PS 88-100 99.317 1.484 65.718 -2.627 0.000
BW WT SB 88-100 0.000 2.500 65.579 5.452 0.000
BW WT PS 88-100 0.000 2.500 65.579 -5.452 0.000
BW DB SB 73-88 137.750 1.489 56.277 2.926 0.000
BW DB PS 73-88 137.750 1.489 56.277 -2.926 0.000
BW WT SB 73-88 0.000 2.500 56.485 7.076 0.000
BW WT PS 73-88 0.000 2.500 56.485 -7.076 0.000
BW DB SB 61-73 114.709 1.499 46.898 3.070 0.000
BW DB PS 61-73 114.709 1.499 46.898 -3.070 0.000
BW WT SB 61-73 0.000 2.500 46.740 7.419 0.000
BW WT PS 61-73 0.000 2.500 46.740 -7.419 0.000
BW DB SB 49-61 0.000 0.015 42.024 0.203 0.000
BW DB PS 49-61 0.000 0.015 42.024 -0.203 0.000
BW WT SB 49-61 0.000 2.500 38.458 7.466 0.000
BW WT PS 49-61 0.000 2.500 38.458 -7.466 0.000
BW DB SB 37-49 93.743 1.659 30.346 2.994 0.000
BW DB PS 37-49 93.743 1.659 30.346 -2.994 0.000
BW WT SB 37-49 0.000 2.500 30.454 7.408 0.000
BW WT PS 37-49 0.000 2.500 30.454 -7.408 0.000
BW SB 4-19 0.000 5.750 8.540 8.034 0.000
BW PS 4-19 0.000 5.750 8.540 -8.034 0.000
BW SB -4-4 0.000 4.761 -1.533 0.033 0.000
BW PS -4-4 0.000 4.761 -1.533 -0.033 0.000
SUBTOTAL 1312.951 1.505 60.313 0.000 63.317
Subtotals for group : Fuel oil
FO CT 124-133 8.596 2.662 89.765 0.000 0.000 !
FO CT 112-124 16.181 2.662 82.367 0.000 0.000 !
FO CT 100-112 18.878 2.662 74.200 0.000 341.545 !
FO CT 88-100 18.878 2.662 65.800 0.000 0.000 !
FO SB 4-19 7.866 5.912 8.050 5.600 0.000 !
FO PS 4-19 7.866 5.912 8.050 -5.600 0.000 !
SUBTOTAL 78.263 3.316 62.275 0.000 341.545
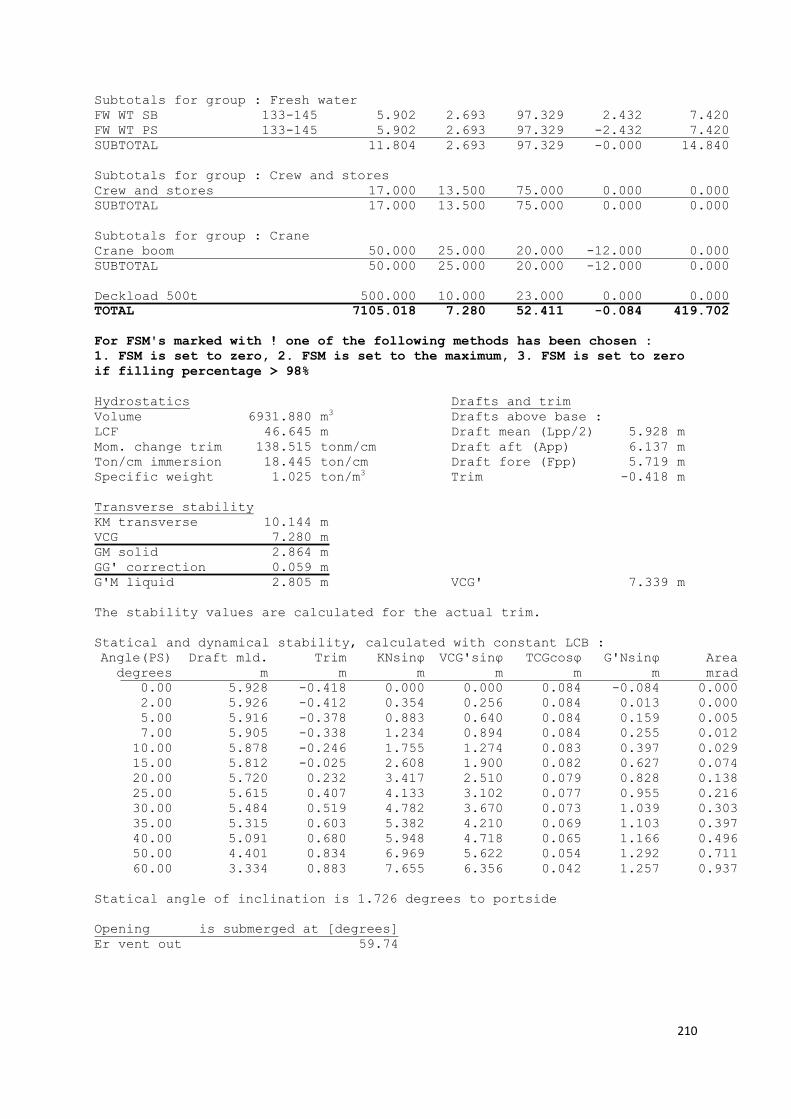
210
Subtotals for group : Fresh water
FW WT SB 133-145 5.902 2.693 97.329 2.432 7.420
FW WT PS 133-145 5.902 2.693 97.329 -2.432 7.420
SUBTOTAL 11.804 2.693 97.329 -0.000 14.840
Subtotals for group : Crew and stores
Crew and stores 17.000 13.500 75.000 0.000 0.000
SUBTOTAL 17.000 13.500 75.000 0.000 0.000
Subtotals for group : Crane
Crane boom 50.000 25.000 20.000 -12.000 0.000
SUBTOTAL 50.000 25.000 20.000 -12.000 0.000
Deckload 500t 500.000 10.000 23.000 0.000 0.000
TOTAL 7105.018 7.280 52.411 -0.084 419.702
For FSM's marked with ! one of the following methods has been chosen :
1. FSM is set to zero, 2. FSM is set to the maximum, 3. FSM is set to zero
if filling percentage > 98%
Hydrostatics Drafts and trim
Volume 6931.880 m3 Drafts above base :
LCF 46.645 m Draft mean (Lpp/2) 5.928 m
Mom. change trim 138.515 tonm/cm Draft aft (App) 6.137 m
Ton/cm immersion 18.445 ton/cm Draft fore (Fpp) 5.719 m
Specific weight 1.025 ton/m3 Trim -0.418 m
Transverse stability
KM transverse 10.144 m
VCG 7.280 m
GM solid 2.864 m
GG' correction 0.059 m
G'M liquid 2.805 m VCG' 7.339 m
The stability values are calculated for the actual trim.
Statical and dynamical stability, calculated with constant LCB :
Angle(PS) Draft mld. Trim KNsinφ VCG'sinφ TCGcosφ G'Nsinφ Area
degrees m m m m m m mrad
0.00 5.928 -0.418 0.000 0.000 0.084 -0.084 0.000
2.00 5.926 -0.412 0.354 0.256 0.084 0.013 0.000
5.00 5.916 -0.378 0.883 0.640 0.084 0.159 0.005
7.00 5.905 -0.338 1.234 0.894 0.084 0.255 0.012
10.00 5.878 -0.246 1.755 1.274 0.083 0.397 0.029
15.00 5.812 -0.025 2.608 1.900 0.082 0.627 0.074
20.00 5.720 0.232 3.417 2.510 0.079 0.828 0.138
25.00 5.615 0.407 4.133 3.102 0.077 0.955 0.216
30.00 5.484 0.519 4.782 3.670 0.073 1.039 0.303
35.00 5.315 0.603 5.382 4.210 0.069 1.103 0.397
40.00 5.091 0.680 5.948 4.718 0.065 1.166 0.496
50.00 4.401 0.834 6.969 5.622 0.054 1.292 0.711
60.00 3.334 0.883 7.655 6.356 0.042 1.257 0.937
Statical angle of inclination is 1.726 degrees to portside
Opening is submerged at [degrees]
Er vent out 59.74

211
Summary
Hydrostatics Criterion Value
Draft mld. 6.600 5.928 m
Trim -0.418 m
Statical angle of inclination 1.73 degrees PS
Flooding angle 59.74 degrees
DNV loss load Criterion Value
DNV Loss of Load (Pt. 5 Ch. 7 Sec 17 D) Area A2> 1,4 A1 1.400 84.485 -
DNV Loss of Load, angle max 15 degrees 15.000 4.689 degrees
VCG'
Actual 7.339 m
Maximum allowable 8.987 m
Loading condition complies with the stated criteria.
Angle of inclination in degrees 1/3.69
0.0 25.0 50.00.0
Righting lever 1/16
0.0
0.5
1.0
0.0

212
XXII Dynamic positioning calculations final design
Section Shape T 2T B Re B/2T Cd dX [m]
x wrt L/2 [m]
dF keel [kN]
M keel [kNm]
1 Ellipse 0.97 1.94 17.65 14242 9.10 0.31 5 -57.5 0.82 -47.37
2 Ellipse 1.35 2.7 18.21 14694 6.74 0.25 5 -52.5 0.91 -47.58
3 Ellipse 2.02 4.04 18.38 14831 4.55 0.33 5 -47.5 23.16 -1100.3
4 Ellipse 2.94 5.88 18.46 14895 3.14 0.42 5 -42.5 19.76 -839.92
5 Ellipse 3.86 7.72 18.5 14928 2.40 0.52 5 -37.5 16.98 -636.89
6 Ellipse 4.61 9.22 18.51 14936 2.01 0.62 5 -32.5 15.26 -496.07
7 Ellipse 5.14 10.3 18.51 14936 1.80 0.70 5 -27.5 9.70 -266.69
8 Ellipse 5.44 10.9 18.5 14928 1.70 0.74 5 -22.5 10.87 -244.48
9 Ellipse 5.6 11.2 18.49 14919 1.65 0.76 5 -17.5 11.52 -201.52
10 Ellipse 5.72 11.4 18.46 14895 1.61 0.78 5 -12.5 12.03 -150.34
11 Ellipse 5.85 11.7 18.35 14807 1.57 0.80 5 -7.5 12.64 -94.83
12 Ellipse 5.92 11.8 18.22 14702 1.54 0.81 5 -2.5 13.03 -32.58
13 Ellipse 5.97 11.9 17.93 14468 1.50 0.83 5 2.5 13.45 33.63
14 Ellipse 5.99 12 17.46 14088 1.46 0.85 5 7.5 13.88 104.10
15 Ellipse 6 12 16.76 13524 1.40 0.89 5 12.5 14.46 180.76
16 Ellipse 6 12 15.77 12725 1.31 0.94 5 17.5 15.27 267.26
17 Ellipse 6 12 14.48 11684 1.21 1.01 5 22.5 16.43 369.71
18 Ellipse 6 12 12.94 10441 1.08 1.10 5 27.5 17.98 494.47
19 Ellipse 6 12 11.26 9086 0.94 1.22 5 32.5 19.90 646.66
20 Ellipse 6 12 9.48 7649 0.79 1.36 5 37.5 22.21 833.04
21 Ellipse 6 12 7.63 6157 0.64 1.53 5 42.5 24.97 1061.30
22 Ellipse 6 12 5.69 4591 0.47 1.74 5 47.5 28.29 1343.84
23 Ellipse 5.99 12 3.57 2881 0.30 1.99 5 52.5 32.41 1701.76
24 Ellipse 2.16 4.32 0.92 742 0.21 2.13 5 57.5 12.50 718.60
SUM 0.94 378.45 3596.59 Table 70, Current forces and moments final design

213
XXIII Technical tender document knuckle boom crane

214

215

216

217

218

219

220

221

222

223