Embed Size (px)
Citation preview

Report 106310
Concept Design of a Crash Management System for
Heavy Goods Vehicles
Forschungsgesellschaft Kraftfahrwesen mbH Aachen
Body Department
Final Report
Concept Design of a Crash Management System for Heavy Goods Vehicles
Project Number
106310
Contractor:
European Aluminium Association AISBL Avenue de Broqueville, 12
1050 Brussels Belgium
Project Leader: Project Engineer:
Dr.-Ing. Markus Bröckerhoff Managing Director fka
Univ.-Prof. Dr.-Ing. Lutz Eckstein Chairman of the Advisory Board
Aachen, June 2011
All rights reserved. No part of this publication may be reproduced and/or published without the previous written consent of fka. fka
Dipl.-Ing. Dipl.-Wirt. Ing. Roland Wohlecker
Dipl.-Ing. Thomas Welfers
Dipl.-Ing. Ralf Matheis
Manager Structural Analysis and Benchmarking
Forschungsgesellschaft Registered in Aachen HRB 2435 Managing Director: IBAN DE 31 3907 0020 0201 339 900 Kraftfahrwesen mbH Aachen Phone +49 241 8861 0 Dr.-Ing. Markus Bröckerhoff SWIFT-Code (BIC) DEUTDEDK 390 Steinbachstr. 7 Fax +49 241 8861 110 Chairman of the Advisory Board: Deutsche Bank Aachen BLZ 390 700 20 52074 Aachen, Germany www.fka.de Univ.-Prof. Dr.-Ing. Lutz Eckstein Account no. 201 339 900
Contents 3
Contents
1 Introduction .................................................................................................................... 4
2 Truck Models ................................................................................................................. 5
2.1 Reference Truck ...................................................................................................... 5
2.2 Advanced Truck Concept ......................................................................................... 6
3 Crash Management System .......................................................................................... 8
3.1 Functional Requirements ......................................................................................... 8
3.2 Concept Design ..................................................................................................... 13
3.3 ECE-R 93 Test ...................................................................................................... 16
3.4 Simulation Load Cases .......................................................................................... 18
3.4.1 Partner Protection .............................................................................................. 18
3.4.2 Self Protection .................................................................................................... 20
3.5 Results of Crash Simulations ................................................................................. 21
3.5.1 Partner Protection .............................................................................................. 22
3.5.2 Self Protection .................................................................................................... 28
3.6 Weight Investigation .............................................................................................. 31
4 Summary ..................................................................................................................... 32
5 Literature ..................................................................................................................... 33
6 Appendix ..................................................................................................................... 36
6.1 Frontal Car to Truck Collision without Offset .......................................................... 36
6.2 Truck to Car Rear Shunt ........................................................................................ 40
1 Introduction 4
1 Introduction
In the EU Directive 96/53/EC, the maximum weight and dimensions of trucks are clearly restricted. Current trucks are designed to carry a maximum of payload or a maximum volume of goods. This results in limited design flexibility regarding safety issues.
A change in the regulation that allows a disconnection of the cabin length from the overall length would encourage designs that can benefit road safety. These potentials are analysed in the study “APROSYS” [APR09]. The developed truck design serves as a basis for this study and will be transferred to a 40 t truck. The focus of this study is to build up a crash management system concept that utilises the additional design space in the front of the new designed truck for optimising the energy absorption behaviour.
For this purpose the reference truck as well as the advanced truck concept will be presented in the first step. Following this, functional requirements for the crash management system will be analysed. Legal requirements will be investigated and target values for crash worthiness will be defined. On this basis, a CAD model of the crash management system concept will be built up and integrated into the tractor CAD model used in the previous project. The completed design concept will be meshed with shell elements for the further simulations.
The load cases that are used for the FE simulations were defined in the previous study based on HGV accident statistics. For the optimization of design parameters (e.g. geometric parameters and wall thicknesses), the two load cases “frontal car to truck with offset” and “frontal car to truck without offset” will be considered. The identified parameters will be applied in the finalised concept design. The performance of this concept will be simulated with in total four crash load cases. The load cases “truck to car rear shunt” and “truck to truck rear shunt” will be set up in addition to the existing load cases “frontal car to truck with offset” and “frontal car to truck without offset”. The results will be analysed, assessed and compared with the reference used for the concept.
2 Truck Models 5
2 Truck Models
The CAD truck model built up on the basis of the previous study “APROSYS” is introduced in this chapter. First the reference truck is presented followed by the advanced concept.
2.1 Reference Truck
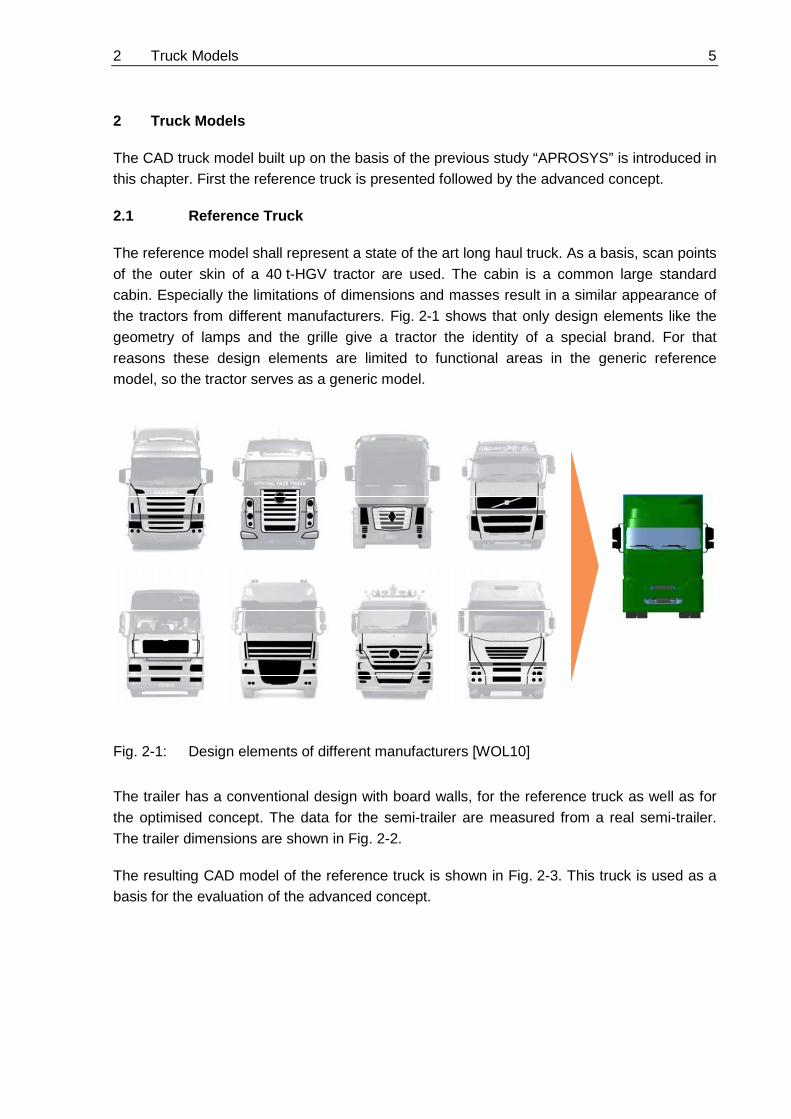
The reference model shall represent a state of the art long haul truck. As a basis, scan points of the outer skin of a 40 t-HGV tractor are used. The cabin is a common large standard cabin. Especially the limitations of dimensions and masses result in a similar appearance of the tractors from different manufacturers. Fig. 2-1 shows that only design elements like the geometry of lamps and the grille give a tractor the identity of a special brand. For that reasons these design elements are limited to functional areas in the generic reference model, so the tractor serves as a generic model.
Fig. 2-1: Design elements of different manufacturers [WOL10]
The trailer has a conventional design with board walls, for the reference truck as well as for the optimised concept. The data for the semi-trailer are measured from a real semi-trailer. The trailer dimensions are shown in Fig. 2-2.
The resulting CAD model of the reference truck is shown in Fig. 2-3. This truck is used as a basis for the evaluation of the advanced concept.

2 Truck Models 6
Fig. 2-2: Dimensions of a standard semi-trailer [SCB10]
Fig. 2-3: Reference truck
2.2 Advanced Truck Concept
The advanced truck concept is shown in Fig. 2-4. It is based on the design elaborated in the “APROSYS” study. This design provides advantages regarding accidents with vulnerable road users (VRU). It has a deflective effect and can reduce the risk of overrunning VRUs in case of a frontal accident [APR09]. These aspects are not further investigated in this study.

2 Truck Models 7
Fig. 2-4: Advanced concept
To assure feasibility, legal requirements are also considered in the design of the advanced concept (e.g. 97/27/EC manoeuvrability, 92/144/EEC lateral projections, ECE-R 12 pen-dulum test, ECE-R 73 lateral protection device). The bottom view shown in Fig. 2-5 reveals the additional design space affected by the length extension of the truck front.
Fig. 2-5: Additional design space
Rounded front shape
960 mm
3 Crash Management System 8
3 Crash Management System
The additional design space in the front area provided by the advanced concept can be used to achieve an improvement of the safety concept by adding an additional crash management system. The build up of the crash management system is described in this chapter.
3.1 Functional Requirements
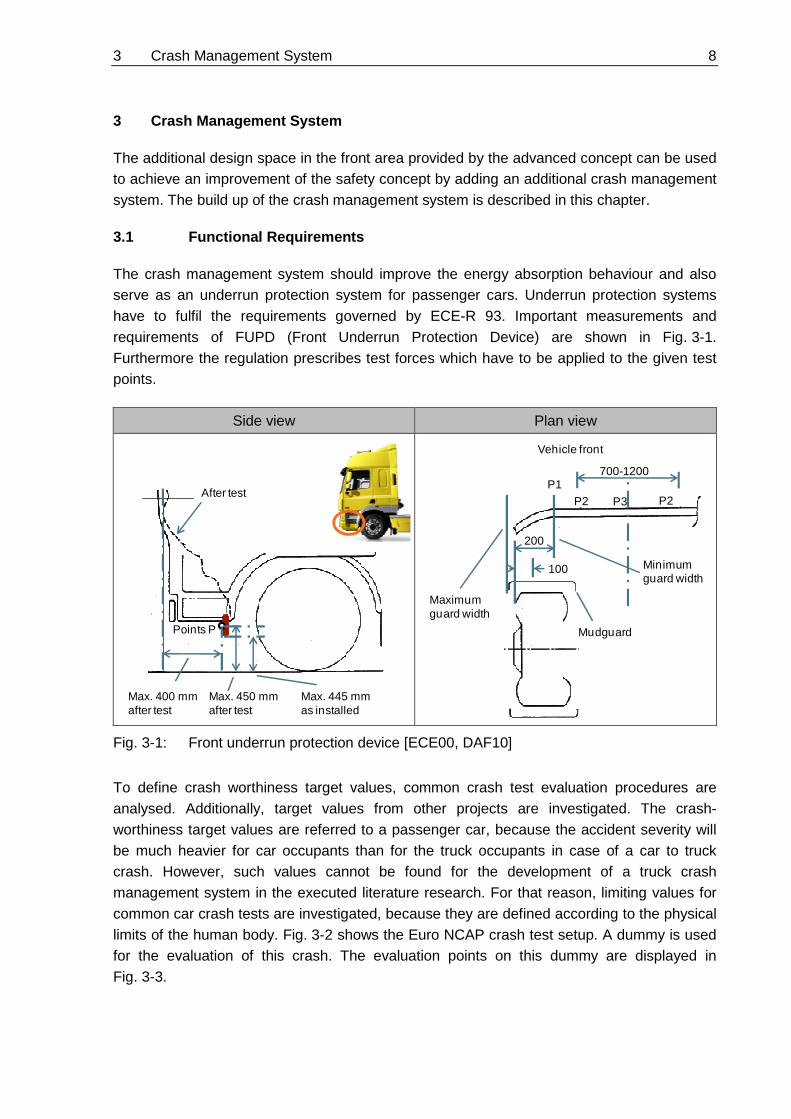
The crash management system should improve the energy absorption behaviour and also serve as an underrun protection system for passenger cars. Underrun protection systems have to fulfil the requirements governed by ECE-R 93. Important measurements and requirements of FUPD (Front Underrun Protection Device) are shown in Fig. 3-1. Furthermore the regulation prescribes test forces which have to be applied to the given test points.
Side view Plan view
Fig. 3-1: Front underrun protection device [ECE00, DAF10]
To define crash worthiness target values, common crash test evaluation procedures are analysed. Additionally, target values from other projects are investigated. The crash-worthiness target values are referred to a passenger car, because the accident severity will be much heavier for car occupants than for the truck occupants in case of a car to truck crash. However, such values cannot be found for the development of a truck crash management system in the executed literature research. For that reason, limiting values for common car crash tests are investigated, because they are defined according to the physical limits of the human body. Fig. 3-2 shows the Euro NCAP crash test setup. A dummy is used for the evaluation of this crash. The evaluation points on this dummy are displayed in Fig. 3-3.
After test
Points P
Max. 450 mm after test
Max. 445 mm as installed
Max. 400 mm after test
P1P2 P3 P2
200
Mudguard
100
Vehicle front
Maximum guard width
Minimum guard width
700-1200

3 Crash Management System 9
Fig. 3-2: Setup of Euro NCAP crash test [CAR11]
Fig. 3-3: Evaluation points on a dummy [CAR11]
The recorded values on the dummy also depend on restraining system like seat belts and airbags. These influences should be investigated separately in connection with the development of car safety systems and are not considered for the design of a truck crash management system. Hence the limiting values from Euro NCAP cannot be used and so, the car related values are required.
Such car related values are used in the ULSAB Project. They are listed in Fig. 3-4. Only intrusions and displacements are considered in these values. For a complete evaluation of the accident severity, the occurring accelerations also need to be considered.
40 % overlap = 40 % of the width of the widest part of the car (not including wing mirrors)
540 mm
64 km/h
1000
mm
Head: acceleration and HIC
Thorax: depression
Upper leg: forces
Knee: displacement
Neck: forces
Lower leg: forces
Foot: displacement (brake pedal)
(Head Impact Criterion)

3 Crash Management System 10
Fig. 3-4: Crashworthiness targets of ULSAB [ULS98]
The target values for intrusion are also used in the SLC project. Furthermore, maximum accelerations are also considered. For this reason, accelerations are recorded at the lower end of both B-pillars and at the middle tunnel. The decisive value is the average of these accelerations. Fig. 3-5 shows the SLC target values. Adverse in the present case is that the simulation model and the evaluation of the simulation respectively have a high degree of complexity. To reduce this complexity, the intrusions into the car’s firewall and the accelerations at the rear seat only are used for the evaluation of the simulation results.
A Euro NCAP crash is also simulated in this project as shown in Fig. 3-6. The according intrusions and accelerations can be seen in Fig. 3-7 and Fig. 3-8 respectively. Fig. 3-9 shows the energy absorption behaviour. The values are not suitable as a basis for comparison with a car to truck crash, because the energy absorption behaviour is different due to the differences in the crash scenario. However, at least the crash performance of the used car model can be evaluated this way.
The car model used for the simulations is a public model of a Ford Taurus, model year 2001 [NAC10]. The results show that the crash performance of this car cannot be compared to the performance of today’s vehicles, but since a comparison between two different design stages of an accident partner (in this case the truck) is required in this study, it is sufficient to use this public model.
Crash Event Crashworthiness Targets
Crash Event Crashworthiness Targets
Overall dynamic deformation ≤ 650 mm
Steering column displacement ≤ 80 mm in X-direction
US NCAP Front Impact
Euro NCAP A-pillar displacement < 650 mm
Footwell intrusion < 80 mm
Steering column displacement ≤ 80 mm in X-direction

3 Crash Management System 11
Fig. 3-5: Target values defined in SLC development [BER09]
Fig. 3-6: Euro NCAP offset crash simulation
Peak Intrusion Depth (mm)
POINT TARGET SLC
Footwell � < 100 53
Footwell � < 100 51
Footwell � < 100 42
Wheelhouse � < 100 43
Footrest � < 100 35
Shaft hole � < 100 49
A-plr ave < 20 19
Shocktower < 100 84
Steering < 100 16
Door gap --- 20
Pulse amax ≤ 55 g 56 g
Seat torsion < 80 40 1 2 3
4
5
6
ReferenceSLC

3 Crash Management System 12
Fig. 3-7: Intrusions into the car’s firewall after the Euro NCAP offset crash
Fig. 3-8: Acceleration at the car’s rear seats during the Euro NCAP offset crash
200150100500
Intrusion[mm]
Max = 370 mm
0 20 40 60 80 100 120 140 160Time [ms]
Acc
eler
atio
n [g
]
200
150
100
50
0
Rear seat right side
Rear seat left side
125
75
25
175

3 Crash Management System 13
Fig. 3-9: Energy absorption behaviour in Euro NCAP offset crash
3.2 Concept Design
Compared to mild steel, extrusion-based aluminium bumper systems offer approximately 45-50 % weight saving with similar or better crash performance [WEL06]. But aluminium crash management systems also compare very well with crash management systems made using modern high strength steel grades because of the significantly higher specific energy absorption capacity of aluminium alloys specifically developed for optimum crash performance.
For this reason, aluminium is widely used for crash structures in passenger cars. The application of extruded crash bumpers with crash boxes is a common way to realise such systems. Fig. 3-10 shows an example. These systems are characterised by their high effectiveness and low complexity.
Fig. 3-10: Extruded bumper beam with crash boxes [GIL04]
To further increase the effectiveness of crash management systems honeycomb structures as shown in Fig. 3-11 can be used. The energy absorption potential of these structures is higher than that of simple extrusion profiles. The disadvantages regarding the manufacturing and joining complexity, however, avoid a higher market penetration of this technology.
Total amountof absorbedenergy
Energyabsorbedby car
Energyabsorbedby barrier
Time [ms]
Ene
rgy
[kJ]
200
120
80
40
0 0 20 40 60 80 100 120 140 160
160
3 Crash Management System 14
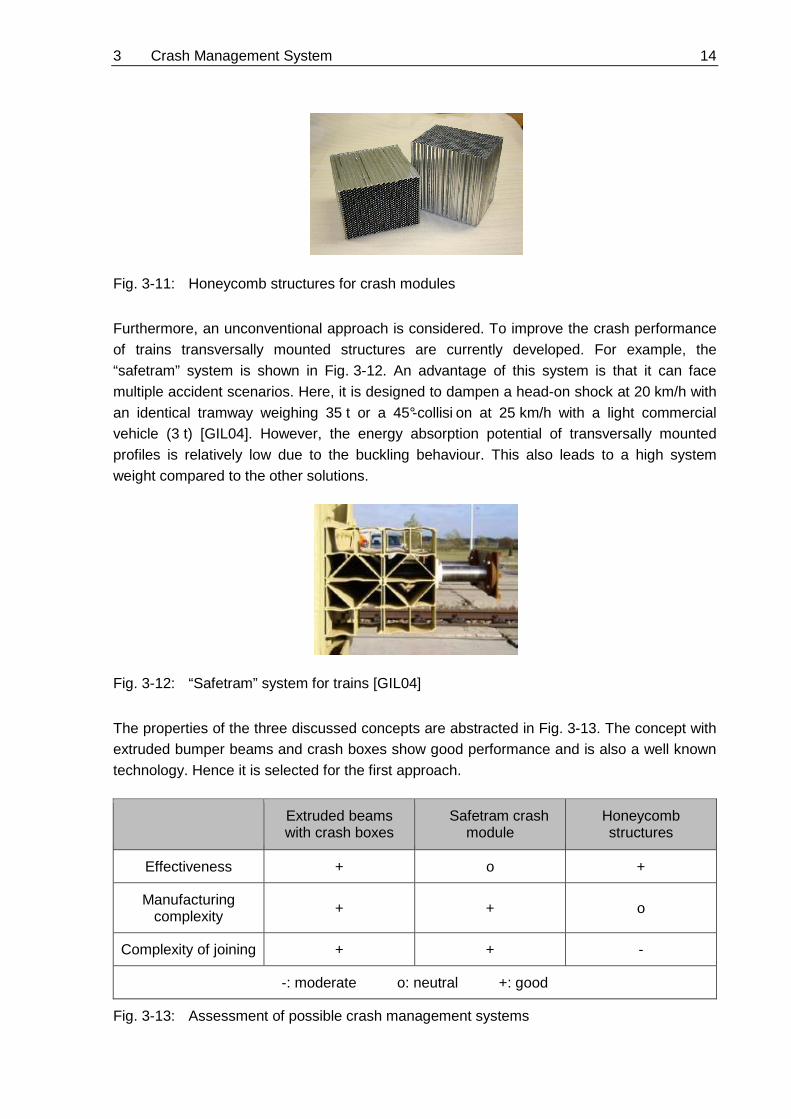
Fig. 3-11: Honeycomb structures for crash modules
Furthermore, an unconventional approach is considered. To improve the crash performance of trains transversally mounted structures are currently developed. For example, the “safetram” system is shown in Fig. 3-12. An advantage of this system is that it can face multiple accident scenarios. Here, it is designed to dampen a head-on shock at 20 km/h with an identical tramway weighing 35 t or a 45°-collisi on at 25 km/h with a light commercial vehicle (3 t) [GIL04]. However, the energy absorption potential of transversally mounted profiles is relatively low due to the buckling behaviour. This also leads to a high system weight compared to the other solutions.
Fig. 3-12: “Safetram” system for trains [GIL04]
The properties of the three discussed concepts are abstracted in Fig. 3-13. The concept with extruded bumper beams and crash boxes show good performance and is also a well known technology. Hence it is selected for the first approach.
Extruded beams with crash boxes
Safetram crash module
Honeycomb structures
Effectiveness + o +
Manufacturing complexity + + o
Complexity of joining + + -
-: moderate o: neutral +: good
Fig. 3-13: Assessment of possible crash management systems
3 Crash Management System 15
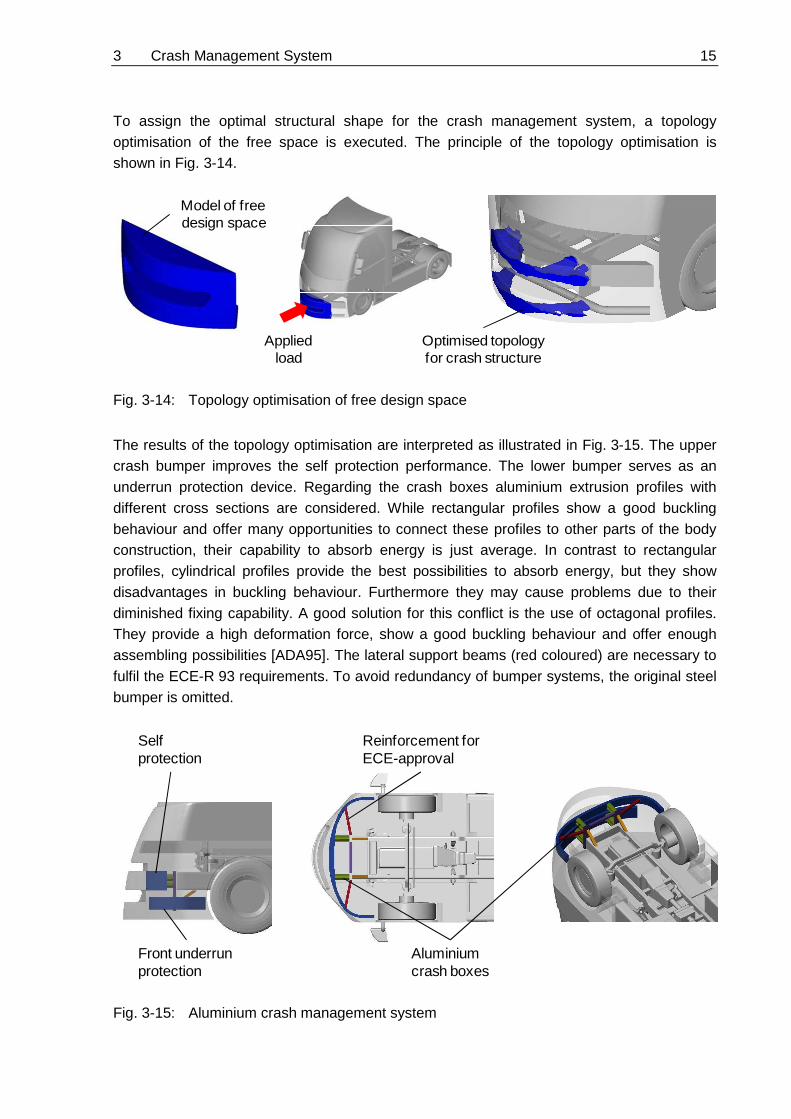
To assign the optimal structural shape for the crash management system, a topology optimisation of the free space is executed. The principle of the topology optimisation is shown in Fig. 3-14.
Fig. 3-14: Topology optimisation of free design space
The results of the topology optimisation are interpreted as illustrated in Fig. 3-15. The upper crash bumper improves the self protection performance. The lower bumper serves as an underrun protection device. Regarding the crash boxes aluminium extrusion profiles with different cross sections are considered. While rectangular profiles show a good buckling behaviour and offer many opportunities to connect these profiles to other parts of the body construction, their capability to absorb energy is just average. In contrast to rectangular profiles, cylindrical profiles provide the best possibilities to absorb energy, but they show disadvantages in buckling behaviour. Furthermore they may cause problems due to their diminished fixing capability. A good solution for this conflict is the use of octagonal profiles. They provide a high deformation force, show a good buckling behaviour and offer enough assembling possibilities [ADA95]. The lateral support beams (red coloured) are necessary to fulfil the ECE-R 93 requirements. To avoid redundancy of bumper systems, the original steel bumper is omitted.
Fig. 3-15: Aluminium crash management system
Model of free design space
Optimised topologyfor crash structure
Appliedload
Selfprotection
Front underrunprotection
Aluminiumcrash boxes
Reinforcement forECE-approval

3 Crash Management System 16
A detailed view of the crash management system with its dimensions is shown in Fig. 3-16. To achieve a maximum of energy absorption the crash box shall buckle instead of bend. The buckling process is initialised by the initialisation crimps. The wall thickness of the lower octagon profiles is 2.2 mm. This thickness is defined in a parameter optimisation for the car to truck crash. This way it is ensured that the full length of the crashboxes is used for energy absorption at the lowest possible acceleration level in the car. The upper crashboxes have a wall thickness of 3 mm, because they must be designed in a more robust way to meet the self protection requirements. Also the bumpers have a wall thickness of 3 mm to provide a high level of bending stiffness, which enables good distribution of the crash loads on both attached crashboxes. The feasibility of the bending radius of the lower bumper is verified by an estimation according to [OST07].
Fig. 3-16: Detailed view of the crash management system
3.3 ECE-R 93 Test
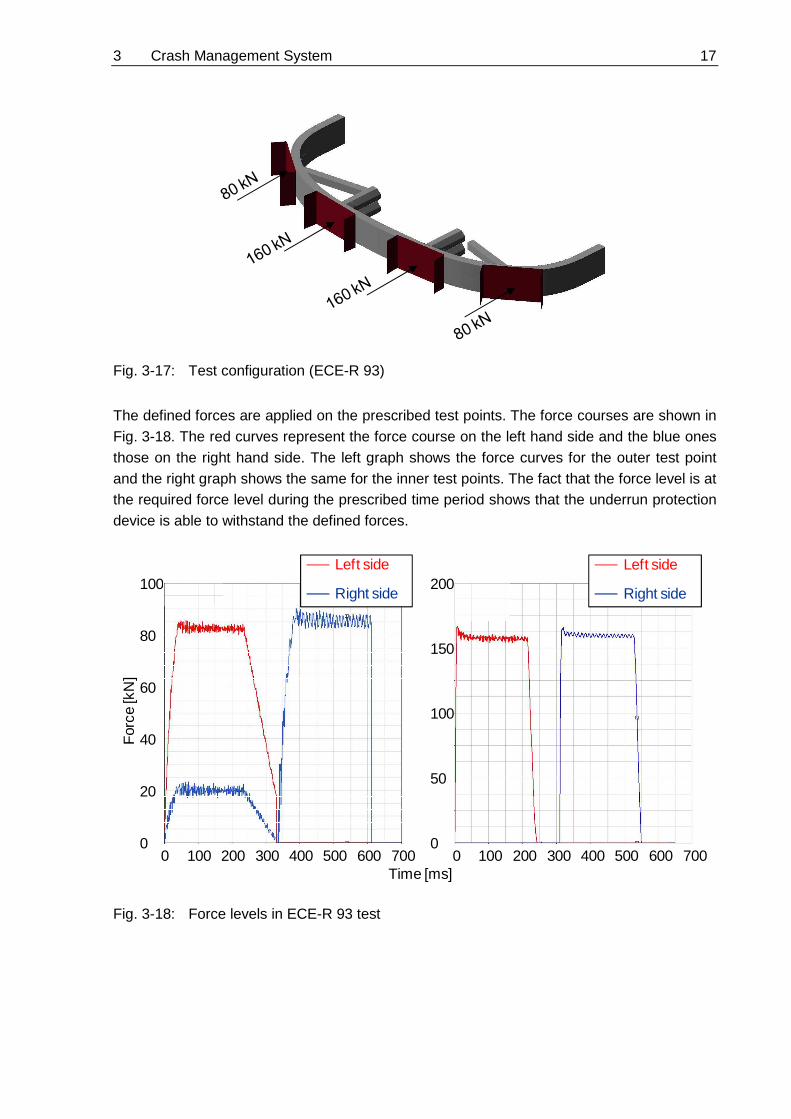
To check the requirements governed by ECE-R 93 the simulation model shown in Fig. 3-17 is built up.
190
mm
280
mm
200
mm
120 mm
Initialisation crimps
3 Crash Management System 17
Fig. 3-17: Test configuration (ECE-R 93)
The defined forces are applied on the prescribed test points. The force courses are shown in Fig. 3-18. The red curves represent the force course on the left hand side and the blue ones those on the right hand side. The left graph shows the force curves for the outer test point and the right graph shows the same for the inner test points. The fact that the force level is at the required force level during the prescribed time period shows that the underrun protection device is able to withstand the defined forces.
Fig. 3-18: Force levels in ECE-R 93 test
Time [ms]
For
ce [k
N]
100
80
60
40
0
20
700100 200 3000 600400 500 700100 200 3000 600400 500
150
100
0
50
200Right side
Left side
Right side
Left side
3 Crash Management System 18
3.4 Simulation Load Cases
The simulation load cases are described in this subchapter. There are three setups for the evaluation of the partner protection performance (car occupant protection) and one for the evaluation of the self protection performance. All load case definitions are based on statistical findings from the previous study. Wherever possible, real crash test setups are also compared with the simulations setups.
3.4.1 Partner Protection
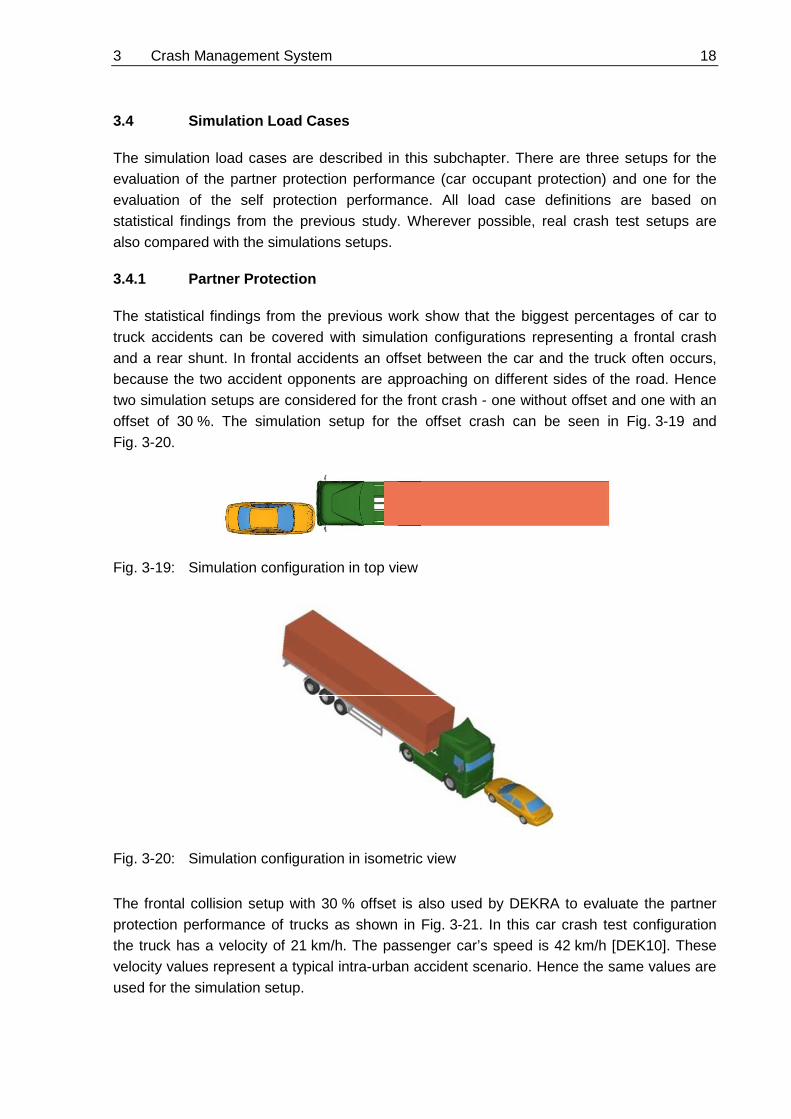
The statistical findings from the previous work show that the biggest percentages of car to truck accidents can be covered with simulation configurations representing a frontal crash and a rear shunt. In frontal accidents an offset between the car and the truck often occurs, because the two accident opponents are approaching on different sides of the road. Hence two simulation setups are considered for the front crash - one without offset and one with an offset of 30 %. The simulation setup for the offset crash can be seen in Fig. 3-19 and Fig. 3-20.
Fig. 3-19: Simulation configuration in top view
Fig. 3-20: Simulation configuration in isometric view
The frontal collision setup with 30 % offset is also used by DEKRA to evaluate the partner protection performance of trucks as shown in Fig. 3-21. In this car crash test configuration the truck has a velocity of 21 km/h. The passenger car’s speed is 42 km/h [DEK10]. These velocity values represent a typical intra-urban accident scenario. Hence the same values are used for the simulation setup.

3 Crash Management System 19
Crash configuration Truck after crash Car after crash
Fig. 3-21: DEKRA truck against car crash test [DEK10]
Crash tests with a similar configuration are also executed by truck manufacturers. Volvo, for example completes a crash test illustrated in Fig. 3-22 to develop the Front Underride Protection System (FUPS). The truck has a velocity of 65 km/h and hits the car with 50 % offset. The target of this crash test is to identify the crash performance of the tractor using a FUPS [VOL10c].
Crash configuration Crash test Truck after crash
Fig. 3-22: Volvo truck against car crash test [SCH06]
In addition this crash test is completed with different velocities of the car (56 km/h, 64 km/h and 75 km/h) and with different kinds of cars (super mini and small family). This way it is possible to design the FUPS for different crash severities [VOL10c]. Further information about the FUPS can be found in [UTA05].
Fig. 3-23: Results of Volvo crash test [VOL10c]
Impa
ct fo
rce
Volvo FUPSmaximum force
Large car
Medium car
Small car
Time
Volvo FUPS trigging force
3 Crash Management System 20
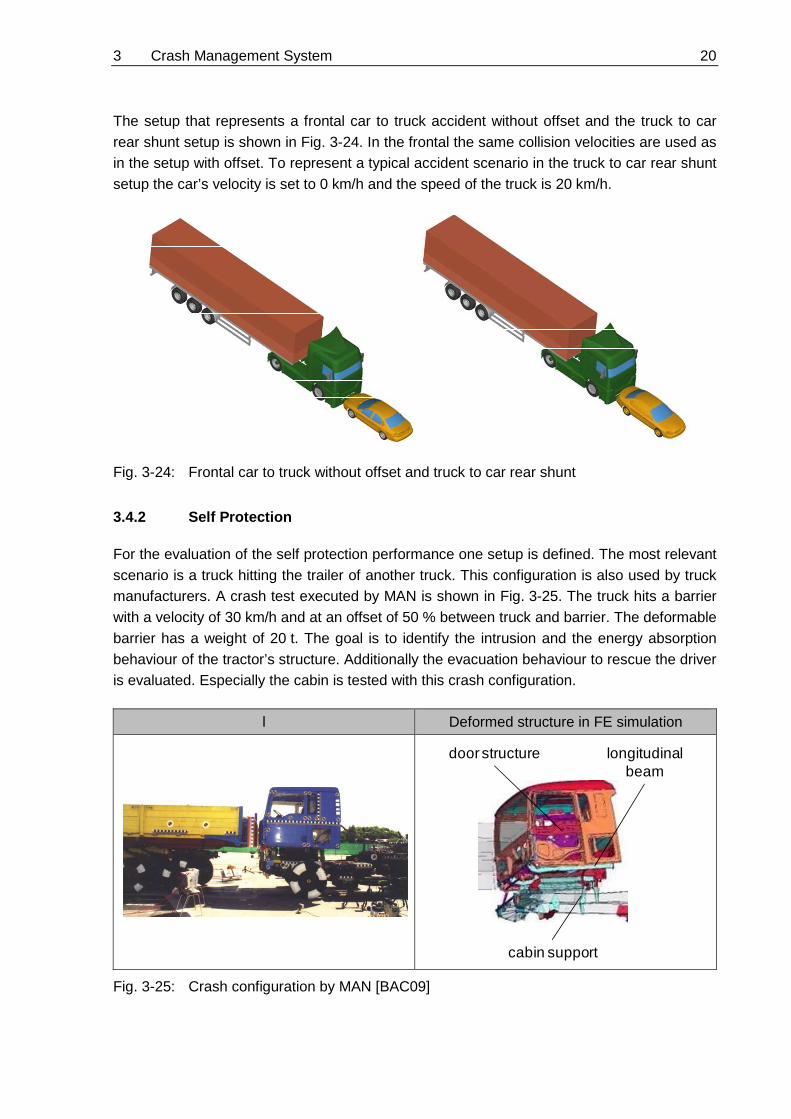
The setup that represents a frontal car to truck accident without offset and the truck to car rear shunt setup is shown in Fig. 3-24. In the frontal the same collision velocities are used as in the setup with offset. To represent a typical accident scenario in the truck to car rear shunt setup the car’s velocity is set to 0 km/h and the speed of the truck is 20 km/h.
Fig. 3-24: Frontal car to truck without offset and truck to car rear shunt
3.4.2 Self Protection
For the evaluation of the self protection performance one setup is defined. The most relevant scenario is a truck hitting the trailer of another truck. This configuration is also used by truck manufacturers. A crash test executed by MAN is shown in Fig. 3-25. The truck hits a barrier with a velocity of 30 km/h and at an offset of 50 % between truck and barrier. The deformable barrier has a weight of 20 t. The goal is to identify the intrusion and the energy absorption behaviour of the tractor’s structure. Additionally the evacuation behaviour to rescue the driver is evaluated. Especially the cabin is tested with this crash configuration.
l Deformed structure in FE simulation
Fig. 3-25: Crash configuration by MAN [BAC09]
longitudinalbeam
door structure
cabin support
3 Crash Management System 21
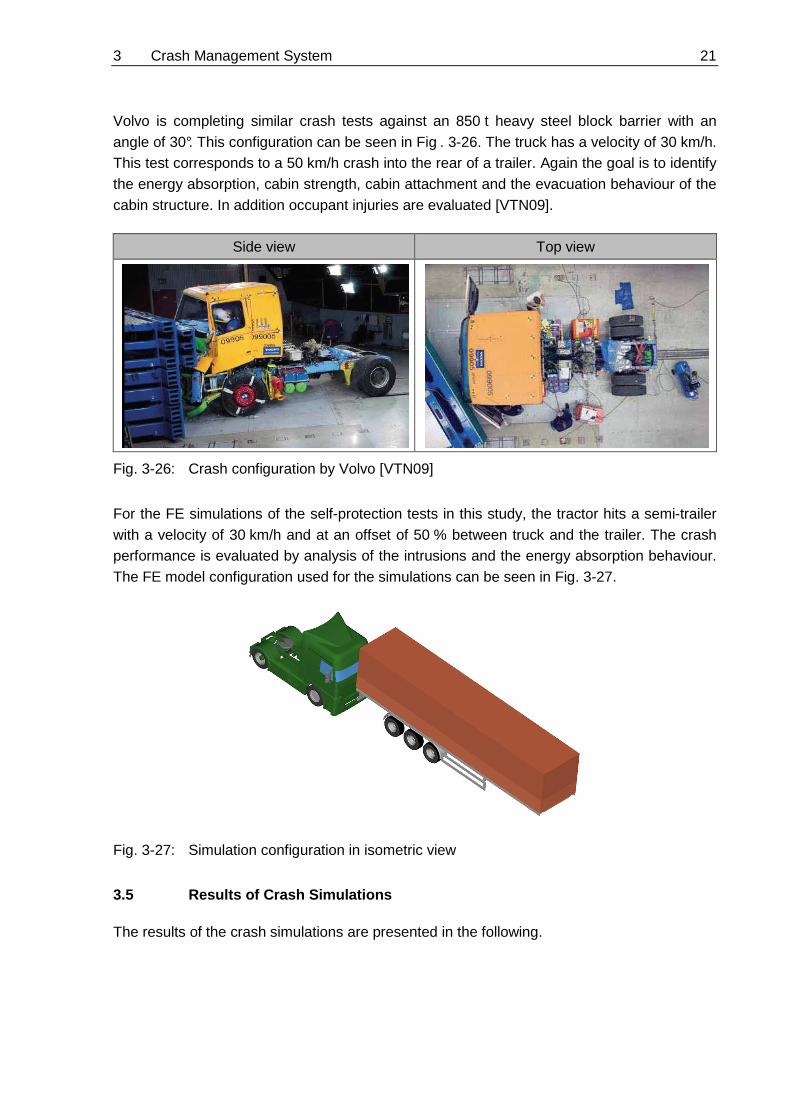
Volvo is completing similar crash tests against an 850 t heavy steel block barrier with an angle of 30°. This configuration can be seen in Fig . 3-26. The truck has a velocity of 30 km/h. This test corresponds to a 50 km/h crash into the rear of a trailer. Again the goal is to identify the energy absorption, cabin strength, cabin attachment and the evacuation behaviour of the cabin structure. In addition occupant injuries are evaluated [VTN09].
Side view Top view
Fig. 3-26: Crash configuration by Volvo [VTN09]
For the FE simulations of the self-protection tests in this study, the tractor hits a semi-trailer with a velocity of 30 km/h and at an offset of 50 % between truck and the trailer. The crash performance is evaluated by analysis of the intrusions and the energy absorption behaviour. The FE model configuration used for the simulations can be seen in Fig. 3-27.
Fig. 3-27: Simulation configuration in isometric view
3.5 Results of Crash Simulations
The results of the crash simulations are presented in the following.
3 Crash Management System 22
3.5.1 Partner Protection
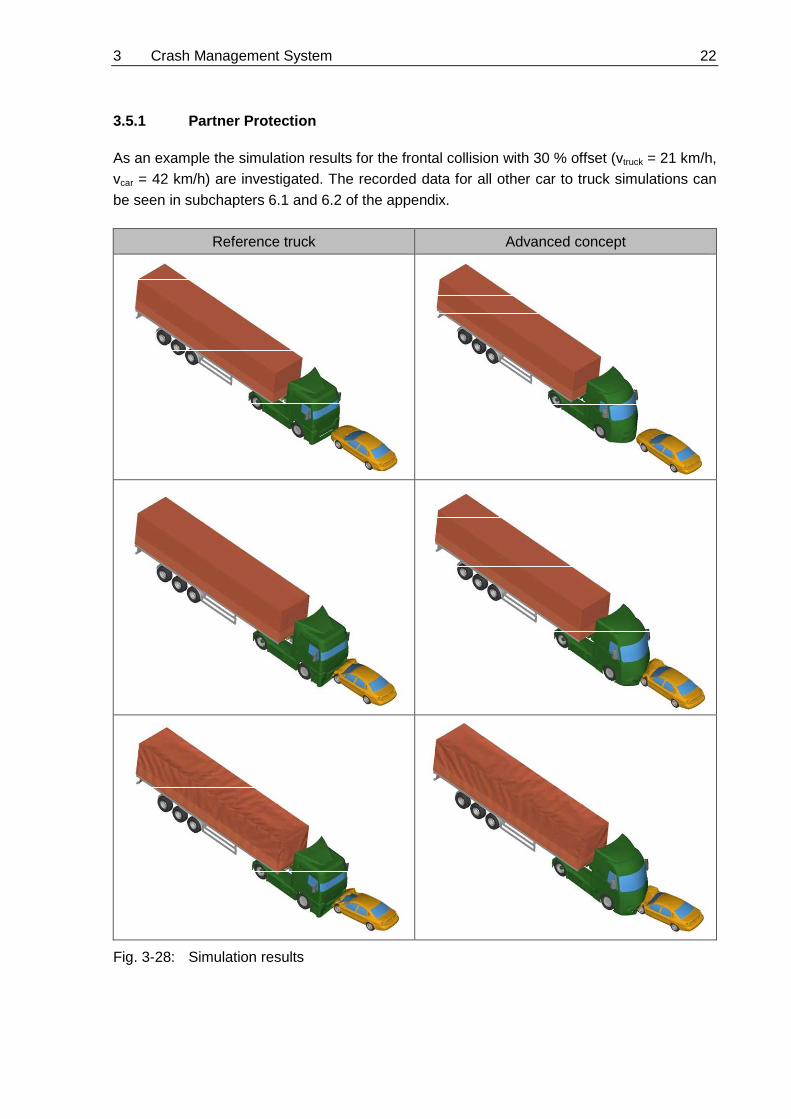
As an example the simulation results for the frontal collision with 30 % offset (vtruck = 21 km/h, vcar = 42 km/h) are investigated. The recorded data for all other car to truck simulations can be seen in subchapters 6.1 and 6.2 of the appendix.
Reference truck Advanced concept
Fig. 3-28: Simulation results

3 Crash Management System 23
The comparison of the simulation results of the reference truck and the advanced concept are shown in Fig. 3-28. The evaluation of the intrusions and the occurring accelerations show differences in the crash behaviour. These data are illustrated in Fig. 3-29, Fig. 3-30 and Fig. 3-31.
Fig. 3-29: Intrusions into the car’s firewall after the crash
The maximum intrusion into the car’s firewall after the crash with the reference truck is 186.1 mm. After the crash with the advanced concept the peak value is 174.4 mm. Furthermore the advanced concept shows reduced intrusion values in the steering wheel area. This area is critical, because intrusions here are likely to cause contact between the occupant parts of the car which increases the risk of injuries.
Fig. 3-30: Acceleration at the car’s rear seats during crash with reference truck
Max = 186.1 mm Max = 174.4 mm
Reference truck Advanced concept
1801401006020
Intrusion[mm]
0
Time [ms]
Acc
eler
atio
n [g
]
100
80
60
40
20
0
Rear seat right side
Rear seat left side
0 20 40 60 80 100 120 140 160

3 Crash Management System 24
Fig. 3-31: Acceleration at the car’s rear seats during crash with the advanced concept
Analysing the accelerations it becomes conspicuous that the application of the crash management system leads to a reduced peak value below 70 g (compared to 85 g for the reference truck). In conclusion, the partner protection performance is enhanced.
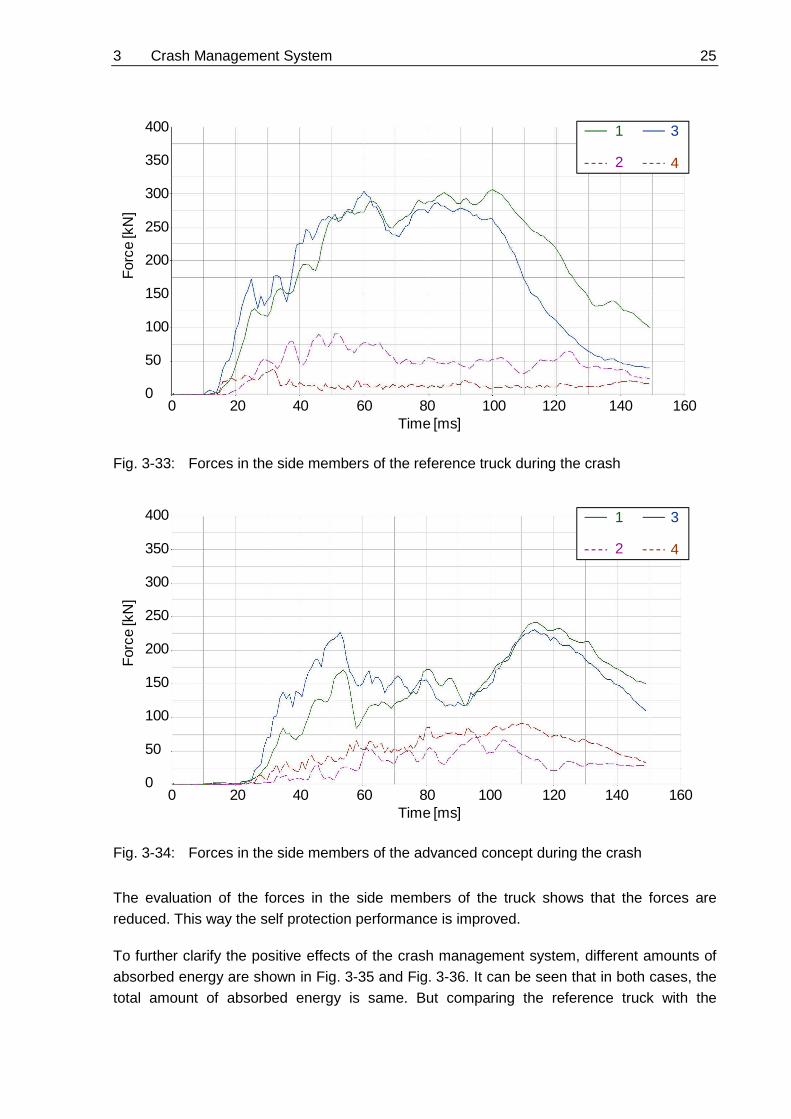
To evaluate the trucks behaviour during the crash the forces inside the side members are investigated. Fig. 3-32 shows the evaluation points for the recording of the occurring forces. The results are shown in Fig. 3-33 and Fig. 3-34.
Fig. 3-32: Evaluation points for occurring forces
0 20 40 60 80 100 120 140 160Time [ms]
Acc
eler
atio
n [g
]100
80
60
40
20
0
Rear seat right side
Rear seat left side
3: Right side member front
1: Left side member front
4: Right side member rear
2: Left side member rear
3 Crash Management System 25
Fig. 3-33: Forces in the side members of the reference truck during the crash
Fig. 3-34: Forces in the side members of the advanced concept during the crash
The evaluation of the forces in the side members of the truck shows that the forces are reduced. This way the self protection performance is improved.
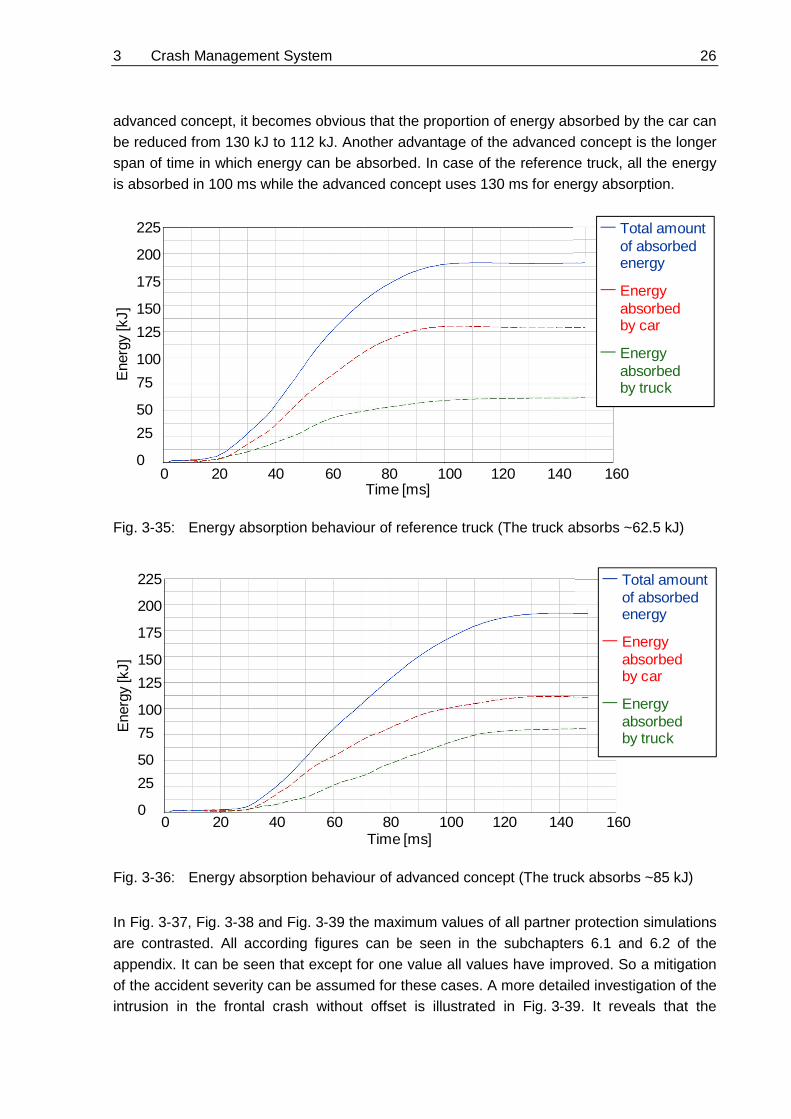
To further clarify the positive effects of the crash management system, different amounts of absorbed energy are shown in Fig. 3-35 and Fig. 3-36. It can be seen that in both cases, the total amount of absorbed energy is same. But comparing the reference truck with the
Time [ms]
For
ce [k
N]
300
200
250
150
100
50
0
350
400
0 20 40 60 80 100 120 140 160
3
4
1
2
Time [ms]
For
ce [k
N]
300
200
250
150
100
50
0
350
400
0 20 40 60 80 100 120 140 160
3
4
1
2
3 Crash Management System 26
advanced concept, it becomes obvious that the proportion of energy absorbed by the car can be reduced from 130 kJ to 112 kJ. Another advantage of the advanced concept is the longer span of time in which energy can be absorbed. In case of the reference truck, all the energy is absorbed in 100 ms while the advanced concept uses 130 ms for energy absorption.
Fig. 3-35: Energy absorption behaviour of reference truck (The truck absorbs ~62.5 kJ)
Fig. 3-36: Energy absorption behaviour of advanced concept (The truck absorbs ~85 kJ)
In Fig. 3-37, Fig. 3-38 and Fig. 3-39 the maximum values of all partner protection simulations are contrasted. All according figures can be seen in the subchapters 6.1 and 6.2 of the appendix. It can be seen that except for one value all values have improved. So a mitigation of the accident severity can be assumed for these cases. A more detailed investigation of the intrusion in the frontal crash without offset is illustrated in Fig. 3-39. It reveals that the
0 20 40 60 80 100 120 140 160Time [ms]
Ene
rgy
[kJ]
200
150
100
50
0
25
75
125
175
225 Total amountof absorbedenergy
Energyabsorbedby car
Energyabsorbedby truck
0 20 40 60 80 100 120 140 160Time [ms]
Ene
rgy
[kJ]
200
150
100
50
0
25
75
125
175
225 Total amountof absorbedenergy
Energyabsorbedby car
Energyabsorbedby truck

3 Crash Management System 27
maximum value of intrusion only occurs in a small area on the upper right side. The intrusions in the critical steering wheel area and the rest of the firewall, however, are reduced.
Frontal crash with offset Reference truck Advanced concept
max. intrusions into the car’s firewall [mm] 186.1 174.4
max. acceleration at the rear seat of the car [g] 85 70
max. force in side members of the truck [kN] 305 240
Fig. 3-37: Comparison of maximum values for frontal crash with 30 % offset
Frontal crash without offset Reference truck Advanced concept
max. intrusions into the car’s firewall [mm] 175.9 187.3
max. acceleration at the rear seat of the car [g] 250 112.5
max. force in side members of the truck [kN] 427 235
Fig. 3-38: Comparison of maximum values for frontal crash without offset
Fig. 3-39: Intrusions into the car’s firewall after frontal crash without offset
Rear shunt Reference truck Advanced concept
max. intrusions into the car’s rear floor panel [mm] -80.2 -34.8
max. acceleration at the rear seat of the car [g] 170 59
max. force in side members of the truck [kN] 90 74
Fig. 3-40: Comparison of maximum values for truck to car rear shunt
Max = 175.9 mm Max = 187.3 mm
Reference truck Advanced concept
1801401006020
Intrusion[mm]
0
3 Crash Management System 28
3.5.2 Self Protection
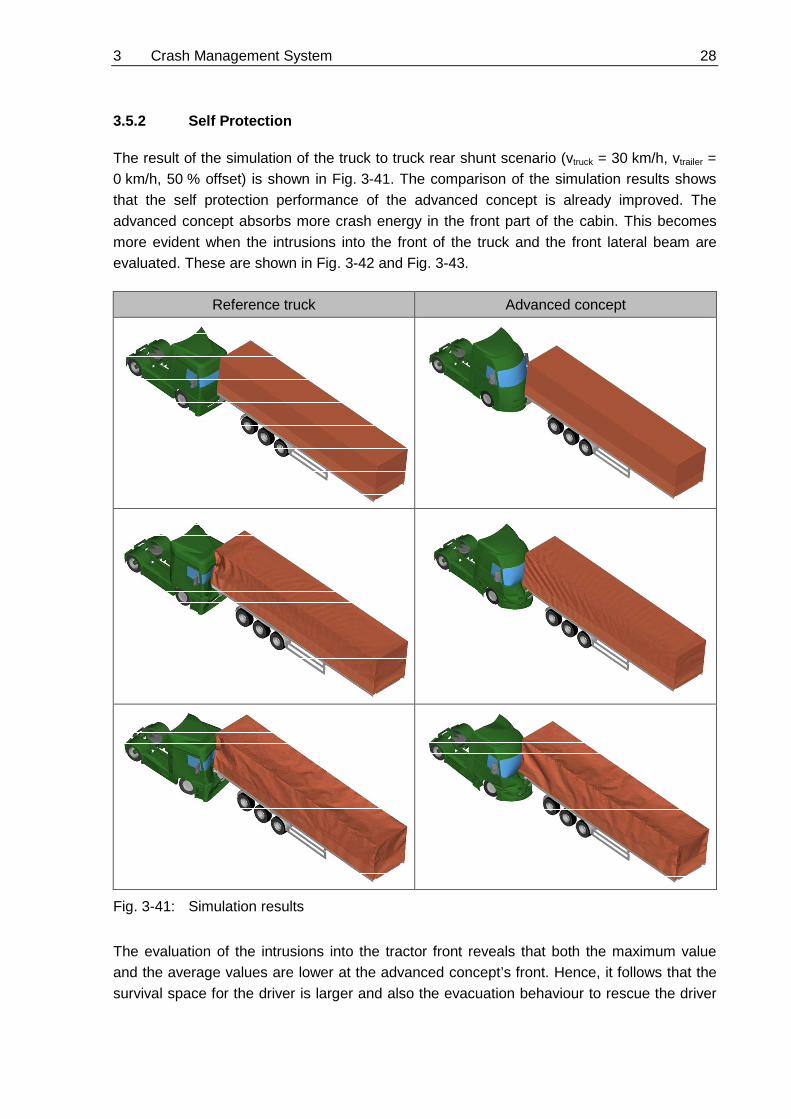
The result of the simulation of the truck to truck rear shunt scenario (vtruck = 30 km/h, vtrailer = 0 km/h, 50 % offset) is shown in Fig. 3-41. The comparison of the simulation results shows that the self protection performance of the advanced concept is already improved. The advanced concept absorbs more crash energy in the front part of the cabin. This becomes more evident when the intrusions into the front of the truck and the front lateral beam are evaluated. These are shown in Fig. 3-42 and Fig. 3-43.
Reference truck Advanced concept
Fig. 3-41: Simulation results
The evaluation of the intrusions into the tractor front reveals that both the maximum value and the average values are lower at the advanced concept’s front. Hence, it follows that the survival space for the driver is larger and also the evacuation behaviour to rescue the driver
3 Crash Management System 29
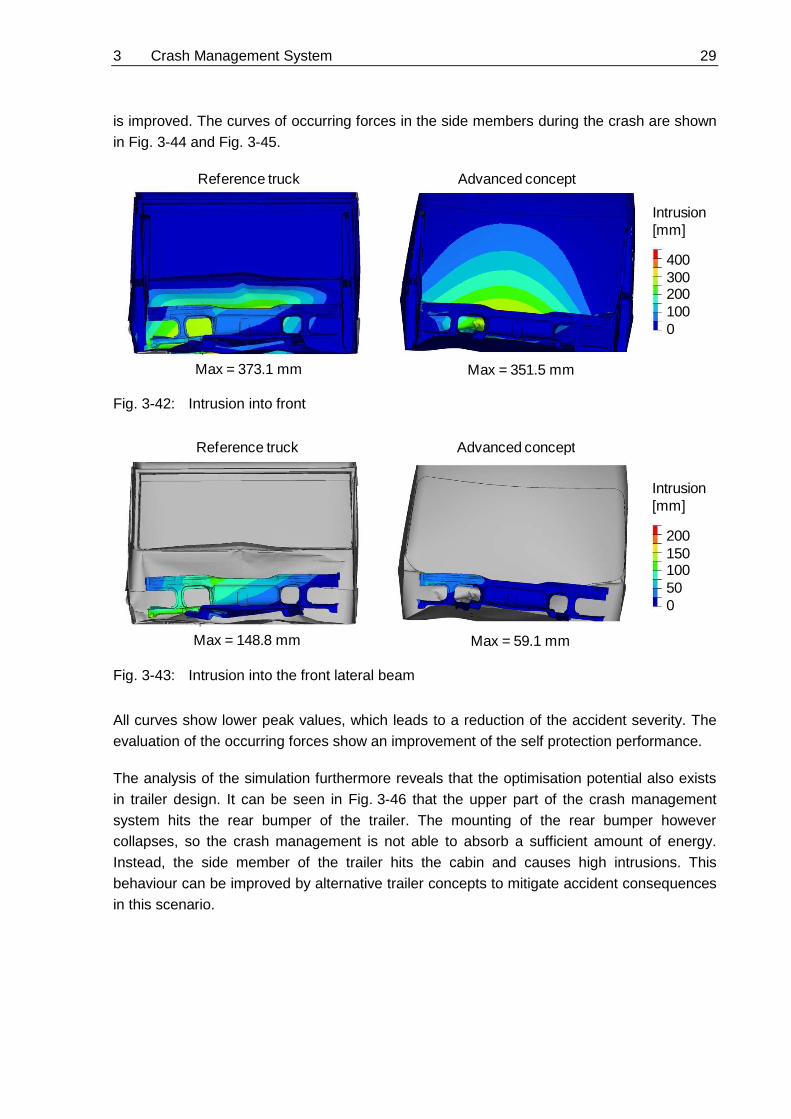
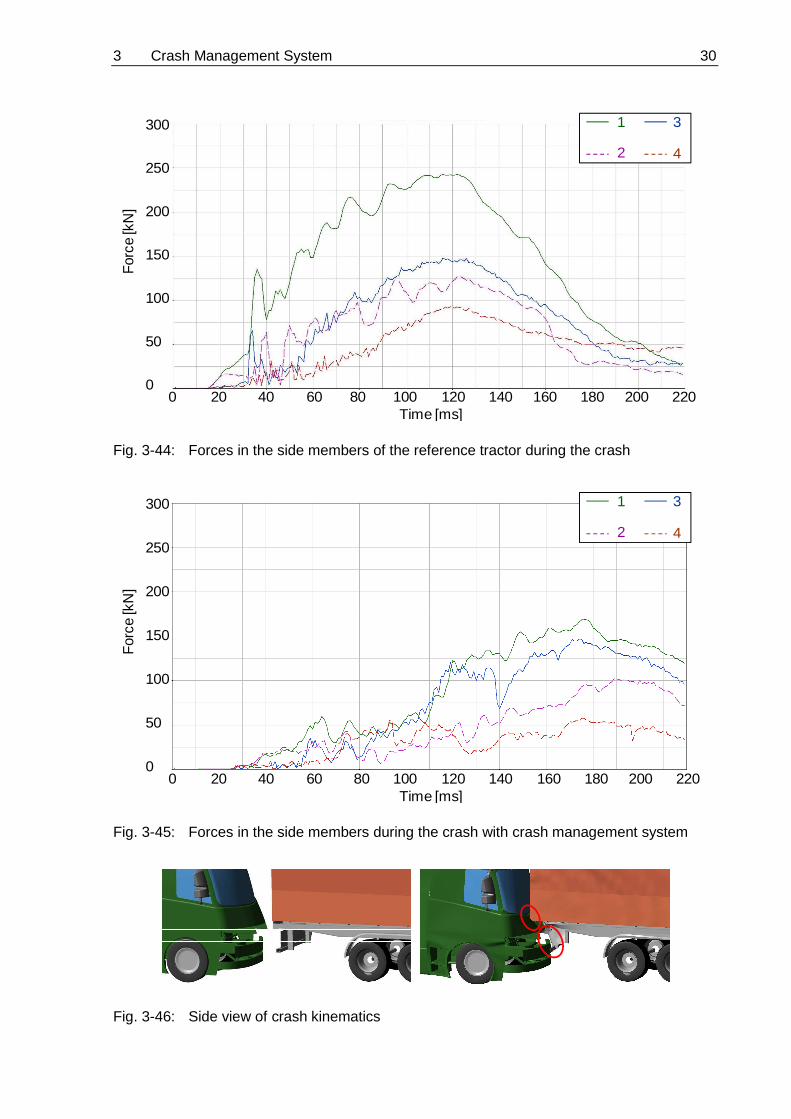
is improved. The curves of occurring forces in the side members during the crash are shown in Fig. 3-44 and Fig. 3-45.
Fig. 3-42: Intrusion into front
Fig. 3-43: Intrusion into the front lateral beam
All curves show lower peak values, which leads to a reduction of the accident severity. The evaluation of the occurring forces show an improvement of the self protection performance.
The analysis of the simulation furthermore reveals that the optimisation potential also exists in trailer design. It can be seen in Fig. 3-46 that the upper part of the crash management system hits the rear bumper of the trailer. The mounting of the rear bumper however collapses, so the crash management is not able to absorb a sufficient amount of energy. Instead, the side member of the trailer hits the cabin and causes high intrusions. This behaviour can be improved by alternative trailer concepts to mitigate accident consequences in this scenario.
4003002001000
Intrusion[mm]
Max = 373.1 mm
Reference truck Advanced concept
Max = 351.5 mm
200150100500
Intrusion[mm]
Max = 148.8 mm
Reference truck Advanced concept
Max = 59.1 mm
3 Crash Management System 30
Fig. 3-44: Forces in the side members of the reference tractor during the crash
Fig. 3-45: Forces in the side members during the crash with crash management system
Fig. 3-46: Side view of crash kinematics
Time [ms]
For
ce [k
N] 200
100
0
300
0 20 40 60 80 100 120 140 160 180 200 220
3
4
1
2
50
150
250
Time [ms]
For
ce [k
N] 200
100
0
300
0 20 40 60 80 100 120 140 160 180 200 220
3
4
1
2
50
150
250

3 Crash Management System 31
3.6 Weight Investigation
The crash management system’s weight is 60.7 kg. The standard steel bumper system’s weight is 53.6 kg. Since the crash management system replaces the steel bumper system, an additional mass of 7.1 kg must be compensated. This can, for example, be easily done by using an aluminium 5th wheel Fig. 7-2 instead of a conventional steel device. This way a mass reduction between 33 kg (37 %) to 45 kg is possible.
Fig. 3-47: Aluminium 5th wheel
4 Summary 32
4 Summary
The scope of this study was to develop a crash management system concept for 40 t trucks. The basis was an advanced truck concept that was developed based on the truck front design developed in the “APROSYS” study. This truck provides an extended front to improve aerodynamic properties and safety. The additional design space that is affected by the length extension was utilised in this study to apply a crash management system concept that improves the energy absorption behaviour in case of an accident.
In the first part the advanced truck concept as well as the reference truck that form the basis for the comparison of performances was introduced. The optimisation measures to lower the drag resistance of the optimised concept were explained briefly.
For the build up of the crash management system concept, functional requirements were collected. It was found in the analysis of legal requirements that a type approval according to ECE-R 93 is necessary for the crash management system concept, because it shall also serve as an underrun protection device for passenger cars. All measures prescribed in the regulation were considered in the construction of the crash management system concept and the test procedure was simulated using an FE model. To define crashworthiness target values, other research projects with the scope of the development of crash structures were investigated. These projects use the Euro NCAP crash test as a basis for comparison for newly developed structures. For this reason, an FE simulation of the Euro NCAP configuration was carried out for the used car model, so it can serve as a basis for comparison.
According to the elaborated requirements a concept design for the crash management system was built up. For the choice of the used material, aluminium and steel were considered. Also different basic concepts were analysed. An aluminium solution with octagon crash box profiles proved to be the right choice because of its high energy absorption potential, low technical complexity and its low weight.
After this, a CAD model was built up. This model was meshed with shell elements and used for the crash simulations. The four load cases “frontal car to truck with offset”, “frontal car to truck without offset”, “truck to car rear shunt” and “truck to truck rear shunt” were considered in the simulations. In the evaluation of the simulation runs, it was found that the developed crash management system concept mitigates the accident severity in all cases.
This study shows that the additional design space that would result from a length extension of the front of trucks can be efficiently utilised for application of crash management systems, which mitigate the consequences of an accident for the accident partner as well as for the truck occupants. From this point of view, in case the EU directive 96/53/EC regarding maximum dimension of trucks is reviewed, it is clearly desirable to disconnect the cabin length from the overall length of the vehicle. In this way a design that will improve road safety can be encouraged. In the continuation this can also open up possibilities to introduce minimum criteria for the energy absorption of the truck front structure.
5 Literature 33
5 Literature
[ADA95] ADAM, H. Untersuchung zur Optimierung der Vorhersagbarkeit der Energieabsorptions-eigenschaften von Karosseriestrukturen Schriftenreihe Automobiltechnik Institut für Kraftfahrwesen Aachen, 1995
[APR09] N. N. APROSYS website http://www.aprosys.com/
[BAC09] BACHEM, H.; GUSERLE, S. MAN TGX/TGS – Active and Passive Safety MAN Nutzfahrzeuge AG 18. Aachener Kolloquium Fahrzeug und Motorentechnik, RWTH Aachen Univsersity, Aachen, 2009
[BER09] BERGER, L.; LESEMANN, M.; SAHR, C. SuperLIGHT-CAR - the Multi-Material Car Body 7th European LS-DYNA Conference, Salzburg, Österreich, 2009
[CAR11] N. N. SafetyCompanion 2011 carhs.training gmbh, 2011
[DAF10] N. N. Imagebank http://www.daftrucks.com DAF Trucks N.V., Eindhoven, 2010
[DEK10] N. N. Aktuelle Crashtestberichte MAN gegen VW Golf http://www.dekra.de DEKRA e.V., Stuttgart, 2010
[ECE00] N. N. ECE-R 93 – Front underrun protective devices Regulations of the UN Economic Commission for Europe (ECE) http://www.unece.org UN Economic Commission for Europe, Switzerland, 2000

5 Literature 34
[GIL04] GILMONT, B. Aluminium improves transport safety Texts and illustrations for the European transport press Press Information, European Aluminium Association, 2004
[NCA10] N. N National Crash Analysis Center http://www.ncac.gwu.edu/vml/models.html
[OST07] OSTERMANN, F. Anwendungstechnologie Aluminium 2., neu bearbeitete und aktualisierte Auflage Springer-Verlag Berlin Heidelberg 1998, 2007
[SCB10] N. N. S.CS UNIVERSAL Schmitz Cargobull AG, Horstmar, 2010
[SCH06] SCHRAM, R. Car-to-Truck Testing and Simulations http://vc-compat.rtdproject.net VC-COMPAT, Eindhoven, 2006
[ULS98] N. N. ULSAB Engineering Reprort 6. CAE Analysis Results WorldAutoSteel www.worldautosteel.org/uploaded/2_2_6_ULSAB_EngRpt_CAEAnalRes.pdf 1998
[UTA05] N. N. Front underride protection / rear underride protection UTAC Gothenburg Workshop Gothenburg, Gothenburg, 2005
[VOL10c] N. N. Volvo - Safety Nobody Has Crashed http://www.volvo.com Volvo Truck Corporation, Gothenburg, 2010

5 Literature 35
[VTN09] N. N. TruckNews0309 Willkommen in der Crash-Fabrik http://www.volvo.com Truck News, Ismaning, 2009
[WEL06] WELO, T.; et al ATZ autotechnology Edition, 2/2006
[WOL10] WOLFSGRUBER, A. Nutzfahrzeugdesign im 21. Jahrhundert Szenarien, Trends und Utopien im Truckdesign MAGNA STEYR Fahrzeugtechnik 4. Grazer Nfz Workshop TU Graz, Graz, 2010
6 Appendix 36
6 Appendix
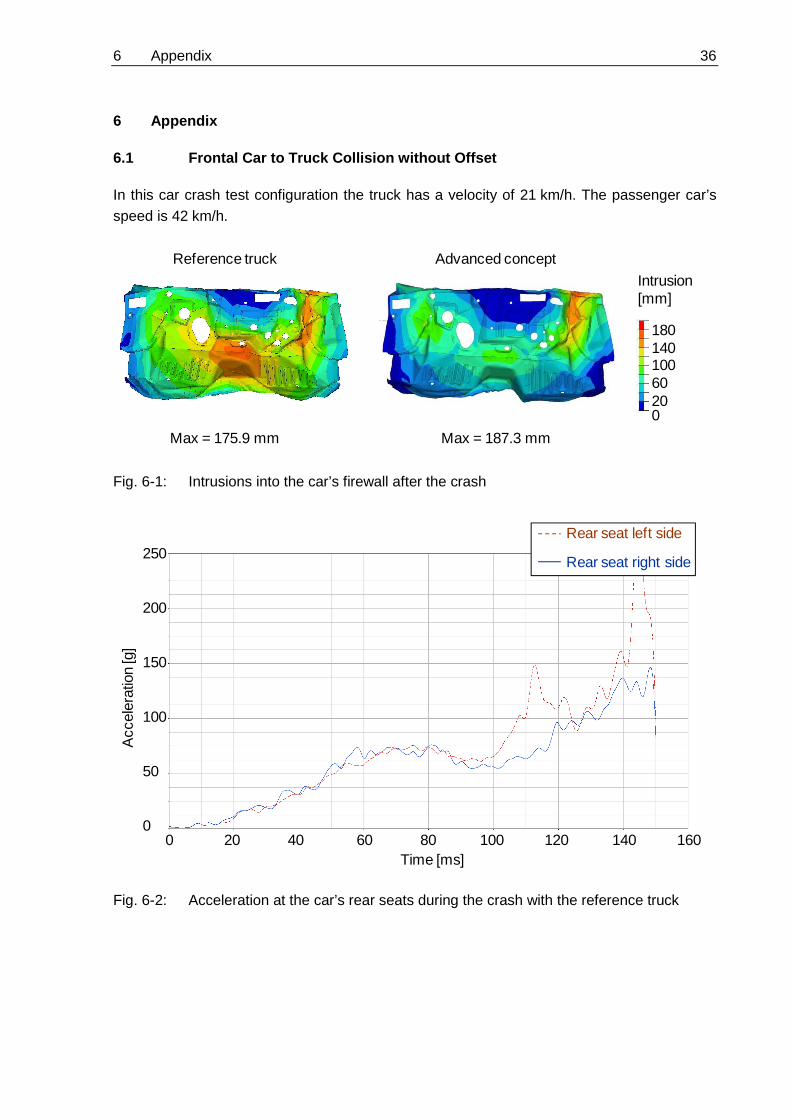
6.1 Frontal Car to Truck Collision without Offset
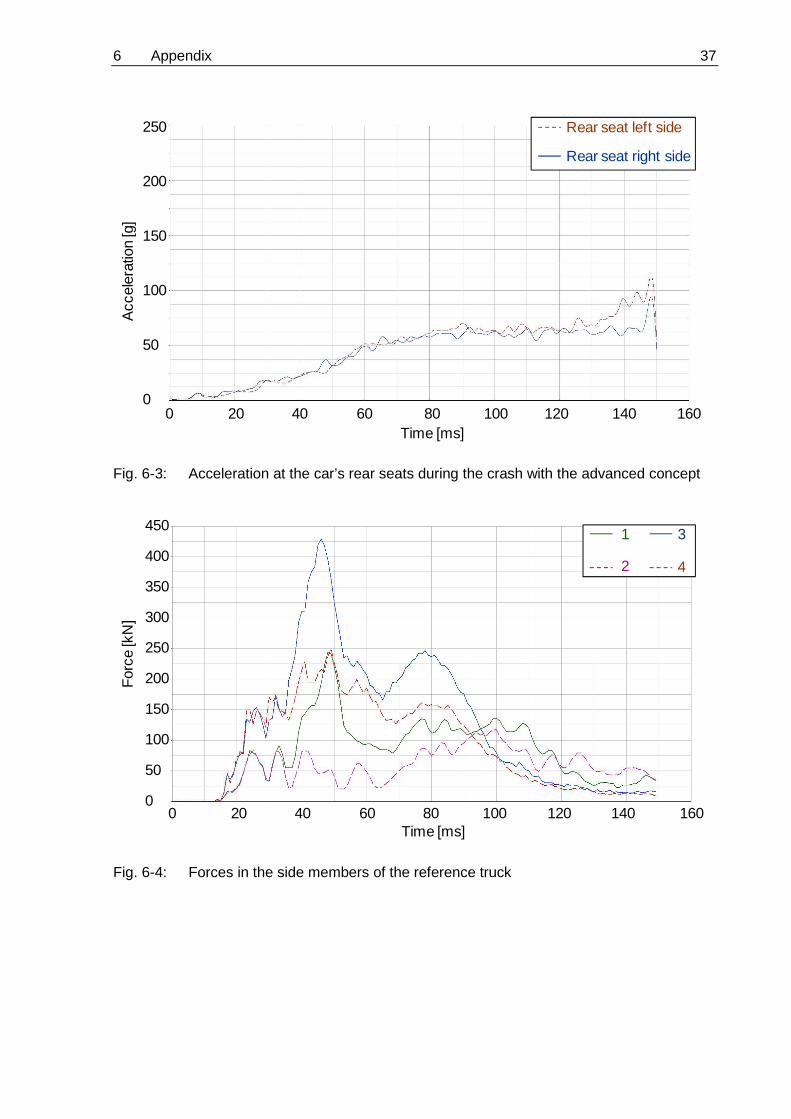
In this car crash test configuration the truck has a velocity of 21 km/h. The passenger car’s speed is 42 km/h.
Fig. 6-1: Intrusions into the car’s firewall after the crash
Fig. 6-2: Acceleration at the car’s rear seats during the crash with the reference truck
Max = 175.9 mm Max = 187.3 mm
Reference truck Advanced concept
1801401006020
Intrusion[mm]
0
0 20 40 60 80 100 120 140 160Time [ms]
Acc
eler
atio
n [g
]
250
200
150
100
50
0
Rear seat right side
Rear seat left side
6 Appendix 37
Fig. 6-3: Acceleration at the car’s rear seats during the crash with the advanced concept
Fig. 6-4: Forces in the side members of the reference truck
0 20 40 60 80 100 120 140 160Time [ms]
Acc
eler
atio
n [g
]250
200
150
100
50
0
Rear seat right side
Rear seat left side
Time [ms]
For
ce [k
N] 300
200
250
150
100
50
0
350
400
0 20 40 60 80 100 120 140 160
3
4
1
2
450

6 Appendix 38
Fig. 6-5: Forces in the side members of the advanced concept
Fig. 6-6: Energy absorption behaviour of reference truck
Time [ms]
For
ce [k
N]
0 20 40 60 80 100 120 140 160
31
300
200
250
150
100
50
0
350
400
450 3
4
1
2
0 20 40 60 80 100 120 140 160Time [ms]
Ene
rgy
[kJ]
200
150
100
50
0
25
75
125
175
225 Total amountof absorbedenergy
Energyabsorbedby car
Energyabsorbedby truck
6 Appendix 39
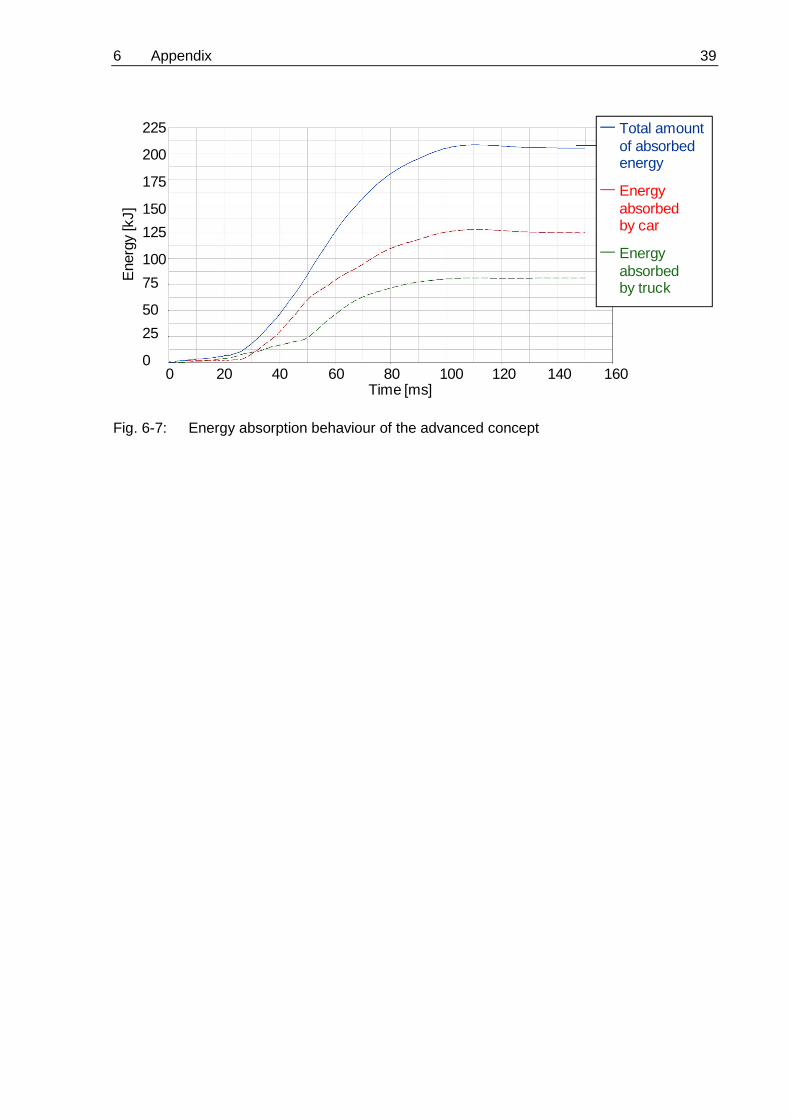
Fig. 6-7: Energy absorption behaviour of the advanced concept
0 20 40 60 80 100 120 140 160Time [ms]
Ene
rgy
[kJ]
200
150
100
50
0
25
75
125
175
225 Total amountof absorbedenergy
Energyabsorbedby car
Energyabsorbedby truck
6 Appendix 40
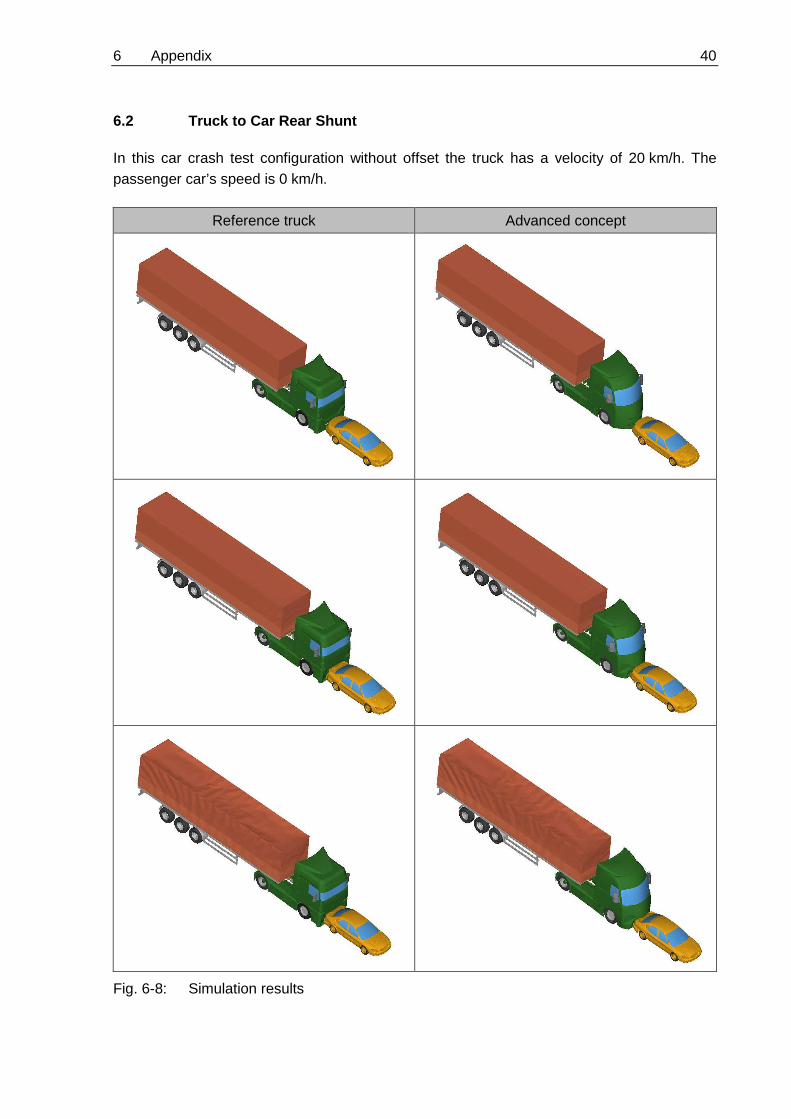
6.2 Truck to Car Rear Shunt
In this car crash test configuration without offset the truck has a velocity of 20 km/h. The passenger car’s speed is 0 km/h.
Reference truck Advanced concept
Fig. 6-8: Simulation results
6 Appendix 41
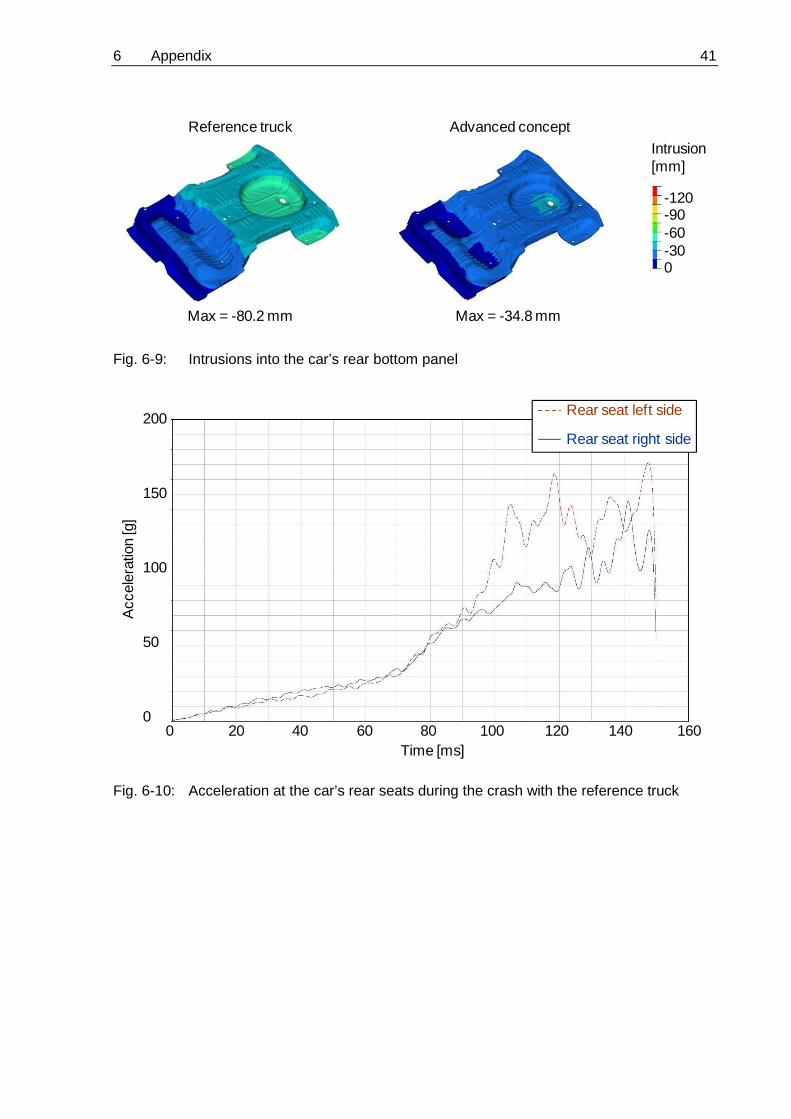
Fig. 6-9: Intrusions into the car’s rear bottom panel
Fig. 6-10: Acceleration at the car’s rear seats during the crash with the reference truck
-120-90-60-300
Intrusion[mm]
Max = -80.2 mm Max = -34.8 mm
Reference truck Advanced concept
0 20 40 60 80 100 120 140 160Time [ms]
Acc
eler
atio
n [g
]
200
150
100
50
0
Rear seat right side
Rear seat left side

6 Appendix 42
Fig. 6-11: Acceleration at the car’s rear seats during the crash with the advanced concept
Fig. 6-12: Forces in the side members of the reference truck
0 20 40 60 80 100 120 140 160Time [ms]
Acc
eler
atio
n [g
]100
75
50
25
0
Rear seat right side
Rear seat left side
Time [ms]
For
ce [k
N] 100
50
0
150
0 20 40 60 80 100 120 140 160
3
4
1
2
25
75
125
6 Appendix 43
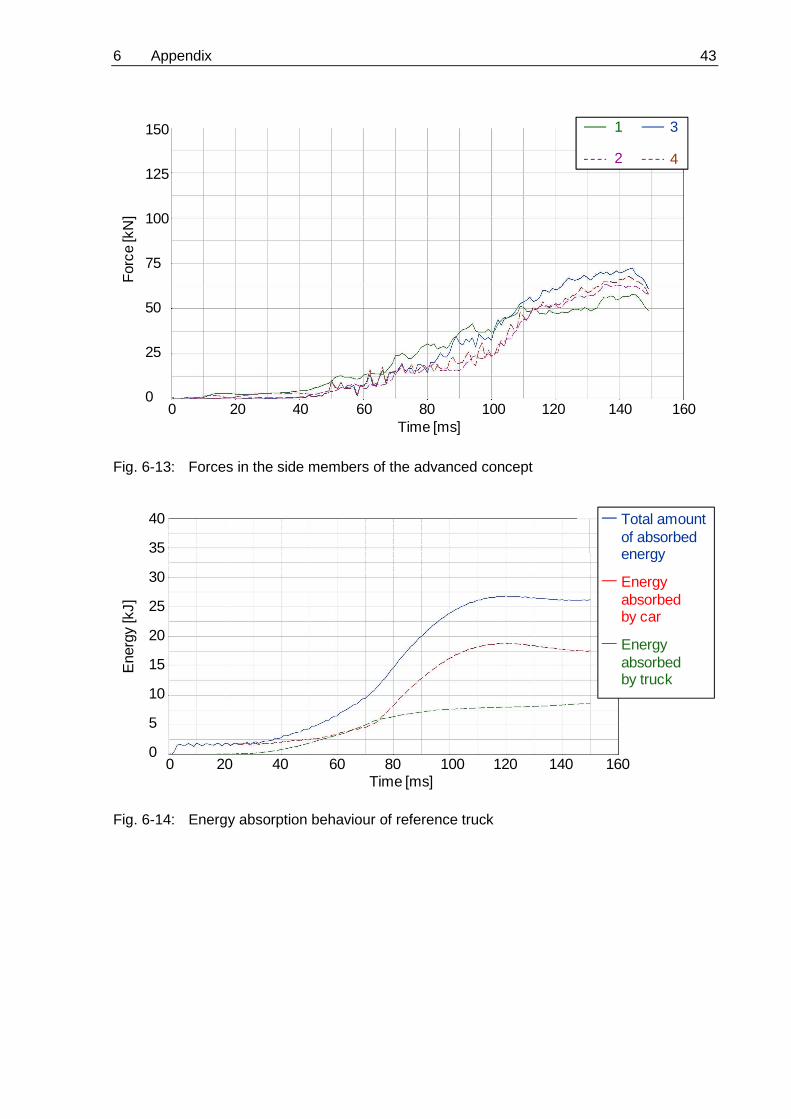
Fig. 6-13: Forces in the side members of the advanced concept
Fig. 6-14: Energy absorption behaviour of reference truck
Time [ms]
For
ce [k
N] 100
50
0
150
0 20 40 60 80 100 120 140 160
3
4
1
2
25
75
125
0 20 40 60 80 100 120 140 160Time [ms]
Ene
rgy
[kJ]
35
25
15
5
0
10
20
30
40 Total amountof absorbedenergy
Energyabsorbedby car
Energyabsorbedby truck

6 Appendix 44
Fig. 6-15: Energy absorption behaviour of the advanced concept
0 20 40 60 80 100 120 140 160Time [ms]
Ene
rgy
[kJ]
35
25
15
5
0
10
20
30
40 Total amountof absorbedenergy
Energyabsorbedby car
Energyabsorbedby truck