Embed Size (px)
Citation preview

Concentric Punching Shear Strength of
Reinforced Concrete Flat Plates
Fariborz Moeinaddini
Submitted in total fulfilment of the requirement of the degree of
Master of Engineering
June 2012
Centre for Sustainable Infrastructure, Faculty of Engineering and
Industrial Science
Swinburne University of Technology, Melbourne, Australia

ii

iii
Abstract
Flat slabs are very popular and economical floor systems in the construction industry. These
floor systems, supported directly on columns, are known to be susceptible to punching shear in
the vicinity of the slab-column connection. The punching shear provisions of AS 3600-2009,
the current Australian Concrete Structures Standard, for the case of concentric loading are based
on empirical formulae developed in the early 1960s and have not improved significantly since
then. These provisions do not consider some of the important parameters affecting the capacity
of a slab such as flexural reinforcement ratio and slab thickness size effect. AS 3600-2009 only
recognises shearheads as an effective shear reinforcement to increase the concentric punching
shear strength of slabs, and it does not cover more practical types of reinforcement such as shear
studs and stirrups unlike most of European and North American codes of practice.
In this thesis, the available methods for calculating concentric punching shear strength of slabs
are reviewed. The analytical basis of previous work by other researchers was used to propose a
formula to calculate the punching shear strength of flat plates with good accuracy for a wide
range of slab thicknesses, tensile reinforcement ratios, and concrete compressive strengths. In
this method, it is assumed that punching shear failure occurs due to the crushing of the critical
concrete strut adjacent to the column. A large number of experimental results of slab test
specimen, reported in the literature were gathered to evaluate the accuracy of the proposed
formula, as well as the punching shear formulae in some of the internationally recognised
standards such as AS 3600-2009, ACI 318-05, CSA A23.3-04, DIN 1045-1:2001, Eurocode2,
and NZS 3101:2006.
The proposed formula was also extended to cover the case of prestressed flat plates with the use
of the decompression method. Recent experimental results of prestressed slab test specimens,
published in journal papers, were collected to assess the accuracy of the proposed formula and
provisions of aforementioned standards in the prediction of the ultimate strength of prestressed
flat plates.
Furthermore, detailing considerations for the design of shear reinforcements such as shear studs
and stirrups, which are not recognised by AS 3600-2009, were discussed. Different failure
modes of flat plates with shear reinforcement were presented. A method to calculate the
strength of the slab assuming a critical crack developing inside the shear reinforced region was
proposed. This method considers the contribution of shear reinforcement intersecting with the
iv
critical crack and the uncracked concrete zone adjacent to the column. In addition, a control
perimeter outside the shear reinforced zone was suggested to be used with the one-way shear
formula of AS 3600-2009 to calculate the punching shear strength of flat plates outside their
shear reinforced zone. The proposed method and provisions of ACI 318-05, CSA A23.3-04,
and Eurocode2 were evaluated against some of the reported experimental results on the flat
plates with shear reinforcement.

v
Acknowledgement
This research was conducted at the Centre of Sustainable Infrastructure, Swinburne
University of Technology. The SUPRA scholarship provided by Swinburne University
of Technology is gratefully acknowledged.
I would like to sincerely thank my principal coordinating supervisor Dr. Kamiran
Abdouka for his invaluable guidance and constant support throughout this research. I
am also greatly indebted to my coordinating supervisor Prof. Emad Gad for his wise
suggestions and continuous help during my postgraduate studies.
I wish to express my deep gratitude to Emma Wenczel, Alireza Mohyeddin-Kermani
whom I lived with during my studies in Australia, for their encouragement,
understanding and support.
I owe special thanks to my valued friends and colleagues Anne Belski, Ianina Belski,
Bara Baraneedaran, Saleh Hassanzade, Hessam Mohseni, Siva Sivagnanasundram and
Stephan Zieger for their assistance and companionship during this research.
Finally, my foremost thanks and greatest gratitude goes to my beloved family Fahime,
Firoozeh, Farnaz and Faramarz for their moral support and unconditional help.

vi
vii
Preface
So far, a part of this research has been presented in the following conference papers:
• Moeinaddini, F & Abdouka, K 2011, ‘Punching shear capacity of concrete slabs with no unbalanced moment’, Proceedings of Concrete 2011, Concrete Institute of Australia, Perth, Australia.
• Moeinaddini, F, Abdouka, K & Gad, EF 2010, ‘Punching shear capacity of concrete slabs: a comparative study of various standards and recent analytical methods’, Post-
graduate Research, Swinburne University of Technology, Melbourne, Australia.

viii

ix
Declaration
This is to certify:
• This thesis contains no material which has been accepted for the award to the
candidate of any other degree or diploma, except where due reference is made in the
text.
• To the best of the candidate’s knowledge contains no material previously published or
written by another person except where due reference is made in the text of the
examinable outcome.
Fariborz Moeinaddini
June 2012

x

xi
Table of Content
1 INTRODUCTION ................................................................................................................ 1
1.1 Background ................................................................................................................... 1
1.2 Aim and Objectives ....................................................................................................... 5
1.3 Thesis Organisation ...................................................................................................... 5
2 LITERATURE REVIEW ..................................................................................................... 7
2.1 Introduction ................................................................................................................... 7
2.2 Reported Observations from Concentric Punching Shear Failure of Test Specimens .. 7
2.3 Mechanical Models for Punching Shear – Balanced Condition ................................... 9
2.3.1 Kinnuen and Nylander Approach ......................................................................... 9
2.3.2 Truss Model by Alexander and Simmonds ......................................................... 15
2.3.3 Bond Model by Alexander and Simmonds ......................................................... 17
2.3.4 Models Based on the Failure of Concrete in Tension ......................................... 19
2.3.5 Plasticity Approach ............................................................................................. 24
2.3.6 Flexural Approach............................................................................................... 25
2.3.7 Critical Shear Crack Theory ............................................................................... 26
2.4 Punching Shear of Prestressed Flat Plates .................................................................. 27
2.4.1 Principal Tensile Stress Approach ...................................................................... 28
2.4.2 Equivalent Reinforcement Ratio Approach ........................................................ 28
2.4.3 Decompression Approach ................................................................................... 29
2.5 Methods to Increase Punching Shear Strength of Concrete Slabs .............................. 30
2.6 Shear Reinforcement for Flat Plates ........................................................................... 31
2.6.1 Shear Reinforcement for Construction of New Slabs ......................................... 31
2.6.2 Shear Reinforcement for Retrofit of Slabs .......................................................... 35
2.7 Control Perimeter Approach and Building Code Provisions ...................................... 37
2.7.1 Australian Standard AS 3600-2009 .................................................................... 37

xii
2.7.2 American Code ACI 318-05 ................................................................................ 39
2.7.3 New Zealand Standard NZS 3101:2006 .............................................................. 41
2.7.4 Canadian Standard CSA A23.3-04 ...................................................................... 41
2.7.5 Eurocode2 (2004) ................................................................................................ 43
2.7.6 British Standard BS 8110-97 ............................................................................... 44
2.7.7 German Standard DIN 1045-1:2001 .................................................................... 45
2.8 Summary ...................................................................................................................... 46
3 CONCENTRIC PUNCHING SHEAR OF FLAT PLATES ............................................... 47
3.1 Introduction ................................................................................................................. 47
3.2 Strut-and-Tie Model for Punching Shear Phenomenon ............................................... 48
3.3 Proposed Formula for the Ultimate Punching Shear Strength of Flat Plates ............... 50
3.3.1 Depth of Neutral Axis ......................................................................................... .52
3.3.2 Inclination of the Critical Strut and Critical crack .............................................. .55
3.3.3 Compressive Strength of the Concrete Strut ...................................................... .58
3.3.4 Slab Size Factor ................................................................................................... 59
3.3.5 Determination of the Parameters ......................................................................... 60
3.3.6 Example ............................................................................................................... 67
3.4 Comparison of Experimental Results with Design Standards ..................................... 68
3.5 Summary ...................................................................................................................... 75
4 CONCENTRIC PUNCHING SHEAR OF PRESTRESSED FLAT PLATES ................... 77
4.1 Introduction ................................................................................................................. 77
4.2 Background .................................................................................................................. 77
4.2.1 Effect of In-plane Stresses on the Punching Shear Strength of Flat Plates ......... 78
4.2.2 Effect of Eccentricity of Prestressing Tendon on the Punching Shear Strength of
Flat Plates ............................................................................................................................ 81
4.2.3 Effect of the Vertical Component of Prestressing Tendons Passing over the Slab-
Column Connection on the Punching Shear Strength of Flat Plates ................................... 82
4.3 Ultimate Punching Shear Strength of Prestressed Flat Plates Using the Decompression
Method ..................................................................................................................................... 84
4.3.1 Available Decompression Methods ..................................................................... 86
xiii
4.3.2 Proposed Decompression Method....................................................................... 88
4.3.3 Example .............................................................................................................. 91
4.4 Comparison of Design Standards ................................................................................ 94
4.4.1 Comparison with Experimental Results .............................................................. 94
4.5 Summary ..................................................................................................................... 99
5 CONCENTRIC PUNCHING SHEAR OF FLAT PLATES WITH SHEAR
REINFORCEMENT ................................................................................................................. 101
5.1 Introduction ............................................................................................................... 101
5.2 Detailing of Shear Reinforcement ............................................................................. 102
5.3 Ultimate Strength of Flat Plates with Shear Reinforcement ..................................... 104
5.3.1 Failure Inside the Shear Reinforced Region ..................................................... 105
5.3.2 Failure Outside the Shear Reinforced Region ................................................... 109
5.3.3 Summary of the suggested method ................................................................... 111
5.3.4 Example ............................................................................................................ 112
5.4 Comparison of Experimental Results with Design Standards .................................. 114
5.5 Summary ................................................................................................................... 114
6 SUMMARY AND CONCLUSIONS ............................................................................... 117
6.1 Summary and Findings of Literature Review ........................................................... 117
6.2 Concentric Punching Shear Strength of Flat Plates .................................................. 117
6.3 Concentric Punching Shear Strength of Prestressed Flat Plates ............................... 119
6.4 Concentric Punching Shear Strength of Flat Plates with Shear Reinforcement.........120
References…………… ...... ……………………………………………...………………….... 123
Appendix A…………………….……… .......... ……………………...………………………..125
Appendix B… ..... …….…………………………..…………………………...……………….139
Appendix C… ..... .…………………………………………………...……………..………….143

xiv

xv
List of Figures
Figure 1.1 Schematic view of different types of two-way concrete slabs (Wight & MacGregor
2009) ............................................................................................................................................. 1
Figure 1.2 Punching shear localised failure with pyramid-shaped failure surface (Egberts 2009 ;
Wight & MacGregor 2009) ........................................................................................................... 2
Figure 2.1 Tangential and radial cracks observed in typical punching shear test specimen (Sherif
1996) ............................................................................................................................................. 8
Figure 2.2 Comparison of deflection-load graph for slab test specimens failed by punching
shear to slab test specimens failed in flexure (Menétrey 1998) .................................................... 8
Figure 2.3 Mechanical model of Kinnunen and Nylander as shown in fib (2001) ....................... 9
Figure 2.4 Punching shear failure model proposed by Shehata and Regan (Shehata 1990) ....... 11
Figure 2.5 Radial compression stress failure proposed by Broms (1990) as shown in fib (2001)
.................................................................................................................................................... 12
Figure 2.6 Radial compression stress failure mechanism as shown in Marzouk, Rizk and Tiller
(2010) .......................................................................................................................................... 15
Figure 2.7 Truss model proposed by Alexander and Simmonds (1987) as shown in Megally
(1998) .......................................................................................................................................... 16
Figure 2.8 Curved compression strut (Alexander & Simmonds 1992) ....................................... 17
Figure 2.9 Plan view of slab and the components of Bond model proposed by Alexander and
Simmonds (1992) ........................................................................................................................ 18
Figure 2.10 Free body diagram of radial strip (Alexander & Simmonds 1992) ......................... 19
Figure 2.11 Punching shear model by Georgopoulos as shown in fib (2001) ............................ 20
Figure 2.12 Distribution of concrete tensile stresses in Georgopoulos as shown in fib (2001) .. 20
Figure 2.13 Schematic view of components of proposed method by Menetrey (2002) ............. 21

xvi
Figure 2.14 Schematic view of model by Theodorakopoulos and Swamy (2002) ..................... 23
Figure 2.15 Plasticity model proposed by Braestrup et al. (1976) .............................................. 24
Figure 2.16 Failure pattern and parameters of the proposed method by Rankin and Long (1987)
..................................................................................................................................................... 26
Figure 2.17 Procedure to specify punching shear strength of slab according to Critical Shear
Crack Theory (Muttoni 2008)...................................................................................................... 27
Figure 2.18 Load-deflection curves of slabs strengthened by different methods (Megally &
Ghali 2000) .................................................................................................................................. 30
Figure 2.19 Shearhead reinforcement (Corley & Hawkins 1968) ............................................... 32
Figure 2.20 (a) Bent bar, (b) Single-leg stirrup , (c) Multiple-leg stirrup (d) Closed-stirrup or
Closed-tie (ACI 318-05 2005 ; Broms 2007) .............................................................................. 33
Figure 2.21 Headed shear studs (Bu 2008) .................................................................................. 33
Figure 2.22 (a) Plan view of a shearband (b) Shearbands placed in slab (Pilakoutas & Li 2003)
..................................................................................................................................................... 34
Figure 2.23 UFO shear reinforcement (Alander 2004) ............................................................... 34
Figure 2.24 Lattice shear reinforcement (Park et al. 2007) ......................................................... 35
Figure 2.25 Test specimen strengthened by steel plates (Ebead & Marzouk 2002) .................... 36
Figure 2.26 (a) Shear bolt, (b) concrete slab strengthened with shear bolts (Bu 2008)............... 36
Figure 2.27 Critical perimeter around the column as shown in AS 3600- 2009 ......................... 38
Figure 2.28 Shear reinforcement layout suggested by ACI 318-05 as shown in Kamara and
Rabbat (2005) .............................................................................................................................. 40
Figure 2.29 Critical perimeter as shown in Eurocode2 (2004) .................................................... 43
Figure 2.30 Shear reinforcement arrangement and critical perimeter outside the shear reinforced
region as shown in Eurocode2 (2004) ......................................................................................... 44
Figure 2.31 Critical perimeter as given in DIN 1045-1 (2001) ................................................... 45

xvii
Figure 3.1 Schematic view of B-regions and D-regions in a simple structure............................ 47
Figure 3.2 Early strut-and-tie model for slab-column connection .............................................. 48
Figure 3.3 Refined Strut-and-tie model including concrete ties ................................................. 49
Figure 3.4 Punching shear by failure of concrete ties ................................................................. 49
Figure 3.5 Punching shear by crushing of concrete struts .......................................................... 50
Figure 3.6 View and cross section of the critical concrete strut around the column .................. 51
Figure 3.7 Distribution of strains, stresses and forces in elastic condition (Warner et al. 1998) 53
Figure 3.8 Strains and stresses distribution in the ultimate stage (Warner et al. 1998) .............. 53
Figure 3.9 Rectangular stress block in the ultimate stage (Warner et al. 1998) ......................... 54
Figure 3.10 Schematic view of the flexural neutral axis and the shear neutral axis
(Theodorakopoulos & Swamy 2002) .......................................................................................... 55
Figure 3.11 Observed critical crack angle versus thickness of slab ............................................ 57
Figure 3.12 Predicted angle of the critical crack using Equation 3-10 ....................................... 58
Figure 3.13 Vtest/Vuo versus effective depth of slab, tensile reinforcement ratio and compressive
strength of concrete for T-P-M-0.5 ............................................................................................. 64
Figure 3.14 Vtest/Vuo versus effective depth of slab, tensile reinforcement ratio and compressive
strength of concrete for S-P-B-0.33 ............................................................................................ 65
Figure 3.15 Vtest/Vuo versus effective depth of slab, tensile reinforcement ratio and compressive
strength of concrete for S-P-A-0.5 .............................................................................................. 66
Figure 3.16 Plan and elevation view of test specimen 16/1 reported in (2005) ......................... 67
Figure 3.17 Vtest/Vuo versus effective depth of slab, tensile reinforcement ratio and compressive
strength of concrete for AS 3600-2009 and ACI 318-05 ............................................................ 70
Figure 3.18 Vtest/Vuo versus effective depth of slab, tensile reinforcement ratio and compressive
strength of concrete for NZS3101:2006 ...................................................................................... 71

xviii
Figure 3.19 Vtest/Vuo versus effective depth of slab, tensile reinforcement ratio and compressive
strength of concrete for CSA A23.3-04 ....................................................................................... 72
Figure 3.20 Vtest/Vuo versus effective depth of slab, tensile reinforcement ratio and compressive
strength of concrete for Eurocode2 and Model Code 90 ............................................................. 73
Figure 3.21 Vtest/Vuo versus effective depth of slab, tensile reinforcement ratio and compressive
strength of concrete for DIN 1045-1 ........................................................................................... 74
Figure 4.1 Prestressing actions adjacent to the slab-column connection ..................................... 78
Figure 4.2 Geometery of BD test series (Ramos, Lúcio & Regan 2011) .................................... 79
Figure 4.3 Geometry of test specimens LP1, LP2 and LP3 as shown in Silva, Regan and Melo
(2005) .......................................................................................................................................... 80
Figure 4.4 Geometry of test specimens V5 and V6 reported in Kordina and Nolting (1984) as
shown in Silva, Regan and Melo (2005) ..................................................................................... 80
Figure 4.5 Elevation view of test setup of PC test series and the bending moment diagram which
was applied to the slab without presence of in-plane forces (Clement & Muttoni 2010) ........... 81
Figure 4.6 (a) Plan view of test specimens AR8-AR16 (b) Profile of prestressing tendons
(Ramos & Lucio 2006) ................................................................................................................ 83
Figure 4.7 Position of prestressing tendons in test specimens AR8-AR16 (Ramos & Lucio 2006)
..................................................................................................................................................... 83
Figure 4.8 Schematic view of deformation of slab after prestressing forces are applied ............ 85
Figure 4.9 (a) Prestressed slab (b) Prestressed slab at decompression stage (c) Punching shear
failure of prestressed slab ............................................................................................................ 86
Figure 4.10 Vtest/Vup versus σcp for three different methods of calculating Vup ............................ 90
Figure 4.11 (a) Plan view (b) Elevation view of test setup of specimen D2 as reported in Silva,
Regan and Melo (2005) ............................................................................................................... 92
Figure 4.12 Vtest/Vup versus σcp for AS3600-2009 ........................................................................ 96
Figure 4.13 Vtest/Vup versus σcp for AS3600-2009 when Vp is included ....................................... 96

xix
Figure 4.14 Vtest/Vup versus σcp for ACI 318-05 .......................................................................... 97
Figure 4.15 Vtest/Vup versus σcp for ACI 318-05 ignoring the limit on f’c .................................... 97
Figure 4.16 Vtest/Vup versus σcp for CSA A23.3-04 ..................................................................... 97
Figure 4.17 Vtest/Vup versus σcp for CSA A23.3-04 ignoring the limit on f’c ............................... 98
Figure 4.18 Vtest/Vup versus σcp for Eurocode2 ............................................................................ 98
Figure 4.19 Vtest/Vup versus σcp for DIN 1045-1 .......................................................................... 98
Figure 5.1 (a) Orthogonal type arrangement (b) Radial type arrangement (c) square type
arrangement of shear reinforcement for punching shear ........................................................... 102
Figure 5.2 Radial and tangential spacing between shear rows reinforcement in flat plates...... 103
Figure 5.3 Different types of punching shear failure in flat plates with shear reinforcement .. 104
Figure 5.4 (a) Critical tie in flat plates with shear reinforcement (b) Failure of the critical tie due
to the development of shear crack inside the shear reinforced region ...................................... 105
Figure 5.5 Vertical components of the critical tie which resist punching shear ....................... 106
Figure 5.6 Eurocode2 and Model Code 90 control perimeter outside the orthogonal shear
reinforced zone.......................................................................................................................... 110
Figure 5.7 (a) Top view of test specimen 12 (b) Arrangement of shear reinforcements in the test
specimen 12 (Birkle & Dilger 2008) ......................................................................................... 112

xx

xxi
List of Tables
Table 3.1 Main properties of test specimens and angle of the critical crack reported in (Pisanty
2005) ........................................................................................................................................... 57
Table 3.2 Average, SD and CV of Vtest/Vuo for different combination of parameters using the
method in Broms (1990) to calculate the depth of the neutral axis............................................. 62
Table 3.3Average, SD and CV of Vtest/Vuo for different combination of parameters using the
method in Theodorakopoulos and Swamy (2002) to calculate the depth of the neutral axis...... 62
Table 3.4 Average, SD and CV of Vtest/Vuo for different combination of parameters using the
method in Shehata (1990) to calaculate the depth of the neutral axis ......................................... 63
Table 3.5 Average, SD and CV of Vtest/Vuo for AS 3600-2009, ACI 318-05, NZ 3101:2006,
CSA A23.3-04, Eurocode2 and DIN 1045-1 .............................................................................. 69
Table 4.1 Failure load and details of BD test specimens (Ramos, Lúcio & Regan 2011) .......... 79
Table 4.2 Failure load and detail of test specimens LP1, LP2 and LP3 (Silva, Regan & Melo
2005) ........................................................................................................................................... 80
Table 4.3 Failure load and details of test specimens V5 and V6 (Silva, Regan & Melo 2005) .. 81
Table 4.4 Failure load and details of test specimens reported in Clement and Muttoni (2010) .. 82
Table 4.5 Failure load and details of test specimen AR8-AR16 (Ramos & Lucio 2006) ........... 84
Table 4.6 Average, SD and CV of Vtest/Vup for three different methods of calculating Vup ......... 89
Table 4.7 Average, SD and CV of Vtest/Vup for AS 3600-2009, ACI 318-04, CSA A23.3-04,
Eurocode2, and DIN 1045-1:2001 .............................................................................................. 95
Table 5.1 Vtest/Vuin for test specimens in which failure occurred inside the shear reinforced zone
.................................................................................................................................................. 109
Table 5.2 Vtest/Vuout for test specimens in which failure occurred outside the shear reinforced
zone ........................................................................................................................................... 111

xxii
Table 5.3 Average, SD and CV of Vtest/Vus for ACI 318-05, CSA A23.3, Eurocode2, and the
proposed method ....................................................................................................................... 114
Table A.1 Details of collected slab test specimens.................................................................... 130
Table A.2 Predicted punching shear strength of collected test specimens ................................ 134
Table B. 1 Details of collected prestressed slab test specimens ................................................ 140
Table B. 2 Predicted punching shear strength of collected test specimens using the suggested
method ....................................................................................................................................... 141
Table B. 3 Predicted punching shear strength of collected test specimens using formulae of
design standards......................................................................................................................... 142
Table C.1 Details of collected slab test specimens with shear reinforcement ........................... 144
Table C.2 Predicted punching shear strength of slab test specimens with shear reinforcement
using the suggested method ....................................................................................................... 145
Table C.3 Predicted punching shear strength of slab test specimens with shear reinforcement
using ACI 318-05 ...................................................................................................................... 146
Table C.4 Predicted punching shear strength of slab test specimens with shear reinforcement
using Eurocode2 ........................................................................................................................ 147
Table C.5 Predicted punching shear strength of slab test specimens with shear reinforcement
using CSA A23.3-04 ................................................................................................................. 148

1
Chapter One
1 INTRODUCTION
1.1 Background
Two-way concrete slabs are widely used in many types of strucutres. They can be categorised
into slabs that are supported on beams, and slabs that are supported on columns without any
beam. The beamless slabs can be further subdivided into two categories: flat slabs, which are
supported on columns through a drop panel or column capital, and flat plates, which are
supported directly on the columns. Different types of two-way concrete slabs are shown in
Figure 1.1. The early beamless slabs were flat slabs, constructed in the early 20th century. With
the devlopment of construction technology, flat plates were developed from the concept of flat
slabs and were increasingly built after World War II.
Figure 1.1 Schematic view of different types of two-way concrete slabs (Wight & MacGregor 2009)
Flat plate construction is very common in parking, office, and apartment buildings. Exclusion
of the beams, drop panels, or column capitals in the structural system optimises the storey
height, formwork, labour, construction time, and the interior space of the building. This makes
flat plate construction a very desirable structural system in view of economy, construction, and
architectural desires. However, from structural point of view, supporting a relatively thin plate
directly on a column is significantly problematic due to the structural discontinuity.
a) Concrete slab, supported on
beams
b) Flat slab concrete slab c) Flat plate concrete slab

2
Considering the flow of forces in the structure, significant biaxial bending moment and shear
force should transfer through the slab-column connection. In the absence of beams, drop
panels, or column capital, this region is considered as one of the most critical D-regions, in
which stresses are disturbed and strains are irregular, in concrete structures (fib 2001).
If the shear stresses are minor, two-way concrete slabs show significant ductility, and
redistribution of moment before the strength of the slab is reached. Where two-way slabs are
supported on beams, shear force is distributed along the beams and shear stresses are not
considerable, so a very thin slab satisfies the flexural strength criterion of the design. Generally,
in this type of concrete slab, the deflection limitations determine the thickness of the slab.
In flat plates, however, there is a considerable amount of shear to be transferred through the
slab-column connection. Typically, slab thickness would be determined either by a shear
strength criterion or deflection limitations. With the increasing use of prestressing in floor
construction, designers are capable of eliminating the excessive deflection of two-way slabs by
defining the prestressing tendon profile, and generally the critical problem which governs the
design is the so called “punching shear” (Dilger & Ghali 1981).
The punching shear or two-way shear phenomenon is a localised failure. It occurs when the
column, punches through the slab, and it can be characterised by the truncated or pyramid
failure surface. Schematic view and a saw-cut test specimen, failed by punching shear, are
shown in Figure 1.2.
Figure 1.2 Punching shear localised failure with pyramid-shaped failure surface (Egberts 2009 ;
Wight & MacGregor 2009)
This type of failure is extremely dangerous and should be prevented, since it may lead to brittle,
with little or no warning, and progressive collapse of floors. One of the most notorious
examples of the devastating punching shear failure is: the collapse of Sampoong department
store in South Korea in 1995 where more than 500 people were killed and nearly 1000 were

3
injured (Gardner, Huh & Chung 2002). Another example is the collapse of the Skyline Plaza in
Virginia in 1973 which killed more than 14 workers (Bu 2008).
Designers can increase the punching strength of beamless slabs by increasing the slab thickness,
introducing drop panels or column capitals, adding shear reinforcement adjacent to the column,
or even specifying concrete with higher strength. In some standards such as Eurocode2 (2004),
BS 8110 (1997), and DIN 1045-1 (2001) increase of flexural reinforcement also allows
designers to consider higher shear strength for the slabs.
Due to the importance of the punching shear phenomenon, an enormous volume of research has
been conducted on this topic. There have been significant attempts to propose a rational model
that can explain the flow of forces in the vicinity of the slab-column connection. However,
there is still no consensus in the literature on how to calculate the punching shear strength of
concrete slabs. Even internationally recognised concrete structure standards are significantly
different in their approach towards this problem.
Most of the international concrete structure standards have enhanced their formulae as insight
into this type of failure has improved in recent decades. Mostly, they adopt empirical or semi-
empirical formulae in their provisions for the punching shear phenomenon. Typically, they
distinguish between two conditions for punching shear. Firstly, where slab-column connections
are under no unbalanced moment and the loading of the slab produces symmetrical shear.
Secondly, where slab-column connections undergo unbalanced moment and shear forces
simultaneously. An example for the first case is where the columns are equally spaced and the
lateral loads on the structure are carried by other structural systems such as shear walls or
bracings. An example for the second case is where the slab-column structural system resists the
lateral forces in addition to the gravity loads, or at exterior slab-column connections.
Generally, the most common solution for designers to increase the punching strength of the slab
is to use different types of shear reinforcement. Some of the most common types of shear
reinforcement for punching shear are closed ties, shearheads, bent-up bars, single leg ties, and
more recently shear studs or stud rails. The slab-column connection region is highly congested
with tensile and compressive reinforcement from the column and slab. This would be worse in
the presence of post-tensioning cables. Shear reinforcement such as shearheads, which are
bulky, are not favourable in this region. Moreover, from the economical perspective, shear
reinforcement such as closed ties are time consuming and labour intensive to install in position.
Recently, more efficient shear reinforcement such as shear studs and stud rails were developed
and became very popular and common due to their easy installation and practicality. The latter
types of shear reinforcement are recognised by most European and North American standards.

4
In Australia, the Australian Standard for Concrete Structures AS 3600-2009, is still behind
many other standards in punching shear provisions. In the case of symmetric punching, the
provision is based on research work in the early 1960s. Its formula does not account for some
important parameters such as the size effect or tensile reinforcement ratio. Moreover, AS 3600-
2009 only recognises shearhead reinforcement as the allowable shear reinforcement to increase
the symmetric punching shear strength of concrete slabs, but provides no guidelines on how to
design this type of shear reinforcement. In Clause 9.2.2 of AS 3600-2009, there is a note which
states for shear reinforcement other than shearheads, strength may be determined by tests. This
has left users of AS 3600-2009 with uneconomical and architecturally unpleasant solutions such
as increasing the thickness of the whole slab or locally increasing the thickness of the slab-
column connection by introducing a drop-panel, or column capital. The European and North
American designers, however, have the option of using practical types of shear reinforcement
such as stud-rails or shear studs.
In most design standards, formulae for predicting punching shear strength of slabs with
unbalanced moment are extensions of the formulae of symmetric punching shear. Therefore,
any deficiency in the calculation of symmetric punching shear strength of slabs would be
reflected in the provisions of those for the punching shear with unbalanced moment.
In the case of punching shear with unbalanced moment, AS 3600-2009 has a totally different
approach compared to the other international standards. The provision is based on work by
Rangan and Hall (1983), and assumes that a significant amount of the unbalanced moment from
the slab is transferred by torsion to the side faces of the column. On the basis of this
assumption, AS 3600-2009 only recognises closed ties as shear reinforcement to enhance the
punching shear strength of slab-column connection in the presence of unbalanced moment. The
problem with closed ties is that they are labour intensive and cumbersome to install on site, as
compared to shear studs. Many other international standards allow designers to use more
convenient shear reinforcement such as shear studs, or single leg ties. This is based on a
considerable volume of research conducted in the last three decades (Polak, El-Salakawy &
Hammill 2005).
With the significant increase in the use of post-tensioning in the construction of concrete floors
in Australia, it has become crucial to better understand the effect of prestressing on the punching
shear strength of slabs. Currently, AS 3600-2009 recognises the contribution of post-tensioning
in increasing the punching shear strength of floors by adding thirty percent of the average pre-
compression stress in the floor to the concrete component of punching shear equation. Issues
such as the effect of the post-tensioning tendon profile in the vicinity of the column on the
punching shear resistance of concrete floors, and effects of upward force resultant from

5
inclination of tendons are neglected by AS 3600-2009. More recently, some promising
mechanical methods such as decompression methods have become available in the literature to
calculate the strength of prestressed flat plates with better accuracy as compared to the current
standards’ approaches.
Considering the gap between the Australian Standard and other international standards, and the
difficulties facing AS 3600-2009 users, there is an urgent need to review and improve the
provisions of the Australian Standard for punching shear.
1.2 Aim and Objectives
The main aim of this research project is to propose a method to calculate the concentric
punching shear strength of flat plates with more accuracy as compared to the provisions of AS
3600-2009. This method should be based on a mechanical model, valid for a wide range of flat
plates and simple to use. The following objectives are covered in this project:
1. Review available mechanical methods and semi-empirical methods for concentric
punching shear strength of flat plates.
2. Propose a formula to calculate the punching shear strength of reinforced concrete flat
plates for the case of concentric punching.
3. Extend the proposed method for the case of prestressed slabs.
4. Review guidelines for detailing of shear reinforcements, and provide a method to
calculate the ultimate strength of flat plates strengthened with shear reinforcements such
as shear studs, stud rails and stirrups.
1.3 Thesis Organisation
Chapter One provides a brief background to the punching shear phenomenon and the problem
with the current Australian Standard, followed by objectives and the thesis layout.
Chapter Two is a review of the literature. Some of the influential and illustrative methods are
discussed. Different approaches by internationally recognised standards are presented.
In Chapter Three, the basis of a model developed previously by other researchers, was used to
propose a formula to calculate the punching shear strength of flat plates. Further, the accuracy
of some of the internationally recognised standards in predicting punching shear strength of flat
plates was evaluated against reported experimental results in the literature.
In Chapter Four, the proposed formula for non prestressed flat plates extended for the case of
prestressed flat plates, and provisions of various standards were assessed by some of the
available test results in the literature.

6
In Chapter Five, guidelines are provided for detailing and strength considerations of flat plates
with shear reinforcements.
Chapter Six presents the conclusions from the current research project.

7
Chapter Two
2 LITERATURE REVIEW
2.1 Introduction
In the last five decades a significant amount of research has been conducted on the topic of
punching shear in concrete floors. Many analytical and empirical methods have been proposed
based on the observations and results gathered during experimental tests. It is not possible to
cover all of the previous work on punching shear of concrete slabs herein. Therefore, in this
chapter, some of the methods which may be considered as main contributors to the current state
of knowledge on the punching shear phenomenon are presented. Other aspects of this type of
failure such as punching shear in prestressed slabs, and slabs strengthened by shear
reinforcement are reviewed briefly. Finally, the provisions of the current Australian Standard
for Concrete Structures (AS 3600 2009) and some of the internationally recognised standards
such as American code (ACI 318-05 2005), New Zealand standard (New Zealand Standard NZS
3101:Part 1 2006), European code (Eurocode 2 2004), British standard (BS 8110-97 1997), and
German standard (DIN 1045-1 2001) are presented.
2.2 Reported Observations from Concentric Punching Shear Failure of
Test Specimens
Punching shear failures, as explained in the literature, are local failures around the column or
the stub of test specimens. As reported in Kinnunen and Nylander (1960), the tangential and
radial strains of slab test specimens were measured in their test series, and it was observed that
the strains in the tangential direction are higher than the strains in the radial direction which
resulted in the formation of radial cracks prior to tangential or circumferential cracks. These
two types of cracks are shown in Figure 2.1 for clarity.

8
Figure 2.1 Tangential and radial cracks observed in typical punching shear test specimen (Sherif
1996)
As stated in (Regan 1981), generally the inclined radial cracks initiate at 1/2 to 2/3 of the
ultimate load which causes the punching failure. After the formation of inclined radial cracks,
the condition of the slab is entirely stable and it can undergo loading and reloading. As the load
increases some tangential cracks appear around the column. One of the tangential cracks will
eventually become the cone shaped surface of failure (Sherif 1996).
Figure 2.2 shows the applied load versus the deflection of test specimens reported in (Menétrey
1998). It illustrates the difference between the ductility of slabs that failed by punching
phenomenon and slabs that failed in flexure. From the sudden drop in the load-deflection graph,
it can be depicted that punching failure is a sudden failure with little warning, whereas the
specimens that failed by flexure behaved in a ductile manner before their failure.
Figure 2.2 Comparison of deflection-load graph for slab test specimens failed by punching shear to
slab test specimens failed in flexure (Menétrey 1998)
Flexural failure
Punching failure

9
2.3 Mechanical Models for Punching Shear – Balanced Condition
2.3.1 Kinnuen and Nylander Approach
Based on observations of 61 circular slab specimens, Kinnuen and Nylander (1960) proposed a
mechanical model for the punching shear of slabs with circular -ring shaped- reinforcement.
They presented a structural system for the slab-column connection as shown in Figure 2.3. In
their model, the slab is divided into a compressed conical shell and rigid elements. The
compressed conical shell part is surrounded by the shear crack, and the rigid elements are
confined at the front by a tangential crack and at the sides by the radial cracks as seen in Figure
2.3(b). The rigid elements are supported by conical compressive struts around the column as
shown in Figure 2.3(c). Under load action and after the formation of tangential and radial
cracks, the rigid segments of the slab turn around their centre of rotation at the root of the shear
crack. The failure is assumed to occur when the compressive stress in the strut and the
tangential strains at the point located under the centre of rotation reach their critical values.
Assuming that the two failure criteria coincide, the depth of the neutral axis was calculated by
iteration (Sherif 1996). The critical values for the failure criteria were calibrated based on
results of experimental tests reported by (Elstner & Hognestand 1956) and (Kinnunen &
Nylander 1960). These values were different to the well known values of strain and stress for
concrete at the ultimate stage. A major drawback of this method is the complexity and iterative
procedure of calculating punching shear strength as compared to the other methods (Megally
1998).
Figure 2.3 Mechanical model of Kinnunen and Nylander as shown in fib (2001)
Compressed conical shell
Rigid element Shear crack

10
Kinnunen (1963) further developed the previous model to include slabs with orthogonal
reinforcement. Three equations were derived from the equilibrium condition for the rigid
sector. Equation 2-1 was the result of moment equilibrium. Equation 2-2 was gained from the
equilibrium of forces in radial direction, and Equation 2-3 was derived from the equilibrium of
forces in the vertical direction.
� � ��� � � � � sin � ��� � �� � � cos � �� � �� � 2� �� �� � � �� � 0 (2-1)
� cos � � 2� �� � 2� � � 2� �� !" � 0 (2-2)
� �1 � �� � � sin � (2-3)
Where P is the force causing failure, c is the diameter of test specimen, h is the effective depth
of slab, T is the compressive force in the strut around the column, κR1, R2 are the forces in
reinforcement crossing the shear crack in the tangential, and radial directions respectively, R4 is
the force resultant from the concrete compression zone as shown in Figure 2.3(b), ∆$ is the
angle of the rigid segment slice as shown in Figure 2.3(b), α is the angle between the
compressive strut and slab, y is the height of the compressive strut, λy is the distance of R4 to the
bottom of slab, B is the diameter of the stub, z1 as shown in the Figure 2.3(c), and γ is equal to
(M+D)/P, in which M is the vertical resultant of the membrane force in the reinforcement, D is
the force from the dowel-effect of reinforcement crossing the crack.
This model involves an iterative procedure to predict the punching load. First a value for (y/h)
should be assumed. Having (y/h), α can be calculated from geometry, and substituted in
Equation 2-1, 2-2, and 2-3. Punching load is the convergent value of P from above equations.
2.3.1.1 Shehata and Regan’s model
Shehata and Regan (1989) proposed a mechanical model in which the slab is divided into rigid
segments, surrounded by radial cracks on the sides and tangential cracks at the front and the
back, as shown in Figure 2.4 (b). The reinforcement crossing the circumferential crack was
assumed to reach yield prior to the failure of slab. After yield, the rigid segments are detached
from the central conical part of the slab and turn around the centre of rotation (CR), shown in
the Figure 2.4(a). Three criteria are defined for the failure:
• Inclination of the compressive force reaching 20° from the plane of the slab.
• Radial compressive strains at the face of column reaching 0.0035.
• Tangential compressive strains at a distance equal to the depth of neutral axis from the
face of column reaching 0.0035.

11
To simplify the above approach, Shehata (1990) derived a simplified formula to calculate the
punching strength of concrete slabs as expressed in Equation 2-4.
%&' � 2 � (& ) *� +�, -.*10° �500/2�/3 (2-4)
Where ro, x, and d are shown in Figure 2.4, and nc=1.4(2d/r0)0.5 is the stress concentration factor
which takes into account the effect of the multi-axial stress condition on the concrete strength.
Shehata suggested a simplified formula to calculate the depth of the neutral axis -x- which will
be presented in detail in Chapter Three (Equation 3-8).
Figure 2.4 Punching shear failure model proposed by Shehata and Regan (Shehata 1990)
2.3.1.2 Broms’ model
Broms (1990) used a similar approach as Kinnuen and Nylander (1960) in which he assumed
that the punching failure occurs when the tangential strain, or the compressive stress in the
radial direction reaches its critical values. Unlike Kinnunen and Nylander (1960) who
calibrated the aforementioned critical values by using experimental results, Broms suggested
Rigid segment

12
limitations for the strains and stresses using generally recognised properties of concrete.
Another significant difference of Broms’ method as compared to Kinnuen and Nylander (1960)
is that two types of compression zones were considered, namely the tangential compression
zone and the radial compression zone.
The limitation for high tangential compression strain is expressed in Equation 2-5.
4�5' � 0.0008�150/�)5'�8.33�25/+�,�8.33 f’c in (MPa), and xpu in (mm) (2-5)
Where xpu (mm) is the depth of the compression zone in the tangential direction, εcpu is the
tangential strain in the outermost fibre of concrete at the edge of the column and αxpu is the
height of the equivalent rectangular stress block with the stress equal to fc’. The punching force
Vε for this criterion can be obtained by the use of classical bending theory assuming εcpu as the
critical strain in the concrete. This is the punching shear load calculated using equilibrium and
Bernoulli’s compatibility conditions.
The other criterion for punching shear failure is the radial compression failure. Broms (1990)
assumed the formation of an imaginary strut around the column to transfer the applied load to
the column as shown in Figure 2.5. Broms assumed the inclination of the shear crack as 30°,
the inclination of the concrete strut as 15° and the compressive strength of the strut as 1.1 fc’ to
account for the effect of the multi-axial state of stress on the strut. Equation 2-6 was proposed
by Broms to calculate the punching load for this criterion.
Figure 2.5 Radial compression stress failure proposed by Broms (1990) as shown in fib (2001)
%σ � ��9 � 2�/-.*30°� ��;<*15°/;<*30°� 1.1+�,�150/0.5��8.333;<*15° (2-6)
Where D is the diameter of column, y is the depth of the neutral axis in the radial direction. For
the case of slabs supported on square columns with column side dimension a, D is equal to
4a/p.
Vσ

13
Equation 2-7 is suggested by Broms to calculate the depth of the compression zone in the radial
direction.
� � =>*?@A1 � 2/=>*? � 1B2 (2-7)
Where n is the ratio of elastic modulus of steel to elastic modulus of concrete n=Es/Ec, ρ is the
ratio of tensile reinforcement, d is the effective depth of section, and
kρ=(0.5D+d/tan30°)/(0.5D+y/tan30
°).
The lesser of punching shear capacities obtained from the above criteria (Vε and Vσ) is the
ultimate capacity of the slab.
Recently, Broms (2009) improved the latter model by modifying the critical tangential strain
(Equation 2.5) to the following expression.
4�5' � 0.001�150/)5'�/3�25/+�,�8. f’c in (MPa), and xpu in (mm) (2-8)
He also proposed the depth of compression zone to be calculated in the elastic condition as
shown in Equation 2-9.
)5' � *?@A1 � 2/*? � 1B2 (2-9)
Where n is the ratio of modulus of elasticity of steel to Ec10 the secant modulus elasticity of
concrete for the strain of 0.001.
Broms (2005) suggested Equation 2-10 to calculate Ec10.
C�8 � �1 � 0.6�1 � +�′/150���C�8 f’c in (MPa) (2-10)
Where Ec0 is the modulus of elasticity for concrete at zero strain which can be calculated by
Equation 2-11 as given in Model Code 90 (Model Code 90 1993).
C�8 � 21500�+�,/10�/3 f’c in (MPa) (2-11)
The punching shear strength based on the strain criterion, Vε, can be calculated from Equation 2-
12.
%E � FE GH� IJ�K/L�MN�L/K�O (2-12)
Where l is the diameter of the test specimen or the distance between points of contra-flexure in
the slab, D is the diameter of the column, and mε is the bending moment at the edge of slab-
column connection which can be calculated as following.

14
FE � ? CP 4P 2� =' �1 � )5'/32� (2-13)
In Equation 2-13, ku=(fsy/εsEs)0.2
<1.0, fsy is the yield stress of the flexural reinforcement, and εs is
the strain in the tensile reinforcement assuming elastic condition and can be calculated by
Equation 2-14.
4P � 4�5'�2 � )5'�/)5' (2-14)
Where εcpu can be calculated from Equation 2-8.
Broms also suggested an upper bound for the strength of the slab by considering the flexural
strength of the slab. This can be calculated from yield line theory as given in Equation 2-15.
%Q� � FQ �HN�L/K� (2-15)
Where my=ρ fsy d2 (1-0.59 ρ fsy/fc
’)
In the case of slabs with square columns, the column was replaced by a fictitious circular
column which gives a similar bending moment at the edge of slab-column connection D=3ap/8,
where a is the side dimension of the column.
A different εcpu was used in Broms (2005) and Broms (2009) compared to εcpu in Broms (1991) -
Equation 2-8 and 2-5 - which resulted in Vσ being less likely to govern the design. Broms
(2005) states that Vσ governing only when the thickness of the slab is large in relation to the
column dimension. This is less likely in design of flat slabs and more of the case for design of
footings.
Broms (2009) adopted the lesser of Vε from Equation 2-12 and Vy2 as the punching shear
strength of the slab.
2.3.1.3 Strut-and-tie model by Marzouk and Tiller
Tiller (1995) proposed a method in which only the radial compressive stress failure mechanism
is taken into account. The hypothetical critical concrete strut is shown in Figure 2.6. Tiller
suggested Equation 2-16 to calculate the ultimate punching shear strength of slabs.
%σ � � �9 � �QRSTU VQPWT�XOPWTU Y +��ZS[;< * �U� \ ;<�]+.�-^( (2-16)
Tiller simplified the depth of neutral axis to y=ρfsy/0.6f’c and used the formula given in
Canadian Standard CSA A23.3 for the strength of the concrete strut as expressed in Equation 2-
17. As a slab size factor, Tiller used (500/h)0.35 for concrete strength less than 40MPa and

15
(250/h)0.35 for concrete strength more than 40MPa. The angle between the crack and the plane of
the slab was assumed to be equal to 30°.
+��ZS[ � +�,/�0.8 � 1704� ` 0.85+�, (2-17)
Where fc2max is the compressive strength of the concrete strut, ε1 is the principal tensile strain in
the cracked concrete. Tiller (1995) did not specify how to calculate ε1.
Figure 2.6 Radial compression stress failure mechanism as shown in Marzouk, Rizk and Tiller
(2010)
Marzouk, Rizk and Tiller (2010) improved the latter method by using Equation 2-18 to calculate
the depth of the compression zone.
� � 0.67�*?a�8.b�35/+�,�8.b2 f’c in (MPa) (2-18)
Where n is the ratio of modulus of elasticity of steel to modulus of elasticity of concrete, ρe is
the ratio of reinforcement for a basic yield strength (500MPa) and can be calculated as ρe=
ρ(fsy/500)§0.02 where ρ is the ratio of reinforcement and fsy is the yield strength of the tensile
reinforcement. Also they suggested a range for the angle of the critical crack (θ) depending on
the thickness of the slab i.e. 25°-35° for slabs less than 250mm thick, 35°-45° for slabs 250mm-
500mm thick and 45°-60° for slabs thicker than 500mm.
2.3.2 Truss Model by Alexander and Simmonds
Alexander and Simmonds (1987) approached the punching shear phenomenon by proposing
formation of a three dimensional truss around the column. The components of the truss are
shown in Figure 2.7. The truss is broken down into the flexural tensile reinforcement acting as
ties, and the compression concrete zones acting as struts. As shown in Figure 2.7, two types of
struts are assumed, shear struts and anchoring struts. The shear struts are assumed to have an

16
angle of α to the plane of slab, and transfer shear forces from the slab to the column. The
anchoring struts are parallel to the plane of the slab and provide anchorage for the adjacent
reinforcement outside the column to transfer bending moment to the column as shown in Figure
2.7. The tensile reinforcements passing through the column plus a fraction of the tensile
reinforcement passing through a distance less than the effective depth of the slab from the side
faces of the column is considered to act in transferring shear forces to the column. It was
assumed that the reinforcement passing through the face of the column is fully effective (ζ=1)
and the reinforcement bar at the distance d from the face of column is not effective (ζ=0). The
effectiveness (ζ) of any reinforcement in between these two points is determined by linear
interpolation.
Figure 2.7 Truss model proposed by Alexander and Simmonds (1987) as shown in Megally (1998)
α the angle between the shear struts and the plane of slab was calibrated using the experimental
results available in the literature. The following expressions were proposed to calculate α.
tan � � 1 � ]N�.�be (2-19)
Where, f � �gahh2,A+�,�/�ijSk+PQ��/2�8.�b� f’c in (MPa), and d in (mm),
Seff= effective tributary width of the reinforcing bar which is equal to the spacing of
reinforcement and less than 6d ’,

17
d ‘ = cover of tensile reinforcing bar,
d= effective depth of slab,
c= dimension of column face,
Abar= area of single reinforcing bar,
fc'=compressive cylinder strength of concrete,
fsy=yield strength of tensile reinforcement steel.
Having α, the punching strength of the slab for concentric load can be calculated from Equation
2-20.
%'& � ∑ ζijSk +PQ -.*� (2-20)
Where ζ is the effectiveness of the tensile reinforcement as explained earlier.
2.3.3 Bond Model by Alexander and Simmonds
Alexander and Simmonds modified and developed their “Truss model” to the so called “Bond
model”. By monitoring the strains of the test specimens reported in (Alexander 1990),
Alexander and Simmonds (1992) suggested the shear struts are arch shaped as shown in Figure
2.8, and the geometry of the shear arch cannot be obtained by the amount of tensile
reinforcement. This is in contrast with the assumptions of the shear struts in the Truss model.
Figure 2.8 Curved compression strut (Alexander & Simmonds 1992)

18
Instead, they proposed a Bond model in which the slab is composed of four radial strips and
four quadrant slabs as shown in Figure 2.9. The assumptions of this model are:
• All the loads are transferred to the column through the radial strips, and the quadrants
components of the slab transfer the loads to the side faces of the radial strips.
• The total load on each strip is 2w and w is the ultimate internal shear that can be
resisted by the slab on each side face of the strip.
• The strength of the radial strips is limited by the flexural strength of the strip Ms.
Ms is the sum of the flexural strengths of the slab at the ends of the strip- Mneg and Mpos.
According to (Alexander 1999) Ms can be approximated by Equation (2.21).
mP � mTan � m5&P o 0.9.2��?Tan � ?5&P�+PQ (2.21)
Where a is the width of the strip -side dimension of column-, ρneg is the ratio of top
reinforcement at the column end of the strip and ρpos is the ratio of bottom reinforcement at
the shear zero end of the strip.
Figure 2.9 Plan view of slab and the components of Bond model proposed by Alexander and
Simmonds (1992)
A free body diagram of the radial strip is shown in Figure 2.10. If l is the length of applied
uniform distributed load then from equilibrium, Ms=wl2 and the maximum load Ps carried by a
strip is given by Equation 2-22.

19
�P � 2qr � 2AmPq (2-22)
Where w is the one-way shear strength of concrete from ACI 318 as expressed in Equation 2-23.
q � 0.166A+�, 2 f’c in (MPa),d in (mm), and w in N/mm (2-23)
Finally, the punching shear strength of the slab can be gained from the following Equation 2-24.
%'& � 4�P � 8tmP�0.166A+�, 2� (2-24)
Figure 2.10 Free body diagram of radial strip (Alexander & Simmonds 1992)
2.3.4 Models Based on the Failure of Concrete in Tension
Some researchers explained the punching shear phenomenon by the failure of concrete ties in
the vicinity of the column. Models by Georgopolous and Menetrey are among the models
which consider the tensile strength of concrete ties to govern the punching shear capacity of the
slab as cited in fib (2001).
2.3.4.1 Georgopoulos approach
The review of this method is based on fib (2001) as the original paper is not in English.
Georgopoulos assumed the transfer of shear from the slab to the column relies on the principal
tensile stresses in the concrete and the compression in the concrete strut around the column. He
suggested that 75 percent of the shear force transfers through the tensile strength of concrete and
the remaining 25 percent through the compressive strut. Details of the proposed model are
shown in Figure 2.11.

20
Figure 2.11 Punching shear model by Georgopoulos as shown in fib (2001)
The depth of compression zone was assumed to be 0.2 of the effective depth of the slab. The
stress distribution in the expected punching failure surface was assumed to be a polynomial of
third order as shown in Figure 2.12.
Figure 2.12 Distribution of concrete tensile stresses in Georgopoulos as shown in fib (2001)
As shown in Figure 2.11, Zb is the resultant tensile force in the cracked section. Georgopoulos
estimated Zb by integration of the stresses along the surface of failure. Consequently, he
proposed the following equation to calculate the punching strength of slabs.
%'& � uj cos � /0.75 � [email protected]�+�'ja��/3B2� cot � ��/2 � 0.2 � 0.35 cot α� (2-25)
Where α is the inclination of the failure surface, λ is the ratio of the diameter of the column to
the effective depth of the slab, fcube is the compressive strength of concrete of a cube test
specimen in MPa.
Georgopoulos suggested the following equation to predict the inclination of the critical crack
causing punching failure.
tan � � 0.56+�'ja/?+PQ � 0.3 (2-26)
Where ρ is the tensile reinforcement ratio.

21
2.3.4.2 Model by Menétrey
Menétrey (1996, 2002) assumed a strut-and-tie pattern which transfers the load from its point of
application to the column. He considered the failure to occur when the strength of the tie,
adjacent to the column, reaches the failure limit. The contributors to tensile strength of the tie
are shown in Figure 2.13.
Figure 2.13 Schematic view of components of proposed method by Menetrey (2002)
In this method, Menetrey included the tensile capacity of the concrete, the effect of dowel action
of the flexural reinforcement, the strength of the shear reinforcement and the vertical component
of the prestressing force. Equation 2-27 is suggested to calculate the ultimate punching shear
strength of a given slab.
%'& � w�R � wx&y � wPy � w5 (2-27)
Where, Fct is the vertical component of the concrete tensile strength of the hypothetical tie
shown in Figure 2.13, Fdow is the dowel-effect contribution from the flexural reinforcement
crossing the punching crack, Fsw is the contribution from shear reinforcement if there is any,
and Fp is the contribution of vertical component of forces of prestressing tendons crossing the
punching crack.

22
Fct can be calculated by Equation 2-28,
w�R � ��( � (��;+R�/3z{| (2-28)
Where rs is the radius of the column, r1=rs+d/10tan30°, r2=rs+d/tan30
°, s is the length of the
punching shear crack and is equal to √ ((r2-r1)2+(0.9d)
2), ft is the uniaxial tensile strength of the
concrete, ξ is a factor to take into account the influence of the flexural reinforcement ratio -ρ-
and can be calculated by the following expression.
ξ=min(0.87, -0.1ρ2+0.46ρ+0.35)
η and µ take into account the size effect on the tensile strength of the concrete and are
expressed as followings.
η=min(0.625, 0.1(h/rs)2+0.5(h/rs)+1.25)
µ=1.6(1+d/da)-0.5
Where h is the thickness of slab, and da is the maximum aggregate size in concrete.
The contribution of the dowel-effect Fdow is the summation of dowel-effect of each reinforcing
bar crossing the failure surface and can be calculated by the following expression.
wx&y � 1/2 ∑ }P�t+�+PQ�1 � ζ�� ;<*30° (2-29)
Where Øs is the diameter of the flexural reinforcement crossing the punching shear critical
crack, fc is the uniaxial compressive strength of the concrete, fsy is the yield stress of the
reinforcing bars, ζ=σs/fsy, and σs is the stress in the tensile reinforcement at punching which can
be quantified by the following equation.
~P � %'&/�-.* 30° ∑ iP� (2-30)
Where ∑ iP is the area of reinforcing bars crossing the punching shear failure surface.
It should be noted for calculating σs that the punching strength of the slab is needed, so the
calculation of punching shear strength is an iterative procedure in this method.
If adequate anchorage is provided, Fsw can be calculated by Equation 2-31.
wPy � iPy+Py sin �Py (2-31)
Where Asw is the area of the shear reinforcement intersecting with the punching shear crack, fsw
is the yield strength of the shear reinforcement steel, and βsw is the angle between the shear
reinforcement and the plane of the slab.

23
The contribution of prestressing Fp is given as following expression.
w5 � i5~5 sin �5 (2-32)
Where Ap is the area of prestressing steel crossing the failure surface, σp is the stress in the
tendons, and βp is the inclination of the tendon with the plane of slab as shown in Figure 2.13.
2.3.4.3 Theodorakopoulos and Swamy approach
Theodorakopoulos and Swamy (2002) proposed a method for representing the punching shear
phenomenon by considering a criterion for the tensile strength of the compression zone in the
vicinity of the column. The punching shear strength was related to the tensile strength of the
compressed concrete around the column. It was assumed that there are two types of neutral
axes adjacent to the column, namely flexural and shear. The location of the flexural neutral axis
was calculated assuming the ultimate stage in flexure and the location of the shear neutral axis
was assumed to be 0.25 of the effective depth of the slab. Equation 2-33 was suggested to
calculate the mean of the depth of the neutral axes. This will be explained further in Chapter
Three.
2T � 2�h�P/��P � �h� (2-33)
In Equation 2-33, Xf is the depth of the flexural neutral axis and Xs is the depth of the shear
neutral axis.
As show in Figure 2.14, the ultimate punching strength of slab -Vu- consists of the contribution
of the tensile strength of the compression zone, Vc , and the contribution of the dowel-effect of
flexural reinforcement.
Figure 2.14 Schematic view of model by Theodorakopoulos and Swamy (2002)
dn
Vu

24
For simplicity, Theodorakopoulos and Swamy incorporated a larger control perimeter as
compared to the perimeter of the compression zone around the column to account for the dowel-
effect action. A control perimeter, similar to BS 8110-97 (1997), was adopted in this method as
expressed in Equation 2-34.
�5 � 4. � 122 (2-34)
Where a is the side dimension of the column and d is the effective depth of the slab.
The ultimate punching shear strength of the slab was expressed as the following equation.
%'& � 2T �5 cot � +�R (2-35)
Where fct is the splitting strength of concrete, equal to 0.27(fcube)2/3
, and q was taken as 30°, dn is
calculated by Equation 2-33, and bp is calculated by Equation 2-34.
2.3.5 Plasticity Approach
Braestrup et al. (1976) proposed an upper bound model on the basis of the theory of plasticity
for punching shear phenomenon. Geometrical parameters of the model are shown in Figure
2.15. In this model, it was assumed that the vertical load V was applied to the slab by the
column with the diameter of d. The maximum diameter of punching shear failure surface is d1.
The punching failure surface was assumed to shape as curve A-B-E, shown in Figure 2.15. The
curve of the failure surface is expressed as r=r(x), and the angle of displacement vector is
expressed as α=α(x).
The work done by the punching force (Wv) should be equal to the dissipated energy (We) at the
punching shear crack surface. Equation 2-36 was suggested to express the dissipated energy
and Equation 2-37 was suggested to express the work done by the applied load.
Figure 2.15 Plasticity model proposed by Braestrup et al. (1976)

25
�a � � 0.5 � +�, �� � | ;<* � �2� ( x[�&P ��8 (2-36)
�� � %� (2-37)
Where δ is the displacement, λ=1-fct/fc’(k-1), µ=1-fct/fc
’(k+1), k=(1+sinφ)/(1-sinφ), fct is the
tensile strength of concrete, and φ is the friction angle of concrete as shown in Figure 2.15.
The above equations will give an upper bound punching shear strength of the slab. By
optimisation, Braestrup et al. (1976) suggested the failure surface consists of a linear conical
part (A-B) and a curved part (B-E). Thus the ultimate punching strength is the sum of P1 which
takes into account the straight line part (A-B) as expressed in Equation 2-39 and P2 which takes
into account the curved part as expressed in Equation 2-40.
%'& � � � �� (2-38)
� � � +�, ��� �x ��� "M�� ��J "��N��J "��&PO " (2-39)
�� � 0.5 � +�, ����� � �8� � � Vx�� t�x�� � � �� � .�Y � | ��x�� � � .��� (2-40)
Where h is the thickness of the slab, h0 is the depth of inclined straight line, a=d/2+h0 tanφ,
b=c tanφ, and c=√(a2-b
2).
One of the common criticisms of this method is that it ignores the effect of tensile reinforcement
on the punching shear strength of slabs.
2.3.6 Flexural Approach
A considerable number of slab test specimens, reported in the literature, have a failure load not
significantly different to their flexural capacity. As a result, some researchers such as Gesund
and Goli (1980), Gesund (1981), and Rankin and Long (1987) assumed the punching shear as a
secondary failure phenomenon and attempted to propose a method which relates the punching
shear strength of slabs to the flexural capacity of the slabs.
In this section, the flexural method proposed in Rankin and Long (1987), is reviewed. Rankin
and Long (1987) suggested that the flexural punching strength of a prototype test specimen can
be calculated from Equation 2-41.
%hKa[ � �=Q � �=Q � =j/(h�mj/mjSK�mj � =j/(h mjSK (2-41)
Where, ky1 is moment factor for overall yielding of tensile reinforcement, and for square slabs
supported on a square column is equal to 8(s/(a-c)-0.172) where a, c, s are shown in Figure
2.16.

26
kb is the ratio of the applied load to the internal bending moment at the column periphery which
is equal to (25/(ln(2.5a/c)1.5
).
rf is a factor to allow for the shape of column which is equal to 1.0 for circular columns and 1.15
for square column.
Mb is the bending moment resistance, and can be calculated by ρfsyd2(1-0.59(ρfsy/fc
’)).
Mbal is the balanced moment of resistance which was suggested to be calculated by 0.333fc’d
2.
Figure 2.16 Failure pattern and parameters of the proposed method by Rankin and Long (1987)
Rankin and Long (1987) also specified a criterion for failure caused by “internal diagonal
tension cracking”. They suggested Equation 2-42 to calculate the latter strength of slabs.
%P�aSk � 1.66A+�, �� � 2�2 �100?�8.�b f’c in (MPa),Vshear in (N), c and d in (mm) (2-42)
The lesser of Vflex and Vshear is the punching shear strength of the slab.
2.3.7 Critical Shear Crack Theory
Muttoni (2008) presented a different failure criterion for punching shear based on the opening of
a critical shear crack in the vicinity of the column. According to Muttoni and Schwarts (1991),
the width of the critical shear crack (wc) is proportional to the product of the rotation of the slab
times the effective depth of slab (yd). Another relevant parameter in view of critical crack
theory is the roughness of the critical shear crack which is related to the size of the aggregates in
the concrete. With the mentioned assumptions and available experimental results, Equation 2-
43 was proposed to calculate the punching strength of concrete slabs.
S a

27
%'& � �82A+�, 8.�bM�b�yx�/�x��Mx��� f’c in (MPa),Vshear in (N),b0, d, dg, and dg0 in (mm)(2-43)
Where b0 is the control perimeter at the distance equal to d/2 from the face of column, dg0 is the
reference aggregate size and considered to be 16mm, and dg is the maximum aggregate size in
the concrete.
Rotation of slab (y) is related to the applied load V as given in Equation 2-44.
y � 1.5 k��x h���� � �������.b (2-44)
Where rs is plastic radius around the column which can be taken as the distance between the
centre of column to the point of contraflexure, and Vflex can be calculated from yield-line theory.
To calculate the punching strength of a given slab, an iterative procedure is required.
Alternatively, the load-rotation curve can be drawn using Equation 2-44 and the failure criterion
can be drawn using Equation 2-43. The intersection of these curves determines the failure load
of the slab (Vuo). The latter procedure is shown in Figure 2.17.
Figure 2.17 Procedure to specify punching shear strength of slab according to Critical Shear Crack
Theory (Muttoni 2008)
2.4 Punching Shear of Prestressed Flat Plates
The present section reviews some of the theoretical approaches to include the effect of
prestressing forces in the calculation of punching shear strength of flat plates. According to
Regan and Braestrup (1985), the available models for punching of prestressed slabs can be
categorised to the following approaches.
Vuo

28
2.4.1 Principal Tensile Stress Approach
In this approach, the effect of prestressing was taken into account by approximation of principal
tensile stresses on the control perimeter, and consideration of the vertical component of the
tendon forces crossing the control perimeter. An example of this approach is Equation 2-45,
suggested by ACI-ASCE Committee 423 (1974), and adopted in ACI 318-05 (2005) code.
%'&/��2� � 0.29A+�, � 0.3 ~�5 � %5/��2� f’c in (MPa) (2-45)
Where u is the length of control perimeter at a distance of d/2 from the face of column, σcp is the
mean effective prestressing stress in the concrete, and Vp is the vertical component of
prestressing tendons crossing the control perimeter.
2.4.2 Equivalent Reinforcement Ratio Approach
In this approach, the effect of prestressing is considered by adding the equivalent reinforcement
ratio to the actual reinforcement ratio of the slab. The sum of the ordinary reinforcement and
the equivalent reinforcement is used in the formula, which predicts the punching strength of the
slab. There are various proposed methods to convert the prestressing stress to the equivalent
reinforcement ratio.
As cited in Sundquist (2005), FIP recommendations (1980) specifies the equivalent
reinforcement ratio by Equation 2-46.
?a� � ~�5/+PQ (2-46)
Another method for calculating equivalent reinforcement ratio proposed by Nylander,
Kinnunen, and Ingvarsson, which is cited in Regan and Braestrup (1985), is given in Equation
2-47.
?a� � ?5 +8.�/�+8.� � ~5a� (2-47)
Where ρp is the prestressing steel ratio, f0.2 is the 0.2% proof stress of the tendons, and σpe is the
effective prestress of the tendons.
Clearly, this approach is not suitable for methods which do not include the effect of the tensile
reinforcement on the punching shear strength of slabs.

29
2.4.3 Decompression Approach
Regan (1985) proposed a decompression method for the punching shear phenomenon. The state
of decompression occurs when compression stress, resulting from prestressing forces, is
cancelled out by the effect of transverse loading at a specific region (Silva, Regan & Melo
2005). In a decompression method for punching shear of slabs, it was assumed the punching
strength after the decompression stage is equal to the strength of a geometrically similar
concrete slab with the same number of reinforcement and no prestressing forces. Thus it is
possible to determine the punching resistance of prestressed slabs by adding the decompression
load to the punching strength of the ordinary concrete slab with the same amount of
reinforcement. The required bending moment for decompression of a given section can be
calculated from Equation 2-48.
m& � ~�5� ��/6 (2-48)
Where σcp* is the compressive stress in the outermost compressive fibre of the section due to
prestressing after losses.
According to Regan and Braestrup (1985) the decompression load can be taken as following.
%& � 2� m& for circular slabs
%& � 4�/r m& for rectangular slabs with breadth b, and main span l.
In Regan and Braestrup (1985), the punching shear strength of concrete slabs with no
prestressing was suggested to be calculated from the draft of British code CP 110 as following.
%'& � 0.27A500/2 A100?+�'ja¡ fcube in (MPa), d in (mm) (2-49)
Where ρ in Equation 2-49 is the sum of ordinary reinforcement area (Asr) and bonded
prestressing steel area (Asp).
? � �iPk � iP5�/�2 (2-50)
Where b is the breadth of the section and d is the equivalent effective depth of the steel and can
be calculated as expressed in Equation 2-51.
2 � �iPk +PQ 2k � iP5 +8.� 25�/�iPk +PQ � iP5 +8.�� (2-51)
Where f0.2 is the 0.2% proof stress of the prestressing steel, fsy is the yield strength of ordinary
reinforcement, dp is the effective depth of prestressing steel, and dr is the effective depth of
ordinary reinforcement.

30
2.5 Methods to Increase Punching Shear Strength of Concrete Slabs
In Polak, El-Salakawy and Hammill (2005), three common methods to increase the punching
shear strength of concrete slabs are categorised as followings:
• Expanding the area which transfers shear stresses from slab to column. In this method
designers normally increase the thickness of the slab in the vicinity of column by
introducing drop panels or column capitals. Other possibility is to increase the
dimensions of the column which results in a larger area resisting shear stresses.
• Using concrete with higher compressive strength which results in a higher punching
shear strength.
• Providing different types of shear reinforcement such as shearheads, stirrups, bent-up
bars, or shear studs in the area adjacent to the column.
In a study by Megally and Ghali (2000), four different methods were used to strengthen 150mm
thick slabs. Drop panel, column capital, stirrups (closed-ties) and shear stud rails (SSR). Then
a comparison was made between the performance and amount of increase in punching shear
capacity of slabs. The slabs were loaded to the point of failure, and the load-deflection curve
for each slab was plotted as shown in Figure 2.18. Drop panel and column capital resulted in an
increase of the punching shear strength of the slab but not the ductility of the slab. As shown,
shear studs increased both the strength and ductility of the slab. Further, it was observed in this
case that stirrups only slightly increased the punching shear strength of the test specimen due to
lack of proper anchorage (Megally & Ghali 2000).
Figure 2.18 Load-deflection curves of slabs strengthened by different methods (Megally & Ghali
2000)

31
Although all the aforementioned methods increased the punching shear strength of the tested
slabs, the issue of ductility, which is a desirable behaviour of structures in seismic regions, was
not improved by most of the provided strengthening techniques except for the slab strengthened
with shear studs. Other important considerations to decide the best strengthening method can be
economy, and practicality of the method. Designers prefer the use of shear reinforcement to
increase the punching strength of concrete slabs due to its advantages over the other methods.
In the 70s and 80s a significant amount of research was conducted on the performance of slabs
with shear reinforcement and consequently design provisions were introduced into design
codes.
2.6 Shear Reinforcement for Flat Plates
As mentioned, different types of shear reinforcement were proposed by structural engineers to
increase strength and ductility of concrete slabs. The role of shear reinforcement in the slab is
mainly to arrest the opening of the critical shear crack, increase the compression zone and
aggregate interlock which result in increase of shear strength.
In design, the radial spacing and placement of shear reinforcement is very important, and
designers should detail the position of shear reinforcement in a way that they intersect with the
inclined shear cracks. In addition, desirable types of shear reinforcement should have a good
tensile capacity, adequate ductility and enough anchorage (Polak, El-Salakawy & Hammill
2005). Providing that the shear reinforcements are placed and designed properly, it can increase
the punching shear and rotation capacity of the slab significantly. Preferably, punching shear
strength of slabs should be increased to the extent that the flexural failure occurs prior to the
punching shear failure. Generally, there are two categories of shear reinforcement for punching
shear, namely shear reinforcement for construction of new slabs and shear reinforcement for
retrofit of existing slabs.
2.6.1 Shear Reinforcement for Construction of New Slabs
Shear reinforcement for a new slab can be classified as follow (Polak, El-Salakawy & Hammill
2005).
• Shearheads, made of different types of structural steel sections as shown in Figure 2.19.
• Stirrups, single or double leg bar, bent bars, and closed-ties. This type of shear
reinforcement is made from the normal reinforcing bars as shown in Figure 2.20.
• Stud rails, shear studs, and shear bolts which are called headed shear reinforcements as
shown in Figure 2.21.

32
• Other new shear reinforcements such as shear bands, and UFO as shown in Figure 2.22
and Figure 2.23.
Figure 2.19 shows two types of fabricated shearheads which are made of channel or I
sections welded in a shape which can be fitted orthogonally at the slab-column connection.
The shear head is one of the earliest types of shear reinforcement which was used to
increase the punching shear strength of slabs. It acts as a steel frame which is hidden inside
the concrete slab. Shearheads increases ductility, shear strength and flexural strength of the
connection.
Figure 2.19 Shearhead reinforcement (Corley & Hawkins 1968)
There are several disadvantages with this type of shear reinforcement which makes it very
undesirable in industry such as the labourer intensive fabrication procedure, bulky dimensions
and interference with the longitudinal reinforcement of the slab.
Closed-ties and stirrups are common in beam sections and they are proven to increase the
punching shear capacity of slabs providing that the vertical legs of stirrups have a good
anchorage. These types of shear reinforcement are shown in Figure 2.20. As shown, the shear
reinforcement should engage the flexural bars at top and bottom to achieve a proper anchorage
(Polak, El-Salakawy & Hammill 2005). In some experimental tests, it was observed that some
of closed-ties did not reach their full yield capacity due to slip and lack of anchorage. Slabs
with smaller thicknesses are more prone to this phenomenon (Polak, El-Salakawy & Hammill
2005).
Bent bars are normal longitudinal bars which are bent and placed to intersect with the critical
shear crack as shown in Figure 2.20(a). The performance of this type of shear reinforcement
relies on its horizontal anchorages, so the horizontal part of bent bars should be long enough to
resist the pull out effect for adequate anchorage.

33
(a) (b)
(c) (d)
Figure 2.20 (a) Bent bar, (b) Single-leg stirrup , (c) Multiple-leg stirrup (d) Closed-stirrup or
Closed-tie (ACI 318-05 2005 ; Broms 2007)
The headed studs were presented in Dilger and Ghali (1981) for the first time. Since it is a very
convenient and practical type of shear reinforcement, extensive research has been conducted on
the performance of slabs strengthened with headed shear studs. In this type of shear
reinforcement, the problem of anchorage has been solved by providing large flat heads at the
both ends with the area of 10 times the stem cross-sectional area. This shear reinforcement is
available in the form of shear stud rails (SSR) in the market as shown in Figure 2.21. SSR are
easy to install, and adequate anchorage is achievable in relatively thin slabs. Most of the tests
on slabs strengthened with headed shear studs, show a ductile and satisfactory performance
(Polak, El-Salakawy & Hammill 2005), and consequently, this type of reinforcement has been
adopted by most of internationally recognised standards as an effective shear reinforcement for
slabs.
Figure 2.21 Headed shear studs (Bu 2008)

34
In recent years, other types of shear reinforcement for punching shear have been made available
in the marketplace such as Shearbands, UFOs, and lattice.
Shearbands were tested in the University of Sheffield and reported in Pilakoutas and Li (2003).
These are high ductile thin steel strips with punched holes as shown in Figure 2.22(a). The
holes are provided to increase the anchorage of strips as experimentally proven. These strips are
easily bent and shaped to place in a way to cross the shear cracks as shown in Figure 2.22(b). A
significant improvement in the ductility and strength of slabs was observed in the test specimens
reinforced with this type of shear reinforcement (Pilakoutas & Li 2003).
(a)
(b)
Figure 2.22 (a) Plan view of a shearband (b) Shearbands placed in slab (Pilakoutas & Li 2003)
UFOs are steel plates which are shaped like a cone and placed at the slab-column connection to
intersect with the critical shear crack. There are some perforated holes to allow for the
continuation of column reinforcements. This shear reinforcement is shown in Figure 2.23.
Figure 2.23 UFO shear reinforcement (Alander 2004)

35
A lattice is made of top, bottom, and web bars which are welded and prefabricated in the factory
as shown in Figure 2.24. Lattice performance as a punching shear reinforcement was first
reported in Park et al. (2007). According to the experimental observations, the strength and
ductility of the test specimens reinforced with these were increased up to 1.4, and 9.2 times
respectively as compared to the specimen with no shear reinforcement (Park et al. 2007).
Another advantage of this system is that even after failure, due to truss action of lattice system,
it can avoid sudden failure of the slab.
Figure 2.24 Lattice shear reinforcement (Park et al. 2007)
2.6.2 Shear Reinforcement for Retrofit of Slabs
Punching shear strength of existing concrete slabs may need to be increased due to the corrosion
of rebars, change in the amount of imposed load, or errors in the structural design. There are
different methods to increase the punching capacity of an existing concrete slab such as
providing external shearheads around the column, using steel plates around the column, and
providing shear bolts in the vicinity of a column (Polak, El-Salakawy & Hammill 2005). Use of
external I sections, bonded with epoxy, to increase punching shear strength of slab-column
connection was reported satisfactory in terms of strength and ductility (Polak, El-Salakawy &
Hammill 2005), but from aesthetic point of view it is not desirable. Ebead and Marzouk (2002)
used steel plates fitted around the column which are bonded to the slab with epoxy and steel
bolts as shown in Figure 2.25. An increase in the strength and ductility of test specimens
strengthen with this technique was reported in Ebead and Marzouk (2002).

36
Figure 2.25 Test specimen strengthened by steel plates (Ebead & Marzouk 2002)
Strengthening technique with shear bolts were studied by Adetifa and Polak (2005), Bu and
Polak (2009), El-Salakawy, Polak and Soudki (2003). Shear bolts are normal strength steel with
a smooth stem, forged head, large washers and threaded end as shown in Figure 2.26 (a). A
concrete slab strengthened by shear bolts is shown in Figure 2.26 (b).
(a)
(b)
Figure 2.26 (a) Shear bolt, (b) concrete slab strengthened with shear bolts (Bu 2008)

37
2.7 Control Perimeter Approach and Building Code Provisions
Traditionally, structural members such as beams or columns are checked for shear strength by
the concept of nominal shear stress on the section area at a specific distance from the support or
the point where the load is applied. This approach was first proposed by Talbot (1913) for the
case of concrete slabs as cited in (Bu 2008), and Equation 2.52 was suggested to calculate the
applied shear stress on the critical section.
¢� � %/�4�. � 22�£2� (2.52)
Where vc is the applied stress on the concrete which should be less than the nominal shear
stress. a is side dimension of the square column, d is the effective depth of slab, and jd is the
lever arm between compression and tension force which approximated to 0.9d.
Moe (1961) gathered some of available results on the slab specimen tests at the time to propose
an empirical formula for the ultimate allowable stress on the face of column. He proposed the
following formula as cited in (fib 2001).
¢'& � %'&/��&K2 � �1.246�1 � 0.059./2���&K2A+�,�/�1 � 0.436��&K2A+�,/%hKa[� (2-53)
Where vuo is the ultimate shear stress on the concrete around the column face in (MPa), a is the
side dimension of the column in (mm), ucol is the column perimeter in (mm), and Vflex is the
flexural capacity of the slab which can be calculated by yield-line theory in (N).
Based on Moe’s work, ACI-ASCE Committee 326 (1962) proposed Equation 2-54 to calculate
the ultimate shear stress on the critical perimeter u, located at a distance of d/2 from the face of
column.
¢'& � %'&/�2 � 0.33A+�, f’c in (MPa) (2-54)
Since then Equation 2-54 has been used as the basis for many internationally recognised
standards such as ACI-318, CSA 24, NZS 3101, and AS 3600.
2.7.1 Australian Standard AS 3600-2009
According to Clause 9.2.3 of AS 3600 (2009), the ultimate punching shear strength of concrete
slabs Vuo can be calculated using Equation 2-55.
%'& � �2&Z�+�¤ � 0.3~�5� (2-55)
Where dom, is the effective depth of slab, u is the perimeter around the column at a distance
equal to the half of effective depth of slab from the face of column as shown in Figure 2.27, σcp

38
is the average intensity of effective prestress in the vicinity of support in MPa, and fcv is given in
Equation 2-56.
Figure 2.27 Critical perimeter around the column as shown in AS 3600-2009
+�¤ � 0.17�1 � 2/���A+�′ ` 0.34A+�′ f’c in (MPa) (2-56)
In Equation 2-56, βh is the ratio of larger to shorter column sides.
When applied shear force on the critical perimeter is higher than the computed capacity,
calculated by Equation 2-55, AS3600-2009 permits the use of shearheads by which the fcv can
be increased using Equation 2-57.
%'& � �2&Z�0.5A+�′ � 0.3~�5� ` 0.2�2&Z+�′ f’c in (MPa) (2-57)
Unlike other international standards, AS3600-2009 does not provide any guidelines to the
design and detailing of shearhead reinforcement.
According to AS 3600-2009, the design shear strength is calculated as following.
%x � ¥%'& (2-58)
Where f is called capacity factor, and for the case of shear strength should be taken equal to 0.7.
To ensure adequate shear strength of the slab, Clause 9.1.2 of AS 3600-2009 requires 25% of
the negative bending moment in the column strip and half of the middle strip to be resisted by
the reinforcement and prestressing tendons that cross over the column and the distance of 2d
from the faces of the column.

39
2.7.2 American Code ACI 318-05
ACI- 318-05 (2005) specifies similar control perimeter around the column as AS 3600-2009.
The ultimate strength of concrete slab is the lesser of following expressions.
%'& � F<* ¦ 0.083��2 � 4/��� A+�, �20.083���P2/� � 2� A+�, �2 0.33�A+�, �2 § f’c in (MPa) (2-59)
Where λ= is a factor to account for the density of concrete and is equal to 1.0 for normal
concrete and 0.8 for low density concrete.
βc= is the ratio of the larger column side to the shorter column side.
αs= is equal to 40, 30 and 20 for interior, edge and corner columns respectively.
fc'= is the compressive strength of concrete in MPa.
For the case of prestressed slabs, Equation 2-60 was adopted by ACI 318-05 to calculate the
ultimate punching shear strength.
%'& � @0.083�5A+�, � 0.3~�5B�2 � %5 (2-60)
Where βp= lesser of (αsd/u+1.5) and 3.5
σcp= is the average intensity of effective prestress on control perimeter in (MPa)
fc'= is the compressive strength of concrete in MPa and should not be taken greater than 35 MPa
Vp is the vertical component of prestressing forces on the critical perimeter.
The design strength is calculated similar to Equation 2-58, where f is considered to be equal to
0.75 according to ACI 318-05.
ACI 318-05 recognises several types of shear reinforcement for strengthening of concrete slabs
such as headed shear studs, single-leg stirrups, double-leg stirrups and closed-ties. If shear
reinforcement is provided, the design punching shear strength is calculated for two regions,
shear strength inside the shear reinforced zone, and shear strength outside the shear reinforced
zone. The arrangement of shear reinforcement is shown in Figure 2.28.

40
Figure 2.28 Shear reinforcement layout suggested by ACI 318-05 as shown in Kamara and Rabbat
(2005)
To calculate the design punching shear strength inside the shear reinforced zone Equation 2-61
is given.
%Px � ¥%� � ¥%P§¥%ZS[ (2-61)
Where, f= 0.75,
%� � 0.17A+�,�2 f’c in (MPa)
%P � iP¤+PQ¤2/;
Asv= is the section area of one row of shear reinforcement around the column
fsyv=is the yield strength of shear reinforcement less than 414 MPa
s= is the spacing of shear between rows of reinforcement as shown in Figure 2.28
%ZS[ � 0.5A+�,�2 f’c in (MPa)
To calculate punching shear strength outside the shear reinforcement zone, Equation 2-62 is
given.
%x&'R � ¥0.17A+�,�&'R2 f’c in (MPa) (2-62)
Where uout is the critical perimeter outside the shear reinforcement zone as shown with the
broken line in Figure 2.28.
The lesser of Equation 2-61 and 2-62 governs the design.

41
2.7.3 New Zealand Standard NZS 3101:2006
The formulae of NZS 3101:2006 for punching shear are the same as formulae of ACI 318-05
except for the slab size effect factor. According to NZS 3101:2006 the contribution of concrete
shear resistance should be reduced by the slab size factor which is given in Equation 2-63. This
factor is effective to reduce the ultimate punching shear strength of slabs thicker than 200mm.
z � 0.5 ` A200/2 ` 1.0 d in (mm) (2.63)
2.7.4 Canadian Standard CSA A23.3-04
The Canadian concrete structure standard (CSA A23.3-04 2004) specifies the critical perimeter
at distance of d/2 similar to ACI 318-05 and AS 3600-2009. The ultimate punching shear
strength is given in Equation 2-64.
%'& � F<* ¦ 0.19��1 � 2/��� A+�, �2���P2/� � 0.19� A+�, �2 0.38�A+�, �2 § (2-64)
Where λ= is a factor to account for density of concrete and is equal to 1.0 for normal concrete.
βc= is the ratio of larger to shorter column sides.
αs= is equal to 4, 3 and 2 for interior, edge and corner columns respectively.
fc'= is the compressive strength of concrete in MPa.
The ultimate design strength is given as follow.
%�x � ¥�%'& (2-65)
Where fc is the partial concrete safety factor and is equal to 0.65.
A notable difference between CSA 23.3-04 and ACI 318-05 is that Canadian Standard considers
a reduction factor for slabs with effective depth more than 300mm. The reduction factor is given
in Equation 2-66 and should be multiplied by Vcd.
z � 1300/�1000 � 2� ` 1.0 (2-66)
When prestressing forces exist, the design punching shear strength of prestressed slab -Vpd- is
calculated as expressed in Equation 2-67.
%5x � V�5�¥�A+�, t1 � ¥5~�5/�0.33�¥�A+�, � Y �2 � ¥5%5 (2-67)
Where βp= lesser of (αsd/u+0.15) and 0.33

42
σcp= is the average intensity of effective prestress on control perimeter in MPa
fc'= is the compressive strength of concrete in MPa and should not be taken greater than 35 MPa
λ= is a factor to account for density of concrete and is equal to 1.0 for normal concrete
fc= is the concrete partial safety factor equal to 0.65
fp= is the prestressing steel partial safety factor equal to 0.9.
CSA 23.3-04 allows the use of stirrups and headed shear studs for strengthening of concrete
slabs. The following equation calculates the punching shear resistance of slabs strengthened
with shear reinforcements inside the shear reinforced zone.
%Px � ¥�%� � ¥P%P ` ¥�% ZS[ (2-68)
fc= Concrete partial safety factor equal to 0.65
fs= Steel partial safety factor equal to 0.85
Where headed shear studs are provided:
%� � 0.28�A+�, �2 f’c in (MPa)
%P � iP¤+PQ¤2/; f’c in (MPa)
Asv= is the section area of one row of shear reinforcement around the column
fsyv=is the yield strength of shear reinforcement less than 414 MPa
%ZS[ � 0.75 A+�, �2 f’c in (MPa)
Where stirrups are provided:
Vc and V max change to the followings.
%� � 0.19�A+�, �2 f’c in (MPa)
%ZS[ � 0.55 A+�, �2 f’c in (MPa)
Outside the shear reinforced zone punching shear strength can be calculated as:
%x&'R � ¥�0.19A+�,�&'R2
Where uout is similar to the ACI 318-05 (Figure 2.28).

43
2.7.5 Eurocode2 (2004)
As Eurocode2 (2004) and Model Code 90 (1993) are very similar in their provisions for
punching shear strength, herein only Eurocode2 provisions are presented. Eurocode2 specifies
the critical perimeter at a distance equal to 2d from the face of column which is shown in Figure
2.29. It requires designers to use rounded edges for the critical perimeter.
The concrete ultimate shear strength is calculated by Equation 2-69.
¢� � 0.18z�100?S¤a+�¨�/3 � 0.1~�5 � ¢�ZWT (2-69)
Where z � 1 � �200/2�8.b ` 2.0 d in (mm)
?S¤a � �?[?Q�8.b ` 0.02
ρx, and ρy are the tensile reinforcement ratio in two orthogonal directions.
fck=is the characteristic concrete strength in MPa which approximated to fck=fc’-1.60MPa
(Gardner 2005)
¢�ZWT � 0.035 �z��/3+�¨8.b
Figure 2.29 Critical perimeter as shown in Eurocode2 (2004)
The ultimate design punching shear strength of slab can be calculated from the following
Equation.
%�x � �2¢�/�� (2-70)
Where u1 is the critical perimeter as shown in Figure 2.29 and γc is the concrete resistance factor
equal to 1.5.

44
If headed shear studs are provided, the punching shear strength is calculated as follow.
%Px � 0.75%�x � 1.5�2/;�iP¤+PQ¤�;<*� ` %ZS[/�� (2-71)
Where α is the angle between the shear reinforcement and the plane of the slab, and
fsvvE= 250+0.25d<fsv
Vmax=0.3(1-fck/250) fck u1d
The shear strength outside the shear reinforcement zone -Vcd out- can be calculated by Equation
2-72.
%�x &'R � �&'R2¢�/�� (2-72)
In Equation 2-69, uout is the outer critical perimeter shown in Figure 2.30 with the broken lines.
In Figure 2.30, k is equal to 1.5 according to Eurocode2, whereas, k is equal to 2.0 in Model
Code 90.
Figure 2.30 Shear reinforcement arrangement and critical perimeter outside the shear reinforced
region as shown in Eurocode2 (2004)
2.7.6 British Standard BS 8110-97
In BS 8110-97 (1997), the critical perimeter is located at 1.5d from the loaded area, and the
ultimate allowable shear stress on the critical perimeter can be calculated as given in Equation
2-73.
%�x � 0.79 �100?�/3 �400/2�8�b �+�'/25�/3 �2/γZ f’cu in (MPa, and d (mm ) (2-73)
Where γm= is the material partial factor is equal to 1.25,
fcu= is the characteristic cube concrete compressive strength not less than 25 MPa and greater
than 40 MPa,

45
ρ= (ρx+ ρx)/2 <0.03, in which ρx, and ρy are the flexural reinforcement ratio in two orthogonal
directions,
(400/d)0.25 is the size factor and should be equal or less than one.
The maximum shear stress at the column face should not be greater than 5MPa, or 0.8(fcu)0.5.
There are no specific provisions for the punching shear of prestressed slabs in BS 8110-97.
The punching shear strength of slabs with shear reinforcement is calculated by the following
equation.
%Px � %�x � 0.87iP¤+PQ¤;<*� (2-74)
Where Asv is the area of one row of shear reinforcement around the column which is provided in
successive bands with spacing of 0.75d and fsyv is the yield strength of shear reinforcement.
2.7.7 German Standard DIN 1045-1:2001
DIN 1045-1 (2001), similar to BS 8110-97, specifies the critical perimeter to be located at a
distance equal to 1.5d from the face of column as shown in Figure 2.31. The ultimate punching
shear strength of slabs is calculated by Equation 2-75.
%�x � 0.21z�100?S¤a+�¨�/3/�� � 0.12~�5 fck in (MPa) (2-75)
Where z � 1 � �200/2�8.b ` 2.0
?S¤a � �?[ � ?Q�/2 ` 0.02 .*2 ` 0.23+�¨/+PQ
γc=is the material partial safety factor equal to 1.5
Figure 2.31 Critical perimeter as given in DIN 1045-1 (2001)
If shear reinforcement is provided, the punching shear strength of slabs can be increased to the
maximum of 1.9Vcd for slabs reinforced with double headed shear studs and 1.5Vcd for other
types of shear reinforcement.

46
The first row of shear reinforcement, placed at the distance of d/2 from the face of column,
should be capable of resisting the punching shear force, so Equation 2-76 is suggested by DIN
1045-01.
%Px � %�x � =P0.87iP¤+PQ¤ (2-76)
For the strength of remaining rows can be calculated by Equation 2-77.
%Px � %�x � =P0.87iP¤+PQ¤2/; (2-77)
Where s is the spacing of shear reinforcement, fsyv is the yield strength of shear reinforcement
not more than 500 MPa, and ks is a parameter to take into account the effect of slab thickness in
anchorage and efficiency of shear reinforcement. ks can be calculate as following.
0.7 ` =P � 0.7 � 0.3�2 � 400�/400 ` 1.0 d in (mm) (2-78)
2.8 Summary
There has been an extensive research on the topic of punching shear of flat slabs. Major
previous analytical methods were briefly presented. There are various available approaches to
the punching shear phenomenon and there are significant differences between many of them.
Solutions to include the effect of prestressing forces on punching shear strength of flat plates
were discussed. Further, different types of strengthening technique and shear reinforcement for
punching shear were reviewed. Finally, the provisions of several internationally recognised
standards for punching shear strength of concrete slabs, prestressed slabs and concrete slabs
with shear reinforcement were presented. Despite the large volume of research conducted on
punching shear capacity and the large number of proposed mechanical models, none of the
internationally recognised standards has yet to adopt any of these mechanical models for its
design equations of punching shear capacity. It is clear that most of the standards still use the
empirical formulae originally proposed by Moe (1961) with minor modifications for different
factors such as slab thickness and concrete compressive strength.

47
Chapter Three
3 CONCENTRIC PUNCHING SHEAR OF FLAT PLATES
3.1 Introduction
From the structural point of view, concrete structures consist of two types of regions, main
regions, and local regions. The main regions -sometime referred to as the B-regions- are where
the distribution of stresses and strains are regular and this distribution can be presented by
mathematical expressions. In B-regions, force equilibrium and compatibility conditions
determine the state of stresses and strains (Hsu 1993). On the other hand, in the local or
disturbed regions -sometime referred as D-regions-, stresses are disturbed and strains are
irregular. Figure 3.1 shows main regions and local regions in a simple structure. In local
regions, it is very difficult to provide a mathematical solution for the flow of forces. Especially,
the compatibility conditions are not applicable, which leads to the use of equilibrium conditions
alone as the solution to the design of local regions. Prior to cracking, the stress pattern and
stress values can be quantified by the use of elastic finite-element analysis. After cracking, the
stress field will be disrupted and reoriented.
D-region
B-region
Figure 3.1 Schematic view of B-regions and D-regions in a simple structure
Historically, engineers designed local regions by “good practice”, by rule of thumb, or more
recently by empirical methods (Wight & MacGregor 2009). However, in the last three decades,
structural engineers have had a giving renewed interest in the strut-and-tie method as an
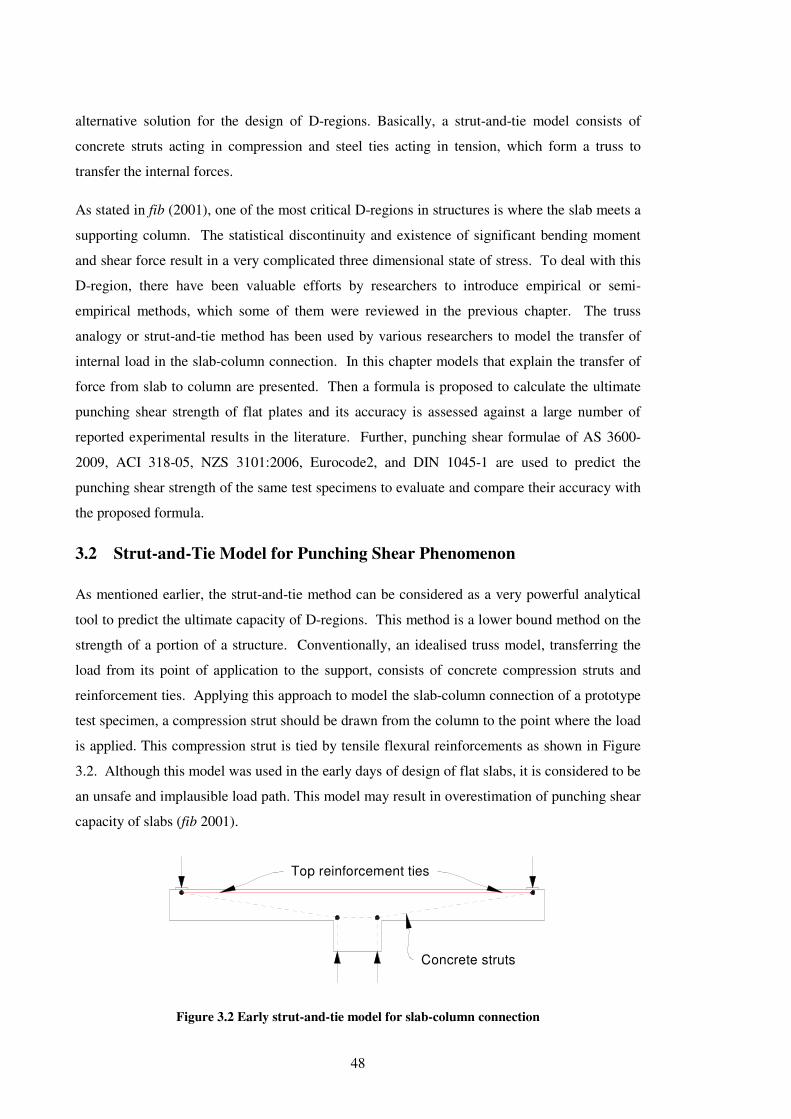
48
alternative solution for the design of D-regions. Basically, a strut-and-tie model consists of
concrete struts acting in compression and steel ties acting in tension, which form a truss to
transfer the internal forces.
As stated in fib (2001), one of the most critical D-regions in structures is where the slab meets a
supporting column. The statistical discontinuity and existence of significant bending moment
and shear force result in a very complicated three dimensional state of stress. To deal with this
D-region, there have been valuable efforts by researchers to introduce empirical or semi-
empirical methods, which some of them were reviewed in the previous chapter. The truss
analogy or strut-and-tie method has been used by various researchers to model the transfer of
internal load in the slab-column connection. In this chapter models that explain the transfer of
force from slab to column are presented. Then a formula is proposed to calculate the ultimate
punching shear strength of flat plates and its accuracy is assessed against a large number of
reported experimental results in the literature. Further, punching shear formulae of AS 3600-
2009, ACI 318-05, NZS 3101:2006, Eurocode2, and DIN 1045-1 are used to predict the
punching shear strength of the same test specimens to evaluate and compare their accuracy with
the proposed formula.
3.2 Strut-and-Tie Model for Punching Shear Phenomenon
As mentioned earlier, the strut-and-tie method can be considered as a very powerful analytical
tool to predict the ultimate capacity of D-regions. This method is a lower bound method on the
strength of a portion of a structure. Conventionally, an idealised truss model, transferring the
load from its point of application to the support, consists of concrete compression struts and
reinforcement ties. Applying this approach to model the slab-column connection of a prototype
test specimen, a compression strut should be drawn from the column to the point where the load
is applied. This compression strut is tied by tensile flexural reinforcements as shown in Figure
3.2. Although this model was used in the early days of design of flat slabs, it is considered to be
an unsafe and implausible load path. This model may result in overestimation of punching shear
capacity of slabs (fib 2001).
Top reinforcement ties
Concrete struts
Figure 3.2 Early strut-and-tie model for slab-column connection

49
Although concrete has some tensile strength, it is conservatively neglected in strut-and-tie
modelling. To achieve a more accurate and plausible mechanical strut-and-tie layout, it is
necessary to consider the tensile capacity of concrete. An alternative arrangement of struts and
ties can be envisaged if the tensile strength of concrete is taken into account. A very straight
forward model is shown in Figure 3.3 where solid lines represent ties and broken lines represent
compressive struts.
Top reinforcement ties
Concrete strutsConcrete ties
Figure 3.3 Refined Strut-and-tie model including concrete ties
Considering this model in 3D, the critical tie is the closest concrete tie to the column, which has
the least concrete area to transfer tension. Some researchers such as Menetry, and Georgopoulos
(fib 2001) as presented in 2.3.4.2 and 2.3.4.1, quantify the ultimate punching shear strength of
slabs by calculating the strength of the concrete tie shown in Figure 3.4.
Concrete tie failure
Figure 3.4 Punching shear by failure of concrete ties
According to Regan and Braestrup (1985) the crack which causes the punching shear
phenomenon, initiates approximately at 70 percent of the ultimate punching load. Even after the
development of this crack, test specimens were able to resist unloading and reloading. Broms
(1990) concluded that punching shear is not a “pure shear” problem and the resistance
mechanism of slab against punching shear relies on the compression zone where there is no
crack.
Consequently, an alternative failure criterion to the one shown in Figure 3.4, can be envisaged
in which the compressive strength of the critical strut, adjacent to the column, governs the

50
ultimate strength of the slab-column connection as shown in Figure 3.5. This has been the basis
for a number of proposed mechanical methods for the punching shear phenomenon such as
Kinnunen and Nylander (1960), Shehata (1990), Broms (1990), Hallgren (1996), Tiller(1995),
and Marzouk, Rizk and Tiller (2010) as reviewed in 2.3.1, 2.3.1.1, 2.3.1.2 and 2.3.1.3.
Furthermore, it has been observed by Kinnunen and Nylander (1960), Hallgren (1996) that the
radial compressive strains in a slab-column connection increase as the load increases, but just
before the punching shear failure occurs, strains start to decrease to zero at the soffit of the
connection. Broms (2005) considered this phenomenon as an evidence that the failure was
triggered by a crack in the compression zone at the soffit of the slab. Based on this observation,
Muttoni (2008) suggested an “elbow-shaped” compressive strut and horizontal tie develop in
the vicinity of column just before the punching shear failure.
There is an agreement between researchers on the formation of the critical strut beneath the
critical shear crack in the vicinity of the column, which transfers the load from slab to the
column (Broms 1990), (Shehata 1990), (Tiller 1995), (Muttoni 2008), and (Marzouk, Rizk &
Tiller 2010).
Critical shear crack
Critical concrete strut
Figure 3.5 Punching shear by crushing of concrete struts
3.3 Proposed Formula for the Ultimate Punching Shear Strength of Flat
Plates
Considering the mentioned observations in experimental tests, it is more rational to quantify the
punching shear capacity of slabs using the criterion for crushing of the critical compressive
strut. A schematic view of the critical compressive strut is shown in Figure 3.6.
As suggested by Broms (1990), Tiller(1995), and Marzouk, Rizk and Tiller(2010), Equation 3-1
can be used to calculate the ultimate punching shear strength of slabs (Vuo).

51
%'& � ��9 � 2©� \ - \ +� \ z \ sin ��/2� (3-1)
Where D, B, t and q are shown in Figure 3.6. fc and z are the compressive strength of the
concrete strut and a slab size factor respectively. For the case of square columns an equivalent
circular column with a similar perimeter has been considered.
Figure 3.6 View and cross section of the critical concrete strut around the column
A number of parameters such as dimensions of the critical strut, compressive strength of the
critical strut, slab size factor, and inclination of the critical strut should be quantified before
trying to calculate the punching shear strength of a slab using Equation 3-1. Herein, a prismatic
strut was chosen to simplify the model similar to Broms (1990), Tiller (1995), and Marzouk,
Rizk and Tiller (2010). Also it was assumed that the inclination of the critical strut is half of the
inclination of the critical shear crack similar to previous researchers such as Shehata (1990),
Broms (1990), Tiller (1995) and Marzouk, Rizk and Tiller (2010). Thickness of the idealised
prismatic strut can be quantified by determining boundary conditions for the geometry of the
compressive strut. If the top of the concrete strut is assumed to be fixed at the level of the
neutral axis, and the bottom of the strut is assumed to be fixed at the soffit of the slab-column
θ/2
B
tC
θ
h
Column CL
D/2
Ν.Α.
Critical shear crack
Critical strut

52
connection, it is possible to determine the thickness of the strut. Referring to Figure 3.6, B and t
can be quantified by Equation 3-2 and 3-3 respectively.
© � 2T/-.*� (3-2)
- � 2T sin��/2� /;<*� ª 2T/2 (3-3)
In following sections, methods to calculate parameters such as depth of neutral axis dn in the
vicinity of column, inclination of crack q, strength of concrete strut fc, and slab size factor will
be discussed.
3.3.1 Depth of Neutral Axis
As reviewed in the previous chapter, significant research has been carried out on the punching
shear of concrete slabs, but there is no agreement on how to calculate the depth of the
compression zone in the vicinity of column. This can be attributed to the existence of shear
forces adjacent to the column in addition to a complex triaxial state of stress, which results from
the bending moment around the column. Different approaches to calculate the depth of the
neutral axis adjacent to column are presented as following.
3.3.1.1 Depth of neutral axis in the elastic condition
Figure 3.7 shows the distribution of strains and the forces in the elastic condition of a section
subject to bending moment in B-region of structure, where the Bernoulli compatibility condition
is valid. The depth of the neutral axis in the elastic condition can be quantified by using
Hooke’s uniaxial constitutive law (4P � ~P/CP , 4� � ~�/C�), the strain distribution considering
Bernoulli compatibility condition (4P � 4&�2 � 2T�/2T� , and equating the tensile force in
reinforcing bars to the compressive force in the concrete (C=T). The depth of the neutral axis
can be expressed as Equation 3-4.
2T � *?@A1 � 2/*? � 1B2 (3-4)
Where n is the ratio of elastic modulus of steel to elastic modulus of concrete n=Es/Ec, ρ is the
ratio of tensile reinforcement and d is the effective depth of the section.
Broms (1990) used the basis of this method to calculate the location of the neutral axis in the
vicinity of the column. He included a modification factor kρ to reflect the inclined crack effects
as expressed in Equation 3-5. It should be noted that this effect is included because the region
adjacent to the column is a D-region, where both the bending moment and the shear forces are
significant.

53
2T � =>*?@A1 � 2/=>*? � 1B2 (3-5)
Where, => � �0.59 � 2/-.*30°�/�0.59 � 2T/-.*30°� . Hence, calculating the depth of the
neutral axis, based on this method, requires an iterative procedure.
Figure 3.7 Distribution of strains, stresses and forces in elastic condition (Warner et al. 1998)
3.3.1.2 Depth of neutral axis in the ultimate stage
The depth of the neutral axis can be calculated in the ultimate stage i.e. the maximum bending
moment resistance of section is reached. Assuming the provided tensile reinforcement ratio of
the section is less than the balanced reinforcement ratio, failure occurs when the outermost
compressive fibre of the section has reached its maximum strain εu. Figure 3.8 shows the strain
and stress distribution in a section at the ultimate stage for bending only.
To simplify calculation of the bending moment strength and the depth of the compression zone
at the ultimate stage, most of design standards allow using the equivalent rectangular stress
block as shown in Figure 3.9. Where ku=dn/d, γ is a parameter to convert the depth of the
neutral axis to the length of the equivalent rectangular stress block.
Figure 3.8 Strains and stresses distribution in the ultimate stage (Warner et al. 1998)

54
Figure 3.9 Rectangular stress block in the ultimate stage (Warner et al. 1998)
AS 3600-2009 specifies the ultimate strain for concrete as εu=0.003, and γ=1.05-0.007f’c. The
magnitude of the equivalent uniform stress is given as α2=1.0-0.003f’c. In this method, the
depth of the compression zone can be calculated by equating the compressive force to the
tensile force which will result in Equation 3-6.
2T � �?+PQ�2/����+�′� (3-6)
Theodorakopoulos and Swamy (2002) proposed two types of neutral axes in the region adjacent
to the column, namely the flexural neutral axis Xf and the so called “shear neutral axis” Xs.
Theodorakopoulos and Swamy (2002) pointed out that the ratio of fcube / (ρfsy) for test specimens
which yielded prior to punching shear had a value between 5 to 9. They assumed that the shear
neutral axis is equal to the flexural neutral axis i.e. Xf=Xs in test specimens which yielded before
punching shear occurs. In their model, the flexural neutral axis was calculated for the ultimate
stage and considering fcube / (ρfsy) is equal to average value of 7 then Xf=Xs=0.25d. In the
opinion of Theodorakopoulos and Swamy (2002), Xf is influenced by the amount of flexural
reinforcement and the compressive strength of concrete whereas Xs is unaffected. A schematic
view of the flexural neutral axis and the shear neutral axis is shown in Figure 3.10. In this
figure, point A is the intersection of the column and the slab. If two lines are drawn from the tip
of shear crack and the tip of flexural crack to the point A, the angle between the lines is ϕ as
shown in Figure 3.10. For cases where fcube / (ρfsy)≠7, Theodorakopoulos and Swamy (2002)
argued that the harmonic mean of Xf and Xs gives a more realistic approximation of the depth of
the compression zone. This is due to the characteristic of the harmonic value which tends to
mitigate the impact of the larger of Xf or Xs and aggravate the impact of the smaller one. ϕ tends
to zero as the flexural and shear cracks are very close or coincide (Theodorakopoulos & Swamy
2002). Consequently, it was suggested that the depth of the neutral axis could be calculated
using Equation 3-7.

55
Figure 3.10 Schematic view of the flexural neutral axis and the shear neutral axis
(Theodorakopoulos & Swamy 2002)
2T � 2��h � �P�/��h�P� (3-7)
In Equation 3-7, Xf=(ρfs-ρ’f’s)d/(k1fcu) where k1 is the concrete stress block parameter, fs is the
stress in the tensile reinforcement, f’s is the stress in the compressive reinforcement and
Xs=0.25d as suggested by Theodorakopoulos and Swamy (2002).
3.3.1.3 Simplified formula for depth of neutral axis
Shehata (1990) suggested a simplified formula to calculate the depth of the neutral axis for a
given slab in the elasto-plastic condition as given in Equation 3-8. In this formula, the shear
was accounted for by assuming punching shear occurs prior to concrete reaching the fully
plastic range.
2T � 0.8A*?aA35/+�, 2 f’c in MPa (3-8)
In Equation 3-8, n is the ratio of modulus of elasticity of steel to modulus of elasticity of
concrete, ρe is the ratio of reinforcement for a basic yield strength (500MPa) and can be
calculated as ρe= ρ(fsy/500)§0.02 where ρ is the ratio of reinforcement and fsy is the yield
strength of the tensile reinforcement.
3.3.2 Inclination of the Critical Strut and Critical crack
As shown in Figure 3.6, the angle of the critical strut was assumed to be half of the critical crack
angle. Shehata (1990), based on his experimental observations, suggested the inclination of the
critical crack to be 20°. While, Broms (1990), Tiller (1995) used 30
± as a typical critical crack
angle in their method which agrees with Regan and Braestrup (1985) experimental observations.
The assumption of treating the inclination of critical crack as a single value seems to be
inaccurate, as it has been observed in more recent experiments such as Hegger, Sherif and
Ricker (2006), and Guandalini, Burdet and Muttoni (2009). In these experiments, some test
dn
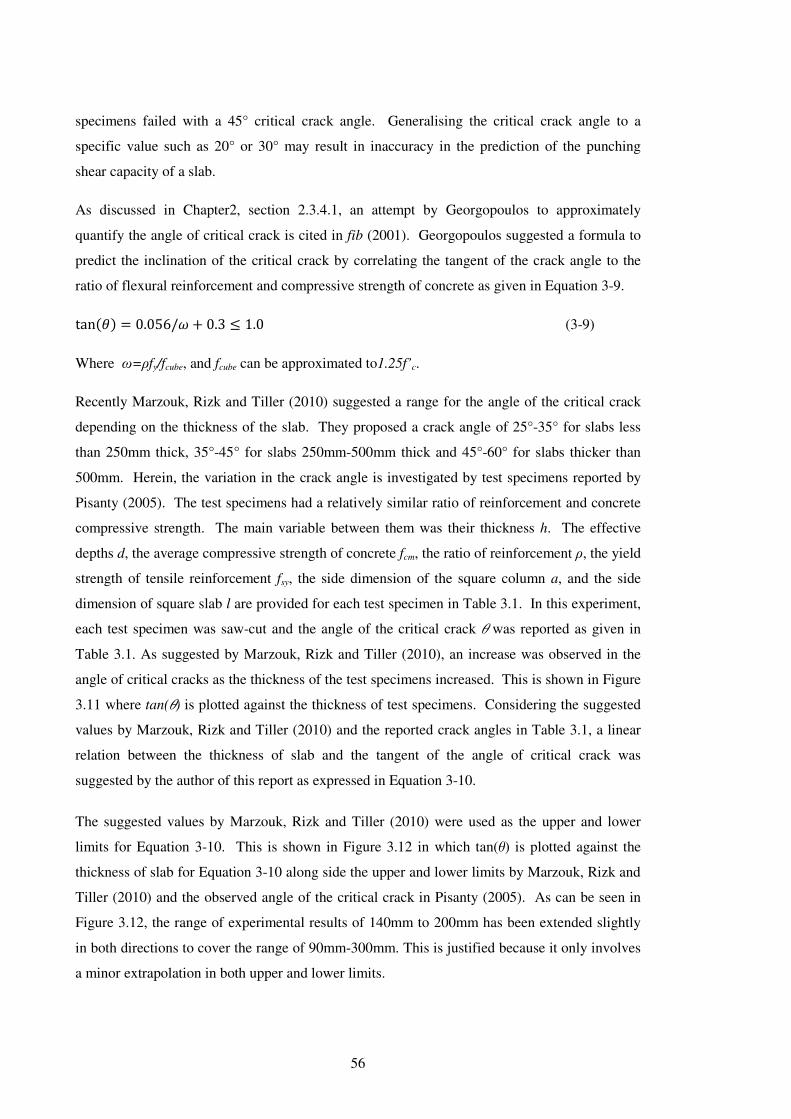
56
specimens failed with a 45° critical crack angle. Generalising the critical crack angle to a
specific value such as 20° or 30° may result in inaccuracy in the prediction of the punching
shear capacity of a slab.
As discussed in Chapter2, section 2.3.4.1, an attempt by Georgopoulos to approximately
quantify the angle of critical crack is cited in fib (2001). Georgopoulos suggested a formula to
predict the inclination of the critical crack by correlating the tangent of the crack angle to the
ratio of flexural reinforcement and compressive strength of concrete as given in Equation 3-9.
tan��� � 0.056/« � 0.3 ` 1.0 (3-9)
Where ω=ρfy/fcube, and fcube can be approximated to1.25f’c.
Recently Marzouk, Rizk and Tiller (2010) suggested a range for the angle of the critical crack
depending on the thickness of the slab. They proposed a crack angle of 25°-35° for slabs less
than 250mm thick, 35°-45° for slabs 250mm-500mm thick and 45°-60° for slabs thicker than
500mm. Herein, the variation in the crack angle is investigated by test specimens reported by
Pisanty (2005). The test specimens had a relatively similar ratio of reinforcement and concrete
compressive strength. The main variable between them was their thickness h. The effective
depths d, the average compressive strength of concrete fcm, the ratio of reinforcement ρ, the yield
strength of tensile reinforcement fsy, the side dimension of the square column a, and the side
dimension of square slab l are provided for each test specimen in Table 3.1. In this experiment,
each test specimen was saw-cut and the angle of the critical crack q was reported as given in
Table 3.1. As suggested by Marzouk, Rizk and Tiller (2010), an increase was observed in the
angle of critical cracks as the thickness of the test specimens increased. This is shown in Figure
3.11 where tan(q) is plotted against the thickness of test specimens. Considering the suggested
values by Marzouk, Rizk and Tiller (2010) and the reported crack angles in Table 3.1, a linear
relation between the thickness of slab and the tangent of the angle of critical crack was
suggested by the author of this report as expressed in Equation 3-10.
The suggested values by Marzouk, Rizk and Tiller (2010) were used as the upper and lower
limits for Equation 3-10. This is shown in Figure 3.12 in which tan(q) is plotted against the
thickness of slab for Equation 3-10 along side the upper and lower limits by Marzouk, Rizk and
Tiller (2010) and the observed angle of the critical crack in Pisanty (2005). As can be seen in
Figure 3.12, the range of experimental results of 140mm to 200mm has been extended slightly
in both directions to cover the range of 90mm-300mm. This is justified because it only involves
a minor extrapolation in both upper and lower limits.

57
Table 3.1 Main properties of test specimens and angle of the critical crack reported in (Pisanty
2005)
Test Specimen 14/1 14/2 16/1 16/2 18/1 18/2 20/1 20/2
h(mm) 140 140 160 160 180 180 200 200
d(mm) 112 112 133 133 151 151 171 171
fcm(MPa) 26.4 22.8 25 19 23.3 25.5 24.1 21.8
ρ 0.013 0.013 0.009 0.009 0.012 0.012 0.01 0.01
fsy(MPa) 500 500 500 500 500 500 500 500
a(mm) 200 200 200 200 250 250 300 300
l(mm) 1700 1700 1700 1700 1700 1700 1700 1700
Angle of crack q 30° 33° 32° 35° 35° 31° 37° 40°
Angle of crack
Equation 3-9 30° 29° 34° 30° 30° 31° 32° 31°
Angle of crack
Marzouk, Rizk and Tiller (2010) 25°<q<35°
Figure 3.11 Observed critical crack angle versus thickness of slab
0.45 ` -.*��� � 0.0027��� � 0.2 ` 1.0 (3-10)
Where h is the thickness of slab in (mm) and q in degree.
tan(θ)= 0.0027h + 0.2
0.4
0.45
0.5
0.55
0.6
0.65
0.7
0.75
0.8
0.85
0.9
130 140 150 160 170 180 190 200 210
tan(θ)
Thickness of slab (mm)
Observed critical shear crack in test specimens
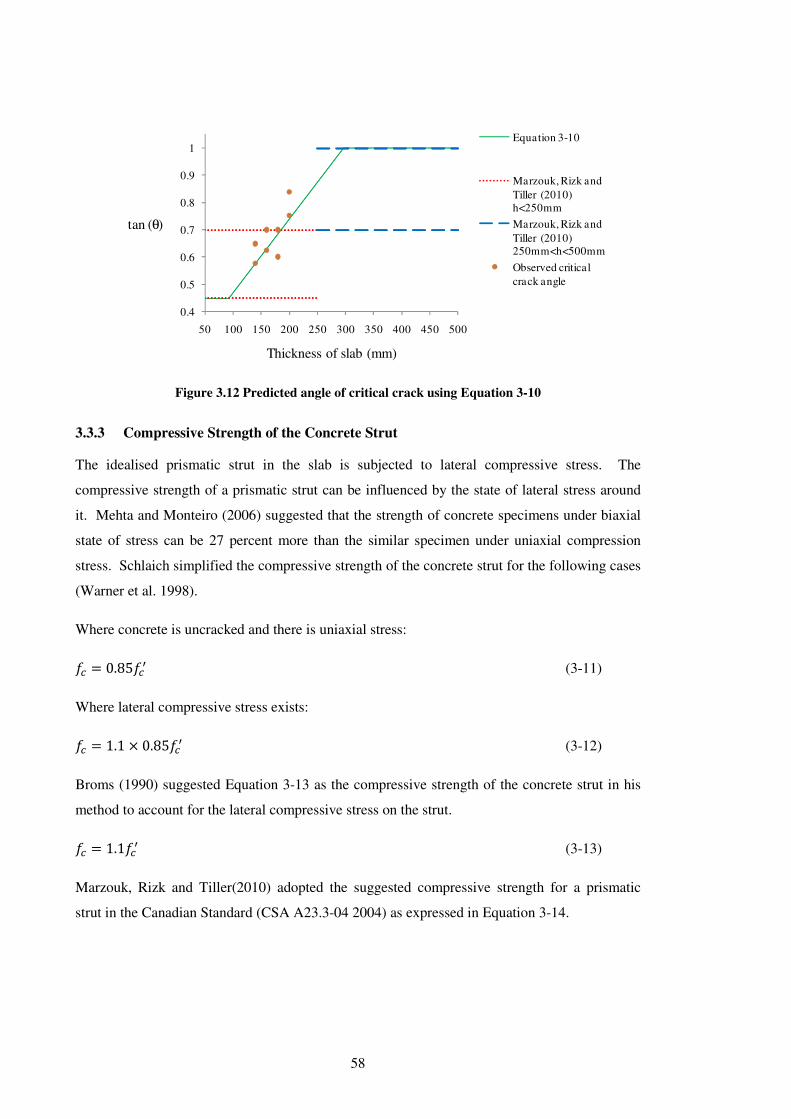
58
Figure 3.12 Predicted angle of critical crack using Equation 3-10
3.3.3 Compressive Strength of the Concrete Strut
The idealised prismatic strut in the slab is subjected to lateral compressive stress. The
compressive strength of a prismatic strut can be influenced by the state of lateral stress around
it. Mehta and Monteiro (2006) suggested that the strength of concrete specimens under biaxial
state of stress can be 27 percent more than the similar specimen under uniaxial compression
stress. Schlaich simplified the compressive strength of the concrete strut for the following cases
(Warner et al. 1998).
Where concrete is uncracked and there is uniaxial stress:
+� � 0.85+�, (3-11)
Where lateral compressive stress exists:
+� � 1.1 \ 0.85+�, (3-12)
Broms (1990) suggested Equation 3-13 as the compressive strength of the concrete strut in his
method to account for the lateral compressive stress on the strut.
+� � 1.1+�, (3-13)
Marzouk, Rizk and Tiller(2010) adopted the suggested compressive strength for a prismatic
strut in the Canadian Standard (CSA A23.3-04 2004) as expressed in Equation 3-14.
0.4
0.5
0.6
0.7
0.8
0.9
1
50 100 150 200 250 300 350 400 450 500
tan (θ)
Thickness of slab (mm)
Equation 3-10
Marzouk, Rizk and
Tiller (2010) h<250mm
Marzouk, Rizk and
Tiller (2010) 250mm<h<500mm
Observed critical
crack angle

59
+� � +�,/�0.8 � 1704� ` 0.85+�, (3-14)
Where 4 is the principal tensile strain in the cracked concrete. Marzouk, Rizk and Tiller (2010)
used 0.001 for 4 in their method.
The recent AS 3600-2009 gives Equation 3-15 as the capacity of prismatic concrete struts.
+� � 0.9+�, (3-15)
Muttoni, Schwarts and Thurlimam (2003) suggested the following equations to quantify the
compressive strength of the concrete strut.
Where there is lateral confining compressive stress (σ1) the compressive capacity of strut is:
+� � 20�+�,/20���/3� � 4~ for +¬� � 20m�. (3-16)
Where there is no lateral stress (σ1 ) the compressive capacity of strut is:
+� � 20�+�,/20���/3� for +¬� � 20m�. (3-17)
As expressed in Equation 3-16, an increase in the lateral confining stress σ1 will result in
increase of the compressive strength of the concrete strut. For the strut, σ1 is not uniform and it
changes depending on the distance to the neutral axis. Therefore, it is not possible to specify a
value for σ1 in Equation 3-16.
In this report, Equation 3-13, Equation 3-15, and Equation 3-17 are used as the compressive
strength of the concrete strut in Equation 3-1.
3.3.4 Slab Size Factor
Marzouk, Rizk and Tiller (2010) based on fracture mechanics, suggested a slab size factor for
their proposed strut-and-tie model as expressed in Equation 3-18.
g<�] +.�-^( � �r��/��� (3-18)
lch is called characteristic length. This parameter is not a physical property and reflects the
fracture characteristic of the concrete. Marzouk, Rizk and Tiller (2010) suggested to use α=0.33
for various concrete compressive strengths. lch can be calculated by Equation 3-19.
r�� � C�h/+�R� (3-19)
Where Ec is the concrete modulus of elasticity, fct is the tensile strength of concrete, and Gf is
called fracture energy. Gf represents the amount of energy which causes a unit area of crack.
This parameter can be quantified by calculating the area under the curve of load-crack width

60
graph. Marzouk and Chen (1995) suggested that the average value of lch for normal strength
concrete is 500mm and for high strength concrete is 250mm. Marzouk, Rizk and Tiller (2010)
in the outline of the design procedure for their strut-and-tie model, suggested to obtain the
characteristic length either from a simple fracture mechanics test or the latter approximate
values.
Broms (2005) proposed to use the compression zone dimensions, instead of the thickness of the
slab, as the reference dimension to consider the slab size effect. Justification for this assumption
relies on the hypothesis of the compressive failure in the soffit of the slab-column connection.
Broms used (150/dn)0.33 in his method to consider the size effect on the strain capacity of slabs,
and (150/t)0.33 to consider the slab size effect on the compressive strength of concrete struts in
which t is expressed in Equation 3-3 and shown in Figure 3.6. 150mm is the reference value,
chosen based on the diameter of the standard test cylinder specimen. If the failure occurs before
the concrete goes into the non-linear mode, 0.5 is a suitable exponent to reflect the size effect,
but for cases in which concrete goes into the plastic range and performs non-linearly then 0.25
is a suitable exponent. Therefore, Broms (2005), pointed out that the 0.5 exponent, suggested
by Hallgren (1996), exaggerates the size effect on the failure capacity of slabs. Instead he
suggested 0.33 as a more realistic exponent for the case of punching shear failure. In this report,
the author used (150/t)a as the slab size factor. Considering Equation 3-3, t can approximate to
(@ dn/2). Different values were used as the exponent for this ratio to determine the most suitable
exponent.
3.3.5 Determination of the Parameters
As it was discussed, for a given slab, there is no agreement in the literature on how to quantify
some of the aforementioned parameters such as the depth of the compression zone, the size
effect, the inclination of the critical crack and the strength of the critical strut. Therefore, a large
number of reported experimental tests were gathered from fib (2001) and some of other recent
papers, which are not included in fib (2001), such as Birkle and Dilger (2008), Li (2000),
Marzouk and Hussein (1991), Guandalini, Burdet and Muttoni (2009), and Pisanty (2005).
Slabs which reportedly failed in flexure were excluded from the database, and only slabs which
reportedly failed by punching shear were considered. Details of these test specimens are
provided in Appendix A.
An Excel spreadsheet was written to predict the capacity of each slab based on Equation 3-1.
The depth of the neutral axis was quantified, using Equation 3-5, Equation 3-7 and Equation 3-
8. To account for the slab size effect, the ratio of (300/dn) with four different exponents, 0 -no
size effect-, 0.25, 0.33, and 0.5, were considered. Further, the proposed expression by
Georopoulos in Equation 3-9 and that proposed by the author in Equation 3-10 were used to
61
predict the inclination of the critical crack. Moreover, Equation 3-13, Equation 3-15, and
Equation 3-17 were used to calculate the compressive strength of the critical strut. In total 72
different combinations of parameters were considered using Equation 3-1.
The ratio of the predicted capacity, over the reported failure load (Vtest/Vuo) was calculated for
each test specimen of the database. Consequently, average, standard deviation -SD-, and
coefficient of variation -CV- of these ratios were calculated to compare the capability of each
combination of parameters.
In Table 3.2 to Table 3.4, the column of parameters indicates the parameters, which were used
in Equation 3-1 to calculate the punching strength of slabs. The first letter expresses the method
which was used to calculate the depth of the neutral axis. So, B represents the depth of the
compression zone based on the method suggested in Broms (1990), T represents the method
suggested in Theodorakopoulos and Swamy (2002), and S represents the method suggested in
Shehata (1990). The second letter stands for the method which was used to quantify the
inclination of shear crack. Letter G standing for the method, suggested by Georgopoulos
(Equation 3-9), and P standing for the proposed formula by the author of this thesis (Equation 3-
10). The third letter represents the method which was used to calculate the compressive
strength of the critical strut. Here A standing for the suggested method in AS 3600-2009, B
standing for the suggested method in Broms (1990), and M represents the suggested method in
Muttoni, Schwarts and Thurlimam (2003). Finally, the last figure represents the exponent of the
slab size factor (300/dn). This is, 0 (no size effect is considered), 0.25 represents (300/dn)0.25,
0.33 represents (300/dn)0.33 and 0.5 represents (300/dn)
0.5.
As an example, S-G-B-0.25 indicates that Shehata’s method (Equation 3-7) was used to
calculate the depth of the compression zone, Georgopoulos’s method (Equation 3-9) was used
to calculate the inclination of the critical crack, Broms’s method (Equation 3-13) was used to
calculate the strength of the concrete strut, and finally the ratio of (300/dn)0.25 was used as the
slab size effect. Therefore, Equation 3-1 for the case of S-G-B-0.25 is shown as below.
Vuo(S-G-B-0.25)� � �9 � �x®¯°J�U� \ x®±WT�XO±WT�U� \ 1.1+�, \ g<* �U� \ �388x® �8.�b
Table 3.2 gives the average, SD, and CV of Vtest/Vuo for different combination of parameters
where Equation 3-5 was used to calculate the depth of the neutral axis. Similarly, Table 3.3,
and Table 3.4 show the average, SD, and CV of Vtest/Vuo for different combination of parameters
where Equation 3-7 and Equation 3-8 were used respectively to calculate the depth of the
neutral axis. The desired method would have the lowest CV and an average value close to
unity.

62
In Table 3.2, Table 3.3, and Table 3.4, three formulae show a reasonable accuracy, and they are
T-P-M-0.5, S-P-A-0.5, and S-P-B-0.33.
Table 3.2 Average, SD and CV of Vtest/Vuo for different combination of parameters using the
method in Broms (1990) to calculate the depth of the neutral axis
Parameters Average SD CV Parameters Average SD CV
B-G-A-0 1.24 0.55 0.44 B-P-A-0 1.32 0.53 0.40
B-G-A-0.25 0.82 0.33 0.41 B-P-A-0.25 0.86 0.31 0.36
B-G-A-0.33 0.71 0.28 0.40 B-P-A-0.33 0.75 0.26 0.35
B-G-A-0.5 0.54 0.21 0.39 B-P-A-0.5 0.57 0.19 0.33
B-G-B-0 1.02 0.45 0.44 B-P-B-0 1.08 0.43 0.40
B-G-B-0.25 0.67 0.27 0.41 B-P-B-0.25 0.70 0.36 0.36
B-G-B-0.33 0.58 0.23 0.40 B-P-B-0.33 0.61 0.21 0.35
B-G-B-0.5 0.44 0.17 0.39 B-P-B-0.5 0.46 0.15 0.33
B-G-M-0 1.28 0.32 0.25 B-P-M-0 1.37 0.32 0.23
B-G-M-0.25 0.85 0.19 0.22 B-P-M-0.25 0.90 0.17 0.18
B-G-M-0.33 0.74 0.16 0.22 B-P-M-0.33 0.79 0.14 0.17
B-G-M-0.5 0.56 0.13 0.23 B-P-M-0.5 0.60 0.10 0.17
Table 3.3 Average, SD and CV of Vtest/Vuo for different combination of parameters using the method
in Theodorakopoulos and Swamy (2002) to calculate the depth of the neutral axis
Parameters Average SD CV Parameters Average SD CV
T-G-A-0 2.88 0.99 0.34 T-P-A-0 3.14 0.97 0.31
T-G-A-0.25 1.62 0.55 0.34 T-P-A-0.25 1.75 0.49 0.28
T-G-A-0.33 1.34 0.46 0.34 T-P-A-0.33 1.44 0.40 0.28
T-G-A-0.5 0.92 0.32 0.35 T-P-A-0.5 0.98 0.27 0.27
T-G-B-0 2.36 0.81 0.34 T-P-B-0 2.57 0.79 0.31
T-G-B-0.25 1.33 0.45 0.34 T-P-B-0.25 1.43 0.28 0.28
T-G-B-0.33 1.10 0.37 0.34 T-P-B-0.33 1.18 0.33 0.28
T-G-B-0.5 0.75 0.27 0.35 T-P-B-0.5 0.80 0.22 0.27
T-G-M-0 3.03 0.54 0.18 T-P-M-0 3.35 0.69 0.21
T-G-M-0.25 1.71 0.32 0.19 T-P-M-0.25 1.87 0.30 0.16
T-G-M-0.33 1.41 0.28 0.20 T-P-M-0.33 1.54 0.24 0.15
T-G-M-0.5 0.97 0.22 0.23 T-P-M-0.5 1.05 0.17 0.16

63
Table 3.4 Average, SD and CV of Vtest/Vuo for different combination of parameters using the method
in Shehata (1990) to calaculate the depth of the neutral axis
Parameters Average SD CV Parameters Average SD CV
S-G-A-0 3.03 0.48 0.16 S-P-A-0 3.38 0.71 0.21
S-G-A-0.25 1.68 0.31 0.18 S-P-A-0.25 1.84 0.30 0.16
S-G-A-0.33 1.38 0.28 0.20 S-P-A-0.33 1.51 0.24 0.15
S-G-A-0.5 0.94 0.23 0.25 S-P-A-0.5 1.02 0.17 0.17
S-G-B-0 2.48 0.40 0.16 S-P-B-0 2.76 0.58 0.21
S-G-B-0.25 1.37 0.25 0.18 S-P-B-0.25 1.51 0.24 0.16
S-G-B-0.33 1.13 0.23 0.20 S-P-B-0.33 1.23 0.19 0.15
S-G-B-0.5 0.77 0.19 0.25 S-P-B-0.5 0.83 0.14 0.17
S-G-M-0 3.37 0.89 0.26 S-P-M-0 3.80 1.23 0.32
S-G-M-0.25 1.85 0.47 0.25 S-P-M-0.25 2.06 0.54 0.26
S-G-M-0.33 1.52 0.39 0.26 S-P-M-0.33 1.68 0.42 0.25
S-G-M-0.5 1.03 0.29 0.28 S-P-M-0.5 1.12 0.27 0.24
To compare these three methods, Vtest/Vuo is plotted against effective depth of slab (d), tensile
reinforcement ratio (ρ), and compressive strength of concrete (f’c) in Figure 3.13, Figure 3.14,
and Figure 3.15. The linear trendline is shown for the ratio of Vtest/Vuo for each of the latter
methods. Similar to fib (2001), the linear trendline is used to approximately evaluate the
capability of the predicting method. The trendline indicates if a method can keep its accuracy as
a variable such as effective depth of slab, compressive strength of concrete or tensile
reinforcement ratio changes. A horizontal trendline demonstrates that the model is capable of
maintaining its accuracy for a wider range of test specimens. Conversely, an inclined line
indicates that the model is not capable of keeping its accuracy for a broad range of test
specimens. As given in Table 3.4, S-P-B-0.33 has the lowest CV compared to the other
methods. Also as shown in Figure 3.13, the trendlines are horizontal and the method is
consistent for a wide range of test specimens. The minimum value of Vtest/Vuo for S-P-B-0.33 is
0.78 as compared to 0.69 and 0.63 for T-P-M-0.5 and S-P-A-0.5 respectively. In this study, the
author decided to adopt S-P-B-0.33 Equation 3-20 to calculate the punching strength of slabs.
%'& � ��9 � 22T/-.*�� \ 2T/2 \ 1.1+�, \ �300/2T�8.33 \ sin��/2� (3-20)
Where, the depth of the neutral axis was expressed in Equation 3-8 (dn=0.8√(nρe)√(35/f’c)d) ,
the inclination of the critical crack is quantified by the proposed formula Equation 3-10
(tanθ=0.0027h+0.2), 1.1f’c is used as the concrete strut strength, and (300/dn)0.33 is the slab size
effect parameter. The predicted punching shear strength of test specimens using this method is
provided in Appendix A.

64
Figure 3.13 Vtest/Vuo versus effective depth of slab, tensile reinforcement ratio and compressive
strength of concrete for T-P-M-0.5

65
Figure 3.14 Vtest/Vuo versus effective depth of slab, tensile reinforcement ratio and compressive
strength of concrete for S-P-B-0.33

66
Figure 3.15 Vtest/Vuo versus effective depth of slab, tensile reinforcement ratio and compressive
strength of concrete for S-P-A-0.5

67
3.3.6 Example
Herein, the ultimate punching shear strength of test specimen 16/1 reported in Pisanty (2005) is
calculated as an example to illustrate the procedure of calculating the punching shear strength of
a slab using the suggested formula.
The geometry and arrangement of tensile reinforcement of the test specimen 16/1 are shown in
Figure 3.16. The compressive strength of concrete was 25 MPa, the ratio of tensile
reinforcement was 0.95%, the yield strength of normal reinforcements was 500 MPa, the mean
of effective depths of tensile reinforcements was 133 mm, and the thickness of the test specimen
was 160 mm.
Figure 3.16 Plan and elevation view of test specimen 16/1 reported in Pisanty (2005)
Having the above information and given dimensions in Figure 3.16, the ultimate punching shear
strength of the test specimen can be predicted as following.
Vuo according to Equation 3.20:
%'& � ��9 � 22T/-.*�� \ 2T/2 \ 1.1+�, \ �300/2T�8.33 \ sin��/2�
In which the equivalent diameter:
D=4a/p=4µ200mm/3.14=254.8mm
φ12@85mm
φ12@95mm
1700m
m
1700mm
200mm
V
13
3m
m

68
The depth of neutral axis using Equation 3-8:
dn=0.8√(nρe)√(35/f’c)d
n=Es/Ec
According to AS 3600-2009, Ec for the concrete with the density of 2400 kg/m3 and f’c§40MPa
can be calculated as:
Ec=24001.5µ0.043√f’c=2400
1.5µ0.043µ√25=25.3µ103 MPa
n=200µ103/25.3µ10
3=7.91
ρe=ρ(fsy/500)=0.0095(500/500)=0.0095
dn=0.8√(7.91µ0.0095)µ√(35/25)µ133=35.5mm
The angle of the critical crack based on Equation 3-10:
tan(q)=0.0027h+0.2=0.0027µ160+0.2=0.632
The predicted angle of the critical crack q=32°.
The observed angle of the critical crack, reported in (Pisanty 2005), q=32°.
Using Equation 3-20, the predicted ultimate punching shear strength of the test specimen is:
Vuo=p(254.8+2µ35.5/tan32°)µ35.5/2µ1.1µ25µ(300/35.5)0.33µsin(32°/2)=315kN
Observed punching shear strength of test specimen was reported as Vtest=376kN
Vtest/Vuo=1.19
3.4 Comparison of Experimental Results with Design Standards
In this section, the collected experimental results were used to assess formulae of AS 3600-
2009, ACI 318-05, NZS 3101:2006, CSA A23.3-04, Eurocode2, and DIN 1045-1 for concentric
punching shear. It should be noted that the formulae of AS 3600-2009 and ACI 318-05 are
similar. NZS 3101:2006 is also similar to formulae of ACI 318-08 and AS3600-2009 except
that it includes a size effect factor (Equation 2-63). In Appendix A, the predicted punching
shear strength of the gathered test specimens using aforementioned standards are provided.
Table 3.5 provides the average, SD, and CV of the failure load to the predicted capacity
(Vtest/Vuo) for AS 3600-2009, ACI 318-05, NZS 3101:2006, CSA A23.3-04, Eurocode2, and DIN

69
1045-1. In Table 3.5, AS 3600-2009, ACI 318-05, and NZS 3101:2006 have a significant
higher average and CV compared to Eurocode2 and DIN 1045-1.
Table 3.5 Average, SD and CV of Vtest/Vuo for AS 3600-2009, ACI 318-05, NZ 3101:2006, CSA
A23.3-04, Eurocode2 and DIN 1045-1
Predicting method Average
Vtest/Vuo SD
Vtest/Vuo CV
Vtest/Vuo
AS 3600-2009 & ACI 318-05 1.39 0.28 0.20
NZS 3101:2006 1.45 0.28 0.19
CSA A23.3 1.24 0.25 0.20
Eurocode2 1.20 0.20 0.17
DIN 1045-1 1.24 0.20 0.16
Further, Vtest/Vuo is plotted against the effective depth of slabs, the ratio of tensile reinforcement,
and concrete compressive strengths for AS 3600-2009, ACI 318-05, NZS 3101:2006, CSA
A23.3-04, Eurocode2, and DIN 1045-1 in Figure 3.17 to Figure 3.21. The linear trendline is
drawn similar to the previous section to approximately evaluate the capability of the mentioned
standards in predicting the punching shear strength of flat plates. As shown in Figure 3.17, the
ratio of Vtest/Vuo decreases as the effective depth of the slabs increases for AS3600-2009. AS
3600-2009 seems to overestimate the capacity of thick slabs due to neglecting of the slab
thickness size effect. As shown in Figure 3.18, NZS 3101:2006 does not overestimate the
punching shear strength of thick slabs because of considering the slab thickness size factor. In
Figure 3.17 to Figure 3.19, due to neglect of tensile reinforcement ratio in the punching shear
formula of AS 3600-2009, NZS 3101:2006 and CSA A23.3-04, the punching shear strength of
heavily reinforced slabs is underestimated. According to Eurocode2 and DIN 1045-1, punching
shear capacity of a slab is proportional to the third root of the tensile reinforcement ratio of the
slab. As shown in Figure 3.20 and Figure 3.21, horizontal trendlines demonstrate Eurocdoe2
and DIN 1045-1 are very good in the estimation of the effect of tensile reinforcement ratio.
However, it seems latter standards cannot keep their accuracy for a wide range of slab
thicknesses.

70
Figure 3.17 Vtest/Vuo versus effective depth of slab, tensile reinforcement ratio and compressive
strength of concrete for AS 3600-2009 and ACI 318-05

71
Figure 3.18 Vtest/Vuo versus effective depth of slab, tensile reinforcement ratio and compressive
strength of concrete for NZS3101:2006

72
Figure 3.19 Vtest/Vuo versus effective depth of slab, tensile reinforcement ratio and compressive
strength of concrete for CSA A23.3-04

73
Figure 3.20 Vtest/Vuo versus effective depth of slab, tensile reinforcement ratio and compressive
strength of concrete for Eurocode2 and Model Code 90

74
Figure 3.21 Vtest/Vuo versus effective depth of slab, tensile reinforcement ratio and compressive
strength of concrete for DIN 1045-1

75
3.5 Summary
The proposed formula to predict the concentric punching shear strength of flat plates, considers
the compressive strength of the critical strut adjacent to the column to govern the punching
shear strength of slabs. It was discussed that there is no agreement between researchers on the
method to specify the depth of the neutral axis in the vicinity of slab-column connections, the
inclination of the critical crack, the slab size effect and the compressive strength of the critical
strut. Therefore, a large number of experimental test specimens were gathered and the best
combination of the mentioned parameters was chosen to achieve a relatively accurate formula to
predict the punching shear strength of slabs. This method has a low coefficient of variation and
its accuracy is consistent for a wide range of slab thicknesses, tensile reinforcement ratios, and
concrete compressive strengths. AS 3600-2009 formula for punching shear with no unbalanced
moment does not consider two important parameters, namely the slab size effect and tensile
reinforcement effect. Comparing experimental test results, reported in the literature, to the
predicted strength of slab by AS 3600-2009 formula, it was revealed that due to neglecting of
slab size effect, the capacity of thick slabs is overestimated, and due to neglect of tensile
reinforcement ratio, the capacity of heavily reinforced slabs is underestimated. Further, AS
3600-2009, ACI 318-05, and CSA A23.3-04 had the worst coefficient of variation as compared
to the other mentioned standards. NZS 3101:2006 shows a better estimation of thick concrete
slab capacity as the slab thickness size effect is included in the formula. Eurocode2 and DIN
1045-1 give a good prediction of the failure load, and have a lower coefficient of variation as
compared to AS 3600-2009, ACI 318-05, NZS 3101:2006 and CSA A23.3-04.

76

77
Chapter Four
4 CONCENTRIC PUNCHING SHEAR OF PRESTRESSED
FLAT PLATES
4.1 Introduction
The use of prestressing technique in construction of concrete slabs has been increasing recently.
It solves serviceability issues such as excessive deflection and cracking, and allows designers to
achieve relatively thin slabs for large spans. This reduces the self-weight and overall height of
the building which is desirable in seismic regions and results in more economical structures. As
explained in Chapter Three, the state of stress is complex in the vicinity of column and the
presence of in-plane forces makes it even more difficult to determine the stresses adjacent to the
column.
In the following sections, the effect of prestressing tendons on the punching shear strength of
slabs is reviewed, and based on the available experimental results, the proposed method in
Chapter Three is extended to calculate the punching shear strength of prestressed slabs. Further,
the provisions of standards, presented in Chapter Two, are used to predict the punching shear
resistance of the same test results, and comparisons are made between them to determine their
accuracy in the prediction of punching shear strength of test specimens.
4.2 Background
In Chapter Two, three different approaches were reviewed for calculating the punching shear
strength of prestressed slabs namely: the principle tensile stress method, the equivalent
reinforcement ratio method, and the decompression method. These approaches are empirical or
semi-empirical, and a fully satisfactory mechanical method is yet to be developed to explain the
effect of prestressing on the punching shear phenomenon. The topic of punching of prestressed
slabs has been reviewed and presented by several researchers such as Scordelis, Pister and Lin
(1958), Regan (1985), Shehata (1990), Silva, Regan and Melo (2005), Clement and Muttoni
(2010), and Ramos, Lucio and Regan (2011). Inclusion of prestressing tendons in slabs imposes
three main actions in the analysis of stresses. Two of them are the resultant of the compressive
force in the tendons which can be divided into horizontal (Np) and vertical (Vp) components.

78
The third action is the bending moment (Mp) which is the resultant of the eccentricity
prestressing force from the neutral axis. These actions are shown in Figure 4.1.
P P
Prestressing tendon
Np
Vp
MpNp
Vp
Mp
Figure 4.1 Prestressing actions adjacent to the slab-column connection
As discussed in Silva, Regan and Melo (2007), the majority of prestressed slab specimens,
tested before the mid 1980s, cannot be used to draw a general conclusion on how prestressing
effects punching shear strength of slabs. This is due to the individual features of the test series
such as small slab thicknesses or lack of bonded reinforcement, and also in some instances some
of the important information about the test specimens such as the depth and profile of the
prestressing tendons were not clearly documented (Silva, Regan & Melo 2007). However, in
recent years, there has been valuable experimental work which sheds light on the effects of
prestressing on the punching shear strength of prestressed slabs.
Effects of prestressing have been investigated globally in most of the experimental test series
(Clement & Muttoni 2010). The test specimens were prestressed in the way that Np, Mp, and Vp
were applied to the slab simultaneously. As a result, it is not possible to investigate the effect of
each individual parameter on the punching shear strength of flat plates.
There are very limited experimental results available in which the effect of one of the
aforementioned parameters can be observed. Herein, the author selected the test specimens
reported in the literature from which the effect of one of the parameters -Np, Mp, Vp- can be
investigated on the overall strength of prestressed slabs.
4.2.1 Effect of In-plane Stresses on the Punching Shear Strength of Flat Plates
In this section, the effect of in-plane compressive stress is presented as deduced from some of
the reported experimental results on prestressed slab specimens. Two criteria were considered
to select the following presented test specimens. First, prestressed slab test specimens should be
similar to their reference test specimens -the specimen with no prestressing- in specifications
such as concrete compressive strength, ratio of reinforcement and dimensions. Second, the only
difference between the reference slab and prestressed slab should be the presence of in-plane
forces.

79
Regan (1983) reported experimental results which investigated the effect of in-plane force only
in one direction of the slab. The dimensions and the loading configuration of the reference test
specimen BD2 and the prestressed test specimen BD4 are shown in Figure 4.2 (a). Test
specimens were 1500mm by 1500mm square slabs which were supported on two edges and
loaded by 100mm by 100mm steel plates at the centre until failure. In addition, test specimens
BD4 and BD8 were tested in which the slab was supported on four edges as shown in Figure 4.2
(b). Prestressing forces were applied by unbonded prestressing tendons at the centre of the slab
thickness. The thickness of all test specimens were 125mm and the effective depth of tensile
reinforcement was 101mm. Table 4.1 gives the failure load and details of the test specimens.
(a) (b)
Figure 4.2 Geometery of BD test series (Ramos, Lúcio & Regan 2011)
Table 4.1 Failure load and details of BD test specimens (Ramos, Lúcio & Regan 2011)
Slab fcube(MPa) ρ(%) σcpx(MPa) σcpy(MPa) Vtest(kN)
BD2 49.0 1.28 0 0 268
BD1 52.8 1.28 7.65 0 293
BD8 44.1 1.28 0 0 251
BD4 46.0 1.28 7.65 0 293
In Table 4.1, fcube is the concrete cube compressive strength, ρ is the ratio of flexural
reinforcement, σcpx is the average in-plane compressive stress in the slab in the x direction, σcpy
is the average in-plane compressive stress in the slab in the y direction, and Vtest is the reported
punching shear failure load of the test specimen.
Silva, Regan and Melo (2005) cited experimental results of Correa (2001) in which unbonded
prestressing tendons in two of test specimens LP2 and LP3 were positioned horizontally in two
perpendicular directions at the mid thickness of slabs. As a result, the only difference between
LP2 and LP3 to the reference specimen was the presence of in-plane compressive stress. Test
specimens were 135mm thick square slabs supported on a 150mm by 150mm square columns,

80
and were loaded on 8 points as shown in Figure 4.3. The geometry and details of test specimens
LP1, LP2 and LP3 are given in Table 4.2.
Figure 4.3 Geometry of test specimens LP1, LP2 and LP3 as shown in Silva, Regan and Melo (2005)
Table 4.2 Failure load and detail of test specimens LP1, LP2 and LP3 (Silva, Regan & Melo 2005)
Slab fc’ (MPa) ρ(%) σcpx(MPa) σcpy(MPa) Vtest(kN)
LP1 50.7 1.17 0 0 327 LP2 52.4 1.17 2.19 2.19 355
LP3 52.4 1.17 4.28 4.28 415
Silva, Regan and Melo (2005) also cited test results by Kordina and Nolting (1984) in which
test specimen V6 was prestressed by a horizontal unbonded tendon at mid thickness of the slab.
Slabs were 150mm thick supported on 200mm diameter circular columns. The test setup is
shown in Figure 4.4 in which dimensions are in metres.
Figure 4.4 Geometry of test specimens V5 and V6 reported in Kordina and Nolting (1984) as shown
in Silva, Regan and Melo (2005)
560
mm
16
00 m
m
2000
mm
150
mm

81
Table 4.3 Failure load and details of test specimens V5 and V6 (Silva, Regan & Melo 2005)
Slab fc’ (MPa) ρ(%) σcpx(MPa) σcpy(MPa) Vtest(kN)
V5 36.8 0.9 0 0 349.5
V6 30.4 0.62 2.19 1.77 375
From the presented experimental specimens, it can be concluded that an increase in the in-plane
compressive stresses results in increase of the punching shear strength of slabs. This effect has
been included in most of the available methods for calculating punching shear strength of
prestressed slabs.
4.2.2 Effect of Eccentricity of Prestressing Tendon on the Punching Shear Strength of
Flat Plates
Most of reported experimental results simultaneously investigated the effect of eccentricity of
the prestressing tendons from the neutral axis with the effect of in-plane compressive stresses.
Recently, a very illustrative test series reported in Clement and Muttoni (2010) demonstrated
the effect of the eccentricity of prestressing simulated by applying bending moment mp on the
test specimens without the presence of any in-plane compressive stresses. Test specimens were
a 3000mm by 3000mm square slab with 250mm thickness and 210mm effective depth
supported on 260mm by 260mm square column. Shear forces were applied at 8 points, and the
slab was subjected to a bending moment mp at the region around the column. This was made
possible by two diagonal steel frames which were used to introduce two equal couples of forces
(Fh, -Fh, Fv, and -Fv) as shown in Figure 4.5.
Figure 4.5 Elevation view of test setup of PC test series and the bending moment diagram which
was applied to the slab without presence of in-plane forces (Clement & Muttoni 2010)

82
The bending moment is constant at the centre of the slab as shown in Figure 4.5. Two sets of
slab specimens with 0.77%, and 1.5% ratio of flexural reinforcement were tested. Each set
included one reference test specimen with no applied bending moment, one test specimen with
75 kNm/m bending moment and one specimen with 150 kNm/m bending moment. Details and
failure loads of the experiment are provided in Table 4.4.
Table 4.4 Failure load and details of test specimens reported in Clement and Muttoni (2010)
Slab fc’ (MPa) ρ(%) mp(kNm/m) Vtest (kN)
PG19 46.2 0.77 0 860
PC1 44.0 0.77 75 1201
PC3 43.8 0.77 150 1338
PG20 51.7 1.50 0 1014
PC2 45.3 1.50 75 1397
PC4 44.4 1.50 150 1433
From Table 4.4, it is clear the applied bending moment resulted in the increase of punching
shear resistance of the test specimens PC1, PC2, PC3, and PC4. It can be concluded the
eccentricity of tendons in the vicinity of the column, which creates a similar bending moment,
can play an important role in the punching shear capacity of slabs. Unfortunately, most of
current standards, reviewed in Chapter Two, do not take into account this parameter in their
punching shear formula. The only available method, which include the effect of eccentricity of
the prestressing tendon, is the decompression method which will be discussed later in this
chapter.
4.2.3 Effect of the Vertical Component of Prestressing Tendons Passing over the Slab-
Column Connection on the Punching Shear Strength of Flat Plates
The other effective parameter on the punching shear strength of prestressed slabs is the vertical
component of the prestressing tendon crossing the punching shear failure zone. This vertical
load acts against the shear force around the column and is a resultant of the deviation of
prestressing tendons. Test specimens AR8 to AR16, reported in Ramos and Lucio (2006), were
tested to investigate the latter parameter. In this test series, slab AR 9 was the reference slab.
The position and profile of the prestressing tendons of test specimens are shown in Figure 4.6
and Figure 4.7. Test specimens were prestressed by four prestressing tendons with 12.7 mm
diameter in each direction, and the position of the tendons was varied as shown in Figure 4.7.
In Table 4.5, the vertical deviation of prestressing tendons -a- and the prestressing force in
tendons -P- are given. A steel frame was used to avoid transfer of any in-plane force to the slab.
The failure load and detail of test specimens AR8 to AR16 are provided in Table 4.5.

83
(a)
(b)
Figure 4.6 (a) Plan view of test specimens AR8-AR16 (b) Profile of prestressing tendons (Ramos &
Lucio 2006)
Figure 4.7 Position of prestressing tendons in test specimens AR8-AR16 (Ramos & Lucio 2006)

84
Table 4.5 Failure load and details of test specimen AR8-AR16 (Ramos & Lucio 2006)
Slab fc’ (MPa) ρ(%) a(mm) P(kN) Vtest (kN)
AR9 41.6 1.68 0 0 251
AR8 37.1 1.68 40.3 448 380
AR10 41.4 1.68 40.5 348 371
AR11 38.0 1.68 41.9 239 342
AR12 31.3 1.68 36.8 448 280
AR13 32.5 1.68 38.3 446 261
AR14 28.2 1.68 35.2 431 208
AR15 31.7 1.68 36.9 445 262
AR16 30.6 1.68 41.5 442 351
As shown in Figure 4.7, prestressing tendons in AR8, AR10, AR11, and AR16 are concentrated
around the column, and prestressing tendons are positioned outside the column band in test
specimens AR12, AR13, AR14 and AR15. Considering the failure loads, presented in Table
4.5, the test specimens in which the tendons are passing over the column show higher punching
shear resistance as compared to the slabs with prestressing tendons outside the column band. It
can be concluded the vertical component of the prestressing force crossing the failure surface
increases the strength of prestressed slabs. Ramos and Lucio (2006) suggested that the tendons
passing within the distance of d/2 from the faces of the column are effective in increasing the
punching shear strength of prestressed concrete slabs.
4.3 Ultimate Punching Shear Strength of Prestressed Flat Plates Using the
Decompression Method
Most internationally recognised standards use the “principal tensile stress” approach to include
the effects of prestressing. Generally, the allowable shear stress on the control perimeter is
increased by adding a percentage of the horizontal prestressing stress. Also the majority of
standards include the vertical force, resulting from the deviation of the tendons passing the
critical perimeter, in punching shear formulae. A shortcoming in the “principal tensile stress”
approach is that the effect of eccentricity of prestressing tendons has been neglected.
In the “equivalent reinforcement ratio” approach, the prestressed reinforcement, or the
prestressing stress is converted to the equivalent normal reinforcement. Then the equivalent
reinforcement ratio is added to the actual ratio of normal reinforcement to be used in the
punching shear formula. Similar to “principal tensile stress” approach, this method does not

85
take into account the effect of eccentricity of tendons on the punching shear strength of
prestressed slabs.
Decompression approaches are more mechanically acceptable and promising as they take into
account all of the actions imposed on the slab by prestressing tendons in calculating the
punching shear strength of slabs. As discussed in section 4.2, it has been observed that the
compressive in-plane stress, the eccentricity of prestressing tendons from the neutral axis, and
the vertical component of prestressing tendons can influence the punching shear strength of
slabs.
The schematic deformation of prestressed slab after applying the prestressing forces is shown in
Figure 4.8. Vdec is the shear force at a section which corresponds to the decompression moment
being reached at that section. The amount of compressive stress in the extreme fiber depends on
the intensity of force in the tendons and also the eccentricity of tendons from the neutral axis of
the section. Therefore, the decompression action is divided into two components, Vo which is
the force needed to cancel out the compressive stress of the in-plane force of prestressing -Np- at
the outermost fibre, and Ve which is the force needed to cancel out the compressive stress from
the imposed bending moment of prestressing Mp in the outermost fibre. After the
decompression stage the remaining punching shear strength of prestressed slab is assumed to be
equal to the similar slab without the presence of prestressing actions. Figure 4.9 schematically
shows the component of decompression method and the punching shear strength of prestressed
slabs.
P P
Prestressing tendon
Deformed slab after application of prestressing forces
Figure 4.8 Schematic view of deformation of slab after prestressing forces are applied

86
P P
(a)
P P
(b)
Vdec=Vo+Ve
P P
(c)
Vup=Vuo+Vdec
Figure 4.9 (a) Prestressed slab (b) Prestressed slab at decompression stage (c) Punching shear
failure of prestressed slab
4.3.1 Available Decompression Methods
There are three decompression methods available in the literature for predicting the punching
shear resistance of prestressed flat plates. First is the method proposed by Regan (1985) which
presented in Chapter Two. Second is a “direct decompression approach” which presented in
Silva, Regan and Melo (2005). Third is a more complex decompression method suggested in
FIP recommendations for design of post-tensioned slabs and foundations (1998).
Silva, Regan and Melo (2005) suggested the decompression force is a force which creates a
bending moment at the face of the column annulling the compressive stress in the extreme fibre.
According to Silva, Regan and Melo (2005), the decompression force can be calculated by the

87
following equation considering the eccentricity of prestressing tendons and the in-plane
compressive stress.
%'5 � %'& � %& � %a � %'& � F&�%/F� � Fa�%/F� (4-1)
Where Vup is the ultimate punching shear strength of the prestressed slab
Vuo is the ultimate punching shear strength of similar slab with no-prestressing force using
formula of Eurocode2 (Equation 2-69)
mo=σcph2/6 in which σcp is the average in-plane compressive stress in the slab due to
prestressing.
me is the average moment due to the eccentricity of the tendon at the column.
(V/m) is the ratio between shear and the average bending moment at the face of the column.
To calculate the bending moment at the face of the column simple elastic analysis is suggested.
In Regan (1985), a linear relation between the applied force and the resultant bending moment
can be calculated. The ratio between the applied load V and the bending moment in the elastic
condition is a constant value which depends on the span of the slab, and side dimensions of the
column. For further illustration, an example is provided later in this chapter in which it is
shown how to calculate the ratio of V/m.
The other available decompression method is the formula in FIP (1998) which is more
complicated as compared to the latter method and needs iterative calculations. According to
FIP (1998), the punching strength of a prestressed slab can be calculated by the following
expression.
%'5 � %'& � %5 � %& � %a � %'& � %5 � F&, �% � %5�/�F, � Fa, � (4-2)
Where Vp is the vertical component of prestressing forcing crossing perimeter around the
column at the distance equal to the half of the thickness of slab (h/2).
V is the applied shear force.
m'o=σ’cph2/6 in which ~�5, is the average in-plane compressive stress on the critical perimeter of
slab, located at 2d from the face of the column.
F, is the average bending moment over the width of critical perimeter due V.
Fa, is the average moment due to the eccentricity of the tendon over the width of the critical
perimeter.

88
For any individual slab finite element analysis should be used to obtain m’, m’o, and m’e. This
may not be a convenient method for every day design cases.
4.3.2 Proposed Decompression Method
As discussed, all prestressing actions -Np, Vp, and Mp- are effective parameters in the punching
shear resistance of prestressed slabs. Decompression methods are the only available methods
which include Mp in the punching shear strength of slabs. Further, to take into account the
vertical component of the prestressing force, crossing within the distance of d/2 from the faces
of the column, Vp should be added to the punching shear strength of the slab as concluded in
Ramos and Lucio (2006), and Silva, Regan and Melo (2007). In the absence of a fully
satisfactory mechanical model to calculate the punching shear strength of prestressed flat plates
any proposed method should be validated by experimental results. Therefore, the author
gathered a database of 46 tested prestressed slab specimens which reported in the literatures
after mid 1980s. These tests are reported in Clement and Muttoni (2010), Ramos and Lucio
(2006), Ramos, Lucio and Regan (2011), Silva, Regan and Melo (2007) , and provided in
Appendix B.
To calculate the punching shear strength of prestressed slabs, the author suggested using a
decompression method with the proposed formula in Chapter Three. Three different scenarios
were considered to calculate the strength of prestressed slabs. In the first scenario, only the
effect of the in-plane compressive stress was considered and the punching shear strength of
prestressed slabs were calculated as Vuo+Vo in which Vuo is the punching shear strength of a
similar slab with no prestressing by Equation 3-20 and Vo is the load to cancel out the
compressive stress of the outermost compressive fibre due to the in-plane prestressing stress. In
the second scenario, strength of prestressed slabs were calculated as Vuo+Vo+Ve in which Ve is
the load to cancel out the compressive stress of the outermost compressive fibre due to
eccentricity of prestressing tendons at the face of column. For simplicity Vo, and Ve are
calculated in a manner similar to that in Equation 4-1. Finally, in the third scenario, in addition
to the previous effects, the contribution of the vertical component of the prestressing force in the
tendons was considered and the punching resistances of the slabs were calculated as
Vuo+Vo+Ve+Vp. As some details such as forces in each tendon at failure are not available for a
number of test specimens of the database, the calculated Vp in Silva, Regan and Melo (2007) for
the tendons within the distance d/2 from faces of the column were used in the latter method.
Similar to Chapter Three, the ratio of the observed failure load Vtest over the predicted punching
shear strength Vup was calculated for the three different scenarios as presented in Appendix B.
The average, standard deviation -SD-, and coefficient of variation -CV- for the ratios were
calculated and presented in Table 4.6.

89
Table 4.6 Average, SD and CV of Vtest/Vup for three different methods of calculating Vup
Method Average SD CV
Vup=Vuo+Vo 1.43 0.25 0.18
Vup=Vuo+Vo+Ve 1.16 0.19 0.16
Vup=Vuo+Vo+Ve+Vp 1.10 0.15 0.13
Figure 4.10 shows Vtest/Vup versus σcp for these methods. The third method, in which Vo, Ve, and
Vp were added to the punching shear resistance of the similar non prestressed slab, is a more
accurate method as it has an average closer to one and has a lower CV in comparison to the
other two methods.
The test specimens which isolated the effect of eccentricity of the prestressing tendons or the
effect of Vp are the ones with σcp=0 and positioned on the vertical axis of Figure 4.10. As it can
be seen in Figure 4.10, the method which takes into account Vo,Ve, and Vp predict the punching
shear strength of these test specimens with a better accuracy (Vtest/Vup closer to one).
As a result, the author of this report suggests Equation 4-3 for calculating the ultimate punching
shear strength of prestressed slabs.
%'5 � %'& � %5 � %& � %a � %'& � %5 � F&�%/F� � Fa�%/F� (4-3)
Where Vuo is the punching shear strength of similar slab with no prestressing using Equation 3-
20.
Vp is the vertical component of prestressing tendon crossing within the distance of d/2 from
faces of the column.
mo=σcph2/6 in which h is the thickness of the slab and σcp is the average in-plane compressive
stress in the slab due to prestressing.
me is the average moment due to the eccentricity of tendons from the neutral axis of the section
at the column.
(V/m) is the ratio between shear and the average bending moment at the face of column.

90
Figure 4.10 Vtest/Vup versus σσσσcp for three different methods of calculating Vup
0
0.2
0.4
0.6
0.8
1
1.2
1.4
1.6
1.8
2
2.2
2.4
0 0.5 1 1.5 2 2.5 3 3.5 4 4.5
Vte
st/V
up
σcp (MPa)
Vup=Vuo+Vo
0
0.2
0.4
0.6
0.8
1
1.2
1.4
1.6
1.8
2
2.2
2.4
0 0.5 1 1.5 2 2.5 3 3.5 4 4.5
Vte
st/V
up
σcp (MPa)
Vup=Vuo+Vo+Ve
0
0.2
0.4
0.6
0.8
1
1.2
1.4
1.6
1.8
2
2.2
2.4
0 0.5 1 1.5 2 2.5 3 3.5 4 4.5
Vte
st/V
up
σcp (MPa)
Vup=Vuo+Vo+Ve+Vp
91
It should be mentioned that all the considered prestressed test specimens had unbonded
prestressing tendons. The only available test specimens that studied the punching of prestressed
slabs with bonded tendons are the ones investigating the effect of prestressing on bridge slabs.
These tests were spanning and prestressed in only one direction (Silva, Regan & Melo 2005).
In the case of prestressed slabs with bonded prestressing tendons, the ratio of prestressing
tendon -ρp- can be added to the ratio of normal reinforcement -ρ-, and the effective depth of the
section can be calculated by Equation 2-51 (Silva, Regan & Melo 2005).
Herein an example is provided to clarify the procedure of calculating the punching shear
strength of a prestressed slab using Equation 4-3.
4.3.3 Example
The test specimen D2 reported in Silva, Regan and Melo (2005) is presented as an example to
illustrate the procedure of calculating the punching shear strength of a prestressed slab using the
suggested method.
The plan view of test specimen D2 and positions of the supports are shown in Figure 4.11 (a).
The slab was loaded by a jack below the column and supported on eight nodes. The elevation
of the test specimen and the profile of prestressing tendons are shown in Figure 4.11 (b). The
compressive strength of the concrete was 44.1 MPa, the yield strength of normal reinforcements
was 540 MPa, the effective depths of normal reinforcements was 106mm, the ratio of normal
reinforcement was 0.5%, the effective depth of prestressing tendons over the support was 90
mm, the average force of each prestressing tendon at the beginning of the test was 137 kN, and
the mean in-plane compressive stress in the concrete was 2.23 MPa.
Having the above information and given dimensions in Figure 4.11, the ultimate punching shear
strength of the test specimen can be predicted as following.
The ultimate punching shear strength of a similar slab with no prestressing Vuo according to
Equation 3-20:
%'& � ��9 � 22T/-.*�� \ 2T/2 \ 1.1+�, \ �300/2T�8.33 \ sin��/2�
Equivalent circular diameter:
D=4a/p=4µ200mm/3.14=254.8mm
The depth of neutral axis using Equation 3-8:
dn=0.8√(nρe)√(35/f’c)d

92
n=Es/Ec=200µ103/32.8µ10
3=6.09
ρe=ρ(fsy/500)=0.005(540/500)=0.0054
dn=0.8√(6.43µ0.0054)µ√(35/44.1)µ106=13.7mm
The angle of the critical crack using Equation 3-10:
tan(q)=0.0027h+0.2=0.0027µ123+0.2=0.532, so q=28°
The ultimate punching shear strength using Equation 3-20:
Vuo=p(254.8+2µ13.7/tan28°)µ13.7/2µ1.1µ44.1µ(300/13.7)0.33µsin(28°/2)=217.2kN
560m
m
1600mm
2000m
m
200mm
100mm
100mm
200mm
Prestressing tendons
(a)
100mm
200mm
100mm
123
mm
55
mm
90m
m
Prestressing tendons
V
Supports
(b)
Figure 4.11 (a) Plan view (b) Elevation view of test setup of specimen D2 as reported in Silva, Regan
and Melo (2005)

93
The decompression load to cancel out the in-plane compressive force of prestressing tendons in
the outermost fiber:
Vo=mo(V/m)
Where
mo=σcph2/6=2.23µ123
2/6=5.623kN.m/m
m=(2µV/8µ(560/2-200/2)+ (2µV/8µ(1600/2-200/2))/2000=0.11V
V/m=9.091
Vo=5.623µ9.091=51.1kN
The decompression load to cancel out the compressive stress due to the eccentricity of
prestressing tendons:
Ve=me(V/m)
In-plane force per meter= σcph
Eccentricity of tendon= (dp-0.5h)
me= σcph.(dp-0.5h)=2.23µ123µ(90-0.5µ123)=7.817kN.m/m
(V/m)=9.091
Ve=7.817µ9.091=71.1kN
The sum of vertical forces in the tendons Vp crossing the width a+d over the column:
a+d=200+106=306mm
According to Figure 4.11, there are two tendons in each direction passing the width a+d.
Considering that the profile of the tendons is “circular-arc” the vertical force in each tendon can
be calculated by the following formula:
Vp=∑ P. sin(β)
Where P is the average prestressing force in each tendon, β is the inclination of tendon from the
plane of the slab at the distance of d/2 from the face of column.
The average force in each tendon at the start of the test was 137kN. β is equal to 0.6° from
geometry of the tendon. Considering four tendons in two directions crossing a+d:

94
Vp=8µ137µsin 0.6°=11.5kN
The predicted punching shear strength of the test specimen Vup:
Vup=Vuo+Vo+Ve+Vp=217.2+51.1+71.1+11.5=350.9kN
The reported failure load:
Vtest=385kN
Vtest/Vup=385/350.9=1.09
4.4 Comparison of Design Standards
As presented in Chapter Two, AS 3600-2009, ACI 318-05, NZS 3101:2006, and CSA A23.3-04
use the same control perimeter and relatively similar formulae for punching of non-prestressed
slabs. In the case of prestressed slabs, AS 3600-2009 differ to the other standards due to
ignoring the contribution of Vp. Further, ACI 318-05, NZS 3101:2006, and CSA A23.3-04 limit
the compressive strength of the concrete f’c to 35 MPa and increasing the concrete compressive
strength more than 35 MPa does not increase the punching shear strength of prestressed slabs.
AS 3600-2009, however, allows the use of concrete compressive strength up to 100 MPa.
AS 3600-2009, ACI 318-05 and NZS 3101:2006 add 30% of the in-plane compressive stress to
the concrete shear strength to account for the prestressing contribution. CSA A.23.3-04 has a
different approach to consider the effect of prestressing as shown in Equation 2-67.
Ramos (2006) discussed two contradictory clauses 6.4.3 and 9.4.3 in Eurocode2 (2004). Clause
6.4.3 suggests the vertical component of the prestressing tendons at a distance of 2d from the
face of column should be included in punching shear strength of the slab, whereas clause 9.4.3
suggests the distance to be d/2 from the face of column. Ramos (2006) based on his
experimental results, which studied effects of the vertical component of prestressing forces and
the position of tendons on the punching shear strength of slabs, concluded that tendons
positioned within the distance of d/2 from the faces of column are effective in the punching
shear resistance of slabs.
4.4.1 Comparison with Experimental Results
AS 3600-2009 formula for punching shear -Equation 2-55- was used to predict the punching
shear strength of each test specimen of the gathered database of prestressed test series. The
ratio of the observed failure load over the predicted punching shear strength was calculated for
46 test specimens, and the average, SD, and CV of the ratios are provided in Table 4.7. As
mentioned, AS3600-2009 does not include Vp in its punching shear formula unlike other

95
standards. To investigate the effect of including Vp in the accuracy of AS3600-2009, the
vertical component of prestressing tendons, located within the distance of d/2 of the face of
column, was added to the predicted punching shear strength by AS36000-2009. The ratio of the
observed failure load to the predicted punching shear strength was calculated for each test
specimen of the database and the average, SD, and CV of these ratios is provided in Table 4.7.
As mentioned earlier according to ACI 318-05, NZS 3101:2006 and CSA A23.3-04 the
compressive strength of concrete in the punching shear formula of ACI 318-05 should not be
taken as more than 35 MPa. The ratios of the observed failure load over the predicted punching
shear resistance of test specimens are calculated using formulae of ACI 318-05, NZS 3101:2006
and CSA A23.3-04 for two scenarios namely, including the limit on the concrete strength, and
ignoring the limit on the concrete strength. The average, SD, and CV of Vtest/Vup for both
scenarios is presented in Table 4.7. Finally, Eurocode2 and DIN 1045-1 were used to predict
the strength of test specimens, and the average, SD, and CV of Vtest/Vup for these standards are
given in Table 4.7.
Table 4.7 Average, SD and CV of Vtest/Vup for AS 3600-2009, ACI 318-04, CSA A23.3-04,
Eurocode2, and DIN 1045-1:2001
Method Average SD CV
AS3600-2009 1.40 0.26 0.19
AS3600-2009 (including Vp within the distance of d/2 of the face of column)
1.29 0.19 0.14
ACI 318-05 and NZS 3101:2006 1.54 0.26 0.17
ACI 318-05 and NZS 3101:2006 (ignoring the limit on f’c)
1.46 0.23 0.16
CSA A23.3 1.32 0.24 0.18
CSA A23.3 (ignoring the limit on f’c)
1.25 0.21 0.17
Eurocode2 1.35 0.17 0.13
DIN 1045-1 1.36 0.18 0.14
The only difference between the punching shear formula of NZS 3101:2006 to the formula of
ACI316-05 is inclusion of a size factor which is effective for slabs with effective depth more
than 200mm. As the majority of available prestressed test specimens have effective depth less
than 200mm, given values for ACI 318-05 in Table 4.7 are the same for NZS 3101:2006.
In Figure 4.12 and Figure 4.13, Vtest/Vup is plotted against σcp for AS3600-2009, and for the case
when Vp is added to AS3600-2009 respectively. Considering the average, SD, and CV of
AS3600-2009 in Table 4.7 and comparing Figure 4.12 to Figure 4.13, it is clear including Vp in

96
the punching shear formula of AS3600-2009 significantly increases the accuracy of the
predicted resistance of prestressed slabs. As given in Table 4.7, the current formula of AS3600-
2009 has the highest CV and relatively high average as compared to the other standards. In
Figure 4.14, Figure 4.16, Figure 4.18, and Figure 4.19, Vtest/Vup is plotted against σcp for ACI
318-05, CSA A23.3, Eurocode2, and DIN 1045-1 respectively.
As shown, ACI 318-05 and underestimate the punching shear strength of prestressed slabs, and
its accuracy can be improved if the limit on f’c is ignored (Figure 4.15). Eurocode2 and DIN
1045-1 have a lower CV and average as compared to the other standards.
Figure 4.12 Vtest/Vup versus σσσσcp for AS3600-2009
Figure 4.13 Vtest/Vup versus σσσσcp for AS3600-2009 when Vp is included
0
0.2
0.4
0.6
0.8
1
1.2
1.4
1.6
1.8
2
2.2
2.4
0 0.5 1 1.5 2 2.5 3 3.5 4 4.5
Vte
st/V
up
σcp (MPa)
AS3600-2009
0
0.2
0.4
0.6
0.8
1
1.2
1.4
1.6
1.8
2
2.2
2.4
0 0.5 1 1.5 2 2.5 3 3.5 4 4.5
Vte
st/V
up
σcp (MPa)
AS3600-2009+Vp

97
Figure 4.14 Vtest/Vup versus σσσσcp for ACI 318-05
Figure 4.15 Vtest/Vup versus σσσσcp for ACI 318-05 ignoring the limit on f’c
Figure 4.16 Vtest/Vup versus σσσσcp for CSA A23.3-04
0
0.2
0.4
0.6
0.8
1
1.2
1.4
1.6
1.8
2
2.2
2.4
0 0.5 1 1.5 2 2.5 3 3.5 4 4.5
Vte
st/V
up
σcp (mm)
ACI 318-05
0
0.2
0.4
0.6
0.8
1
1.2
1.4
1.6
1.8
2
2.2
2.4
0 0.5 1 1.5 2 2.5 3 3.5 4 4.5
Vte
st/V
up
σcp (MPa)
ACI 318-05 no limit on f'c
0
0.2
0.4
0.6
0.8
1
1.2
1.4
1.6
1.8
2
2.2
2.4
0 0.5 1 1.5 2 2.5 3 3.5 4 4.5
Vte
st/V
up
σcp (MPa)
CSA A23.3-04

98
Figure 4.17 Vtest/Vup versus σσσσcp for CSA A23.3-04 ignoring the limit on f’c
Figure 4.18 Vtest/Vup versus σσσσcp for Eurocode2
Figure 4.19 Vtest/Vup versus σσσσcp for DIN 1045-1
0
0.2
0.4
0.6
0.8
1
1.2
1.4
1.6
1.8
2
2.2
2.4
0 0.5 1 1.5 2 2.5 3 3.5 4 4.5
Vte
st/V
up
σcp (MPa)
CSA A23.3-04 no limit on f'c
0
0.2
0.4
0.6
0.8
1
1.2
1.4
1.6
1.8
2
2.2
2.4
0 0.5 1 1.5 2 2.5 3 3.5 4 4.5
Vte
st/V
up
σcp (MPa)
Eurocode2
0
0.2
0.4
0.6
0.8
1
1.2
1.4
1.6
1.8
2
2.2
2.4
0 0.5 1 1.5 2 2.5 3 3.5 4 4.5
Vte
st/V
up
σcp (MPa)
DIN 1045-1

99
4.5 Summary
In this chapter, the proposed method in Chapter Three was extended to calculate the punching
shear strength of prestressed slabs with the use of the decompression method. The proposed
formula has the advantage of taking into account some of the effective parameters such as in-
plane compressive stresses, the eccentricity of prestressing tendons from the neutral axis, and
the vertical component of the prestressing force of tendons, crossing in the region adjacent to
the column. Then the proposed method is used to predict the strength of some of the
experimental results reported in the literature. By comparing the observed failure load to the
predicted strength, the accuracy of the model assessed. Further, formulae of the standards,
presented in Chapter Two, are used to predict the strength of the same experimental results. It is
shown the suggested formula has a better accuracy in comparison to the current design
standards. Also it is concluded, by adding the vertical component of prestressing tendons which
are located within a distance d/2 from faces of the column to the predicted punching shear
strength, the accuracy of AS 3600-2009 can be improved. ACI 318-05, NZS 3101:2006, and
CSA A23.3-04 underestimate the strength of prestressed slabs, and it is shown that by ignoring
the current limitation on f’c in these standards the accuracy of formulae in predicting strength of
prestressed slabs is improved. The ratios of the observed failure load over the strength
predicted by Eurocode2 and DIN 1045-1 show less divergence as compared to ACI 318-05,
NZS 3101:2006, and CSA A23.3-04.

100

101
Chapter Five
5 CONCENTRIC PUNCHING SHEAR OF FLAT PLATES
WITH SHEAR REINFORCEMENT
5.1 Introduction
In Chapter Two, different methods of strengthening of concrete slabs against punching shear
were presented. As discussed, the use of shear reinforcement is a more favorable solution to
increase punching shear strength of concrete floors due to its aesthetical advantages. Among
the different types of shear reinforcement available in the market, headed shear studs are the
most popular in Europe and North America because of their lower cost, easy installation
procedure, and proven adequate anchorage. Even some of the design guidelines such as ACI
Committee 421 (1999) and CSA A23.3 (2004) allow higher punching shear strength for flat
plates strengthened by shear studs compared to similar flat plates with other types of shear
reinforcement such as stirrups. Issues such as placement, anchorage, and strength of shear
reinforcement should be addressed by the designer to ensure the shear reinforcement is effective
against punching shear. Unfortunately, AS 3600-2009 does not mention shear studs as a type of
shear reinforcement that increases the punching shear strength of flat slabs unlike most
internationally recognised standards. Further, there are no guidelines or design
recommendations for the design of any type of shear reinforcement (including shearheads)
against punching shear of concrete flat plates in AS 3600-2009 unlike other internationally
recognised standards. Here in this chapter, two aspects of design of shear reinforcement are
discussed, namely detailing considerations, and ultimate strength considerations.
In the detailing section, issues such as the arrangement of shear reinforcement, the spacing
between shear reinforcement and the anchorage of shear reinforcement are discussed. In the
ultimate strength section, different types of failure in flat plates reinforced with shear
reinforcement are presented, and a method to calculate the ultimate punching shear strength is
suggested. Further, a comparison is made between the accuracy of different standards and the
proposed method in predicting the ultimate strength of flat plates with shear reinforcement.

102
5.2 Detailing of Shear Reinforcement
Although the recommendations for detailing of shear reinforcement against punching shear are
slightly different among various standards, the main objective of detailing is to provide shear
reinforcement which effectively intersects with critical shear cracks, and delays the punching
shear phenomenon.
The layout of shear reinforcement can be divided into a number of different arrangements such
as the orthogonal type arrangement recommended by standards such as ACI 318-05, CSA
A23.3-04 and NZS 3101:2006, the radial type -star-shape- arrangement recommended in
Eurocode2, DIN 1045-1, and the square arrangement recommended in BS 8110. These types of
arrangement are shown in Figure 5.1. Generally, all mentioned arrangements are capable of
increasing the punching shear strength of a slab provided they are placed symmetrically around
the column (Polak, El-Salakawy & Hammill 2005). However, the orthogonal type arrangement
is found to be more economical (Vollum et al. 2010), and the positioning of shear reinforcement
is more convenient as the flexural reinforcement is also placed orthogonally.
(a) (b) (c)
Figure 5.1 (a) Orthogonal type arrangement (b) Radial type arrangement (c) square type
arrangement of shear reinforcement for punching shear
Another important issue in detailing is the spacing between shear reinforcement. There are
restrictions on the distance between the first row of shear reinforcement and the face of the
column -so-, the radial spacing between rows of shear reinforcement -sr-, and the tangential
spacing between shear reinforcement -st- in design standards. For illustration, so, sr and st are
shown for the orthogonal and the radial arrangement of shear reinforcement in Figure 5.2.

103
st
so sr
st
srso
Figure 5.2 Radial and tangential spacing between shear rows reinforcement in flat plates
The limitation on so is to avoid a premature failure at the face of the column in which the shear
crack develops without intersecting with any of the shear reinforcement elements. This type of
failure is shown in Figure 5.3. Potential shear cracks in flat plates have an angle between 25° to
45° to the plane of the slab, so to ensure they intersect with the first row of shear reinforcement
ACI 318-05, Eurocode2 and CSA A.23.3-04 limit so to less than 0.5d. ACI-ASCE Committee
421 (1999) is more stringent and suggests to place the first row of shear reinforcement between
0.35d and 0.4d from the face of the column.
The radial spacing between two consecutive rows of shear reinforcement -sr- should be limited,
to ensure shear cracks which develop in the shear reinforced zone intersect with shear
reinforcement. ACI 318-05, CSA A23.3-04 and NZS 3101:2006 limit the radial spacing to
0.5d, whereas Eurocode2 and DIN 1045-1 allow 0.75d as the maximum radial spacing.
Further, the limitation on the tangential spacing st was introduced to provide enough
confinement for concrete during loading and reloading which is especially important for the
seismic design of flat plates (Polak, El-Salakawy & Hammill 2005). ACI 318-05, CSA A23.3-
04 and NZS 3101:2006 limit the tangential spacing to 2d, and Eurocode2 and DIN 1045-1 limit
this spacing to 1.5d.
The other important issue in the design of shear reinforcement is to ensure that shear
reinforcement can develop their tensile resistance against punching of the slab. This can be
achieved by providing enough anchorage at the ends of shear reinforcement. In Elgabry d Ghali
(1990), it was suggested shear studs with a steel strip or plate at both ends, having at least area
equal ten times of the stem, can develop a tensile stress of 414 MPa. When stirrups are
provided, they should tie to the flexural reinforcements at the top and bottom with a 135°-180°
hook to ensure the anchorage of stirrups (ACI 318-05 2005).

104
In practice, designers tend to match the spacing of punching shear reinforcements with the
spacing of top flexural reinforcement to ensure shear reinforcement will not interrupt the
flexural reinforcement, but this should not violate mentioned limitations on detailing of shear
reinforcements (Polak, El-Salakawy & Hammill 2005).
5.3 Ultimate Strength of Flat Plates with Shear Reinforcement
Different types of failure were observed in experimental tests on slabs with shear reinforcement.
The first type of failure occurs when the critical crack develops from the bottom surface of the
slab at the face of column to the top surface of the slab with a steep angle as shown in Figure
5.3. In this type of failure, the critical crack misses the first row of provided shear
reinforcement and does not intersect with any of the shear reinforcement. As mentioned in the
previous section, this failure can be avoided by limiting the maximum distance between the first
row of shear reinforcement and the face of the column. The second type of failure occurs when
the critical crack propagates in the region where shear reinforcement is provided. In this case,
shear reinforcement intersects with the surface of failure and increases the strength of slab by
arresting the critical crack from opening. The third type of failure is a phenomenon known as
“web crushing failure” in which the concrete in the region where shear reinforcement is
provided crushes prior to the latter failure. The fourth type of failure occurs when a critical
shear crack develops outside the shear reinforced region. The fifth type of failure is the flexural
failure which can precede any of the other mentioned types of failure. In the case of flexural
failure, the slab shows a ductile behaviour prior to the failure and the ultimate flexural strength
of slabs can be calculated by yield-line theory.
Figure 5.3 Different types of punching shear failure in flat plates with shear reinforcement
Column CL Shear reinforcement
Premature failure at the column face
(the critical crack does not intersect with the shear reinforcement)
Failure in the shear reinforced zone
(the critical crack intesrsect with the shear reinforcement
or web crushing occurs)
Failure outside the shear reinforced zone
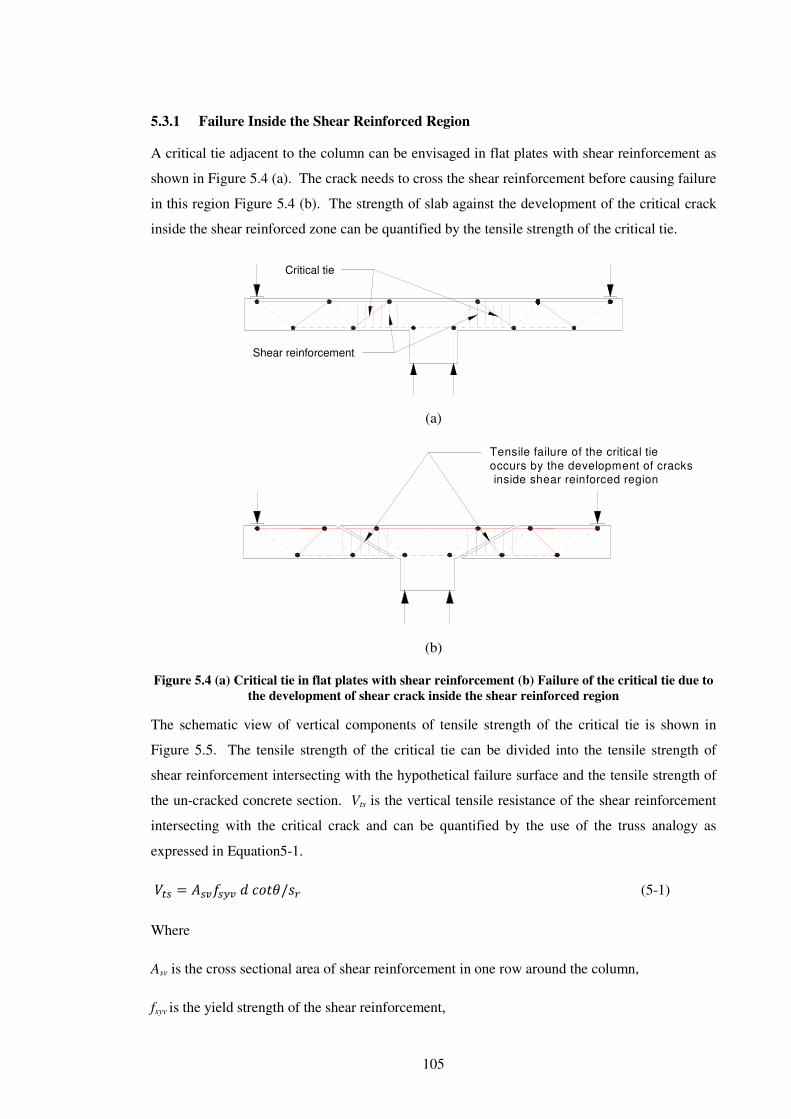
105
5.3.1 Failure Inside the Shear Reinforced Region
A critical tie adjacent to the column can be envisaged in flat plates with shear reinforcement as
shown in Figure 5.4 (a). The crack needs to cross the shear reinforcement before causing failure
in this region Figure 5.4 (b). The strength of slab against the development of the critical crack
inside the shear reinforced zone can be quantified by the tensile strength of the critical tie.
(a)
Tensile failure of the critical tie
occurs by the development of cracks
inside shear reinforced region
(b)
Figure 5.4 (a) Critical tie in flat plates with shear reinforcement (b) Failure of the critical tie due to
the development of shear crack inside the shear reinforced region
The schematic view of vertical components of tensile strength of the critical tie is shown in
Figure 5.5. The tensile strength of the critical tie can be divided into the tensile strength of
shear reinforcement intersecting with the hypothetical failure surface and the tensile strength of
the un-cracked concrete section. Vts is the vertical tensile resistance of the shear reinforcement
intersecting with the critical crack and can be quantified by the use of the truss analogy as
expressed in Equation5-1.
%RP � iP¤+PQ¤ 2 �^-�/;k (5-1)
Where
Asv is the cross sectional area of shear reinforcement in one row around the column,
fsyv is the yield strength of the shear reinforcement,
Critical tie
Shear reinforcement

106
sr is the radial spacing between rows of shear reinforcement,
q is the angle between the critical crack and the plane of slab.
In designing members undergoing one-way shear with shear reinforcement, q is assumed to be
between 30° to 45° (Warner et al. 1998). This is in agreement with the reported angle of the
critical crack in two-way flat plate specimens in Pisanty (2005). ACI 318-05, NZS 3101:2006,
and CSA A23.3-04 use q=45°, whereas Eurocode2 uses q=34° angle to calculate the
contribution of shear reinforcement in shear resistance of slabs under punching shear.
Column CL
D/2
dnd
sr
Concrete compression zone
θ
VtsVtc
Critical crack
Shear reinforcements
fct,sp
Figure 5.5 Vertical components of the critical tie which resist punching shear
In addition to the tensile strength of shear reinforcement, there is a contribution from the tensile
strength of the concrete in the compression zone as shown in Figure 5.5. Warner et al. (1998)
discussed that ignoring the contribution of the concrete in the calculation of the ultimate shear
strength of members with shear reinforcement results in a very conservative prediction of the
shear capacity of the member. This is recognised by most of design standards and a proportion
of the ultimate shear strength of concrete is added to the strength of shear reinforcement to
calculate the ultimate punching shear strength of the slab. There is no rationale for the latter
method and the contribution of concrete was obtained empirically.
As shown in Figure 5.5, the author suggested the contribution of the un-cracked concrete can be
taken into account by including the vertical component of the splitting strength of the un-

107
cracked concrete zone. Considering splitting of the compressive zone in 3D, Vtc can be
expressed as following.
%R� � �4. � 42T/-.*��� 2T/-.*��+�R,P5�^;� for slabs with square column (5-2)
%R� � ��9 � 42T/-.*��� 2T/-.*��+�R,P5�^;� for slabs with circular column
Where
a is the side dimension of square column,
D is the diameter of circular column,
dn is the depth of the neutral axis,
q is the angle between the critical crack and the horizontal plane of slab.
fct,sp is the splitting tensile strength of concrete which can be calculated by Equation 5-3.
As discussed in Chapter Three, the depth of the neutral axis can be calculated using Equation 3-
8. Considering recommendations of Model Code 90 (1993) the splitting tensile strength of
concrete can be calculated by Equation 5-3.
+�R,P5 � 0.337�+�,���/3� (5-3)
In which fc’ is the concrete compressive strength in MPa.
The ultimate resistance of a slab against the development of the critical crack inside its shear
reinforced zone -Vit- can be obtained by Equation 5-4.
%WR � %RP � %R� (5-4)
Where, Vts and Vtc are calculated from Equation 5-1 and 5-2 respectively.
As mentioned, another type of failure is web-crushing failure. This failure can occur in flat
plates which are heavily reinforced with shear reinforcement. In these slabs the crushing of the
concrete in the shear reinforced zone may occur prior to the failure of the critical tie in tension.
The web-crushing capacity of two-way concrete slab can be quantified by the available
empirical formulae in standards. AS 3600-2009, ACI 318-05, and NZS 3101:2006 specify the
web crushing strength of a given slab by Equation 5-5.

108
%y�k � 0.5A+�,�&2 (5-5)
Where
Vwcr is web-crushing strength of the slab,
fc’ is concrete compressive strength in MPa,
d is the effective depth of slab,
bo is the perimeter around the column at a distance of d/2 from the face of column.
The lesser of Vit, Vwcr and Vflex should be chosen as the ultimate strength of the flat plate inside
its shear reinforced zone -Vuin- is the lesser of the.
%'WT � F<* �%WR, %y�k, %hKa[� (5-6)
A database of reported experimental test series, which investigated the punching shear strength
of flat plates with shear reinforcement, was gathered from journal articles such as Vollum et al.
(2010), Birkle and Dilger (2008), Gomes and Regan (1999), Marzouk and Jiang (1997),
Mokhtar, Ghali and Dilger (1985), and Seible, Ghali and Dilger (1980). Test specimens with
shear reinforcement placed in the orthogonal type arrangement were used, and these test
specimens were reinforced with different types of shear reinforcement such as shear stud rails,
stirrups, and short cut-offs of steel I beams.
The specimens which reportedly failed in the shear reinforced region were separated to
determine a value for q, inclination of the critical crack, in Equations 5-1 and 5-2. Vit was
calculated for three different scenarios q=45°, q=34°, and q=30°. Then for each scenario, the
ultimate strength of each test specimen of the database which failed inside the shear reinforced
zone Vuin was calculated using Equation 5-6. The ratio of the observed failure load -Vtest- over
the predicted ultimate strength was calculated as provided in Table 5.1. The average, SD, and
CV of Vtest/Vuin were calculated for each scenario to enable the author to choose a value for q.
As it is shown in Table 5.1, q=30° results in an average closer to one and a lower, SD and CV.
Consequently, q=30° is suggested to be used in Equation 5-1 and 5-2.

109
Table 5.1 Vtest/Vuin for test specimens in which failure occurred inside the shear reinforced zone
Reference Specimen
Vtest/Vuin
for
q=30°
Vtest/Vuin
for
q=34°
Vtest/Vuin
for
q=45°
(Birkle & Dilger 2008)
2 1.15 1.15 1.43
8 0.95 1.15 1.28
9 1.14 1.57 1.66
11 0.93 1.08 1.22
12 1.00 1.36 1.47
(Mokhtar, Ghali & Dilger 1985)
AB3 1.02 1.02 1.06
AB4 0.90 0.90 0.90
AB5 0.96 1.02 1.16
AB6 0.90 0.90 0.90
AB8 0.92 0.92 0.92
(Vollum et al. 2010) 2 1.16 1.16 1.16
5 1.18 1.18 1.18
(Gomes & Regan 1999) S2 1.15 1.60 1.68
Average 1.03 1.15 1.23
Standard deviation 0.11 0.23 0.26
Coefficient of variation 0.11 0.20 0.21
5.3.2 Failure Outside the Shear Reinforced Region
As mentioned, in some test specimens punching shear failure occurred outside the shear
reinforced zone. The shear strength of slabs outside the shear reinforced zone can be treated
similar to the shear in beams outside the shear reinforced zone as the confining effect of the
tangential stress is significantly lower in regions away from the column in comparison with the
region adjacent to the column (Polak, El-Salakawy & Hammill 2005).
To deal with this type of failure, standards such as ACI 318-05 and Eurocode2 define a
perimeter outside the shear reinforced zone and require the shear stress on the perimeter to be
less than the allowable one-way shear stress. Unfortunately, AS 3600-2009 does not provide
any provision for designers to check the shear strength outside the shear reinforced zone of slabs
even if they are reinforced with shearheads. Considering that AS 3600-2009 has a very similar
one-way shear formula to the one used in Eurocode2, it is suggested by the author to adopt a
similar control perimeter as Eurocode2 for AS 3600-2009. Although using a similar formula,
Eurocode2 and Model Code 90 do not agree on the distance of the outer control perimeter to the
last row of shear reinforcements. Eurocode2 suggests the control perimeter at a distance equal
to 1.5d from the last row of shear reinforcements whereas Model Code 90 suggests the distance
of 2d. Figure 5.6 shows the outer perimeter for the case of orthogonal type arrangement of
shear reinforcement in Eurocode2 and Model Code 90 and it can be calculated by Equation 5-7.

110
k.d
k.d
st
X
Figure 5.6 Eurocode2 and Model Code 90 control perimeter outside the orthogonal shear
reinforced zone
�&'R � �4;R � 2=�2 � 4√2�� ` �4;R � 2=�2 � 82� (5-7)
Where, uout is the critical perimeter outside the shear reinforced zone, k, X and st are shown in
Figure 5.6.
In this research, test specimens in the gathered database which reportedly failed by punching
outside the shear reinforcement were separated and used to determine the distance of the outer
control perimeter from the last row of shear reinforcement. Three different scenarios were
considered for the outer control perimeter, namely k=1, k=1.5, and k=2. Considering the one-
way shear formula of AS3600-2009, the ultimate strength of the slab outside of the shear
reinforced zone can be calculated by Equation 5-8.
%'&'R � 1.1�1.6 � 2/1000� �?+�,��/3� �&'R 2 (5-8)
Where, uout is given in Equation 5-7 and f’c in MPa.
The punching shear strength of each test specimen, which reportedly failed in the region outside
the reinforced zone, is calculated using Equation 5-8 using three different values of k. Then the
ratio of the observed failure load over the predicted punching shear strength was calculated as
given in Table 5.2. The average, SD, and CV of Vtest/Vuout for each scenario were calculated and
presented in Table 5.2.
√2 X§2d

111
Table 5.2 Vtest/Vuout for test specimens in which failure occurred outside the shear reinforced zone
Reference Specimen
Vtest/Vuout
for
k=1
Vtest/Vuout
for
k=1.5
Vtest/Vuout
for
k=2
(Birkle & Dilger 2008) 4 1.36 1.19 1.06
(Marzouk & Jiang 1997) HS22 1.31 1.15 1.03
HS23 1.28 1.12 1.00
(Seible, Ghali & Dilger 1980)
SC7 1.46 1.29 1.16
SC11 1.39 1.23 1.11
SC12 1.39 1.23 1.11
SC13 1.36 1.20 1.08
SC9 1.39 1.23 1.10
(Gomes & Regan 1999) S4 1.59 1.36 1.18
S5 1.55 1.32 1.15
Average 1.41 1.23 1.10
Standard deviation 0.10 0.07 0.06
Coefficient of variation 0.07 0.06 0.05
In Table 5.2, k=2 results in a better prediction of ultimate punching shear strength of slabs. The
author suggests a similar outer control perimeter as the one shown in Figure 5.6 at the distance
of 2d from the last row of shear reinforcement. This control perimeter can be used with the one-
way shear formula of AS3600-2009 for calculating the punching shear strength of slabs outside
their shear reinforced zone.
5.3.3 Summary of the suggested method
To summarise, the orthogonal arrangement of the shear reinforcement is suggested for the
design proposes due to its convenient placement as compared to the other types of arrangement.
The radial spacing between the first row of shear reinforcement and the face of the column
should be limited to d/2. This is similar for the radial spacing between consecutive rows of
shear reinforcement. Further, the tangential spacing of shear reinforcement should not be more
than 2d. For shear studs, both ends should have an area of at least ten times that of the stem,
and for stirrups, they should tie to the top and bottom flexural reinforcement with a 135°-180°
hook.
For strength considerations, the punching shear strength inside the shear reinforced zone can be
calculated as the lesser of Equation 5-5, and Equation 5-4. Further, the punching shear strength
outside the shear reinforced zone can be calculated by Equation 5-8. The lesser of the

112
aforementioned strengths and the flexural strength, calculated by yield-line theory, determines
the ultimate strength of the slab.
5.3.4 Example
Herein, the ultimate punching shear strength of test specimen 12 from (Birkle & Dilger 2008) is
calculated as an example to illustrate the procedure of the suggested method. Figure 5.7 (a)
shows the top view of the test specimen 12. In Figure 5.7 (a), Bc is equal to 1900mm, and side
dimension of the square column is a=350mm. Figure 5.7 (b) shows the arrangement and the
radial spacing of the shear reinforcement. The effective depth of the test specimen is d=260mm,
the concrete compressive capacity is f’c=33.8MPa, the tensile flexural reinforcement ratio is
ρ=1.1%, and the yield strength of the tensile reinforcement is fsy=524MPa. The provided shear
reinforcement is headed shear stud with the cross sectional area equal to 127mm2, and yield
strength equal to 409MPa.
(a) (b)
Figure 5.7 (a) Top view of test specimen 12 (b) Arrangement of shear reinforcements in the test
specimen 12 (Birkle & Dilger 2008)
Ultimate strength of slab using yield-line theory
According to (Birkle & Dilger 2008), Vflex for a circular slab with a square column is:
Vflex=2p (ρ fsy d2(1-0.59ρfsy/f’c))(Bc)/(Bc-(4a/p))
Vflex=2p(0.011µ524µ2602µ(1-0.59µ0.011µ524/33.8))µ1900/(1900-4µ350/p)=2875kN
Ultimate web crushing strength
Vwcr=0.5√f’c (bo d)=0.5√33.8µ(4µ350+4µ260)µ260=1844kN
Ultimate strength of slab if the crack develops inside the shear reinforced zone
Vit=Vts+Vtc

113
Vts=Asv fsyv d cotq / sr
Eight shear studs are provided in one row of shear reinforcements and be q=30° as suggested
earlier in this chapter.
Vts=(8µ127)µ409µ260µcot30°/195=960kN
Vtc= (4a+4dn/tanq) (dn/tanq) fct,sp cosq
dn=0.8√(nρe)√(35/f’c)d
n=Es/Ec=200µ103/29.4µ10
3=6.8
ρe=ρ(fsy/500)=0.011(524/500)=0.0115
dn=0.8√(6.8µ0.0115)µ√(35/33.8)µ260=59.2mm
fct,sp=0.337(33.8)(2/3)
=3.52MPa
Vtc=(4µ350+4µ59.2/tan30°)µ(59.2/tan30°)µ3.52µcos30°=566kN
Vuit=Vts+Vtc=960+566=1523kN
Ultimate punching shear strength of the test specimen outside the shear reinforced zone
Vuout=1.1 (1.6-d/1000) (ρf’c)(1/3)
uout d
uout= lesser of (4st+2kpd+4√2X) and (4st+2kpd+8d)
uout= (4µ350+2µ2µpµ260+4√2µ(90+5µ195))=10692mm
§ (4µ350+2µ2µpµ260+8µ260)=6747mm
uout=6747mm
Vuout=1.1µ(1.6-260/1000) µ(0.011µ33.8)(1/3)µ6747µ260=1859kN
The ultimate strength of the slab is the lesser of above calculated strengths:
Vus=min(Vwcr, Vuit, Vuout, and Vflex)=1523kN
Reported failure load 1520kN, and the location of failure was reported inside the reinforced
zone as predicted above.
Vtest/Vus=1.00

114
5.4 Comparison of Experimental Results with Design Standards
ACI 318-05, CSA A23.3-04, Eurocode2, and the proposed method were used to predict the
ultimate punching shear strength of the gathered database which included 30 slab specimens
with shear reinforcement. DIN 1045-1 does not recognise the orthogonal type arrangement of
shear reinforcement (Hegger, Sherif & Beutel 2005). To compare the accuracy of mentioned
standards and the proposed formulae, the ratio of Vtest/Vus for each slab were calculated. The
average, SD, and CV of Vtest/Vus for each standard and the proposed method are also given in
Table 5.3. From Table 5.3, it can be concluded ACI 318-05 underestimates the punching shear
strength of test specimens with shear reinforcement, and the accuracy of the formula deviates
significantly. As presented in Chapter Two, the main difference between the CSA A23.3-04
and ACI 318 approaches is that the CSA A23.3-04 adds a higher proportion of the concrete
shear strength to the ultimate punching strength of slabs when shear studs are provided. As a
result CSA A23.3-04 has a closer average to unity and lower CV as compared to the ACI 318-
05. The proposed method and Eurocode2 give a more accurate prediction of the ultimate
strength of slabs with shear reinforcement in comparison with the other two standards.
Table 5.3 Average, SD and CV of Vtest/Vus for ACI 318-05, CSA A23.3, Eurocode2, and the proposed method
Method Average SD CV
ACI 318-05 1.47 0.41 0.28
CSA A23.3 1.26 0.31 0.24
Eurocode2 1.11 0.10 0.09
Proposed method 1.07 0.10 0.09
5.5 Summary
In this chapter, the available recommendations in design guidelines and standards for detailing
of shear reinforcement were reviewed, and the importance of specifying proper spacing between
the shear reinforcement to avoid premature failure was discussed. Then different types of
potential failure in flat plates were explained. In this research it is assumed that the failure
inside the reinforced zone occurred either by the failure of the critical tie in the vicinity of the
column or by web crushing of the slab. A method proposed to calculate the ultimate strength of
the critical tie using a refined truss analogy. In this method, the contribution of the tensile
strength of shear reinforcement intersecting with the critical crack was added to the contribution
of the tensile strength of the un-cracked concrete zone. Further, a control perimeter outside the

115
shear reinforced zone of orthogonal type shear reinforcement arrangement was proposed. This
can be used with the current one-way shear formula of AS 3600-2009 to calculate the punching
shear strength of flat plates outside the shear reinforced zone. Finally, formulae from ACI 318-
05, CSA A23.3, Eurocode2, and the proposed method were used to predict the ultimate
punching shear strength of a number of test specimens reported in the literature, and the
accuracy of each method assessed against the experimental results. It was observed ACI 318-
05, and CSA A23.3 have lower accuracy as compared to Eurocode2 and the proposed method.

116

117
Chapter Six
6 SUMMARY AND CONCLUSIONS
Summary and conclusions of this thesis can be divided into four sections as follow.
6.1 Summary and Findings of Literature Review
• Earlier models for symmetric punching shear failure of flat plates were reviewed and
discussed briefly in Chapter Two. There are various approaches available to quantify
the ultimate punching shear strength of flat plates some of which are significantly
different to others.
• Current available methods to include effects of prestressing forces in the punching shear
strength of flat plates such as the principal tensile stress approach, the equivalent
reinforcement ratio approach, and the decompression approach were discussed.
• The strengthening techniques for increasing punching shear strength of prospective
concrete slabs and existing concrete slabs were briefly presented. This was followed by
a review of different types of shear reinforcement for strengthening of flat plates.
• Current provisions of some of the internationally recognised standards for design of
concrete structures such as ACI 318-05, AS 3600-2009, BS 8110-97, CSA A23.3-04,
DIN 1045-1:2001, Eurocode2, and NZS 3101:2006 for punching shear of flat plates
with no unbalanced moment were reviewed.
• AS 3600-2009 neglects effects of the tensile reinforcement ratio and the slab size factor
on the punching shear stress resistance of flat plates and differs from most of
aforementioned standards.
6.2 Concentric Punching Shear Strength of Flat Plates
• The strut-and-tie method was used to model the transfer of shear force from the slab to
the column. Based on experimental observations it is plausible to assume the punching
shear failure occurs as a result of crushing of the critical concrete strut adjacent to the
column.
• In this study, the basis of the critical compressive strut model, developed by previous
researchers, was used to quantify the punching shear strength of flat plates based on the

118
assumption of crushing of the critical compressive strut. In this model, there is no
consensus on the method to calculate the depth of the neutral axis in the vicinity of the
slab-column connection, compressive strength of the critical prismatic concrete strut,
and the size effect factor, and the inclination of the critical shear crack.
• Three different available methods in the literature were considered to calculate the
depth of the neutral axis, three different formulae were used to calculate the
compressive strength of the critical strut, four different conditions were considered to
calculate the size effect factor, and two different methods were considered to predict the
inclination of the critical shear crack. In total, 72 different formulae were constructed
using various combinations of the above parameters to calculate the punching shear
strength of flat plates. To evaluate the accuracy of these formulae, 152 slab test
specimens, reported in the literature, were gathered. The ratio of the observed failure
load to the predicted failure load was calculated for each of the test specimens using the
mentioned formulae. The average, standard deviation, and coefficient of variation of
these ratios were calculated for each formula. The formula which produced the lowest
coefficient of variation and an average ratio close to unity was selected to predict the
punching shear strength of flat plates.
• The selected formula produced an average of 1.23, standard deviation of 0.19, and
coefficient of variation of 0.15. Further, it was shown the predicted strengths by this
formula have a consistent accuracy for a wide range of slab thicknesses, tensile
reinforcement ratios, and concrete compressive strengths.
• Provisions of AS 3600-2009, ACI 318-05, CSA A23.3-04, DIN 1045-1:2001,
Eurocode2, and NZS 3101:2006 were used to predict the punching shear strength of the
same 152 experimental specimens. The ratio of the actual failure load to the predicted
punching shear strength for each test specimen was calculated. These ratios for AS
3600-2009 and ACI 318-05 have the average of 1.39, standard deviation of 0.28, and
coefficient of variation 0.20. It seems AS 3600-2009, and ACI 318-05 overestimate the
punching shear strength of thick slabs, and underestimate the punching shear strength of
heavily reinforced slabs due to neglect of size effects, and tensile reinforcement effect
in their punching shear formula. NZS 3101:1006 has a similar punching shear to AS
3600-2009 except for including a size effect factor which results in a better prediction
of punching shear strength of thick concrete slabs. DIN 1045-1:2001, and Eurocode2
are capable of predicting the punching shear strength of slabs with a better accuracy as
compared to the other mentioned standards which can be attributed to the inclusion of
the tensile reinforcement ratio. It seems the size factor used in formula of DIN 1045-
1:2001 and Eurocode2 is not capable of maintaining its accuracy for a wide range of
slab thicknesses.

119
6.3 Concentric Punching Shear Strength of Prestressed Flat Plates
• It was discussed that the presence of prestressing tendons can introduce three actions
adjacent to the slab-column connection, namely the in-plane compressive stress due to
prestressing force in tendons, the bending moment due to the eccentricity of tendons
from the neutral axis of the section, and the vertical component of prestressing force in
tendons due to the slope of profile of the tendons. Based on some of the reported
experimental results of prestressed slabs, it was shown these three actions affect the
punching shear strength of slabs.
• The proposed formula for the punching shear strength of concrete slabs with no
prestressing was extended by a decompression method to include the effect of
prestressing forces on the punching shear strength of flat plates. Three different cases
were investigated for the proposed method, namely a case in which only the effect of
the in-plane compressive stress is considered, a case in which the effect of in-plane
force and the effect of the eccentricity of tendons are considered, and a case in which
the effect of all three actions of prestressing forces are considered. To evaluate accuracy
of each case, 46 prestressed slab test specimens, reported in the literature and that had
failed by punching shear, were gathered. The average, standard deviation, and
coefficient of variation of the ratios of the observed failure load to the predicted strength
were calculated for the three cases. The third case had a lower coefficient of variation
of (0.13) and an average closer to one (1.10) as compared to the other two cases. This
method was suggested by the author to be used to calculate the punching shear strength
of prestressed flat plates.
• The current provisions of AS 3600-2009 were used to predict the punching shear
strength of the gathered results of prestressed test specimens. The average, standard
deviation, and coefficient of variation of ratios of the observed failure load to the
predicted failure were 1.40, 0.26, and 0.19 respectively.
• The current punching shear formula of AS 3600-2009 does not include the contribution
of the vertical component of the prestressing tendons in its punching shear formula. It
was shown by including the vertical component of the prestressing tendons, positioned
within the distance of d/2 from the face of column, the accuracy of the current
provisions of AS 3600-2009 can be improved. The average, standard deviation and
coefficient of variation of ratios of the observed failure load to the predicted failure load
are improved to 1.29, 0.19, and 0.14 respectively.
• The provisions of ACI 318-05, NZS 3101:2006, and CSA A23.3-04 were used to
predict the punching shear strength of the gathered results of test specimens. These
standards limit the concrete compressive strength in their formula to the maximum

120
value of 35MPa. It was shown if this limitation is neglected, similar to AS 3600-2009,
a better accuracy in the prediction of punching shear strength of prestressed slabs can be
obtained.
• Eurocode2 and DIN 1045-1:2001 were bench marked against the experimental results,
and both standards show a very good accuracy in prediction of the punching shear
strength of prestressed slabs as compared to ACI 318-05, AS 3600-2009, NZS
3101:2006 and CSA A23.3-04.
6.4 Concentric Punching Shear Strength of Flat Plates with Shear
Reinforcement
• Issues such as arrangement, spacing, and adequate anchorage for detailing of shear
studs and stirrups, which are not mentioned in AS 3600-2009, were discussed.
• Different modes of failure which were observed in the experimental tests by previous
researchers were reviewed.
• It was suggested that the premature failure can be prevented by limiting the radial
spacing of shear reinforcement.
• The formula in ACI 318-05 and AS 3600-2009 for calculating the web crushing
strength of slabs was suggested to be used to quantify the web crushing strength of
slabs.
• To calculate strength of flat plates for the case of failure by the critical shear crack
developing inside the shear reinforced zone, a method was proposed based on the
tensile strength of the critical tie adjacent to the column. This method calculates the
tensile strength of the critical tie by considering the tensile strength of shear
reinforcements intersecting with the critical shear crack and tensile strength of
uncracked concrete zone.
• To calculate punching shear strength outside the shear reinforced zone, it was suggested
to use the one-way shear formula. This approach is adopted by most other standards
such as ACI 318-05 and Eurocode2. Considering the failure load of test specimens
which reportedly failed outside the shear reinforced zone, a control perimeter at a
distance of 2d outside the shear reinforced zone was suggested to be used with the one-
way shear formula of AS 3600-2009 to quantify the punching shear strength of flat
plates outside the shear reinforced zone.
• The ultimate strength of flat plates reinforced with shear reinforcement can be
determined as the lesser of aforementioned strengths and its flexural strength.
• Results from 30 test specimens were gathered to evaluate the latter approach. The ratio
of the observed failure load to the predicted strength was calculated for each test

121
specimen. The average, standard deviation, and coefficient of variation for these ratios
are 1.07, 0.10, and 0.09 respectively.
• This method shows a very good accuracy in prediction of the strength of flat plates
reinforced with shear reinforcements.
• ACI 318-05, CSA A23.3-04, and Eurocode2 were used to predict the punching shear
strength of the same gathered test specimens. The ratios of the observed failure load to
the predicted strength were calculated for the test specimens. The average, standard
deviation, and coefficient of variation of these ratios for ACI 318-05 are 1.47, 0.41, and
0.28. On the other hand, CSA A23.3-04 produced an average of 1.26, standard
deviation of 0.31, and coefficient of variation of 0.24. Eurocode2 resulted in an average
of 1.11, standard deviation of 0.10, and coefficient of variation of 0.09 which shows it is
significantly more accurate as compared to ACI 318-05 and CSA A23.3-04.

122

123
References
ACI-ASCE Commitee 423 1974, 'Tentative recommendations for prestressed concrete flat
plates', ACI Structural Journal, vol. 71, no. 2, February, pp. 61-71.
ACI-ASCE Committee 326 1962, 'Shear and diagonal tension ', ACI Structural Journal, vol. 59,
no. 3, March, pp. 353-396.
ACI-ASCE Committee 421 1999, Shear Reinforcement for Slabs (ACI 421.1R-99), American
Concrete Institute, Farmington Hills, Michigan, 15 pp.
ACI 318-05 2005, Building Code Requirements for Structural Concrete (ACI 318-05) and
Commentary, American Concrete Institute, Framington Hills, Michigan.
Adetifa, B & Polak, MA 2005, 'Retrofit of slab column interior connections using shear bolts',
ACI Structural Journal, vol. 102, no. 2, March, pp. 268-274.
Alander, C 2004, Advanced Systems for Rational Slab Reinforcement, ERMCO, 14 pp.
<http://www.bamtec.com/elements/E2_Final_ALANDER.pdf>.
Alexander, SDB 1990, Bond Model for Strength of Slab-Column Joints, thesis, Department of
Civil Engineering, University of Alberta Edmonton, 228 pp.
Alexander, SDB 1999, 'Strip design for punching shear ', in TC Schaeffer (ed.) The design of
two-way slabs, vol. SP 183, American Concrete Institute Farmington Hills, Michigan.
Alexander, SDB & Simmonds, SH 1987, 'Ultimate strength of slab-column connections', ACI
Structural Journal, vol. 84, no. 3, May, pp. 255-261.
Alexander, SDB & Simmonds, SH 1992, 'Bond model for concentric punching shear', ACI
Structural Journal, vol. 89, no. 3, May, pp. 325-334.
AS 3600 2009, Australian Standard Concrete Structures, Standards Australia, Homebush,
NSW.
Birkle, G & Dilger, W 2008, 'Influence of slab thickness on punching shear strength', ACI
Structural Journal, vol. 105, no. 2, March, pp. 180-188.
Braestrup, MW, Nielsen, MP, Jensen, BC & Bach, F 1976, Axisymmetric Punching of Plain and
Reinforced Concrete, Research Laboratory, Technical University of Denmark,
Copenhagen.
Broms, CE 1990, 'Punching of flat plates - a question of concrete properties in biaxial
compression and size effect. ', ACI Structural Journal, vol. 87, no. 3, March, pp. 292-
304.

124
Broms, CE 2005, Concrete Flat Slabs and Footings Design method for Punching and Detailing
for Ductility, thesis, Department of Civil and Architectural Engineering, Royal Institute
of Technology, Stockholm, 114 pp.
Broms, CE 2007, 'Ductility of flat plates: Comparison of shear reinforcement systems ', ACI
Structural Journal, vol. 104, no. 6, November, pp. 703-711.
Broms, CE 2009, 'Design method for imposed rotations of interior slab-column connection ',
ACI Structural Journal, vol. 106, no. 5, September, pp. 636-645.
BS 8110-97 1997, Structural Use of Concrete, Part 1: Code of Practice for Design and
Construction, British Standard Institute, London.
Bu, W 2008, Shear Bolts for Reinforced Concrete Slabs under Seismic Loading thesis,
University of Waterloo, Waterloo, 217 pp.
Bu, W & Polak, MA 2009, 'Seismic retrofit of reinforced concrete slab-column connections
using shear bolts', ACI Structural Journal, vol. 106, no. 4, July, pp. 514-522.
Clement, T & Muttoni, A 2010, 'Influence of prestressing eccentricity the punching shear
strength of post-tensioned slab bridges,' Proceeding of the 8th fib-PhD Symposium. pp.
63-68.
Corley, WG & Hawkins, NM 1968, 'Shearhead reinforcement for slabs', ACI Structural
Journal, vol. 65, no. 10, October, pp. 811-824.
Correa, GS 2001, Puncionamento em Lajes Cogumelo Protendidas Com Cabos nao Aderentes,
thesis, Department of Civil and Environmental Engineering, University of Brasilia.
CSA A23.3-04 2004, Design of Concrete Structures, Canadian Standards Association, Rexdale,
Ontario.
Dilger, W & Ghali, A 1981, 'Shear reinforcement for concrete slabs', Journal of the Structural
Division-ASCE vol. 107, pp. 2403-2420.
DIN 1045-1 2001, German Standard: Concrete Reinforced and Prestressed Concrete Structures
Part 1: Design, Deutsche Institut fur Normung e.v., Beuth Verl, Berlin.
Ebead, U & Marzouk, H 2002, 'Strengthening of two-way slabs using steel plates', ACI
Structural Journal, vol. 99, no. 1, January, pp. 23-31.
Egberts, MJL 2009, Preventing Progressive Collapse of Flat Plate Structures with Irregular
Layout of Structural Integrity Reinforcement, thesis, Department of Civil Engineering
and Applied Mechanics, McGill University, Montreal, 105 pp.
El-Salakawy, E, Polak, MA & Soudki, KA 2003, 'New shear strengthening technique for
concrete slab-column connections', ACI Structural Journal, vol. 100, no. 3, May, pp.
297-304.
Elgabry, A & Ghali, A 1990, 'Design of stud-shear reinforcement for slabs', ACI Structural
Journal, vol. 87, no. 2, May, pp. 350-361.
125
Elstner, RC & Hognestand, E 1956, 'Shearing strength of reinforcement concrete slabs ', ACI
Structural Journal, vol. 28, no. 1, July pp. 30-58.
Eurocode 2 2004, Eurocode 2: Design of Concrete Structures-part 1-1: General Rules and
Rules for Buildings, British Standards.
fib 2001, Punching of Structural Concrete Slabs, International Federation for Structural
Concrete, Lausanne.
FIP 1980, Recommendations for the Design of Flat Slabs in post-Tensioned Concrete (Using
Bonded or Unbonded Tendons) Federation Internationale de la Precontrainte Slough,
England.
FIP 1998, Design of Post-Tensioned Slabs and Foundations, Federation Internationale de la
Precontrainte London.
Gardner, NJ 2005, 'ACI 318-05, CSA A23.3-04, Eurocode 2 (2003), DIN 1045-1 (2001), BS
8110-97 and CEB-FIP MC 90 provisions for punching shear ', in MA Polak (ed.)
Punching Shear in Reinforced Concrete Slabs, vol. SP-232, American Concrete
Institute Farmington Hills, Michigan, pp. 1-22.
Gardner, NJ, Huh, J & Chung, L 2002, 'Lessons from the Sampoong department store collapse',
Cement and Concrete Composites, vol. 24, no. 6, pp. 523-529.
Gesund, H 1981, 'Limit design of slabs for concentrated loads', Journal of Structural
Engineering, ASCE, vol. 107, no. ST9, September, pp. 1839-1856.
Gesund, H & Goli, H 1980, 'Local flexural strength of slabs at interior columns', Journal of
Structural Engineering, ASCE, vol. 106, no. ST5, May, pp. 1063-1078.
Gomes, RB & Regan, PE 1999, 'Punching resistance of RC flat slabs with shear reinforcement ',
Journal of Structural Engineering, ASCE, vol. 125, no. 6, pp. 684-692.
Guandalini, S, Burdet, OL & Muttoni, A 2009, 'Punching tests of slabs with low reinforcement
ratios', ACI Structural Journal, vol. 106, no. 1, January, pp. 87-95.
Hallgren, M 1996, Punching Shear Capacity of Reinforced High Strength Concrete Slabs,
thesis, Department of Structural Engineering, Royal Institute of Technology,
Stockholm, 206 pp.
Hegger, J, Sherif, A & Beutel, R 2005, 'Punching of reinforced concrete flat slabs - ACI and
German guidelines', in MA Polak (ed.) Punching Shear in Reinforced Concrete Slabs,
vol. SP-232, American Concrete Institute Farmington Hills, Michigan.
Hegger, J, Sherif, A & Ricker, M 2006, 'Expeirmental investigations on punching behaviour of
reinforced concrete footings ', ACI Structural Journal, vol. 103, no. 4, pp. 604-613.
Hsu, TTC 1993, Unified Theory of Reinforced Concrete, CRC Press.
Kamara, ME & Rabbat, BG (eds), 2005, Notes on ACI 318-05 Building Code Requirements for
Structural Concrete, Portland Cement Association, Skokie, Illinois.

126
Kinnunen, S 1963, Punching of Concrete Slabs with Two-Way Reinforcement with Special
Reference to Dowel Effect and Deviation of Reinforcement from Polar Symmetry Royal
Institute of Technology, Stockholm.
Kinnunen, S & Nylander, H 1960, Punching of Concrete Slabs Without Shear Reinforcement,
Royal Institute of Technology, Stockholm, Sweden.
Kordina, K & Nolting, D 1984, Versuche Zum Durchstanzen ohne Verbund vorgespannter
Flachdecken, Lehrstuhl fur Massivbau, Technische Universität, Braunschweig.
Li, KKL 2000, Influence of Size on Punching Shear Strength of Concrete Slabs, thesis,
Department of Civil Engineering and Applied Mechanics, McGill University, Montreal,
78 pp.
Marzouk, H & Chen, W 1995, 'Fracture energy and tension properties of high-strength
concrete', Journal of Material in Civil Engineering, ASCE, vol. 7, no. 2.
Marzouk, H & Hussein, A 1991, 'Experimental investigation on the behavior of high-strength
concrete slabs', ACI Structural Journal, vol. 88, no. 1, November, pp. 701-713.
Marzouk, H & Jiang, D 1997, 'Experimental investigation on shear enhancement types for high-
strength concrete plats', ACI Structural Journal, vol. 94, no. 1, January, pp. 49-58.
Marzouk, H, Rizk, E & Tiller, R 2010, 'Design of shear reinforcement for thick plates using
strut-and-tie model', Canadian Journal of Civil Engineering, vol. 37, pp. 181-194.
Megally, SH 1998, Punching shear resistance of concrete slabs to gravity and earthquake
forces, thesis, Department of Civil Engineering The University of Calgary, Calgary,
468 pp.
Megally, SH & Ghali, A 2000, 'Punching shear design of earthquake-resistant slab-column
connections ', ACI Structural Journal, vol. 97, no. 5, September, pp. 720-730.
Mehta, PK & Monterio, PJM 2006, Concrete Microstructure, Propoerties, and Materials,
McGraw-Hill.
Menétrey, P 1996, 'Analytical computation of the punching strength of reinforced concrete', ACI
Structural Journal, vol. 93, no. 5, October, pp. 503-511.
Menétrey, P 1998, 'Relationships between flexural and punching failure', ACI Structural
Journal, vol. 95, no. 4, July, pp. 412-419.
Menétrey, P 2002, 'Synthesis of punching failure in reinforced concrete', Cement and Concrete
Composites, vol. 24, no. 6, pp. 497-507.
Model Code 90 1993, Design of Concrete Structures, CEB-FIP Model Code 90, British
Standard Institute, London.
Moe, J 1961, Shearing Strength of Reinforced Concrete Slabs and Footings under Concentrated
Loads, Portland Cement Association Skokie, Illinois.
Mokhtar, A, Ghali, A & Dilger, W 1985, 'Stud shear reinforcement for flat concrete plates', ACI
Structural Journal, vol. 82, no. 5, September, pp. 676-683.

127
Muttoni, A 2008, 'Punching shear strength of reinforced concrete slabs without transverse
reinforcement ', ACI Structural Journal, vol. 105, no. 4, July, pp. 440-450.
Muttoni, A & Schwarts, J 1991, 'Behaviour of beams and punching in slabs without shear
reinforcement', IABSE Colloquium, vol. 62, pp. 703-708.
Muttoni, A, Schwarts, J & Thurlimann, B 2003, Design of Concrete Structures with Stress
Fields, Birkhauser Verlag.
New Zealand Standard NZS 3101:Part 1 2006, Concrete Structures Standard, Standards New
Zealand, Wellington.
Park, H, Ahn, K, Choi, K & Chung, L 2007, 'Lattice shear reinforcement for slab-column
connections', ACI Structural Journal, vol. 104, no. 3, May, pp. 294-303.
Pilakoutas, K & Li, X 2003, 'Alternative shear reinforcement for reinforced concrete flat slabs ',
Journal of Structural Engineering, ASCE, vol. 129, no. 9, pp. 1164-1172.
Pinho Ramos, A, Lúcio, VJG & Regan, PE 2011, 'Punching of flat slabs with in-plane forces',
Engineering Structures, vol. 33, no. 3, pp. 894-902.
Pisanty, A 2005, 'Eurocodes and North American Codes predictions on punching shear capacity
in view of experimental evidence', in MA Polak (ed.) Punching Shear in Reinforced
Concrete Slabs, vol. SP-232, American Concrete Institute Farmington Hills, Michigan,
pp. 257-277.
Polak, MA, El-Salakawy, E & Hammill, NL 2005, 'Shear reinforcement for concrete flat slabs',
in MA Polak (ed.) Punching Shear in Reinforced Concrete Slabs, vol. SP-232,
American Concrete Institute Farmington Hills, Michigan.
Ramos, A & Lucio, V 2006, 'Safety on Punching of Prestressed Flat Slabs,' The 2nd fib
Congress, Federation Internationale du Beton.
Rangan, BV & Hall, AS 1983, Forces in the Vicinity of Edge Columns in Flat Plate Floors,
University of NSW, Kensington, NSW, 240 pp.
Rankin, GIB & Long, AE 1987, 'Predicting the punching strength of conventional slab-column
specimens', Proceedings Institution of Civil Engineers, vol. 82, no. 2, April pp. 327-
346.
Regan, PE 1981, Behavior of Reinforced Concrete Flat Slabs, Concrete Industry Research and
Information Association, London, UK, 89 pp.
Regan, PE 1983, Punching Shear in Prestressed Concrete Slab Bridges, Structures Research
Group, Polytechnic of Central London, London.
Regan, PE 1985, 'The punching resistance of prestressed concrete slabs', Proceedings Institution
of Civil Engineers, vol. 79, no. 2, December, pp. 657-680.
Regan, PE & Braestrup, MW 1985, Punching Shear in Reinforced Concrete, Euro International
Committee for Concrete, Lausanne, 232 pp.
128
Scordelis, AC, Pister, KS & Lin, TY 1958, 'Shearing strength prestressed lift slabs ', ACI
Structural Journal, vol. 55, no. 10, October, pp. 485-506.
Seible, F, Ghali, A & Dilger, W 1980, 'Preassembled shear reinforcing units for flat plates', ACI
Structural Journal, vol. 77, no. 1, pp. 28-35.
Shehata, I 1990, 'Simplified model for estimating the punching resistance of reinforced corete
slabs', Materials and Structures, vol. 23, no. 5, pp. 364-371.
Shehata, I & Regan, PE 1989, 'Punching in R. C. slabs', Journal of Structural Engineering,
ASCE, vol. 115, no. 7, July, pp. 1726-1740.
Sherif, AG 1996, Behaviour of Reinforced Concrete Flat Slabs, thesis, Department of civil
engineering The University of Calgary, Calgary, 397 pp.
Silva, RJC, Regan, PE & Melo, GS 2005, 'Punching resistance of unbonded post tensioned slabs
by decompression methods', Structural Concrete, vol. 6, no. No.1, pp. 9-21.
Silva, RJC, Regan, PE & Melo, GS 2007, 'Punching of post-tensioned slabs-tests and codes',
ACI Structural Journal, vol. 104, no. 2, March, pp. 123-132.
Sundquist, H 2005, 'Punching research at the Royal Institute of Technology (KTH) in
Stockholm', in MA Polak (ed.) Punching Shear in Reinforced Concrete Slabs,
American Concrete Institute, Farmington Hills, Michigan.
Talbot, AN 1913, Reinforced Concrete Wall Footings and Column Footings, University of
Illinois, Urbana, Illinois, 114 pp.
Theodorakopoulos, DD & Swamy, RN 2002, 'Ultimate punching strength analysis of slab-
column connections', Cement and Concrete Composites, vol. 24, pp. 509-521.
Tiller, RW 1995, Strut-and-Tie Model for Punching Shear of Concrete Slabs, thesis, Faculty of
Engineering and Applied Science Memorial University of Newfoundland, St. John's
103 pp.
Vollum, RL, Abdel-Fattah, T, Eder, M & Elghazouli, AY 2010, 'Design of ACI-type punching
shear reinforcement to Eurocode 2', Institution of Civil Engineers, vol. 62, no. 1, pp. 3-
16.
Warner, RF, Rangan, BV, Hall, AS & Faulkes, KA 1998, Concrete Structures, Addison Wesley
Longman Australia.
Wight, JK & MacGregor, JG 2009, Reinforced Concrete Pearson Prentice Hall, New Jersey.

129
Appendix A
In this appendix, details of test specimens which were used to determine the proposed formula
and to evaluate the accuracy of formulae of standards are presented. Also the reported failure
load of test specimens and the predicted punching shear strength of test specimens, using
formulae in design standards, are provided.
In Table A.1, a reference number is given to each test specimen, and the source in which the test
specimen was reported is provided. The shape of the column of each test specimen is given in
Table A.1 where C stands for the circular column and S stands for the square column. Further,
the thickness of the slab (h), the effective depth of the slab (d), the average compressive strength
of concrete (fcm), the tensile reinforcement ratio of the slab (ρ), the yield strength of the tensile
reinforcement (fsy), the diameter of circular columns (D), and the side dimension of square
columns (a) are provided in Table A.1.
In Table A.2, the predicted punching shear strength of each test specimen of the databank is
provided using the proposed formula, and formulae of design standards.
It should be noted that the reference number for each test specimen is the same in Table A.2 and
Table A.1.

130
Table A.1 Details of collected slab test specimens
No. Source Specimen Column h d f cm ρ f sy D or
shape (mm) (mm) (MPa) (%) (MPa) a(mm)
1 PG1 S 250 210 27.6 1.50 573 260
2 (Guandalini, PG11 S 250 210 31.5 0.75 570 260
3 Burdet & PG3 S 500 456 32.4 0.33 520 520
4 Muttoni 2009) PG6 S 125 96 34.7 1.50 526 130
5 PG7 S 125 100 34.7 0.75 550 130
6 NS1 S 120 95 42.0 1.47 490 150
7 HS2 S 120 95 70.0 0.84 490 150
8 HS7 S 120 95 74.0 1.19 490 150
9 HS3 S 120 95 69.0 1.47 490 150
10 HS4 S 120 95 66.0 2.37 490 150
11 (Marzouk & NS2 S 150 120 30.0 0.94 490 150
12 Hussein 1991) HS5 S 150 125 68.0 0.64 490 150
13 HS6 S 150 120 70.0 0.94 490 150
14 HS8 S 150 120 69.0 1.11 490 150
15 HS9 S 150 120 74.0 1.61 490 150
16 HS10 S 150 120 80.0 2.33 490 150
17 HS12 S 90 70 75.0 1.52 490 150
18 HS13 S 90 70 68.0 1.87 490 150
19 HS14 S 120 95 72.0 1.47 490 220
20 HS15 S 120 95 71.0 1.47 490 300
21 (fib 2001) HSLW1.5 S 150 115 75.5 1.50 435 250
22 HSLW2 S 150 115 74.0 2.00 435 250
23 NSLW1 S 150 115 36.2 1.00 435 250
24 NSC1 S 200 158 35.0 2.17 400 250
25 HSC1 S 200 138 69.0 2.48 400 250
26 HSC2 S 200 128 70.0 2.68 400 250
27 HSC3 S 200 158 67.0 1.67 400 250
28 HSC4 S 200 158 61.0 1.13 400 250
29 HSC5 S 150 113 70.0 1.88 400 250
30 NS4 S 300 218 40.0 0.73 400 250
31 HS2 S 300 218 64.7 0.73 400 250
32 HS3 S 350 263 65.4 1.44 400 400
33 NS5 S 400 313 40.0 1.58 400 400
34 ND65-1-1 S 320 275 64.3 1.50 500 200
35 ND65-2-1 S 240 200 70.2 1.70 500 150
36 ND95-1-1 S 320 275 83.7 1.50 500 200
37 ND95-1-3 S 320 275 89.9 2.50 500 200
38 ND95-2-1 S 240 200 88.2 1.70 500 150
39 ND95-2-1D S 240 200 86.7 1.70 500 150
40 ND95-2-3 S 240 200 89.5 2.60 500 150

131
Table A.1 Details of collected slab test specimens
Column h d f cm ρ f sy D or
shape (mm) (mm) (MPa) (%) (MPa) a (mm)
41 ND95-2-3D S 240 200 80.3 2.60 500 150
42 ND95-2-3D+ S 240 200 98.0 2.60 500 150
43 ND95-3-1 S 120 88 85.1 1.80 500 100
44 ND115-1-1 S 320 275 112.0 1.50 500 200
45 ND115-2-1 S 240 200 119.0 1.70 500 150
46 ND115-2-3 S 240 200 108.1 2.60 500 150
47 P100 S 135 100 39.4 0.97 488 200
48 P150 S 190 150 39.4 0.90 488 200
49 P200 S 240 200 39.4 0.83 465 200
50 P300 S 345 300 39.4 0.76 468 200
51 P400 S 450 400 39.4 0.76 468 300
52 P500 S 550 500 39.4 0.76 433 300
53 (Birkle & 1 S 160 124 33.1 1.54 488 250
54 Dilger 7 S 230 190 33.5 1.30 531 300
55 2008) 10 S 300 260 31.0 1.10 524 350
56 HSC0 C 240 200 94.0 0.80 643 250
57 HSC1 C 245 200 91.0 0.80 627 250
58 HSC2 C 240 194 86.0 0.80 620 250
59 HSC4 C 240 200 92.0 1.20 596 250
60 HSC6 C 239 201 109.0 0.60 633 250
61 N/HSC8 C 242 198 95.0 0.80 631 250
62 12 C 125 98 60.4 1.30 550 150
63 13 C 125 98 43.6 1.30 550 150
64 14 C 125 98 60.8 1.30 550 150
65 21 C 125 98 41.9 1.30 650 150
66 22 C 125 98 84.2 1.30 650 150
67 25 C 125 98 32.9 1.20 650 150
68 26 C 125 98 37.6 1.20 650 150
69 27 C 125 98 33.7 1.00 650 150
70 S2.1 C 240 200 24.2 0.80 657 250
71 S2.2 C 240 199 22.9 0.80 670 250
72 S2.3 C 240 200 25.4 0.50 668 250
73 S2.4 C 240 197 24.2 0.50 664 250
74 S1.1 C 120 100 28.6 0.80 706 125
75 S1.2 C 120 99 22.9 0.80 701 125
76 I/1 S 100 77 25.8 1.39 500 200
77 I/2 S 100 77 23.4 1.20 500 200
78 I/3 S 100 77 27.4 0.92 500 200
79 I/4 S 100 77 32.3 1.20 500 200
80 I/5 S 100 79 28.2 0.87 480 200
No. Source Specimen
(fib 2001)
(Li 2000)
(fib 2001)
(fib 2001)

132
Table A.1 Details of collected slab test specimens
Column h d f cm ρ f sy D or
shape (mm) (mm) (MPa) (%) (MPa) a (mm)
81 I/6 S 100 79 21.9 0.80 480 200
82 II/1 S 250 200 34.9 1.00 530 250
83 II/2 S 160 128 33.3 1.00 485 160
84 II/3 S 160 128 34.3 1.00 485 160
85 II/4 S 80 64 33.3 1.00 480 80
86 II/5 S 80 64 34.3 1.00 480 80
87 II/6 S 80 64 36.2 1.00 480 80
88 III/1 S 120 95 23.2 0.80 494 150
89 III/2 S 120 95 9.5 0.80 494 150
90 III/3 S 120 95 37.8 0.80 494 150
91 III/4 S 120 93 11.9 1.50 464 150
92 III/5 S 120 93 26.8 1.50 464 150
93 III/6 S 120 93 42.6 1.50 464 150
94 V/1 S 150 118 34.3 0.80 628 54
95 V/2 S 150 118 32.2 0.80 628 170
96 V/3 S 150 118 32.4 0.80 628 110
97 V/4 S 150 118 36.2 0.80 628 102
98 A1/M1 S 140 114 16.3 1.10 255 203
99 A1/M2 S 140 117 15.5 1.50 282 203
100 A1/M3 S 140 121 14.2 1.90 282 203
101 A1/M4 S 140 124 14.0 1.00 432 203
102 A1/M5 S 140 117 21.0 1.20 432 203
103 A2/M2 S 140 117 32.8 1.50 282 203
104 A2/M3 S 140 121 32.5 1.90 282 203
105 A2/T1 S 140 124 39.3 1.00 432 203
106 A2/T2 S 140 124 41.4 1.70 432 203
107 A3/M1 S 140 124 18.8 1.00 255 203
108 A3/M2 S 140 102 19.3 1.70 282 203
109 A3/M3 S 140 117 27.3 1.90 282 203
110 A3/T1 S 140 121 20.6 1.00 432 203
111 A3/T2 S 140 119 16.0 1.20 432 203
112 A4/M1 S 140 114 38.3 1.10 255 203
113 A4/M2 S 140 119 29.2 1.50 282 203
114 A4/M3 S 140 117 32.2 1.90 322 203
115 A4/T1 S 140 114 32.8 1.10 432 203
116 A4/T2 S 140 117 29.3 1.20 432 203
117 II-1 C 102 82 10.5 1.20 457 221
118 II-4a C 102 82 17.9 0.90 559 221
119 II-4b S 102 82 9.8 0.90 466 201
120 II-4c S 102 82 13.9 0.90 510 201
(fib 2001)
Source SpecimenNo.

133
Table A.1 Details of collected slab test specimens
Column h d f cm ρ f sy D or
shape (mm) (mm) (MPa) (%) (MPa) a (mm)
121 IIB20-2 C 128 108 15.0 0.90 500 201
122 IIB30-1 C 102 80 17.6 2.00 403 300
123 II-2 C 102 82 9.8 1.30 373 221
124 II-3 S 102 82 13.5 1.30 491 301.5
125 II-6 C 102 82 21.6 1.30 456 221
126 II-9 S 102 79 9.3 0.85 550 201
127 II-3 C 102 82 18.1 1.20 559 221
128 II-7 C 102 82 10.0 0.70 456 119
129 II-10 C 102 82 11.7 1.00 385 119
130 S1-60 S 152 114 23.3 1.10 399 254
131 S1-70 S 152 114 24.5 1.10 483 254
132 S5-60 S 152 114 22.2 1.10 399 254
133 S5-70 S 152 114 23.0 1.10 483 254
134 R1 S 152 114 26.6 1.40 328 254
135 R2 S 152 114 27.6 1.40 328 254
136 H1 S 152 114 26.1 1.10 328 254
137 M1A S 152 114 20.8 1.50 481 254
138 VIII B-9 S 152 114 35.1 2.00 341 254
139 VIII B-11 S 152 114 40.4 3.00 325 254
140 VIII-14 S 152 114 38.2 0.90 303 254
141 14/1 S 140 112 26.4 1.31 500 200
142 14/2 S 140 112 22.8 1.31 500 200
143 16/1 S 160 133 25.0 0.95 500 200
144 (Pisanty 16/2 S 160 133 19.0 0.95 500 200
145 2005) 18/1 S 180 151 23.3 1.18 500 250
146 18/2 S 180 151 25.5 1.18 500 250
147 20/1 S 200 171 24.1 1.04 500 300
148 20/2 S 200 171 21.8 1.04 500 300
149 IA15a-5 C 149 117 27.9 0.80 454 150
150 IA30a-6 C 151 118 25.8 0.80 441 150
151 IA30a-24 C 158 128 25.9 1.00 456 300
152 IA30a-25 C 154 124 24.6 1.10 451 300
No.
(fib 2001)
(fib 2001)
Source Specimen

134
Table A.2 Predicted punching shear strength of collected test specimens
Proposed AS 3600 NZS CSA EC2 DIN
No. V test formula ACI 318 3101 A23.3-04 MC90 1045-1
(kN) (kN) (kN) (kN) (kN) (kN) (kN)
1 1023 973 705 668 788 931 910
2 763 728 753 714 842 775 742
3 2153 1824 3445 2215 3438 2307 2198
4 238 224 174 169 194 219 211
5 241 169 184 179 206 187 179
6 320 243 205 199 229 239 233
7 249 233 265 257 296 237 230
8 356 278 272 264 304 271 263
9 356 296 263 255 294 284 276
10 418 335 257 250 287 310 301
11 396 242 241 234 270 272 261
12 365 286 386 374 431 341 326
13 489 330 369 358 412 365 349
14 436 353 366 355 409 384 367
15 543 430 379 368 424 445 426
16 645 490 394 383 440 491 470
17 258 212 181 176 203 179 178
18 267 223 173 168 193 186 185
19 498 411 345 335 386 333 332
20 560 531 430 417 481 382 391
21 538.5 582 496 481 554 486 483
22 613.4 649 491 477 549 531 528
23 432.1 353 343 333 384 330 328
24 678 684 516 501 577 685 667
25 788 806 602 584 673 692 680
26 801 762 548 532 612 615 607
27 802 826 714 693 799 807 785
28 811 673 682 662 762 686 668
29 480 585 464 450 519 493 491
30 882 721 875 814 977 869 829
31 1023 907 1112 1035 1243 1026 978
32 2090 2089 1913 1620 2138 1955 1897
33 2234 2000 1915 1487 2120 2198 2109
34 2050 1381 1425 1179 1592 1774 1650
35 1200 845 798 774 891 1095 1019
36 2250 1534 1625 1345 1816 1941 1805
37 2400 1798 1684 1394 1883 2189 2035
38 1100 921 894 868 999 1183 1102
39 1300 915 886 860 991 1176 1095
40 1450 999 901 874 1007 1255 1169

135
Table A.2 Predicted punching shear strength of collected test specimens
Proposed AS 3600 NZS CSA EC2 DIN
No. V test formula ACI 318 3101 A23.3-04 MC90 1045-1
(kN) (kN) (kN) (kN) (kN) (kN) (kN)
41 1250 960 853 828 953 1210 1127
42 1450 1034 942 915 1053 1294 1205
43 330 246 208 201 232 254 242
44 2450 1729 1880 1556 2101 2142 1992
45 1400 1035 1039 1008 1161 1309 1219
46 1550 1073 990 961 1106 1338 1246
47 330 267 256 249 286 246 243
48 583 428 448 435 501 470 452
49 904 576 683 663 763 752 711
50 1381 872 1280 1015 1431 1372 1271
51 2224 1537 2390 1640 2481 2343 2182
52 2681 1826 3415 2096 3308 3366 3103
53 483 479 363 352 406 416 412
54 825 909 733 711 819 849 826
55 1046 1349 1201 1022 1342 1306 1257
56 965 936 932 905 1042 997 941
57 1021 921 917 890 1025 986 931
58 889 864 853 828 954 917 867
59 1041 1055 922 895 1031 1133 1070
60 960 903 1010 979 1130 959 906
61 944 953 923 896 1032 983 929
62 319 245 202 196 225 255 244
63 297 218 171 166 192 228 218
64 341 246 202 196 226 256 244
65 286 234 168 163 188 225 215
66 405 301 238 231 266 286 273
67 244 212 149 144 166 201 192
68 294 218 159 154 178 211 201
69 227 193 151 146 168 191 182
70 603 574 473 459 529 624 589
71 600 569 456 443 510 606 572
72 489 465 484 470 541 542 512
73 444 450 462 449 517 519 490
74 216 157 128 125 144 165 156
75 194 150 113 110 127 150 142
76 194 194 147 143 165 158 159
77 176 177 140 136 157 146 147
78 194 164 152 147 170 141 142
79 194 195 165 160 184 163 164
80 165 162 159 154 178 145 146

136
Table A.2 Predicted punching shear strength of collected test specimens
Proposed AS 3600 NZS CSA EC2 DIN
No. V test formula ACI 318 3101 A23.3-04 MC90 1045-1
(kN) (kN) (kN) (kN) (kN) (kN) (kN)
81 165 144 140 136 157 129 130
82 825 643 567 551 635 764 721
83 390 291 289 281 323 328 314
84 365 293 294 285 328 331 317
85 117 72 72 70 81 82 78
86 105 73 73 71 82 83 79
87 105 64 59 57 66 79 75
88 197 131 120 116 134 147 141
89 123 129 98 95 109 113 110
90 214 177 195 189 218 188 183
91 154 180 106 103 119 148 144
92 214 207 159 154 178 199 193
93 248 236 201 195 224 234 228
94 170 142 162 157 181 214 195
95 280 276 262 254 293 267 258
96 265 207 208 202 233 238 224
97 285 202 213 206 238 243 228
98 322 184 198 193 222 233 228
99 346 229 200 195 224 264 259
100 307 263 201 195 225 293 286
101 259 240 206 200 231 245 239
102 346 273 233 226 261 274 269
103 419 282 292 283 326 346 339
104 430 324 304 295 340 395 386
105 419 318 346 336 386 355 346
106 439 414 355 344 397 431 420
107 247 199 239 232 267 273 266
108 336 225 186 180 208 239 236
109 298 298 266 258 297 351 344
110 328 257 242 235 270 271 265
111 298 261 208 202 233 255 250
112 259 243 304 295 340 316 310
113 341 276 282 273 315 342 334
114 541 333 289 280 323 372 364
115 384 291 281 273 315 299 293
116 402 299 276 268 308 309 302
117 181 138 86 83 96 112 111
118 245 147 112 109 126 125 124
119 162 128 99 96 111 106 106
120 215 145 118 114 132 121 121

137
Table A.2 Predicted punching shear strength of collected test specimens
Proposed AS 3600 NZS CSA EC2 DIN
No. V test formula ACI 318 3101 A23.3-04 MC90 1045-1
(kN) (kN) (kN) (kN) (kN) (kN) (kN)
121 307 180 138 134 154 177 171
122 239 221 136 132 152 178 181
123 152 127 83 80 93 112 111
124 244 223 157 153 176 165 170
125 240 167 123 120 138 151 150
126 157 129 92 89 102 95 96
127 201 170 113 110 126 138 137
128 117 73 56 54 62 75 71
129 98 83 60 58 67 90 85
130 389 308 275 267 308 289 288
131 393 341 282 274 316 294 293
132 343 303 269 261 300 284 283
133 378 335 274 266 306 288 287
134 312 328 294 286 329 329 327
135 394 333 300 291 335 333 332
136 372 294 291 283 326 301 300
137 433 375 260 253 291 308 307
138 505 430 338 328 378 408 406
139 578 442 363 352 405 428 427
140 334 301 352 342 394 322 321
141 390 308 244 237 273 284 278
142 355 296 227 220 254 269 264
143 376 315 301 292 337 332 322
144 445 300 263 255 293 301 292
145 581 485 398 386 444 463 452
146 606 497 416 404 465 479 467
147 835 618 538 522 601 589 577
148 822 599 511 496 572 569 557
149 255 175 176 171 197 226 214
150 275 171 171 166 192 223 211
151 430 346 298 289 333 341 335
152 408 340 279 271 312 328 323

138
139
Appendix B
In this appendix, details of prestressed slab test specimens which were used to evaluate the
suggested method are presented. Also, the reported failure load of the test specimens and the
predicted punching shear strength of the test specimens using formulae of design standards are
provided.
In Table B. 1, a reference number is given to each test specimen, and the source in which the
test specimen was reported is provided. The shape of the column of the test specimen is given
in Table B. 1 where C stands for the circular column and S stands for the square column.
Further, the thickness of slabs (h), the effective depth of tensile reinforcement (d), the average
compressive strength of concrete (fcm), the tensile reinforcement ratio of the slab (ρ), the yield
strength of the tensile reinforcement (fsy), the diameter of circular columns (D), the side
dimension of square columns (a), the ratio of the average bending moment to the shear force
(m/V), the average compressive stress in the slab (σcp), and the depth of prestressing tendons
over the column (dp) are given in Table B. 1.
In Table B. 2, the predicted punching shear strength of each test specimen of the databank is
provided using the proposed formula.
In Table B. 3, the predicted punching shear strength of each test specimen is given using AS
3600-2009, ACI 318-05, CSA A23.3-04, Eurocode2, and DIN 1045-1. Also, the predicted
punching shear of each test specimen is given using AS 3600-2009 with inclusion of the vertical
component of tendons crossing within a distance of d/2 from faces of the column. The
predicted punching shear strength of test specimens are also calculated for ACI 318-05 and
CSA A23.3-04 with ignoring the limit on f’c.
It should be mentioned that the reference number for each test specimen is the same in Table B.
1, Table B. 2, and Table B. 3.

140
Table B. 1 Details of collected prestressed slab test specimens
Column h d f'c
ρ fsy
D or €cpd
p
shape (mm) (mm) (Mpa) (%) (MPa) a (mm) (MPa) (mm)
1 A1 S 125 109 37.8 0.62 553 100 3.31 91
2 A2 S 127 113 37.8 0.47 553 100 2.14 97
3 A3 S 128 109 37.8 0.62 553 100 3.16 86
4 A4 S 129 104 37.8 0.51 553 100 1.98 86
5 B1 S 124 114 40.1 0.60 553 200 3.39 98
6 B2 S 124 110 40.1 0.48 553 200 2.23 94
7 B3 S 124 108 40.1 0.63 553 200 3.12 90
8 B4 S 124 106 40.1 0.50 553 200 2.16 89
9 C1 S 126 111 41.6 0.61 525 300 3.33 94
10 C2 S 122 105 41.6 0.50 525 300 2.26 89
11 C3 S 124 106 41.6 0.64 525 300 3.48 90
12 (Silva, C4 S 123 102 41.6 0.52 525 300 2.31 85
13 Regan & D1 S 124 100 44.1 0.68 540 200 3.34 83
14 Melo 2005) D2 S 123 106 44.1 0.50 540 200 2.23 90
15 and D3 S 125 103 44.1 0.51 540 200 2.27 90
16 (Silva, D4 S 125 111 44.1 0.48 540 300 2.22 95
17 Regan & LP2 S 130 105 52.4 1.70 500 150 2.19 65
18 Melo 2007) LP3 S 130 105 52.4 1.70 500 150 4.28 65
19 LP4 S 130 105 50.7 1.70 500 150 0.8 81
20 LP5 S 130 105 50.7 1.70 500 150 1.33 81
21 LP6 S 130 105 52.4 1.70 500 150 1.76 81
22 SP1 S 175 140 36.5 2.70 500 150 3.94 135
23 SP4 S 175 140 41.7 2.70 500 150 4.28 135
24 SP5 S 175 140 40.9 2.70 500 150 3.28 135
25 SP6 S 175 140 42.5 2.70 500 150 3.5 135
26 M4 S 160 134 51.9 0.92 500 180 1.95 120
27 V1 C 150 124 33.6 0.62 500 200 1.7 114
28 V2 C 150 123 36 0.90 500 200 1.66 114
29 V3 C 150 122 36 0.62 500 200 3.09 114
30 V6 C 150 120 30.4 0.62 500 200 1.77 75
31 V7 C 150 124 31.2 0.62 500 200 1.77 114
32 V8 C 150 124 35.2 0.62 500 200 1.77 114
33 PC1 S 250 210 44 0.77 591 260 0 0
34 (Clemente & PC3 S 250 210 43.8 0.77 591 260 0 0
35 Muttoni 2010) PC2 S 250 210 45.3 1.40 577 260 0 0
36 PC4 S 250 210 44.4 1.40 577 260 0 0
37 AR5 S 100 80 35.7 1.60 523 200 2 0
38 AR7 S 100 80 43.9 1.60 523 200 2.75 0
39 AR8 S 100 80 41.6 1.60 481 200 0 0
40 AR10 S 100 80 41.4 1.60 481 200 0 62
41 (Ramos & AR11 S 100 80 38 1.60 481 200 0 62
42 Lucio 2006) AR12 S 100 80 31.3 1.60 481 200 0 62
43 AR13 S 100 80 32.5 1.60 481 200 0 62
44 AR14 S 100 80 28.2 1.60 481 200 0 62
45 AR15 S 100 80 31.7 1.60 481 200 0 62
46 AR16 S 100 80 30.6 1.60 481 200 0 62
No. Source Specimen

141
Table B. 2 Predicted punching shear strength of collected test specimens using the suggested
method
V test V uo mo V o me V e V p V up
(kN) (kN) (kN.m)/m (kN) (kN.m)/m (kN) (kN) (kN)
1 380 142 9 70 12 96 9 3182 315 129 6 47 9 74 10 2613 353 144 9 70 9 73 0 2874 321 125 5 45 5 45 0 2145 582 247 9 79 15 138 32 4966 488 217 6 52 9 80 30 3807 520 240 8 73 11 98 13 4248 459 214 6 50 7 66 13 3439 720 341 9 90 13 133 41 60610 557 297 6 58 8 79 35 46911 637 333 9 91 12 124 18 56612 497 296 6 60 7 68 15 44013 497 240 9 78 9 79 10 40714 385 217 6 51 8 71 12 35115 395 219 6 54 8 71 0 34416 532 322 6 59 9 93 40 51317 355 322 6 53 0 0 0 37518 415 322 12 104 0 0 0 42619 390 318 2 19 2 14 8 36020 475 318 4 32 3 24 13 38721 437 322 5 43 4 32 11 40722 988 460 20 159 33 258 19 89523 884 476 22 172 36 281 21 95024 780 473 17 132 27 215 0 82025 728 479 18 141 29 229 0 84926 773 377 8 59 12 88 27 55027 450 219 6 51 10 79 66 41428 525 264 6 50 10 77 61 45129 570 220 12 93 18 143 116 57130 375 206 7 53 0 0 0 25931 475 214 7 53 10 82 68 41632 518 222 7 53 10 82 70 42733 1201 839 0 0 75 375 0 121434 1338 837 0 0 150 750 0 158735 1397 1099 0 0 75 375 0 147436 1433 1090 0 0 150 750 0 184037 251 240 3 24 0 0 0 26438 288 259 5 33 0 0 0 29139 380 244 0 0 0 0 72 31640 371 243 0 0 0 0 56 29941 342 236 0 0 0 0 40 27642 280 222 0 0 0 0 66 28843 261 225 0 0 0 0 34 25944 208 216 0 0 0 0 0 21645 262 223 0 0 0 0 0 22346 351 221 0 0 0 0 74 295
No.

142
Table B. 3 Predicted punching shear strength of collected test specimens using formulae of design
standards
AS 3600- AS 3600- ACI 318-05 ACI 318-05 CSA A23.3 CSA A23.3 DIN
No. 2009 2009+V p f' c§ 35MPa no limit on f' c f' c§ 35MPa no limit on f' c 1045-1
(kN) (kN) (kN) (kN) (kN) (kN) (kN) (kN)
1 281 290 256 262 301 309 311 2552 263 273 237 244 282 290 283 2313 277 277 243 249 288 296 274 2434 228 228 196 202 235 242 220 1935 454 486 424 441 495 517 440 3756 385 415 356 372 420 440 344 3087 411 424 366 382 431 452 364 3258 363 376 320 335 380 399 314 2779 582 623 536 565 627 662 501 44410 488 524 443 469 523 555 381 36011 557 575 493 520 578 612 440 40412 473 489 411 436 489 520 360 33113 391 401 336 362 396 428 343 30414 380 392 322 349 383 416 323 28515 367 367 300 326 358 390 297 26316 534 573 475 513 561 607 420 39217 334 334 254 296 305 354 365 35418 401 401 297 338 374 427 407 39619 285 293 217 255 256 299 350 33020 302 315 240 277 284 328 373 34621 320 331 252 293 299 348 392 35622 526 544 468 474 569 577 774 65923 565 586 471 496 587 621 809 69724 513 513 439 462 519 548 688 64025 530 530 450 478 530 566 721 65426 511 538 415 477 491 567 540 49027 313 379 342 342 397 397 424 39328 317 377 337 340 392 396 452 42629 366 482 442 445 503 506 545 48130 290 290 257 257 308 308 286 30431 307 374 339 339 393 393 422 39032 322 392 354 355 410 411 438 40433 890 890 679 761 771 864 877 83934 888 888 679 759 771 862 875 83835 903 903 679 772 771 877 1083 103736 894 894 679 764 771 868 1075 102937 236 236 208 209 249 251 226 22838 276 276 228 246 271 294 252 25439 196 268 226 240 247 263 280 28140 196 252 210 223 231 246 264 26541 188 228 194 200 215 222 242 24242 170 236 212 212 231 231 254 25543 174 208 182 182 203 203 259 22644 162 162 138 138 157 157 212 18245 172 172 147 147 166 166 189 19046 169 243 218 218 238 238 261 262
EC2

143
Appendix C
In this appendix, details of test specimens with shear reinforcement which were used to evaluate
the suggested method are presented. Also, the reported failure load of test specimens and the
predicted punching shear strength of test specimens using formulae of ACI 318-05, CSA A23.3-
04, and Eurocode2 are provided.
In Table C.1, a reference number is given to each test specimen, and the source in which the test
specimen was reported is provided. Further, the thickness of the slab (h), the effective depth of
tensile reinforcement (d), the average compressive strength of concrete (fcm), the tensile
reinforcement ratio of the slab (ρ), the yield strength of the tensile reinforcement (fsy), the side
dimension of square columns (a), the cross sectional area of shear reinforcement in one row
around the column (Asv), the yield strength of shear reinforcement (fsvy), the radial distance
between the first row of shear reinforcement and the face of column (so), the radial spacing
between rows of shear reinforcement (sr), and the tangential spacing between shear
reinforcement are given in Table C.1.
In Table C.2, the predicted punching shear strength of each test specimen of the databank is
provided using the suggested formulae.
In Table C.3, the predicted punching shear strength of each test specimen is provided using ACI
318-05.
In Table C.4, the predicted punching shear strength of each test specimen is presented using
Eurocode2.
In Table C.5, the predicted punching shear strength of each test specimen is given using DIN
1045-1.
It should be mentioned that the reference number for each test specimen is the same in Table
C.1, Table C.2, Table C.3, Table C.4, and Table C.5.

144
Table C.1 Details of collected slab test specimens with shear reinforcement
No. of side
Test h d f' c ρ f sy A sv f svy s o s r s t shear dimnesion of
specimen (mm) (mm) (MPa) (%) (MPa) (mm) 2 (MPa) (mm) (mm) (mm) reinforcment square column
rows (mm)
1 4 160 124 38 1.54 488 568 465 30 60 250 5 250
2 (Birkle & 2 160 124 29 1.54 488 568 393 45 90 250 6 250
3 Dilger 8 230 190 35 1.3 531 568 460 50 100 300 5 300
4 2008) 9 230 190 35.2 1.3 531 568 460 75 150 300 6 300
5 11 300 260 30 1.1 524 1016 409 65 130 350 5 350
6 12 300 260 33.8 1.1 524 1016 409 95 195 350 6 350
7 AB3 150 142 23 1.1 516 852 278 70 105 250 8 250
8 (Mokhtar, AB4 150 142 41 1.1 516 852 278 70 105 250 8 250
9 Ghlia & AB5 150 142 30 1.1 516 852 278 70 105 250 8 250
10 Dilger AB6 150 142 29 1.1 516 852 278 70 105 250 6 250
11 1985) AB7 150 142 35 1.1 448 852 278 70 105 250 6 250
12 AB8 150 142 30 1.1 448 852 278 70 105 250 5 250
13 (Marzouk & HS22 150 120 60 1.1 490 2120 400 60 90 250 3 250
14 Jiang 1997) HS23 150 120 60 1.1 490 942 400 60 90 250 4 250
15 SC7 150 121 33.6 1.17 450 868 350 60 120 310 2 310
16 SC11 150 121 33.6 1.17 450 992 500 60 120 310 2 310
17 (Seible, SC12 150 121 33.6 1.17 450 496 500 30 50 310 4 310
18 Ghali & SC13 150 121 33.6 1.17 450 496 500 30 50 310 4 310
19 Dilger 1980) SC8 150 121 33.6 1.17 450 900 490 60 120 310 2 310
20 SC9 150 121 33.6 1.17 450 600 490 60 60 310 3 310
21 SC10 150 121 33.6 1.17 450 500 490 60 40 310 4 310
22 (Vollum, 2 220 174 24 1.28 567 628 560 90 90 270 10 270
23 Abdel-Fattah, 3 220 174 27.2 1.28 567 628 560 90 90 270 6 270
24 Eder & 4 220 174 27.2 1.28 567 628 560 90 90 270 6 270
25 Elghazouli 5 220 174 23.3 1.28 567 628 560 90 90 270 10 270
26 2010) 6 220 174 23.3 0.64 567 628 560 90 90 270 10 270
27 S2 200 159 34.5 1.26 670 225 450 80 80 150 2 200
28 (Gomes & S3 200 159 39.2 1.26 670 300 450 80 80 150 2 200
29 Regan 1999) S4 200 159 32.1 1.26 670 400 450 80 80 150 3 200
30 S5 200 159 34.7 1.26 670 630 450 80 80 150 4 200
No. Source
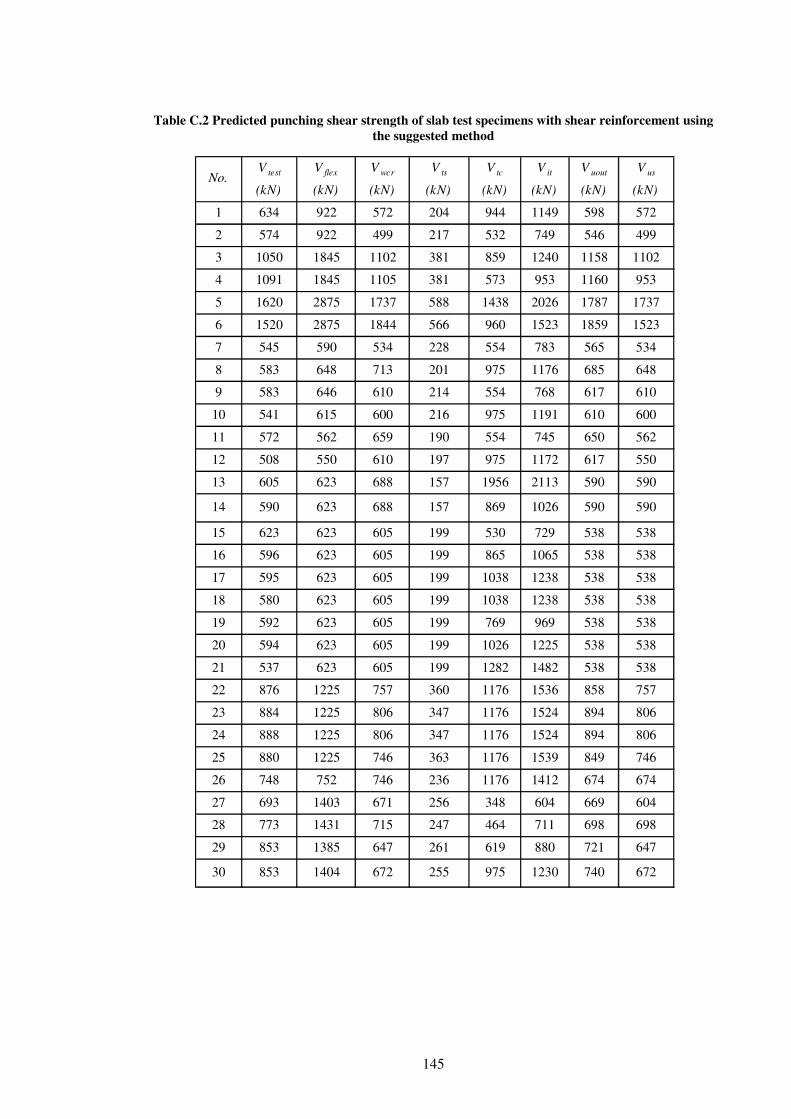
145
Table C.2 Predicted punching shear strength of slab test specimens with shear reinforcement using
the suggested method
V test V flex V wcr V ts V tc V it V uout V us
(kN) (kN) (kN) (kN) (kN) (kN) (kN) (kN)
1 634 922 572 204 944 1149 598 572
2 574 922 499 217 532 749 546 499
3 1050 1845 1102 381 859 1240 1158 1102
4 1091 1845 1105 381 573 953 1160 953
5 1620 2875 1737 588 1438 2026 1787 1737
6 1520 2875 1844 566 960 1523 1859 1523
7 545 590 534 228 554 783 565 534
8 583 648 713 201 975 1176 685 648
9 583 646 610 214 554 768 617 610
10 541 615 600 216 975 1191 610 600
11 572 562 659 190 554 745 650 562
12 508 550 610 197 975 1172 617 550
13 605 623 688 157 1956 2113 590 590
14 590 623 688 157 869 1026 590 590
15 623 623 605 199 530 729 538 538
16 596 623 605 199 865 1065 538 538
17 595 623 605 199 1038 1238 538 538
18 580 623 605 199 1038 1238 538 538
19 592 623 605 199 769 969 538 538
20 594 623 605 199 1026 1225 538 538
21 537 623 605 199 1282 1482 538 538
22 876 1225 757 360 1176 1536 858 757
23 884 1225 806 347 1176 1524 894 806
24 888 1225 806 347 1176 1524 894 806
25 880 1225 746 363 1176 1539 849 746
26 748 752 746 236 1176 1412 674 674
27 693 1403 671 256 348 604 669 604
28 773 1431 715 247 464 711 698 698
29 853 1385 647 261 619 880 721 647
30 853 1404 672 255 975 1230 740 672
No.

146
Table C.3 Predicted punching shear strength of slab test specimens with shear reinforcement using
ACI 318-05
V test V flex
(kN) (kN) V max (kN) V sd (kN) V uout (kN) V us (kN)
1 634 922 572 670 393 393
2 574 922 499 472 471 471
3 1050 1845 1102 806 818 806
4 1091 1845 1105 660 1227 660
5 1620 2847 1737 1404 1318 1318
6 1520 2847 1844 1163 2104 1163
7 545 590 534 497 689 497
8 583 648 713 708 921 648
9 583 646 610 522 787 522
10 541 615 600 670 620 600
11 572 562 659 538 681 538
12 508 550 610 674 552 550
13 605 623 688 1358 426 426
14 590 623 688 729 507 507
15 623 623 605 506 310 310
16 596 623 605 610 310 310
17 595 623 605 692 310 310
18 580 623 605 692 310 310
19 592 623 605 572 310 310
20 594 623 605 696 310 310
21 537 623 605 820 310 310
22 876 1225 757 748 966 748
23 884 1225 806 764 714 714
24 888 1225 806 764 714 714
25 880 1225 746 744 951 744
26 748 752 746 744 951 744
27 693 1403 671 405 342 342
28 773 1431 715 480 365 365
29 853 1385 647 539 399 399
30 853 1404 672 735 487 487
No.ACI 318-05

147
Table C.4 Predicted punching shear strength of slab test specimens with shear reinforcement using
Eurocode2
V test V flex
(kN) (kN) V max (kN) V sd (kN) V uout (kN) V us (kN)
1 634 922 1199 823 540 540
2 574 922 954 628 491 491
3 1050 1845 2059 1128 1084 1084
4 1091 1845 2069 969 1086 969
5 1620 2847 2883 1929 1640 1640
6 1520 2847 3192 1650 1711 1650
7 545 590 890 786 509 509
8 583 648 1460 868 624 624
9 583 646 1125 817 559 559
10 541 615 1092 826 553 553
11 572 562 1282 835 590 562
12 508 550 1125 830 559 550
13 605 623 1642 1513 535 535
14 590 623 1642 853 535 535
15 623 623 1309 670 488 488
16 596 623 1309 722 488 488
17 595 623 1309 806 488 488
18 580 623 1309 806 488 488
19 592 623 1309 683 488 488
20 594 623 1309 810 488 488
21 537 623 1309 938 488 488
22 876 1225 1223 1004 788 788
23 884 1225 1367 1026 824 824
24 888 1225 1367 1026 824 824
25 880 1225 1191 999 780 780
26 748 752 1191 903 619 619
27 693 1403 1135 610 634 610
28 773 1431 1261 694 663 663
29 853 1385 1068 751 690 690
30 853 1404 1140 961 709 709
Eurocode2No.

148
Table C.5 Predicted punching shear strength of slab test specimens with shear reinforcement using
CSA A23.3-04
V test V flex
(kN) (kN) V max (kN) V sd (kN) V uout (kN) V us (kN)
1 634 922 858 801 439 439
2 574 922 749 587 545 545
3 1050 1845 1652 1059 962 962
4 1091 1845 1657 914 1419 914
5 1620 2847 2606 1804 1556 1556
6 1520 2847 2766 1587 2439 1587
7 545 590 801 619 792 590
8 583 648 1069 872 1058 648
9 583 646 915 662 905 646
10 541 615 899 808 717 615
11 572 562 988 689 788 562
12 508 550 915 814 641 550
13 605 623 1032 1516 501 501
14 590 623 1032 888 591 591
15 623 623 907 645 365 365
16 596 623 907 749 365 365
17 595 623 907 831 365 365
18 580 623 907 831 365 365
19 592 623 665 602 365 365
20 594 623 665 726 365 365
21 537 623 665 850 365 365
22 876 1225 833 785 1112 785
23 884 1225 886 804 833 804
24 888 1225 886 804 833 804
25 880 1225 820 781 1096 781
26 748 752 820 781 1096 752
27 693 1403 1006 559 415 415
28 773 1431 1072 645 443 443
29 853 1385 970 688 478 478
30 853 1404 1009 890 578 578
No.CSA A23.3-04