Embed Size (px)
Citation preview
CONCENTRATION AND MERGERSIN U.S. WHOLESALE GROCERY
MARKETS
by
John M. Connor
Staff Paper 97-09
June 1997
Dept. of Agricultural Economics
Purdue University
Purdue University is committed to the policy that all persons shall have equal access to its programs andreligion, national origin, sex, age, marital status, disability, employment without regard to race, color, creed public assistance status, veteran status, or sexual orientation.
CONCENTRATION AND MERGERSIN U.S. WHOLESALE GROCERY MARKETS
byJohn M. Connor
Dept. Of Agricultural Economics, Purdue UniversityWest Lafayette, Indiana 47907-1145
[email protected] Paper 97-09
June 1997
Abstract
This report analyzes a large sample of U.S. grocery warehouse operators in 54 well definedgrocery marketing areas. Almost all grocer retail chains with more than 40 supermarkets and $500million in retail sales in 1990 are vertically integrated into wholesaling. More than four-fifths of themarket areas display high levels of sales concentration (four-firm concentration greater than 60percent). The 1992 merger between Super Value and Wetterau violated federal merger enforcementguidelines in at least four market areas, and several more horizontal mergers between merchantgrocery wholesalers have been consummated since then.
Keywords: Grocery wholesale trade, food retail trade, market concentration, mergers and acquisitions, vertical integration, antitrust policy, food distribution, geographic market definition.
Copyright © by John M. Connor. All rights reserved. Readers may make verbatim copies of thisdocument for non-commercial purposes by any means, provided that this copyright notice appearson all such copies.
ii
Contents
Introduction . . . . . . . . . . . . . . . . . . . . . . . . . . . . . . . . . . . . . . . . . . . . . . . . . . . . . . . . . . . . . . . .1Objective . . . . . . . . . . . . . . . . . . . . . . . . . . . . . . . . . . . . . . . . . . . . . . . . . . . . . . . . . . . . 2Data Sources . . . . . . . . . . . . . . . . . . . . . . . . . . . . . . . . . . . . . . . . . . . . . . . . . . . . . . . . . 3Method of Analysis . . . . . . . . . . . . . . . . . . . . . . . . . . . . . . . . . . . . . . . . . . . . . . . . . . . . .4
Market Definitions . . . . . . . . . . . . . . . . . . . . . . . . . . . . . . . . . . . . . . . . . . . . . . . . . . . . . . . . . . . 5
Ownership Types . . . . . . . . . . . . . . . . . . . . . . . . . . . . . . . . . . . . . . . . . . . . . . . . . . . . . . . . . . . . 8Integrated Retailers . . . . . . . . . . . . . . . . . . . . . . . . . . . . . . . . . . . . . . . . . . . . . . . . . . . . 8Merchant Wholesalers . . . . . . . . . . . . . . . . . . . . . . . . . . . . . . . . . . . . . . . . . . . . . . . . . . 11Other Wholesalers . . . . . . . . . . . . . . . . . . . . . . . . . . . . . . . . . . . . . . . . . . . . . . . . . . . . . 11
Sales Concentration . . . . . . . . . . . . . . . . . . . . . . . . . . . . . . . . . . . . . . . . . . . . . . . . . . . . . . . . . .12Warehouse Numbers . . . . . . . . . . . . . . . . . . . . . . . . . . . . . . . . . . . . . . . . . . . . . . . . . . . 13Company Numbers . . . . . . . . . . . . . . . . . . . . . . . . . . . . . . . . . . . . . . . . . . . . . . . . . . . . .14Sales Concentration Ratios . . . . . . . . . . . . . . . . . . . . . . . . . . . . . . . . . . . . . . . . . . . . . . .16Company Market Shares . . . . . . . . . . . . . . . . . . . . . . . . . . . . . . . . . . . . . . . . . . . . . . . . 18
Merger Analysis . . . . . . . . . . . . . . . . . . . . . . . . . . . . . . . . . . . . . . . . . . . . . . . . . . . . . . . . . . . . .19Mergers 1992-1996 . . . . . . . . . . . . . . . . . . . . . . . . . . . . . . . . . . . . . . . . . . . . . . . . . . . . 19Effects of Super Valu-Wetterau . . . . . . . . . . . . . . . . . . . . . . . . . . . . . . . . . . . . . . . . . . . 21
Conclusions . . . . . . . . . . . . . . . . . . . . . . . . . . . . . . . . . . . . . . . . . . . . . . . . . . . . . . . . . . . . . . . .23
References . . . . . . . . . . . . . . . . . . . . . . . . . . . . . . . . . . . . . . . . . . . . . . . . . . . . . . . . . . . . . . . . .45
Endnotes . . . . . . . . . . . . . . . . . . . . . . . . . . . . . . . . . . . . . . . . . . . . . . . . . . . . . . . . . . . . . . . . . .47
Appendix A . . . . . . . . . . . . . . . . . . . . . . . . . . . . . . . . . . . . . . . . . . . . . . . . . . . . . . . . . . . . . . . .49
Appendix B . . . . . . . . . . . . . . . . . . . . . . . . . . . . . . . . . . . . . . . . . . . . . . . . . . . . . . . . . . . . . . . .62
1
Concentration and Mergers in U.S.Wholesale Grocery Markets
byJohn M. Connor
Dept .of Agricultural Economics, Purdue UniversityWest Lafayette, IN 47907-1145
[email protected] Paper 97-09
June 1997
Introduction
For decades economists have attempted to study and understand the market structures of theU.S. food processing and distribution industries. Compared to the other stages of the U.S. foodsystem, the market structure of the grocery wholesaling industry is the least documented. The mostcomprehensive study of the U.S. food system devoted a mere 2.3 percent of its text pages to thegrocery wholesaling industries (Marion et al.). The Bureau of the Census has published concentrationdata on the food manufacturing industries on a regular basis since the 1940s, and market shares fromfor-profit grocery information services has increasingly become available (IRI). In grocery retailing,regional research groups have commissioned at great expense special tabulations of salesconcentration ratios across statistical metropolitan areas, the latest for the year 1987 (Franklin andCotterill). Concentration ratios have repeatedly been discovered to have strong explanatory powerwhen linked to various measures of market performance (e.g., Connor et al., Cotterill, Binkley andConnor). The proper measurement of market sales concentration is essential for the wiseenforcement of U.S. merger laws. The merger guidelines now is force for the major federal antitrustagencies specify the use of pre-merger and post-merger concentration ratios as the principal criteriafor deciding whether to investigate proposed mergers in any industry (U.S. Justice Department). Thenumber of U.S. grocery wholesalers acquired by other U.S. grocery wholesalers averaged about 20per year in the 1970s (Marion et al.: 349). The rate nearly doubled in the 1980s and early 1990s.(ERS). More importantly, several mergers during 1992-1996 involved leading wholesalers.
Very few published studies of grocery wholesaling concentration exist. The U.S. nationalCommission on Food Marketing studied wholesaling within various commodity subsectors, butproduced no comprehensive examination of the industry as a whole. The last precise investigationwas an unpublished analysis of a special tabulation of the 1972 Census of Wholesale Trade preparedby USDA economists and reported in Marion et.al. (Page 348). This study found that the four-firmsales concentration ratio (CR4) for general-line food wholesalers ranged from 58 to 89 percent andaveraged 73 percent across 14 grocery marketing areas (GMA). The GMAs were defined for suchlarge metropolitan areas as Boston, Cleveland, Seattle, and San Francisco. Each GMA wascomposed of from two to four census MSAs. Concentration ratios were also calculated forwholesalers specialized in selling meat, produce, confectionary, or the like. Average CR4s for thespecialty wholesalers were typically much lower than for the general-line wholesalers.
2
Although a pioneering study for its time, the USDA special tabulation suffers from severallimitations. In particular, the sample of 14 GMAs was chosen for convenience rather than statisticalrepresentativeness, and the USDA analysis was confined by certain rigid classification practices ofthe U.S. Bureau of the Census. The limitations of the USDA study highlight two major problems1
facing would-be studies of wholesaler market structure. The first issue is that there are difficultiesin identifying which types of wholesale operations are in more or less direct rivalry with one another.Grocery warehouses are owned and operated by four fairly distinct types of companies. First, mostlarge and many medium-sized grocery chains operate warehouses that are filled with goods purchaseddirectly from food processors (or in the case of fresh produce, wholesale packers or growers). Inaddition, most smaller chains and some “independent” (non-chain) retailers operate small warehousesthat satisfy a portion of their storage requirements while relying on other wholesalers for the bulk oftheir wholesale purchases. Second, there are merchant wholesalers, firms that store and deliverproducts purchased from growers, packers, or manufacturers. Some of the merchants are specializedin one line of business (meat, dairy, beverages, etc.) And some are general-line merchants (sell severallines of groceries). The fourth type of wholesale distributor are manufacturers that vertically integrateforward by operating their own sales and distribution centers. These manufacturers’ sales branchesgenerally sell to integrated retailers or to merchant wholesalers. A fifth kind of grocery wholesalerdoes not operate a warehouse; agents and brokers sell food products for processors on a commissionbasis. Like manufacturers’ sales branches, agent and brokers tend to sell to integrated retailers or tomerchant wholesalers, while the latter two types tend to sell and deliver directly to retailestablishments each wholesaler type offers different mixes of services to client. The complexityinduce by these four or five types of wholesalers makes market structure analysis of grocerywholesaling particularly messy.
A second knotty analytical issue is the proper geographic delineation of wholesale grocerymarkets. The consensus among economists who have studied the issue is that neither the nation asa whole nor units as small as MSAs. National markets do exist for many manufactured food2
products (but most are subnational), and federal court decisions have affirmed that the MSA is arelevant geographic market for grocery retailing. The MSA may not be a useful building block foridentifying appropriate geographic markets for grocery wholesalers. General-line wholesalersgenerally shipped most of their products to stores within 200 miles of the warehouse, but occasionalshipments occur to clients up to 400 miles away, particularly in sparsely populated areas of thecountry. In a 1982 study of general-line wholesale establishments, the average distance of thefarthest store served was 271 miles. Information on actual shipping patterns from warehouses tostores would be essential to proper market delineation. Even with such information, market borderscannot be drawn with the utmost precision or certainty. Rather, the resulting geographic definitionswould most likely remain probabilistic constructs or “fuzzy sets,” with gaps between markets forareas that fall into no identifiable or unique shipping zone.
Objective
The purpose of this paper is to calculate and analyze the degree of market sales concentrationin 1990 among general-line grocery wholesalers in properly defined local U.S. markets. Marketconcentration measures the number and size distribution of independent sellers in the same industry.High concentration results when the number of significant sellers is small or their market shares areunequally distributed. The primary focus of this paper is on wholesalers that distribute directly to
3
grocery stores; manufacturers sales branches, wholesale agents, and brokers are outside the scopeof this report. Consideration of geographic market definition is a necessary step in the accuratemeasurement of sales concentration, so an entire section of this report is devoted to the topic. Thesecond purpose is to evaluate the effects on concentration of the largest merger among grocerywholesalers in decades, the 1992 Super Valu-Wetterau merger.
Data Sources
The principal data source is confidential “Participant Information Guides: prepared by SAMIanalysts for their own internal use. SAMI (Selling-Areas Markets, Inc.) was the major and almostsole rival to A.C. Nielsen Company in the business of selling data on grocery brands market sharesin the 1970s and 1980s. Unlike Nielsen, SAMI employed “warehouse withdrawal” data to developmarket-by-market estimates of retail grocery market sales, volumes, and prices. Beginning in 1965,SAMI contracted with grocery warehouse operators to send magnetic tapes to SAMI’s operationscenter every four weeks. The tapes contained item-by-item shipments of grocery products fromspecific warehouses to specific retail stores. By the 1980s the number of participating warehousesexceeded 600 nationwide, and the SAMI sample accounted for nearly 90 percent of total groceryshipments in 54 GMAs. The operations center consolidated the product shipments data using acommon product coding system and made projections of non-sample sales. Over the 25 years SAMIwas in business, total sales to food manufacturers and other clients accumulated to $5 to $10 billion.3
Food companies clearly regarded SAMI data as accurate and useful for marketing decisions.
Grocery wholesalers sell their products to two major retail outlets: food stores andfoodservice establishments. Neither the SAMI data nor most of the Progressive Grocer Guidebookcover shipments to foodservice outlets. SAMI’s product tracking services were entirely focused onretail grocery and drug stores. The Guidebook may list wholesalers that sell a minor portion of their4
shipments to foodservice operators, but all the retailers listed as potential buyers are grocery retailers.Neither source lists Sysco Corp., which is by far the largest wholesaler supplying foodservice outlets(Marion et al.).
The SAMI data cover wholesale shipments to operators grocery of supermarkets, conveniencestores, and mass-merchandise department stores. Grocery supermarkets include conventionalsupermarkets, warehouse stores, combination stores, and super stores (Connor and Schiek). Thepresence of convenience store chains in the SAMI data is signaled by a listing for SouthlandCorporation, the parent company for the 7-eleven chain, which operates a couple of smallwarehouses. The Guidebook also lists wholesalers that serve convenience stores and other smallergrocery stores. Finally, SAMI had the participation of at least one large discount department storechain with warehouse shipment activity centered in Missouri and nearby states. Progressive Grocerlists no mass-merchandise retailers either as distributors or retail buyers.
This study uses several pieces of information gleaned from the Participant Information Guides.Each SAMI operator and warehouse is identified by name and a unique code number. Super Valuand its subsidiaries were given company code “0002", and A & P was assigned code “0015.” Inaddition, if one company shipped groceries to stores in a given market from two or more facilities,each facility is usually identified by type of product or location. For example, in the Portland, Mainemarket, the Wetterau company shipped to stores in the market from two locations identified as
4
“Wetterau/Portland” and “Wetterau/Keene.” Next to each warehouse is the percentage of thesample’s retail sales supplied by each warehouse. In August 1990, Wetteraus’ Portland warehouseaccounted for 4.9 percent and its Keene, NH warehouse accounted for 1.9 percent of totalparticipants’ sales in the Portland market. Finally, the Guides indicate which of five product lineswere being shipped into the market by the warehouse (dry grocery, meat, other refrigerated foods,frozen foods, and HBA). Thus, one can see that Progressive Distributors supplied 6.4 percent ofPortland’s groceries and that its sole warehouse shipped only HBAs. On a separate sheet, SAMIanalysts estimated within a 10 percentage point range the coverage of SAMIs’ sample for each of thefive grocery product lines in each of its markets. In Portland, SAMI participants accounted for 85to 95 percent of all dry groceries sold in the market.
The SAMI data were cross-checked by consulting Progressive Grocer’s 1991 MarketingGuidebook, the 24 edition of this reference handbook. The Guidebook uses information on 90,000th
grocery stores to develop profiles of retail chains with at least $50 million in sales and wholesalers(merchants, brokers, and rack jobbers) of like size supplying the chains. Information on sales, storetypes, and locations is given for nearly 300 retail companies. For nearly 100 wholesale merchants,the Guidebook lists warehouse locations, physical sizes, products handled, and sales. Sales areestimated for about one-fifth of the companies, but the methods of estimation are not revealed. Fora few companies (especially foreign owned ones like National Tea), no sales estimates are provided.
Cross checks with the SAMI lists indicate that about 10 percent of the retailers and merchantwholesalers that meet Progressive Grocer’s size criteria are missing from the Guidebook. Sales bygeographic “divisions” of retailers and merchants (operations that generally correspond to GMAs)are provided sporadically. Many HBA wholesalers listed by SAMI are missing in the Guidebook.There are signs of carelessness in preparation of the guidebook: city names are misspelled, pages areout of order, and sometimes company sales in a GMA exceed the total national sales of company bya substantial margin. There is no discussion of how sales estimates are made nor limitations of thedata presented in the Guidebook. Consequently, this report favors the SAMI data as more accurateand employs the Guidebook as a secondary source of information.
Methods of Analysis
The starting point is the sample market shares provided in the SAMI worksheets. There are696 market shares given, an average of 13 per GMA. These shares measure the retail value of 1990shipments from a warehouse to grocery stores located in the GMA. Most of the warehouses arephysically located inside the GMA as well, but about one-fourth of the warehouses are located inadjacent market areas. Warehouses supplying only HBAs are especially likely to be located outsidethe GMAs of the stores they supply. The SAMI sample market shares are converted to retail salesfigures using SAMIs own data on grocery sales (see Appendix A) and further multiplied by the SAMIcoverage ratio (shown in Table 1 below). Thus, the dollar figures represent retail-value wholesaleshipments to stores in the SAMI-defined GMA.
Progressive Grocer data was added for major retailers or wholesalers that were not SAMIparticipants. Sales of non-participants were adjusted downward to reflect the smaller geographiccoverage of Progressive Grocer’s GMAs as compared to SAMI’s GMAs (see next section for adiscussion). The Progressive Grocer data provided an additional 72 market shares, making the total
5
number of share observations 768. The number of Progressive Grocer sales shares varied from zero(for 13 GMAs) to four; the average shares estimated from the Guidebook was 4.9 percentage points.The total coverage from both sources is shown in Table 4 below. The Guidebook was also used toclassify the wholesale operators by type (retailer, cooperative wholesaler, voluntary wholesaler, andproprietary wholesaler) and to estimate total national sales of the companies. Total sales acrossGMAs were compared with total national sales.
Market Definitions
The grocery marketing areas (GMAs) defined by SAMI were designed primarily on the basisof the shipping patterns of grocery warehouses. Wholesalers and retailers that managed grocerywarehouses (called “operators” or “participants” by SAMI) provided information on the location ofthe warehouses and shipments to individual stores of all types of grocery products (frozen andrefrigerated foods, dry groceries, and health and beauty aids). Some participants operated severalwarehouses in a single GMA, and some participants supplied stores in the GMA from warehousesoutside the GMA.
It is clear from the confidential “Participant Information Guides” maintained by SAMI analyststhat GMAs were delineated so as to minimize the extent of “leakage” while at the same timeincreasing the number of GMAs for sale to clients. SAMI revenue was positively related to thenumber of well defined GMAs for which reliable brand market shares could be calculated. Regionalmanufacturers could purchase information for just their selling areas or potential expansion areas andnational manufacturers would pay more as the number of useful GMAs rose. However, because itrelied on wholesale shipping information, SAMI could not increase the number of GMAs indefinitelyor even match the number of Statistical Metropolitan Areas (SMAs) in the United States. As thenumber of GMAs increased, the extent of cross-GMA grocery shipments also increased, whichgreatly complicated the calculation of accurate GMA market shares. Therefore, the SAMI GMAs5
represent a compromise between providing fine geographic detail and aggregation to minimizeleakage across GMA boundaries. Maps of the 54 GMAs are shown in Appendix B.
Historically, SAMI first began selling GMA data on three large metropolitan areas in theMidwest and Houston, Texas (Table 1). Within four months five more large cities had been addedto SAMI’s offerings, including New York and Boston. During 1967, SAMI added nine more largecities, some of them located in the South and far West. By the end of 1968, SAMI offered localgrocery information on 25 of the largest U.S. cities that accounted for about 70 percent of U.S.grocery sales.
These first 25 GMAs were fairly straight-forward choices, partly because their sizes gaveSAMI a very large share of total U.S. grocery sales and partly because they were geographicallycohesive. The early SMAs had a high degree of coverage by SAMI participants and a low degreeof leakage from outside the GMA boundaries. For example, 97 percent coverage of the MinneapolisGMA was obtained from warehouse-withdrawals supplied by merely six SAMI participants;moreover, of that 97 percent sample, at most 0.3 percentage points consisted of shipments intoMinneapolis from warehouses outside the GMA. Most of the other early SAMI markets also attained2
high levels of coverage and low degrees of import leakages: Detroit, Milwaukee, Boston, New York,Philadelphia, Buffalo, Atlanta, Chicago, Seattle, Denver, and Phoenix are examples. Each of these
6
cities tend to be economically dominant metropolitan areas with few other large cities within a 100mile radius. A couple of exceptions are worth noting. The Baltimore/Washington GMA had lessthan 60 percent coverage, but it is apparent from the SAMI participant guides that the main reasonwas SAMI’s failure to sign up the area’s leading retail operator, Giant Foods. Had SAMI been ableto obtain Giant’s warehouse of shipments’ data, its coverage would have approached 90 percent. TheIndianapolis case if different. Indianapolis lies 160 miles from Chicago, 122 from Fort Wayne, 114from Cincinnati, 97 from Louisville, and 242 from St. Louis. Each of these surrounding cities havelarge grocery warehouse operators. SAMI was able to secure the participation of the four largestoperators within the Indianapolis market and the cooperation of several major operators that importedgroceries into the Indianapolis market from warehouses in Fort Wayne; Chicago; Desloge, Missouri;Evansville, Indiana; Lima, Ohio; and two other locations outside the GMA. Despite the largecoverage of inside operators (almost 90 percent) and eight outside warehouses, SAMI coverage ofretail sales in Indianapolis was less than 75 percent in 1990 because several operators in Michigan,Illinois, and Ohio were not part of the SAMI system. Although the Indianapolis case is exceptionalamong the SAMI markets, it demonstrates the difficulty that SAMI had in trying to expandgeographical coverage in more densely populated areas of the United States.
With 25 markets accumulated in three years, creation of additional market areas proceededmuch more slowly after 1968. From 1969 to 1973 only five more markets were added to SAMI’slist. Some were relatively easy choices: The Cincinnati market covered most of central and southernOhio (though how far south the border should be drawn may be arbitrary). The Birmingham andnorthern Florida markets also appear to be well defined. However, the Memphis/Little Rock marketdefinition must have required some close decisions about whether to include Springfield, Missourior Jackson, Mississippi (both were excluded).
From 1974 to 1985, SAMI added three markets each year (except 1975 and 1978-1980).Again, many of these markets appear to be well defined because they contain dominant metropolitanareas relatively isolated from other competing metropolitan centers of commerce. San Antonio, SaltLake City, Spokane, and Wichita markets fit this description. Other markets covered entire statesor major portions of states separated by natural geographic barriers: the Norfolk/Richmond marketcovered most of Virginia except the Washington area. The Oklahoma City, Nashville, and Louisvillemarkets are similarly coextensive with state boundaries; Spokane covers Washington State east ofthe Cascade Mountains. The SAMI markets added in the late 1970s and early 1980s considerablyexpanded the coverage of the South and many rural areas, yet even by 1985 many gaps remained inSAMI’s geographical coverage. The gaps include most of Appalachia, the Ozarks, south Georgiaand the Florida panhandle, Nevada and a huge area of the northern High Plains (Appendix B). SAMIapparently decided that its clients were relatively uninterested in areas dominated by low incomehouseholds or undergoing depopulation.
Some of the GMAs added by SAMI during the early 1980s appear to be somewhat arbitrarilydelineated, but one must bear in mind the excellent shipping data that SAMI analysts had from theirparticipating operators. Amon the problematic market areas are Portland, Maine (may be part ofBoston); Scranton, Pennsylvania (part of Baltimore); Peoria, Illinois (part of St. Louis); Quad Cities(part of Chicago to the east or Omaha/Des Moines to the west); and perhaps Shreveport/Jackson(could be part of the Memphis or Dallas GMAs).

7
The 54 GMAs delineated by SAMI during 1985-1990 tend to correspond closely to othercommercial grocery data services. Progressive Grocer’s Marketing Guidebook divided the entirecontinental United States into 51 GMAs in 1990. The Marketing Guidebook has been publishedannually for about 30 years. Like SAMI, the Guidebook is aimed at the salespeople and marketingplanners of grocery manufacturers who want to identify the major buyers of grocery products in eachregion. The major distributors with facilities in each GMA are identified according to their share ofGAM retail sales; moreover, like SAMI, the Guidebook also identifies out-of-market distributioncenters. While Progressive Grocer does obtain some proprietary data from distributors (size andlocation of warehouses, number of trucks, number and types of stores served), it does not haveregular access to shipping destinations. (The state locations of stores is sometimes available, but notall distributors reveal even this much). The Guidebook GMAs tend to follow state lines whereverpossible.
There is a fairly close correspondence between the geographic definition of the SAMI andProgressive Grocer GMAs (Table 2). In general, where they overlap the SAMI markets arecontained within the Progressive Grocer markets. Of the 54 SAMI markets, 35 are virtuallycoextensive with Progressive Grocer markets. In addition, eight Progressive Grocer marketsessentially were split in two by 16 SAMI markets (the former are Boston, Baltimore, Milwaukee,Chicago, St. Louis, Memphis, Charlotte, and Columbia). Only three SAMI markets (Jacksonville,San Francisco, and Omaha) were split by six Progressive Grocer GMAs. Finally, three ProgressiveGrocer markets have no correspondence to SAMI markets; the three (Billings, Fargo and Springfield,Missouri) fall in the empty intermarket areas between SAMI markets. Therefore, in summary, withthree exceptions, all the other 51 SAMI markets are encompassed by 42 Progressive Grocer markets;three SAMI markets correspond to three pairs of Progressive Grocer Markets.
The SAMI GMAs also correspond quite closely to the retail grocery markets defined by theA.C. Nielsen company (Table 2). The Nielsen markets were apparently designed from retail salesinformation and consideration of Areas of Dominant Influence (ADIs). Again there is a closecorrespondence between the SAMI and Nielsen markets. Nielsen splits the SAMI Cincinnati marketinto a Columbus and Cincinnati portion; SAMI’s Omaha market is likewise split east from west; andthe SAMI Jacksonville market is divided into three Nielsen markets (Jacksonville, Orlando, andTampa). There are four more such examples of SAMI markets split by Nielsen. The most interestingcase is SAMI’s Quad Cities market, which Nielsen places in its large Omaha - Des Moines area, butProgressive Grocer judges its part of the Chicago GMA.
To summarize, the geographic definitions of GMAs by SAMI, Nielsen, and ProgressiveGrocer are quite similar. The SAMI areas are delineated to minimize “exports” from and “imports”into each GMA, a market concept that comports with economists’ concepts of a market. The SAMIapproach allows for large intermarket areas, whereas Progressive Grocer places every U.S. countyinto one GMA. In general, the Progressive Grocer GMAs are equal to or larger than SAMI’s,whereas Nielsen’s are smaller or the same in size. The overall impression is of great geographicalsimilarity of U.S. grocery-products markets. Retail sales in the 54 GMAs in 1990 accounted for 75.4percent of total U.S. grocery sales (Table 1).
8
Ownership Types
Warehouse operators fall into two major classes: retail grocery chains buying for their ownstores and merchant wholesalers. There are a few integrated retailers that sell wholesale to otherretailers in their markets or slightly outside them, and likewise a few wholesalers own and operatesome grocery stores, but his classification is almost always clear-cut. Among the merchantwholesalers, there are three forms of ownership. Cooperative wholesalers are actually owned by thesmall chains and independent retailers that they serve. Voluntary wholesalers are not owned by theretailers they serve, but the retailers are contractually affiliated for long periods of time with thesewholesalers, usually by contract. Both cooperative and voluntary wholesalers typically operategeneral-line warehouses. The remaining merchant wholesalers are a miscellaneous group, containingboth general line and specialty wholesalers. Many of these wholesalers are rack jobbers (tobacco,candy, and magazines), HBA specialists, or other food specialists. Table 3 shows the breakdown ofgrocery warehouse operators by ownership type for the 54 SAMI market areas. Integrated retailersaccount for as little as 0.1 percent of GMA sales (Minneapolis) or as much as 84 percent (Denver).Except for Michigan (where Spartan and Meijers are strong) and Chicago, the Midwest generallydisplays low retailer shares. Most GMAs south of the Midwest also share this characteristic. MostAtlantic coastal GMAs display a marked prediction for retailer integration.
Cooperative wholesalers are important players in only a few GMAs. In the Northeast,southern New England, eastern New York state, and eastern Pennsylvania stand out. In the Midwest,cooperative activity is centered in Chicago and Milwaukee (where Roundy’s has a leading position)and in the states of Kansas, Nebraska, and Missouri. In the South, significant penetration ofcooperatives is found only around Memphis and northern Texas. Three large cooperative wholesalersoperate in Salt Lake City (Associated Foods), Seattle (Associated Grocers), and Los Angeles(Certified). Very few GMAs have more than one cooperative grocery wholesaler.
Voluntary wholesalers also have uneven distribution across the United States. They dominategrocery wholesaling Pittsburgh, parts of Ohio, Minnesota, northern Wisconsin, and a couple ofGMAs in Texas and Oklahoma. However, in most GMAs, voluntary wholesalers have the greatestshare among the merchant wholesalers in practically all of the GMAs.
About 5 percent of wholesale grocery activity in the typical GMA cannot be classified by type.This “unknown” category includes retailers and wholesalers too small to be listed in ProgressiveGrocer’s guidebook. It also includes many merchant wholesalers specialized in fresh produce, meat,poultry, and seafood. SAMI was not interested in collecting data on these types of merchantwholesalers because the majority of such products are not branded by manufacturers.
Integrated Retailers
Grocery chain retailers that have large enough retail operations in a grocery marketing area(GMA) typically are heavily invested in grocery warehouse assets. Backward vertical integration byretailers is motivated by both the prospects of greater operational efficiency and for strategic reasons.Exclusive retailer ownership of warehouses resolves several differences that may arise between aretailer and an independent wholesaler. The most profitable business decisions for the wholesaler7
may result in suboptimal profits for the retailer (and vise versa). Generally speaking, retailers would
9
desire more frequent deliveries to stores than is optimal for the wholesaler to provide; more frequentreplenishment of store shelves would permit retailers to increase the number of items stocked in thestores (multiple facings of popular items can be reduced) and reduce the risk of outages. Retailersmight prefer more deliveries at night or in the early morning hours for the convenience of itscustomers, but wholesalers might find such a shift would be a difficult challenge in labor relations.Retailers would like wholesalers to stock a mix of items that precisely matches their customers’preferred groceries, but wholesalers must balance the needs of several retail clients with differingcustomer bases. When new warehouse facilities or significant expansions are being planned, a retailclient would like the investment to occur close to the economic centroid of its own retail operations,but an independent wholesaler will expand in a direction and a pace that fits best its expectation ofthe future locations of all its likely retail clients. Another investment decisions involves integratedelectronic inventory-ordering systems; a system adopted by a wholesaler may not have the technicalfeatures that are ideal for each of its retail customers. Once adopted, such computerized systems maybe incompatible with the systems adopted by alternative supplies, thus reducing the bargaining powerof the retail client. Most large wholesalers offer private label products, but the label is controlled bythe wholesalers. That is, the quality of the products is largely a wholesaler decision. Moreimportantly, unlike the store brands of the largest retailers, the controlled brands cannot be offeredexclusively to just one retail client. Finally, warehouse ownership by retailers may be a tool forhorizontal rivalry among retailers in a GMA. Investment in a large, dedicated warehouse facilityrepresents a concrete, highly visible symbol of commitment to a market. Part of the investment costsare sunk costs that cannot be recovered should the owner exit the GAM. Moreover, a retailer mayintentionally build “ahead of demand;” that is, a warehouse might contain excess capacity. Both sunkcosts and excess capacity can discourage potential entrants from moving into a GMA or can serveto discipline an existing weak rival into a less aggressive pricing stance. In brief, direct warehouseownership can solidify the market shares of integrated retailers.
Appendix Table 1 contains a list of the 121 grocery retailers known to have 1992 U.S. salesof at least $250 million. Sales are estimated by Progressive Grocer in some cases; a few companiesabove this size limit may be missing, but the list is reasonably complete. These 121 companies were8
listed irrespective of the extent of their wholesale integration. One operator of “supercenters” ordepartment stores, Wal-Mart, is also included. A few wholesalers with extensive retail operationsare listed as well, e.g., Penn Traffic, Super Valu, and Holiday Companies. Only the retail grocerydivisions of these diversified companies are included.
Nearly all of the top ten grocery chains were fully integrated in general-line grocery productsin 1990. There are few exceptions. Kroger owns the Fry’s chain based in Phoenix: Fry’s operatesa 1,000,000 square foot warehouse complex in Phoenix that supplies stores in Arizona that have retailsales there of more than $1 billion. However, Fry’s has made a foray into the San Francisco GMA,where it had a 2 percent local market share. Because its San Francisco sales are not large enough tojustify building a warehouse in northern California, Fry’s is supplied by the huge cooperativewholesaler, Certified Grocers of Los Angeles. This appears to be exceptional, as Kroger’s otheroperations appear to be fully integrated. Another exception to the general rules appears in thewholesaling of frozen foods, HBAs, and housewares. Some large frozen food specialty wholesalerssupply major chains: Burris supplies Giant in Washington, DC and Southeast Frozen supplies GrandUnion in Atlanta. HBAs are sometimes supplied by specialized wholesalers, like Rawson Drug onthe West Coast, but most of the leading retailers appear to have special warehouses for HBAs that
10
deliver to large sections of the country. A&P delivers HBAs and housewares from New Jersey HBAwarehouse all the way to New Orleans and Atlanta.
Leading U.S. retailers have substantial investments in warehouses, truck, and trailers., Thenine largest companies own facilities that aggregate to at least 3.5 million square feet of space.Kroger, the largest U.S. grocery retailer in 1990, operated at least 24 grocery warehouses with nearly10 million square feet of storage space. These data may actually undercount warehouse spacebecause Kroger, Safeway, A&P, Winn-Dixie, and some others are reluctant to reveal warehouse sized(but not locations) to Progressive Grocer; this report estimates the sizes of these warehouses fromother information. Retailers below this top group are not nearly so shy about revealing warehouse9
sizes, and nearly all the merchant wholesalers are candid about their buildings. Altogether there were26 U.S. grocery retailers that owned at least 1 million square feet of warehouse space. SouthlandCorporation, operator of the largest U.S. convenience store chain (7-Eleven), owns six warehousesthat span the Continent, but these warehouses supply only HBA items to their stores.
The size of warehouses owned is closely correlated with the number of stores served,especially when the number of stores is converted to a conventional-supermarket-equivalence figure(Appendix Table 1). Some integrated retailers own as little as 1500 square feet of warehouse spacefor each supermarket-equivalent (e.g., American Stores) and some as much as 5000 square feet (FoodLion), but 2000 or 3000 is more typical.
With a couple of exceptions, the top 50 retailers are fully integrated into grocerywholesaling. By “full integration” is meant sole ownership of warehouses for produce, other10
refrigerated foods, and all other groceries except perhaps frozen foods, housewares, HBA items, andcandy-magazine racks.
Retailers with 1990 sales of $400 million but below $1 billion present a more mixed picture(see Retailers No. 53 to 97). Slightly less than half of this middle-sized group are fully integrated,about one-fourth are partially integrated, and the remaining one-third are unintegrated. By “partial”or “tapered” integration is meant ownership of substantial warehouse capacity (at least 100,000 ft. )2
together with purchases of groceries from merchant wholesalers. In fact, only 19 of the 121 largestretailers report partial integration, with this arrangement most common among firms with $600 to$800 million in retail sales and 100 to 200 supermarket-equivalents. Virtually all of the tapered-integration cases involve single GMAs with large dollar sales or geographic spread (NYC, SanFrancisco, El Paso, and Phoenix). Convenience store chains tend to engage in tapered integration.
The largest cases of nonintegrated retailers occur in New York City, a GMA well suppliedwith merchant wholesalers. There are five nonintegrated retailers with sales of $500 to $700 million,but they operate only 16 to 27 stores (or 26 to 79 supermarket-equivalents) and have market sharesof less than 3 percent of the New York GMA. In other cities, the largest nonintegrated retailers havefrom 16 to 44 stores (40 to 80 supermarket equivalents) and less than a 3 percent share. Whenretailers generated less than $400 million in sales or operated fewer than 30 stores (40 supermarket-equivalents), they appeared to be nearly always nonintegrated. A dozen exceptions to this rule arelisted at the bottom of Appendix Table 1. Some of these small integrated retailers may bemisclassified; they may be wholesalers with minor interests in retailing.
11
To summarize, there are three types of vertical integration by grocery retailers. Full backwardintegration into grocery wholesaling is characteristic of nearly all retailers with 1990 retails sales ofat least $1 billion and the preferred option for retailers with at least $500 million in sales and morethan 30 supermarkets. Very few retailers with sales of less than $400 million or fewer than 40supermarkets own or operate significant grocery warehouses (those with 100,000 square feet of spaceor more). Tapered integration is a relatively unusual strategy followed by large convenience-store11
chains and supermarket chains with sales of $400 to $800 million in sales.
Merchant Wholesalers
General-line grocery merchant wholesalers deliver a broad range of grocery products toretailers that are too small to operate profitably their own warehouse. That is, merchants wholesalers’clients are typically small grocery chains that operate less than 30 or 40 supermarkets or nonchaingrocers. When one client becomes so large that it can efficiently become integrated, the loss of thatbusiness can be financially painful. An example of such an event was Albertson’s decision to dropSuper Food Services as its supplier in 1994. Albertson’s operated 75 large supermarkets in theTampa area in 1993 and had been adding about two new stores per year in the early 1990s.Albertson’s purchased and remodeled a large warehouse near Tampa for its own use, thereby causingSuper Food Services to lose one-third of its revenues. Therefore, there are sound business reasonsfor merchant wholesalers to attempt to diversify their client base by acquiring a large number of smalland medium-sized accounts.
Appendix Table 3 contains a reasonably complete list of the 64 largest U.S. merchantwholesalers in 1990-1992. Each firm had annual sales of at least $200 million at wholesale(corresponding to $250 to $500 million in retail grocery sales). Each company operates one or moregrocery warehouses containing at least 300,000 square feet of storage space.
The big four wholesalers operate extensive, multi-regional warehouse networks with totalcapacities of from 6 to 13 million square feet. Super Valu’s warehouses are the largest on average(about 550,000 square feet), and its newest facilities are being built at around 800 to 900,000 squarefeet. Scrivner operates the smallest warehouses (about 300,000 square feet on average), and Flemingis not far behind (about 400,000). Nash Finch operates very small facilities in four regions, but allother merchant wholesalers own and operate five or fewer warehouses that deliver in cohesive areascomprising a few states. Wakefern, for example, operates four New York City warehouses that serveonly New York and three adjacent GMAs. Penn Traffic Co. is pretty much confined to parts of threestates (NY,PA, OH). From its strong base in Los Angeles, Certified Grocers ships only a minorportion of its groceries to parts of the San Francisco GMA. In fact, only ten U.S. wholesalers havesignificant shares (say 2 percent or more) of at least four of the 54 GMAs. All others supply less thanfour GMAs.
Other Wholesalers
There are two curious listings int he SAMI Participant Guides. First, in 23 SMAs anobviously generic category entitled “mass merchandisers” (company no. 0149) is listed. This termnormally refers to discount department stores such as Wal Mart and K Mart, both of which havesignificant food and nonfood grocery sales. Total retail sales of these mass merchandisers was $789
12
million (an average of $34 million per GMA) or approximately 0.2 percent of total U.S. grocery storesales. In the 23 GMAs into which the mass merchandisers’ warehouses shipped, they accrued anaverage market share of 1.2 percent; the range was from 0.1 percent to 4.4 percent. The GMAs withsignificant mass merchandiser presence most highly concentrated in Missouris and all adjacent statesexcept Illinois; specifically, the mass merchandisers’ shares are 2 percent or higher in the St. Louis,Kansas City, Whicita, and Shreveport/Jackson GMAs. Surrounding this core area is a ring with asecondary concentration of mass-merchandiser presence; the ring loops mainly to the southeast andsouthwest of Missouri. There are nine GMAs with 1 to 2 percent market shares for massmerchandisers: Nashville/Knoxville and three GMAs to the south; Omaha/Des Moines, OklahomaCity, and three GMAs in Texas. This geographic pattern is consistent with the retail sales pattern ofWal Mart around 1990.
The second puzzling SAMI listing is a likewise generic entry “General merchandisedistributors” (no. 0129), some with further descriptors such as “eastern division,” “mid-Americandivision,” “southern division,” and “western division.” The 13 GMAs with such a listing had averagesales of $39 million and average market shares of 0.8 percent. These distributors sold only HBAitems. Interviews with former SAMI analysts revealed that SAMI tried to take into account theactivities of “diverters,” wholesalers engaged in long-distance geographic arbitrage. These entriesprobably represent known sales activities of major diverters.
Sales Concentration
The degree of sales concentration in a given grocery marketing area (GMA) is of interestprimarily to two types of businesses - food manufacturers and grocery retailers. IN order to enter anew geographic market, a food processor must approach the buying committee of a grocerywarehouse operation and obtain a favorable decision from the committee in order to have the productadded to the warehouse’s inventory. If the product is adopted by a wholesaler, chances are that12
some or all of the wholesaler’s clients will place the product on their retail shelves. If the product’ssales are satisfactory, other retailers and wholesalers will demand the product as well, thus boostingthe product’s market share in the GMA. But convincing a buying committee is no easy matter unlessthe manufacturer has a sterling track record with new product introductions or is prepared to unleasha significant advertising or promotion campaign. Grocery warehouses can be very large (in excessof one million square feet of floor space), but even the largest carry only a limited number of items.If wholesaler concentration in a GMA is high, a food company’s broker or sales representative hasrelatively few opportunities to make a sale.
Grocery retailers contemplating entry into a given GMA also are concerned about the degreeof wholesaler concentration. Only the largest retailers can afford to build a new grocery warehouseand the 30 or more stores that would be served by the warehouse. Shipping warehoused productsfrom an adjacent GMA where the company already many have a wholesale facility will typically entailtransportation costs or delays that will place the entrant at a cost disadvantage relative to establishedretailers in the target GMA. Thus, a would-be entrant must utilize existing warehouse facilities in thetarget GMA, at least until the retailer has built enough stores to make vertical integration efficient.Existing warehouse facilities operated by merchant wholesalers are the primary choice set becauseintegrated retailers are unlikely to want to assist a new rival in becoming cost competitive in theGMA. Another group of retailers also has an interest in wholesaler concentration: existing retailers
13
too small to vertically integrate into full scale wholesaling operations. Many small grocery chainsown small warehouses (less than 50,000 square feet or so), but these facilities cannot carry the 15,000 or more items stocked in modern supermarkets. Thus, a GMA with only five or six merchantwholesalers from the point of view of nonintegrated retailers.
Because wholesaler concentration affects the entry conditions of food manufacturers andpotential large-scale retailer entrants and affects the bargain position of established retailers, grocerywholesaler concentration is a public policy issue as well. One purpose of the antitrust laws is topreserve a workable level of competition in well delineated markets. Horizontal mergers in thegrocery wholesaling industry were common in the late 1980s and early 1990s, and these mergers mayhave resulted in levels of sales concentration at the appropriate local geographic level that increasedthe potential for unilateral or multilateral market power. The concentration data that follow can shed13
some light on this critical public policy issue.
Warehouse Numbers
Appendix Table 1 lists the number and size of grocery warehouses located within each GMAby type of owner: integrated retailer or merchant wholesaler. The location and size of warehousesrun by specialty wholesalers is generally not known, so in this case the number of specializedwholesalers in the sample that are shipping to the GMA is given; their size is in dollars of retail sales,not square footage. These data on specialized wholesalers are far from complete, whereas data onthe other two types generally comprise a very large share of total sales. The number of specializedwholesalers’ warehouses contains a good deal of double counting, but there is not double countingof the other warehouses. In any case, the number of warehouses shown is at best a minimum: onlythe warehouses of companies with at least 2 percent of sales in each GMA are known to be in thesample; in some cases these companies publically report only their square footage; or they reportoperating several warehouses in one location when the warehouses are in fact housed under one roofor grouped together in one warehouse complex. In short, floor space is a superior indicator ofwarehouse capacity in a GMA.
The United States has at least 40,000 grocery warehouses, but in the SAMI sample, the 54GMAs contain at least 600 general-line grocery warehouses (Appendix Table 1). This total does notcount most of the retailer-owned warehouses that specialize in HBAs or housewares, general-linewarehouses located outside the GMAs (Alaska, Hawaii, Nevada, most of the northern High Plains,central Pennsylvania, and other extra-GMA areas), nor grocery warehouses operated by foodmanufacturers or specialty wholesalers. Despite these omissions, the 600 warehouses handled at least90 percent of the storable grocery products delivered to the 54 GMAs’ grocery stores in 1990-1992,or about 68 percent of total national shipments.
Assuming that the sample covers about 80 percent of capacity, U.S. integrated retailersoperated general-line grocery warehouses with a total of 150 million square feet of storage capacity,and merchant wholesalers about 125 million square feet, for a U.S. total of almost 275 million squarefeet. Across the GMAs, sample general-line warehouse capacity varies from 11 million square feetin New York City to zero in the Quad Cities on the Iowa-Illinois border. That is, the Quad CitiesGMA is supplied almost entirely by facilities located in the surrounding GMAs (Des Moines, Chicago,St. Louis, and Minneapolis), further evidence that this GMA may be poorly defined. The Charleston,
14
WV GMA has only three significant warehouses located within or on the edge of its borders, so itis another dubiously defined GMA. Peoria is a third GMA supplied mainly by imported groceries.
Warehouse space in a GMA is closely related to the sales size of the market, but thecorrelation is not perfect (cf., Table 1 and Appendix Table 1). New York City has $24 billion in retailgrocery sales, of which approximately $19.5 billion comes from stores served by SAMI participants(those located within the GMA and a few located outside). Stores in NYC served by participantsgenerated about $1,400 per year for each square foot of general-line warehouse space; if one discardswarehouses outside the GMA, the sales/ft. rises to $1,930. If, as is likely the case, shipments into2
the GMA are about the same size as exports from warehouses inside the GMA, the latter figure ismore accurate. Retail sales associated with general-line warehouses in Los Angeles amount to$2,400/ft. , but the comparable figure for San Francisco is only $1,500. San Francisco’s warehouses2
export considerable merchandise to Nevada, Northern California, and other areas outside the SAMIGMA. Chicago is even lower at $1,130 per square foot. Denver, a relatively export-oriented GMA,generates $1,500/ft. For import-oriented Charleston, WV the figure is $1,900/ft.2 2
The average amount of retail sales across the United States in 1990 was approximately $1,660per square feet of warehouse space. Variation across markets can be explained by the extent of net14
exports from the GMA and by various efficiency factors (warehouse turnover and utilization, grocerystore density, and transportation network efficiency). In export-oriented GMAs like San Franciscoand Chicago, GMA sales understate the true retail sales of served stores (and vice versa for netimport GMAs like Charleston, WV). Efficiency factors can be revealed by examining store salesacross warehouses within self-contained GMAs or groups of GMAs. A casual examination of sixsuch groupings reveals that leading integrated retailers generally have the highest wholesale efficiency(high sales per square foot). In Los Angeles, for example, Lucky’s and Von’s both generate morethan $3,000 of retail sales per square foot of warehouse space; H.E. Butt leads in San Antonio as doAlbertson’s and Smith’s in Salt Lake City. In most regions, leading voluntary wholesalers attain salesper square feet of $1,200 to $1,500, but in some markets such as San Antonio, the figure drops tothe $800 range. Lower ranking voluntary merchants drop to as low as $300 in sales. Cooperativewholesalers can be quite efficient (Associated in Seattle, Certified in Los Angeles, and Associated inFlorida), but as a group rank third in their markets. The fact that merchant wholesaler generally servea smaller average store mix than leading chains probably explains much of the disparity in salesefficiency.
Company Numbers
One measure of market sales concentration is the number of sellers of a given product orservice. While there are thousands of grocery wholesalers in business in the United States, non carryon their activities in all parts of the United States. According to the SAMI data base, the largestmerchant wholesaler in the United States is Fleming with 1990 wholesale sales of about $12.5 billion.Yet, this grocery wholesaler operates in only 28 of the 54 SAMI GMAs. The second largest, SuperValu ($11 billion sales) covers 25 GMAs, of which only 13 overlap with Fleming. Likewise,American Stores, the nation’s largest grocery retailer ($22 billion in retail sales) has significant salesin only 15 of the 54 SAMI market areas. The second largest retailer, Kroger ($19 billion) hassignificant grocery warehouse shipments to 23 GMAs but meets in only two of them (Peoria and
15
Dallas) with American Stores. These facts reinforce the necessity of examining concentration at thelocal market level.
Table 4 contains 1990 sample data on the number of warehouses and companies operatingwarehouses in each of the 54 SAMI markets. The coverage of the sample is shown in the last columnof the table. On average, sample coverage (measured by the retail grocery sales of the stores servedby the warehouses) is quite high. Of the 54 markets, 27 of them (50 percent) have coverage of atleast 90 percent, and 44 GMAs (81 percent) have at least 80 percent sample coverage. Almost allof the data are derived from confidential SAMI worksheets, but supplementary data onnonparticipants is taken from Progressive Grocer (1991) and adjusted to SAMI market definitions.15
Very few leading merchant wholesalers or integrated retailers are omitted from the sample. Exceptfor the few GMAs with low average, it is highly unlikely that any company with a 2 percent marketshare or more is omitted from the sample. Total U.S. and GMA company sales data were used asa cross-check on the SAMI market sales data.
The total number of grocery warehouses varies considerably across markets. New York has16
by far the largest number of warehouses (42); in 1990, the average sample warehouse shippedgroceries worth $464 million at retail. By contrast, the Greenville/Spartanburg/Ashland market getsby with only six warehouses covering 87 percent of this South Carolina market; the averagewarehouse shipped goods with a $280 million retail sales value. In general, it is the largestmetropolitan areas that have the most grocery warehouses: Boston, Philadelphia, Cleveland,Baltimore/Washington, New Orleans, and San Francisco each have at least 20 large warehouses.However, some very large cities have few grocery depots: Minneapolis has only seven, Miami only11, Denver only 9, and Houston only 13.
Many of the sample warehouses supply products to all five major grocery department: drygroceries (food and nonfood), meat, other refrigerated foods, frozen foods, and health and beautyaids (HBAs). In Boston, for example, eight of the establishments are “full-service” warehouses; acouple sell everything except meat or frozen foods; seven do not sell HBAs, whereas four warehouseshandle HBA products exclusively. There are scattered examples of warehouses that ship only meator only frozen foods, but these are exceptional cases. Almost every GMA contains a few warehousesselling only HBAs, and these HBA warehouses are typically located outside the GMA. That is,because HBA products are relatively expensive compared to shipping costs, HBA suppliers typicallyship greater distances than foods and other groceries. In short it is difficult to generalize about themix of products a given warehouse will stock, but only a minority of them are “full-service” (fivedepartment) types. The most common product mix is dry groceries combined with two or three otherfood departments.
In any case, a retailer trying to locate a supplier of products for only one department (e.g.,just frozen foods) will typically be able to secure supplies from nine or ten warehouses, not from the15 or 20 warehouses of all kinds. Moreover, in most GMAs there are companies that operatemultiple warehouses, so the choices among wholesale companies is more restricted than the numberof warehouses would imply. For example, Grand Union is a retailer that supplies the New YorkGMA with about 5 percent of its retail groceries. However, Grand Union’s stores receive theirproducts from no less than five warehouses scattered around the metropolitan area, each with aunique product mix. This is an extreme but not unusual example that is found in other GMAs and
16
among smaller wholesalers. Market Wholesale Company, with only $350 million in annual sales,ships into the San Francisco GMA from four warehouses in three different cities.
The sixth and seventh columns of Table 4 count the number of sample wholesale companiessupplying a GMA in 1990. The 42 warehouses in New York are owned by just 20 companies, ofwhich seven are integrated retailers and 13 are merchant wholesalers. For most GMAs, the numberof independent merchant wholesalers is in the range of three to six (but some of these sell HBAsexclusively). The huge Los Angeles/San Diego GMA is extreme case because there are only twomerchant wholesale companies of any size: one very small HBA supplier and one cooperative offeringa full spectrum of groceries to about 16 percent of the retail grocery market. The rest of the market(accounting for 70 percent of retail sales) is tied up by integrated retailers. The remaining 14 percentof the Los Angeles market is supplied by non-sample wholesalers too small to be separately identified.
Sales Concentration Ratios
Market shares can be used to identify markets with dominant firms or groups of leading firmsthat are so large that noncompetitive pricing or output conduct can become feasible. Table 5 showsthe market shares of the four leading wholesale grocery operators in the 54 SAMI markets. Inaddition, for all companies in the sample a truncated Hirfindahl-Hirshman Index (HHI) is calculated.17
The number of companies and sample size is shown in Table 4. Because the sample coverage is solarge, omitted companies have small shares unlikely to affect the calculation of the HHI. In the firstfive columns both integrated retailers and merchant wholesalers are mixed together; the last twocolumns take into account concentration among merchant wholesalers only.
The market share of the leading firm tends to cluster around 30 percent in most GMAs.However, in seven GMAs the market share of the leading firm is greater than 40 percent, a level oftenbelieved to offer scope for dominant-firm behavior. The seven GMAs are Portland, Maine(Hannaford Bros.); Grand Rapids (Spartan); Minneapolis (Super Valu); Wichita (Kroger); Houston(Grocer Supply Co.);San Antonio (H.E. Butt); and Denver (Kroger). Five of the seven marketleaders are retailers.
New York, Boston, Cleveland, Dallas, and three adjacent GMAs in the deep south have thesmallest leading-firm shares. Two of the three southern GMAs (Memphis/Little Rock andShreveport/Jackson) are somewhat problematic cases. Other industry sources suggest that the twoshould be combined or that certain borderland cities (Shreveport, Springfield, Missouri) might beplaced elsewhere. Similarly, there is disagreement about whether Mobile, Alabama should be partof the New Orleans GMA or grouped with other Alabama cities. There is not enough informationto settle these and other fine points concerning GMA limits.
In a few markets, there is a pattern of two leading firms with large shares followed by a third-ranking firm with very small shares. Portland (ME), Grand Rapids, Chicago, and Norfolk/Richmondare examples. Where both leaders are rivals, such a structure could encourage duopoly-typebehavior.
The four-firm concentration ratios (CR4s) for these GMAs are mostly quite high. In manyindustrial-products markets, empirical studies often infer that a CR4 of 60 percent or higher offers

17
the leaders considerable opportunity for oligopolistic behavior, while a CR4 of 40 percent or less isof little competitive concern. Of the 54 GMAs, 44 are highly concentrated markets. None of thewholesale grocery markets have low concentration (CR4<40 percent), though New York and thethree deep south markets just discussed come close. Concentration is especially high among theSouth Atlantic states and those west of the Mississippi. These areas are the GMAs that haveexperienced the greatest population growth since the 1940s. and that ten to be surrounded by areas18
of very low population density. Why these characteristics might foster wholesaler concentration issomething of a puzzle.
The sixth column of Table 5 contains the sample firms’ HHI. The HHI and CR4 are highlycorrelated across the 54 GMAs ( r = + 0.89). The critical levels of HHI used for merger enforcementare 1000 and 1800, though these are to some extent arbitrary. Only six GMAs have 1990 HHI levelsbelow 1000; three of these GMAs are the three problematic “Deep South” markets whose bordersmay be drawn too generously. New York again displays low concentration; Cleveland andIndianapolis are borderline cases. Perhaps the most striking fact is that 18 of the 54 GMAs alreadyexceed the dangerous 1800 level, and several others are quite close. Again, most of the SouthAtlantic and far west GMAs are relatively highly concentrated.
The final calculations of CR4 and HHI utilize only merchant wholesalers. Two measures ofsales concentration among merchant wholesalers are presented in Table 5. The CR4 is calculated onthe assumption that all wholesalers not in the sample are merchants and that none of the omitted firmsis in the top four. Because integrated retailers are omitted also, the CR4 for merchants must begreater than or equal to the CR4 for all warehouse operators. In GMAs with few retailers in leadingpositions, the two CR4s will be close (observe Minneapolis, for example), but generally the CR4 formerchants is 5 to 10 percentage points higher.
The HHI for merchant wholesalers utilizes only information in the sample. In 1990, everyGMA had an HHI in excess of 1000. The lowest observed HHI is for New York City. There are 12merchant wholesalers in the sample, the largest being Wakefern with only about 12 percent ofwholesale grocery sales in the GMA. Besides New York, only 12 other GMAs have HHI indexesbelow 1800, the upper threshold level for merger investigations. Several GMAs have very high HHIratios, generally signaling the presence of dominant wholesalers. In Syracuse, a subsidiary of PennTraffic Co. dominates the merchant wholesaler segment with nearly two-thirds of the local market;a Scrivner affiliate languishes in distant second place with one-fifth of the market. But suchdominance is unusual in the Northeast, the Great Lakes States, and much of the South. InMinneapolis, Virginia, the Carolinas, Georgia, Houston and most of the Far West (Mountain andPacific states) local domination of the merchant wholesaler segment is the rule. In Minneapolis,Super Value and Scrivner rule in a virtual duopoly, sharing more than four-fifths of the totalwholesale market. Other examples of GMAs dominated in 1990 by merchant wholesalers include:
� Richfood controlled 63% of Norfolk/Richmond� Harris-Teeter has 87% of merchant sales in Charlotte� Merchants Distributors monopolizes Greenville, SC� Super Valu is the sole major merchant in Atlanta� Super Food Services has over half of Jacksonville� Super Valu controls 70% of Denver’s small merchant segment
18
� The Associated Foods Cooperative Monopolizes Salt Lake City� Fleming is the only significant merchant in Phoenix� Associated Grocers dominates merchants in Seattle� Certified Grocers is nearly the only merchant in Los Angeles
Company Market Shares
The examples just given above reinforce a point made previously: even the largest integratedretailers and merchant wholesalers are unevenly distributed across only portions of the United States.The leading warehouse operators tend to have high market shares in one or a few GMAs, weakerpositions in a few adjacent markets, and vast stretches of the country with no presences. Table 6shows the estimated GMA shares for the ten largest grocery retailers in the United States, measuredin local retail grocery sales. A few GMAs may be omitted where the company operates so few storesthat its share is less than 2 percent (and usually less than 1 percent) of the GMA.
American stores operates markets under many local brand names: Star in Boston, Acme inPhiladelphia, Jewel around Chicago, Alpha Beta in Texas, Buttrey in Spokane, and Lucky Foods inCalifornia. It is the first or second-ranking retailer in each of those metropolitan areas. On average,American Stores has a 10 percent share of the 13 GMAs shown in Table 6. Safeway Stores hashigher average shares in four distinct area: Washington, D.C.; Denver; Phoenix; and all of the Westcoast markets except Los Angeles. Kroger is by far the most geographically diverse grocery retailsin the United States, with significant recorded shares in 23 GMAs. Kroger operates in a huge bandacross middle America from an eastern border that runs from Pittsburgh to Savannah to a westwardpoint in Colorado; except for Houston, Kroger has no presence in the Southwest or Pacific states.The geographic spread of A & P is far more spotty; it owns leading supermarket chains in Detroit andMilwaukee, but operates mixtures of supermarkets and small box stores in 11 other disconnectedGMAs. Winn-Dixie operates in 15 GMAs from central Virginia down to Miami and around the GulfCoast states as far west as Dallas. Food Lion overlaps Winn Dixie in seven GMAs in the SouthAtlantic region.
All the remaining integrated chains operate in Cohesive, more restricted regions. Albertson’sis located in two Texas cities and in all nine GMAs in the far West. Supermarkets General sells infive Northeastern GMAs; Publix is restricted to Florida; and Von’s is found only in the Los Angelesarea. Thus, only six or seven U.S. grocery chains operate outside more than one of the eight regionsshown in Table 6. In fact, four of the GMAs are bereft of stores of any of the top ten chains.
The extent to which the leading chains have intra-market contracts is surprisingly low (Table7). Kroger and Safeway meet in only one GMA (Denver, where they share 70 percent of the market).Moreover, Kroger has only one minor contact point with American Stores in the Peoria GMA. EvenA & P has surprisingly little market overlap with the big three firms, and such contacts that existmostly involve A & P’s box-stores, which may not directly compete with the other firms’supermarkets. Winn-Dixie does have a large number of contact points with both Kroger (eightoverlaps) and Food Lion (sever), of which three are common to all three chains. Avoidance ofcontact points is a strategic option of diversified firms that is called forbearance (Mueller, Scott).
19
Market shares of ten large merchant grocery wholesalers are shown in Table 8. One or moreof the top four merchants operate in all but four of the 54 GMAs in the sample; two or more arefound in 31 of the 54 GMAs; and three or more overlap in nine of the 54 markets. The largestmerchant (Fleming) ships groceries in or to 30 GMAs, slightly more than half of the sample. The sixwholesalers below the big four operate in an average of only five GMAs. All of the wholesalersbelow the top four have contiguous territories; indeed, the ninth largest (Certified Grocers) operatesin only one state (California). The top four merchant wholesalers tolerate gaps int heir territories.For example, Wetterau serves Massachusetts, northern New England, and Pennsylvania but has nosignificant business in New York State. Of the top four, Super Valu appears to have the strongestlocal market positions with an average of 13 percent of the 25 GMAs in which it operates. Scrivner,Penn Traffic, Roundy’s, and Nosh-Finch control only 6 to 8 percent of their average GMA.
Table 9 calculates contact points for the top ten wholesalers. Unlike the integrated retailersin Table 7, the major wholesalers show little evidence of avoiding each others’ territories. Fleming,Super Valu, and Scrivner each overlap one of the others in a high proportion of the markets; tripleoverlaps are quite uncommon, but pairs are not. Penn Traffic, Roundy’s, and Nosh-Finch also tendto meet one of the big three quite frequently.
Merger Analysis
Current federal horizontal merger-enforcement guidelines promise an investigation andpossible legal action if the level and increase in sales concentration in an appropriately defined marketare above certain limits (Department of Justice). In brief, if a market’s Hèrfindahl-Hirshman Index(HHI) of concentration reaches levels above 1800 after a merger and the increase in HHI is 100 ormore points, then the merging firms are told to expect a court challenge by the Department of Justiceor the Federal Trade Commission. However, if the post-merger HHI reaches 1000 to 1800 pointsor if the change in the HHI is between 50 and 100 points, then a more complex set of considerationscomes into play. Further analysis of entry conditions, probable financial failure of one of the mergerpartners, and likely efficiencies resulting from the merger must enter the mix of criteria to be appliedin the decision to challenge a specific merger. In the case of many mergers, the antitrust agenciesapply the dubious “5 percent” rule. Economic models are used to predict the price effects of themerger. If post-merger prices are predicted to rise by 5 percent or more, then the merging firms mustdivest themselves of assets in the affected market areas.
Mergers 1992-1996
On October 29, 1992, Wetterau, Inc. became a wholly owned subsidiary of Super ValuStores, Inc., and the new entity was renamed SUPERVALU, Inc. At the time the merger was19
proposed, Super Valu and Wetterau were the second-largest and fourth-largest grocery merchantwholesalers in the United States. IN 1992, the new combined firm, SUPERVALUE, becameapproximately equal in sales size to Fleming Companies, the largest U.S. grocery wholesaler. Bothleaders are more than twice the size of the third-ranking firm, Scrivner. This section examines thechanges in GMA concentration that resulted from the merger.
Trade sources speculate that the 1992 Super Valu-Wetterau merger was the spark thatkindled numerous similar flares-up in the industry, including several merger negotiations and
20
proposals that were not consummated. That is, several wholesalers and integrated retailers mergedor attempted to merge as defensive moves in response to Super Valu’s aggressive expansions,including another large acquisition in 1994 of Sweet Life Foods. Sweet Life, a voluntary merchantwholesaler headquartered in Windsor Locks, Connecticut, had 1990-192 sales of $1 billion spreadover three Northeastern GMAs (Albany, Hartford, and Boston). With an average market share of9 percent and warehouse capacity of 1.36 million square feet, Sweet Life was probably the leadingmerchant wholesaler in the three markets at the time (C&S was about equal in 1990 but probablysurpassed Sweet Life by 1994). SUPERVALU closed one of Sweet Life’s warehouses inMassachusetts, laying off 450 workers. This acquisition allowed Super Valu to expand quickly tothe Northeast; except for Pittsburgh, Super Valu had previously had no presence in this region. In1996, Super Valu also expanded into southern California for the first time when it purchases theoperations of the Sav-U-Foods chain.
In 1994, six more large mergers took place. The largest was Fleming’s acquisition of Scrivnerfrom its German owner Franz Haniel & Cie. at a cost of $1.09 billion. Fleming was the number-onemerchant wholesaler at the time and Scrivner was number three. Both had their headquarters inOklahoma City. The immediate effect was to increase Fleming’s sales by nearly 50 percent overnight.The two companies overlapped in no less than ten GMAs (see Table 8). Barring unannounceddivestitures, the new Fleming company in 1994 operated in at least 39 of the 54 SAMI markets,coming closer to becoming the first national grocery wholesaler than any other company in history;its average market share in the 39 markets jumped to an impressive 17 percentage points. However,in late 1994 at least three warehouses were closed by Fleming in Alabama, Texas and Minnesota. Amerger of this size often proves difficult to digest. By 1996, the trade press was reporting thatFleming was experiencing a number of difficulties: declining sales, low profits, and numerous retailersuits against it.
Another large merger occurred in mid 1994 when Richfood of Mechanicsville, Virginiabought Rotelle, a Philadelphia frozen-foods wholesaler. Richfood is the dominant general-linewholesaler in Virginia, with at least 30 percent of the Norfolk/Richmond GMA. Richfood’swholesale sales increased from $1.3 billion to $1.7 billion as a result of the merger; moreover,Richfood now operating in four GMAs, rather than just two. In late 1995, Richfood made anotherlarge acquisition when it paid $320 million to purchase Super Rite Foods, a large voluntarywholesaler in Harrisburg, Pennsylvania, with wholesale-retail sales of about $1.0 billion. As a resultof both mergers, Richfood became the fourth largest merchant wholesaler in the United States andthe leading wholesaler in the Atlantic Seaboard with sales approaching $3 billion. However, thesemergers also proved difficult for Richfood to absorb, causing earnings to fall in 1996.
Merger talks were held between Affiliated Foods Cooperative of Norfolk, Nebraska andUnited A-G Cooperative in Nebraska in 1994, but no agreement was reached. The two cooperativeshad about $750 million in combined sales. Also in 1994, abortive merger discussions were heldbetween Roundy’s (Wisconsin) and Spartan Stores, Inc. of Grand Rapids, Michigan. Combined saleswere almost $5 billion at the time and highly concentrated in Wisconsin and Michigan.
Some important mergers took place among integrated retailers in the early 1990s. Ralph’sthe third largest Los Angeles retailer, was permitted to merge in 1994 with another large Californiaretailer, Food 4 Less, the fourth largest retailer in Los Angeles. Combined retail sales in 1994 were
21
about $5 billion, placing the company right behind number-one Von’s in the L.A. market (marketshares were about 22 to 24 percent, respectively. Yucaipa Companies, the parent of both Ralph’sand Food 4 Less, then acquired the Dominick’s chain in 1995, which gave Yucaipa about 20 percentof the Chicago market. Yucaipa’s $7 billion in sales made it the nation’s 8 or 9 largest groceryth th
retailer in 1995. Ahold, owner of several large grocery chains, mor than doubled its market share inthe New York City GMA by buying Mayfair Supermarkets for $180 million in 1995. In the sameyear, another foreign company, Loblaw’s of Canada, withdrew from U.S. grocery retailing by sellingits National Tea subsidiary to Schnucks for $215 million. Schnucks’ purchase of 85 stores in theMidwest pushed its already leading market position in St. Louis (30 percent of the GMA) to adominant one (about a 40 percent share). Schnucks also gained a substantial foothold in the Chicagomarket but, strangely, was required to divest 28 National Tea stores in the New Orleans area (whereSchnucks had no presence) to Schwegmann’s (a long established New Orleans retailer). Anotherhorizontal merger occurred in 1995 when Harvest Foods purchased Rand’s. Both of these companiesoperated large general-line grocery warehouses in Little Rock, Arkansas.
In 1996, a major horizontal merger between integrated retailers joined Stop & Shop withPurity Supreme. These companies were first and third, respectively, in the Boston/Providence GMAand now control about one-third of this large market and one-third of this large market and one-thirdof the Hartford GMA as well. Prior to the merger Stop & Shop owned four grocery warehouses(1.03 million square feet) and Purity two (0.58 million square feet).
Finally, in November 1996, a large-scale merger took place between two merchantwholesalers. Nash Finch, the eighth largest U.S. wholesaler, acquired Super Food Services, Inc. forabout $500 million in debt. Super Food Services generated nearly $2 billion in wholesale grocerysales in the two Florida GMAs from its large Orlando warehouses. Nash Finch has about $2.5 billionin national sales, but its territory extended to the southeast only as far as Georgia and the Carolinas.Super Foods may have been under financial stress because of the loss of one-third of its Floridabusiness when it lost its Albertson’s account in Florida around 1994; Albertson’s purchased andremodeled an 820,000 square foot warehouse in Plant City, Florida to serve its growing retailbusiness in the Tampa area.
Effects of Super Valu-Wetterau
Table 8 shows the percentage market shares of Super Value, Wetterau, and eight othermerchant wholesalers in 1990. The two companies were active in 33 of the 54 GMAs, but theyoverlapped in only six of these 33 markets. That is, in 28 of the 33 markets, there was no knownchange in sales concentration among actual rivals in the market (Table 10). It is still possible thatSuper Valu was one of the leading potential entrants in one or more of the markets where Wetterauwas the sole active seller (and vice versa for a Wetterau entry). Identifying the most likely potentialentrants is no simple task. Information on unutilized capacity in adjacent markets and internalmarket-expansion plans may be necessary to make a confident identification of potential entrant.However, even a casual examination of the geographic patterns of the two businesses showsconsiderable potential entry in several Midwestern markets. Super Valu’s large warehouses in Xenia,Ohio and Fort Wayne, Indiana could have become a springboard for expansion into Wetterau’s twoMichigan markets; indeed, SUPERVALU added 20,000 square feet of warehouse space in FortWayne in 1993. Conversely, Wetterau’s huge Pittsburgh warehouse or smaller West Virginia facility
22
could have invaded the Ohio markets served by Super Valu. Likewise, Wetterau was well placed toexpand from its powerful Louisville base into parts of Super Valu’s Tennessee territory, and it couldhave pushed a bit north from its St. Louis warehouses into Super Valu’s Iowa markets (it was alreadyserving central Illinois from there). In sum, Wetterau and Super Valu bordered each other along acurve almost 1,000 miles long, but this frontier was treated as more of a Maginot line than a placefor skirmishing.
In six GMAs, both companies had significant sales prior to the merger and, hence,concentration markets, sales concentration among the merchant wholesalers was well over the 1800mark after the merger (indeed, it was above 1800 before the merger in all GMAs save Indianapolis.The HHI increases averaged nearly 1300 points, again well above the 100-point threshold. In all sixoverlap markets one of the two merged companies was already the largest merchant wholesaler priorto the merger, so the merger merely solidified an already solid position. After the merger, the new,larger SUPERVALU company was the first or second leading wholesaler in no less than 23 of the33 GMAs where it operated in 1992-1993.
It is difficult to imagine what rationalizations were proffered by the companies in defense oftheir merger. Even if the wholesalers claimed that they would be in direct competition with integratedretailers, in at least four of the six overlap markets the post-merger HHIs and changes in HHI metthe government’s own merger criteria (Indianapolis and Charleston, WV may not have qualified).One can only imagine that the GMAs adopted for analysis must have been much larger than thoseused by the industry itself (thereby lowering the implied market shares of Super Valu and Wetterau)or that antitrust officials believe that only two or three sellers are sufficient to ensure activecompetition.
Insight into current merger enforcement standards for distributers is provided by the FTC’sresponse to the proposed 1997 acquisition of Office Depot by Staples. These companies togetheraccount for approximately 80 percent of U.S. sales of office supplies and equipment sold through“office superstores” (Wilke and Pereira). The FTC voted to block the merger in March, 1997, eventhough superstores accounted for only about 7 percent of the 1996 retail office-supplies market. Keyelements in FTC thinking were that the superstore segment is sufficiently distinguished from otheroffice-supplies retailers that it forms a separate retail market; that while entry is easy in retailinggenerally, entry is difficult in the superstore segment; that the superstore segment had already seenthe number of chains decline by more than 85 percent since 1988; and that claimed cost savings fromthe merger were outweighed by price increases of about 5 to 15 percent in metropolitan areas whereonly one of the two companies are present (as compared to the case when both are in active rivalry).In addition, the FTC was concerned because the acquired company (Office Depot) was the priceleader in this market and because some planned expansions by both of the merged companies wouldbe cancelled as a result of the merger. Ironically, at one point in the negotiations, the FTC offeredto permit the merger if the two leaders sold only 62 stores (4 percent of the two companies’ sales)to the remaining third office superstore company, Office Max. Had this sale gone forward, the officesuperstore segment would have been left with two companies, one with 1100 stores and $10 billionin sales, the other with 600 stores and $3 billion in sales.
It is likely that the Super Valu-Wetterau merger was permitted because the antitrust agency’seconomic models did not show price increases of more than 5 percent in the six overlap GMAs.
23
However, it is poor logic to apply this 5 percent rule outside retail markets. The 5 percent rule isarbitrary, but it may be justified as a threshold price change that final consumers may notice. In thegrocery retailing industry, gross margins are about 20 percent and profits about 1 percent of sales.If a wholesaler were to raise its prices by 5 percent, their customers would incur losses of 4 percentof sales ceteris paribus. Even a 0.5 percent increase in wholesale prices would cut retailer prices inhalf. The “5-percent rule” is too crude in the first place, but is it clearly inappropriate in grocerywholesaler mergers.
Conclusions
This study describes and analyzes a sample of more than 600 large grocery warehousesowned by integrated retailers and merchant wholesalers. The sample covers 90 percent of sales togrocery retailers in 54 wholesale grocery market areas (GMAs) defined by the Selling-AreasMarketing, Inc. (SAMI) company. Confidential SAMI documents permit the calculation of the mostcomprehensive and precise list of estimates of concentration among grocery wholesalers in the early1990s. The geographic boundaries of the 54 GMAs are found to be nearly all well defined and largelyconsistent with the definitions used by A.C. Nielsen and Progressive Grocer. Both SAMI and Nielsentend to define GMAs that minimize leakages from warehouses inside the GMA boundaries as wellas shipments into the GMAs from wholesale establishments outside. Areas that minimize trade acrossboundaries comport with empirical economic concepts of well-defined markets. All three companiesagree that the United States has between 50 and 60 GMAs, though among some of the smaller GMAsthere is not complete agreement on the inclusion or exclusion of certain metropolitan areas.
The mix of types of warehouse operators varies enormously across GMAs. Voluntarywholesalers dominate many GMAs in the Midwest, Texas, and Oklahoma. Cooperative wholesalersnever have dominant shares in their GMAs, and very few GMAs are served by more than one sizablevoluntary wholesaler. Voluntaries are most prominent in Wisconsin, Kansas, Nebraska, Missouri,and around Memphis. Integrated retailers dominate wholesale activity in Denver, Chicago, Michigan,and most Atlantic coastal GMAs. Virtually all of the 50 largest grocery chains are fully integratedinto general-line grocery wholesaling; these retailers had 1990 sales of $1 billion or more. Fullintegration is also common among retailers in the $500 to $900 million sales range, but a slightmajority of this size class engaged in partial or tapered integration. Warehouse integration was rareamong grocery retailers with fewer than 40 supermarkets generating less than $500 million in salesor those with less than 3 percent of GMA sales. Thus, these figures represent the thresholds forsupermarket operators to consider backward vertical integration; for convenience store chains thethresholds are somewhat lower.
Warehouse sales efficiency varies considerably across GMAs and across types of warehouseoperators. The United States has almost 275 million square feet of general-line grocery warehousespace, of which at least 80 percent is accounted for in our sample of 600 warehouses. The averagelarge U.S. warehouse generated $1,660 of retail grocery sales annually per square foot, but theaverage ranged from $1,100 to $2,500 across GMAs. Integrated retailers generally achieve thehighest sales productivity within given GMAs (as high as $3,000) and cooperative wholesalers thesmallest (as low as $300). Average store size served appears to explain most of thesedifferences.turkey
24
Grocery wholesaling is mostly highly concentrated within U.S. GMAs. Of the 54 markets inthe sample, 44 are highly concentrated (CR4 > 60 percent) and none are unconcentrated (CR4 < 40percent). The Hirschman-Herfindahl Index also indicates that 48 have concentration levels highenough to warrant an investigation by federal antitrust agencies should a significant horizontal mergertake place (HHI > 1000).
The concentration figures just mentioned assume that all warehouse operators are sellers inthe relevant market. However, a case can be made that integrated retailers only rarely would consideroffering wholesaling services to a rival retail organization in the same GMA. That is, from the pointof view of a newly entering grocery retailer, especially one not spreading out from an adjacent GMA,linking up with an existing merchant wholesaler may be the only feasible option. If this is so, thenconcentration ratios calculated only among merchant wholesalers is a meaningful exercise. Exceptfor New Orleans, the CR4 for merchants is in the highly concentrated range (CR4 > 60 percent). AllGMAs have a merchant HHI above 1,000, and 42 of the 54 GMAs have HHI values greater than1,800. In almost one-third of the GMAs, one merchant wholesaler dominates all other merchants.
In October 1992, the second-largest and fourth-largest U.S. merchant grocery wholesalersmerged without opposition from federal antitrust authorities. After the Super Valu-Wetterau merger,many other such mergers were attempted or consummated. An analysis of the 1992 merger finds thatsales concentration increased significantly (1,300 HHI points on average) in six GMAs, and in fourof six GMAs the HHI was above 1,800 prior to the merger. These six cases clearly violated the 1992federal merger enforcement guidelines, yet the merger was not opposed. This episode and othersubsequent mergers demonstrate that federal antitrust policy is willing to permit the creation ofduopolies in any local distribution market where the effect of the merger is predicted to raise pricesby less than 5 percent. Applying such an arbitrary rule in a very low-margin industry such as grocerywholesaling is dubious indeed. With average profit rates of about 1 percent on sales, a 5 percentprice increase would amount to a 500 percent increase in profits, ceteris paribus. In the equally low-margin grocery retailing industry, even a 0.5 percent increase in wholesale prices would be noticedimmediately, never mind a 5 percent increase.
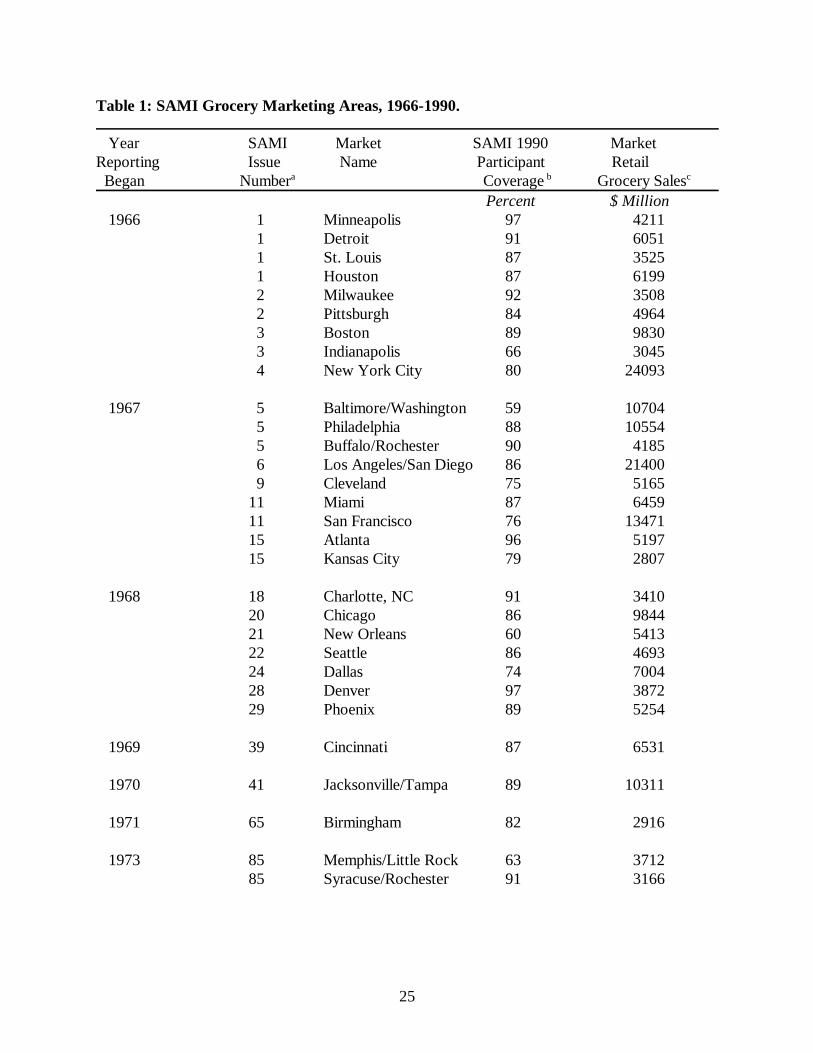
25
Table 1: SAMI Grocery Marketing Areas, 1966-1990. Year SAMI Market SAMI 1990 MarketReporting Issue Name Participant Retail Began Number Coverage Grocery Salesa b c
Percent $ Million1966 1 Minneapolis 97 4211
1 Detroit 91 60511 St. Louis 87 35251 Houston 87 61992 Milwaukee 92 35082 Pittsburgh 84 49643 Boston 89 98303 Indianapolis 66 30454 New York City 80 24093
1967 5 Baltimore/Washington 59 107045 Philadelphia 88 105545 Buffalo/Rochester 90 41856 Los Angeles/San Diego 86 214009 Cleveland 75 5165
11 Miami 87 645911 San Francisco 76 1347115 Atlanta 96 519715 Kansas City 79 2807
1968 18 Charlotte, NC 91 341020 Chicago 86 984421 New Orleans 60 541322 Seattle 86 469324 Dallas 74 700428 Denver 97 387229 Phoenix 89 5254
1969 39 Cincinnati 87 6531
1970 41 Jacksonville/Tampa 89 10311
1971 65 Birmingham 82 2916
1973 85 Memphis/Little Rock 63 371285 Syracuse/Rochester 91 3166

26
Table 1: (Continued)
1974 101 Portland, OR 88 3409101 Omaha 86 3068101 Oklahoma City/Tulsa 85 3857
1976 123 Norfolk/Richmond 85 4116123 Nashville/Knoxville 96 3765123 San Antonio 73 5580
1977 141 Salt Lake City 81 2685141 Raleigh/Winston/
Greensboro 86 3833143 Albany/Schenectady/
Troy 72 3047
1981 190 Charleston, SC/Savannah 83 1516
190 El Paso/Albuquerque/Lubbock 81 3723
190 Grand Rapids/Kalamazoo 75 2501
1982 203 Hartford/Springfield 94 3889203 Louisville/Lexington 79 2504203 Spokane 91 1812
1983 214 Wichita 80 1223214 Charleston/Huntington WV 80 1908214 Quad Cities 85 1418
1984 229 Scranton 83 1340229 Greenville/Spartanburg 87 1934229 Peoria/Springfield 85 1738
1985 240 Portland, ME 89 2541240 Green Bay 91 1747240 Shreveport/Jackson 61 3215
Source: SAMI Participant Information Guides.An “issue” covers exactly 28 days (roughly a lunar month) and 13 issues comprised almost one (solar) year. The firsta
SAMI issue covered the four weeks ending October 7, 1966 and the last issue (No. 315) ended November 2, 1990.From SAMI estimates of their coverage of the four major departments of grocery stores for issueb
310. The midpoint of the SAMI range was weighted by U.S. retail sales in each of the four departments.
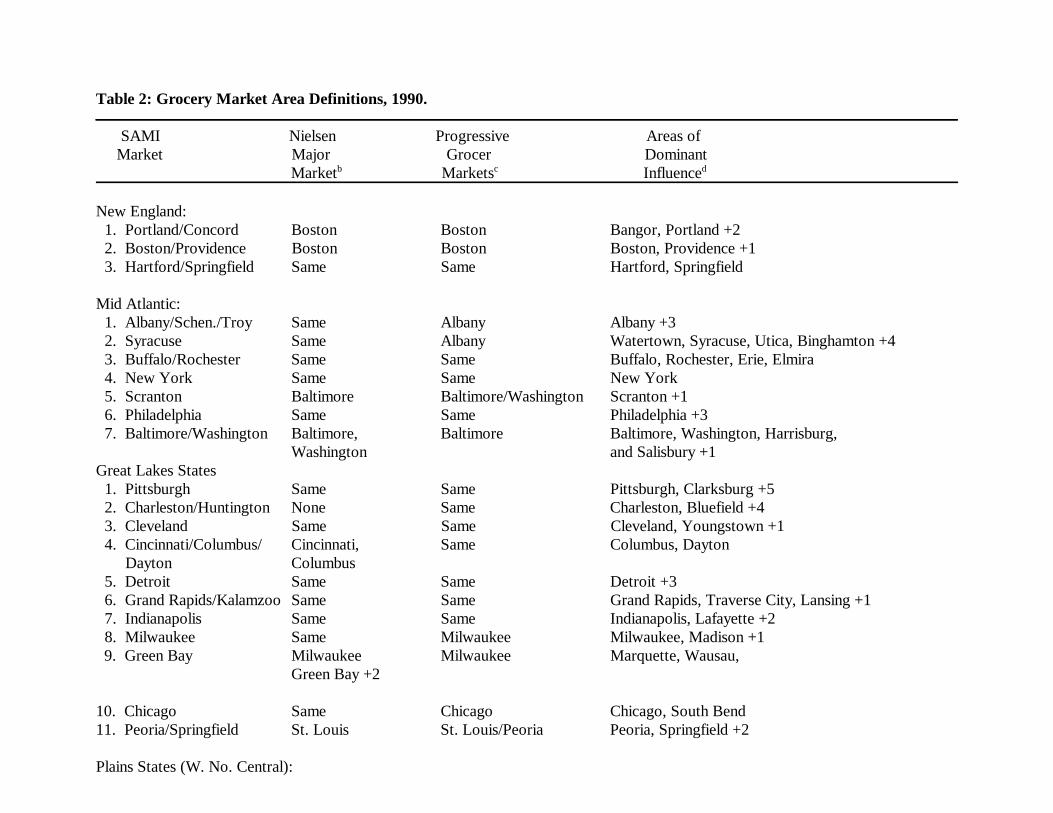
Table 2: Grocery Market Area Definitions, 1990.
SAMI Nielsen Progressive Areas of Market Major Grocer Dominant Market Markets Influenceb c d
New England:1. Portland/Concord Boston Boston Bangor, Portland +22. Boston/Providence Boston Boston Boston, Providence +13. Hartford/Springfield Same Same Hartford, Springfield
Mid Atlantic:1. Albany/Schen./Troy Same Albany Albany +32. Syracuse Same Albany Watertown, Syracuse, Utica, Binghamton +43. Buffalo/Rochester Same Same Buffalo, Rochester, Erie, Elmira4. New York Same Same New York5. Scranton Baltimore Baltimore/Washington Scranton +16. Philadelphia Same Same Philadelphia +37. Baltimore/Washington Baltimore, Baltimore Baltimore, Washington, Harrisburg,
Washington and Salisbury +1Great Lakes States1. Pittsburgh Same Same Pittsburgh, Clarksburg +52. Charleston/Huntington None Same Charleston, Bluefield +43. Cleveland Same Same Cleveland, Youngstown +14. Cincinnati/Columbus/ Cincinnati, Same Columbus, Dayton Dayton Columbus5. Detroit Same Same Detroit +36. Grand Rapids/Kalamzoo Same Same Grand Rapids, Traverse City, Lansing +17. Indianapolis Same Same Indianapolis, Lafayette +28. Milwaukee Same Milwaukee Milwaukee, Madison +1
9. Green Bay Milwaukee Milwaukee Marquette, Wausau, Green Bay +2
10. Chicago Same Chicago Chicago, South Bend11. Peoria/Springfield St. Louis St. Louis/Peoria Peoria, Springfield +2
Plains States (W. No. Central):

Table 3: U.S. Grocery Wholesalers Ownership Types, by Market Area, 1990
1. Minneapolis/St. Paul Same Same Minneapolis, Mankato +12. Quad Cities Omaha/Des Moines Chicago/Quad Cities, Quad Cities, Ottumuwa,
Des Moines Cedar Rapids +33. Omaha/Des Moines Omaha, Des Moines Omaha, Des Moines Omaha, Des Moines +24. St. Louis Same St. Louis/Peoria St. Louis +45. Kansas City Same Same Kansas City, St. Joseph,
Topeka +26. Wichita None Same Wichita +2
South Atlantic States:1. Norfolk/Richmond Same Same Charlottesville, Richmond,
North Hampton, Norfolk +22. Raleigh/Greensboro Raleigh-Durham Charlotte Raleigh, Greensboro +33. Charlotte, NC Same Charlotte Charlotte +3
4. Charleston/Savannah None Columbia, SC Charleston, Savannah5. Greenville/Columbia None Columbia, SC Greenville-Spartanburg-Asheville +16. Atlanta (not So. GA) Same Same Atlanta +57. Jacksonville/Orlando Jacksonville, Jacksonville/ Jacksonville, Gainesville, Tampa (not Tallahassee) Orlando, Tallahassee, Orlando, Tampa +4
Tampa Tampa8. Miami Same Same West Palm Beach, Ft. Myers,
MiamiOther Southern States:1. Louisville/Lexington Same Same Louisville, Lexington +42. Nashville/Knoxville Same Same Nashville, Knoxville,
Bowling Green +63. Birmingham/ Same Same Birmingham, Huntsville, Montgomery Tuscaloosa, Montgomery +1
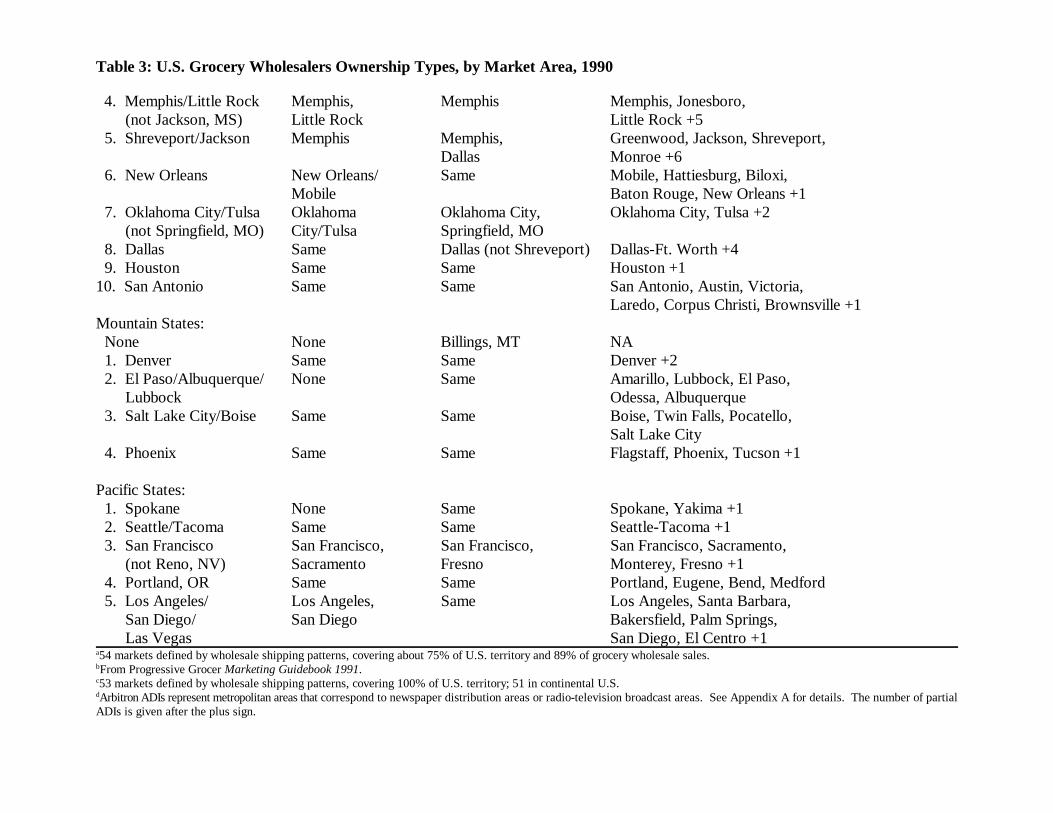
Table 3: U.S. Grocery Wholesalers Ownership Types, by Market Area, 1990
4. Memphis/Little Rock Memphis, Memphis Memphis, Jonesboro, (not Jackson, MS) Little Rock Little Rock +55. Shreveport/Jackson Memphis Memphis, Greenwood, Jackson, Shreveport,
Dallas Monroe +66. New Orleans New Orleans/ Same Mobile, Hattiesburg, Biloxi,
Mobile Baton Rouge, New Orleans +17. Oklahoma City/Tulsa Oklahoma Oklahoma City, Oklahoma City, Tulsa +2 (not Springfield, MO) City/Tulsa Springfield, MO8. Dallas Same Dallas (not Shreveport) Dallas-Ft. Worth +49. Houston Same Same Houston +1
10. San Antonio Same Same San Antonio, Austin, Victoria,Laredo, Corpus Christi, Brownsville +1
Mountain States:None None Billings, MT NA1. Denver Same Same Denver +22. El Paso/Albuquerque/ None Same Amarillo, Lubbock, El Paso, Lubbock Odessa, Albuquerque3. Salt Lake City/Boise Same Same Boise, Twin Falls, Pocatello,
Salt Lake City4. Phoenix Same Same Flagstaff, Phoenix, Tucson +1
Pacific States:1. Spokane None Same Spokane, Yakima +12. Seattle/Tacoma Same Same Seattle-Tacoma +13. San Francisco San Francisco, San Francisco, San Francisco, Sacramento, (not Reno, NV) Sacramento Fresno Monterey, Fresno +14. Portland, OR Same Same Portland, Eugene, Bend, Medford5. Los Angeles/ Los Angeles, Same Los Angeles, Santa Barbara, San Diego/ San Diego Bakersfield, Palm Springs, Las Vegas San Diego, El Centro +1
54 markets defined by wholesale shipping patterns, covering about 75% of U.S. territory and 89% of grocery wholesale sales. a
From Progressive Grocer Marketing Guidebook 1991.b
53 markets defined by wholesale shipping patterns, covering 100% of U.S. territory; 51 in continental U.S.c
Arbitron ADIs represent metropolitan areas that correspond to newspaper distribution areas or radio-television broadcast areas. See Appendix A for details. The number of partiald
ADIs is given after the plus sign.
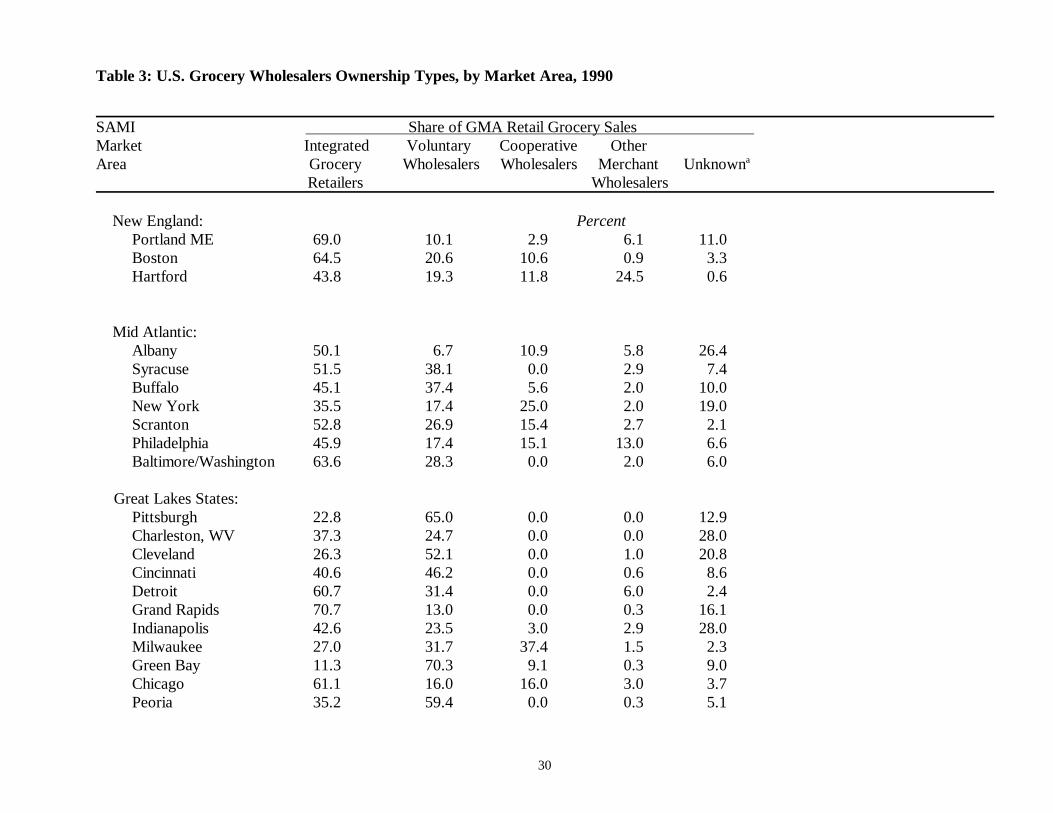
Table 3: U.S. Grocery Wholesalers Ownership Types, by Market Area, 1990
30
SAMI Share of GMA Retail Grocery Sales Market Integrated Voluntary Cooperative OtherArea Grocery Wholesalers Wholesalers Merchant Unknowna
Retailers Wholesalers
New England: Percent Portland ME 69.0 10.1 2.9 6.1 11.0Boston 64.5 20.6 10.6 0.9 3.3Hartford 43.8 19.3 11.8 24.5 0.6
Mid Atlantic:Albany 50.1 6.7 10.9 5.8 26.4Syracuse 51.5 38.1 0.0 2.9 7.4Buffalo 45.1 37.4 5.6 2.0 10.0New York 35.5 17.4 25.0 2.0 19.0Scranton 52.8 26.9 15.4 2.7 2.1Philadelphia 45.9 17.4 15.1 13.0 6.6Baltimore/Washington 63.6 28.3 0.0 2.0 6.0
Great Lakes States:Pittsburgh 22.8 65.0 0.0 0.0 12.9Charleston, WV 37.3 24.7 0.0 0.0 28.0Cleveland 26.3 52.1 0.0 1.0 20.8Cincinnati 40.6 46.2 0.0 0.6 8.6Detroit 60.7 31.4 0.0 6.0 2.4Grand Rapids 70.7 13.0 0.0 0.3 16.1Indianapolis 42.6 23.5 3.0 2.9 28.0Milwaukee 27.0 31.7 37.4 1.5 2.3Green Bay 11.3 70.3 9.1 0.3 9.0Chicago 61.1 16.0 16.0 3.0 3.7Peoria 35.2 59.4 0.0 0.3 5.1
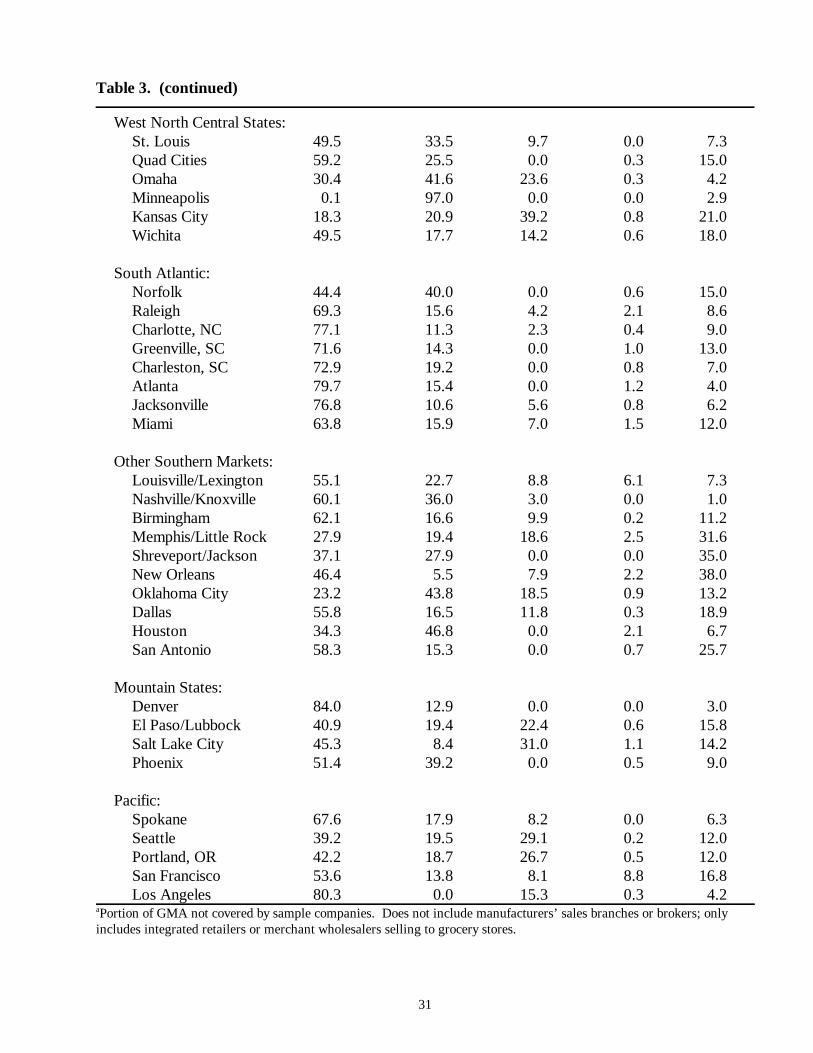
Table 3. (continued)
31
West North Central States:St. Louis 49.5 33.5 9.7 0.0 7.3Quad Cities 59.2 25.5 0.0 0.3 15.0Omaha 30.4 41.6 23.6 0.3 4.2Minneapolis 0.1 97.0 0.0 0.0 2.9Kansas City 18.3 20.9 39.2 0.8 21.0Wichita 49.5 17.7 14.2 0.6 18.0
South Atlantic:Norfolk 44.4 40.0 0.0 0.6 15.0Raleigh 69.3 15.6 4.2 2.1 8.6Charlotte, NC 77.1 11.3 2.3 0.4 9.0Greenville, SC 71.6 14.3 0.0 1.0 13.0Charleston, SC 72.9 19.2 0.0 0.8 7.0Atlanta 79.7 15.4 0.0 1.2 4.0Jacksonville 76.8 10.6 5.6 0.8 6.2Miami 63.8 15.9 7.0 1.5 12.0
Other Southern Markets:Louisville/Lexington 55.1 22.7 8.8 6.1 7.3Nashville/Knoxville 60.1 36.0 3.0 0.0 1.0Birmingham 62.1 16.6 9.9 0.2 11.2Memphis/Little Rock 27.9 19.4 18.6 2.5 31.6Shreveport/Jackson 37.1 27.9 0.0 0.0 35.0New Orleans 46.4 5.5 7.9 2.2 38.0Oklahoma City 23.2 43.8 18.5 0.9 13.2Dallas 55.8 16.5 11.8 0.3 18.9Houston 34.3 46.8 0.0 2.1 6.7San Antonio 58.3 15.3 0.0 0.7 25.7
Mountain States:Denver 84.0 12.9 0.0 0.0 3.0El Paso/Lubbock 40.9 19.4 22.4 0.6 15.8Salt Lake City 45.3 8.4 31.0 1.1 14.2Phoenix 51.4 39.2 0.0 0.5 9.0
Pacific:Spokane 67.6 17.9 8.2 0.0 6.3Seattle 39.2 19.5 29.1 0.2 12.0Portland, OR 42.2 18.7 26.7 0.5 12.0San Francisco 53.6 13.8 8.1 8.8 16.8Los Angeles 80.3 0.0 15.3 0.3 4.2
Portion of GMA not covered by sample companies. Does not include manufacturers’ sales branches or brokers; onlya
includes integrated retailers or merchant wholesalers selling to grocery stores.
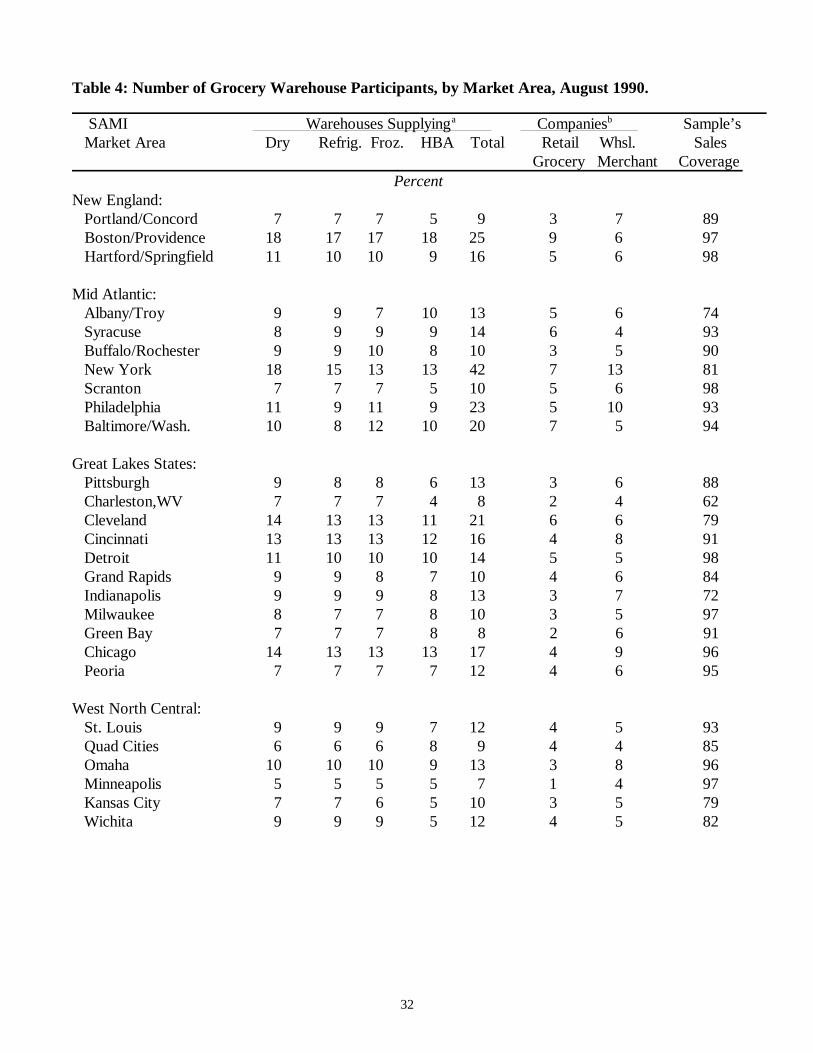
Table 4: Number of Grocery Warehouse Participants, by Market Area, August 1990.
32
SAMI Warehouses Supplying Companies Sample’s a b
Market Area Dry Refrig. Froz. HBA Total Retail Whsl. Sales Grocery Merchant Coverage PercentNew England:
Portland/Concord 7 7 7 5 9 3 7 89 Boston/Providence 18 17 17 18 25 9 6 97 Hartford/Springfield 11 10 10 9 16 5 6 98 Mid Atlantic:
Albany/Troy 9 9 7 10 13 5 6 74Syracuse 8 9 9 9 14 6 4 93Buffalo/Rochester 9 9 10 8 10 3 5 90New York 18 15 13 13 42 7 13 81Scranton 7 7 7 5 10 5 6 98Philadelphia 11 9 11 9 23 5 10 93Baltimore/Wash. 10 8 12 10 20 7 5 94
Great Lakes States:Pittsburgh 9 8 8 6 13 3 6 88Charleston,WV 7 7 7 4 8 2 4 62Cleveland 14 13 13 11 21 6 6 79Cincinnati 13 13 13 12 16 4 8 91Detroit 11 10 10 10 14 5 5 98Grand Rapids 9 9 8 7 10 4 6 84Indianapolis 9 9 9 8 13 3 7 72Milwaukee 8 7 7 8 10 3 5 97Green Bay 7 7 7 8 8 2 6 91Chicago 14 13 13 13 17 4 9 96Peoria 7 7 7 7 12 4 6 95
West North Central:St. Louis 9 9 9 7 12 4 5 93Quad Cities 6 6 6 8 9 4 4 85Omaha 10 10 10 9 13 3 8 96Minneapolis 5 5 5 5 7 1 4 97Kansas City 7 7 6 5 10 3 5 79Wichita 9 9 9 5 12 4 5 82
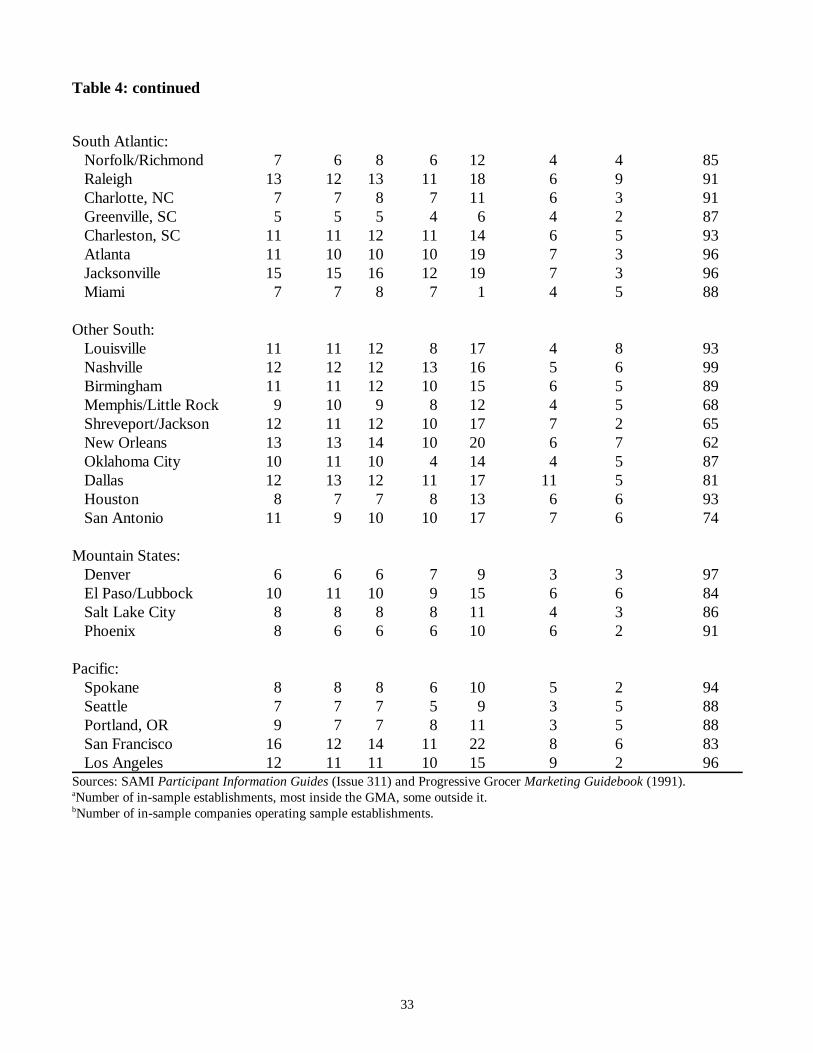
Table 4: continued
33
South Atlantic:Norfolk/Richmond 7 6 8 6 12 4 4 85Raleigh 13 12 13 11 18 6 9 91Charlotte, NC 7 7 8 7 11 6 3 91Greenville, SC 5 5 5 4 6 4 2 87Charleston, SC 11 11 12 11 14 6 5 93Atlanta 11 10 10 10 19 7 3 96Jacksonville 15 15 16 12 19 7 3 96Miami 7 7 8 7 1 4 5 88
Other South:Louisville 11 11 12 8 17 4 8 93Nashville 12 12 12 13 16 5 6 99Birmingham 11 11 12 10 15 6 5 89Memphis/Little Rock 9 10 9 8 12 4 5 68Shreveport/Jackson 12 11 12 10 17 7 2 65New Orleans 13 13 14 10 20 6 7 62Oklahoma City 10 11 10 4 14 4 5 87Dallas 12 13 12 11 17 11 5 81Houston 8 7 7 8 13 6 6 93San Antonio 11 9 10 10 17 7 6 74
Mountain States:Denver 6 6 6 7 9 3 3 97El Paso/Lubbock 10 11 10 9 15 6 6 84Salt Lake City 8 8 8 8 11 4 3 86Phoenix 8 6 6 6 10 6 2 91
Pacific:Spokane 8 8 8 6 10 5 2 94Seattle 7 7 7 5 9 3 5 88Portland, OR 9 7 7 8 11 3 5 88San Francisco 16 12 14 11 22 8 6 83Los Angeles 12 11 11 10 15 9 2 96
Sources: SAMI Participant Information Guides (Issue 311) and Progressive Grocer Marketing Guidebook (1991).Number of in-sample establishments, most inside the GMA, some outside it.a
Number of in-sample companies operating sample establishments.b
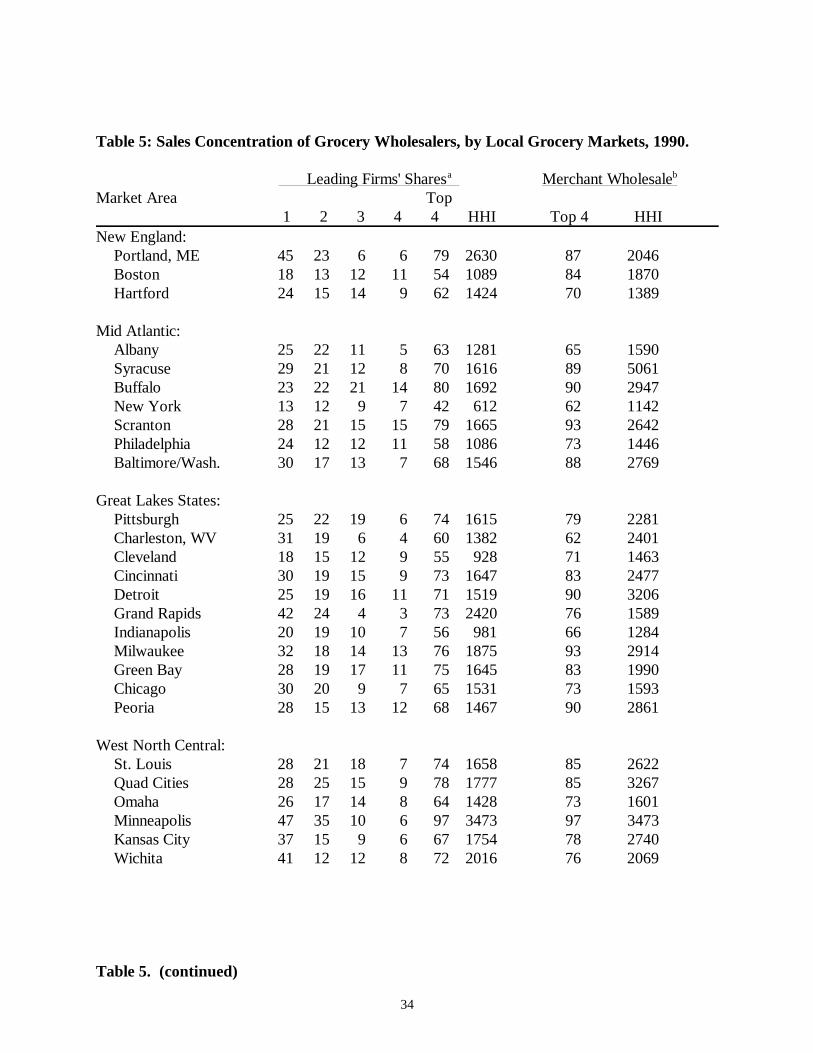
34
Table 5: Sales Concentration of Grocery Wholesalers, by Local Grocery Markets, 1990. Leading Firms' Shares Merchant Wholesalea b
Market Area Top 1 2 3 4 4 HHI Top 4 HHINew England:
Portland, ME 45 23 6 6 79 2630 87 2046Boston 18 13 12 11 54 1089 84 1870Hartford 24 15 14 9 62 1424 70 1389
Mid Atlantic:Albany 25 22 11 5 63 1281 65 1590Syracuse 29 21 12 8 70 1616 89 5061Buffalo 23 22 21 14 80 1692 90 2947New York 13 12 9 7 42 612 62 1142Scranton 28 21 15 15 79 1665 93 2642Philadelphia 24 12 12 11 58 1086 73 1446Baltimore/Wash. 30 17 13 7 68 1546 88 2769
Great Lakes States:Pittsburgh 25 22 19 6 74 1615 79 2281Charleston, WV 31 19 6 4 60 1382 62 2401Cleveland 18 15 12 9 55 928 71 1463Cincinnati 30 19 15 9 73 1647 83 2477Detroit 25 19 16 11 71 1519 90 3206Grand Rapids 42 24 4 3 73 2420 76 1589Indianapolis 20 19 10 7 56 981 66 1284Milwaukee 32 18 14 13 76 1875 93 2914Green Bay 28 19 17 11 75 1645 83 1990Chicago 30 20 9 7 65 1531 73 1593Peoria 28 15 13 12 68 1467 90 2861
West North Central:St. Louis 28 21 18 7 74 1658 85 2622Quad Cities 28 25 15 9 78 1777 85 3267Omaha 26 17 14 8 64 1428 73 1601Minneapolis 47 35 10 6 97 3473 97 3473Kansas City 37 15 9 6 67 1754 78 2740Wichita 41 12 12 8 72 2016 76 2069
Table 5. (continued)
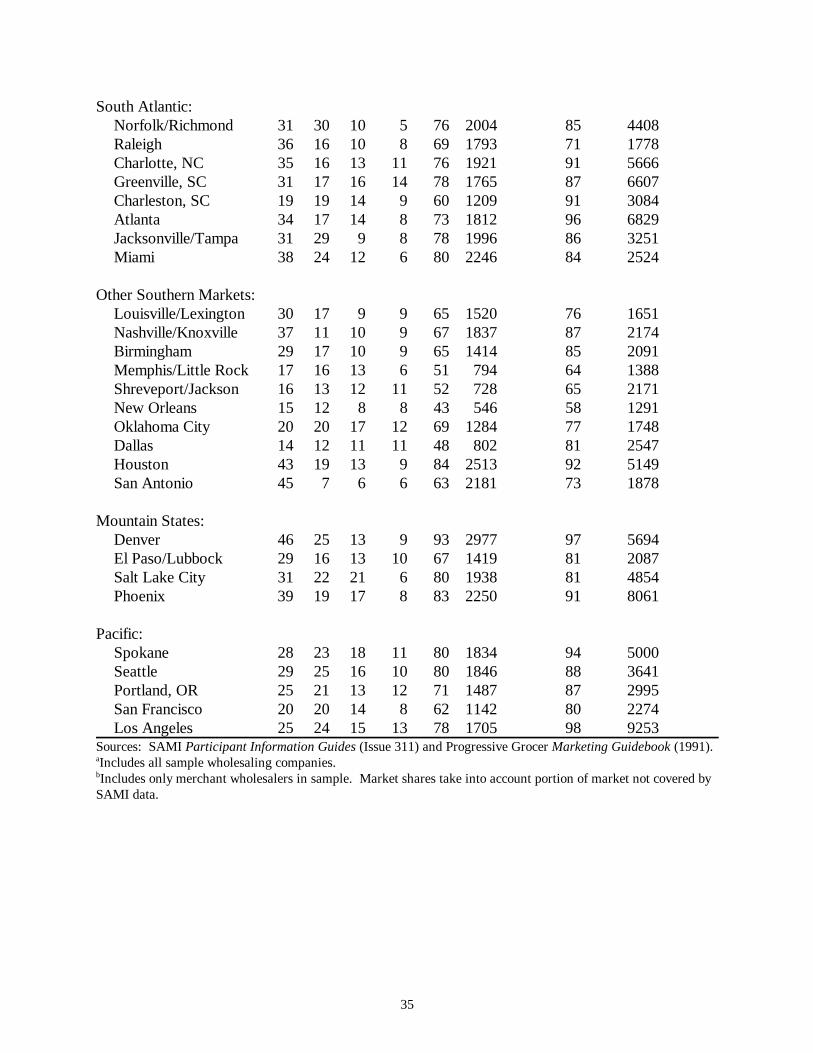
35
South Atlantic:Norfolk/Richmond 31 30 10 5 76 2004 85 4408Raleigh 36 16 10 8 69 1793 71 1778Charlotte, NC 35 16 13 11 76 1921 91 5666Greenville, SC 31 17 16 14 781765 87 6607Charleston, SC 19 19 14 9 60 1209 91 3084Atlanta 34 17 14 8 73 1812 96 6829Jacksonville/Tampa 31 29 9 8 781996 86 3251Miami 38 24 12 6 80 2246 84 2524
Other Southern Markets:Louisville/Lexington 30 17 9 9 65 1520 76 1651Nashville/Knoxville 37 11 10 9 67 1837 87 2174Birmingham 29 17 10 9 65 1414 85 2091Memphis/Little Rock 17 16 13 6 51 794 64 1388Shreveport/Jackson 16 13 12 11 52 728 65 2171New Orleans 15 12 8 8 43 546 58 1291Oklahoma City 20 20 17 12 69 1284 77 1748Dallas 14 12 11 11 48 802 81 2547Houston 43 19 13 9 84 2513 92 5149San Antonio 45 7 6 6 63 2181 73 1878
Mountain States:Denver 46 25 13 9 93 2977 97 5694El Paso/Lubbock 29 16 13 10 67 1419 81 2087Salt Lake City 31 22 21 6 80 1938 81 4854Phoenix 39 19 17 8 83 2250 91 8061
Pacific:Spokane 28 23 18 11 80 1834 94 5000Seattle 29 25 16 10 80 1846 88 3641Portland, OR 25 21 13 12 71 1487 87 2995San Francisco 20 20 14 8 62 1142 80 2274Los Angeles 25 24 15 13 78 1705 98 9253
Sources: SAMI Participant Information Guides (Issue 311) and Progressive Grocer Marketing Guidebook (1991).Includes all sample wholesaling companies.a
Includes only merchant wholesalers in sample. Market shares take into account portion of market not covered byb
SAMI data.
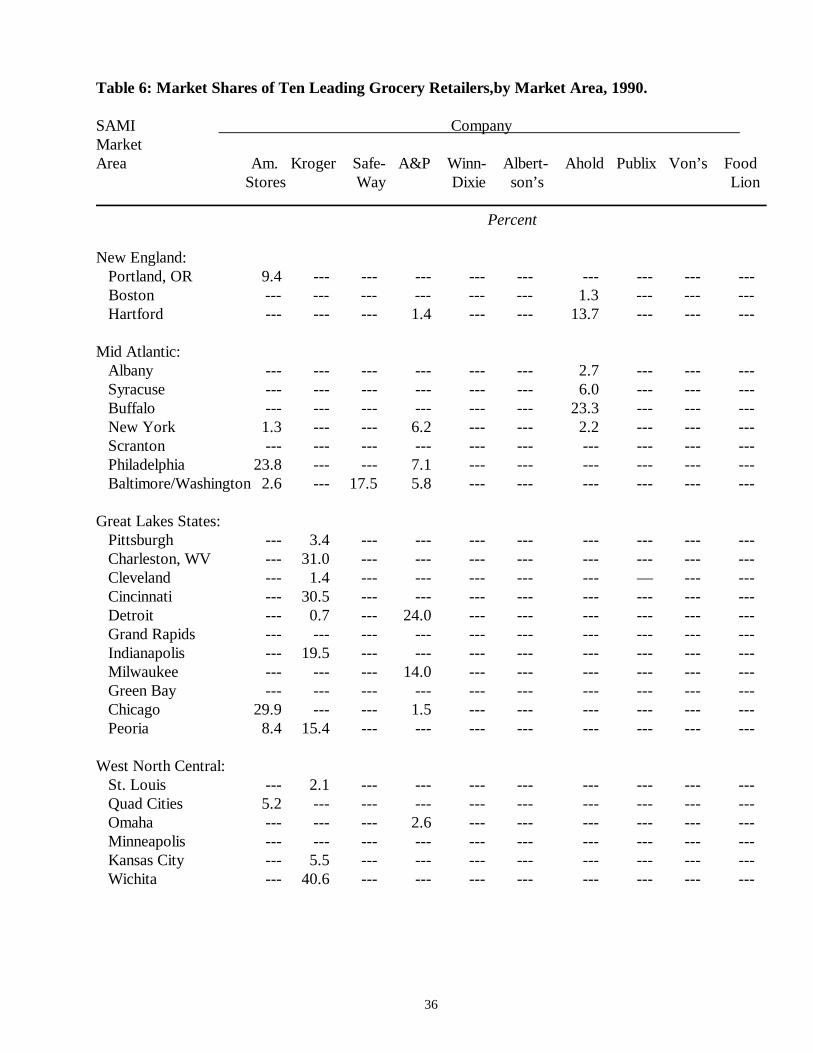
36
Table 6: Market Shares of Ten Leading Grocery Retailers,by Market Area, 1990.
SAMI Company Market Area Am. Kroger Safe- A&P Winn- Albert- Ahold Publix Von’s Food Stores Way Dixie son’s Lion
Percent
New England:Portland, OR 9.4 --- --- --- --- --- --- --- --- ---
Boston --- --- --- --- --- --- 1.3 --- --- ---Hartford --- --- --- 1.4 --- --- 13.7 --- --- ---
Mid Atlantic:Albany --- --- --- --- --- --- 2.7 --- --- ---Syracuse --- --- --- --- --- --- 6.0 --- --- ---Buffalo --- --- --- --- --- --- 23.3 --- --- ---New York 1.3 --- --- 6.2 --- --- 2.2 --- --- ---Scranton --- --- --- --- --- --- --- --- --- ---Philadelphia 23.8 --- --- 7.1 --- --- --- --- --- ---Baltimore/Washington 2.6 --- 17.5 5.8 --- --- --- --- --- ---
Great Lakes States:Pittsburgh --- 3.4 --- --- --- --- --- --- --- ---Charleston, WV --- 31.0 --- --- --- --- --- --- --- ---Cleveland --- 1.4 --- --- --- --- --- — --- ---Cincinnati --- 30.5 --- --- --- --- --- --- --- ---Detroit --- 0.7 --- 24.0 --- --- --- --- --- ---Grand Rapids --- --- --- --- --- --- --- --- --- ---Indianapolis --- 19.5 --- --- --- --- --- --- --- ---Milwaukee --- --- --- 14.0 --- --- --- --- --- ---Green Bay --- --- --- --- --- --- --- --- --- ---Chicago 29.9 --- --- 1.5 --- --- --- --- --- ---Peoria 8.4 15.4 --- --- --- --- --- --- --- ---
West North Central:St. Louis --- 2.1 --- --- --- --- --- --- --- ---Quad Cities 5.2 --- --- --- --- --- --- --- --- ---Omaha --- --- --- 2.6 --- --- --- --- --- ---Minneapolis --- --- --- --- --- --- --- --- --- ---Kansas City --- 5.5 --- --- --- --- --- --- --- ---Wichita --- 40.6 --- --- --- --- --- --- --- ---
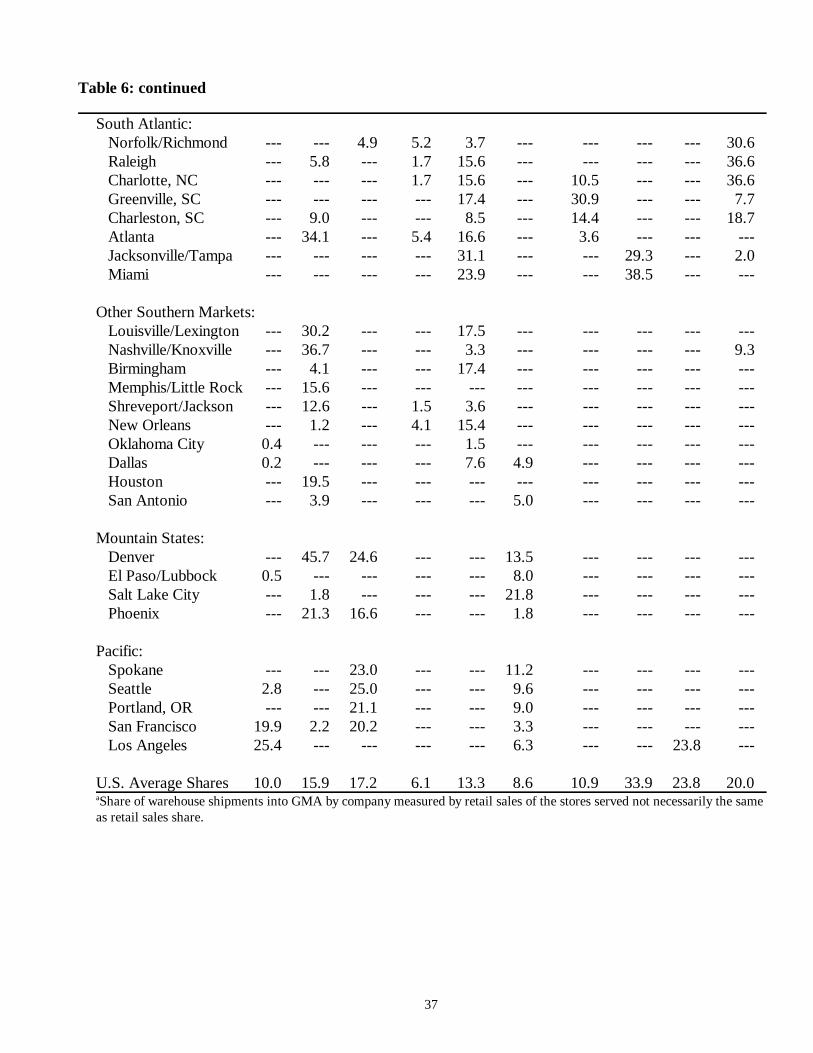
Table 6: continued
37
South Atlantic:Norfolk/Richmond --- --- 4.9 5.2 3.7 --- --- --- --- 30.6Raleigh --- 5.8 --- 1.7 15.6 --- --- --- --- 36.6Charlotte, NC --- --- --- 1.7 15.6 --- 10.5 --- --- 36.6Greenville, SC --- --- --- --- 17.4 --- 30.9 --- --- 7.7Charleston, SC --- 9.0 --- --- 8.5 --- 14.4 --- --- 18.7Atlanta --- 34.1 --- 5.4 16.6 --- 3.6 --- --- ---Jacksonville/Tampa --- --- --- --- 31.1 --- --- 29.3 --- 2.0Miami --- --- --- --- 23.9 --- --- 38.5 --- ---
Other Southern Markets:Louisville/Lexington --- 30.2 --- --- 17.5 --- --- --- --- ---Nashville/Knoxville --- 36.7 --- --- 3.3 --- --- --- --- 9.3Birmingham --- 4.1 --- --- 17.4 --- --- --- --- ---Memphis/Little Rock --- 15.6 --- --- --- --- --- --- --- ---Shreveport/Jackson --- 12.6 --- 1.5 3.6 --- --- --- --- ---New Orleans --- 1.2 --- 4.1 15.4 --- --- --- --- ---Oklahoma City 0.4 --- --- --- 1.5 --- --- --- --- ---Dallas 0.2 --- --- --- 7.6 4.9 --- --- --- ---Houston --- 19.5 --- --- --- --- --- --- --- ---San Antonio --- 3.9 --- --- --- 5.0 --- --- --- ---
Mountain States:Denver --- 45.7 24.6 --- --- 13.5 --- --- --- ---El Paso/Lubbock 0.5 --- --- --- --- 8.0 --- --- --- ---Salt Lake City --- 1.8 --- --- --- 21.8 --- --- --- ---Phoenix --- 21.3 16.6 --- --- 1.8 --- --- --- ---
Pacific:Spokane --- --- 23.0 --- --- 11.2 --- --- --- ---Seattle 2.8 --- 25.0 --- --- 9.6 --- --- --- ---Portland, OR --- --- 21.1 --- --- 9.0 --- --- --- ---San Francisco 19.9 2.2 20.2 --- --- 3.3 --- --- --- ---Los Angeles 25.4 --- --- --- --- 6.3 --- --- 23.8 ---
U.S. Average Shares 10.0 15.9 17.2 6.1 13.3 8.6 10.9 33.9 23.8 20.0Share of warehouse shipments into GMA by company measured by retail sales of the stores served not necessarily the samea
as retail sales share.
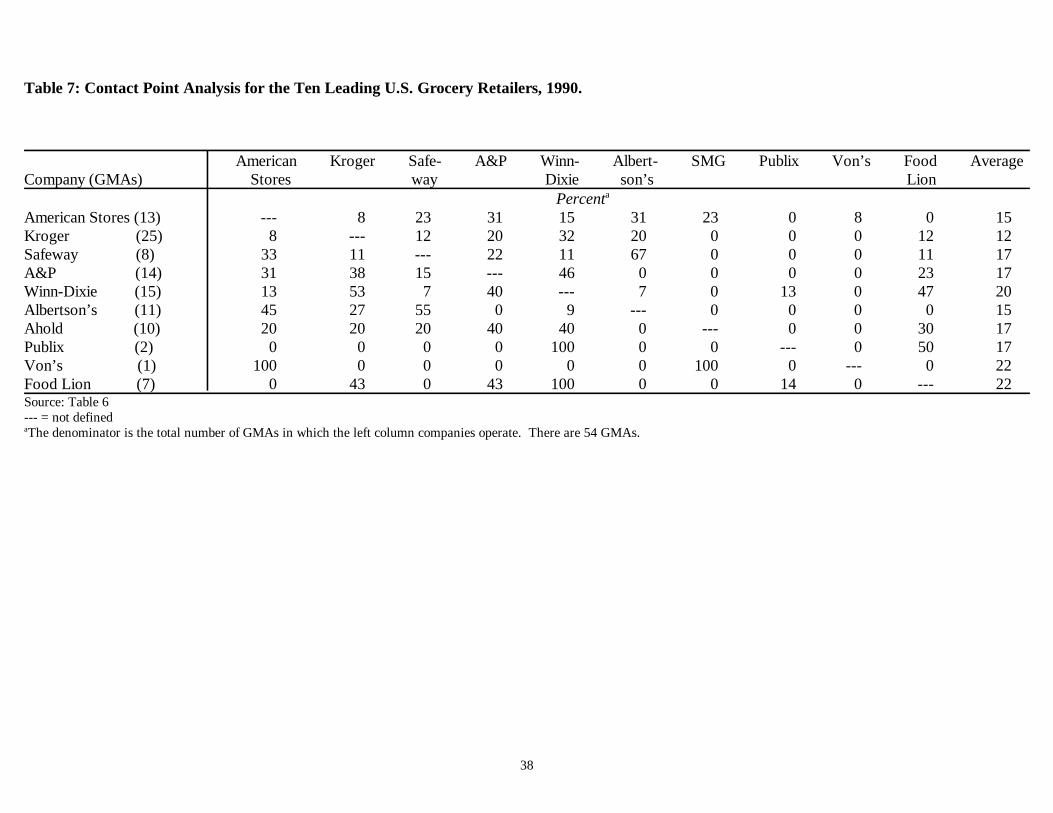
Table 7: Contact Point Analysis for the Ten Leading U.S. Grocery Retailers, 1990.
38
American Kroger Safe- A&P Winn- Albert- SMG Publix Von’s Food AverageCompany (GMAs) Stores way Dixie son’s Lion
Percenta
American Stores (13) --- 8 23 31 15 31 23 0 8 0 15Kroger (25) 8 --- 12 20 32 20 0 0 0 12 12Safeway (8) 33 11 --- 22 11 67 0 0 0 11 17A&P (14) 31 38 15 --- 46 0 0 0 0 23 17Winn-Dixie (15) 13 53 7 40 --- 7 0 13 0 47 20Albertson’s (11) 45 27 55 0 9 --- 0 0 0 0 15Ahold (10) 20 20 20 40 40 0 --- 0 0 30 17Publix (2) 0 0 0 0 100 0 0 --- 0 50 17Von’s (1) 100 0 0 0 0 0 100 0 --- 0 22Food Lion (7) 0 43 0 43 100 0 0 14 0 --- 22Source: Table 6--- = not definedThe denominator is the total number of GMAs in which the left column companies operate. There are 54 GMAs.a
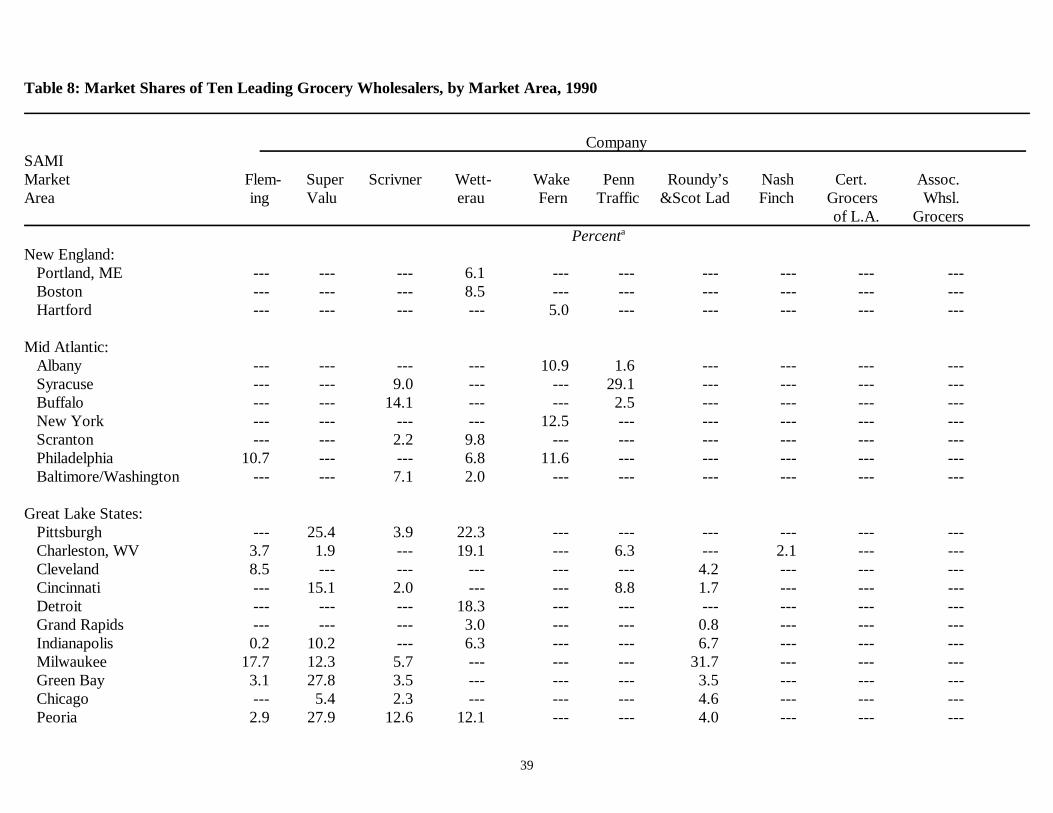
Table 8: Market Shares of Ten Leading Grocery Wholesalers, by Market Area, 1990
39
CompanySAMI Market Flem- Super Scrivner Wett- Wake Penn Roundy’s Nash Cert. Assoc.Area ing Valu erau Fern Traffic &Scot Lad Finch Grocers Whsl. of L.A. Grocers Percenta
New England:Portland, ME --- --- --- 6.1 --- --- --- --- --- ---Boston --- --- --- 8.5 --- --- --- --- --- ---Hartford --- --- --- --- 5.0 --- --- --- --- ---
Mid Atlantic:Albany --- --- --- --- 10.9 1.6 --- --- --- ---Syracuse --- --- 9.0 --- --- 29.1 --- --- --- ---Buffalo --- --- 14.1 --- --- 2.5 --- --- --- ---New York --- --- --- --- 12.5 --- --- --- --- ---Scranton --- --- 2.2 9.8 --- --- --- --- --- ---Philadelphia 10.7 --- --- 6.8 11.6 --- --- --- --- ---Baltimore/Washington --- --- 7.1 2.0 --- --- --- --- --- ---
Great Lake States:Pittsburgh --- 25.4 3.9 22.3 --- --- --- --- --- ---Charleston, WV 3.7 1.9 --- 19.1 --- 6.3 --- 2.1 --- ---Cleveland 8.5 --- --- --- --- --- 4.2 --- --- ---Cincinnati --- 15.1 2.0 --- --- 8.8 1.7 --- --- ---Detroit --- --- --- 18.3 --- --- --- --- --- ---Grand Rapids --- --- --- 3.0 --- --- 0.8 --- --- ---Indianapolis 0.2 10.2 --- 6.3 --- --- 6.7 --- --- ---Milwaukee 17.7 12.3 5.7 --- --- --- 31.7 --- --- ---Green Bay 3.1 27.8 3.5 --- --- --- 3.5 --- --- ---Chicago --- 5.4 2.3 --- --- --- 4.6 --- --- ---Peoria 2.9 27.9 12.6 12.1 --- --- 4.0 --- --- ---
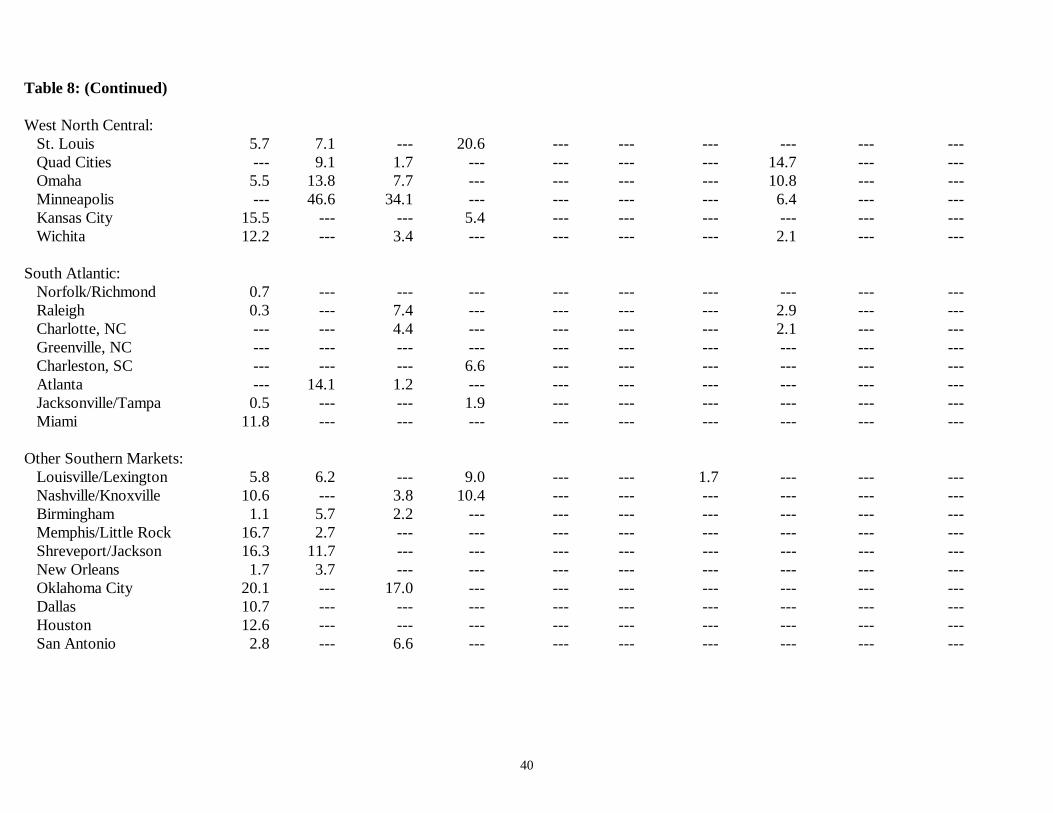
40
Table 8: (Continued)
West North Central:St. Louis 5.7 7.1 --- 20.6 --- --- --- --- --- ---Quad Cities --- 9.1 1.7 --- --- --- --- 14.7 --- ---Omaha 5.5 13.8 7.7 --- --- --- --- 10.8 --- ---Minneapolis --- 46.6 34.1 --- --- --- --- 6.4 --- ---Kansas City 15.5 --- --- 5.4 --- --- --- --- --- ---Wichita 12.2 --- 3.4 --- --- --- --- 2.1 --- ---
South Atlantic:Norfolk/Richmond 0.7 --- --- --- --- --- --- --- --- ---Raleigh 0.3 --- 7.4 --- --- --- --- 2.9 --- ---Charlotte, NC --- --- 4.4 --- --- --- --- 2.1 --- ---Greenville, NC --- --- --- --- --- --- --- --- --- ---Charleston, SC --- --- --- 6.6 --- --- --- --- --- ---Atlanta --- 14.1 1.2 --- --- --- --- --- --- ---Jacksonville/Tampa 0.5 --- --- 1.9 --- --- --- --- --- ---Miami 11.8 --- --- --- --- --- --- --- --- ---
Other Southern Markets:Louisville/Lexington 5.8 6.2 --- 9.0 --- --- 1.7 --- --- ---Nashville/Knoxville 10.6 --- 3.8 10.4 --- --- --- --- --- ---Birmingham 1.1 5.7 2.2 --- --- --- --- --- --- ---Memphis/Little Rock 16.7 2.7 --- --- --- --- --- --- --- ---Shreveport/Jackson 16.3 11.7 --- --- --- --- --- --- --- ---New Orleans 1.7 3.7 --- --- --- --- --- --- --- ---Oklahoma City 20.1 --- 17.0 --- --- --- --- --- --- ---Dallas 10.7 --- --- --- --- --- --- --- --- ---Houston 12.6 --- --- --- --- --- --- --- --- ---San Antonio 2.8 --- 6.6 --- --- --- --- --- --- ---
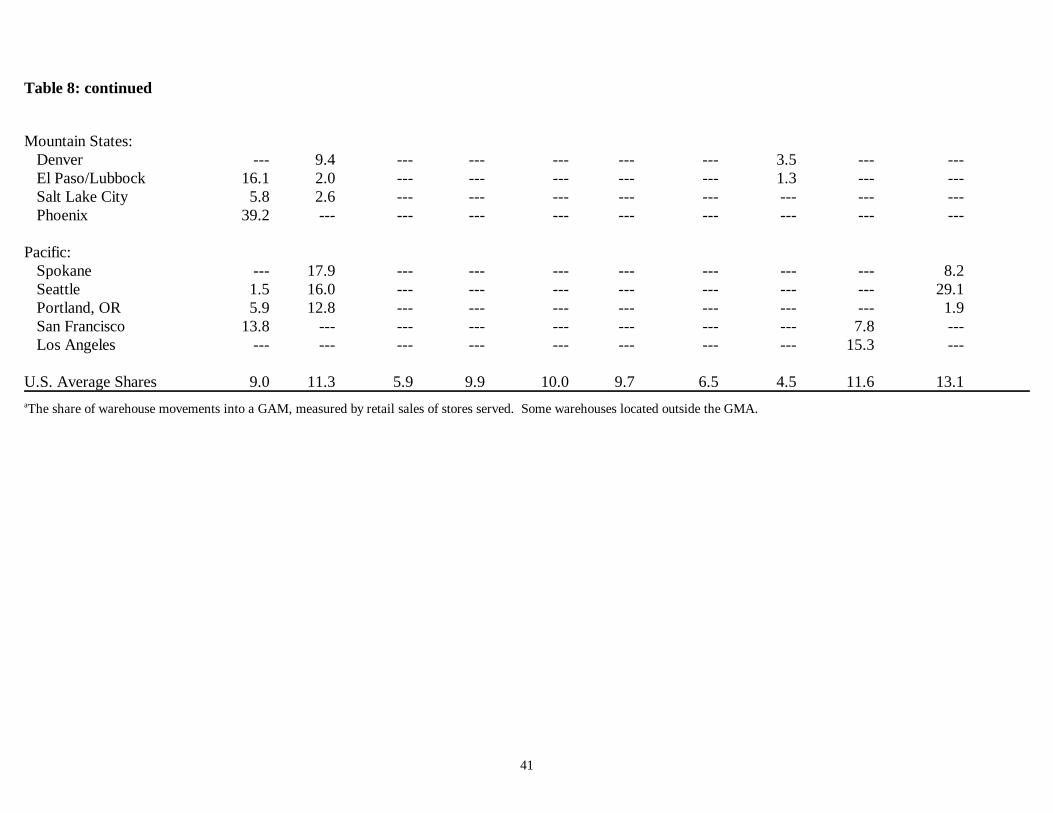
Table 8: continued
41
Mountain States:Denver --- 9.4 --- --- --- --- --- 3.5 --- ---El Paso/Lubbock 16.1 2.0 --- --- --- --- --- 1.3 --- ---Salt Lake City 5.8 2.6 --- --- --- --- --- --- --- ---Phoenix 39.2 --- --- --- --- --- --- --- --- ---
Pacific:Spokane --- 17.9 --- --- --- --- --- --- --- 8.2Seattle 1.5 16.0 --- --- --- --- --- --- --- 29.1Portland, OR 5.9 12.8 --- --- --- --- --- --- --- 1.9San Francisco 13.8 --- --- --- --- --- --- --- 7.8 ---Los Angeles --- --- --- --- --- --- --- --- 15.3 ---
U.S. Average Shares 9.0 11.3 5.9 9.9 10.0 9.7 6.5 4.5 11.6 13.1
The share of warehouse movements into a GAM, measured by retail sales of stores served. Some warehouses located outside the GMA.a
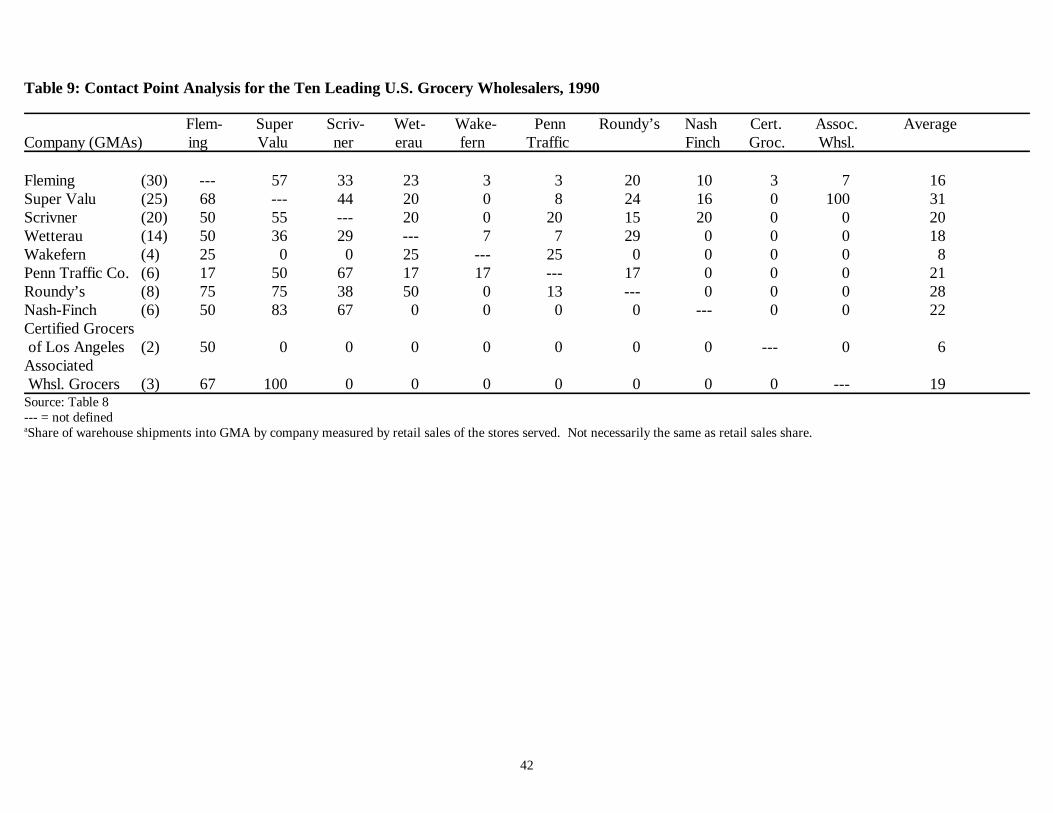
Table 9: Contact Point Analysis for the Ten Leading U.S. Grocery Wholesalers, 1990
42
Flem- Super Scriv- Wet- Wake- Penn Roundy’s Nash Cert. Assoc. Average Company (GMAs) ing Valu ner erau fern Traffic Finch Groc. Whsl.
Fleming (30) --- 57 33 23 3 3 20 10 3 7 16Super Valu (25) 68 --- 44 20 0 8 24 16 0 100 31Scrivner (20) 50 55 --- 20 0 20 15 20 0 0 20Wetterau (14) 50 36 29 --- 7 7 29 0 0 0 18Wakefern (4) 25 0 0 25 --- 25 0 0 0 0 8Penn Traffic Co. (6) 17 50 67 17 17 --- 17 0 0 0 21Roundy’s (8) 75 75 38 50 0 13 --- 0 0 0 28Nash-Finch (6) 50 83 67 0 0 0 0 --- 0 0 22Certified Grocers of Los Angeles (2) 50 0 0 0 0 0 0 0 --- 0 6Associated Whsl. Grocers (3) 67 100 0 0 0 0 0 0 0 --- 19Source: Table 8--- = not definedShare of warehouse shipments into GMA by company measured by retail sales of the stores served. Not necessarily the same as retail sales share.a
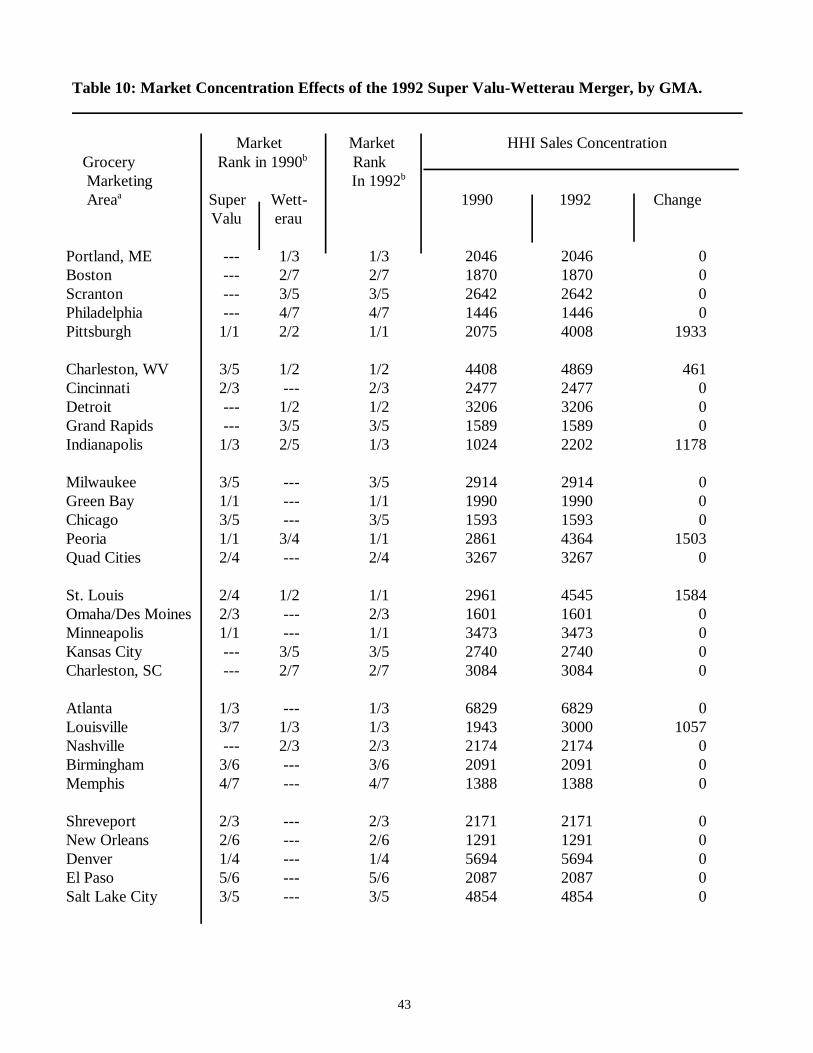
Table 10: Market Concentration Effects of the 1992 Super Valu-Wetterau Merger, by GMA.
43
Market Market HHI Sales Concentration Grocery Rank in 1990 Rank b
Marketing In 1992b
Area Super Wett- 1990 1992 Changea
Valu erau
Portland, ME --- 1/3 1/3 2046 2046 0Boston --- 2/7 2/7 1870 1870 0Scranton --- 3/5 3/5 2642 2642 0Philadelphia --- 4/7 4/7 1446 1446 0Pittsburgh 1/1 2/2 1/1 2075 4008 1933
Charleston, WV 3/5 1/2 1/2 4408 4869 461Cincinnati 2/3 --- 2/3 2477 2477 0Detroit --- 1/2 1/2 3206 3206 0Grand Rapids --- 3/5 3/5 1589 1589 0Indianapolis 1/3 2/5 1/3 1024 2202 1178
Milwaukee 3/5 --- 3/5 2914 2914 0Green Bay 1/1 --- 1/1 1990 1990 0Chicago 3/5 --- 3/5 1593 1593 0Peoria 1/1 3/4 1/1 2861 4364 1503Quad Cities 2/4 --- 2/4 3267 3267 0
St. Louis 2/4 1/2 1/1 2961 4545 1584Omaha/Des Moines 2/3 --- 2/3 1601 1601 0Minneapolis 1/1 --- 1/1 3473 3473 0Kansas City --- 3/5 3/5 2740 2740 0Charleston, SC --- 2/7 2/7 3084 3084 0
Atlanta 1/3 --- 1/3 6829 6829 0Louisville 3/7 1/3 1/3 1943 3000 1057Nashville --- 2/3 2/3 2174 2174 0Birmingham 3/6 --- 3/6 2091 2091 0Memphis 4/7 --- 4/7 1388 1388 0
Shreveport 2/3 --- 2/3 2171 2171 0New Orleans 2/6 --- 2/6 1291 1291 0Denver 1/4 --- 1/4 5694 5694 0El Paso 5/6 --- 5/6 2087 2087 0Salt Lake City 3/5 --- 3/5 4854 4854 0
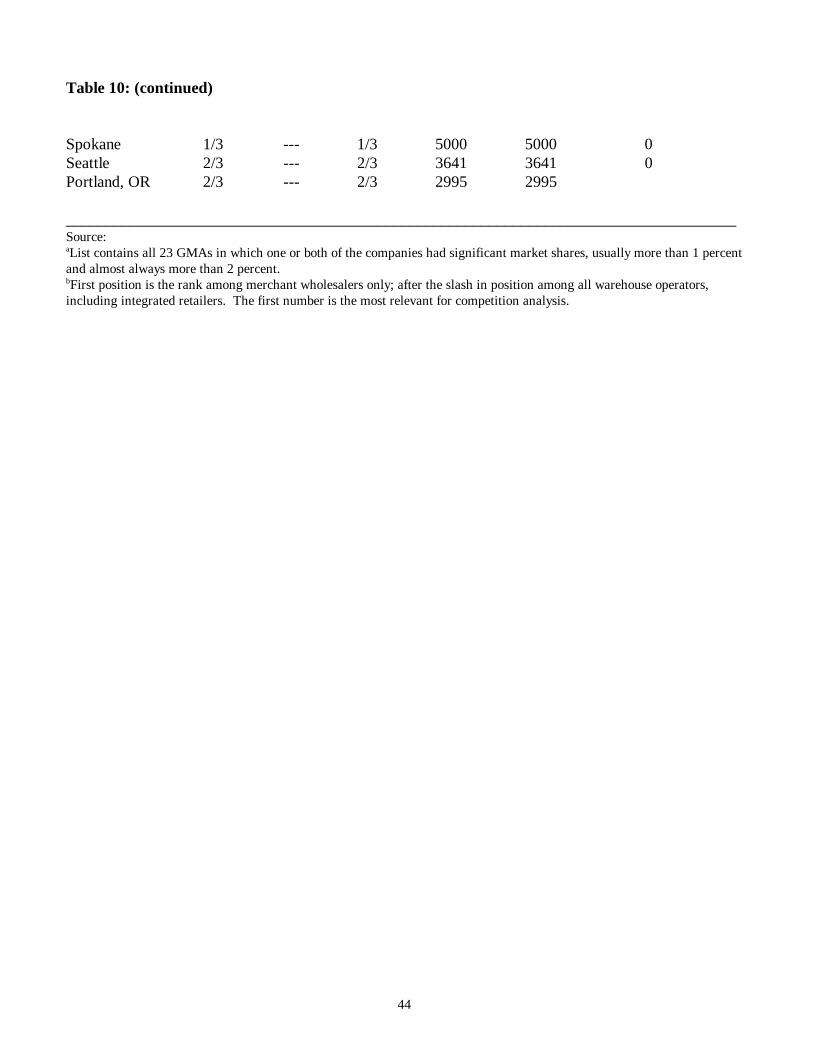
44
Table 10: (continued)
Spokane 1/3 --- 1/3 5000 5000 0Seattle 2/3 --- 2/3 3641 3641 0Portland, OR 2/3 --- 2/3 2995 2995
____________________________________________________________________________________Source:List contains all 23 GMAs in which one or both of the companies had significant market shares, usually more than 1 percenta
and almost always more than 2 percent.First position is the rank among merchant wholesalers only; after the slash in position among all warehouse operators,b
including integrated retailers. The first number is the most relevant for competition analysis.
45
References
Binkley, James K. and John M. Connor. Market Competition and Metropolitan-AreaGrocery Prices, Staff Paper 95-15. West Lafayette, Indiana: Department of AgriculturalEconomics, Purdue University (July 1996).
Connor, John M. et al. The Food Manufacturing Industries: Structure, Strategies,Performance, and Policies. Lexington, Mass.: Lexington Books (1985).
Connor, John M. and William Schiek. Food Processing: An Industrial Powerhouse inTransition (Second edition). New York: John Wiley & Sons (1997).
Cotterill, Ronald W. Market Power in the Retail Food Industry: Evidence from Vermont. Review of Economics and Statistics 68 (August 1986): 379-386.
ERS. Food Marketing Review, 1994-95, Agricultural Economics Report No. 743. Washington, D.C.: Economic Research Service, U.S. Department of Agriculture (September1996 and previous editions).
Franklin, Andrew and Ronald W. Cotterill. An Analysis of the U.S. Grocery RetailingIndustry, Research Report No. __. Storrs, Conn.: Food Marketing Policy Center, University ofConnecticut (1993).
Grinnell, Gerald, Russell Parker, and Lawrence Rens. Grocery Retailing Concentrationin Metropolitan Areas: Economic Census Years 1954-72. Washington, D.C.: U.S. FederalTrade Commission and U.S. Department of Agriculture (1979).
IRI. Marketing Data Book. Chicago, Ill.: Information Resources, Inc. (1997 andprevious annual editions).
Marion, Bruce W. and the NC 117 Committee. The Organization and Performance ofthe U.S. Food System. Lexington, Mass.: Lexington Books (1986).
Progressive Grocer. 1991 Marketing Guidebook. Stamford, Conn.: Progressive GrocerTrade Dimensions, McLean Hunter Media, Inc. (1990).
U.S. Census Bureau. 1992 Census of Manufactures: Concentration Ratios inManufacturing. Washington, D.C.: U.S. Department of Commerce (1996 World Wide Web,home page of U.S. Department of Commerce).
U.S. Justice Department. Merger Guidelines. Washington, D.C.: U.S. Department ofJustice and U.S. Federal Trade Commission (1992).
Wilke, John R. and Joseph Pereira. FTC Votes to Bar Staples’ Bid for Rival. Wall StreetJournal (March 11, 1997): A3.

46
________. Staples Sets Store Sales to Rescue Merger. Wall Street Journal (March 13,1997): A3.
47
Endnotes
1. The 14 GMAs were apparently chosen because MSA boundaries seem to correspond to apriori notions of what constituted a proper geographic market boundary. The CensusBureau tends to over classify specialty wholesalers (see Marion et al: 365). Moreover,MSA boundaries are drawn to represent population centers that form cohesive labormarkets (as revealed by commuting patterns), not necessarily reasonable wholesale tradingzones.
2. In 1989, the Census Bureau defined 334 Metropolitan Statistical Areas (MSAs), many ofwhich were further grouped into 20 very large consolidated Metropolitan Statistical Areas(CMSAs). MSAs were formerly called SMSAs (Standard Metropolitan Statistical Areas).
3. SAMI was bought by Time, Inc., in the early 1970s and was eventually resold by Arbitron. Because SAMI was late to develop a retail scanner service, it was overtaken byInformation Resources, Inc. (IRI) in the late 1980s. SAMI ceased operations inDecember 1990 and was liquidated in March 1991. Most of SAMI’s data was donated toPurdue University at that time and placed in an archive in the Krannert Library.
4. The drug store service had SARDI as its acronym. In the 1970s, SAMI attempted todevelop a product tracking service for foodservice items, but coverage never extendedbeyond about six GMAs. The experimental service never drew sufficient interest fromfoodservice and food manufacturing clients to become profitable.
5. SAMI employees said that a considerable effort was required to correct for inter-GMAshipments of wholesaler-diverters. Few, if any, of their participants would admit toengaging in diverting and retailers themselves were reluctant to admit purchases fromdiverters.
6. Leakage from warehouses located in the GMA of interest to areas outside the GMAcannot be determined from the SAMI guidelines, but SAMI could always expand thenumber of stores on the fringe of the GMA so as to minimize outward leakage. Suchexpansion would be limited by increased imports from other SAMI GMAs.
7. This problem is referred to as the “principal-agent” problem in the economic literature. This problem is most apparent in the case of merchant wholesalers but also applies in thecase of cooperative wholesalers to a lesser extent.
8. Major retailers drop in and out of various editions of the Marketing Guidebook, somultiple editions were consulted. The SAMI Participant Guides also provided names ofretailers that met the size criterion.
9. Numbers of truck and trailers are sometimes given when square footage is not. Occasionally, numbers and types of stores, local sales revenues, and information oncompanies of comparable size, type of business, and location are used as reference points.
48
10. Giant Food’s (No. 13) arrangement with Super Rite was apparently dropped in 1991 or1992. Food 4 Less (No. 22) had just purchased new stores in California. Retailers 29, 35,and 46 are partially integrated. Retailers No. 41 and 49 are fully integrated in one GMAbut not in another.
11. Many small chains own warehouses smaller than 100,000 square feet, but these tend to beused for produce or short term storage of dry groceries.
12. The only alternative is direct manufacture-retailer delivery or direct consumer marketing,but these methods account for less than one-fifth of the sales these methods account forless than one-fifth of the sales of consumer-ready foods in the United States.
13. The Department of Justice - Federal Trade Commission merger guidelines state that apost-merger Herfindahl index of 1800 or more will likely trigger an investigation; only anindex level below 1000 is unlikely to meet with agency opposition.
14. Total U.S. grocery sales in 1990 were $369 billion, but the general-line grocerywarehouses listed in Appendix Table 1 are believed to cover only about 80% of U.S.warehouse capacity.
15. On average, the market shares of wholesalers omitted from the SAMI sample accountedfor 4.8 percentage points of GMA retail sales. The largest single omission was GiantStores in Washington, DC (35 percent share). Sales data on SAMI omissions areestimated from Progressive Grocer data.
16. By “number of warehouses” is meant the number of establishments supplying groceryproducts in the sample. Most are inside the GMA, but some ship from outside the GMAboundaries. Several are counted more than once. Perhaps it is easier to think of thenumber as the number of distinct zones to which a single warehouse ships.
17. The CR4 is the sum of the shares of the top four companies. The HHI is the sum of thesquares of the percentage market shares. A monopoly has an HHI of 10,000, whereas anunconcentrated market has an HHI close to zero.
18. Recall that the depopulated portions of the northern High Plains are not covered by SAMImarkets.
19. Information on mergers and acquisitions is taken from ERS (1996) and a Lexis-Nexissearch of articles appearing in Supermarket News, Progressive Grocer, and other trademagazines.
49
APPENDIX A
TABLES
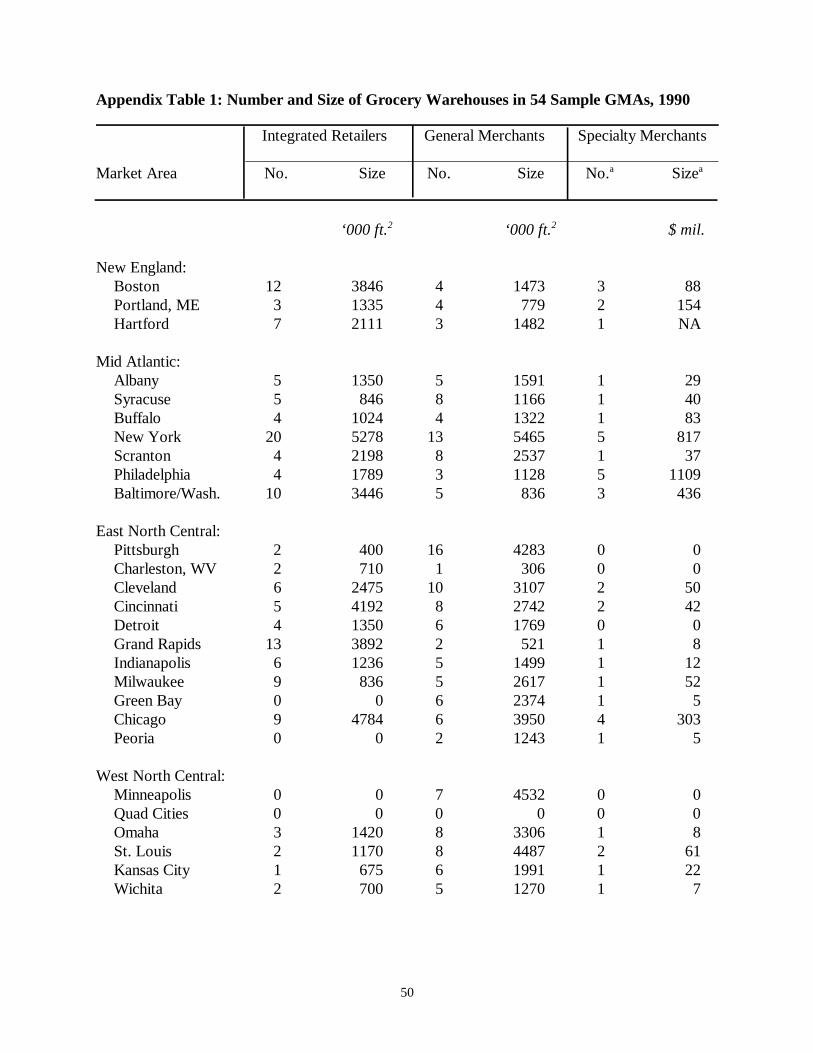
Appendix Table 1: Number and Size of Grocery Warehouses in 54 Sample GMAs, 1990
50
Integrated Retailers General Merchants Specialty Merchants Market Area No. Size No. Size No. Sizea a
‘000 ft. ‘000 ft. $ mil.2 2
New England:Boston 12 3846 4 1473 3 88Portland, ME 3 1335 4 779 2 154Hartford 7 2111 3 1482 1 NA
Mid Atlantic:Albany 5 1350 5 1591 1 29Syracuse 5 846 8 1166 1 40Buffalo 4 1024 4 1322 1 83New York 20 5278 13 5465 5 817Scranton 4 2198 8 2537 1 37Philadelphia 4 1789 3 1128 5 1109Baltimore/Wash. 10 3446 5 836 3 436
East North Central:Pittsburgh 2 400 16 4283 0 0Charleston, WV 2 710 1 306 0 0Cleveland 6 2475 10 3107 2 50Cincinnati 5 4192 8 2742 2 42Detroit 4 1350 6 1769 0 0Grand Rapids 13 3892 2 521 1 8Indianapolis 6 1236 5 1499 1 12Milwaukee 9 836 5 2617 1 52Green Bay 0 0 6 2374 1 5Chicago 9 4784 6 3950 4 303Peoria 0 0 2 1243 1 5
West North Central:Minneapolis 0 0 7 4532 0 0Quad Cities 0 0 0 0 0 0Omaha 3 1420 8 3306 1 8St. Louis 2 1170 8 4487 2 61Kansas City 1 675 6 1991 1 22Wichita 2 700 5 1270 1 7
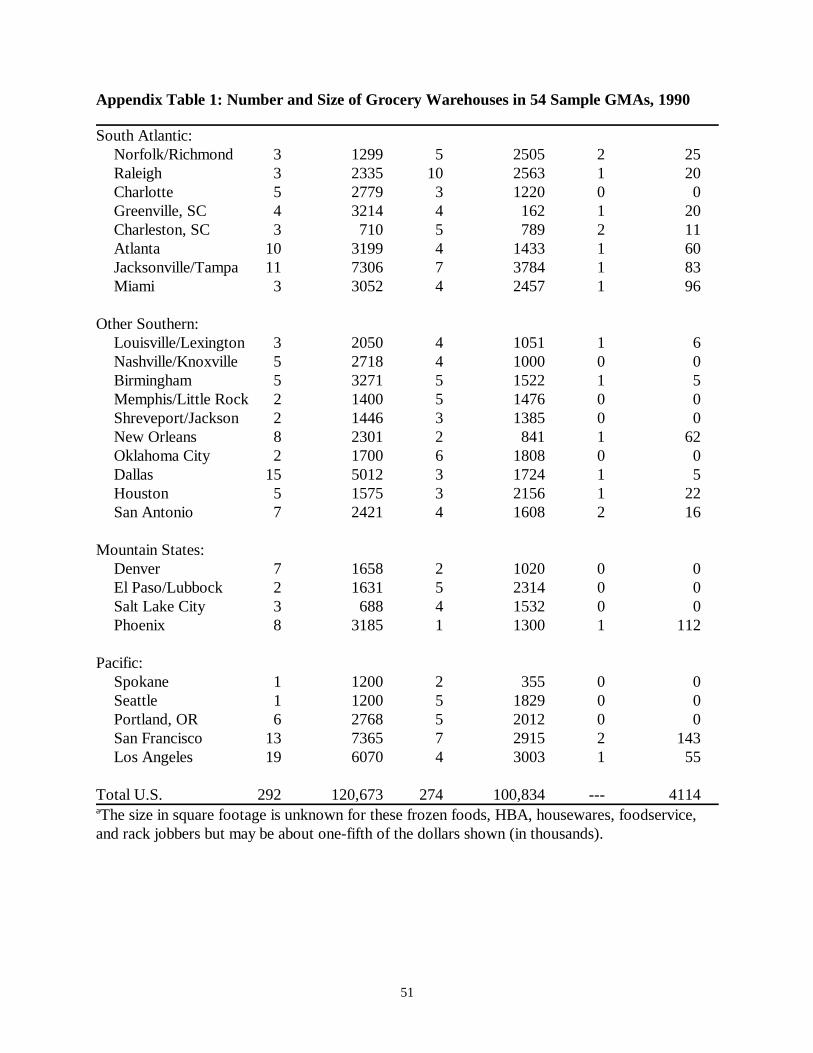
Appendix Table 1: Number and Size of Grocery Warehouses in 54 Sample GMAs, 1990
51
South Atlantic:Norfolk/Richmond 3 1299 5 2505 2 25Raleigh 3 2335 10 2563 1 20Charlotte 5 2779 3 1220 0 0Greenville, SC 4 3214 4 162 1 20Charleston, SC 3 710 5 789 2 11Atlanta 10 3199 4 1433 1 60Jacksonville/Tampa 11 7306 7 3784 1 83Miami 3 3052 4 2457 1 96
Other Southern:Louisville/Lexington 3 2050 4 1051 1 6Nashville/Knoxville 5 2718 4 1000 0 0Birmingham 5 3271 5 1522 1 5Memphis/Little Rock 2 1400 5 1476 0 0Shreveport/Jackson 2 1446 3 1385 0 0New Orleans 8 2301 2 841 1 62Oklahoma City 2 1700 6 1808 0 0Dallas 15 5012 3 1724 1 5Houston 5 1575 3 2156 1 22San Antonio 7 2421 4 1608 2 16
Mountain States:Denver 7 1658 2 1020 0 0El Paso/Lubbock 2 1631 5 2314 0 0Salt Lake City 3 688 4 1532 0 0Phoenix 8 3185 1 1300 1 112
Pacific:Spokane 1 1200 2 355 0 0Seattle 1 1200 5 1829 0 0Portland, OR 6 2768 5 2012 0 0San Francisco 13 7365 7 2915 2 143Los Angeles 19 6070 4 3003 1 55
Total U.S. 292 120,673 274 100,834 --- 4114The size in square footage is unknown for these frozen foods, HBA, housewares, foodservice,a
and rack jobbers but may be about one-fifth of the dollars shown (in thousands).
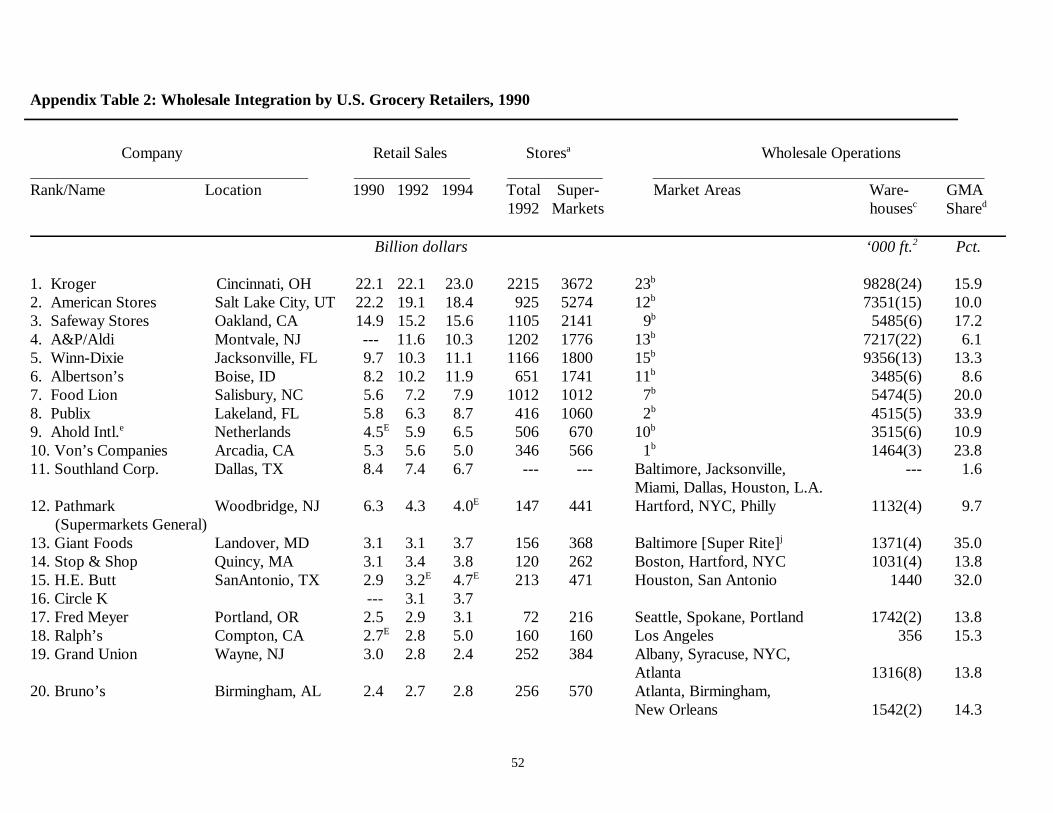
Appendix Table 2: Wholesale Integration by U.S. Grocery Retailers, 1990
52
Company Retail Sales Stores Wholesale Operations a
Rank/Name Location 1990 1992 1994 Total Super- Market Areas Ware- GMA 1992 Markets houses Share c d
Billion dollars ‘000 ft. Pct.2
1. Kroger Cincinnati, OH 22.1 22.1 23.0 2215 3672 23 9828(24) 15.9b
2. American Stores Salt Lake City, UT 22.2 19.1 18.4 925 5274 12 7351(15) 10.0b
3. Safeway Stores Oakland, CA 14.9 15.2 15.6 1105 2141 9 5485(6) 17.2b
4. A&P/Aldi Montvale, NJ --- 11.6 10.3 1202 1776 13 7217(22) 6.1b
5. Winn-Dixie Jacksonville, FL 9.7 10.3 11.1 1166 1800 15 9356(13) 13.3b
6. Albertson’s Boise, ID 8.2 10.2 11.9 651 1741 11 3485(6) 8.6b
7. Food Lion Salisbury, NC 5.6 7.2 7.9 1012 1012 7 5474(5) 20.0b
8. Publix Lakeland, FL 5.8 6.3 8.7 416 1060 2 4515(5) 33.9b
9. Ahold Intl. Netherlands 4.5 5.9 6.5 506 670 10 3515(6) 10.9e E b
10. Von’s Companies Arcadia, CA 5.3 5.6 5.0 346 566 1 1464(3) 23.8b
11. Southland Corp. Dallas, TX 8.4 7.4 6.7 --- --- Baltimore, Jacksonville, --- 1.6Miami, Dallas, Houston, L.A.
12. Pathmark Woodbridge, NJ 6.3 4.3 4.0 147 441 Hartford, NYC, Philly 1132(4) 9.7E
(Supermarkets General)13. Giant Foods Landover, MD 3.1 3.1 3.7 156 368 Baltimore [Super Rite] 1371(4) 35.0j
14. Stop & Shop Quincy, MA 3.1 3.4 3.8 120 262 Boston, Hartford, NYC 1031(4) 13.815. H.E. Butt SanAntonio, TX 2.9 3.2 4.7 213 471 Houston, San Antonio 1440 32.0E E
16. Circle K --- 3.1 3.717. Fred Meyer Portland, OR 2.5 2.9 3.1 72 216 Seattle, Spokane, Portland 1742(2) 13.818. Ralph’s Compton, CA 2.7 2.8 5.0 160 160 Los Angeles 356 15.3E
19. Grand Union Wayne, NJ 3.0 2.8 2.4 252 384 Albany, Syracuse, NYC, Atlanta 1316(8) 13.8
20. Bruno’s Birmingham, AL 2.4 2.7 2.8 256 570 Atlanta, Birmingham, New Orleans 1542(2) 14.3
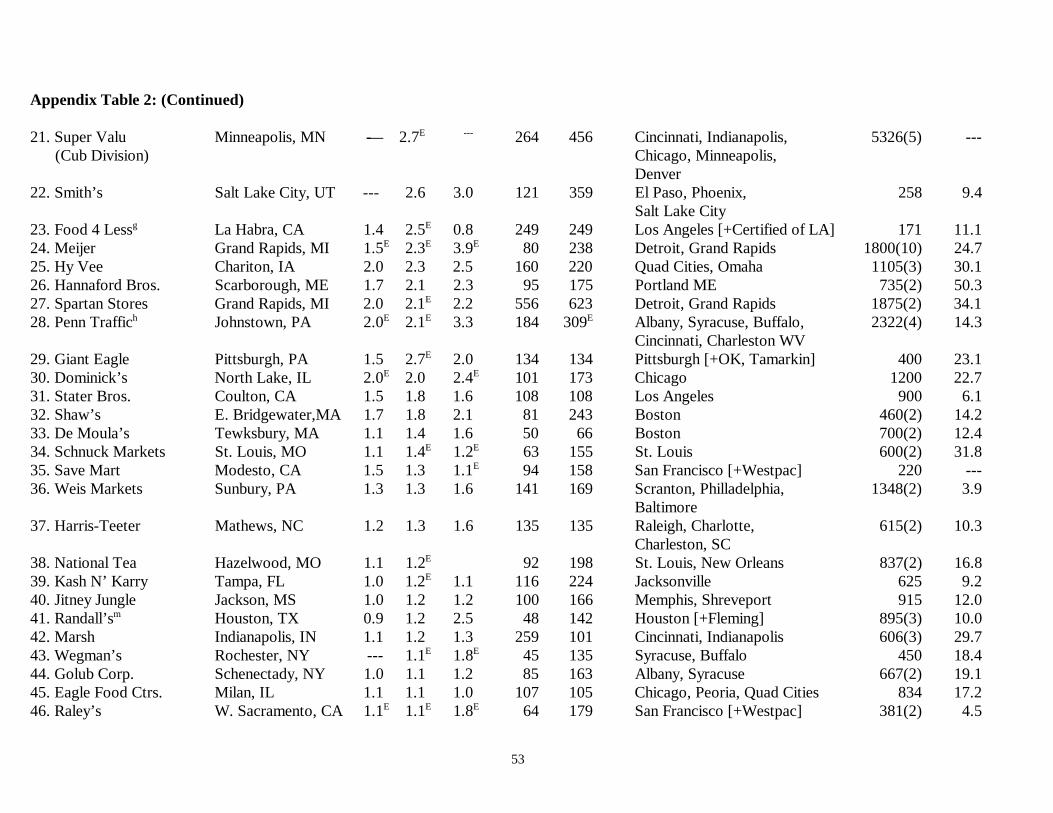
53
Appendix Table 2: (Continued)
21. Super Valu Minneapolis, MN -— 2.7 264 456 Cincinnati, Indianapolis, 5326(5) ---E ---
(Cub Division) Chicago, Minneapolis, Denver
22. Smith’s Salt Lake City, UT --- 2.6 3.0 121 359 El Paso, Phoenix, 258 9.4Salt Lake City
23. Food 4 Less La Habra, CA 1.4 2.5 0.8 249 249 Los Angeles [+Certified of LA] 171 11.1g E
24. Meijer Grand Rapids, MI 1.5 2.3 3.9 80 238 Detroit, Grand Rapids 1800(10) 24.7E E E
25. Hy Vee Chariton, IA 2.0 2.3 2.5 160 220 Quad Cities, Omaha 1105(3) 30.126. Hannaford Bros. Scarborough, ME 1.7 2.1 2.3 95 175 Portland ME 735(2) 50.327. Spartan Stores Grand Rapids, MI 2.0 2.1 2.2 556 623 Detroit, Grand Rapids 1875(2) 34.1E
28. Penn Traffic Johnstown, PA 2.0 2.1 3.3 184 309 Albany, Syracuse, Buffalo, 2322(4) 14.3h E E E
Cincinnati, Charleston WV29. Giant Eagle Pittsburgh, PA 1.5 2.7 2.0 134 134 Pittsburgh [+OK, Tamarkin] 400 23.1E
30. Dominick’s North Lake, IL 2.0 2.0 2.4 101 173 Chicago 1200 22.7E E
31. Stater Bros. Coulton, CA 1.5 1.8 1.6 108 108 Los Angeles 900 6.132. Shaw’s E. Bridgewater,MA 1.7 1.8 2.1 81 243 Boston 460(2) 14.233. De Moula’s Tewksbury, MA 1.1 1.4 1.6 50 66 Boston 700(2) 12.434. Schnuck Markets St. Louis, MO 1.1 1.4 1.2 63 155 St. Louis 600(2) 31.8E E
35. Save Mart Modesto, CA 1.5 1.3 1.1 94 158 San Francisco [+Westpac] 220 ---E
36. Weis Markets Sunbury, PA 1.3 1.3 1.6 141 169 Scranton, Philladelphia, 1348(2) 3.9Baltimore
37. Harris-Teeter Mathews, NC 1.2 1.3 1.6 135 135 Raleigh, Charlotte, 615(2) 10.3Charleston, SC
38. National Tea Hazelwood, MO 1.1 1.2 92 198 St. Louis, New Orleans 837(2) 16.8E
39. Kash N’ Karry Tampa, FL 1.0 1.2 1.1 116 224 Jacksonville 625 9.2E
40. Jitney Jungle Jackson, MS 1.0 1.2 1.2 100 166 Memphis, Shreveport 915 12.041. Randall’s Houston, TX 0.9 1.2 2.5 48 142 Houston [+Fleming] 895(3) 10.0m
42. Marsh Indianapolis, IN 1.1 1.2 1.3 259 101 Cincinnati, Indianapolis 606(3) 29.743. Wegman’s Rochester, NY --- 1.1 1.8 45 135 Syracuse, Buffalo 450 18.4E E
44. Golub Corp. Schenectady, NY 1.0 1.1 1.2 85 163 Albany, Syracuse 667(2) 19.145. Eagle Food Ctrs. Milan, IL 1.1 1.1 1.0 107 105 Chicago, Peoria, Quad Cities 834 17.246. Raley’s W. Sacramento, CA 1.1 1.1 1.8 64 179 San Francisco [+Westpac] 381(2) 4.5E E E
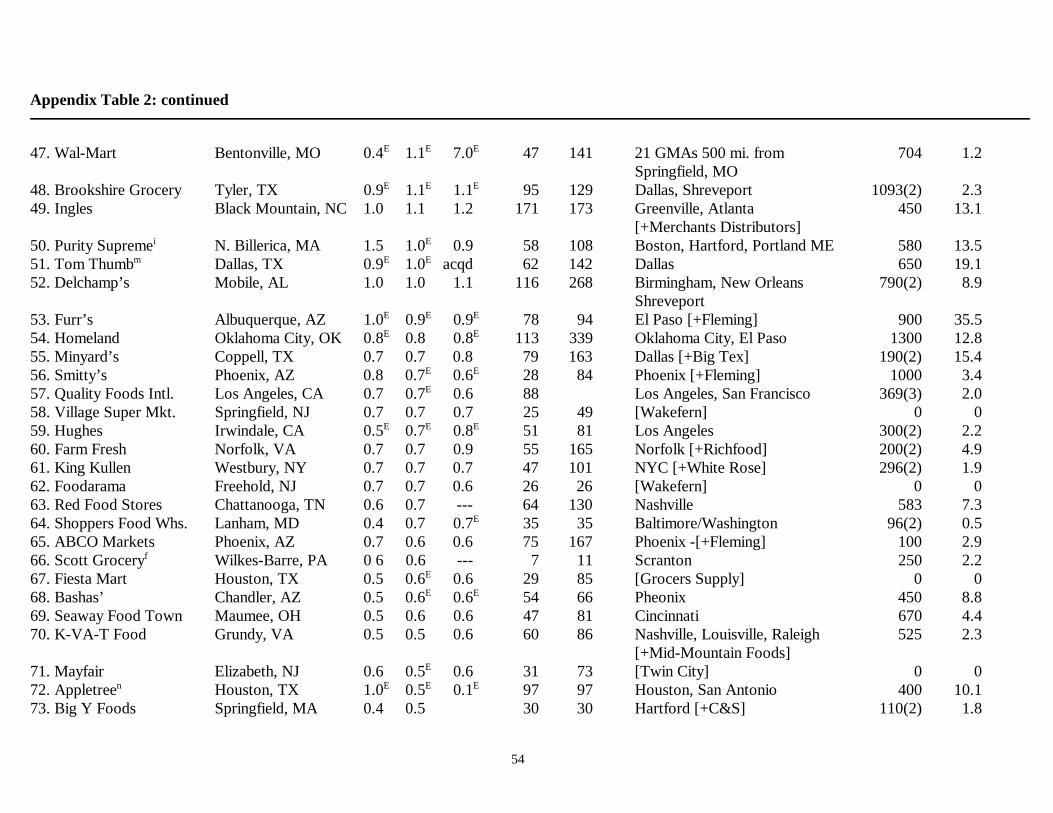
Appendix Table 2: continued
54
47. Wal-Mart Bentonville, MO 0.4 1.1 7.0 47 141 21 GMAs 500 mi. from 704 1.2E E E
Springfield, MO48. Brookshire Grocery Tyler, TX 0.9 1.1 1.1 95 129 Dallas, Shreveport 1093(2) 2.3E E E
49. Ingles Black Mountain, NC 1.0 1.1 1.2 171 173 Greenville, Atlanta 450 13.1[+Merchants Distributors]
50. Purity Supreme N. Billerica, MA 1.5 1.0 0.9 58 108 Boston, Hartford, Portland ME 580 13.5i E
51. Tom Thumb Dallas, TX 0.9 1.0 acqd 62 142 Dallas 650 19.1m E E
52. Delchamp’s Mobile, AL 1.0 1.0 1.1 116 268 Birmingham, New Orleans 790(2) 8.9Shreveport
53. Furr’s Albuquerque, AZ 1.0 0.9 0.9 78 94 El Paso [+Fleming] 900 35.5E E E
54. Homeland Oklahoma City, OK 0.8 0.8 0.8 113 339 Oklahoma City, El Paso 1300 12.8E E
55. Minyard’s Coppell, TX 0.7 0.7 0.8 79 163 Dallas [+Big Tex] 190(2) 15.456. Smitty’s Phoenix, AZ 0.8 0.7 0.6 28 84 Phoenix [+Fleming] 1000 3.4E E
57. Quality Foods Intl. Los Angeles, CA 0.7 0.7 0.6 88 Los Angeles, San Francisco 369(3) 2.0E
58. Village Super Mkt. Springfield, NJ 0.7 0.7 0.7 25 49 [Wakefern] 0 059. Hughes Irwindale, CA 0.5 0.7 0.8 51 81 Los Angeles 300(2) 2.2E E E
60. Farm Fresh Norfolk, VA 0.7 0.7 0.9 55 165 Norfolk [+Richfood] 200(2) 4.961. King Kullen Westbury, NY 0.7 0.7 0.7 47 101 NYC [+White Rose] 296(2) 1.962. Foodarama Freehold, NJ 0.7 0.7 0.6 26 26 [Wakefern] 0 063. Red Food Stores Chattanooga, TN 0.6 0.7 --- 64 130 Nashville 583 7.364. Shoppers Food Whs. Lanham, MD 0.4 0.7 0.7 35 35 Baltimore/Washington 96(2) 0.5E
65. ABCO Markets Phoenix, AZ 0.7 0.6 0.6 75 167 Phoenix -[+Fleming] 100 2.966. Scott Grocery Wilkes-Barre, PA 0 6 0.6 --- 7 11 Scranton 250 2.2f
67. Fiesta Mart Houston, TX 0.5 0.6 0.6 29 85 [Grocers Supply] 0 0E
68. Bashas’ Chandler, AZ 0.5 0.6 0.6 54 66 Pheonix 450 8.8E E
69. Seaway Food Town Maumee, OH 0.5 0.6 0.6 47 81 Cincinnati 670 4.470. K-VA-T Food Grundy, VA 0.5 0.5 0.6 60 86 Nashville, Louisville, Raleigh 525 2.3
[+Mid-Mountain Foods]71. Mayfair Elizabeth, NJ 0.6 0.5 0.6 31 73 [Twin City] 0 0E
72. Appletree Houston, TX 1.0 0.5 0.1 97 97 Houston, San Antonio 400 10.1n E E E
73. Big Y Foods Springfield, MA 0.4 0.5 30 30 Hartford [+C&S] 110(2) 1.8
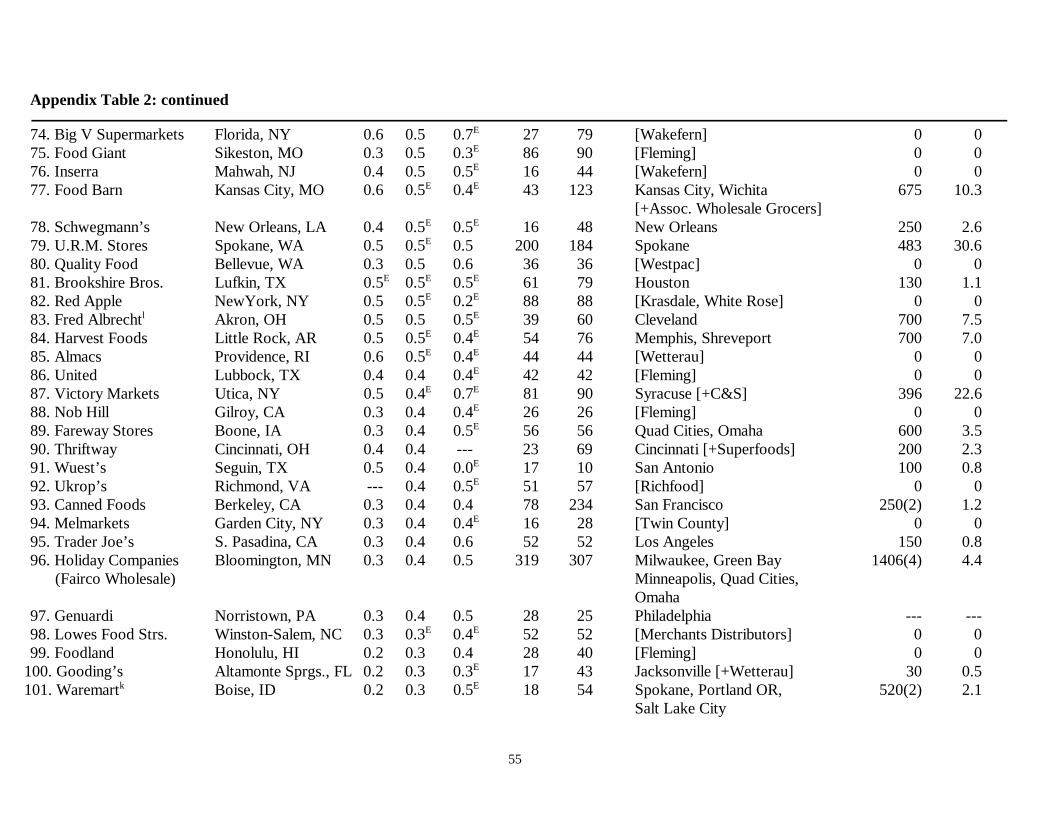
Appendix Table 2: continued
55
74. Big V Supermarkets Florida, NY 0.6 0.5 0.7 27 79 [Wakefern] 0 0E
75. Food Giant Sikeston, MO 0.3 0.5 0.3 86 90 [Fleming] 0 0E
76. Inserra Mahwah, NJ 0.4 0.5 0.5 16 44 [Wakefern] 0 0E
77. Food Barn Kansas City, MO 0.6 0.5 0.4 43 123 Kansas City, Wichita 675 10.3E E
[+Assoc. Wholesale Grocers]78. Schwegmann’s New Orleans, LA 0.4 0.5 0.5 16 48 New Orleans 250 2.6E E
79. U.R.M. Stores Spokane, WA 0.5 0.5 0.5 200 184 Spokane 483 30.6E
80. Quality Food Bellevue, WA 0.3 0.5 0.6 36 36 [Westpac] 0 081. Brookshire Bros. Lufkin, TX 0.5 0.5 0.5 61 79 Houston 130 1.1E E E
82. Red Apple NewYork, NY 0.5 0.5 0.2 88 88 [Krasdale, White Rose] 0 0E E
83. Fred Albrecht Akron, OH 0.5 0.5 0.5 39 60 Cleveland 700 7.5l E
84. Harvest Foods Little Rock, AR 0.5 0.5 0.4 54 76 Memphis, Shreveport 700 7.0E E
85. Almacs Providence, RI 0.6 0.5 0.4 44 44 [Wetterau] 0 0E E
86. United Lubbock, TX 0.4 0.4 0.4 42 42 [Fleming] 0 0E
87. Victory Markets Utica, NY 0.5 0.4 0.7 81 90 Syracuse [+C&S] 396 22.6E E
88. Nob Hill Gilroy, CA 0.3 0.4 0.4 26 26 [Fleming] 0 0E
89. Fareway Stores Boone, IA 0.3 0.4 0.5 56 56 Quad Cities, Omaha 600 3.5E
90. Thriftway Cincinnati, OH 0.4 0.4 --- 23 69 Cincinnati [+Superfoods] 200 2.391. Wuest’s Seguin, TX 0.5 0.4 0.0 17 10 San Antonio 100 0.8E
92. Ukrop’s Richmond, VA --- 0.4 0.5 51 57 [Richfood] 0 0E
93. Canned Foods Berkeley, CA 0.3 0.4 0.4 78 234 San Francisco 250(2) 1.294. Melmarkets Garden City, NY 0.3 0.4 0.4 16 28 [Twin County] 0 0E
95. Trader Joe’s S. Pasadina, CA 0.3 0.4 0.6 52 52 Los Angeles 150 0.896. Holiday Companies Bloomington, MN 0.3 0.4 0.5 319 307 Milwaukee, Green Bay 1406(4) 4.4 (Fairco Wholesale) Minneapolis, Quad Cities,
Omaha97. Genuardi Norristown, PA 0.3 0.4 0.5 28 25 Philadelphia --- ---98. Lowes Food Strs. Winston-Salem, NC 0.3 0.3 0.4 52 52 [Merchants Distributors] 0 0E E
99. Foodland Honolulu, HI 0.2 0.3 0.4 28 40 [Fleming] 0 0100. Gooding’s Altamonte Sprgs., FL 0.2 0.3 0.3 17 43 Jacksonville [+Wetterau] 30 0.5E
101. Waremart Boise, ID 0.2 0.3 0.5 18 54 Spokane, Portland OR, 520(2) 2.1k E
Salt Lake City
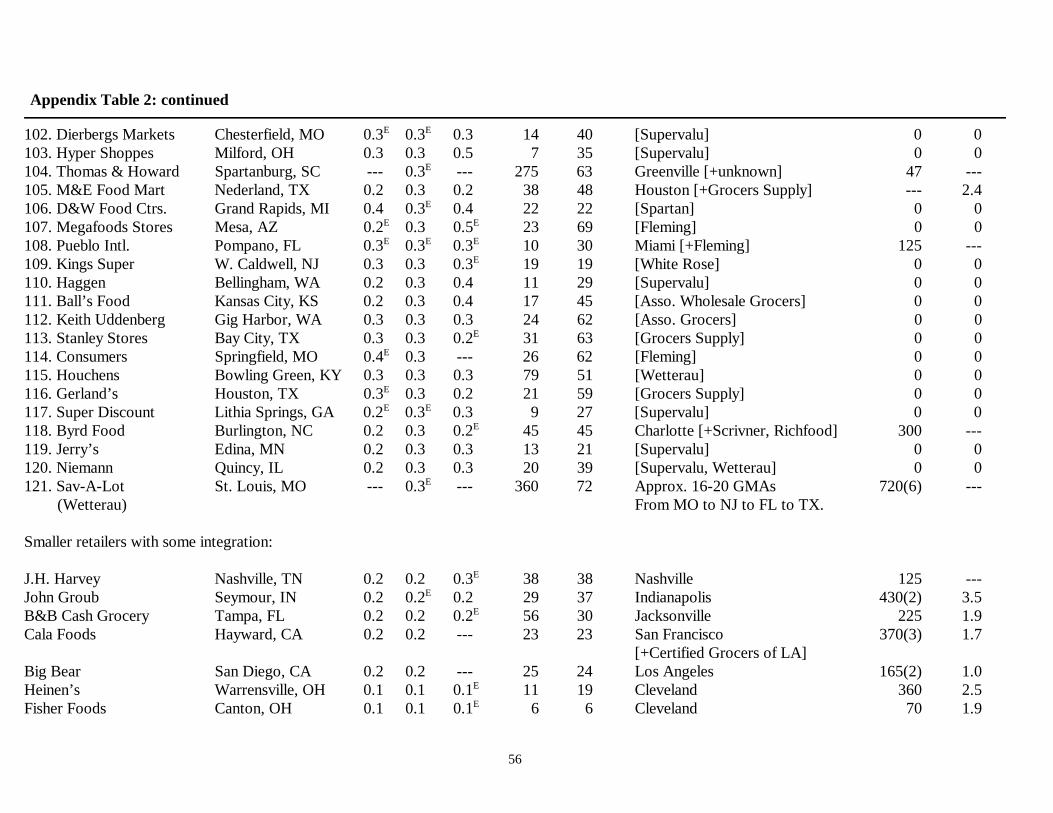
Appendix Table 2: continued
56
102. Dierbergs Markets Chesterfield, MO 0.3 0.3 0.3 14 40 [Supervalu] 0 0E E
103. Hyper Shoppes Milford, OH 0.3 0.3 0.5 7 35 [Supervalu] 0 0104. Thomas & Howard Spartanburg, SC --- 0.3 --- 275 63 Greenville [+unknown] 47 ---E
105. M&E Food Mart Nederland, TX 0.2 0.3 0.2 38 48 Houston [+Grocers Supply] --- 2.4106. D&W Food Ctrs. Grand Rapids, MI 0.4 0.3 0.4 22 22 [Spartan] 0 0E
107. Megafoods Stores Mesa, AZ 0.2 0.3 0.5 23 69 [Fleming] 0 0E E
108. Pueblo Intl. Pompano, FL 0.3 0.3 0.3 10 30 Miami [+Fleming] 125 ---E E E
109. Kings Super W. Caldwell, NJ 0.3 0.3 0.3 19 19 [White Rose] 0 0E
110. Haggen Bellingham, WA 0.2 0.3 0.4 11 29 [Supervalu] 0 0111. Ball’s Food Kansas City, KS 0.2 0.3 0.4 17 45 [Asso. Wholesale Grocers] 0 0112. Keith Uddenberg Gig Harbor, WA 0.3 0.3 0.3 24 62 [Asso. Grocers] 0 0113. Stanley Stores Bay City, TX 0.3 0.3 0.2 31 63 [Grocers Supply] 0 0E
114. Consumers Springfield, MO 0.4 0.3 --- 26 62 [Fleming] 0 0E
115. Houchens Bowling Green, KY 0.3 0.3 0.3 79 51 [Wetterau] 0 0116. Gerland’s Houston, TX 0.3 0.3 0.2 21 59 [Grocers Supply] 0 0E
117. Super Discount Lithia Springs, GA 0.2 0.3 0.3 9 27 [Supervalu] 0 0E E
118. Byrd Food Burlington, NC 0.2 0.3 0.2 45 45 Charlotte [+Scrivner, Richfood] 300 ---E
119. Jerry’s Edina, MN 0.2 0.3 0.3 13 21 [Supervalu] 0 0120. Niemann Quincy, IL 0.2 0.3 0.3 20 39 [Supervalu, Wetterau] 0 0121. Sav-A-Lot St. Louis, MO --- 0.3 --- 360 72 Approx. 16-20 GMAs 720(6) ---E
(Wetterau) From MO to NJ to FL to TX.
Smaller retailers with some integration:
J.H. Harvey Nashville, TN 0.2 0.2 0.3 38 38 Nashville 125 ---E
John Groub Seymour, IN 0.2 0.2 0.2 29 37 Indianapolis 430(2) 3.5E
B&B Cash Grocery Tampa, FL 0.2 0.2 0.2 56 30 Jacksonville 225 1.9E
Cala Foods Hayward, CA 0.2 0.2 --- 23 23 San Francisco 370(3) 1.7[+Certified Grocers of LA]
Big Bear San Diego, CA 0.2 0.2 --- 25 24 Los Angeles 165(2) 1.0Heinen’s Warrensville, OH 0.1 0.1 0.1 11 19 Cleveland 360 2.5E
Fisher Foods Canton, OH 0.1 0.1 0.1 6 6 Cleveland 70 1.9E
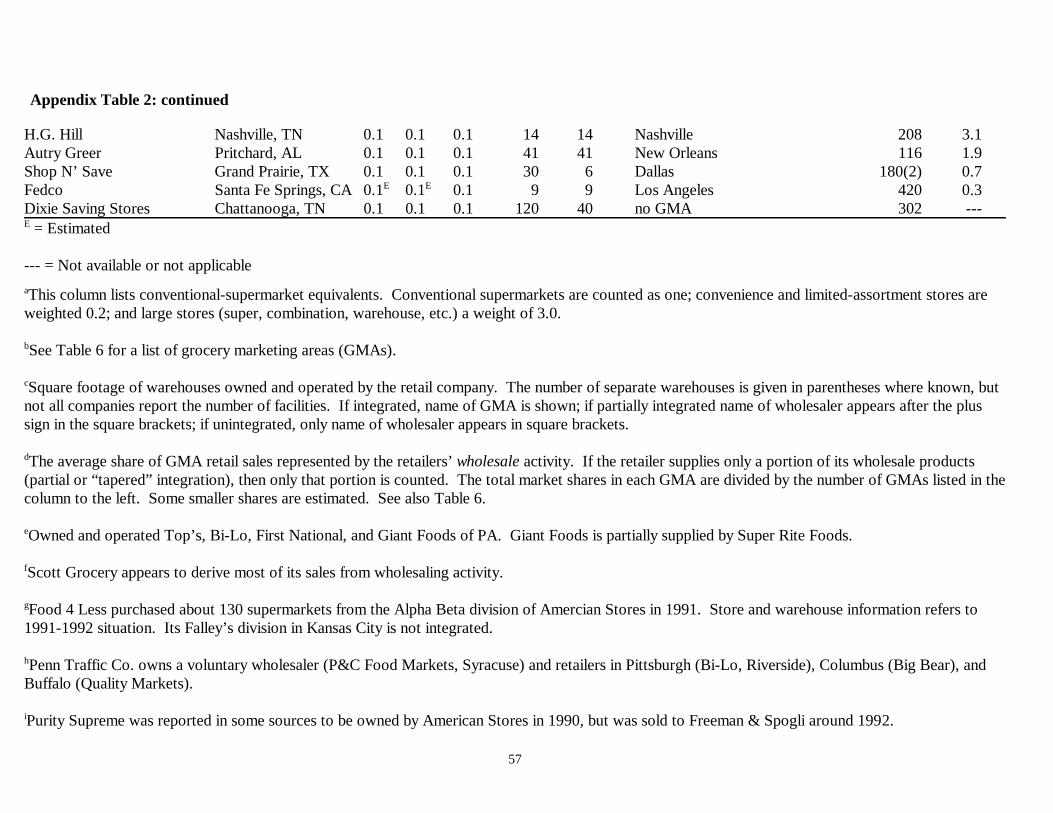
Appendix Table 2: continued
57
H.G. Hill Nashville, TN 0.1 0.1 0.1 14 14 Nashville 208 3.1Autry Greer Pritchard, AL 0.1 0.1 0.1 41 41 New Orleans 116 1.9Shop N’ Save Grand Prairie, TX 0.1 0.1 0.1 30 6 Dallas 180(2) 0.7Fedco Santa Fe Springs, CA 0.1 0.1 0.1 9 9 Los Angeles 420 0.3E E
Dixie Saving Stores Chattanooga, TN 0.1 0.1 0.1 120 40 no GMA 302 --- = EstimatedE
--- = Not available or not applicable
This column lists conventional-supermarket equivalents. Conventional supermarkets are counted as one; convenience and limited-assortment stores area
weighted 0.2; and large stores (super, combination, warehouse, etc.) a weight of 3.0.
See Table 6 for a list of grocery marketing areas (GMAs).b
Square footage of warehouses owned and operated by the retail company. The number of separate warehouses is given in parentheses where known, butc
not all companies report the number of facilities. If integrated, name of GMA is shown; if partially integrated name of wholesaler appears after the plussign in the square brackets; if unintegrated, only name of wholesaler appears in square brackets.
The average share of GMA retail sales represented by the retailers’ wholesale activity. If the retailer supplies only a portion of its wholesale productsd
(partial or “tapered” integration), then only that portion is counted. The total market shares in each GMA are divided by the number of GMAs listed in thecolumn to the left. Some smaller shares are estimated. See also Table 6.
Owned and operated Top’s, Bi-Lo, First National, and Giant Foods of PA. Giant Foods is partially supplied by Super Rite Foods.e
Scott Grocery appears to derive most of its sales from wholesaling activity.f
Food 4 Less purchased about 130 supermarkets from the Alpha Beta division of Amercian Stores in 1991. Store and warehouse information refers tog
1991-1992 situation. Its Falley’s division in Kansas City is not integrated.
Penn Traffic Co. owns a voluntary wholesaler (P&C Food Markets, Syracuse) and retailers in Pittsburgh (Bi-Lo, Riverside), Columbus (Big Bear), andh
Buffalo (Quality Markets).
Purity Supreme was reported in some sources to be owned by American Stores in 1990, but was sold to Freeman & Spogli around 1992. i
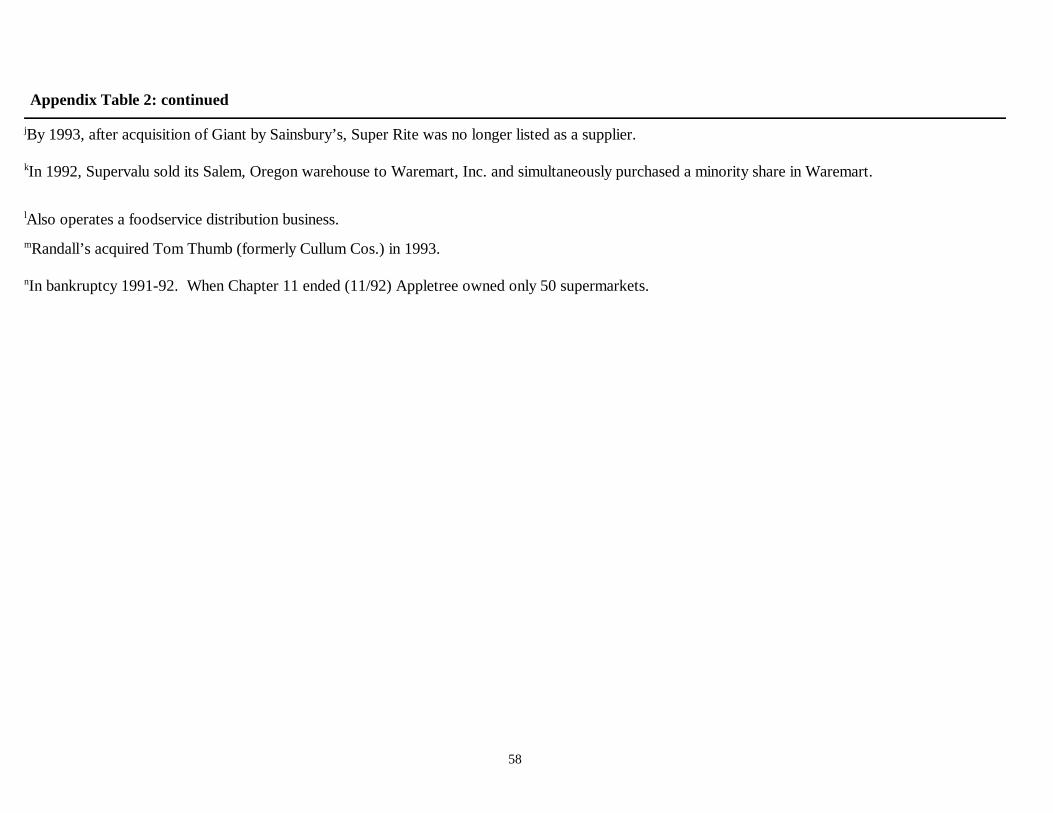
Appendix Table 2: continued
58
By 1993, after acquisition of Giant by Sainsbury’s, Super Rite was no longer listed as a supplier.j
In 1992, Supervalu sold its Salem, Oregon warehouse to Waremart, Inc. and simultaneously purchased a minority share in Waremart.k
Also operates a foodservice distribution business.l
Randall’s acquired Tom Thumb (formerly Cullum Cos.) in 1993.m
In bankruptcy 1991-92. When Chapter 11 ended (11/92) Appletree owned only 50 supermarkets.n
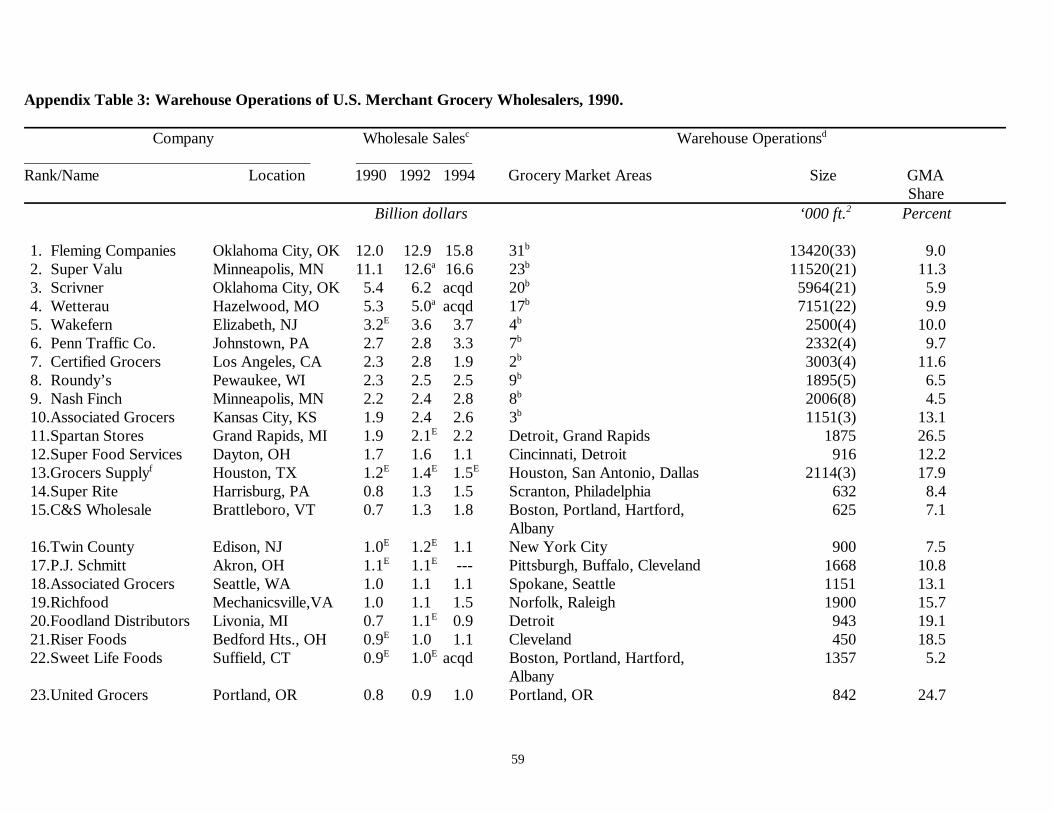
59
Appendix Table 3: Warehouse Operations of U.S. Merchant Grocery Wholesalers, 1990.
Company Wholesale Sales Warehouse Operations c d
Rank/Name Location 1990 1992 1994 Grocery Market Areas Size GMA Share Billion dollars ‘000 ft. Percent2
1. Fleming Companies Oklahoma City, OK 12.0 12.9 15.8 31 13420(33) 9.0b
2. Super Valu Minneapolis, MN 11.1 12.6 16.6 23 11520(21) 11.3a b
3. Scrivner Oklahoma City, OK 5.4 6.2 acqd 20 5964(21) 5.9b
4. Wetterau Hazelwood, MO 5.3 5.0 acqd 17 7151(22) 9.9a b
5. Wakefern Elizabeth, NJ 3.2 3.6 3.7 4 2500(4) 10.0E b
6. Penn Traffic Co. Johnstown, PA 2.7 2.8 3.3 7 2332(4) 9.7b
7. Certified Grocers Los Angeles, CA 2.3 2.8 1.9 2 3003(4) 11.6b
8. Roundy’s Pewaukee, WI 2.3 2.5 2.5 9 1895(5) 6.5b
9. Nash Finch Minneapolis, MN 2.2 2.4 2.8 8 2006(8) 4.5b
10.Associated Grocers Kansas City, KS 1.9 2.4 2.6 3 1151(3) 13.1b
11.Spartan Stores Grand Rapids, MI 1.9 2.1 2.2 Detroit, Grand Rapids 1875 26.5E
12.Super Food Services Dayton, OH 1.7 1.6 1.1 Cincinnati, Detroit 916 12.213.Grocers Supply Houston, TX 1.2 1.4 1.5 Houston, San Antonio, Dallas 2114(3) 17.9f E E E
14.Super Rite Harrisburg, PA 0.8 1.3 1.5 Scranton, Philadelphia 632 8.415.C&S Wholesale Brattleboro, VT 0.7 1.3 1.8 Boston, Portland, Hartford, 625 7.1
Albany16.Twin County Edison, NJ 1.0 1.2 1.1 New York City 900 7.5E E
17.P.J. Schmitt Akron, OH 1.1 1.1 --- Pittsburgh, Buffalo, Cleveland 1668 10.8E E
18.Associated Grocers Seattle, WA 1.0 1.1 1.1 Spokane, Seattle 1151 13.119.Richfood Mechanicsville,VA 1.0 1.1 1.5 Norfolk, Raleigh 1900 15.720.Foodland Distributors Livonia, MI 0.7 1.1 0.9 Detroit 943 19.1E
21.Riser Foods Bedford Hts., OH 0.9 1.0 1.1 Cleveland 450 18.5E
22.Sweet Life Foods Suffield, CT 0.9 1.0 acqd Boston, Portland, Hartford, 1357 5.2E E
Albany23.United Grocers Portland, OR 0.8 0.9 1.0 Portland, OR 842 24.7
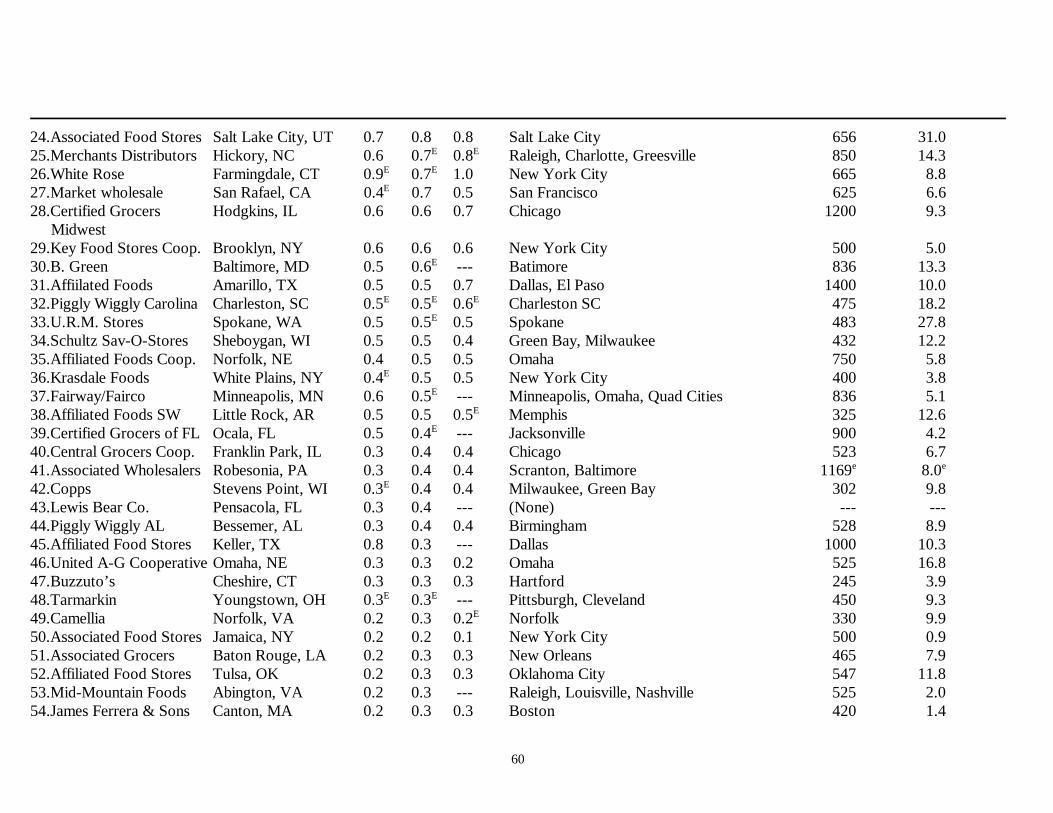
60
24.Associated Food Stores Salt Lake City, UT 0.7 0.8 0.8 Salt Lake City 656 31.025.Merchants Distributors Hickory, NC 0.6 0.7 0.8 Raleigh, Charlotte, Greesville 850 14.3E E
26.White Rose Farmingdale, CT 0.9 0.7 1.0 New York City 665 8.8E E
27.Market wholesale San Rafael, CA 0.4 0.7 0.5 San Francisco 625 6.6E
28.Certified Grocers Hodgkins, IL 0.6 0.6 0.7 Chicago 1200 9.3 Midwest29.Key Food Stores Coop. Brooklyn, NY 0.6 0.6 0.6 New York City 500 5.030.B. Green Baltimore, MD 0.5 0.6 --- Batimore 836 13.3E
31.Affiilated Foods Amarillo, TX 0.5 0.5 0.7 Dallas, El Paso 1400 10.032.Piggly Wiggly Carolina Charleston, SC 0.5 0.5 0.6 Charleston SC 475 18.2E E E
33.U.R.M. Stores Spokane, WA 0.5 0.5 0.5 Spokane 483 27.8E
34.Schultz Sav-O-Stores Sheboygan, WI 0.5 0.5 0.4 Green Bay, Milwaukee 432 12.235.Affiliated Foods Coop. Norfolk, NE 0.4 0.5 0.5 Omaha 750 5.836.Krasdale Foods White Plains, NY 0.4 0.5 0.5 New York City 400 3.8E
37.Fairway/Fairco Minneapolis, MN 0.6 0.5 --- Minneapolis, Omaha, Quad Cities 836 5.1E
38.Affiliated Foods SW Little Rock, AR 0.5 0.5 0.5 Memphis 325 12.6E
39.Certified Grocers of FL Ocala, FL 0.5 0.4 --- Jacksonville 900 4.2E
40.Central Grocers Coop. Franklin Park, IL 0.3 0.4 0.4 Chicago 523 6.741.Associated Wholesalers Robesonia, PA 0.3 0.4 0.4 Scranton, Baltimore 1169 8.0e e
42.Copps Stevens Point, WI 0.3 0.4 0.4 Milwaukee, Green Bay 302 9.8E
43.Lewis Bear Co. Pensacola, FL 0.3 0.4 --- (None) --- ---44.Piggly Wiggly AL Bessemer, AL 0.3 0.4 0.4 Birmingham 528 8.945.Affiliated Food Stores Keller, TX 0.8 0.3 --- Dallas 1000 10.346.United A-G Cooperative Omaha, NE 0.3 0.3 0.2 Omaha 525 16.847.Buzzuto’s Cheshire, CT 0.3 0.3 0.3 Hartford 245 3.948.Tarmarkin Youngstown, OH 0.3 0.3 --- Pittsburgh, Cleveland 450 9.3E E
49.Camellia Norfolk, VA 0.2 0.3 0.2 Norfolk 330 9.9E
50.Associated Food Stores Jamaica, NY 0.2 0.2 0.1 New York City 500 0.951.Associated Grocers Baton Rouge, LA 0.2 0.3 0.3 New Orleans 465 7.952.Affiliated Food Stores Tulsa, OK 0.2 0.3 0.3 Oklahoma City 547 11.853.Mid-Mountain Foods Abington, VA 0.2 0.3 --- Raleigh, Louisville, Nashville 525 2.054.James Ferrera & Sons Canton, MA 0.2 0.3 0.3 Boston 420 1.4
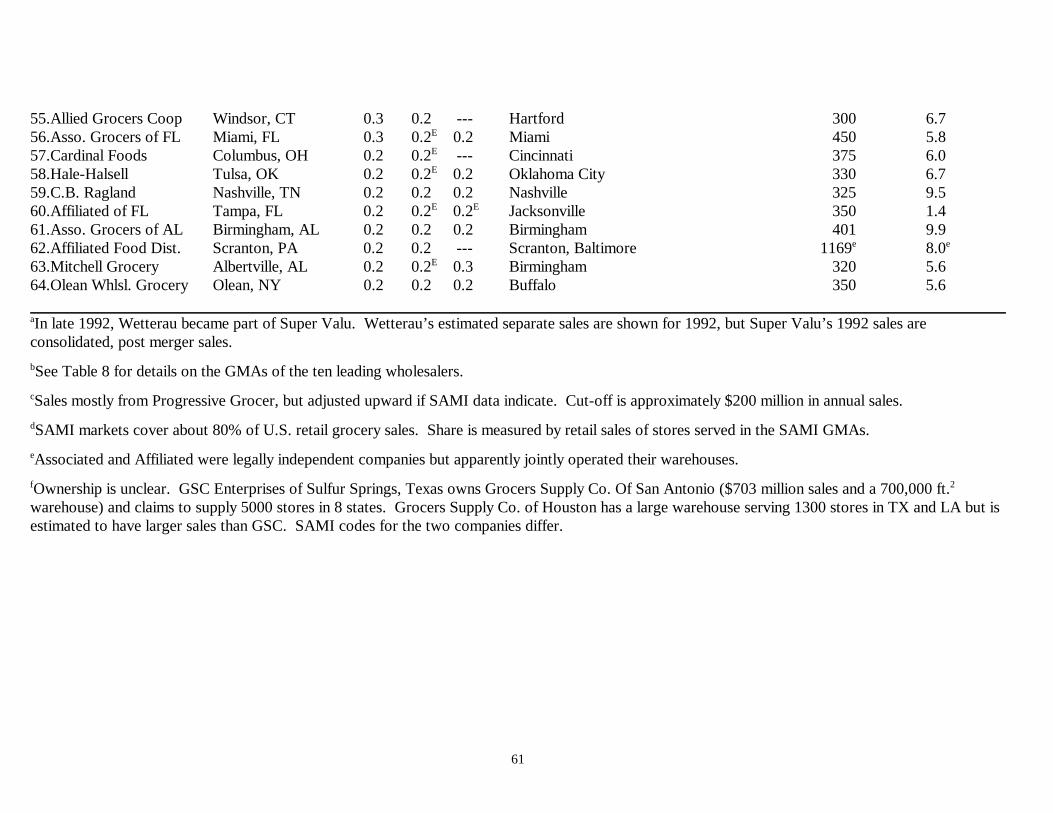
61
55.Allied Grocers Coop Windsor, CT 0.3 0.2 --- Hartford 300 6.756.Asso. Grocers of FL Miami, FL 0.3 0.2 0.2 Miami 450 5.8E
57.Cardinal Foods Columbus, OH 0.2 0.2 --- Cincinnati 375 6.0E
58.Hale-Halsell Tulsa, OK 0.2 0.2 0.2 Oklahoma City 330 6.7E
59.C.B. Ragland Nashville, TN 0.2 0.2 0.2 Nashville 325 9.560.Affiliated of FL Tampa, FL 0.2 0.2 0.2 Jacksonville 350 1.4E E
61.Asso. Grocers of AL Birmingham, AL 0.2 0.2 0.2 Birmingham 401 9.962.Affiliated Food Dist. Scranton, PA 0.2 0.2 --- Scranton, Baltimore 1169 8.0e e
63.Mitchell Grocery Albertville, AL 0.2 0.2 0.3 Birmingham 320 5.6E
64.Olean Whlsl. Grocery Olean, NY 0.2 0.2 0.2 Buffalo 350 5.6
In late 1992, Wetterau became part of Super Valu. Wetterau’s estimated separate sales are shown for 1992, but Super Valu’s 1992 sales area
consolidated, post merger sales.
See Table 8 for details on the GMAs of the ten leading wholesalers.b
Sales mostly from Progressive Grocer, but adjusted upward if SAMI data indicate. Cut-off is approximately $200 million in annual sales.c
SAMI markets cover about 80% of U.S. retail grocery sales. Share is measured by retail sales of stores served in the SAMI GMAs.d
Associated and Affiliated were legally independent companies but apparently jointly operated their warehouses.e
Ownership is unclear. GSC Enterprises of Sulfur Springs, Texas owns Grocers Supply Co. Of San Antonio ($703 million sales and a 700,000 ft.f 2
warehouse) and claims to supply 5000 stores in 8 states. Grocers Supply Co. of Houston has a large warehouse serving 1300 stores in TX and LA but isestimated to have larger sales than GSC. SAMI codes for the two companies differ.
62
APPENDIX BMAPS
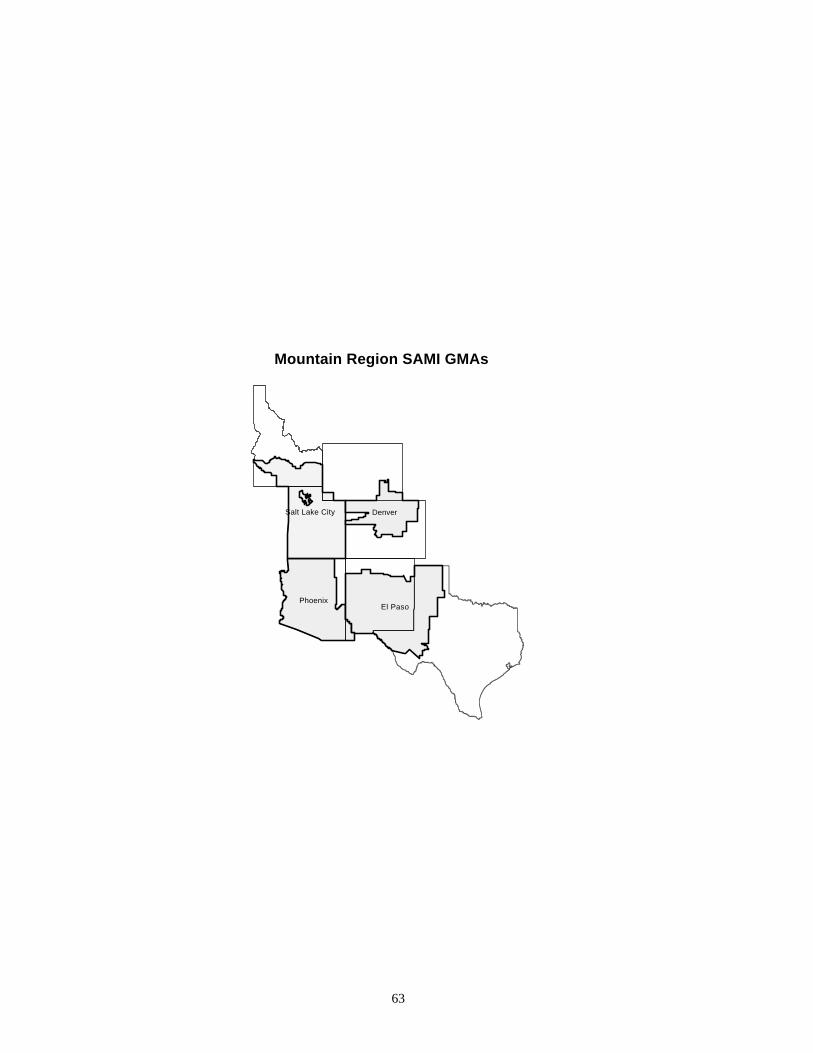
Phoenix
Salt Lake City
El Paso
Denver
Mountain Region SAMI GMAs
63
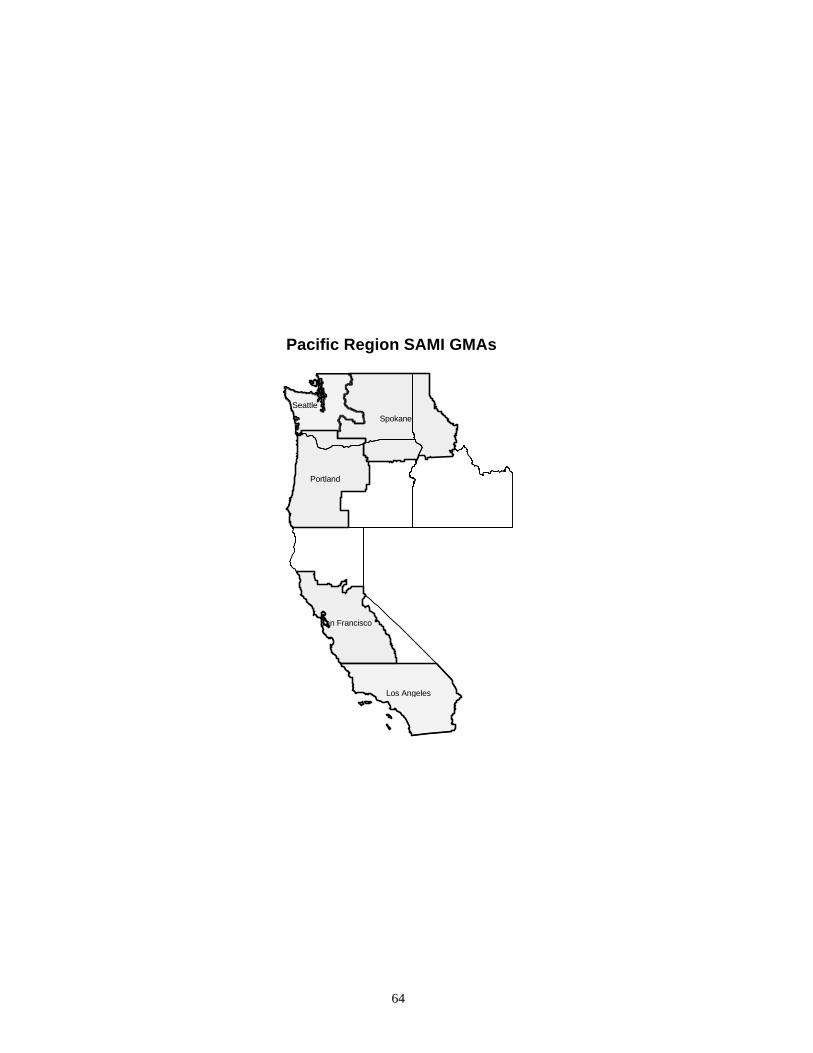
Spokane
Seattle
Portland
San Francisco
Los Angeles
Pacific Region SAMI GMAs
64
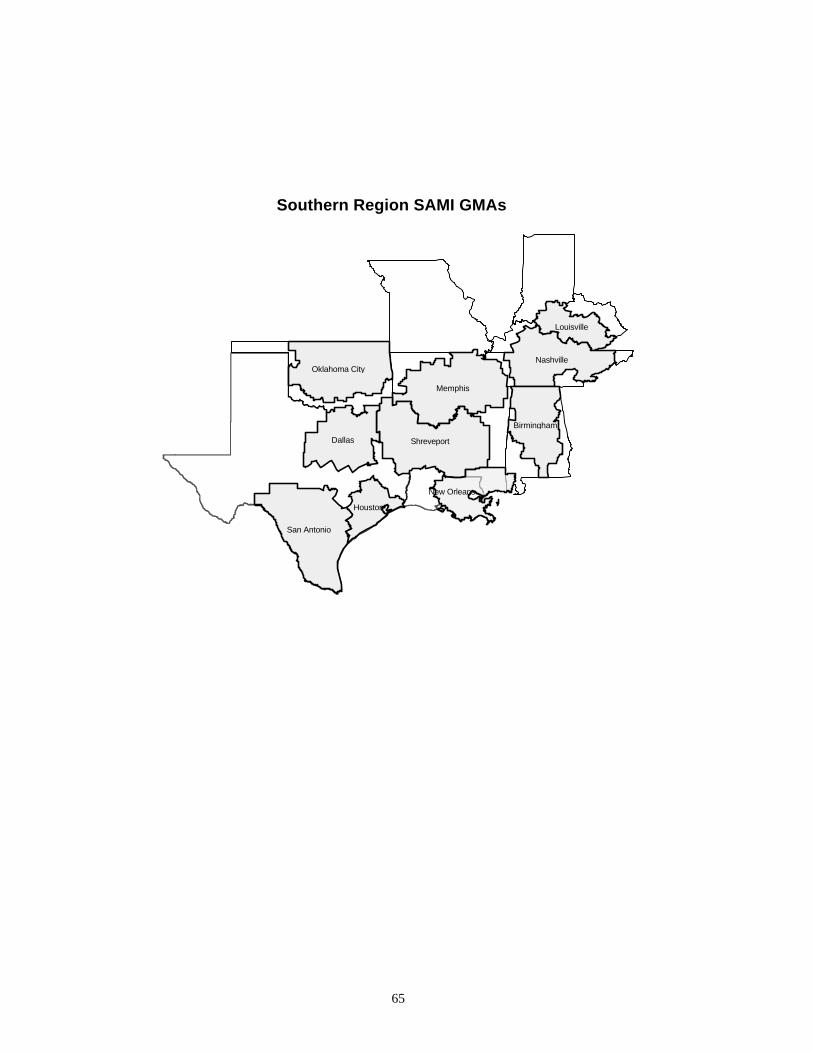
Louisville
Nashville
Memphis
ShreveportDallas
Houston
San Antonio
New Orleans
Oklahoma City
Birmingham
Southern Region SAMI GMAs
65
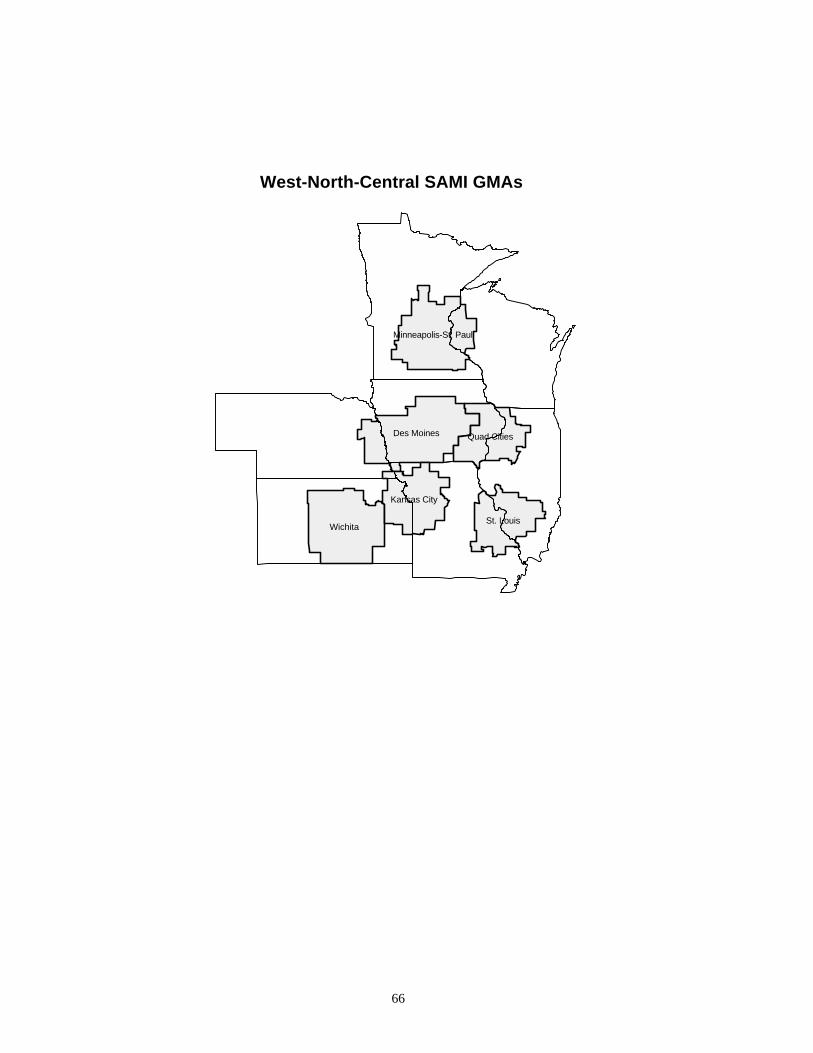
Minneapolis-St. Paul
Des Moines
Wichita
Kansas City
Quad Cities
St. Louis
West-North-Central SAMI GMAs
66
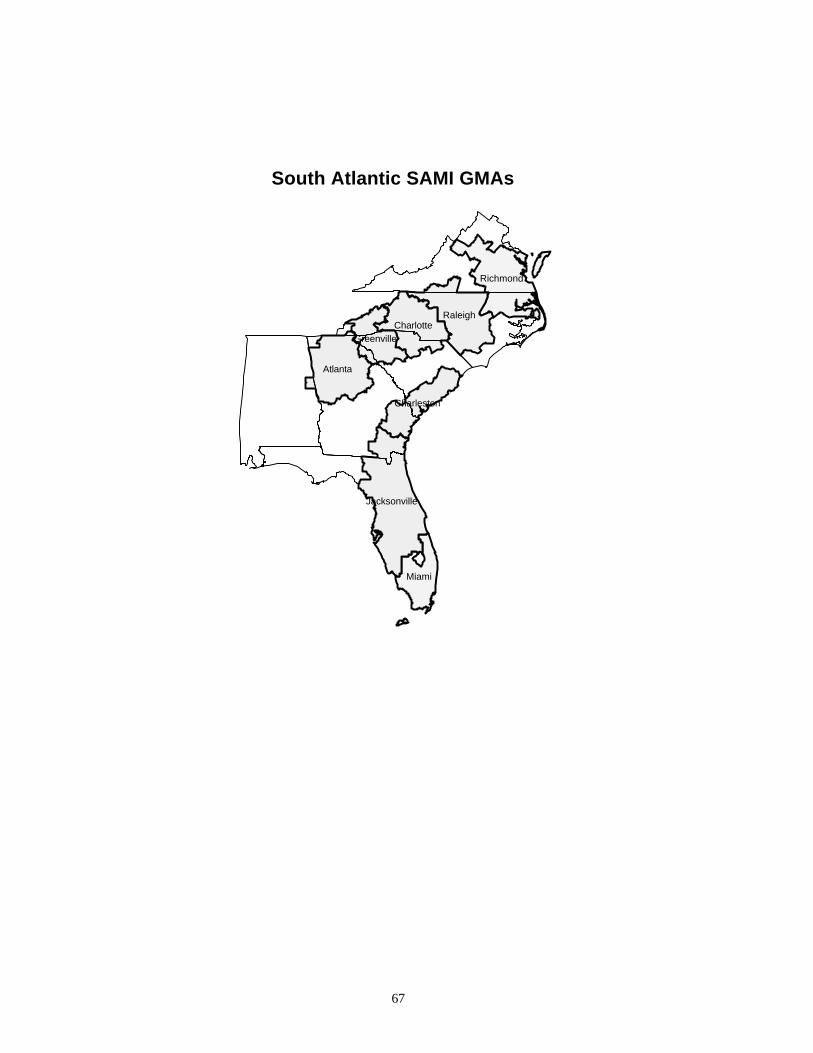
Richmond
RaleighCharlotte
Greenville
Atlanta
Charleston
Miami
Jacksonville
South Atlantic SAMI GMAs
67