Embed Size (px)
Citation preview
Concentrating Solar Power:The ‘Other’ Solar…
A Systems Perspective
Greg KolbSandia National Laboratories
November 9, [email protected]
Sandia National Laboratories is a multi-program laboratory operated by Sandia Corporation, a Lockheed Martin Company, for the United States Department of Energy under Contract DE-AC04-94AL85000
2
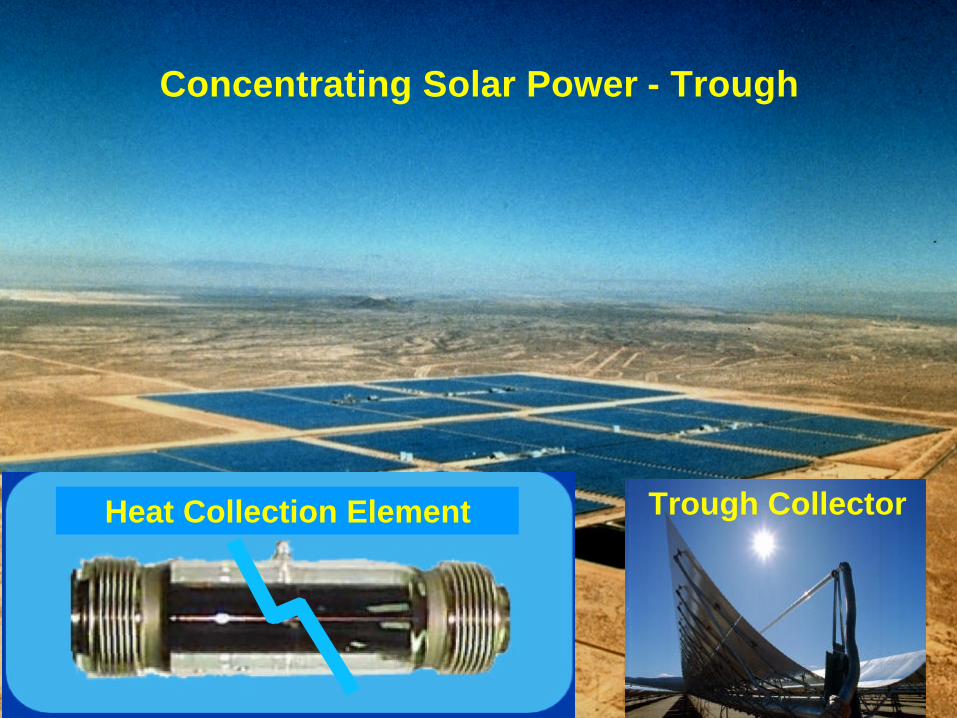
Concentrating Solar Power - Trough
Heat Collection Element Trough Collector
3
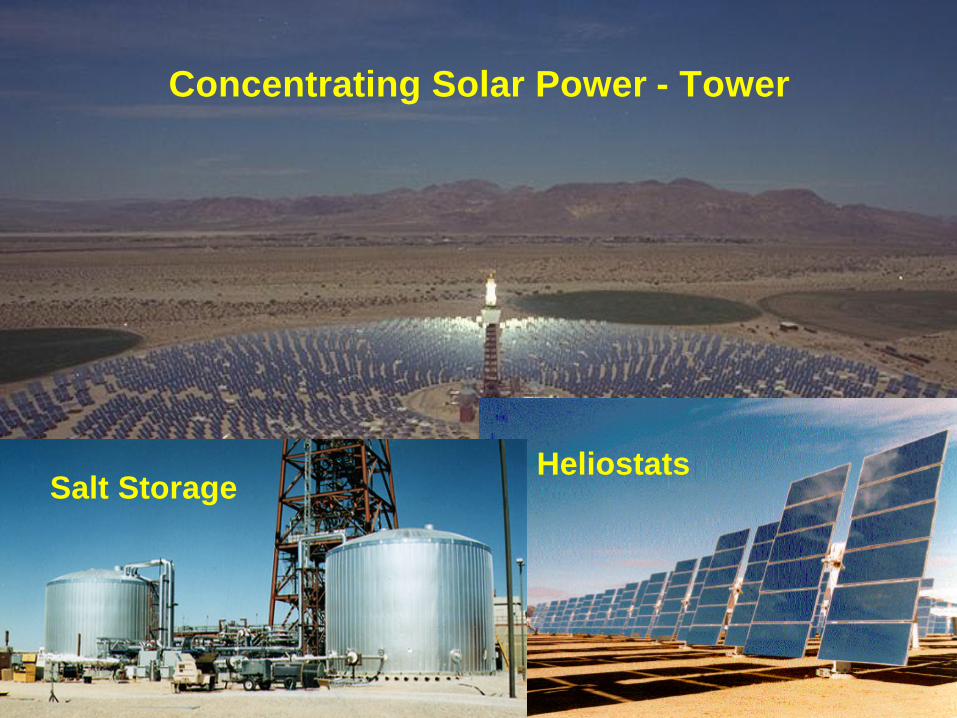
Concentrating Solar Power - Tower
HeliostatsSalt Storage
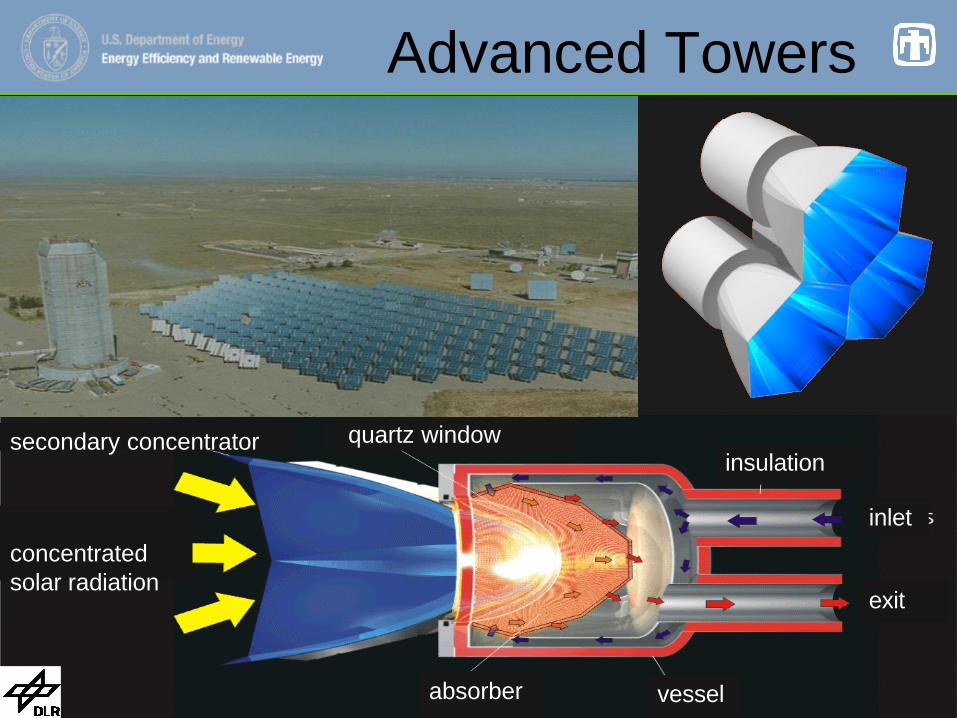
4vessel
quartz windowinsulation
inlet
exit
absorber
concentrated solar radiation
secondary concentrator
Advanced Towers
5
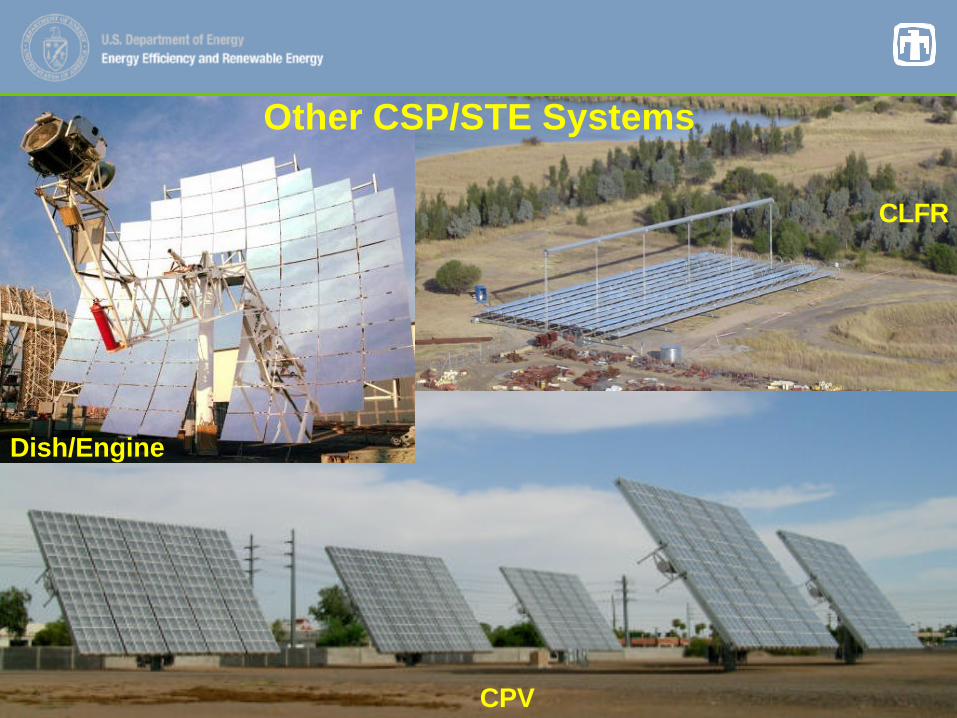
Other CSP/STE Systems
Dish/Engine
CLFR
CPV
6
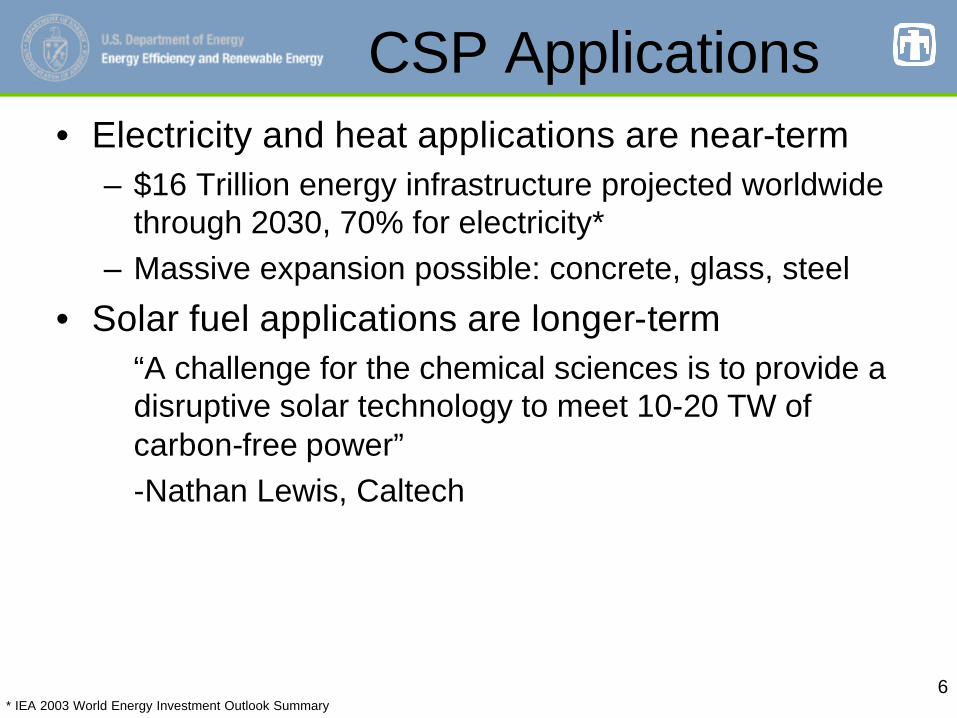
CSP Applications• Electricity and heat applications are near-term
– $16 Trillion energy infrastructure projected worldwide through 2030, 70% for electricity*
– Massive expansion possible: concrete, glass, steel
• Solar fuel applications are longer-term“A challenge for the chemical sciences is to provide a disruptive solar technology to meet 10-20 TW of carbon-free power”
-Nathan Lewis, Caltech
* IEA 2003 World Energy Investment Outlook Summary
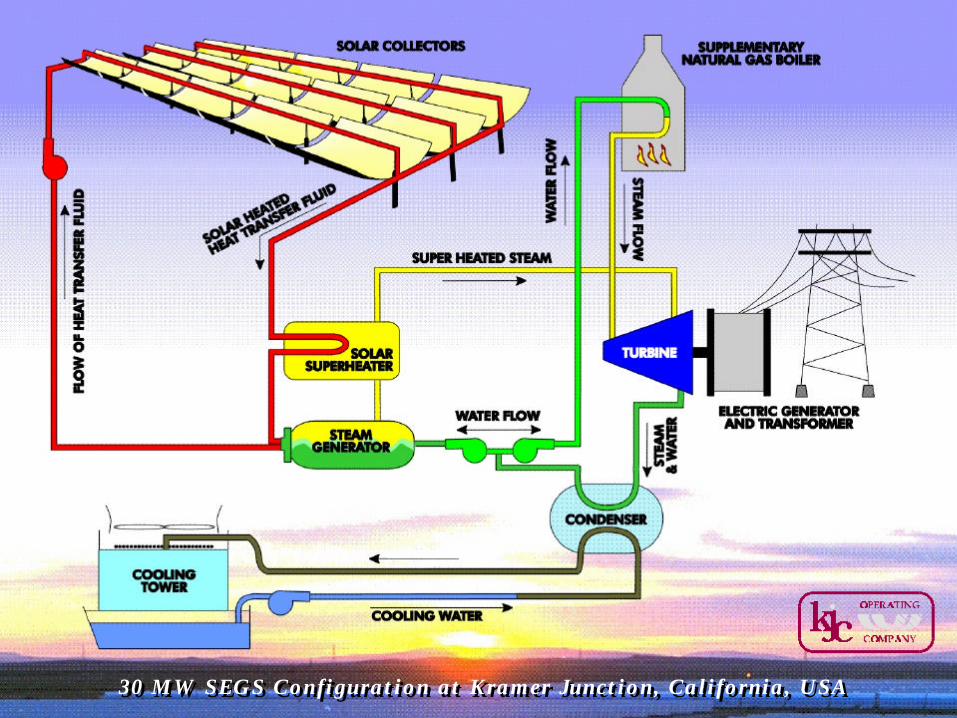
730 MW SEGS Configuration at Kramer Junction, California, USA30 MW SEGS Configuration at Kramer Junction, California, USA
8
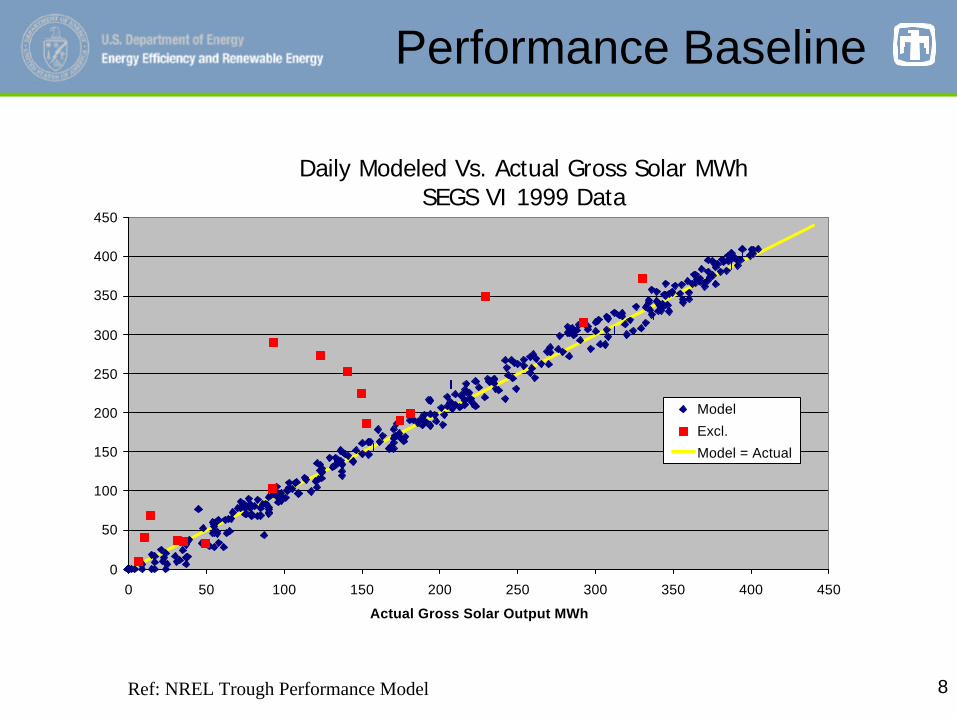
Performance Baseline
0
50
100
150
200
250
300
350
400
450
0 50 100 150 200 250 300 350 400 450
Actual Gross Solar Output MWh
Model
Excl.
Model = Actual
Daily Modeled Vs. Actual Gross Solar MWhSEGS VI 1999 Data
Ref: NREL Trough Performance Model
9
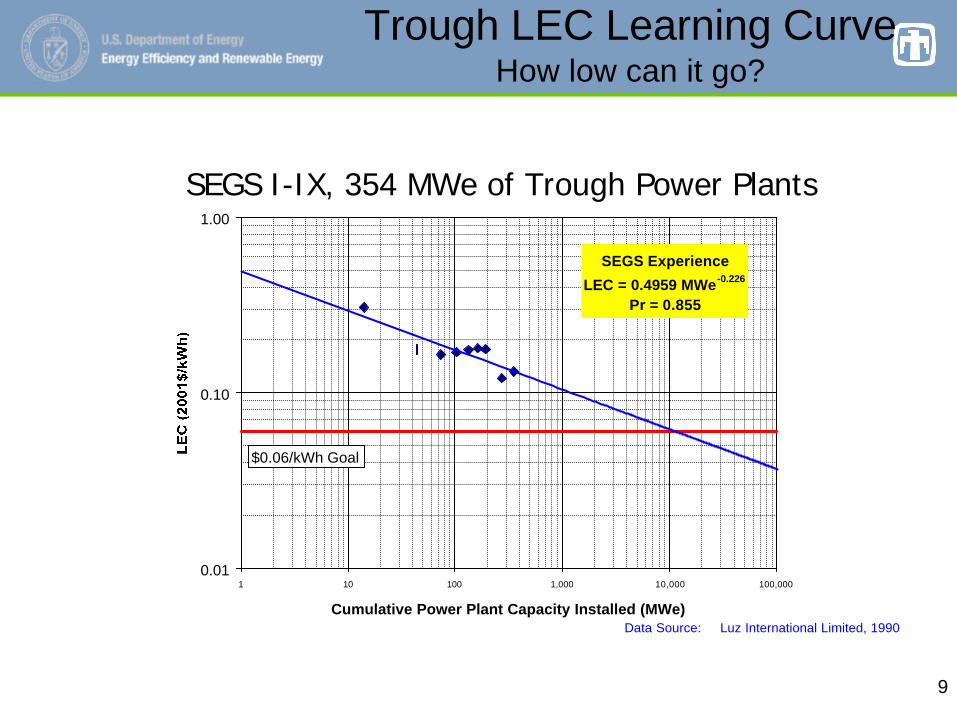
Trough LEC Learning CurveHow low can it go?
SEGS Experience
LEC = 0.4959 MWe -0.226
Pr = 0.855
0.01
0.10
1.00
1 10 100 1,000 10,000 100,000
Cumulative Power Plant Capacity Installed (MWe)
$0.06/kWh Goal
Data Source: Luz International Limited, 1990
SEGS I-IX, 354 MWe of Trough Power Plants
10
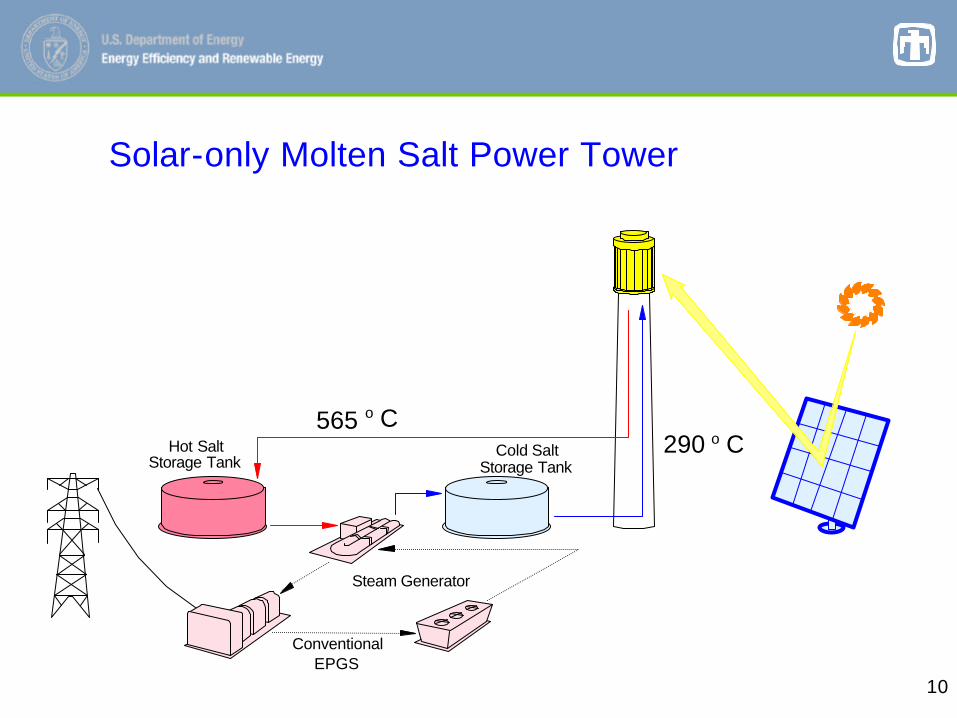
Storage TankCold Salt
Storage TankHot Salt
ConventionalEPGS
Steam Generator
o C565290 o C
Solar-only Molten Salt Power Tower
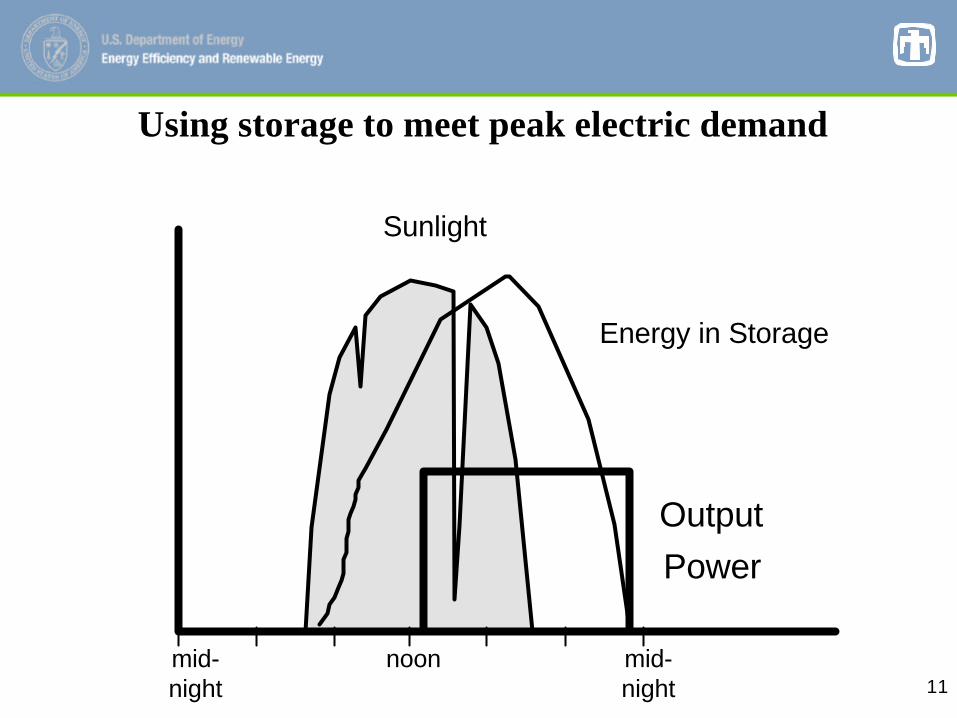
11mid-night
noon mid-night
Sunlight
Output
Power
Energy in Storage
Using storage to meet peak electric demand
12
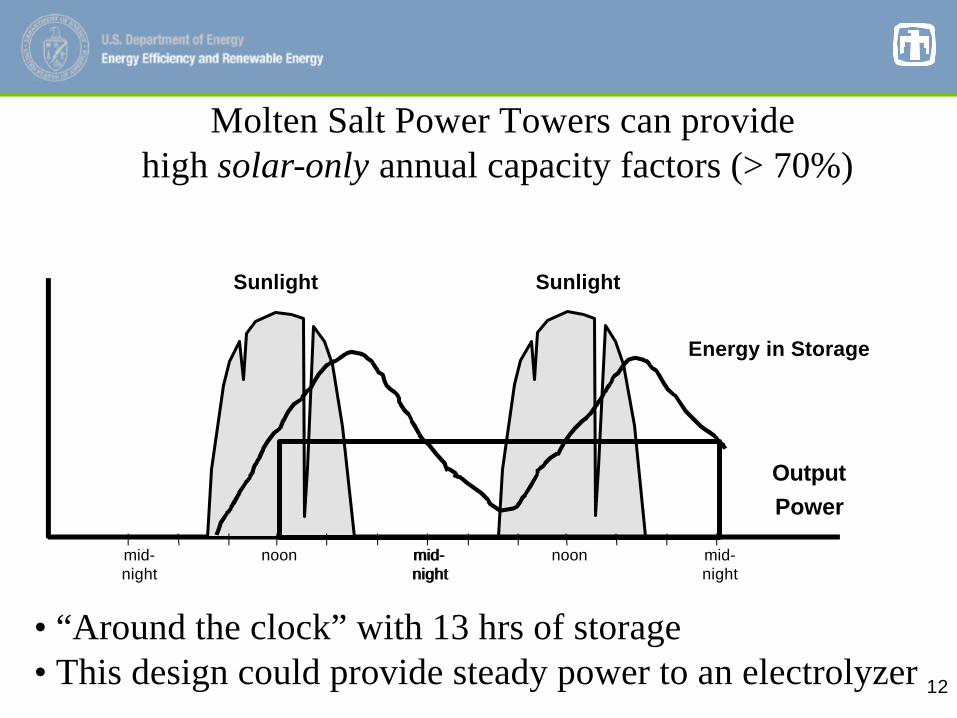
Molten Salt Power Towers can providehigh solar-only annual capacity factors (> 70%)
mid-night
noon mid-night
Output
Power
Energy in Storage
mid-night
noon mid-night
SunlightSunlight
• “Around the clock” with 13 hrs of storage• This design could provide steady power to an electrolyzer
13
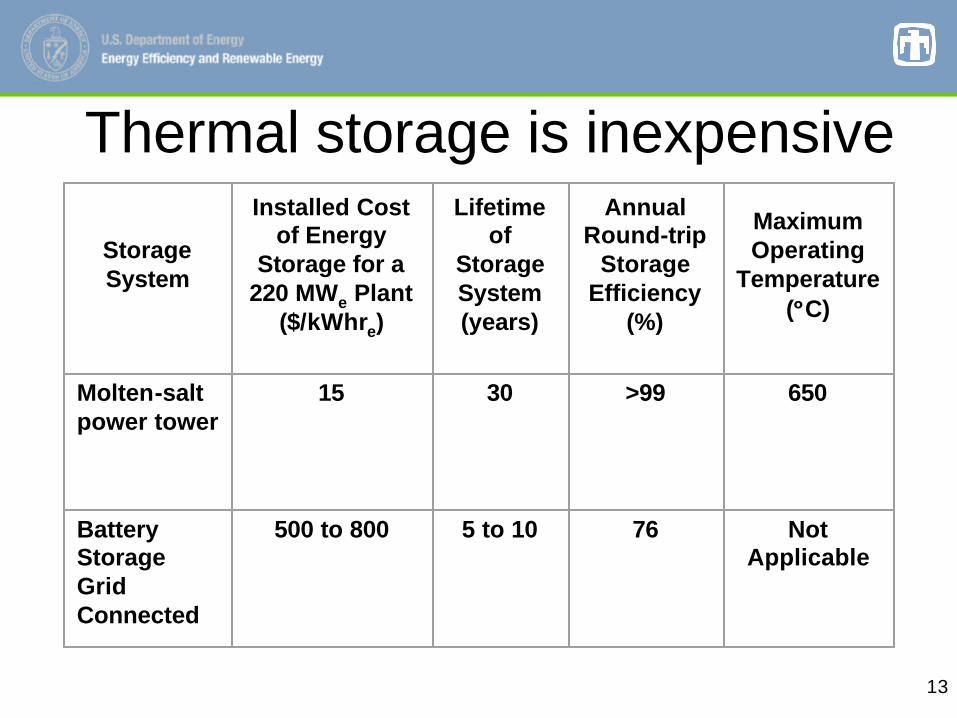
Thermal storage is inexpensive
Storage System
Installed Cost of Energy
Storage for a 220 MWe Plant
($/kWhre)
Lifetime of
Storage System (years)
Annual Round-trip
StorageEfficiency
(%)
Maximum Operating
Temperature (°°C)
Molten-salt power tower
15 30 >99 650
Battery Storage Grid Connected
500 to 800 5 to 10 76 Not Applicable
14
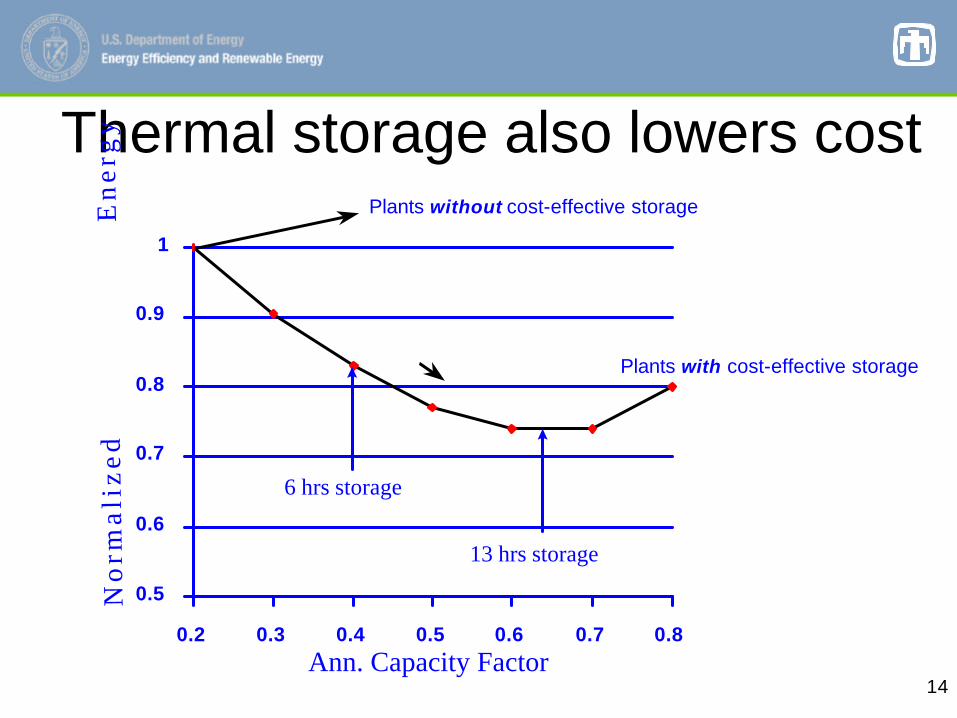
Thermal storage also lowers cost
0.5
0.6
0.7
0.8
0.9
1
0.2 0.3 0.4 0.5 0.6 0.7 0.8
Ann. Capacity Factor
No
rmal
ized
E
ner
gy
C
ost
6 hrs storage
13 hrs storage
Plants without cost-effective storage
Plants with cost-effective storage
15
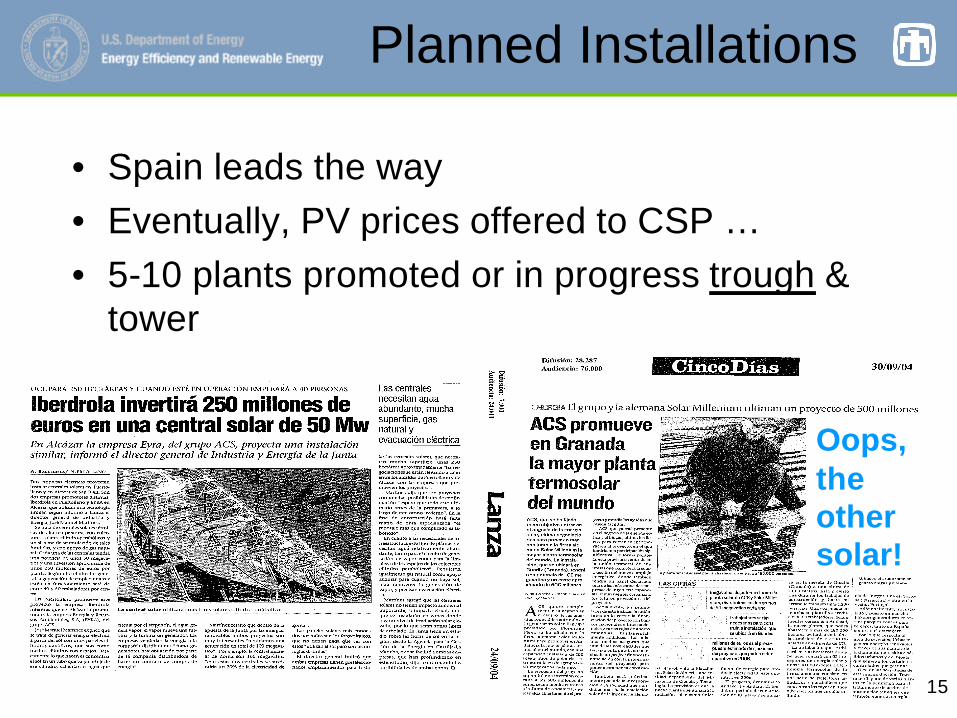
• Spain leads the way
• Eventually, PV prices offered to CSP …
• 5-10 plants promoted or in progress trough & tower
Oops, the other solar!
Planned Installations
16
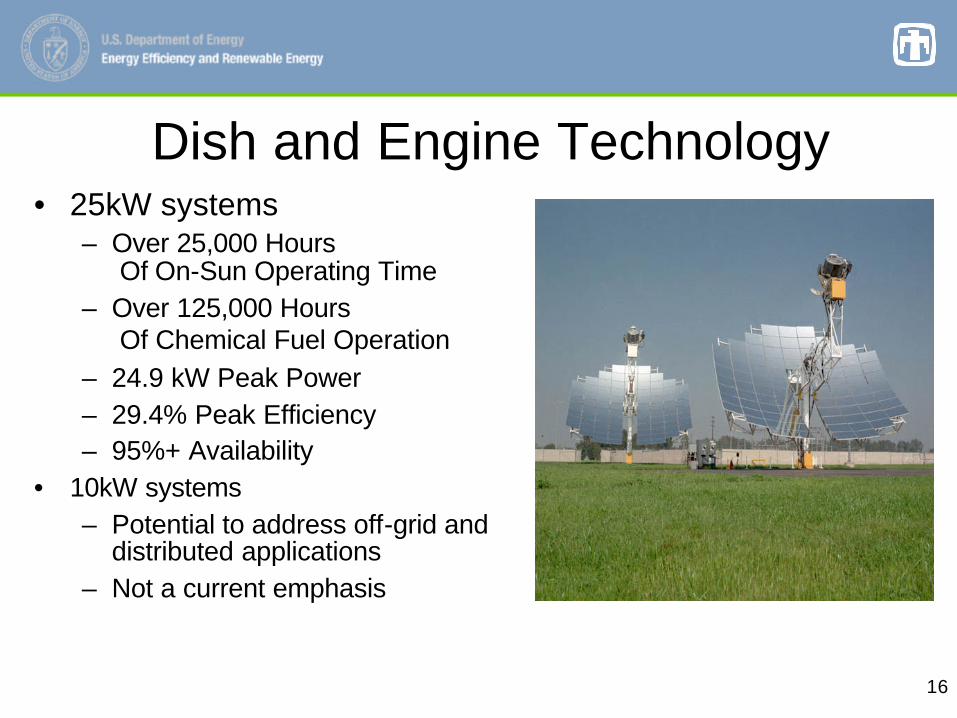
Dish and Engine Technology• 25kW systems
– Over 25,000 Hours Of On-Sun Operating Time
– Over 125,000 Hours Of Chemical Fuel Operation
– 24.9 kW Peak Power– 29.4% Peak Efficiency– 95%+ Availability
• 10kW systems– Potential to address off-grid and
distributed applications– Not a current emphasis
17
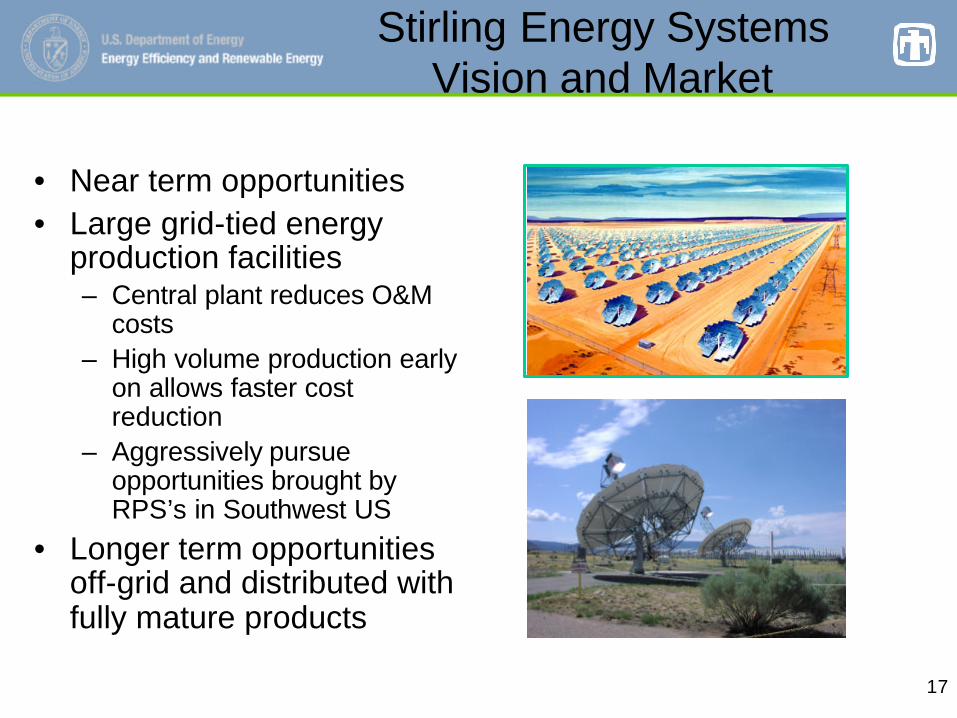
Stirling Energy Systems Vision and Market
• Near term opportunities• Large grid-tied energy
production facilities– Central plant reduces O&M
costs– High volume production early
on allows faster cost reduction
– Aggressively pursue opportunities brought by RPS’s in Southwest US
• Longer term opportunities off-grid and distributed with fully mature products
18
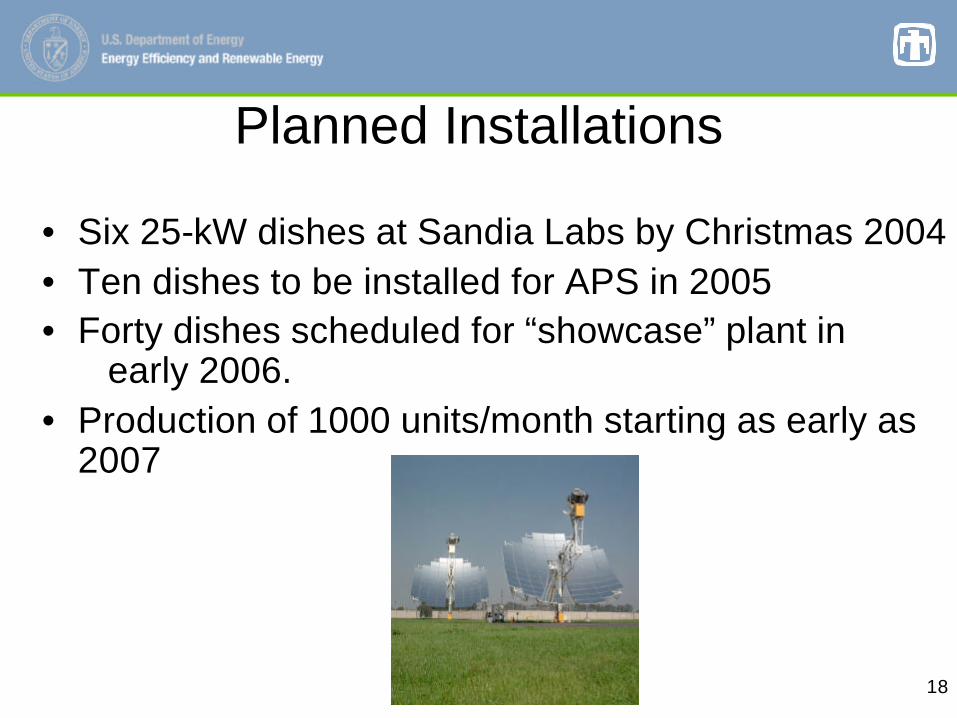
Planned Installations
• Six 25-kW dishes at Sandia Labs by Christmas 2004• Ten dishes to be installed for APS in 2005• Forty dishes scheduled for “showcase” plant in
early 2006. • Production of 1000 units/month starting as early as
2007
19
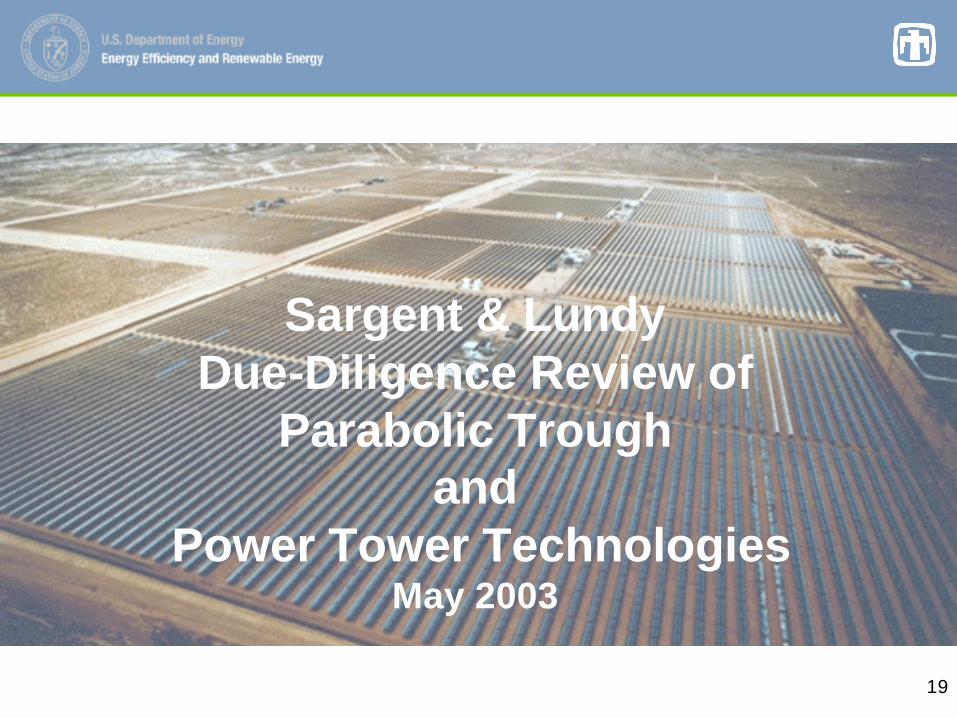
Sargent & LundyDue-Diligence Review of
Parabolic Troughand
Power Tower TechnologiesMay 2003
20
S&L Work Scope
– Examination of trough and tower baseline technology assumptions (next plant)• Relied heavily on SunLab and industry data
– Analysis of industry projections out to 2020• Evaluated scale-up, technology improvements, experience
learning
• Detailed review of cost and performance
• Assessment of R&D risk
– Assessment of the level of cost reductions likely to be achieved based on S&L experience.
– Perform a financial analysis to determine Levelized Cost of Energy (LEC)
21
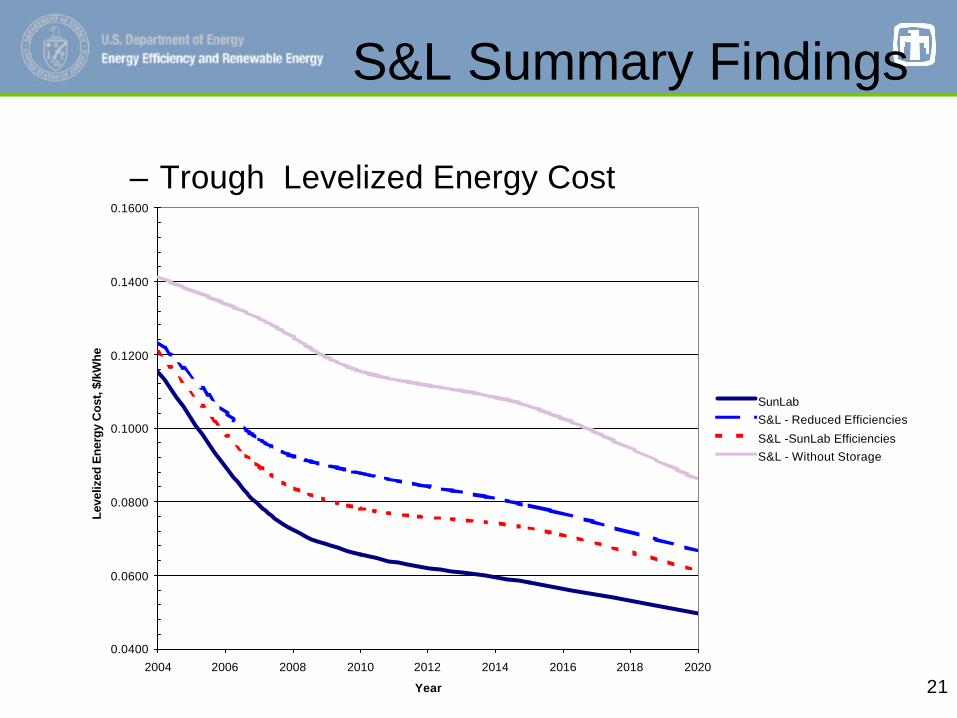
S&L Summary Findings
– Trough Levelized Energy Cost
0.0400
0.0600
0.0800
0.1000
0.1200
0.1400
0.1600
2004 2006 2008 2010 2012 2014 2016 2018 2020
Year
Lev
eliz
ed E
ner
gy
Co
st, $
/kW
he
SunLab
S&L - Reduced Efficiencies
S&L -SunLab Efficiencies
S&L - Without Storage
22
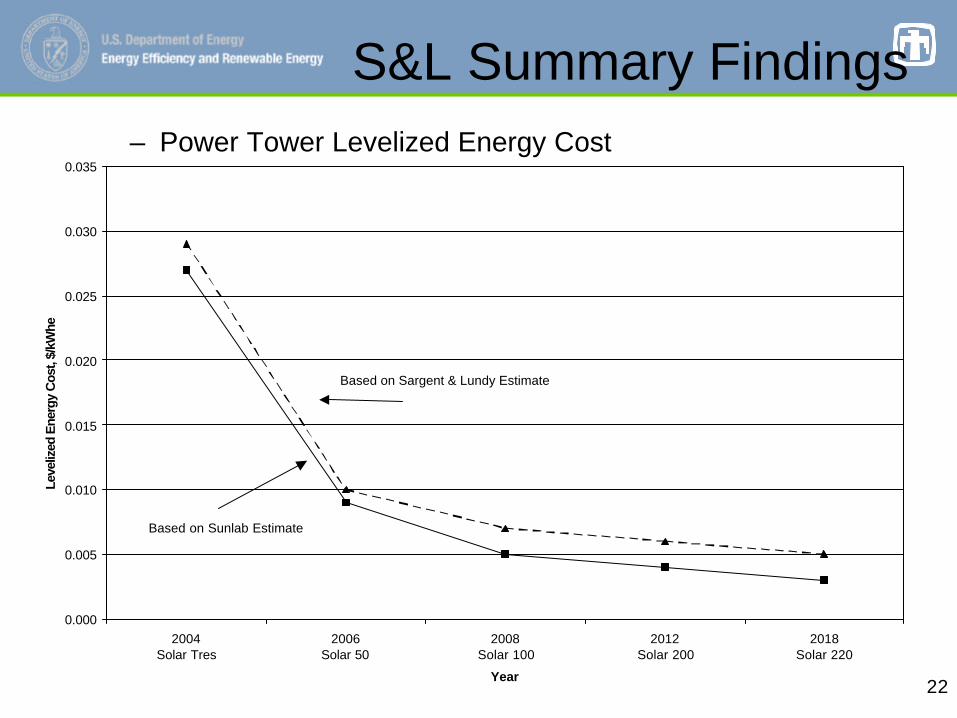
S&L Summary Findings– Power Tower Levelized Energy Cost
0.000
0.005
0.010
0.015
0.020
0.025
0.030
0.035
2004Solar Tres
2006Solar 50
2008Solar 100
2012Solar 200
2018Solar 220
Year
Leve
lized
Ene
rgy
Cos
t, $/
kWhe
Based on Sunlab Estimate
Based on Sargent & Lundy Estimate
23
S&L Conclusions
– … it is S&L’s opinion that CSP technology is a proven technology for energy production
– There is a potential market for CSP technology
– Currently CSP electricity is more expensive than conventional fossil-fueled technology.
• Early deployments will require incentives
• Significant cost reductions will be required to reach market acceptance
– Significant cost reductions are achievable assuming reasonable deployment of CSP technologies occurs
• 2 to 10 GW by year 2020
24
Concluding Remarks
• This is a Solar-H2 Workshop … how about CSP hydrogen??
• Near term – H2 via Electrolysis– Large central plants using trough, tower, and dish plants– Locate first plants in SW deserts near large population centers to
minimize transportation cost and losses• Ample good locations near Los Angeles, Phoenix, and Las Vegas
• Longer term – H2 via Thermochemical cycle– Higher solar-to-H2 efficiency– Lower levelized H2-generation cost
25
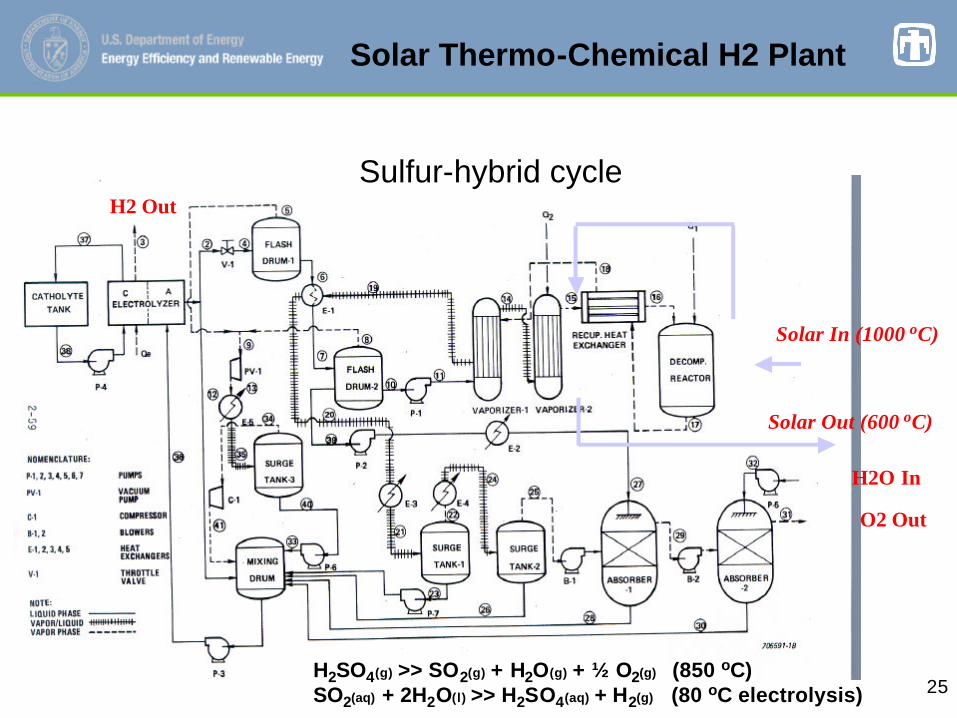
Solar In (1000 oC)
H2SO4(g) >> SO2(g) + H2O(g) + ½ O2(g) (850 oC)SO2(aq) + 2H2O(l) >> H2SO4(aq) + H2(g) (80 oC electrolysis)
H2 Out
O2 Out
H2O In
Solar Out (600 oC)
Solar Thermo-Chemical H2 Plant
Sulfur-hybrid cycle
26
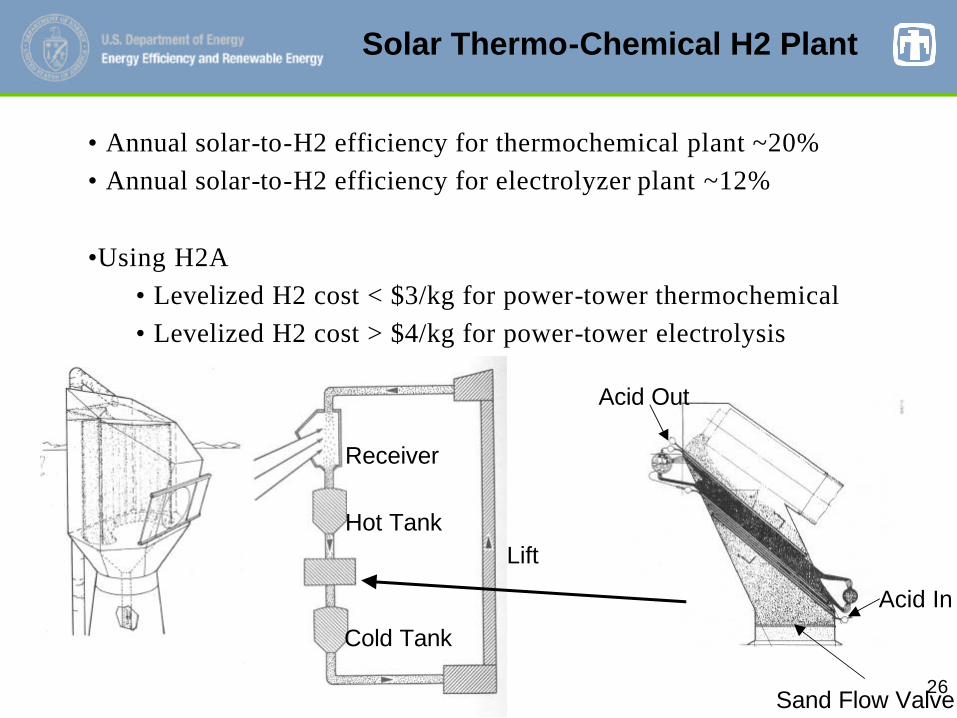
Solar Thermo-Chemical H2 Plant
Sand Flow Valve
Acid In
Acid Out
Lift
Receiver
Hot Tank
Cold Tank
• Annual solar-to-H2 efficiency for thermochemical plant ~20%
• Annual solar-to-H2 efficiency for electrolyzer plant ~12%
•Using H2A
• Levelized H2 cost < $3/kg for power-tower thermochemical
• Levelized H2 cost > $4/kg for power-tower electrolysis