Embed Size (px)
Citation preview
JOURNAL OF GEOPHYSICAL RESEARCH, VOL. ???, XXXX, DOI:10.1029/,
Confirmation of EMIC wave driven relativistic1
electron precipitation2
Aaron T. Hendry1, Craig J. Rodger
1, Mark A. Clilverd
2, Mark J.
Engebretson3, Ian R. Mann
4, Marc R. Lessard
5, Tero Raita
6, David K.
Milling4
D R A F T May 18, 2016, 5:23pm D R A F T

X - 2 HENDRY ET AL.: POES-DETECTED EMIC PRECIPITATION SURVEY
Corresponding author: Aaron Hendry, Department of Physics, Otago University, Dunedin,
New Zealand. ([email protected])
1Department of Physics, Otago
University, Dunedin, New Zealand
2British Antarctic Survey (NERC),
Cambridge, UK
3Department of Physics, Augsburg
College, Minneapolis, Minnesota, USA
4Department of Physics, University of
Alberta, Edmonton, Alberta, Canada
5Department of Physics, University of
New Hampshire, Durham, New Hampshire,
USA.
6Sodankyla Geophysical Observatory,
University of Oulu, Sodankyla, Finland
D R A F T May 18, 2016, 5:23pm D R A F T
HENDRY ET AL.: POES-DETECTED EMIC PRECIPITATION SURVEY X - 3
Abstract. Electromagnetic Ion Cyclotron Waves (EMIC) waves are be-3
lieved to be an important source of pitch-angle scattering driven relativis-4
tic electron loss from the radiation belts. To date, investigations of this pre-5
cipitation have been largely theoretical in nature, limited to calculations of6
precipitation characteristics based on wave observations and small-scale stud-7
ies. Large-scale investigation of EMIC wave-driven electron precipitation has8
been hindered by a lack of combined wave and precipitation measurements.9
Analysis of electron flux data from the POES (Polar Orbiting Environmen-10
tal Satellites) spacecraft has been suggested as a means of investigating EMIC11
wave-driven electron precipitation characteristics, using a precipitation sig-12
nature particular to EMIC waves. Until now the lack of supporting wave mea-13
surements for these POES-detected precipitation events has resulted in un-14
certainty regarding the driver of the precipitation. In this paper we complete15
a statistical study comparing POES precipitation measurements with wave16
data from several ground-based search coil magnetometers; we further present17
a case study examining the global nature of this precipitation. We show that18
a significant proportion of the precipitation events correspond with EMIC19
wave detections on the ground; for precipitation events that occur directly20
over the magnetometers, this detection rate can be as high as 90%. Our re-21
sults demonstrate that the precipitation region is often stationary in MLT,22
narrow in L, and close to the expected plasmapause position. Predominantly23
the precipitation is associated with helium-band rising tone Pc1 waves on24
D R A F T May 18, 2016, 5:23pm D R A F T

X - 4 HENDRY ET AL.: POES-DETECTED EMIC PRECIPITATION SURVEY
the ground. The success of this study proves the viability of POES precip-25
itation data for investigating EMIC wave-driven electron precipitation.26
D R A F T May 18, 2016, 5:23pm D R A F T

HENDRY ET AL.: POES-DETECTED EMIC PRECIPITATION SURVEY X - 5
1. Introduction
Electron fluxes within the radiation belts are ever-changing, reflecting the constant com-27
petition between acceleration, loss, and transport processes. Investigating the intricacies28
involved in each of these processes is essential to fully understanding the radiation belt29
environment, and how particle fluxes develop during times of increased radiation belt30
activity. In recent years there has been an increased scientific interest in electron losses31
from the radiation belts and the role these losses play in radiation belt dynamics [Friedel32
et al., 2002; Millan and Thorne, 2007]. Some of the most important drivers of radiation33
belt dynamics are wave-particle interactions, which play a role in acceleration, loss, and34
transport processes [e.g. Thorne, 2010, and sources within]. Identifying and quantify-35
ing the effects of each of these wave-particle interactions will provide a more complete36
understanding of the evolution of the radiation belts during and following geomagnetic37
storms. Electromagnetic ion-cyclotron (EMIC) waves have been identified as a potential38
driver of significant particle loss [Thorne and Kennel , 1971] and an understanding of the39
characteristics of EMIC wave-particle interactions with high energy electrons is the focus40
of this study.41
EMIC waves are Pc1-Pc2 (0.1–5 Hz) waves that are generated near the magnetic equator42
by anisotropic ring current protons [Jordanova et al., 2008], produced with increased43
frequency during and following geomagnetic storms and substorms [Fraser et al., 2010],44
as well as in association with magnetic compressions [Clausen et al., 2011; Usanova et al.,45
2012]. These waves are generated in one of three distinct frequency bands, i.e., below the46
hydrogen, helium, and oxygen ion gyrofrequencies respectively. EMIC waves have been47
D R A F T May 18, 2016, 5:23pm D R A F T
X - 6 HENDRY ET AL.: POES-DETECTED EMIC PRECIPITATION SURVEY
observed across a wide range of L-shells [e.g. Meredith et al., 2014; Usanova et al., 2012],48
with some studies suggesting preferential generation at high L-shells [e.g. Min et al., 2012;49
Usanova et al., 2012], while others suggest that generation occurs more favorably near the50
plasmapause [e.g. Horne and Thorne, 1993; Pickett et al., 2010]. Most studies of EMIC51
occurrence suggest that wave generation is focused primarily in the noon to dusk sector52
with limited numbers of events occurring elsewhere [e.g. Anderson et al., 1992; Halford53
et al., 2010; Clausen et al., 2011; Usanova et al., 2012]. Plasmaspheric plumes, located54
in the afternoon sector, have been reported as having EMIC occurrence rates ∼ 20 times55
higher than non-plume regions [Usanova et al., 2013]. However, recent studies using the56
Van Allen probes have suggested that the distribution of low-L EMIC events (L < 5) and57
He+ band EMIC events may be more uniformly distributed in MLT space [Saikin et al.,58
2015].59
EMIC waves have long been known as a source of particle loss from the radiation belts,60
through cyclotron interactions with protons [e.g. Lyons and Thorne, 1972] and relativistic61
electrons [e.g. Thorne and Kennel , 1971], scattering the particles into the loss cone. EMIC-62
driven precipitation has recently come under scrutiny as a potential source of significant63
electron losses from the radiation belts, though there is still debate regarding the energy64
ranges and magnitudes of these losses.65
The main limitation on EMIC-driven precipitation studies undertaken to date is the dif-66
ficulty involved in obtaining simultaneous wave and electron precipitation measurements.67
Determining precipitation characteristics from satellite data has typically involved either68
theoretical calculations based on wave data [e.g. Meredith et al., 2003], or on very small69
numbers of event-based coincident conjugate observations between satellites or ground-70
D R A F T May 18, 2016, 5:23pm D R A F T

HENDRY ET AL.: POES-DETECTED EMIC PRECIPITATION SURVEY X - 7
based stations [e.g. Miyoshi et al., 2008; Clilverd et al., 2015]. Ground-based observations71
benefit from near-constant measurements of wave data from multiple magnetometer chains72
world-wide, however observations of precipitation, if they exist at all, are typically lim-73
ited to model-derived values based on ionization of the upper atmosphere, which makes74
large-scale analysis difficult.75
To date there exist only limited observational studies investigating EMIC-driven elec-76
tron precipitation. Wave data from the CRRES satellite has been used in several large-77
scale studies to calculate the theoretical electron precipitation energies, though these78
studies lack any actual precipitation measurements [e.g. Meredith et al., 2003; Ukhorskiy79
et al., 2010; Chen et al., 2011; Kersten et al., 2014]. A number of case-studies have been80
published using direct observations of electron precipitation, though without correspond-81
ing wave measurements [e.g. Bortnik et al., 2006; Millan et al., 2002, 2007]. More recently,82
an increase in the number of ground-based stations capable of detecting EMIC waves as83
well as the launch of the Van Allen Probes has seen a number of case-studies published84
combining both wave and electron precipitation measurements [e.g. Miyoshi et al., 2008;85
Rodger et al., 2008; Li et al., 2014; Clilverd et al., 2015; Usanova et al., 2014]. Due to86
the experimental limitations of these studies, however, it is difficult to draw wholesale87
conclusions on EMIC-wave precipitation characteristics.88
A study by Carson et al. [2013] sought to overcome the limitations based on the lack of89
EMIC precipitation data by creating a database of EMIC wave events based on observa-90
tions of precipitation itself. The key to this database was an EMIC-driven precipitation91
signature identified in POES MEPED data (data described in detail in Section 2.1) by92
Sandanger et al. [2007, 2009]. Based on the fact that EMIC waves are potentially able to93
D R A F T May 18, 2016, 5:23pm D R A F T

X - 8 HENDRY ET AL.: POES-DETECTED EMIC PRECIPITATION SURVEY
scatter both energetic protons and relativistic electrons into the loss cone, it was suggested94
that the presence of short-lived precipitation spikes in the POES 30 − 80 keV proton and95
> 800 keV electron loss cone data should be indicative of EMIC-wave activity capable of96
influencing the radiation belts.97
Carson et al. [2013] examined twelve years of POES MEPED data (1998–2012) from98
the six POES spacecraft available at the time (NOAA-15 through -19 and METOP-99
02). These authors developed an algorithm for finding the precipitation events with the100
expected EMIC signature, following on from the Sandanger et al. [2007, 2009] reports.101
Carson et al. [2013] found 2331 wave-driven precipitation events. In the current study we102
have extended the observational period of the database to the end of 2014 and included103
data from the METOP-01 satellite, which was launched in 2012. The updated database104
now contains 3337 POES-detected prospective EMIC-driven precipitation events.105
It is important to note that this database is not intended to be an exhaustive survey106
of POES-observed EMIC precipitation events, as there are several aspects that limit the107
effectiveness of the detection algorithm. The main limiting factor is the checks put in place108
to prevent false-positive detections - for this algorithm, a high specificity was favored over109
a high sensitivity. As a result, there are many potential events which are ignored due110
to being too close to the instrument noise floor, having excessive background flux, or111
other such problems. It is often possible to identify by eye events that were missed by112
the Carson et al. [2013] detection algorithm, but this process is obviously far too labor-113
intensive to consider for the POES dataset in its entirety. This database also does not114
consider the possibility of EMIC-driven electron precipitation that occurs entirely below115
800 keV. Any such events could potentially be detected using the MEPED > 300 keV116
D R A F T May 18, 2016, 5:23pm D R A F T

HENDRY ET AL.: POES-DETECTED EMIC PRECIPITATION SURVEY X - 9
electron detector, however contamination issues (described in Section 2.1) significantly117
complicate this approach.118
One of the main issues with using POES electron precipitation observations as a proxy119
for EMIC wave detection [Sandanger et al., 2007, 2009; Carson et al., 2013; Wang et al.,120
2014] is the lack of any supporting wave measurements. The POES satellites do not121
carry any instruments capable of directly detecting EMIC wave activity, which makes it122
impossible to state conclusively that the observed precipitation is actually due to EMIC123
waves rather than some other driver. The ability to detect EMIC waves does exist on124
other satellites, for instance the Van Allen probes, however conjunctions between these125
satellites and the POES satellites are typically very rare. This makes it very difficult126
to investigate the validity of the EMIC-precipitation database as a whole in situ. One127
recently reported example of such a conjunction supports the contention that the POES128
precipitation events reported by the Carson et al. [2013] algorithm are indeed produced by129
EMIC waves [Rodger et al., 2015]. In that study a POES-reported precipitation trigger130
occurred within seconds of RBSP-A observing the start of an EMIC wave event, with131
POES located very near the base of the field line which passed through the Van Allen132
Probe.133
Previous studies have shown that it is possible to observe EMIC waves and their re-134
sulting precipitation from the ground [e.g. Rodger et al., 2008; Clilverd et al., 2015]. As135
an initial step in this study, we will imitate this analysis for a 10 hour period of EMIC136
activity that corresponds to a POES-detected EMIC event in the updated Carson et al.137
[2013] database. We show that, for this event, there is a clear link between the POES-138
observed particle precipitation and EMIC waves observed on the ground. We then apply139
D R A F T May 18, 2016, 5:23pm D R A F T
X - 10 HENDRY ET AL.: POES-DETECTED EMIC PRECIPITATION SURVEY
a similar analysis to the updated Carson et al. [2013] database as a whole, finding that a140
significant portion of the database events correspond with ground-based observations of141
EMIC waves. Finally, we provide observations from several additional magnetometers to142
emphasize the link between the POES-observed precipitation and the ground-based wave143
observations. These results all provide significant confidence that the POES detected144
precipitation events are driven by EMIC waves.145
2. Instrument Description
In this study we have made use of a number of ground- and satellite-based instruments146
to understand the link between EMIC-waves and the resulting electron precipitation.147
These are outlined below.148
2.1. POES MEPED Instrument
We use data from the Polar Operational Environmental Satellite (POES) constellation,149
a set of meteorological satellites in polar orbit at an altitude of ∼ 800−850km around the150
Earth. Specifically, we use the Medium Energy Proton and Electron Detector (MEPED)151
instrument from the 2nd generation Space Environment Monitor (SEM-2) instrument152
suite. The MEPED instrument measures radiation belt electron and proton fluxes by153
way of four directional telescopes, two for electrons and two for protons. These telescopes154
are aligned orthogonally, such that one of each of the electron and proton telescope pairs155
points radially outwards along the Earth-to-satellite vector (the 0° detectors), while the156
other two telescopes point perpendicularly to these, anti-parallel to the velocity vector157
of the satellite (the 90° detectors). These two channels approximately measure loss-cone158
D R A F T May 18, 2016, 5:23pm D R A F T

HENDRY ET AL.: POES-DETECTED EMIC PRECIPITATION SURVEY X - 11
and trapped particles respectively, though this is complicated at equatorial latitudes and159
near the South Atlantic Magnetic Anomaly [Rodger et al., 2010a, b].160
Each of the directional electron telescopes measures electron flux across three different161
energy ranges: > 30keV, > 100keV, and > 300keV. These energy channels are referred to162
as the E1, E2, and E3 channels respectively. The proton telescopes are similarly split into163
6 different energy channels: 30−80keV, 80−250keV, 250−800keV, 800−2500keV, 2500−164
6900 keV, and > 6900 keV. These channels are numbered P1 through P6 respectively.165
Both the electron and the proton telescopes contain shielding to prevent cross-166
contamination from occurring. In practice, however, some cross-contamination still oc-167
curs. In other words, electrons above a certain energy are able to penetrate the proton168
detector shielding, and vice versa. The exact energies at which contamination begins is169
not fixed, as it largely depends on the intensity of the incident flux. Roughly, the proton170
channels start being contaminated by electrons with energies above ∼ 500 keV, while171
the electron channels are contaminated by protons with energies above ∼ 100 keV. This172
contamination is particularly noticeable in the P6 proton detector, which was intended173
to measure high-energy protons. In the absence of high-energy protons, the P6 detector174
responds very strongly to relativistic electrons, allowing it to act as a fourth electron de-175
tector. A detailed description of the POES satellites and their instruments can be found in176
Evans and Greer [2000]. A full quantitative analysis of the POES MEPED contamination177
can be found in Yando et al. [2011].178
Each of the POES satellites has two preferred MLT regions, where they spend the179
majority of their time in orbit; this is a direct consequence of the Sun-synchronous polar180
orbit that each satellite is in. The MLT range sampled by each of the POES satellites181
D R A F T May 18, 2016, 5:23pm D R A F T
X - 12 HENDRY ET AL.: POES-DETECTED EMIC PRECIPITATION SURVEY
is shown in Figure 1, as well as the combined MLT sampling for the combination of all182
of the satellites. During their operational lifetimes, many of the POES spacecraft have183
experienced some level of MLT drift [Sandanger et al., 2015], which is seen as a slight184
“smearing” of the data in Figure 1. This is particularly noticeable in the NOAA-16185
satellite, which experienced severe drift in the later years of its operational lifetime. The186
MLT range of the combined POES satellite constellation (lower right corner of Figure 1)187
shows significant coverage with measurements made over almost all L-shells and MLT,188
and only slightly reduced coverage for low L-shells (i.e. L < 2) at 12 MLT. This broad189
coverage allows us to sample the entire MLT range in which precipitation might occur,190
making the POES satellites ideal for investigating particle fluxes within the radiation191
belts.192
2.2. Ground-based Magnetometers
In addition to the POES satellite data, we also use data from several ground-based193
search-coil magnetometers (SCM). Data is available from magnetometers operated by194
different institutions in various locations around the world that give broad coverage of the195
Pc1-Pc2 frequency range. In this study, we focus primarily on data from the Halley SCM,196
located at the British Antarctic Survey Halley station in Antarctica (75.6° S, 26.2° W;197
L = 4.7). In addition to this, we also use data from a north-south chain of SCMs operated198
by the Sodankyla Geophysical Observatory (SGO) in Finland, the CARISMA chain of199
SCMs in Canada [Mann et al., 2008], and a magnetometer in Athabasca, Canada, run by200
the Institute of Space-Earth Environmental Research at Nagoya University, Japan.201
D R A F T May 18, 2016, 5:23pm D R A F T

HENDRY ET AL.: POES-DETECTED EMIC PRECIPITATION SURVEY X - 13
2.3. AARDDVARK
The Antarctic-Arctic Radiation-belt (Dynamic) Deposition - VLF Atmospheric Re-202
search Konsortium (AARDDVARK) is a global network of Very Low Frequency (VLF)203
wave receivers that continuously monitor high-power, fixed-frequency VLF transmitters204
[Clilverd et al., 2009]. The amplitude and phase of the VLF signal from these transmit-205
ters is highly sensitive to perturbations in the conductivity at the lower boundary of the206
ionosphere, which alter the Earth-Ionosphere waveguide through which the VLF waves207
propagate ( 70–85 km). A major source of these ionospheric perturbations is electron208
precipitation; identifying and modeling these changes to the received signal make it pos-209
sible to identify and quantify the source of the precipitation [Rodger et al., 2012]. In this210
study we use data from two AARDDVARK stations: Halley, Antarctica, and Edmonton,211
Canada (53.4° N, 113.0° W; L = 4.2).212
2.4. Riometers
Finally, we also use data from the 30 MHz riometer located at Halley, Antarctica, and213
from the SGO chain of riometers in Finland. Riometers observe the relative opacity of the214
ionosphere by monitoring galactic radio noise passing through the ionosphere. Riometers215
are sensitive to changes in the ionization of the ionosphere, for instance due to electron216
precipitation. Increased ionization will increase the absorption of the incident radio noise,217
which can be modeled to quantify the precipitation source [Little and Leinbach, 1959].218
Unlike the AARDDVARK network, which is sensitive to ionospheric changes over a long219
path between transmitter and receiver, riometers are sensitive to ionospheric changes220
in a relatively small region overhead. This makes riometers useful for detecting local221
precipitation regions.222
D R A F T May 18, 2016, 5:23pm D R A F T

X - 14 HENDRY ET AL.: POES-DETECTED EMIC PRECIPITATION SURVEY
3. Case Study - 13/14 August 2013
On 13 August 2013 at 18:01:12 UT, the Carson et al. [2013] algorithm detected con-223
current spikes in the POES METOP-02 P1 and P6 loss cone data consistent with EMIC224
wave driven precipitation. Closer examination of the data from each satellite showed225
11 additional precipitation spikes consistent with EMIC-driven precipitation that did not226
produce triggers in the detection algorithm, primarily due to large amounts of background227
noise in the MEPED P1 channel. These detections occurred between 17:00–03:00 UT and228
spanned roughly a 150° longitudinal region. The L-shell of each event was confined to229
4 < L < 5, i.e., close to the typical L-shell of the plasmapause under non-disturbed geo-230
magnetic conditions. The geographic location of each of these 12 detections, traced down231
the IGRF field line to an altitude of 110 km, is shown on the world map in Figure 2 as232
a green diamond. The IGRF conjugate locations of each event are shown as an hollow233
diamond. A full list of these detections and their locations is given in Table 1(a).234
When the geographic longitudes of the POES-detected precipitation spikes are plotted235
against the time of their detection, as shown in Figure 3(a), there is a clear essentially236
constant longitudinal drift with respect to UT. The red line fitted to the points in Fig-237
ure 3(a) represents the best fit for the drift rate of the precipitation source, with a slope238
of (15.0 ± 0.6)°/hr. The locations of each of the POES-observed precipitation spikes in239
MLT are shown in Figure 3(b). The red line represents the best fit for the MLT drift240
rate of the precipitation source, with a slope of (0.06 ± 0.07) MLT/hr. The best fit is241
not significantly different from a slope of zero, indicating a source region that is static in242
MLT. These observations are consistent with a long-lived region of electron precipitation243
D R A F T May 18, 2016, 5:23pm D R A F T

HENDRY ET AL.: POES-DETECTED EMIC PRECIPITATION SURVEY X - 15
at a constant ∼ 20 − 21 MLT, located close to the plasmapause, and with the expected244
characteristics of EMIC-driven precipitation.245
Around the time that the precipitation spikes were observed in POES, clear EMIC246
wave signatures were observed in each of the Rovaniemi (66.8° N, 25.9° E; L = 5.1),247
Halley, and Pinawa (50.2° N, 96.0° W; L = 4.0) magnetometers. The locations of these248
magnetometers are shown as yellow stars in Figure 2, and a full list of these detections249
is given in Table 1(b). Several additional magnetometers from the SGO and CARISMA250
magnetometer chains also observed EMIC waves during the event, though with weaker251
power spectral density signatures.252
The wave data from each of the three magnetometers named above is shown in Figure 4.253
Each of the three stations shows a clear rising-tone EMIC wave, termed an IPDP (intervals254
of pulsations of diminishing periods) EMIC wave [Troitskaya, 1961], during the event255
period. Overlaid on the data from each magnetometer is a solid line, indicating the time256
in UT when the station is located at 20.5 MLT, as well as two dotted lines on either side257
of the solid line, indicating 1 hr MLT either side. In each station, the observed wave258
occurs close to this MLT region, showing a clear relation between the POES observed259
precipitation and the SCM observed waves. Data from the SCM located at Athabasca,260
Canada, situated about 20° west of Pinawa, was also checked for EMIC wave activity,261
however none was observed within the specified MLT region. This is consistent with the262
POES-defined precipitation region, which extends no further westward than the Pinawa263
magnetometer, as seen in Figure 1.264
These wave observations suggest that IPDP are being repeatedly triggered in a single265
MLT region at different UT, which are then seen by each station as they arrive at that266
D R A F T May 18, 2016, 5:23pm D R A F T

X - 16 HENDRY ET AL.: POES-DETECTED EMIC PRECIPITATION SURVEY
MLT. This clearly ties the observed IPDP with the POES observed electron precipitation267
regions, also seen within a single MLT region.268
At the same time as their respective SCM instruments observed EMIC waves, such as269
that shown for Halley in Figure 5(a), riometers at both the Rovaniemi and Halley stations270
showed sudden increases in absorption of 1.1 dB and 0.4 dB respectively, indicative of271
energetic electron precipitation into the ionosphere above the instruments. Given the272
close temporal and spatial proximity of the wave and precipitation observations at each273
station, it follows that the precipitation observed in the riometers is most likely due274
to EMIC wave driven electron scattering. The absorption data for the Halley riometer is275
shown in Figure 5(b). The locations of these riometers are shown as red circles in Figure 2,276
and a full list of the riometer detections is given in Table 1(c).277
Concurrently with the riometer and SCM observations, the Halley AARDDVARK VLF278
receiver monitoring the Hawaii-based VLF transmitter (21.420° N, 158.2° W, 21.4 kHz,279
callsign NPM) observed a sudden decrease in the received amplitude of the VLF wave280
of about 8.2 dB. The amplitude data for the NPM VLF transmitter as seen from Halley281
is shown in Figure 5(c) (blue line), with an approximate quiet day curve shown by the282
red dashed line. Such a change in the VLF signal is indicative of electron precipitation283
somewhere along the transmitter-receiver path; the relatively small time difference be-284
tween the Halley riometer and AARDDVARK observed precipitation suggests that the285
precipitation occurred relatively close to Halley, but along the VLF path to the west of286
the station.287
As well as the Halley VLF receiver, the AARDDVARK VLF receiver located in Ed-288
monton, Canada, also observed a sudden decrease of about 6.4 dB in received amplitude289
D R A F T May 18, 2016, 5:23pm D R A F T

HENDRY ET AL.: POES-DETECTED EMIC PRECIPITATION SURVEY X - 17
of the VLF signal from the Maine, USA, based transmitter (44.6° N, 67.3° W, 24.0 kHz,290
callsign NAA). The timing of this drop in amplitude is consistent with the POES-observed291
precipitation observed near the Pinawa magnetometer. The timing also agrees with the292
EMIC wave observed at Pinawa, which suggests that the precipitation observed along the293
Edmonton-NAA path likely occurred close to the Pinawa station. It is very likely that294
the precipitation observed by both the Halley and the Edmonton VLF receivers was due295
to electrons scattered by the EMIC waves detected by the nearby magnetometers. The296
locations of these VLF transmitters and receivers are shown as dark blue and light blue297
squares respectively in Figure 2, with red lines indicating the great circle path between298
them. A full description of both VLF detections is given in Table 1(d).299
4. Database Analysis
The Carson et al. [2013] database provides a useful source of potential EMIC-driven300
precipitation events for study, however there remains a lingering question as to whether301
the majority of the events are caused by EMIC waves. Case studies such as that in the302
previous section show that at least some of the events in the database do correspond to303
actual EMIC wave events, but they say nothing of the credibility of the database as a304
whole. In this section we present the results of a comparison between the updated Carson305
et al. [2013] database and data from the Halley search-coil magnetometer, showing that a306
significant proportion of the POES-detected precipitation events correspond with actual307
EMIC wave observations on the ground.308
4.1. SCM Wave Observations
D R A F T May 18, 2016, 5:23pm D R A F T

X - 18 HENDRY ET AL.: POES-DETECTED EMIC PRECIPITATION SURVEY
The updated Carson et al. [2013] event database consists of 3337 precipitation events309
detected between 1998 and 2014 inclusive. The Halley search-coil magnetometer first310
started recording Pc 1–2 wave data in 2005, though since then it has had a few significant311
lapses in coverage. The main such lapse occurred in 2014, when a major electrical outage312
suspended all science operations at Halley for four months. There are also several occasions313
when data from the station exists, but is unusable due to calibration or other issues. In314
total, usable Halley SCM data exists for 1915 of the 3337 POES-reported precipitation315
events (57%).316
We want to test whether EMIC wave activity at Halley coincides with the POES-317
observed precipitation triggers. The case study presented in Section 3 shows that there318
is the potential for significant longitudinal separation between a magnetometer EMIC319
signature and a POES precipitation trigger. Establishing the link between such widely320
separated observations without any intermediate wave or trigger detections is difficult,321
however. To avoid this issue, we restrict ourselves to only POES precipitation triggers322
that occur within ±15° longitude of the Halley station, the equivalent of approximately323
±1 hr MLT. Due to the aggressive removal of the SAMA region by Carson et al. [2013]324
and the unfortunate location of the Halley station within this removed region, we can only325
consider triggers in the northern hemisphere, around the (IGRF) magnetic conjugate point326
of the Halley station (56.6°N, 304.4°E). We only include EMIC wave signatures that occur327
within one POES half-orbit of the POES trigger (roughly ±1 h in time).328
Of the 1915 POES triggers for which there exists usable Halley SCM data, 998 of329
these occur in the northern hemisphere, of which 131 occur within ±15° longitude of the330
Halley magnetic conjugate point. The Carson et al. [2013] algorithm does not filter for331
D R A F T May 18, 2016, 5:23pm D R A F T

HENDRY ET AL.: POES-DETECTED EMIC PRECIPITATION SURVEY X - 19
multiple detections of the same precipitation event across the different POES satellites,332
so it is possible for a single electron precipitation event to be represented multiple times333
in the precipitation trigger database. Of the 131 near-Halley triggers, there were 125334
unique precipitation events. For each of these 125 unique events, we examined the Halley335
SCM data for evidence of EMIC-wave activity around the time of the POES-detected336
precipitation.337
Investigation of the Halley SCM data was carried out manually. For each event, the338
SCM data was examined for evidence of EMIC wave activity; namely, distinct bursts339
of wave power in the Pc1-Pc2 frequency range. Instances of wave power across a wide340
range of frequencies with no observable lower limit within the resolution of the instrument341
were dismissed as broadband noise, and were not counted as EMIC waves. EMIC waves342
that exhibited a clear rising-tone structure (i.e. increasing in frequency with time) were343
counted as IPDP-type EMIC waves. In total, 81 of the 125 unique precipitation events344
(64.8%) coincided with an EMIC wave observed in the Halley SCM. Around 63% of these345
waves were rising-tone IPDP waves.346
4.2. Detection Algorithm Effectiveness
In order to determine the ability of the Carson et al. [2013] algorithm to detect EMIC-347
wave driven precipitation, it is necessary to establish how often the POES-observed pre-348
cipitation spikes coincide with ground-based SCM detections of EMIC waves. The above349
analysis based on waves observed at Halley suggests that at least 60% of the POES precip-350
itation triggers detected by the algorithm correspond with waves on the ground. However351
this still leaves the matter of the remaining 40% of events. Determining whether these352
“non-detections” are simply cases where the waves did not reach the Halley magnetome-353
D R A F T May 18, 2016, 5:23pm D R A F T

X - 20 HENDRY ET AL.: POES-DETECTED EMIC PRECIPITATION SURVEY
ter or are false detections by the algorithm is important to confirming the validity of the354
database as a whole.355
In our longitudinally restricted comparison of the POES and Halley datasets, we did not356
take into account the latitudinal separation of the POES satellite from Halley at the time357
of the POES trigger. Ducting within the Earth-ionosphere waveguide means that EMIC358
waves that reach the ground can be detected over a range of L-shells, though the extent of359
this ducting is complicated. Unsurprisingly, POES triggers that have a greater latitudinal360
separation from Halley are less likely to have associated EMIC wave observations from361
the Halley station SCM. If we restrict our analysis to events that occur within ∆L < 1362
of the Halley magnetometer, the number of successful detections becomes 65 out of 77363
events (84.4%); at ∆L < 0.5 it becomes 37 out of 41 events (90.2%). This study confirms364
that a very high proportion of the POES triggers are associated with EMIC waves when365
the satellites are directly overhead of the Halley conjugate point.366
The non-detection of EMIC waves from ground-based instruments, when they are known367
to be occurring from simultaneous space-based observations, has been reported previously.368
This may be due to ionospheric attenuation, or absorption/reflection of the incident waves369
[Engebretson et al., 2008]. Therefore, the absence of ground-based wave observations for370
the POES precipitation triggers does not necessarily indicate a false detection in the371
trigger data. Without further data though, for instance in-situ wave observations, it is372
not possible to determine whether the EMIC waves do not exist, that is to say the POES373
trigger is a false detection, or if the EMIC waves are simply not reaching the ground.374
4.3. Broader Database Analysis
D R A F T May 18, 2016, 5:23pm D R A F T
HENDRY ET AL.: POES-DETECTED EMIC PRECIPITATION SURVEY X - 21
EMIC source regions are often long-lived, as the case study presented earlier in this study375
shows. These long-lived source regions manifest in the data as multiple closely spaced376
POES precipitation triggers and SCM wave observations. In our example, the EMIC377
source region was constant in MLT, which resulted in a constant westward longitudinal378
drift of the EMIC source region footprint at a rate of ∼ 15°/h. Other previously published379
case studies have shown EMIC source regions that drift more rapidly in MLT, for instance380
Clilverd et al. [2015] presented an example of an EMIC source region that crossed ∼ 8.5 h381
of MLT in about 1.5 h (equivalent to a ∼ 85°/h westward longitudinal drift rate).382
In the previous sections, we considered POES that occurred within ±15° longitude383
of Halley, to maintain a strong causal link between the triggers and any observed EMIC384
waves in the Halley SCM data. We examined SCM data within ±1 h of the POES trigger,385
which corresponds roughly to the period of a single POES half-orbit. If we maintain this386
time restriction but allow a source region that drifts in MLT, we can consider POES387
triggers that occurred further away in longitude from Halley. Using the drift rates seen in388
the Clilverd et al. [2015] case study as an upper limit on source region drift rates, we are389
able to consider POES triggers that occurred up to ±90° in longitude away from Halley.390
EMIC waves seen at Halley within ±1 h of these triggers can still conceivably be causally391
linked to the POES triggers, though obviously the link becomes more tenuous at greater392
longitudinal separation from Halley.393
Using this new longitude range we have a further 408 POES triggers, in addition to394
the 131 near-Halley triggers investigated previously. We restrict ourselves to Northern395
Hemisphere triggers for consistency, and to avoid any potential issues due to the SAMA396
region. For each of these new POES triggers we consider the Halley data, taking into397
D R A F T May 18, 2016, 5:23pm D R A F T

X - 22 HENDRY ET AL.: POES-DETECTED EMIC PRECIPITATION SURVEY
account potential drift of the source region, again looking for EMIC waves that occur398
within an hour of the POES trigger. Due to the westward drift of the EMIC source399
regions, for events located eastward of Halley only SCM data recorded after the trigger400
time was considered, while for events westward of Halley data recorded before the trigger401
time was investigated. For each event, the longitudinal distance of the POES trigger from402
Halley was used to calculate the time lag expected between the POES trigger and any403
Halley EMIC observations - waves observed outside of this lag window were discounted. As404
before, there are instances where multiple POES satellites detected a given precipitation405
event. With these accounted for, there were 393 unique POES triggers observed.406
In total, 167 of the 393 unique POES triggers coincided with EMIC wave observations at407
Halley. Unsurprisingly, the number of coincident observations between POES and Halley408
drops off as the longitudinal distance from Halley increases, reaching a success rate of409
around 25% at ±90° longitude from Halley. 43% of these EMIC waves observed at Halley410
were rising-tone IPDP waves.411
The question remains how many of these successful observations might be coincidental412
unrelated POES triggers and EMIC waves. To investigate the chances of a random trigger413
unrelated to any real precipitation spikes coinciding with an EMIC wave at Halley we414
generated a set of triggers independent of any POES precipitation triggers that mimicked415
the longitude and MLT distributions of the real triggers. We repeated the process of416
checking Halley for EMIC waves around these times. There is little variation in the success417
rate based on the distance of the random events from Halley, with an average success rate418
of ∼ 18%. A comparison of the database triggers compared to the non-precipitation419
D R A F T May 18, 2016, 5:23pm D R A F T
HENDRY ET AL.: POES-DETECTED EMIC PRECIPITATION SURVEY X - 23
triggers is shown in Figure 6. Only 23% of these random triggers corresponded with420
IPDP-type EMIC waves.421
There is little difference between the success rate of the randomly chosen triggers and422
the real triggers that occur at a distance of 75−90° longitude from Halley, suggesting that423
any true POES-Halley conjunctions observed at this large longitudinal separation from424
Halley cannot reliably be distinguished from random coincidental conjunctions. For POES425
triggers closer to Halley, there is a significantly increased chance above the background of426
observing a coincident EMIC wave at Halley.427
4.4. Wave bands
To identify the significance of the EMIC-waves associated with the triggers produced428
by the Carson et al. [2013] algorithm, it is important to know which ion band the waves429
occur in. Previously published results have suggested that helium band EMIC waves are430
more likely to drive the precipitation of < 2 MeV electrons than hydrogen band EMIC431
[Meredith et al., 2014]. The band that each of the waves is categorized into will therefore432
determine the relevance of the POES-detected EMIC activity to radiation belt dynamics.433
The precipitation spikes in the POES data are very narrowly defined in IGRF L with434
each event typically occurring across an L-shell range of around 0.3 L, consistent with435
previously published case-studies [e.g. Mann et al., 2014]. We are therefore able to use436
the L-shell location of the POES-observed precipitation spikes to calculate the ion gyrofre-437
quencies at the IGRF-determined geomagnetic equator for the POES trigger locations.438
The IGRF magnetic field at the geomagnetic equator was calculated for each event using439
the International Radiation Belt Environment Modeling library (IRBEM-LIB) [Boscher440
et al., 2015]. By comparing the calculated gyrofrequencies to the frequency ranges of the441
D R A F T May 18, 2016, 5:23pm D R A F T

X - 24 HENDRY ET AL.: POES-DETECTED EMIC PRECIPITATION SURVEY
associated EMIC waves observed at Halley, we are able to determine the ion band of each442
wave.443
Though the database is likely to include waves from each of the hydrogen, helium,444
and oxygen wave bands, we categorize the waves as being either hydrogen band, or he-445
lium/oxygen band. The helium and oxygen wave bands are separated by the oxygen446
gyrofrequency, however this separation is only with the presence of oxygen at the wave447
generation region. In the absence of oxygen density data, it is not possible to make the448
distinction between the two bands.449
Of the 81 unique precipitation-causing EMIC waves observed at Halley linked to POES450
triggers, all but one occurred at frequencies below the POES-calculated helium gyrofre-451
quency. Of the 167 coincident events in the broader analysis, 21 (∼ 13%) occurred within452
the hydrogen band, while the rest occurred in the helium/oxygen bands.453
The lack of any significant population of hydrogen band EMIC waves in those observed454
at Halley contrasts with previously published studies on EMIC occurrence, which show455
hydrogen band EMIC occurrence rates relative to other bands significantly greater than456
we have observed [Saikin et al., 2015]. The absence of hydrogen band EMIC on the457
ground has been noted previously; for instance in the case study published by Usanova458
et al. [2008], hydrogen and helium band EMIC waves were observed simultaneously in459
space via the THEMIS satellite, but only the lower-frequency helium band EMIC were460
observed in ground-based magnetometer data.461
5. Additional results
The conclusions from the Halley magnetometer represent only the EMIC wave be-462
haviour at a single location, and do not discount the possibility of an isolated result. In463
D R A F T May 18, 2016, 5:23pm D R A F T
HENDRY ET AL.: POES-DETECTED EMIC PRECIPITATION SURVEY X - 25
this section we briefly present the results of identical studies carried out at the Athabasca464
ground-based magnetometer, as well as several magnetometers from the CARISMA mag-465
netometer chain, and show that the conclusions are largely the same, regardless of the466
magnetometer used. As with the Halley magnetometer data, all investigations of these467
addition magnetometers were carried out manually.468
5.1. Athabasca magnetometer
We carried out the same investigation described in Section 4 on the data from the469
Athabasca SCM, which provides ongoing measurements from 7 September 2005. As with470
the Halley magnetometer, we at first restrict our analysis to POES triggers that occur471
within ±15° longitude of the Athabasca SCM. The Athabasca magnetometer is far enough472
west in longitude that the SAMA region is not an issue, so we also include events from the473
southern hemisphere in our analysis, using the IGRF determined magnetic conjugate point474
of Athabasca as the focal point. This filtering leaves us with 186 unique POES triggers, 107475
of which (57.5%) occurred within ±1 hr of EMIC waves observed at Athabasca. Further476
restricting these events based on their L-shell separation from Athabasca increases the477
success rate of the detection algorithm: 87/130 (66.9%) of the events occurred for ∆L < 1,478
while 54/67 (80.6%) of the events occurred for ∆L < 0.5. Around 43% of the waves were479
IPDP waves, though there significant difference between the hemispheres (53% IPDP for480
triggers in the northern hemisphere vs 36% IPDP in the southern hemisphere).481
We also extend the analysis to include the possibility of drifting EMIC source regions,482
as in Section 4.3, examining POES triggers that occur within ±90° of Athabasca, in both483
the northern and southern hemispheres. In this longitudinal range, we find 929 unique484
POES triggers. 280 (30.1%) of these triggers coincided with EMIC waves observed at the485
D R A F T May 18, 2016, 5:23pm D R A F T
X - 26 HENDRY ET AL.: POES-DETECTED EMIC PRECIPITATION SURVEY
Athabasca SCM, roughly 37% of which were IPDP (though again, there is a significant486
difference between the hemispheres, with 48% IPDP in the northern hemisphere vs 26%487
IPDP in the southern hemisphere). As with the Halley data, we calculate the chance488
that a randomly chosen POES trigger will coincide with an EMIC wave observed in the489
Athabasca SCM data, with a success rate of ∼ 8% across all longitudinal ranges. At490
distances of 75−90° from Athabasca, the success rate of the true triggers approaches that491
of the random triggers. The results of this analysis are shown in Figure 6(b). Only 21%492
of these random triggers were IPDP-type EMIC waves.493
Finally, we classify each of the observed EMIC waves as being either hydrogen band494
or helium/oxygen band EMIC. Of the 107 wave events with POES triggers < 15° lat-495
itude from Athabasca, only 8 (7%) occurred in the hydrogen wave band. Of the 280496
events observed in the broader analysis, 64 (23%) occurred in the hydrogen wave band.497
Interestingly, the hydrogen band waves were observed disproportionately in the southern498
hemisphere: 30% of southern hemisphere events occurring in the hydrogen band, com-499
pared to only 16% of northern hemisphere events.500
5.2. CARISMA magnetometer chain
The CARISMA chain of magnetometers allows us to investigate the POES triggers from501
multiple different latitudes along the same longitude, allowing us to determine latitudinal502
differences in EMIC detection. We use the magnetometers located at Fort Churchill503
(FCHU), Island Lake (ISLL), and Pinawa (PINA), each of which house both fluxgate and504
search-coil magnetometers; for this study we used both types of data.505
As before, we investigated Northern hemisphere POES triggers that occurred within506
±15° longitude of the magnetometers - the southern conjugate points of the CARISMA507
D R A F T May 18, 2016, 5:23pm D R A F T
HENDRY ET AL.: POES-DETECTED EMIC PRECIPITATION SURVEY X - 27
magnetometers have significant overlap with the SAMA region defined by Carson et al.508
[2013], so we do not consider the southern hemisphere for these magnetometers. For509
the FCHU, ISLL, and PINA magnetometers respectively, we found 35/83 (42.2%), 49/89510
(55.1%), and 40/85 (47.1%) unique wave/trigger conjugations, with 20%, 43%, and 63%511
respectively being IPDP EMIC waves. Extending the investigation out to include drift-512
ing source regions, we found 115/454 (25.3%), 157/497 (31.6%), and 89/339 (26.3%)513
wave/trigger conjugations, with 2%, 36%, and 29% respectively being IPDP EMIC waves.514
In the case of FCHU, only two of the observed EMIC waves were IPDP, suggesting a def-515
inite bias against IPDP waves at this magnetometer.516
The CARISMA magnetometers show similar wave band compositions to the Halley and517
Athabasca magnetometers. At FCHU, only 1 of the events within ±15° latitude fell into518
the hydrogen wave band; in the broader analysis, 9 of the events (8%) were hydrogen519
band. At ISLL, there were 3 (6%) hydrogen band waves within ±15° latitude and 16520
(10%) in the broader analysis. At PINA, there were no hydrogen band waves within ±15°521
latitude and 13 (15%) in the broader analysis.522
6. Spatial distribution of EMIC waves
As was mentioned in Section 1, there have been varied reports on the distribution of523
EMIC waves in MLT and L-space. Due to their fixed nature, using ground-based magne-524
tometers to investigate the L-shell distribution of EMIC waves is difficult. Generally only525
waves that occur close to the magnetometers will be detected (where the exact definition526
of “close” depends on a number of factors, including the strength of the wave and the527
ionospheric conditions). No such difficulties exist with investigating MLT distributions,528
though, as any given magnetometer will sample all MLT sectors over the course of a day.529
D R A F T May 18, 2016, 5:23pm D R A F T
X - 28 HENDRY ET AL.: POES-DETECTED EMIC PRECIPITATION SURVEY
Using the combined observations from Halley, Athabasca, and the CARISMA magne-530
tometers we find that EMIC waves that coincide with a POES trigger are present across531
all MLT sectors. The waves show a clear preference for the afternoon and evening MLT532
sectors, peaking between 21-22 MLT. There is also a significant population in the post-533
midnight to morning MLT sector. Splitting the observed EMIC waves into IPDP and534
non-IPDP waves, we find that IPDP waves are confined almost entirely to the afternoon-535
evening sectors, i.e., from 15-22 MLT. The non-IPDP type waves are less well confined,536
occurring across almost all MLT regions.The distribution of all EMIC waves observed at537
all magnetometers is shown in Figure 7(a), with the IPDP and non-IPDP wave distribu-538
tions shown in Figures 7(b), and (c) respectively.539
The EMIC waves observed at each magnetometer are confined to L-shells relatively close540
to the magnetometers, reflecting the inability of the magnetometers to detect EMIC waves541
beyond a certain range. The L-shell distribution of the waves is centered around L = 5.1.542
Splitting the waves into IPDP and non-IPDP waves again, we find that IPDP waves tend543
towards slightly lower L-shells, with a median IPDP L-shell of L = 4.8, compared to544
the non-IPDP median L = 5.5. The IPDP waves also tend to be more tightly clustered545
around the magnetometers, with 83% of IPDP waves occurring within ±1 L-shell of the546
magnetometers, compared to only 61% of the non-IPDP waves. The three CARISMA547
magnetometers also show a significant L-shell dependence of the IPDP waves, with the548
high L-shell FCHU magnetometer observing very few IPDP waves, while the lower L-shell549
ISLL and PINA magnetometers observed much greater proportions of IPDP waves.550
There are distinct differences between the distributions of the hydrogen band EMIC551
waves and the helium/oxygen band EMIC waves. Only one of the observed hydrogen552
D R A F T May 18, 2016, 5:23pm D R A F T
HENDRY ET AL.: POES-DETECTED EMIC PRECIPITATION SURVEY X - 29
band waves occurred below L = 5. The hydrogen band waves occurred across all MLT553
sectors, with a significant peak in the post-midnight sector (1-4 MLT). By comparison,554
none of the helium/oxygen band EMIC waves occurred above L = 8, with over 50% of555
the waves occurring at L < 5. Helium band waves also occurred across all MLT sectors,556
though there was a significant occurrence peak in the evening sector (19-22 MLT).557
7. Summary and Conclusions
From 17:00 UT on 13 August 2013 to 03:00 UT on 14 August 2013, several ground- and558
space-based instruments observed, both directly and indirectly, evidence of EMIC-wave559
activity. Over this 10 hour period, 4 of the 7 POES satellites observed relativistic electron560
and low energy proton precipitation spikes consistent with EMIC-wave driven scattering.561
The locations of these spikes suggested an EMIC source region that was static with respect562
to the magnetic field, centered around 20.5 MLT and L ∼ 4.8. These observations were563
accompanied by ground-based observations of electron precipitation in AARDDVARK564
and riometer data, consistent with the locations of the POES observed precipitation.565
Additionally, several ground-based magnetometers observed rising tone EMIC waves that566
coincided with the timing and location of the precipitation measurements, suggesting that567
the IPDP EMIC waves were the cause of the precipitation.568
The majority of the P6 electron precipitation spikes presented in this case study were569
detected manually, rather than being detected by the Carson et al. [2013] detection algo-570
rithm. This is a side-effect of the checks put in place to prevent false-positive detections,571
described in the introduction to this paper. In this case study, the majority of the manu-572
ally detected spikes were not flagged by the detection algorithm due to large levels of P1573
proton flux, masking any potential P1 spikes from the detection algorithm. In the absence574
D R A F T May 18, 2016, 5:23pm D R A F T

X - 30 HENDRY ET AL.: POES-DETECTED EMIC PRECIPITATION SURVEY
of other evidence, the manually detected P6 electron precipitation spikes would simply575
be high-energy electron spikes, with no identifiable cause. However, the presence of a576
positive EMIC signature identified by the detection algorithm in such close proximity to577
the other P6 spikes, consistent with the observed EMIC wave activity, is highly suggestive578
of a link between the electron precipitation and the EMIC wave activity.579
This event is similar to an EMIC case study recently published by Clilverd et al. [2015],580
who showed similar conjugate observations of IPDP EMIC waves and associated pre-581
cipitation using SCM, AARDDVARK, riometer and POES instrumentation. The event582
investigated by Clilverd et al. [2015] was short-lived, lasting only ∼ 3 h UT and covering583
∼ 50° longitude, however it was also rapidly drifting, moving through ∼ 3 h MLT in584
this time. In comparison, the case study presented in our study was longer-lived, with585
observations spanning over 10 h UT and 140°longitude, but static in MLT. This contrast586
highlights the broad range of forms that EMIC precipitation events may take.587
The case study presented here, as well as the case study by Clilverd et al. [2015], clearly588
shows the possibility for conjugate observations of EMIC activity through POES-observed589
precipitation and ground-based SCM wave signatures. To determine whether the link to590
EMIC wave activity seen in these case studies is true for the Carson et al. [2013] POES591
precipitation triggers in general, we carried out a study of SCM data from the Halley,592
Antarctica station. SCM data from 2005–2014 was investigated, searching for signs of593
EMIC wave activity around the times suggested by the updated Carson et al. [2013]594
precipitation trigger database. We complemented this with similar studies using data595
from magnetometers located in Athabasca, Fort Churchill, Island Lake, and Pinawa, all596
located in Canada.597
D R A F T May 18, 2016, 5:23pm D R A F T
HENDRY ET AL.: POES-DETECTED EMIC PRECIPITATION SURVEY X - 31
Each of the magnetometers studied showed significant numbers of EMIC waves coinci-598
dent with POES electron precipitation triggers. For POES triggers that occurred within599
±15° longitude of each magnetometer, including the magnetic conjugate points of the Hal-600
ley and Athabasca magnetometers, we see successful detection rates of between 50−65%,601
except for the FCHU magnetometer, which sees only 42%, likely due to the high latitude602
location of the magnetometer. Restricting the events further based on the L-shell distance603
of the POES triggers from the magnetometers, we see even greater increases in successful604
detection rates, with the Halley magnetometer in particular detecting EMIC waves for605
90% of the POES triggers that occur within ±0.5L of the Halley northern hemisphere con-606
jugate point. This suggests a very strong link between the POES-detected precipitation607
spikes and EMIC wave activity.608
When considering the possibility of a drifting source region in MLT, we see a consistent609
picture across all of the magnetometers studied. For POES triggers that occur close to610
the magnetometers (or their magnetic conjugate points) we see high rates of successful611
EMIC wave observation. As the longitudinal distance from the magnetometer increases,612
this success rate drops off, until it approaches the “noise” success rate, i.e., the rate of613
successful EMIC wave detection seen for fake POES triggers with no association with any614
precipitation signatures.615
A significant proportion of EMIC waves observed in this study were rising tone IPDP-616
type EMIC waves. IPDP-type waves accounted for over 50% of all EMIC waves observed617
when the POES triggers were < 15° longitude from the magnetometers. In comparison,618
the random triggers with no associated particle precipitation spikes only consisted of619
20− 25% IPDP-type waves, suggesting a preference in the Carson et al. [2013] algorithm620
D R A F T May 18, 2016, 5:23pm D R A F T

X - 32 HENDRY ET AL.: POES-DETECTED EMIC PRECIPITATION SURVEY
towards IPDP-type waves. This indicates that IPDP-type waves may be preferentially621
associated with MeV electron loss as compared to Pc1 banded emissions. Further study622
is needed to determine if there is a significant difference between the precipitation driven623
by IPDP and non-IPDP EMIC waves.624
The CARISMA magnetometers showed that there was a significant L-shell dependence625
of the IPDP-type waves, with only 20% of waves observed at the high-latitude FCHU626
magnetometer being IPDP-type waves, compared to over 60% at the lower latitude PINA627
magnetometer. This suggests that IPDP-type waves are generated at lower L-shells than628
their non-IPDP counterparts. We also saw a much lower percentage of IPDP-type waves629
for POES triggers > 15° longitude from the magnetometers. This could indicate that630
IPDP-type waves are less likely to drift in MLT, or that they are shorter lived than non-631
IPDP EMIC waves. Finally, there was also a significant difference seen between the waves632
observed at Athabasca when comparing POES triggers in the northern and southern633
hemispheres; northern hemisphere triggers were almost twice as likely to be associated634
with IPDP-type waves than the southern hemisphere triggers. Further investigation into635
IPDP-type waves is needed to determine the mechanisms behind these differences.636
The majority of the POES precipitation associated EMIC waves we observed in this637
study occurred in the helium/oxygen bands, with only a very small portion occurring638
in the hydrogen band. Across all magnetometers, over 85% of observed waves occurred639
in the helium/oxygen bands. This possibly indicates a preference in the Carson et al.640
[2013] detection algorithm towards helium band EMIC, which might be due to differences641
in the characteristics of the electron precipitation scattered by the waves in each band.642
Alternatively, it could simply reflect the known difficulty in detecting hydrogen band643
D R A F T May 18, 2016, 5:23pm D R A F T
HENDRY ET AL.: POES-DETECTED EMIC PRECIPITATION SURVEY X - 33
EMIC waves in ground-based instruments, due to lower power or unfavorable propagation644
characteristics [Engebretson et al., 2008; Usanova et al., 2008]. Finally, it might indicate645
a greater difficulty for hydrogen band waves to satisfy the electron resonance condition646
[Denton et al., 2015]. Of all of the hydrogen band waves observed in this study, only ∼ 7%647
were IPDP-type waves.648
We also examined the distribution of the POES trigger associated EMIC waves seen649
at each of the magnetometers. IPDP-type waves were restricted to the afternoon and650
evening MLT sectors, and occurred predominantly at lower L-shells. Non-IPDP EMIC651
waves occurred in all MLT sectors, with a peak occurring in the post-midnight sector.652
The helium/oxygen band waves were observed across all MLT shells with a peak in the653
evening sector, with over 50% of the waves occurring at L < 5. Hydrogen band waves654
were almost exclusively found at L > 5, again across all MLT sectors, with a peak in655
the post-midnight sector. Investigation of high L-shell EMIC waves was limited by a lack656
of high-latitude magnetometer stations, and by a lack of POES triggers at high L-shells.657
This possibly indicates a preference in the Carson et al. [2013] detection algorithm towards658
lower L-shell events. Alternatively, it could indicate that the higher L-shell EMIC waves,659
which our study suggests are almost exclusively non-IPDP hydrogen band waves, are less660
likely to cause relativistic electron precipitation.661
One aspect of the Carson et al. [2013] detection algorithm that still remains to be662
investigated is the “miss rate”, i.e., how often there is EMIC present that the algorithm663
fails to detect. This can happen either when there is no electron precipitation present in664
the energy range to which POES is sensitive, or when there is excessive noise in either665
of the P1 or P6 loss cone channels, preventing a successful detection. We have already666
D R A F T May 18, 2016, 5:23pm D R A F T
X - 34 HENDRY ET AL.: POES-DETECTED EMIC PRECIPITATION SURVEY
shown that there is a likely bias against hydrogen band waves, high L-shell waves, and667
non-IPDP waves, possibly indicating that these types of waves do not readily precipitate668
electrons. A full investigation of how often the algorithm misses EMIC wave events, and669
the characteristics of these missed waves, is outside the scope of the current study.670
The high success rate of EMIC wave detections by POES triggers located in close671
proximity to the magnetometers studies confirms that the Carson et al. [2013] detection672
algorithm is a valid means of detecting EMIC wave activity via POES electron precipita-673
tion data, and shows that the POES precipitation trigger database is made up of a high674
proportion of EMIC-driven electron precipitation events. This makes it possible to use the675
POES precipitation data to further investigate the characteristics of the observed EMIC676
waves and their interactions with radiation belt electrons. The large dataset of POES677
data (17 years of data from up to seven satellites), as well as the ease with EMIC-driven678
precipitation events can be automatically detected by the Carson et al. [2013] algorithm,679
makes it possible to investigate EMIC wave electron interactions on a large scale.680
The POES EMIC-driven precipitation event database can also be used to complement681
ground-based EMIC-wave detection methods. As was demonstrated in this study, data682
from the POES satellites can be using to determine the location of the source region of683
waves observed in ground-based magnetometer data. This has the potential to allow for684
much more detailed examination of the influence of EMIC-wave ducting [cf. Mann et al.,685
2014], as well as permitting accurate calculation of the wave band of ground-detected686
EMIC.687
D R A F T May 18, 2016, 5:23pm D R A F T

HENDRY ET AL.: POES-DETECTED EMIC PRECIPITATION SURVEY X - 35
Acknowledgments. The research leading to these results has received funding from688
the European Community’s Seventh Framework Programme ([FP7/2007–2013]) under689
grant agreement number 263218.690
The authors wish to thank the personnel who developed, maintain, and operate the691
NOAA/POES spacecraft; the Halley search-coil magnetometer, AARDDVARK, and ri-692
ometer instruments; the CARISMA search-coil magnetometer chain; the Sodankyla Geo-693
physical Observatory (SGO) search-coil magnetometer and riometer chains; and the694
Athabasca magnetometer. Support for the Halley search coil magnetometer was pro-695
vided by U.S. National Science Foundation grants PLR-1341493 to Augsburg College and696
PLR-1341677 to the University of New Hampshire. CARISMA is operated by the Uni-697
versity of Alberta, funded by the Canadian Space Agency. The Athabasca induction coil698
magnetometer is operated by Martin Connors of the Centre for Science, Athabasca Uni-699
versity, Athabasca, Alberta, Canada, and Kazuo Shiokawa of the Institute for Space-Earth700
Environmental Research, Nagoya University, Japan.701
The data used in this paper are available at NOAA’s National Geophysical Data Center702
(NGDC - POES MEPED data), the British Antarctic Survey’s Physical Sciences Division703
Data Access Framework (SCM, riometer and AARDDVARK data), the University of704
Alberta CARISMA data repository (SCM data), the SGO (SCM and riometer data -705
available on request), and the ISEE magnetometer data site (http://stdb2.stelab.nagoya-706
u.ac.jp/magne/index.html) for all years of operation.707
D R A F T May 18, 2016, 5:23pm D R A F T

X - 36 HENDRY ET AL.: POES-DETECTED EMIC PRECIPITATION SURVEY
References
Anderson, B. J., R. E. Erlandson, and L. J. Zanetti (1992), A statistical study of Pc708
1-2 magnetic pulsations in the equatorial magnetosphere: 1. equatorial occurrence dis-709
tributions, Journal of Geophysical Research: Space Physics, 97 (A3), 3075–3088, doi:710
10.1029/91JA02706.711
Bortnik, J., R. M. Thorne, T. P. O’Brien, J. C. Green, R. J. Strangeway, Y. Y. Shprits,712
and D. N. Baker (2006), Observation of two distinct, rapid loss mechanisms during the713
20 November 2003 radiation belt dropout event, Journal of Geophysical Research: Space714
Physics, 111 (A12), doi:10.1029/2006JA011802.715
Boscher, D., S. Bourdarie, P. O’Brien, and T. Guild (2015), Irbem-lib - project home716
page.717
Carson, B. R., C. J. Rodger, and M. A. Clilverd (2013), POES satellite observations718
of EMIC-wave driven relativistic electron precipitation during 1998-2010, Journal of719
Geophysical Research: Space Physics, 118 (1), 232–243, doi:10.1029/2012JA017998.720
Chen, L., R. M. Thorne, and J. Bortnik (2011), The controlling effect of ion temperature721
on EMIC wave excitation and scattering, Geophysical Research Letters, 38 (16), doi:722
10.1029/2011GL048653.723
Clausen, L. B. N., J. B. H. Baker, J. M. Ruohoniemi, and H. J. Singer (2011), EMIC waves724
observed at geosynchronous orbit during solar minimum: Statistics and excitation, Jour-725
nal of Geophysical Research: Space Physics, 116 (A10), doi:10.1029/2011JA016823.726
Clilverd, M. A., C. J. Rodger, N. R. Thomson, J. B. Brundell, T. Ulich, J. Lichtenberger,727
N. Cobbett, A. B. Collier, F. W. Menk, A. Seppala, P. T. Verronen, and E. Turunen728
(2009), Remote sensing space weather events: Antarctic-Arctic Radiation-belt (Dy-729
D R A F T May 18, 2016, 5:23pm D R A F T
HENDRY ET AL.: POES-DETECTED EMIC PRECIPITATION SURVEY X - 37
namic) Deposition-VLF Atmospheric Research Konsortium network, Space Weather,730
7 (4), doi:10.1029/2008SW000412.731
Clilverd, M. A., R. Duthie, R. Hardman, A. T. Hendry, C. J. Rodger, T. Raita, M. En-732
gebretson, M. R. Lessard, D. Danskin, and D. K. Milling (2015), Electron precipitation733
from EMIC waves: A case study from 31 May 2013, Journal of Geophysical Research:734
Space Physics, 120 (5), 3618–3631, doi:10.1002/2015JA021090.735
Denton, R. E., V. K. Jordanova, and J. Bortnik (2015), Resonance of relativistic electrons736
with electromagnetic ion cyclotron waves, Geophysical Research Letters, 42 (20), 8263–737
8270, doi:10.1002/2015GL064379.738
Engebretson, M. J., M. R. Lessard, J. Bortnik, J. C. Green, R. B. Horne, D. L. Detrick,739
A. T. Weatherwax, J. Manninen, N. J. Petit, J. L. Posch, and M. C. Rose (2008),740
Pc1-Pc2 waves and energetic particle precipitation during and after magnetic storms:741
Superposed epoch analysis and case studies, Journal of Geophysical Research: Space742
Physics, 113 (A1), doi:10.1029/2007JA012362.743
Evans, D. S., and M. S. Greer (2000), Polar Orbiting Environmental Satellite Space En-744
vironment Monitor-2: Instrument Description and Archive Data Documentation, US745
Department of Commerce, National Oceanic and Atmospheric Administration, Oceanic746
and Atmospheric Research Laboratories, Space Environment Center.747
Fraser, B. J., R. S. Grew, S. K. Morley, J. C. Green, H. J. Singer, T. M. Loto’aniu,748
and M. F. Thomsen (2010), Storm time observations of electromagnetic ion cyclotron749
waves at geosynchronous orbit: GOES results, Journal of Geophysical Research: Space750
Physics (1978–2012), 115 (A5).751
D R A F T May 18, 2016, 5:23pm D R A F T

X - 38 HENDRY ET AL.: POES-DETECTED EMIC PRECIPITATION SURVEY
Friedel, R. H. W., G. D. Reeves, and T. Obara (2002), Relativistic electron dynamics in752
the inner magnetospherea review, Journal of Atmospheric and Solar-Terrestrial Physics,753
64 (2), 265–282.754
Halford, A. J., B. J. Fraser, and S. K. Morley (2010), EMIC wave activity during geomag-755
netic storm and nonstorm periods: CRRES results, Journal of Geophysical Research:756
Space Physics, 115 (A12), doi:10.1029/2010JA015716.757
Horne, R. B., and R. M. Thorne (1993), On the preferred source location for the convective758
amplification of ion cyclotron waves, Journal of Geophysical Research: Space Physics,759
98 (A6), 9233–9247, doi:10.1029/92JA02972.760
Jordanova, V. K., J. Albert, and Y. Miyoshi (2008), Relativistic electron precipitation by761
EMIC waves from self-consistent global simulations, Journal of Geophysical Research:762
Space Physics (1978–2012), 113 (A3).763
Kersten, T., R. B. Horne, S. A. Glauert, N. P. Meredith, B. J. Fraser, and R. S. Grew764
(2014), Electron losses from the radiation belts caused by EMIC waves, Journal of765
Geophysical Research: Space Physics, 119 (11), 8820–8837, doi:10.1002/2014JA020366.766
Li, Z., R. M. Millan, M. K. Hudson, L. A. Woodger, D. M. Smith, Y. Chen, R. Friedel, J. V.767
Rodriguez, M. J. Engebretson, J. Goldstein, J. F. Fennell, and H. E. Spence (2014), In-768
vestigation of EMIC wave scattering as the cause for the BARREL 17 January 2013 rela-769
tivistic electron precipitation event: A quantitative comparison of simulation with obser-770
vations, Geophysical Research Letters, 41 (24), 8722–8729, doi:10.1002/2014GL062273.771
Little, C., and H. Leinbach (1959), The riometer-a device for the continuous mea-772
surement of ionospheric absorption, Proceedings of the IRE, 47 (2), 315–320, doi:773
10.1109/JRPROC.1959.287299.774
D R A F T May 18, 2016, 5:23pm D R A F T
HENDRY ET AL.: POES-DETECTED EMIC PRECIPITATION SURVEY X - 39
Lyons, L. R., and R. M. Thorne (1972), Parasitic pitch angle diffusion of radiation belt775
particles by ion cyclotron waves, Journal of Geophysical Research, 77 (28), 5608–5616,776
doi:10.1029/JA077i028p05608.777
Mann, I. R., D. K. Milling, I. J. Rae, L. G. Ozeke, A. Kale, Z. C. Kale, K. R. Murphy,778
A. Parent, M. E. Usanova, D. M. Pahud, E.-A. Lee, V. Amalraj, D. D. Wallis, V. An-779
gelopoulos, K.-H. Glassmeier, C. T. Russell, H.-U. Auster, and H. J. Singer (2008), The780
upgraded CARISMA magnetometer array in the THEMIS era, Space Science Reviews,781
141 (1-4), 413–451, doi:10.1007/s11214-008-9457-6.782
Mann, I. R., M. E. Usanova, K. Murphy, M. T. Robertson, D. K. Milling, A. Kale,783
C. Kletzing, J. Wygant, S. Thaller, and T. Raita (2014), Spatial localization and ducting784
of EMIC waves: Van Allen Probes and ground-based observations, Geophysical Research785
Letters, 41 (3), 785–792, doi:10.1002/2013GL058581.786
Meredith, N. P., R. M. Thorne, R. B. Horne, D. Summers, B. J. Fraser, and R. R. Anderson787
(2003), Statistical analysis of relativistic electron energies for cyclotron resonance with788
EMIC waves observed on CRRES, Journal of Geophysical Research: Space Physics,789
108 (A6), doi:10.1029/2002JA009700.790
Meredith, N. P., R. B. Horne, T. Kersten, B. J. Fraser, and R. S. Grew (2014),791
Global morphology and spectral properties of EMIC waves derived from CRRES ob-792
servations, Journal of Geophysical Research: Space Physics, 119 (7), 5328–5342, doi:793
10.1002/2014JA020064.794
Millan, R., and R. Thorne (2007), Review of radiation belt relativistic electron795
losses, Journal of Atmospheric and Solar-Terrestrial Physics, 69 (3), 362 – 377, doi:796
http://dx.doi.org/10.1016/j.jastp.2006.06.019.797
D R A F T May 18, 2016, 5:23pm D R A F T
X - 40 HENDRY ET AL.: POES-DETECTED EMIC PRECIPITATION SURVEY
Millan, R. M., R. P. Lin, D. M. Smith, K. R. Lorentzen, and M. P. McCarthy (2002),798
X-ray observations of MeV electron precipitation with a balloon-borne germanium spec-799
trometer, Geophysical research letters, 29 (24), 47–1.800
Millan, R. M., R. P. Lin, D. M. Smith, and M. P. McCarthy (2007), Observation of801
relativistic electron precipitation during a rapid decrease of trapped relativistic electron802
flux, Geophysical research letters, 34 (10).803
Min, K., J. Lee, K. Keika, and W. Li (2012), Global distribution of EMIC waves derived804
from THEMIS observations, Journal of Geophysical Research: Space Physics, 117 (A5),805
doi:10.1029/2012JA017515.806
Miyoshi, Y., K. Sakaguchi, K. Shiokawa, D. Evans, J. Albert, M. Connors, and V. Jor-807
danova (2008), Precipitation of radiation belt electrons by EMIC waves, observed from808
ground and space, Geophysical Research Letters, 35 (23), doi:10.1029/2008GL035727.809
Pickett, J. S., B. Grison, Y. Omura, M. J. Engebretson, I. Dandouras, A. Masson,810
M. L. Adrian, O. Santolık, P. M. E. Decreau, N. Cornilleau-Wehrlin, and D. Con-811
stantinescu (2010), Cluster observations of EMIC triggered emissions in association812
with Pc1 waves near earth’s plasmapause, Geophysical Research Letters, 37 (9), doi:813
10.1029/2010GL042648.814
Rodger, C. J., T. Raita, M. A. Clilverd, A. Seppala, S. Dietrich, N. R. Thomson,815
and T. Ulich (2008), Observations of relativistic electron precipitation from the ra-816
diation belts driven by EMIC waves, Geophysical Research Letters, 35 (16), doi:817
10.1029/2008GL034804.818
Rodger, C. J., M. A. Clilverd, J. C. Green, and M. M. Lam (2010a), Use of POES SEM-2819
observations to examine radiation belt dynamics and energetic electron precipitation820
D R A F T May 18, 2016, 5:23pm D R A F T

HENDRY ET AL.: POES-DETECTED EMIC PRECIPITATION SURVEY X - 41
into the atmosphere, Journal of Geophysical Research: Space Physics, 115 (A4), doi:821
10.1029/2008JA014023.822
Rodger, C. J., B. R. Carson, S. A. Cummer, R. J. Gamble, M. A. Clilverd, J. C. Green,823
J.-A. Sauvaud, M. Parrot, and J.-J. Berthelier (2010b), Contrasting the efficiency of824
radiation belt losses caused by ducted and nonducted whistler-mode waves from ground-825
based transmitters, Journal of Geophysical Research: Space Physics, 115 (A12), doi:826
10.1029/2010JA015880.827
Rodger, C. J., M. A. Clilverd, A. J. Kavanagh, C. E. J. Watt, P. T. Verronen, and828
T. Raita (2012), Contrasting the responses of three different ground-based instruments829
to energetic electron precipitation, Radio Science, 47 (2), doi:10.1029/2011RS004971.830
Rodger, C. J., A. T. Hendry, M. A. Clilverd, C. A. Kletzing, J. B. Brundell, and G. D.831
Reeves (2015), High-resolution in-situ observations of electron precipitation-causing832
EMIC waves, Geophysical Research Letters, doi:10.1002/2015GL066581.833
Saikin, A. A., J.-C. Zhang, R. Allen, C. W. Smith, L. M. Kistler, H. E. Spence, R. B. Tor-834
bert, C. A. Kletzing, and V. K. Jordanova (2015), The occurrence and wave properties835
of H+-, He+-, and O+-band EMIC waves observed by the Van Allen Probes, Journal836
of Geophysical Research: Space Physics, doi:10.1002/2015JA021358.837
Sandanger, M., F. Søraas, K. Aarsnes, K. Oksavik, and D. S. Evans (2007), Loss of rela-838
tivistic electrons: Evidence for pitch angle scattering by electromagnetic ion cyclotron839
waves excited by unstable ring current protons, Journal of Geophysical Research: Space840
Physics, 112 (A12), doi:10.1029/2006JA012138.841
Sandanger, M., F. Søraas, M. Sørbø, K. Aarsnes, K. Oksavik, and D. Evans (2009),842
Relativistic electron losses related to EMIC waves during CIR and CME storms,843
D R A F T May 18, 2016, 5:23pm D R A F T

X - 42 HENDRY ET AL.: POES-DETECTED EMIC PRECIPITATION SURVEY
Journal of Atmospheric and Solar-Terrestrial Physics, 71 (10-11), 1126 – 1144, doi:844
10.1016/j.jastp.2008.07.006.845
Sandanger, M. I., L.-K. G. Ødegaard, H. Nesse Tyssøy, J. Stadsnes, F. Søraas, K. Oksavik,846
and K. Aarsnes (2015), In-flight calibration of NOAA POES proton detectors derivation847
of the MEPED correction factors, Journal of Geophysical Research: Space Physics, doi:848
10.1002/2015JA021388.849
Thorne, R. M. (2010), Radiation belt dynamics: The importance of wave-particle inter-850
actions, Geophysical Research Letters, 37 (22), doi:10.1029/2010GL044990.851
Thorne, R. M., and C. F. Kennel (1971), Relativistic electron precipitation during mag-852
netic storm main phase, Journal of Geophysical research, 76 (19), 4446–4453.853
Troitskaya, V. A. (1961), Pulsation of the Earth’s electromagnetic field with periods of 1854
to 15 seconds and their connection with phenomena in the high atmosphere, Journal of855
Geophysical Research, 66 (1), 5–18, doi:10.1029/JZ066i001p00005.856
Ukhorskiy, A. Y., Y. Y. Shprits, B. J. Anderson, K. Takahashi, and R. M. Thorne (2010),857
Rapid scattering of radiation belt electrons by storm-time EMIC waves, Geophysical858
Research Letters, 37 (9), doi:10.1029/2010GL042906.859
Usanova, M. E., I. R. Mann, I. J. Rae, Z. C. Kale, V. Angelopoulos, J. W. Bonnell,860
K.-H. Glassmeier, H. U. Auster, and H. J. Singer (2008), Multipoint observations of861
magnetospheric compression-related EMIC Pc1 waves by THEMIS and CARISMA,862
Geophysical Research Letters, 35 (17), doi:10.1029/2008GL034458.863
Usanova, M. E., I. R. Mann, J. Bortnik, L. Shao, and V. Angelopoulos (2012), THEMIS864
observations of electromagnetic ion cyclotron wave occurrence: Dependence on AE,865
SYMH, and solar wind dynamic pressure, Journal of Geophysical Research: Space866
D R A F T May 18, 2016, 5:23pm D R A F T
HENDRY ET AL.: POES-DETECTED EMIC PRECIPITATION SURVEY X - 43
Physics (1978–2012), 117 (A10).867
Usanova, M. E., F. Darrouzet, I. R. Mann, and J. Bortnik (2013), Statistical analysis of868
EMIC waves in plasmaspheric plumes from Cluster observations, Journal of Geophysical869
Research: Space Physics, 118 (8), 4946–4951, doi:10.1002/jgra.50464.870
Usanova, M. E., A. Drozdov, K. Orlova, I. R. Mann, Y. Shprits, M. T. Robertson, D. L.871
Turner, D. K. Milling, A. Kale, D. N. Baker, S. A. Thaller, G. D. Reeves, H. E. Spence,872
C. Kletzing, and J. Wygant (2014), Effect of EMIC waves on relativistic and ultra-873
relativistic electron populations: Ground-based and Van Allen Probes observations,874
Geophysical Research Letters, 41 (5), 1375–1381, doi:10.1002/2013GL059024.875
Wang, Z., Z. Yuan, M. Li, H. Li, D. Wang, H. Li, S. Huang, and Z. Qiao (2014), Statistical876
characteristics of EMIC wave-driven relativistic electron precipitation with observations877
of POES satellites: Revisit, Journal of Geophysical Research: Space Physics, 119 (7),878
5509–5519, doi:10.1002/2014JA020082.879
Yando, K., R. M. Millan, J. C. Green, and D. S. Evans (2011), A Monte Carlo simulation880
of the NOAA POES Medium Energy Proton and Electron Detector instrument, Journal881
of Geophysical Research: Space Physics, 116 (A10), doi:10.1029/2011JA016671.882
D R A F T May 18, 2016, 5:23pm D R A F T

X - 44 HENDRY ET AL.: POES-DETECTED EMIC PRECIPITATION SURVEY
Figure 1. MLT vs L-shell distributions of the POES satellites, for 1 < L < 10. For each
satellite, the location of each recorded data point is binned according to its MLT and L-shell,
highlighting the favored MLT regions of each satellite. The combined location for the observations
made by of all seven POES satellites is also shown, in the lower right corner of the figure. For
each plot, L-shell increases radially outwards from the center, while MLT increases in a counter-
clockwise direction with magnetic midnight at the bottom and magnetic noon at the top.
D R A F T May 18, 2016, 5:23pm D R A F T

HENDRY ET AL.: POES-DETECTED EMIC PRECIPITATION SURVEY X - 45
Figure 2. Map of the geographic locations of each detection of the 13 August 2013 EMIC-
induced precipitation region. Red circles indicate riometer locations, yellow stars indicate search-
coil magnetometer locations, solid green diamonds indicate POES satellite relativistic electron
precipitation locations, hollow green diamonds indicate the POES IGRF magnetic conjugate
locations, light blue squares indicate VLF transmitters, and dark blue squares indicate AARD-
DVARK VLF receivers. The red lines indicate the great-circle paths between the VLF trans-
mitters and the AARDDVARK stations. The POES satellite locations are calculated by tracing
down the IGRF field line to an altitude of 110 km. L-shell contours from 3–6 are superimposed
on the map.
D R A F T May 18, 2016, 5:23pm D R A F T

X - 46 HENDRY ET AL.: POES-DETECTED EMIC PRECIPITATION SURVEY
Table 1. Detailed observations for the 13–14 August EMIC event. The POES locations
were determined by tracing down the IGRF field-line to an altitude of 110 km. The locations
of the riometer stations in (c) are the same as the relevant magnetometers in (b). The locations
of the precipitation sources in (d) are somewhere along the path between the VLF transmitter
and AARDDVARK receiver; without further modeling it is not possible to determine the exact
location. For the Halley AARDDVARK receiver, the slight offset from the riometer detection in
(c) suggests the precipitation occurred slightly east of the receiver. For the Edmonton receiver,
the overlap with the Pinawa magnetometer suggests the precipitation occurred directly over
Pinawa.(a) POES Precipitation Observations
Time (UT) Satellite L-shell MLT Latitude (N) Longitude (N)2013/08/13 17:14:30 METOP-01 4.7 20.6 66.0 46.32013/08/13 18:01:12 METOP-02 5.0 20.5 66.5 33.62013/08/13 20:01:18 METOP-01 5.0 20.9 -62.4 42.82013/08/13 20:47:06 METOP-02 5.1 20.7 64.1 347.62013/08/13 21:22:44 METOP-02 4.7 20.9 62.8 345.02013/08/13 21:41:26 METOP-01 4.8 21.0 -67.1 20.542013/08/13 21:51:55 NOAA-16 4.8 20.5 61.4 332.12013/08/13 22:27:16 METOP-02 4.9 21.0 -69.9 10.62013/08/14 00:55:17 NOAA-15 5.0 19.7 51.0 283.12013/08/14 01:13:55 NOAA-16 4.8 20.5 53.5 286.02013/08/14 02:38:35 NOAA-15 4.5 19.8 52.0 265.52013/08/14 02:55:19 NOAA-16 4.5 20.4 52.6 261.8
(b) Magnetometer Wave ObservationsTime start (UT) Time End (UT) Location L-shell MLT Latitude Longitude2013/08/13 17:30 2013/08/13 18:00 Rovaniemi 5.1 20.4–20.9 66.8 25.92013/08/13 22:15 2013/08/13 22:45 Halley 4.7 19.5–20.0 -75.6 333.82013/08/14 02:50 2013/08/14 03:10 Pinawa 4.1 20.2–20.5 50.2 264.0
(c) Riometer Precipitation ObservationsTime start (UT) Time End (UT) Location L-shell MLT Peak ∆absorption (dB)2013/08/13 17:10 2013/08/13 18:10 Rovaniemi 5.1 20.1–21.1 1.12013/08/13 22:40 2013/08/13 22:55 Halley 4.7 20.0–20.2 0.4
(d) AARDDVARK Precipitation ObservationsTime start (UT) Time End (UT) Location L-shell MLT Peak ∆amplitude (dB)2013/08/13 22:25 2013/08/13 22:55 Halley 4.7 19.6–20.2 -8.22013/08/14 02:50 2013/08/14 03:10 Edmonton 4.1 20.2–20.5 -6.4
D R A F T May 18, 2016, 5:23pm D R A F T

HENDRY ET AL.: POES-DETECTED EMIC PRECIPITATION SURVEY X - 47
Figure 3. (a) The geographic longitude of the POES satellite detected EMIC wave driven
electron precipitation spikes against the UT time of their detection. The longitude of the satellite
is calculated by tracing the IGRF field line down from the satellite to an altitude of 110km. These
points are fitted with a linear fit, showing the longitudinal drift of the precipitation region. This
line indicates a drift of approximately 15°/hr. (b) The MLT location of the POES satellite
detected EMIC wave driven electron precipitation spikes against the UT time of their detection.
The y-scale of this plot corresponds to the longitudinal range of the plot in (a). From this it is
clear that detected precipitation spikes are approximately constant in MLT.
D R A F T May 18, 2016, 5:23pm D R A F T

X - 48 HENDRY ET AL.: POES-DETECTED EMIC PRECIPITATION SURVEY
15:00 16:00 17:00 18:00 19:00 20:00 21:00 22:00 23:00 00:00 01:00 02:00 03:00 04:00 05:00 06:00
0
0.2
0.4
0.6
0.8
1
15:00 16:00 17:00 18:00 19:00 20:00 21:00 22:00 23:00 00:00 01:00 02:00 03:00 04:00 05:00 06:00
0
0.2
0.4
0.6
0.8
1
(a)
(b)
(c)
15:00 16:00 17:00 18:00 19:00 20:00 21:00 22:00 23:00 00:00 01:00 02:00 03:00 04:00 05:00 06:00
0
0.5
1
1.5
2
Figure 4. Search-coil magnetometer data from the (a) Rovaniemi, (b) Halley, and (c) Pinawa
magnetometers for the period 2013/08/13 15:00 UT to 2013/08/14 06:00 UT. The solid white
lines superposed on these plots indicate the local time at each site that corresponds to 20:30
MLT, while the dashed white lines indicate 1 hr MLT on either side. The wave-power measured
at each magnetometer is plotted in dB relative to an (different) arbitrary reference. Both panels
(b) and (c) show the x-component of the SCM data, while (a) shows the z-component to avoid
noisy data. In each case, the EMIC signature is clearly visible in each magnetic component.
D R A F T May 18, 2016, 5:23pm D R A F T

HENDRY ET AL.: POES-DETECTED EMIC PRECIPITATION SURVEY X - 49
Figure 5. Observations of the 13 August 2013 EMIC wave precipitation event viewed from
Halley. (a) shows the x-component of the search-coil magnetometer wave-power measured at
Halley, plotted in dB relative to an arbitrary reference, with a rising tone signature clearly
visible from 22:30–22:50. (b) shows the Halley riometer absorption data for the event time as a
solid blue line, with a dashed red line indicating the approximate quiet day curve of the riometer.
(c) shows amplitude data of the NPM VLF transmitter located in Hawaii, USA, as logged by
the Halley AARDDVARK instrument. The blue line indicates the amplitude of the signal, while
the red dotted line indicates an approximate quiet-day curve for the data.
D R A F T May 18, 2016, 5:23pm D R A F T

X - 50 HENDRY ET AL.: POES-DETECTED EMIC PRECIPITATION SURVEY
Figure 6. (a) Comparison of the EMIC wave detection success rate at Halley of the Carson
et al. [2013] POES triggers, shown in blue, compared to triggers chosen to be independent of any
precipitation spikes, shown in red. Triggers are binned by absolute longitudinal distance from
Halley. (b) As above, but with the Athabasca magnetometer.
D R A F T May 18, 2016, 5:23pm D R A F T
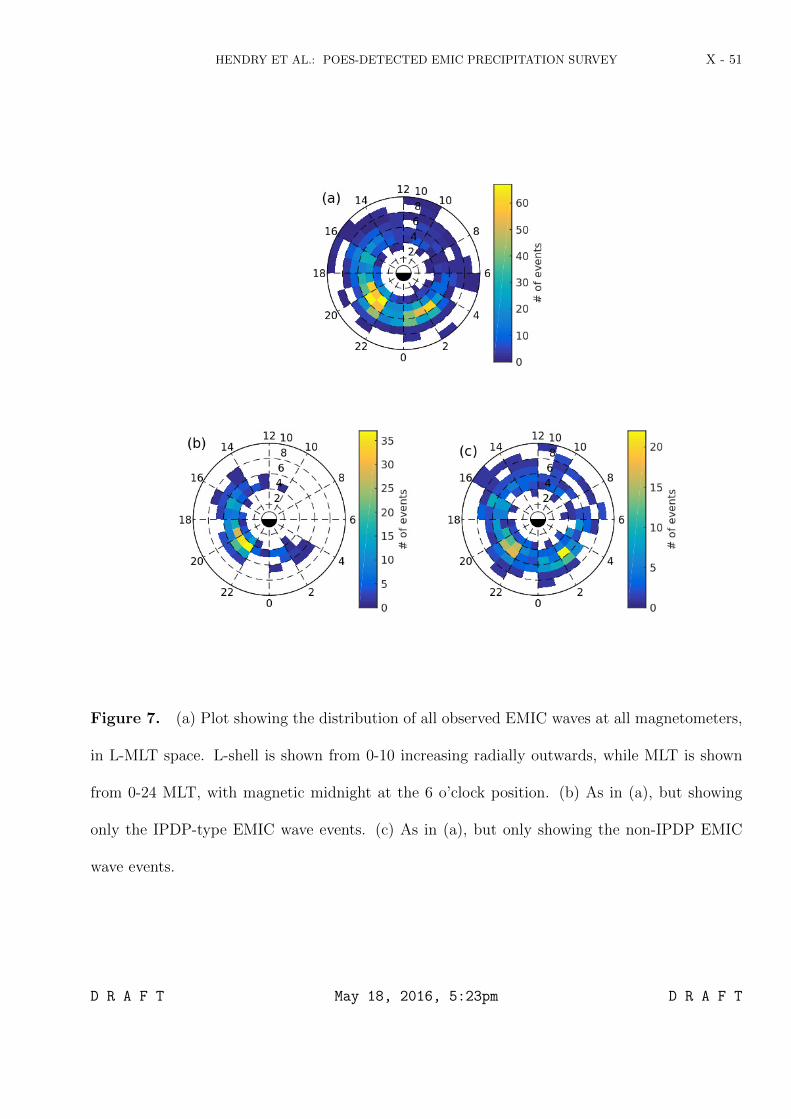
HENDRY ET AL.: POES-DETECTED EMIC PRECIPITATION SURVEY X - 51
Figure 7. (a) Plot showing the distribution of all observed EMIC waves at all magnetometers,
in L-MLT space. L-shell is shown from 0-10 increasing radially outwards, while MLT is shown
from 0-24 MLT, with magnetic midnight at the 6 o’clock position. (b) As in (a), but showing
only the IPDP-type EMIC wave events. (c) As in (a), but only showing the non-IPDP EMIC
wave events.
D R A F T May 18, 2016, 5:23pm D R A F T