Embed Size (px)
Citation preview
1
Experiment
GASES: BOYLE'S LAW
The CCLI Initiative
Computers in Chemistry Laboratory Instruction
LEARNING OBJECTIVES
The objectives of this experiment are to . . .
• introduce the concepts and units of pressure, volume and temperature.
• experimentally determine the relationship between pressure and volume, using the MicroLABinterface system to collect and analyze the data.
BACKGROUND
One of the major differences between gases and solids or liquids are that the volume of a sample of gas varieswhen pressure or temperature is changed to a much greater extent than do the volumes of solids and liquids.Solids and liquids are also affected by temperature and pressure, but the magnitude of the volume changeis very small. When the densities of solids and liquids are measured, there is little need to controltemperature or pressure. Within normal limits of measurement precision, these densities are the same undersomewhat different laboratory conditions. As you will observe in this experiment, the density of a sampleof gas is much more sensitive to changes in temperature and pressure. The dependence of the density onthese two factors is determined by varying the pressure and the temperature separately.
Pressure is defined as the force per unit area. A gas exerts pressure on any surface it touches. Thus, air,which is a mixture of gases, exerts pressure on the surface of the earth. This pressure is called atmosphericpressure. It depends on the mass of air above the surface and thus will be affected by wind conditions andby the relative elevation of the surface of the earth where the measurement is made. The standardatmosphere (1 atm) is defined as 101.325 kPa. A pascal (Pa) is the SI unit of pressure, which is the forceof one newton exerted on an area of one square meter.
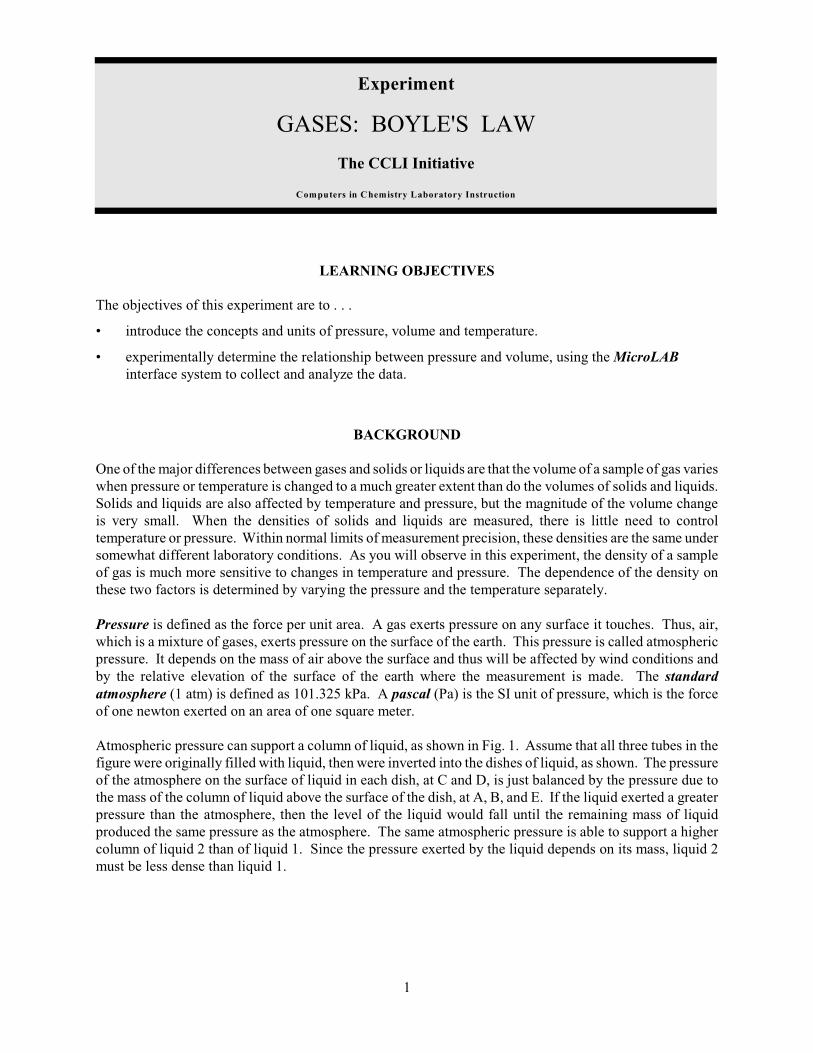
Atmospheric pressure can support a column of liquid, as shown in Fig. 1. Assume that all three tubes in thefigure were originally filled with liquid, then were inverted into the dishes of liquid, as shown. The pressureof the atmosphere on the surface of liquid in each dish, at C and D, is just balanced by the pressure due tothe mass of the column of liquid above the surface of the dish, at A, B, and E. If the liquid exerted a greaterpressure than the atmosphere, then the level of the liquid would fall until the remaining mass of liquidproduced the same pressure as the atmosphere. The same atmospheric pressure is able to support a highercolumn of liquid 2 than of liquid 1. Since the pressure exerted by the liquid depends on its mass, liquid 2must be less dense than liquid 1.
2
Figure 1. Column of liquid supported by atmospheric pressure.
Measurement of the height of a column of liquid,supported by a gas, in a tube of uniform diameter, isa convenient way of measuring pressure. The verydense liquid metal, mercury, is usually used tomeasure pressure. A column of mercury 760.0 mmhigh exerts a pressure of 1 atm or 101.3 kPa.Laboratory measurements are thus often expressedas mm Hg, or mm of Hg. One mm of Hg is alsodefined as one torr. The density of Hg is 13.6 g/cm3
and that of water is 1.00 g/cm . A column of3
mercury is therefore 13.6 times heavier than acolumn of water of the same height and diameter, sothat the column of mercury will exert a pressure13.6 times as great as the same column filled withwater. A given atmospheric pressure can support acolumn of water which is 13.6 times as high as thecolumn of mercury. This is one reason mercury is used in barometers and manometers for measuringpressure; a water barometer would have to be 34 feet high!
Robert Boyle, a British chemist, was one of the first to study gases quantitatively. In one set of experiments,Boyle established a relationship between the pressure and volume of a gas at constant temperature. He foundthat at a constant temperature, the volume (V) occupied by a definite mass of gas is inversely proportionalto the applied pressure (P). This is known as Boyle's Law. Mathematically, this relationship can be statedas follows:
V " 1/P (1)
The symbol """ means "is proportional to." Boyle's Law can also be stated as: for a given amount of gas at
a constant temperature, the product of the pressure and the volume is a constant. If we replace the
proportionality constant in the previous equation with a constant of proportionality, we will obtain another
form of Boyle's Law.
V = k (1/P) or PV = k (2)
We shall see how this is derived experimentally in today’s experiment.
SAFETY PRECAUTIONS
No chemicals are used in this experiment, so there is no concern for chemical hazards. Eye protection should
be worn in case there is a rupture of the apparatus under pressure.

3
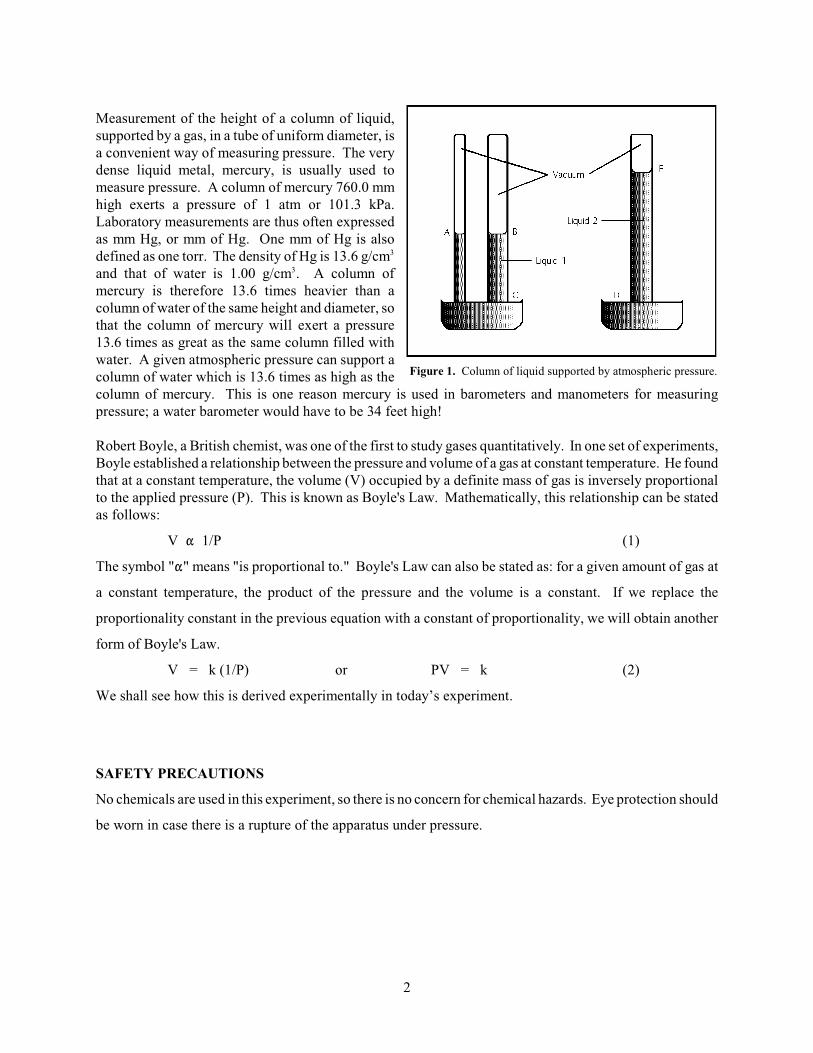
Figure 2. Equipment set-up
BEFORE PERFORMING THIS EXPERIMENT . . .
...you will need a MicroLAB program capable of
• Measuring pressure from an absolute pressure sensor and inputting the corresponding volume from the
keyboard. Choose the Boyle’s Law from the Gas Laws tab on the opening window.
EXPERIMENTAL PROCEDURE
Boyle's Law
Equipment set-up
You will use a large, 60 ml syringe to measure the volumes for this experiment, and to generate the pressures
as shown in Figure 2. Attached to the syringe by a short piece of Tygon tube will be a Y or T tube, which
will also have short pieces of Tygon tube attached to the remaining openings of the tube. This will be
attached to the pressure sensor as described below for measuring the pressure. The open end of the Y tube
should either have a valve or a screw clamp to facilitate isolation from atmospheric pressure.
Pressure sensor set-up
1. Read the atmospheric pressure from the barometer, convert from inches to torr if necessary and record
atmthe value in torr as P in your lab notes.
2. The MicroLAB pressure sensor is factory calibrated, but you
should check to make sure everything is working properly as
follows:
a. Under the Data Sources/Variables view, click on
the pressure sensor and click on Edit. This will open
up the Calibration window.
b. Make sure the radio button labeled Factory
Calibrated “Torr” is clicked, then click Finish.
3. Before starting data collection, you should check that the
pressure being measured by the MicroLAB is the same,
within a percent or two, as the pressure you determined from
the barometer. If it is not, consult with your instructor.
Collecting the data
Small volume (choose a file name for this section of the experiment: _____________)
1. If necessary, reopen the MicroLAB by Double clicking the icon, click on the Gas Laws tab, and select
the experiment named Boyle’s Law, and press Enter. Type in your file name, click Enter, and you
should be in the program.
2. With the syringe at 15 mL, tighten the screw clamp. (15 ml will be your return volume for all
measurements in this section.)
4
3. While one student presses the syringe into the 10 ml volume, the other student enters the total volume,
then Enter. (Don’t forget to add the volume of the Y tubing.)
4. Release the plunger, open the screw clamp, adjust the plunger to exactly 15.0 ml again (the return
volume), then Enter to get the reading at 15.00 mL. Now retighten the screw clamp.
5. Again, while one student pulls the syringe out to the 20 ml volume, the other student enters the total
volume, then Enter. (Don’t forget to add the volume of the Y tubing.)
6. Continue the above procedure for all volumes of 25 through 60 ml at five ml increments of the syringe.
Middle volume (File name: )
1. Again select Perform an Experiment, and continue as in step one above for small volume.
2. This time use 30 ml as your return volume, repeating the above steps for 20 ml through 60 ml at five
ml increments of the syringe.
Large volume (File name: )
1. Again select Perform an Experiment, and continue as in step one above for middle volume.
2. This time use 45 ml as your return volume, repeating the above steps for 30 ml through 60 ml at five
ml increments of the syringe.
DATA ANALYSIS
Data Manipulations
1. For each different PV set of measurements open the file in the spreadsheet, and using the Add
Formula function, calculate the product of P times V and drag it to column C. Using the Statistical
function by right clicking on Column C, determine the mean and standard deviation (the standard
deviation represents the ?standard error” on the mean value) of the data in column C and record these
in your lab book and in T1 in your lab report. Calculate a percent error value on the standard deviation
for each of the data sets and add this to the table. Insert this table, T1, containing the data for each of
the three PV data sets, within the body of the Results and Conclusions section of your written report.
The P vs. V table on your experiment write up is an example of how this should be set up.
2. Graph your dependent variable on Y, and your independent variable on X for each PV data set. Print
these graphs with the spreadsheet data and the appropriate title as described above. (G1.1-G1.3 set)
3. Compare your graphs against the attached series of graphs to determine what mathematical
transformation could be used to make your data linear. (HINT: To decide on the transformation to
use, think about what you physically “felt” in the qualitative pressure/volume experiments as you
adjusted the syringe plunger. CAUTION: Going for the highest correlation coefficient is not always
the best approach if the transform necessary to achieve it is not realistic or does not conform to the
experimentally observed conditions. It is possible to find a transform that will give a perfect
correlation, but may not correspond to the physics or chemistry of the experiment.) Using the Add
Formula function, calculate this transformation, drag it to Column D and the X-axis and using the

5
Analysis function, add a Linear Curve fit to the data, then drag the curve fit to the Y-2 axis. Print
each of these as Graphs G2.1, G2.2 and G2.3 (Remember to do the transform on the independent
variable and then graph the transform on the X axis.)
4. Add the value of the ?slope” from each linear graph (G2.1 - G2.3) to table T1 for each of the three PV
data sets?
5. Calculate the percent difference between the slope and the P*V product for each data set in table T1,
and add this value to table T1.
6. Using PV = nRT, calculate “n” for each PV data point set of the three gas volume series, determine
the mean, standard deviation and % error on the mean for each, and add that data to your table of data.
Questions
1. What is the name of the type of curves that are produced by the Pressure / Volume data? If you don’t
know this, then go to your algebra books, other students, a math major etc. to find out.
2. Discuss the relationship between the slope for each PV data set and the mean P*V product for that
data set, including whether they should be the same and why or why or not.
3. Can you explain the change in the difference between the slope and P*V product from the small
volume set to the large volume set? (HINT: Think about the defining conditions and the units for the
Ideal Gas Law constant!)
4. Which variable, pressure or volume, is measured with the least number of significant digits, i.e., what
is the limiting precision in this experiment?
5. Look up Boyle’s Law in your text book. (Cite your reference!) Are your data consistent with
Boyle’s Law within the precision of this experiment? Support this with data in your answer
6. The graphs of 1/X and 1/logX appear similar. Why is 1/logX not a good choice for modeling in this
experiment?
(T1.1 Include an expanded table like this in your Results and Conclusions section.)
Experiment P*V
mean
Std.
Dev.
%err. on
P*V
mean
Lin.
Reg.
Slope
% Diff.
(P*V vs
slope)
“n”
mean
value
Std.
Dev.
on “n”
% err.
on “n”
mean
Small Vol.
Med. Vol.
Large Vol.

6

7