Embed Size (px)
Citation preview

Ai
Fa
b
c
d
e
f
a
ARRA
KPPTRPPSM
1
al[piu
MT
h0
Computerized Medical Imaging and Graphics 38 (2014) 764–773
Contents lists available at ScienceDirect
Computerized Medical Imaging and Graphics
j ourna l h omepa ge: www.elsev ier .com/ locate /compmedimag
5D computational phantom for pharmacokinetic simulation studiesn dynamic emission tomography
otis A. Kotasidisa,b,∗, Charalampos Tsoumpasc,d, Irene Polycarpouc, Habib Zaidia,e,f
Division of Nuclear Medicine and Molecular Imaging, Geneva University Hospital, Geneva, SwitzerlandWolfson Molecular Imaging Centre, MAHSC, University of Manchester, Manchester, UKDivision of Imaging Sciences and Biomedical Engineering, King’s College London, King’s Health Partners, St. Thomas’ Hospital, London, UKDivision of Medical Physics, University of Leeds, Leeds, UKGeneva Neuroscience Centre, Geneva University, Geneva, SwitzerlandDepartment of Nuclear Medicine and Molecular Imaging, University of Groningen, University Medical Center Groningen, Groningen, The Netherlands
r t i c l e i n f o
rticle history:eceived 9 January 2014eceived in revised form 22 May 2014ccepted 27 June 2014
eywords:arametric imagingharmacokineticsomographyespiratory motionhantomETPECTR
a b s t r a c t
Introduction: Dynamic image acquisition protocols are increasingly used in emission tomography for drugdevelopment and clinical research. As such, there is a need for computational phantoms to accuratelydescribe both the spatial and temporal distribution of radiotracers, also accounting for periodic andnon-periodic physiological processes occurring during data acquisition.Methods: A new 5D anthropomorphic digital phantom was developed based on a generic simulationplatform, for accurate parametric imaging simulation studies in emission tomography. The phantom isbased on high spatial and temporal information derived from real 4D MR data and a detailed multi-compartmental pharmacokinetic modelling simulator.Results: The proposed phantom is comprised of three spatial and two temporal dimensions, includingperiodic physiological processes due to respiratory motion and non-periodic functional processes dueto tracer kinetics. Example applications are shown in parametric [18F]FDG and [15O]H2O PET imaging,successfully generating realistic macro- and micro-parametric maps.Conclusions: The envisaged applications of this digital phantom include the development and evaluation
of motion correction and 4D image reconstruction algorithms in PET and SPECT, development of protocolsand methods for tracer and drug development as well as new pharmacokinetic parameter estimationalgorithms, amongst others. Although the simulation platform is primarily developed for generatingdynamic phantoms for emission tomography studies, it can easily be extended to accommodate dynamicMR and CT imaging simulation protocols.© 2014 Elsevier Ltd. All rights reserved.
. Introduction
The continuous development of anthropomorphic and smallnimal computational phantoms during the last few decades hased to their ever increasing use in clinical and preclinical research1]. The improved level of their realism and flexibility compared to
hysical phantoms has led to their widespread use and adoptionn emission tomography. The ability to perform simulation studiessing these computational phantoms allows a number of methods
∗ Corresponding author at: Geneva University Hospital, Division of Nuclearedicine and Molecular Imaging, CH-1211 Geneva, Switzerland.
el.: +41 22 372 7257.E-mail address: [email protected] (F.A. Kotasidis).
ttp://dx.doi.org/10.1016/j.compmedimag.2014.06.018895-6111/© 2014 Elsevier Ltd. All rights reserved.
and techniques used in the field of medical imaging and morespecifically emission tomography to be developed, evaluated andvalidated under controlled and known conditions.
Three-dimensional computational phantoms fall into threecategories based on their design principle: mathematical styl-ized phantoms, voxelized phantoms and hybrid equation-voxelphantoms. Mathematical phantoms use mathematical equationsto approximate the surface of simple and complex body struc-tures. A number of such designs exist in the literature, such asthe Shepp–Logan [2] and the mathematical cardiac-torso (MCAT)phantoms [3]. Such designs are useful, but their inability to model
complex structures limits their application, especially since thereis need for more realistic simulation studies [4].On the other hand, voxelized phantoms are based on using seg-mented anatomical information from high resolution tomographic
cal Im
diTio
vmpaTb
atrhirf[dMi[
icnopmditpre(sotAspalt[os[
i(tpindpaak(o
F.A. Kotasidis et al. / Computerized Medi
ata (CT or MRI). A number of voxelized phantoms exist, cover-ng anatomical variants (age, sex, body weight, height etc) [5–9].heir main advantage is the level of realism compared to styl-zed approaches; however, it fails to provide the level of flexibilityffered by mathematical phantoms.
The need to combine the detailed anatomical information pro-ided by voxelized phantoms with the flexibility offered by theathematical phantoms, has led to the development of hybrid
hantoms [10]. These models enable the combination of flexibilitynd realism within a single anatomical phantom representation.he most popular is the non-uniform rational B-splines (NURBS)-ased cardiac-torso (NCAT) phantom [11,12].
All these three-dimensional (3D) computational phantoms offer relatively simple and practical simulation platform, but fail toake into account time-dependent physiological processes occur-ing during the course of the imaging process. Consequently, thisas led to the development of four-dimensional (4D) phantoms
ncorporating time-dependent processes, such as cardiac and respi-atory motion. The NCAT phantom and the latest generation in thisamily of phantoms, the extended cardiac-torso phantom (XCAT)13] were generated from multi-detector respiratory-gated CTata, to model cardiac and respiratory motion. Similarly, dynamicRI has also been used to derive the motion information, which
s then used in a four-dimensional (4D) simulation framework14,15].
Although such 4D phantoms combine accurate anatomicalnformation with models of temporally periodic physiological pro-esses, they do not take into account the variable and temporallyon-periodic functional processes occurring during the coursef the study, constraining the level of realism and thus theirotential application in dynamic studies. However, the need forore accurate quantification both in clinical research and drug
evelopment has lead to the increasing use of dynamic imag-ng protocols [16]. Moreover, pharmacokinetic analysis of theime course of the activity distribution enables more targetedhysiological parameters, such as blood flow, metabolism andeceptor occupancy, to be derived. In many studies, such param-ters are more informative compared to standardized uptake valueSUV) index, which remains the most widely adopted metric intatic whole-body PET imaging [17]. Consequently, the devel-pment of realistic digital phantoms for multi-compartmentalracer kinetic studies in dynamic PET and SPECT is of interest.lthough a number of studies in the field of image recon-truction and kinetic modelling have used in-house developedarametric phantoms, they often feature roughly approximatednatomical structures with simple geometrical shapes, whileacking the anatomical and physiological variability caused byemporally periodic phenomena such as respiratory motion18–22]. Recently a variant of the XCAT phantom was devel-ped, named the perfusion cardiac-torso phantom (PCAT), but itscope was limited to dynamic perfusion studies in cardiac imaging23].
In this work, using high resolution anatomical and temporalnformation from real MR data, we develop a five-dimensional5D) computational anthropomorphic phantom, incorporatingemporal gating from respiratory induced body motion and com-artmental modelling tracer kinetic capabilities for parametric
maging simulation studies in dynamic emission tomography. Thisew voxelized phantom, allows respiratory gated and non-gatedatasets to be simulated along with any tracer-specific com-artmental model representing the temporal distribution of thectivity concentration during dynamic imaging protocols in PET
nd SPECT. Rather than being region and application specific,inetic parameters are freely assigned in the entire field-of-viewFOV), generating voxel-wise parametric maps based on the tracerf interest.aging and Graphics 38 (2014) 764–773 765
2. Methods
This section describes the generic methodology used by thesimulation platform for generating 5D parametric imaging sim-ulation phantoms using MR information for discerning anatomyand motion along with a kinetic modelling simulator and a virtualtomograph.
2.1. The KCL–HUG series 5D phantom
2.1.1. 3D anatomical phantomAnatomical information are obtained from a high resolution
3D MRI scan and different organ structures are segmented inorder to generate the anatomical regions comprising the phan-tom, as described in Tsoumpas et al. [24] and Buerger et al. [25].Segmentation of the major structures is performed using a semi-automatic algorithm with local thresholding [25]. This allows fastgeneration of 3D anatomical phantoms, facilitating personalizedpatient-specific anatomical phantom designs, derived from a realMR scan. Apart from template organ structures segmented from theMRI data, tumours of varying characteristics (e.g. size and traceruptake) can be manually inserted in different phantom regions.However, since these tumours represent additional patient-specificstructural variants, they can easily be manipulated. Other anatom-ical variants can also be included depending on the requiredanatomy and simulation conditions. Tumours or other anatomicalvariants can be manually delineated/drawn on the 3D anatomi-cal phantom and the tumour ROI mask can be saved and givena separate value, different to the region it is embedded within.The complete anatomical phantom is a superposition of separateregions segmented from the MRI data.
2.1.2. 4D dynamic phantom for 1- and 2-tissue modelsTo describe the temporal distribution of a given tracer and sim-
ulate time–activity curves (TACs), custom-made software capableof providing multi-compartmental modelling for 1- and 2-tissuemodels was developed. Given an input function, a temporalsampling protocol and known tracer-specific pharmacokineticparameters (constant rates) controlling the bi-direction flux of thetracer between the blood and tissue compartments (for each organstructure in the anatomical phantom), TACs are generated. Typ-ical input functions derived from arterial sampling can be used,along with user defined ones, based on a parameterized model.For the sampling protocol, any number of frames and frame dura-tions can be accommodated within the typical scan times used fordynamic studies in emission tomography. A blood volume compo-nent can also be included to generate the simulated TACs, sincetypically both tissue and blood components are sampled at thevoxel level in clinical acquisitions. The same principles apply forthe different kinetic parameters used, with separate constant ratesfor the different organs and values obtained from the literature,if a generic activity distribution is to be realized. Alternatively, ifa dynamic emission scan is available from a patient, personalizedpatient-specific pharmacokinetic parameters can be used based onmean organ parameters. Although individual micro-parameters arethe endpoint parameters of interest, in some applications certainmacro-parameters, such as the volume of distribution (VT) and thetracer’s net uptake rate into the irreversibly bound compartment(Ki) are often more relevant and provide a more complete pic-ture of the underlying patho-physiology. These macro-parametersare combinations of micro-parameters and can easily be adjustedto reflect specific conditions. Generic schematic diagrams for a
single-tissue and a two-tissue compartment model, used to gen-erate the dynamic phantom image sequence, are shown in Fig. 1.The time-dependent activity concentration in the tissue CT, can bedescribed as a convolution of the impulse response function (IRF),
766 F.A. Kotasidis et al. / Computerized Medical Imaging and Graphics 38 (2014) 764–773
Fmt
wtsb
C
wbp
K
wtpibtfsfr
b
C
w
a
a
a
ivtcct
C
Fig. 2. Schematic diagram of a single-tissue model at two different target regions.As the injected bolus passes through the blood stream it becomes dispersed while its
ig. 1. Schematic diagram of a single-tissue (top) and a two-tissue (bottom) kineticodels showing the different compartments as well as the constant rate controlling
he rate of change in activity concentration for each compartment.
hich is the response of the system to a delta-function, with theime-dependent activity concentration in the plasma CP. For theingle-tissue model, the time-course of the activity distribution cane described as
T = IRF (K1, k2, t) ⊗ CP = K1e−k2t ⊗ CP = K1e−(K1/VT )t ⊗ CP (1)
here K1 is the plasma to tissue rate constant (ml/s/ml). K1 cane further parameterized, based on the Renkin–Crone model, as aroduct of blood flow (perfusion) and extraction fraction as
1 = EF =(
1 − e−(PS/F))
F (2)
here PS is the permeability surface area product, E is the extrac-ion fraction and F is the blood flow [26,27]. For tracers with highermeability surface area product, extraction is close to unity and
s independent of flow and therefore K1 provides a measure oflood flow [28]. The platform is highly flexible, enabling to definehe plasma-to-tissue influx rate by adjusting the permeability sur-ace product and subsequently the extraction fraction, based on theelected tracer. Alternatively, one can directly assign a fixed valueor K1. Similarly, k2 can be given directly or as a ratio of the influxate (K1) and volume of distribution (VT).
For the two-tissue model, the time-course of the activity distri-ution can be described as
T = IRF(K1, k2, k3, k4, t) ⊗ CP = K1
(a2 − a1)[(k3 + k4 − a1) e−a1t
+ (a2 − k3 − k4) e−a2t] ⊗ CP (3)
here
1 = (k2 + k3 + k4) −√
(k2 + k3 + k4)2 − 4k2k4
2(4)
nd
2 = (k2 + k3 + k4) +√
(k2 + k3 + k4)2 − 4k2k4
2(5)
Simple or complex models can be realized in different organs,ncluding dual input function models simulating both arterial andenous blood supply in certain organs such as the liver [29]. Fur-hermore, the differential temporal distribution of the activityoncentration in the blood as it circulates through the blood vessels,
an be taken into account, with differential delay and dispersion inhe input function in adjacent regions (Fig. 2) [30]:P′ (t) = CP (t − �t) + �
dCP (t − �t)dt
(6)
arrival time is shifted. The option to use different delay and dispersion parametersfor each organ in the phantoms improves the level of realism compared to using acommon delay and dispersion for the entire phantom.
Given an input function CP(t), a delay (�t) and a dispersion coef-ficient (�) one can estimate CP
′(t). The tracer’s radioactive decay canalso be taken into account and incorporated into the operationalequations as a global parameter.
TACs are assigned at the voxel level, generating time seriesof voxelized phantoms (4D phantom) with a temporal samplingdictated by the dynamic acquisition protocol selected during theTAC generation. Although only the case for single- and two-tissuemodels is presented in this work, the simulation platform allowsany kinetic model variant to be accommodated with an increas-ing degree of complexity and is therefore applicable for simulatingkinetics for any tracer and protocol.
2.1.3. 5D phantom using MR-derived motion fieldsSo far the 4D phantom corresponds to a single reference position
without including any information regarding respiratory motion.To simulate different types of realistic motion during a dynamicscan, the fast analytic simulation toolkit (FAST) is used [15]. Adynamic 4D MRI scan, providing uniform temporal sampling overconsecutive respiratory cycles during the dynamic scan, is used togenerate the motion fields. This is achieved using the amplitudesignal from a virtual navigator and selecting a number of dynamicimages from different phases of the respiratory cycle as the respi-ratory gates. A reference gate is then selected with the remaininggates being registered to the reference gate, in order to generate themotion fields. These MR-generated motion fields are subsequentlyused to warp the dynamic phantom emission data and generatea number of respiratory gates for each time frame in the dynamicimage sequence. Using this methodology, deep and shallow breath-ing can be simulated along with other non-periodic types of motion.If anatomical variants, such as tumours, are utilized in the phantom,motion is simulated similar to the rest of the regions. Therefore, thetumour’s shape (along with the other regions) is deformed based onthe motion fields, and as such, the deformation depends on wherethe tumour is located.
2.1.4. 5D projection data
The simulated gated dynamic emission and attenuation datacan then be used in conjunction with any medical imaging sim-ulation package which models the physics, image acquisitionand detector properties of medical imaging systems. Data can be
cal Imaging and Graphics 38 (2014) 764–773 767
for
3i
patawafa
3
caucsidcbscct4suepldaaivttpb
3
tacidf[
C
ttcs
Table 1Simulated kinetic parameter for the single-tissue model.
K1 (ml/s/ml) k2 (ml/s/ml) bv (ml/ml) VT (ml/ml)
Lungs 0.0008 0.0014 0.06 0.6Bone 0.0018 0.0027 0.00 0.69Soft tissue 0.0005 0.0042 0.00 0.12Ventricles 0.0000 0.0000 1.00 0.00Myocardium 0.0167 0.0183 0.15 0.91Tumours 0.0098 0.0161 0.08 0.61
F.A. Kotasidis et al. / Computerized Medi
orward projected to generate projection datasets for investigationf numerous methods and techniques for motion correction, imageeconstruction, and kinetic parameter estimation.
. Application in metabolic and blood flow PET parametricmaging
In order to evaluate the phantom design and demonstrate theotential application of this simulation platform in drug, clinical,lgorithmic and methodology development, different clinical pro-ocols were realized. Two dynamic PET protocols corresponding to
metabolic imaging study with [18F]FDG and a perfusion studyith [15O]H2O were simulated and reconstructed. Subsequently
nd following image reconstruction, full kinetic analysis was per-ormed on the dynamic datasets and parametric maps of micro-nd macro-parameters were generated.
.1. 3D anatomical phantom
To generate the anatomical phantom, high resolution anatomi-al information (2 × 2 × 2 mm3), covering the thoracic and upperbdominal area have been obtained from a healthy volunteersing MRI data [25]. As cortical bone is not normally visible usingommon MR sequences, an ultra-short echo-time (UTE) 3D MRIequence was acquired (TR 6.5 ms, flip angle 10◦) obtaining onemage during the free induction decay (TE1 = 0.14 ms) and oneuring the first echo time (TE2 = 4.6 ms). Data were respiratoryorrected to the end-exhale position. From the difference imageetween the 2 UTE images, a number of regions of interest wereegmented (soft tissue, cortical bones, liver and lungs) and used toonstruct the anatomical phantom. The myocardium, heart ventri-les and large vessels were also segmented using a different ECGriggered balanced B-TFE MRI scan during free breathing (TR/TE.7 ms/2.36 ms, TFE factor 26, flip angle of 90◦) [15,31]. The scan wasubsequently respiratory gated again to the end-exhale positionsing a virtual navigator. Based on these two MRI scans, the differ-nt segmented regions were combined to generate the anatomicalhantom. Nine tumours of varying size were also embedded in the
ung (3), liver (3) and dome of the diaphragm (3). The tumours wererawn on the phantom and the tumour masks were inserted as sep-rate regions. The anatomical phantom was then sub-sampled to
volumetric resolution of 2 × 2 × 2 mm3 in order to represent typ-cal voxel resolution encountered in PET imaging, with an imageolume of 336 × 336 × 81 voxels. Based on the segmented organshat were used to generate the anatomical phantom, an attenua-ion map was also generated using a 4-region classification of thehantom.(air: 0 cm−1, lung: 0.03 cm−1, soft tissue: 0.099 cm−1, andone: 0.15 cm−1).
.2. 4D dynamic phantom for [15O]H2O and [18F]FDG models
Two dynamic PET protocols were simulated, corresponding toypical [15O]H2O and [18F]FDG scanning sessions and representing
single-tissue and a two-tissue model. For the [15O]H2O proto-ol, TACs were generated using a single-tissue 3 parameter model,ncluding a blood volume component (K1, k2, bv). A 360 s total scanuration was selected binned into 28 non-uniformly sampled timerames [14 × 5 s, 5 × 10 s, 3 × 20 s, 6 × 30 s], representing a typical15O]H2O protocol [32]:
T = IRF(K1, k2, t) ⊗ CP + bvCp = K1e−k2t ⊗ Cp + bvCp (7)
For the [18F]FDG protocol, TACs were generated using a two-
issue 4 parameter model assuming irreversible kinetics duringhe course of the scan (k4 = 0) and including also a blood volumeomponent (K1, k2, k3 and bv). A 3300 s total scan duration was cho-en binned into 29 non-uniformly sampled time frames [9 × 10 s,Liver 0.0117 0.0119 0.05 0.98
3 × 30 s, 4 × 60 s, 4 × 120 s, 8 × 300 s] [33]:
CT = IRF (K1, k2, k3, t) ⊗ CP + bvCp
= K1
(e−(k2+k3)t + k3
(k3 + k2)(1 − e−(k2+k3)t)
)⊗ Cp + bvCp (8)
In both imaging protocols, a single input function model wasused, representing delivery through arterial blood, while no differ-ential delay and dispersion were used in simulating the kineticsfor the different regions, with a common reference delivery timebetween them. Furthermore, kinetic parameters derived from theliterature, summarized in Tables 1 and 2, were used to generatethe dynamic data. For the [15O]H2O study, a measured input func-tion was used while for the [18F]FDG data a population based inputfunction was used.
3.3. Respiratory data
4D MR data were also acquired from the same healthy volun-teer, providing a uniform temporal sampling of a few completerespiratory cycles (∼25 s dynamic acquisition with 0.7 s temporalsampling—35 dynamic image volumes) as described by Buergeret al. [25]. An amplitude signal from a virtual navigator on thediaphragm dome was then generated and 8 dynamic images werechosen to sample a full respiratory cycle. Subsequently, each gatedimage, corresponding to a different phase in the respiratory cycle,was registered to the reference gate (i.e. end-exhale position) toestimate the corresponding motion fields, using a local affine reg-istration algorithm [34]. Using the MRI-derived motion fields, thedynamic emission phantom images were warped into 8 differentphases over the respiratory cycle, representing a shallow breath-ing pattern. Therefore, 8 gated 3D images were generated foreach time frame in the dynamic 4D phantom (3 spatial dimen-sions {336 × 336 × 81} × 28/29 time frames × 8 respiratory gates).Attenuation data were treated similarly, generating 8 gated atten-uation maps for each phase in the respiratory cycle, but usingthe same gated maps for all the time frames since no motionbetween the kinetic modelling time frames was taken into accountin this study (3 spatial dimensions {336 × 336 × 81} × 8 respiratorygates).
3.4. 5D projection data
To generate the forward projected data, an in-house simulatorwas used. The dynamic emission images for each respiratorygate and time frame along with the respiratory gated atten-uation images, were forward projected into a virtual scannerusing Siddon’s line of response driven algorithm, along withthe geometry configuration of the Biograph 6 Barrel HiRezPET/CT scanner (Siemens Molecular Imaging Inc.TN, USA) [35].
Both the noiseless emission as well as attenuation projectiondata were histogrammed into a 336 × 336 × 313 3D sinogram(336 × 336 × 313 × 28/29 time frames × 8 respiratory gates for theemission data and 336 × 336 × 313 × 8 respiratory gates for the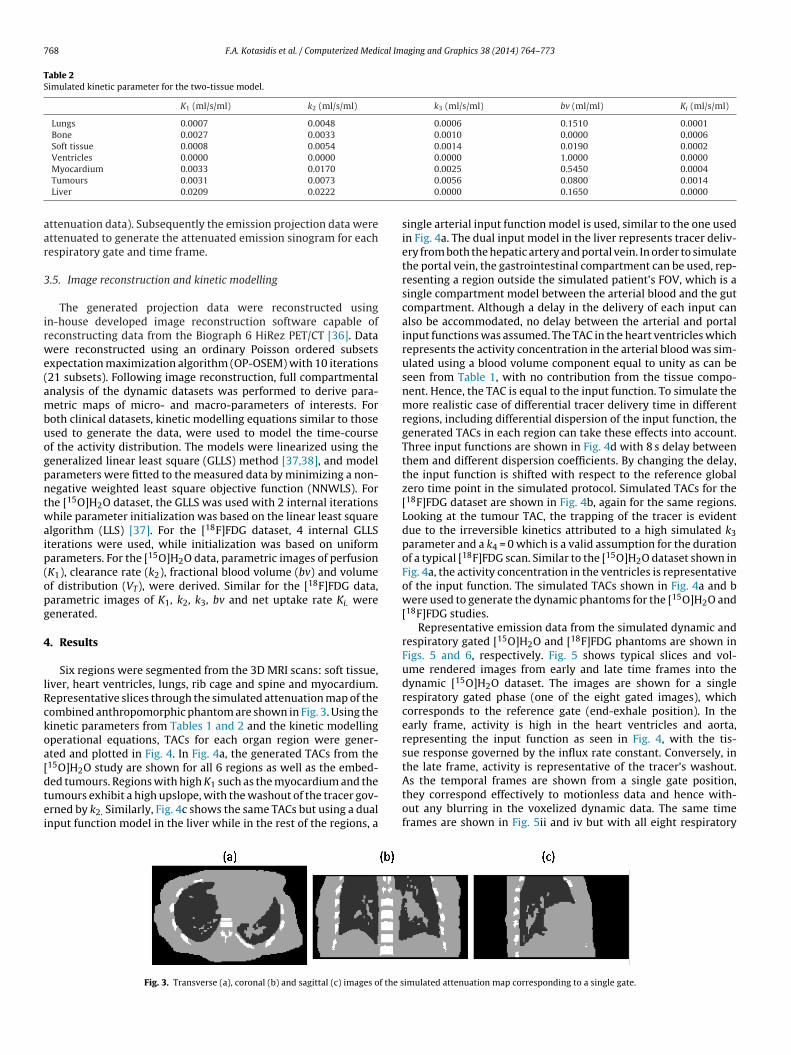
768 F.A. Kotasidis et al. / Computerized Medical Imaging and Graphics 38 (2014) 764–773
Table 2Simulated kinetic parameter for the two-tissue model.
K1 (ml/s/ml) k2 (ml/s/ml) k3 (ml/s/ml) bv (ml/ml) Ki (ml/s/ml)
Lungs 0.0007 0.0048 0.0006 0.1510 0.0001Bone 0.0027 0.0033 0.0010 0.0000 0.0006Soft tissue 0.0008 0.0054 0.0014 0.0190 0.0002Ventricles 0.0000 0.0000 0.0000 1.0000 0.0000
aar
3
irwe(ambuogpntwaip(opg
4
lRckoa[dtei
Myocardium 0.0033 0.0170
Tumours 0.0031 0.0073
Liver 0.0209 0.0222
ttenuation data). Subsequently the emission projection data werettenuated to generate the attenuated emission sinogram for eachespiratory gate and time frame.
.5. Image reconstruction and kinetic modelling
The generated projection data were reconstructed usingn-house developed image reconstruction software capable ofeconstructing data from the Biograph 6 HiRez PET/CT [36]. Dataere reconstructed using an ordinary Poisson ordered subsets
xpectation maximization algorithm (OP-OSEM) with 10 iterations21 subsets). Following image reconstruction, full compartmentalnalysis of the dynamic datasets was performed to derive para-etric maps of micro- and macro-parameters of interests. For
oth clinical datasets, kinetic modelling equations similar to thosesed to generate the data, were used to model the time-coursef the activity distribution. The models were linearized using theeneralized linear least square (GLLS) method [37,38], and modelarameters were fitted to the measured data by minimizing a non-egative weighted least square objective function (NNWLS). Forhe [15O]H2O dataset, the GLLS was used with 2 internal iterationshile parameter initialization was based on the linear least square
lgorithm (LLS) [37]. For the [18F]FDG dataset, 4 internal GLLSterations were used, while initialization was based on uniformarameters. For the [15O]H2O data, parametric images of perfusionK1), clearance rate (k2), fractional blood volume (bv) and volumef distribution (VT), were derived. Similar for the [18F]FDG data,arametric images of K1, k2, k3, bv and net uptake rate Ki. wereenerated.
. Results
Six regions were segmented from the 3D MRI scans: soft tissue,iver, heart ventricles, lungs, rib cage and spine and myocardium.epresentative slices through the simulated attenuation map of theombined anthropomorphic phantom are shown in Fig. 3. Using theinetic parameters from Tables 1 and 2 and the kinetic modellingperational equations, TACs for each organ region were gener-ted and plotted in Fig. 4. In Fig. 4a, the generated TACs from the15O]H2O study are shown for all 6 regions as well as the embed-
ed tumours. Regions with high K1 such as the myocardium and theumours exhibit a high upslope, with the washout of the tracer gov-rned by k2. Similarly, Fig. 4c shows the same TACs but using a dualnput function model in the liver while in the rest of the regions, aFig. 3. Transverse (a), coronal (b) and sagittal (c) images of the s
0.0025 0.5450 0.00040.0056 0.0800 0.00140.0000 0.1650 0.0000
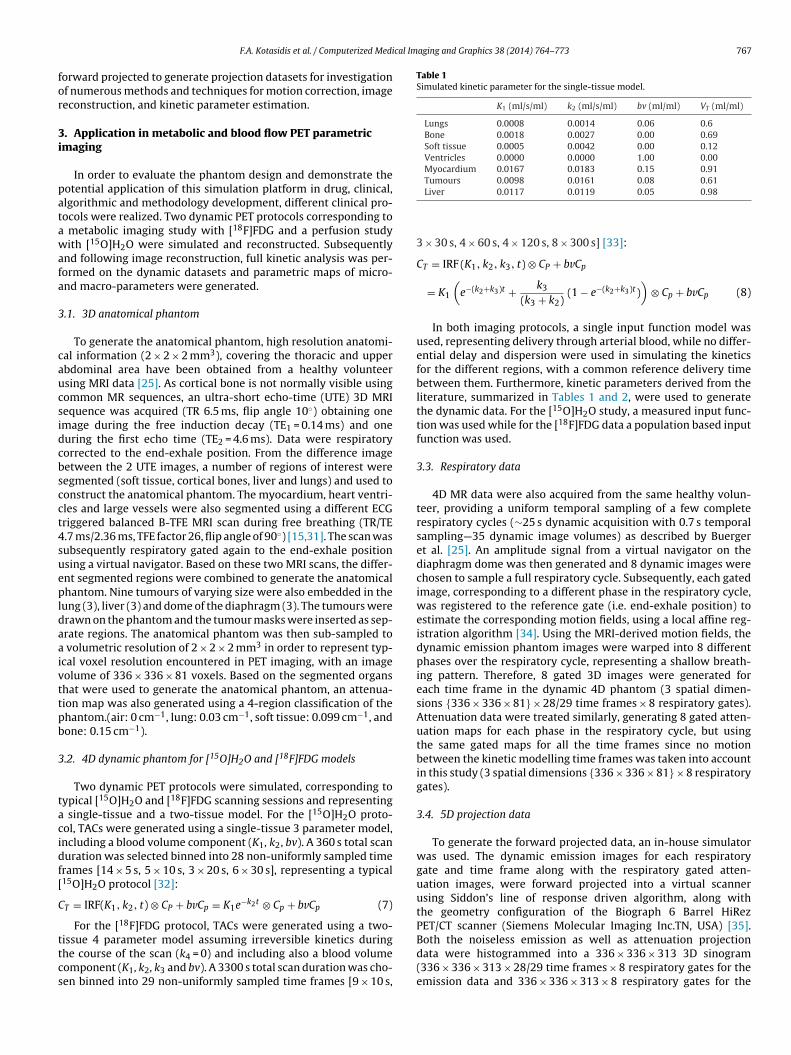
single arterial input function model is used, similar to the one usedin Fig. 4a. The dual input model in the liver represents tracer deliv-ery from both the hepatic artery and portal vein. In order to simulatethe portal vein, the gastrointestinal compartment can be used, rep-resenting a region outside the simulated patient’s FOV, which is asingle compartment model between the arterial blood and the gutcompartment. Although a delay in the delivery of each input canalso be accommodated, no delay between the arterial and portalinput functions was assumed. The TAC in the heart ventricles whichrepresents the activity concentration in the arterial blood was sim-ulated using a blood volume component equal to unity as can beseen from Table 1, with no contribution from the tissue compo-nent. Hence, the TAC is equal to the input function. To simulate themore realistic case of differential tracer delivery time in differentregions, including differential dispersion of the input function, thegenerated TACs in each region can take these effects into account.Three input functions are shown in Fig. 4d with 8 s delay betweenthem and different dispersion coefficients. By changing the delay,the input function is shifted with respect to the reference globalzero time point in the simulated protocol. Simulated TACs for the[18F]FDG dataset are shown in Fig. 4b, again for the same regions.Looking at the tumour TAC, the trapping of the tracer is evidentdue to the irreversible kinetics attributed to a high simulated k3parameter and a k4 = 0 which is a valid assumption for the durationof a typical [18F]FDG scan. Similar to the [15O]H2O dataset shown inFig. 4a, the activity concentration in the ventricles is representativeof the input function. The simulated TACs shown in Fig. 4a and bwere used to generate the dynamic phantoms for the [15O]H2O and[18F]FDG studies.
Representative emission data from the simulated dynamic andrespiratory gated [15O]H2O and [18F]FDG phantoms are shown inFigs. 5 and 6, respectively. Fig. 5 shows typical slices and vol-ume rendered images from early and late time frames into thedynamic [15O]H2O dataset. The images are shown for a singlerespiratory gated phase (one of the eight gated images), whichcorresponds to the reference gate (end-exhale position). In theearly frame, activity is high in the heart ventricles and aorta,representing the input function as seen in Fig. 4, with the tis-sue response governed by the influx rate constant. Conversely, inthe late frame, activity is representative of the tracer’s washout.
As the temporal frames are shown from a single gate position,they correspond effectively to motionless data and hence with-out any blurring in the voxelized dynamic data. The same timeframes are shown in Fig. 5ii and iv but with all eight respiratoryimulated attenuation map corresponding to a single gate.
F.A. Kotasidis et al. / Computerized Medical Imaging and Graphics 38 (2014) 764–773 769
0 50 10 0 15 0 20 0 25 0 30 0 35 00
5
10
15
20
25
Time (sec)
Act
ivity
lun g
bone
torso
ven tricles
myocardium
tumou rs
liver
0 50 10 0 15 0 20 0 25 0 30 0 35 00
5
10
15
20
25
Time (sec)
Act
ivity
lun g
bone
torso
ven tricles
myocardium
tumou rs
liver
0 50 0 100 0 150 0 200 0 250 0 300 00
2
4
6
8
10
12
Time (sec)
Act
ivity
lun g
bone
torso
ven tricles
myocardium
tumou rs
liver
0 50 10 0 15 0 20 0 25 0 30 0 35 00
5
10
15
20
25
30
Time (sec)
Act
ivity
Delay = 0 secDispe rsion coeff icient = 0.1
Delay = -8 secDispe rsion coeff icient = 0.09
Delay = -16 secDispe rsion coeff icient = 0.08
(a) (b)
(c) (d)
Fig. 4. Simulated TACs representing (a) [15O]H2O and (b) [18F]FDG kinetics, used for the different regions of interest in the 3D anatomical phantom. Input functions withd avingf ns fro
gtuaedietlgtwieR[sfroiHaa
ifferential delay and dispersion in different organs can be used while organ TACs hrom (a) are shown in (c) using a dual input model in the liver, while 3 input functio
ated images superimposed, creating a blurred representation ofhe simulated activity distribution. Although eight gates were sim-lated in this study, different gates can be included or excluded toccommodate simulation of different breathing patterns. Using allight gates, increased motion is simulated in the superior-inferiorirection since the bulk of the motion occurs in this direction. Dur-
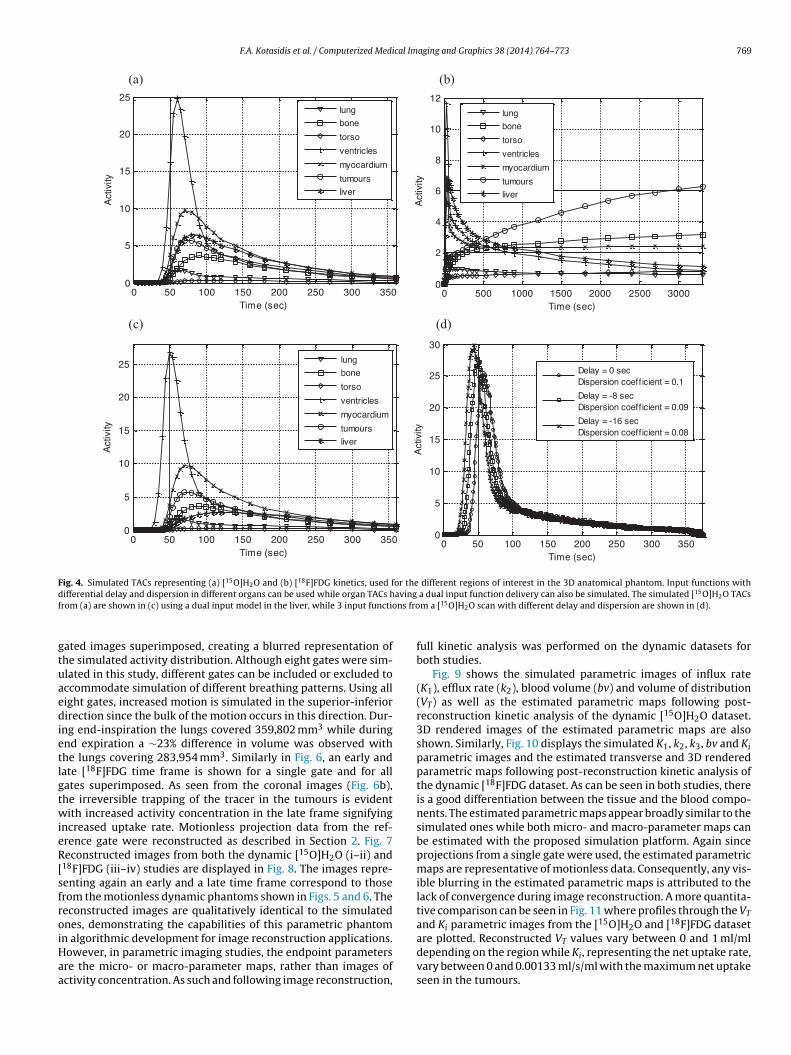
ng end-inspiration the lungs covered 359,802 mm3 while duringnd expiration a ∼23% difference in volume was observed withhe lungs covering 283,954 mm3. Similarly in Fig. 6, an early andate [18F]FDG time frame is shown for a single gate and for allates superimposed. As seen from the coronal images (Fig. 6b),he irreversible trapping of the tracer in the tumours is evidentith increased activity concentration in the late frame signifying
ncreased uptake rate. Motionless projection data from the ref-rence gate were reconstructed as described in Section 2. Fig. 7econstructed images from both the dynamic [15O]H2O (i–ii) and
18F]FDG (iii–iv) studies are displayed in Fig. 8. The images repre-enting again an early and a late time frame correspond to thoserom the motionless dynamic phantoms shown in Figs. 5 and 6. Theeconstructed images are qualitatively identical to the simulatednes, demonstrating the capabilities of this parametric phantom
n algorithmic development for image reconstruction applications.owever, in parametric imaging studies, the endpoint parametersre the micro- or macro-parameter maps, rather than images ofctivity concentration. As such and following image reconstruction,a dual input function delivery can also be simulated. The simulated [15O]H2O TACsm a [15O]H2O scan with different delay and dispersion are shown in (d).
full kinetic analysis was performed on the dynamic datasets forboth studies.
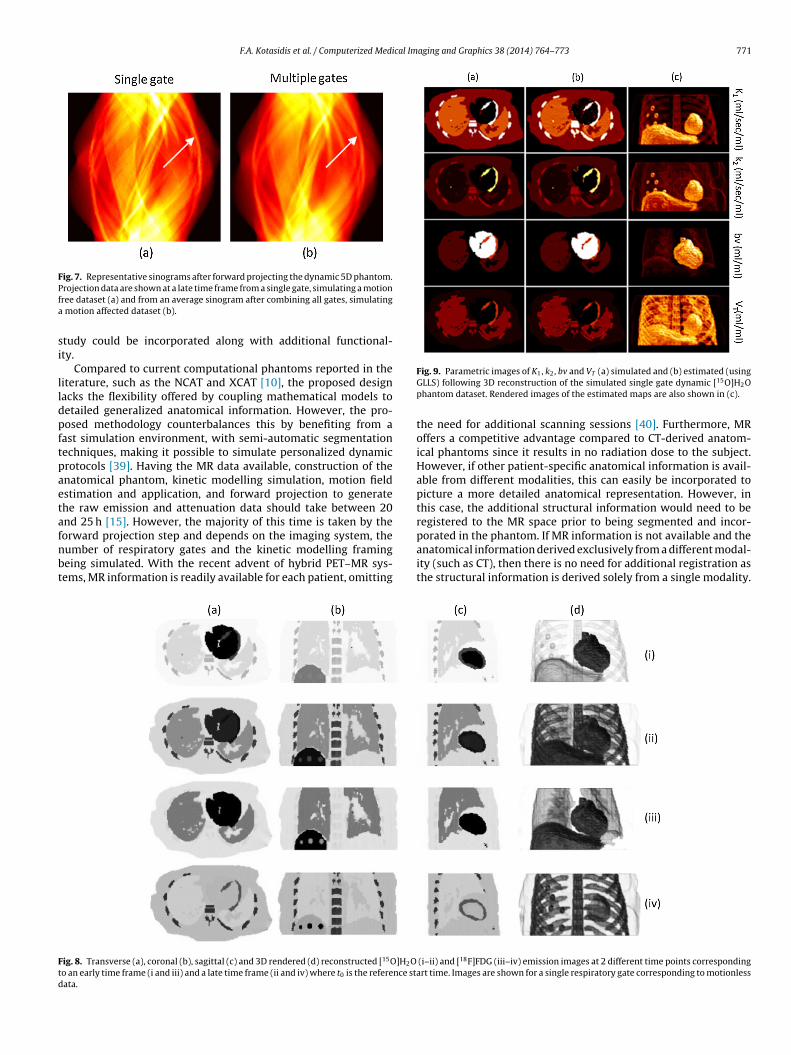
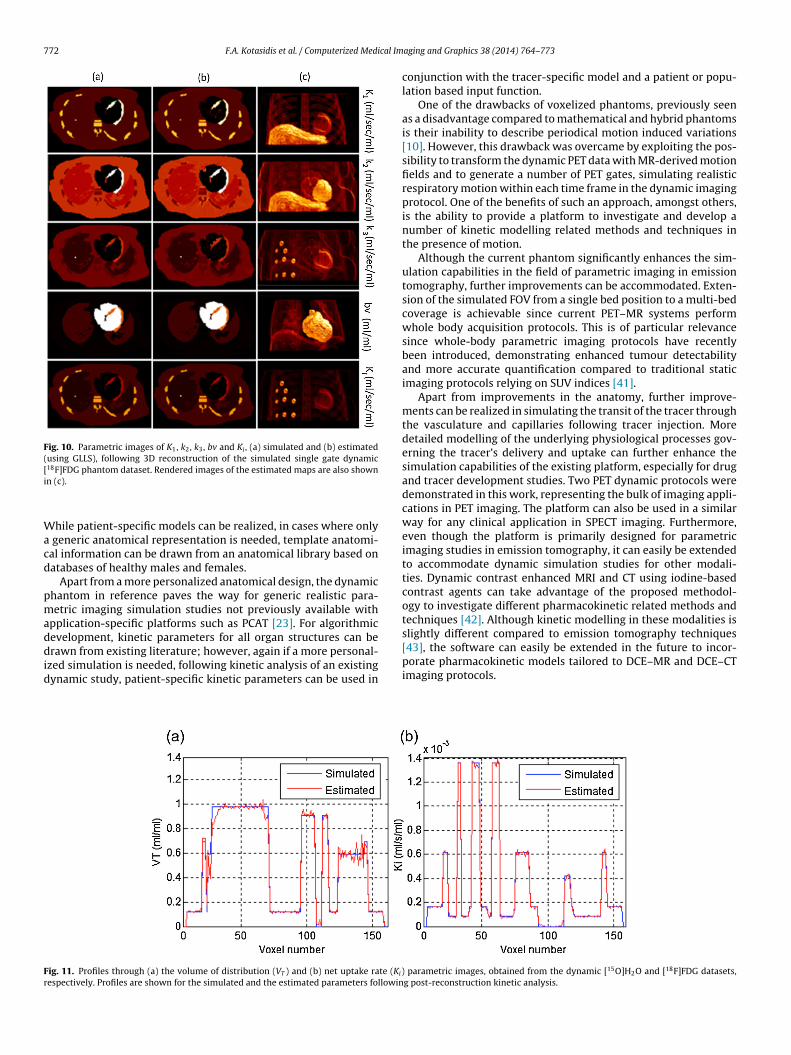
Fig. 9 shows the simulated parametric images of influx rate(K1), efflux rate (k2), blood volume (bv) and volume of distribution(VT) as well as the estimated parametric maps following post-reconstruction kinetic analysis of the dynamic [15O]H2O dataset.3D rendered images of the estimated parametric maps are alsoshown. Similarly, Fig. 10 displays the simulated K1, k2, k3, bv and Kiparametric images and the estimated transverse and 3D renderedparametric maps following post-reconstruction kinetic analysis ofthe dynamic [18F]FDG dataset. As can be seen in both studies, thereis a good differentiation between the tissue and the blood compo-nents. The estimated parametric maps appear broadly similar to thesimulated ones while both micro- and macro-parameter maps canbe estimated with the proposed simulation platform. Again sinceprojections from a single gate were used, the estimated parametricmaps are representative of motionless data. Consequently, any vis-ible blurring in the estimated parametric maps is attributed to thelack of convergence during image reconstruction. A more quantita-tive comparison can be seen in Fig. 11 where profiles through the VT
and Ki parametric images from the [15O]H2O and [18F]FDG dataset
are plotted. Reconstructed VT values vary between 0 and 1 ml/mldepending on the region while Ki, representing the net uptake rate,vary between 0 and 0.00133 ml/s/ml with the maximum net uptakeseen in the tumours.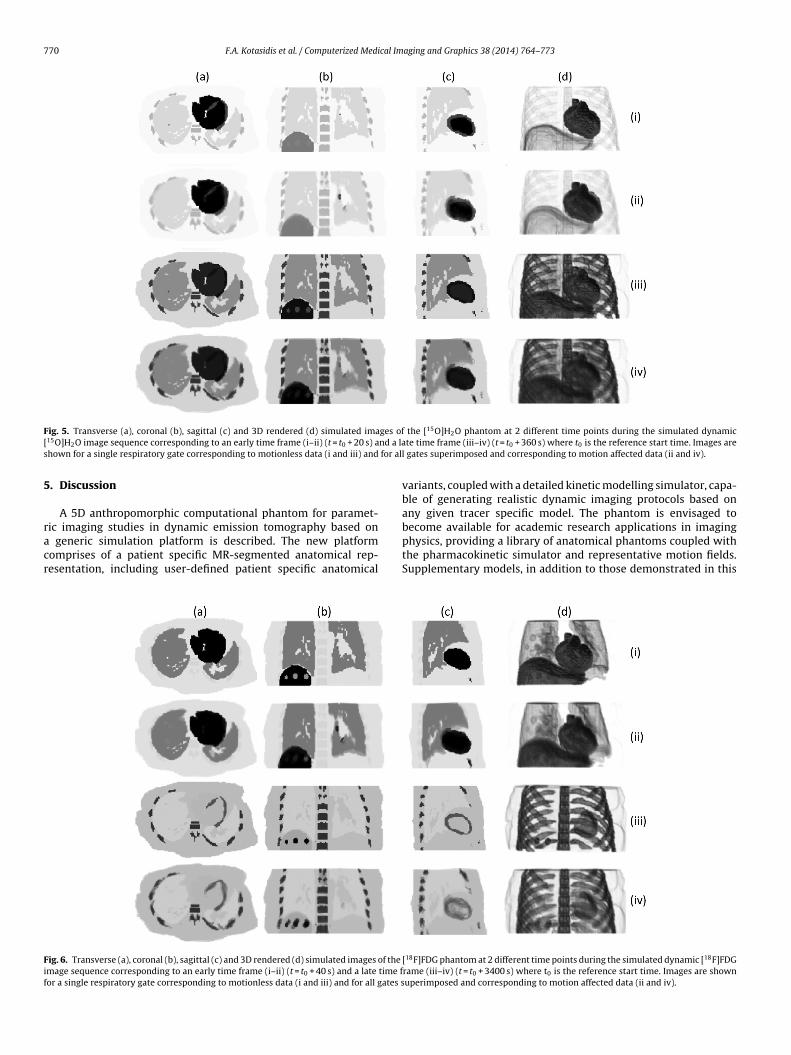
770 F.A. Kotasidis et al. / Computerized Medical Imaging and Graphics 38 (2014) 764–773
F ges of[ nd a las for al
5
racr
Fif
ig. 5. Transverse (a), coronal (b), sagittal (c) and 3D rendered (d) simulated ima15O]H2O image sequence corresponding to an early time frame (i–ii) (t = t0 + 20 s) ahown for a single respiratory gate corresponding to motionless data (i and iii) and
. Discussion
A 5D anthropomorphic computational phantom for paramet-ic imaging studies in dynamic emission tomography based on
generic simulation platform is described. The new platformomprises of a patient specific MR-segmented anatomical rep-esentation, including user-defined patient specific anatomical
ig. 6. Transverse (a), coronal (b), sagittal (c) and 3D rendered (d) simulated images of the
mage sequence corresponding to an early time frame (i–ii) (t = t0 + 40 s) and a late time for a single respiratory gate corresponding to motionless data (i and iii) and for all gates s
the [15O]H2O phantom at 2 different time points during the simulated dynamicte time frame (iii–iv) (t = t0 + 360 s) where t0 is the reference start time. Images are
l gates superimposed and corresponding to motion affected data (ii and iv).
variants, coupled with a detailed kinetic modelling simulator, capa-ble of generating realistic dynamic imaging protocols based onany given tracer specific model. The phantom is envisaged tobecome available for academic research applications in imaging
physics, providing a library of anatomical phantoms coupled withthe pharmacokinetic simulator and representative motion fields.Supplementary models, in addition to those demonstrated in this[18F]FDG phantom at 2 different time points during the simulated dynamic [18F]FDGrame (iii–iv) (t = t0 + 3400 s) where t0 is the reference start time. Images are shownuperimposed and corresponding to motion affected data (ii and iv).
F.A. Kotasidis et al. / Computerized Medical Imaging and Graphics 38 (2014) 764–773 771
Fig. 7. Representative sinograms after forward projecting the dynamic 5D phantom.Pfa
si
lldpftpaetafnbt
Ftd
rojection data are shown at a late time frame from a single gate, simulating a motionree dataset (a) and from an average sinogram after combining all gates, simulating
motion affected dataset (b).
tudy could be incorporated along with additional functional-ty.
Compared to current computational phantoms reported in theiterature, such as the NCAT and XCAT [10], the proposed designacks the flexibility offered by coupling mathematical models toetailed generalized anatomical information. However, the pro-osed methodology counterbalances this by benefiting from aast simulation environment, with semi-automatic segmentationechniques, making it possible to simulate personalized dynamicrotocols [39]. Having the MR data available, construction of thenatomical phantom, kinetic modelling simulation, motion fieldstimation and application, and forward projection to generatehe raw emission and attenuation data should take between 20nd 25 h [15]. However, the majority of this time is taken by the
orward projection step and depends on the imaging system, theumber of respiratory gates and the kinetic modelling framingeing simulated. With the recent advent of hybrid PET–MR sys-ems, MR information is readily available for each patient, omittingig. 8. Transverse (a), coronal (b), sagittal (c) and 3D rendered (d) reconstructed [15O]H2Oo an early time frame (i and iii) and a late time frame (ii and iv) where t0 is the reference staata.
Fig. 9. Parametric images of K1, k2, bv and VT (a) simulated and (b) estimated (usingGLLS) following 3D reconstruction of the simulated single gate dynamic [15O]H2Ophantom dataset. Rendered images of the estimated maps are also shown in (c).
the need for additional scanning sessions [40]. Furthermore, MRoffers a competitive advantage compared to CT-derived anatom-ical phantoms since it results in no radiation dose to the subject.However, if other patient-specific anatomical information is avail-able from different modalities, this can easily be incorporated topicture a more detailed anatomical representation. However, inthis case, the additional structural information would need to beregistered to the MR space prior to being segmented and incor-
porated in the phantom. If MR information is not available and theanatomical information derived exclusively from a different modal-ity (such as CT), then there is no need for additional registration asthe structural information is derived solely from a single modality.(i–ii) and [18F]FDG (iii–iv) emission images at 2 different time points correspondingrt time. Images are shown for a single respiratory gate corresponding to motionless
772 F.A. Kotasidis et al. / Computerized Medical Im
Fig. 10. Parametric images of K1, k2, k3, bv and Ki , (a) simulated and (b) estimated(using GLLS), following 3D reconstruction of the simulated single gate dynamic[18
i
Wacd
pmaddid
slightly different compared to emission tomography techniques
Fr
F]FDG phantom dataset. Rendered images of the estimated maps are also shownn (c).
hile patient-specific models can be realized, in cases where only generic anatomical representation is needed, template anatomi-al information can be drawn from an anatomical library based onatabases of healthy males and females.
Apart from a more personalized anatomical design, the dynamichantom in reference paves the way for generic realistic para-etric imaging simulation studies not previously available with
pplication-specific platforms such as PCAT [23]. For algorithmicevelopment, kinetic parameters for all organ structures can be
rawn from existing literature; however, again if a more personal-zed simulation is needed, following kinetic analysis of an existingynamic study, patient-specific kinetic parameters can be used in
ig. 11. Profiles through (a) the volume of distribution (VT ) and (b) net uptake rate (Ki)espectively. Profiles are shown for the simulated and the estimated parameters followin
aging and Graphics 38 (2014) 764–773
conjunction with the tracer-specific model and a patient or popu-lation based input function.
One of the drawbacks of voxelized phantoms, previously seenas a disadvantage compared to mathematical and hybrid phantomsis their inability to describe periodical motion induced variations[10]. However, this drawback was overcame by exploiting the pos-sibility to transform the dynamic PET data with MR-derived motionfields and to generate a number of PET gates, simulating realisticrespiratory motion within each time frame in the dynamic imagingprotocol. One of the benefits of such an approach, amongst others,is the ability to provide a platform to investigate and develop anumber of kinetic modelling related methods and techniques inthe presence of motion.
Although the current phantom significantly enhances the sim-ulation capabilities in the field of parametric imaging in emissiontomography, further improvements can be accommodated. Exten-sion of the simulated FOV from a single bed position to a multi-bedcoverage is achievable since current PET–MR systems performwhole body acquisition protocols. This is of particular relevancesince whole-body parametric imaging protocols have recentlybeen introduced, demonstrating enhanced tumour detectabilityand more accurate quantification compared to traditional staticimaging protocols relying on SUV indices [41].
Apart from improvements in the anatomy, further improve-ments can be realized in simulating the transit of the tracer throughthe vasculature and capillaries following tracer injection. Moredetailed modelling of the underlying physiological processes gov-erning the tracer’s delivery and uptake can further enhance thesimulation capabilities of the existing platform, especially for drugand tracer development studies. Two PET dynamic protocols weredemonstrated in this work, representing the bulk of imaging appli-cations in PET imaging. The platform can also be used in a similarway for any clinical application in SPECT imaging. Furthermore,even though the platform is primarily designed for parametricimaging studies in emission tomography, it can easily be extendedto accommodate dynamic simulation studies for other modali-ties. Dynamic contrast enhanced MRI and CT using iodine-basedcontrast agents can take advantage of the proposed methodol-ogy to investigate different pharmacokinetic related methods andtechniques [42]. Although kinetic modelling in these modalities is
[43], the software can easily be extended in the future to incor-porate pharmacokinetic models tailored to DCE–MR and DCE–CTimaging protocols.
parametric images, obtained from the dynamic [15O]H2O and [18F]FDG datasets,g post-reconstruction kinetic analysis.

cal Im
6
cmtsticiipkpma
C
A
dwa
R
[
[
[
[
[
[
[
[
[
[
[
[
[
[
[
[
[
[
[
[
[
[
[
[
[
[
[
[
[
[
[
[
F.A. Kotasidis et al. / Computerized Medi
. Conclusion
As dynamic imaging protocols are adopted more frequently forlinical research and drug development, simulation solutions forore efficient development, evaluation and validation of novel
racers, protocols, methods and techniques in parametric imagingtudies, are of interest. In this work, a new 5D computational phan-om for generating realistic datasets for parametric imaging studiesn emission tomography, was presented. The proposed phantoman be used for a number of applications both in PET and SPECT,ncluding motion tracking and correction, conventional and directmage reconstruction algorithm development, dynamic imagingrotocol design, simulations for tracer and drug development andinetic parameter estimation algorithm development. As such, thehantom and software platform will be a valuable tool for theolecular imaging community and is envisaged to become avail-
ble for simulation studies in dynamic tomography.
onflict of interest statement
The authors declare that they have no conflict of interest.
cknowledgments
This work was supported by the Swiss National Science Foun-ation under grants SNSF 31003A-135176 and 31003A-149957 asell as EU COST Action TD1007 (www.pet-mri.eu). Data are avail-
ble at http://www.isd.kcl.ac.uk/pet-mri/simulated-data/.
eferences
[1] Zaidi H, Tsui BMW. Review of computational anthropomorphic anatomical andphysiological models. Proc IEEE 2009;97:1938–53.
[2] Shepp LA, Logan BF. The Fourier reconstruction of a head section. IEEE TransNucl Sci 1974;21:21–43.
[3] Segars WP, Lalush DS, Tsui BMW. Modeling respiratory mechanics in the MCATand spline-based MCAT phantoms. IEEE Trans Nucl Sci 2001;48:89–97.
[4] Tsoumpas C, Gaitanis A. Modeling and simulation of 4D PET–CT and PET–MRImages. PET Clin 2013;8:95–110.
[5] Zubal IG, Harrell CR, Smith EO, Rattner Z, Gindi G, Hoffer PB. Comput-erized three-dimensional segmented human anatomy. Med Phys 1994;21:299–302.
[6] Hoffman EJ, Cutler PD, Digby WM, Mazziotta JC. 3-D phantom to simu-late cerebral blood flow and metabolic images for PET. IEEE Trans Nucl Sci1990;37:616–20.
[7] Xu XG, Chao TC, Bozkurt A. VIP-Man: an image-based whole-body adult malemodel constructed from color photographs of the Visible Human Project formulti-particle Monte Carlo calculations. Health Phys 2000;78:476–86.
[8] Dimbylow P. Development of the female voxel phantom, NAOMI, and itsapplication to calculations of induced current densities and electric fieldsfrom applied low frequency magnetic and electric fields. Phys Med Biol2005;50:1047–70.
[9] Nipper JC, Williams JL, Bolch WE. Creation of two tomographic voxel models ofpaediatric patients in the first year of life. Phys Med Biol 2002;47:3143–64.
10] Segars WP, Tsui BMW. MCAT to XCAT: the evolution of 4D computerized phan-toms for imaging research. Proc IEEE 2009;97:1954–68.
11] Segars WP. Development and application of the new dynamic NURBS-basedcardiac-torso (NCAT) phantom. In: Ph.D. thesis. Chapel Hill, NC: University ofNorth Carolina; 2001.
12] Segars WP, Mori S, Chen GTY, Tsui BMW. Modeling respiratory motion vari-ations in the 4D NCAT phantom. In: Conference record IEEE nuclear sciencesymposium. 2007. p. 2677–9.
13] Segars WP, Sturgeon G, Mendonca S, Grimes J, Tsui BM. 4D XCAT phantom formultimodality imaging research. Med Phys 2010;37:4902–15.
14] Konik A, Connolly CM, Johnson KL, Dasari P, Segars P, Hendrik Pretorius P,et al. Digital anthropomorphic phantoms of non-rigid human respiratory andvoluntary body motions: a tool-set for investigating motion correction in 3D
reconstruction. In: IEEE nuclear science symposium and medical imaging con-ference (NSS/MIC). 2011. p. 3572–8.15] Tsoumpas C, Buerger C, King AP, Mollet P, Keereman V, Vandenberghe S, et al.Fast generation of 4D PET–MR data from real dynamic MR acquisitions. PhysMed Biol 2011;56:6597–613.
[
[
aging and Graphics 38 (2014) 764–773 773
16] Aboagye EO. Imaging in drug development. Clin Adv Hematol Oncol2006;4:902–4.
17] Takesh M. The potential benefit by application of kinetic analysis of PET in theclinical oncology. ISRN Oncol 2012;2012:349351.
18] Reader AJ, Matthews JC, Sureau FC, Comtat C, Trebossen R, Buvat I. Iterativekinetic parameter estimation within fully 4D PET image reconstruction. In:Conference record IEEE nuclear science symposium. 2006. p. 1752–6.
19] Tong S, Alessio AM, Kinahan PE, Liu H, Shi P. A robust state-space kinetics-guided framework for dynamic PET image reconstruction. Phys Med Biol2011;56:2481–98.
20] Verhaeghe J, D’Asseler Y, Vandenberghe S, Staelens S, Van de Walle R, LemahieuI. ML reconstruction from dynamic list-mode PET data using temporal splines.In: Conference record IEEE nuclear science symposium. 2004. p. 3146–50, vol.5.
21] Wernick MN, Infusino EJ, Milosevic M. Fast spatio-temporal image reconstruc-tion for dynamic PET. IEEE Trans Med Imaging 1999;18:185–95.
22] Li Q, Asma E, Ahn S, Leahy RM. A fast fully 4-D incremental gradient reconstruc-tion algorithm for list mode PET data. IEEE Trans Med Imaging 2007;26:58–67.
23] Fung GSK, Higuchi T, Park MJ, Segars WP, Tsui BMW. Development of a 4Ddigital phantom for tracer kinetic modeling and analysis of dynamic perfusionPET and SPECT simulation studies. In: IEEE nuclear science symposium andmedical imaging conference (NSS/MIC). 2011. p. 4192–5.
24] Tsoumpas C, Polycarpou I, Thielemans K, Buerger C, King AP, Schaeffter T, et al.The effect of regularization in motion compensated PET image reconstruction:a realistic numerical 4D simulation study. Phys Med Biol 2013;58:1759–73.
25] Buerger C, Tsoumpas C, Aitken A, King AP, Schleyer P, Schulz V, et al. Investiga-tion of MR-based attenuation correction and motion compensation for hybridPET/MR. IEEE Trans Nucl Sci 2012;59:1967–76.
26] Renkin EM. Transport of potassium-42 from blood to tissue in isolated mam-malian skeletal muscles. Am J Physiol 1959;197:1205–10.
27] Crone C. The permeability of capillaries in various organs as determined by useof the indicator diffusion method. Acta Physiol Scand 1963;58:292–305.
28] Kety SS. The theory and applications of the exchange of inert gas at the lungsand tissues. Pharmacol Rev 1951;3:1–41.
29] Kudomi N, Slimani L, Jarvisalo MJ, Kiss J, Lautamaki R, Naum GA, et al. Non-invasive estimation of hepatic blood perfusion from H2
15O PET images usingtissue-derived arterial and portal input functions. Eur J Nucl Med Mol Imaging2008;35:1899–911.
30] Ludemann L, Sreenivasa G, Michel R, Rosner C, Plotkin M, Felix R, et al. Cor-rections of arterial input function for dynamic H2
15O PET to assess perfusionof pelvic tumours: arterial blood sampling versus image extraction. Phys MedBiol 2006;51:2883–900.
31] Peters J, Ecabert O, Meyer C, Kneser R, Weese J. Optimizing boundary detec-tion via simulated search with applications to multi-modal heart segmentation.Med Imaging Anal 2010;14:70–84.
32] Lodge MA, Carson RE, Carrasquillo JA, Whatley M, Libutti SK, Bacharach SL.Parametric images of blood flow in oncology PET studies using [15O]water. JNucl Med 2000;41:1784–92.
33] Wienhard K. Measurement of glucose consumption using[(18)F]fluorodeoxyglucose. Methods 2002;27:218–25.
34] Buerger C, Schaeffter T, King AP. Hierarchical adaptive local affine registra-tion for fast and robust respiratory motion estimation. Med Imaging Anal2011;15:551–64.
35] Brambilla M, Secco C, Dominietto M, Matheoud R, Sacchetti G, IngleseE. Performance characteristics obtained for a new 3-dimensional lutetiumoxyorthosilicate-based whole-body PET/CT scanner with the NationalElectrical Manufacturers Association NU 2-2001 standard. J Nucl Med2005;46:2083–91.
36] Kotasidis FA, Matthews JC, Angelis GI, Noonan PJ, Jackson A, Price P, et al. Sin-gle scan parameterization of space-variant point spread functions in imagespace via a printed array: the impact for two PET/CT scanners. Phys Med Biol2011;56:2917–42.
37] Dagan F, Huang SC, ZhiZhong W, Dino H. An unbiased parametric imagingalgorithm for nonuniformly sampled biomedical system parameter estimation.IEEE Trans Med Imaging 1996;15:512–8.
38] Feng D, Ho D, Lau KK, Siu WC. GLLS for optimally sampled continuous dynamicsystem modeling: theory and algorithm. Comput Methods Programs Biomed1999;59:31–43.
39] Stute S, Vauclin S, Necib H, Grotus N, Tylski P, Rehfeld NS, et al. Realistic andefficient modeling of radiotracer heterogeneity in Monte Carlo simulations ofPET images with tumors. IEEE Trans Nucl Sci 2012;59:113–22.
40] Zaidi H, Ojha N, Morich M, Griesmer J, Hu Z, Maniawski P, et al. Design andperformance evaluation of a whole-body ingenuity TF PET–MRI system. PhysMed Biol 2011;56:3091–106.
41] Karakatsanis NA, Lodge MA, Tahari AK, Zhou Y, Wahl RL, Rahmim A. Dynamicwhole-body PET parametric imaging: I. Concept, acquisition protocol optimiza-
tion and clinical application. Phys Med Biol 2013;58(20):7391–418.42] Ingrisch M, Sourbron S. Tracer-kinetic modeling of dynamic contrast-enhancedMRI and CT: a primer. J Pharmacokinet Pharmacodyn 2013;40:281–300.
43] Sourbron SP, Buckley DL. Classic models for dynamic contrast-enhanced MRI.NMR Biomed 2013;26:1004–27.