Embed Size (px)
Citation preview

Computerization and Skill Bifurcation:
The Role of Task Complexity in Creating Skill Gains and Losses
by
Avner Ben-Ner* and Ainhoa Urtasun**
January 2010
Draft – Comments invited!
ABSTRACT
Does computerization increase or reduce the extent of skills that workers are required to have? Autor,
Levy and Murnane (2003) show empirically that adoption of computer-based technologies (CBT) was
greater in industries historically intensive in routine tasks, and that computerization increased complex
problem-solving and communication activities and reduced routine cognitive and manual activities. We
extend this argument and claim that the effects of CBT are neither universal nor uniform, but a
bifurcation emerges: occupations that historically (pre-computerization) required low skills and entailed
low-complexity tasks do not experience a lot of CBT in their environment, or if they do, they remain low
skill (or in extremis become less skilled) occupations, whereas historically high-skill occupations that
entailed high complexity see much CBT as well as increases in the skills they require. We test these
propositions in a unique dataset that includes measures of the degree of computerization and changes
attendant to computerization in the level of seven skills of core employees (content, complex problem-
solving, etc.) for a sample of 819 firms in 2000. We link this dataset by core employees’ occupation to US
occupation-level data on three dimensions of task complexity (with respect to data, people and things) in
1971 (pre-CBT). We find that: (1) higher pre-CBT task complexity is associated with subsequent
adoption and intensity of CBT; and (2) for occupations that were historically characterized by complex
tasks, CBT affects most skills positively, but for simple tasks, CBT does not affect skills or affects them
negatively. Our results shed light on the skill-based technological change and skilling-deskilling debates
and suggest that the relationships are contingent in more nuanced ways than the literature has suggested.
* Carlson School of Management, University of Minnesota, [email protected]
** Department of Business and Administration, Universidad Pública de Navarra, [email protected]

2
Computerization and Skill Bifurcation:
The Role of Task Complexity in Creating Skill Gains and Losses
I. INTRODUCTION
Skill-biased technological change (SBTC) is the proposition that technological change in the
form of computer-based technologies (CBT) entails an increase in the skill content of jobs
performed by skilled workers (Machin, 2001). Less-skilled workers, who do not possess the
necessary skills to work with CBT, are being left behind, with diminishing skills and the
accompanying wage stagnation or decline, and damaged labor market prospects. Empirically, the
SBTC hypothesis has been supported by a documented positive correlation between the adoption
of CBT and the increased employment and wages of skilled workers (Katz and Autor, 1999 and
Levy and Murnane, 1992 survey this literature). Yet, as DiNardo and Pischke (1997) suggest,
rather than reflecting returns to computer use or computer skills, relative increases in
employment and wages of CBT users may indicate that ―computer users possess unobserved
skills which might have little to do with computers but which are rewarded in the labor market,
or that computers were first introduced in higher paying occupations‖ (p. 292).
The unobserved skills have been identified by Autor, Levy, and Murname (2003) (henceforth
ALM) as complex problem-solving skills and complex communication skills. ALM explain how
the SBTC proposition actually works: computers take over the execution of routine manual and
cognitive tasks—tasks that can be routinized or readily described with programmed rules—
making redundant workers who previously carried out such tasks; at the same time, computers
complement the efforts of workers to carry out nonroutine cognitive tasks, entailed by complex
problem-solving and complex communication activities. ALM show empirically that indeed

3
CBT adoption was greater in industries historically intensive in routine tasks, and that the
increased computerization predicts increased complex problem-solving and communication
activities and reduced routine cognitive and manual activities. These trends are shown to exist
within occupations, industries, and education groups. Therefore, ALM’s claim is broader than
the SBTC hypothesis: the use of CBT complements the employment and skills not only of more-
skilled but also of less-skilled workers.
But why should CBT or, for that matter, any innovation in the workplace that is intentionally
introduced by an employer, have a felicitous effect on skill is not at all obvious, at least not from
an economic perspective. Increased skill generally implies increased pay, and an employer seeks
to avoid practices that raise the wage bill, unless of course they raise productivity to more than
compensate for it. From a naïve perspective, computerization may embed skills that workers
possess and in its adoption would make them either redundant or an accessory to computers. For
example, in the past at the store checkout counter, a cashier needed to know prices and
distinguish between different items; in a CBT world, however, this same cashier needs only to
pass the goods over the scanner and process payment, although (perhaps by the time this paper
appears in print) self-checkout may become widespread and cashiers scarce. Hence, there is an
apparent loss of skill. Similarly, in the past an architect needed to be able to draw and convey
three dimensions. In a CBT world, the architect has no need for such skills but instead calls up
drawings from a menu in the computer, an apparent loss of skill. In both cases, the employer has
to pay for lower skills without loss of productivity, and possibly even a gain. Furthermore, there
may be fewer cashiers and architects needed to produce the same or more output.

4
The recent economics literature favors the skilling approach, as did the sociological literature in
the tradition of Blauner (1964). That technological change may stimulate demand for more
skilled workers was also the notion of learning-by-doing introduced by Arrow (1962). More
educated employees are better able to evaluate and adapt innovations and to learn faster the new
functions and routines of new technologies than less educated ones (Nelson and Phelps, 1966). In
contrast, theories of occupational downgrading or deskilling, most forcefully stated by
Braverman (1974, 1975), emphasized the desire of employers to acquire control over the work
process by reducing the skill level of their workers. In a similar vein, product life cycle models
(Vernon, 1966) emphasize the constant pressure to routinize new technology so that it becomes
less reliant on skilled labor. The skilling approach tends to rely on forces external to the
organization, basing its evidence on changes in the distribution of employment, whereas the
deskilling approach relies on forces internal to the firm (management strategy) and changes
within individual jobs. Other researchers, agnostic on overall historical trends, adopted a
―contingency‖ or ―mixed effects‖ position, asserting that situational factors such as labor costs or
employee bargaining power are important in determining the utility of any technology or system
of work organization (Wood, 1982; Spenner, 1983; Hirschhorn, 1984; Form, Kauffman, Parcel,
and Wallace, 1988; Zuboff, 1988).
In this paper we extend ALM’s ideas and argue that enhancements in complex problem-solving
and complex communication skills are neither suitable for all workers nor profitable for all
occupations. Instead, we propose that the initial (historic) task attributes of a job or occupation
and the related skill content influence the subsequent degree of computerization as well as its
posterior skill effects. We claim that a bifurcation emerges such that occupations that historically
(pre-CBT) required low skills and entailed low-complexity tasks do not see much CBT in their

5
environment, or if they do, they remain low skill (or in extremis become less skilled). In contrast,
workers in historically skilled and complex jobs see much CBT as well as increases in the skills
they need to possess. We suggest that CBT does not only automate the gathering and storage of
information but also generates information that can be analyzed by workers who possess the
required skills and abilities (Zuboff, 1980). So the greatest gain from CBT has likely occurred in
firms that pre-CBT had a lot of routine tasks, as shown by ALM, and those that had a lot of
complex tasks so that CBT could complement the efforts of workers and make them more
productive. Existing firms that adopt CBT have already a workforce, so managers feel
constrained by their employees’ abilities and the scope of the training they can receive. That is,
management of an existing firm that considers the adoption of a new technology does not start
with a fresh workforce that has the composition of desirable skills, but with an existing
workforce that has certain skills and abilities. To formalize these propositions, we develop a
simple model of skill accumulation that shows that the path of skill accumulation depends on the
extent of initial skill, and exhibits bifurcation of the kind discussed above.
We test our hypotheses using firm-level information obtained from a survey administered in
2000 for more than 800 firms headquartered and operating in Minnesota in a broad cross-section
of industries. We examine the impact of CBT on seven sets of skills of core employees, the non-
managerial employees that are directly involved in making a firm’s main products. Figure 1
focuses on the firms that introduced CBT (80% of sample firms), and shows that CBT was not
associated with improvement in workers’ skill sets in most firms. With respect to complex
problem-solving skills (studied by ALM) close to two-thirds of firms say that their employees’
have remained the same or declined.

6
Figure 1 here
Our main argument is thus that pre-computer task complexity influences both CBT adoption and
CBT’s effect on skills. Industry, occupational, or even firm-level estimates of the relationship
between CBT and skills that do not control for the initial conditions may hide important
differences. A simple look at our data illustrates this point. Figure 2 compares the level of CBT
use (measured on a 5-point scale, with 0 meaning no use) with the geometric mean change in
complex problem-solving skills (rated on a 7-point scale where -3 to -1 means negative change, 0
no change, and 1 to 3 positive change). The proportion of sample firms that fall into each level of
CBT use is also plotted. The full sample is depicted in Figure 2.a where we note a mild positive
correlation between CBT and change in complex problem solving skills. If we consider
separately firms whose core employees performed, before computerization, highly-complex
tasks (with respect to handling of data, as a concrete example) we note a more pronounced
positive relationship, although at high levels of CBT there is a smaller gain in skill than at
somewhat lower levels (Figure 2.b). If, however, we concentrate on those firms that had low
levels of task complexity we note little change and at high CBT levels we actually note a decline
in skills (Figure 2.c).1 Figures 2.b and 2.c reveal the following patterns. (1) Among firms in the
sample with low pre-computer task complexity, only a small proportion, 33 percent, reported a
CBT use greater than moderate, whereas for firms with high pre-computer task complexity, the
proportion was much higher, 65. (2) For CBT users with high pre-computer task complexity,
1 For Figure 2.a, we take survey firms whose core employees, before computerization, analyze, coordinate, or
synthesize data (values ≥ 5 of Data1971 variable); and for Figure 2.b, we take survey firms whose core employees’
tasks, before computerization, were restricted to compare or copying data (values ≤ 2 of Data1971 variable). Data1971,
is extracted from the Dictionary of Occupational Titles (DOT), Fourth Edition (1977) and attached to our sample
using the following dataset: April 1971, Current Population Survey (CPS), augmented with DOT characteristics
issued by the National Academy of Sciences (1981). The data are described in full later in the paper.

7
CBT has a positive impact on complex problem-solving skills, whereas for CBT users with low
pre-computer task complexity, there is a negative or insignificant impact. Hence, we obtain
preliminary support for the bifurcation between simple jobs that do not rely on CBT and remain
unskilled, and complex jobs that experience intensive CBT together with skilling, rather than the
simple and universal skill-upgrading hypothesis.
Figure 2 here
The rest of the paper is organized as follows. In Section II we put forth our theoretical
framework and hypotheses. In Section III we describe the various datasets used in the paper.
Section IV contains the empirical work, first concerning the adoption of CBT and next the
effects of CBT on various skills. Section V concludes.
II. THEORY AND HYPOTHESES
In order to understand the effects of CBT on skills we need to understand first why CBT is
adopted. The two parts are clearly related, so the full argument concerning the ―why‖ question
can be understood more fully after the explanation of the effects of CBT.
II.1. CBT adoption and use
What factors facilitate the adoption of CBT and the degree of reliance on them? ALM (2003)
found that industries that historically (pre-CBT) were intensive in routine tasks or tasks that can
be accomplished by following explicit rules, have adopted computers to a greater extent than
other industries. Skilled-labor endowment has been identified as another potential factor that

8
encourages CBT adoption and use.2 Evidence at the plant-level on computers flowing to high-
wage and high-skilled jobs, is presented by Doms, Dunne, and Troske (1997) and Dunne and
Troske (1995); In a survey of 4,500 German firms, insufficient worker skills were identified as
the main obstacle to increased CBT use (Hempell, 2006).3 These findings suggest a substantial
selection effect, and, since selection is related to the outcome of interest, a possible reverse
causality, that skilled-labor endowment favors future CBT use.4
CBT is adopted to make production cheaper and more efficient. The cost and benefits of CBT
vary across firms (Bresnahan et al., 2002). ALM argue that as CBT executes routine tasks it both
reduces the cost of production and makes it more efficient – less expensive and more productive.
ALM argue further that workers freed of routine tasks can concentrate on complex tasks of the
kind that computers cannot carry out (at this time) as effectively as workers.
We extend ALM’s argument by (1) distinguishing between substitution between CBT and
workers and complementarity between CBT and workers’ tasks, and (2) differentiating between
occupations in which there is scope for expansion of the complex tasks component of the job and
occupations in which such scope is very limited or does not exist. Substitution eliminates jobs or
2 Bartel and Lichtenberg (1987), Greenwood and Yorukoglu (1998), Nelson and Phelps, (1966), Schultz (1975), and
Welch (1970) are among those who argue that skilled-labor conveys a comparative advantage in technology
adoption. 3 Why is CBT complementary to skills? One perspective argues that CBT is intrinsically complementary to skills
(Berman, Bound, and Griliches, 1994; Griliches, 1969; Tinbergen, 1975; Goldin and Katz, 1998). Acemoglu (1998)
argues that CBT and skills are not complementary by ―nature‖ but by design. He argues that technological change is
endogenous and dependent upon the supply of skills: the technology to be developed and adopted is the one that
makes the most efficient use of existing factors. Because skill-biased CBT is more efficient at using skilled-labor,
the presence of more skilled workers will favor the development and adoption of such technology. In a similar vein,
Caselli and Coleman (2006) suggest that cross-country differences in technology are not merely a matter of some
countries having an overall higher level of technical efficiency than others, but also a matter of having a higher level
of skilled labor endowments. 4 As DiNardo and Pischke (1997) show, there is a substantial selection effect in who uses not only computers but
any office tool, like pens and pencils, or in who works while sitting: they are predominantly higher paid and skilled
workers.

9
frees workers to carry out tasks that CBT cannot do as effectively such as certain complex
problem solving. This feature applies to tasks that can be programmed, that is, routine tasks (this
is the gist of ALM’s argument), so the workers who carry out these tasks can be replaced, or they
can dedicate their time to complex tasks that cannot be performed as effectively by CBT. ALM
(2004) argue that the second possibility (shifting attention to complex tasks) prevails and refer to
it as skilling. But even routine tasks require a certain amount of skill (e.g., recognizing different
items in the check-out cashier’s case) that CBT may displace, leaving the worker to do even
simpler tasks that cannot be carried out economically by CBT (such as scanning items at the
check-out counter). This amounts to deskilling.
In some occupations time freed up by computers that do routine tasks can be usefully and
naturally expended on the execution of complex tasks, a substitution effect. In some occupations
information generated by CBT enables complex tasks such as innovation (Zuboff, 1988,
Bresnahan and Trajtenberg, 1995), a complementarity effect. But in many occupations one or
both of these possibilities are missing. Furthermore, even if the substitution or complementarity
effects could be created by CBT, employees in an occupation/firm that had required pre-CBT
low skills may not be able to acquire the requisite skills associate with complex tasks post-CBT.
Hence the scope of gains from the introduction of CBT and its extent are positively correlated
with the complexity of tasks in an existing occupation. Firms have an existing workforce and few
firms regard it as completely and instantly replaceable, so managers’ choices of technology are
constrained by their current employees’ abilities and the scope of the training they can receive.
We have thus identified two effects for occupations that are already (pre CBT) characterized by
significant degree of task complexity, and therefore the workers are highly skilled. One is
making it possible to shift time to more complex tasks, and the other enabling the execution of

10
even more complex tasks; since the execution of complex tasks requires greater skills (of various
kinds) than simple tasks, both effects predict skilling for these occupations.
Obviously, computers are not of equal value for all occupations. For example, supermarket
check-out cashiers have no scope in their jobs for complex tasks and therefore no scope for their
extension or expansion. In contrast, architects freed of routine tasks can dedicate themselves to
perform more complex tasks such as innovation. Hence the architect will lose some skills of
technical nature such as drafting but will gain skills required for innovation, improvisation and
creativity or more broadly complex problem-solving skills in data analysis and relating to people.
Similarly, whereas financial analysts have to complete a wide range of interrelated complex tasks
(analyze financial data, recommend investments and present oral and written reports) that can be
complemented and coordinated by computers, janitors’ jobs consist of simpler tasks that
computers cannot complement or substitute. The foregoing discussion can be summarized as
follows.
H1: Pre-computer task complexity of employees in key jobs in a firm influences positively
the firm’s subsequent adoption of CBT and the intensity of its use.
II.2. Does CBT complement or substitute for skills?
CBT is characterized by a fundamental duality: it automates activities and registers data about
those automated activities, thus generating new streams of information (Zuboff, 1998). This is
exemplified by the computerization of supermarket check-out. Scanning devices not only
identify the cost of the item but also generate data that can be used for inventory control,
warehousing, scheduling of deliveries, and market analysis. In its automating function, the

11
scanner substitutes for the worker by offering complete, final solutions and thus reducing the
employee’s duties. As data collector, the scanner plays the role of an ―enabling technology,‖
opening up new opportunities rather than providing final solutions, and thus complementing the
worker (Bresnahan and Trajtenberg, 1995).
Firms have access to a menu of feasible CBTs (Acemoglu, 1998). The task conditions of the key
occupations and jobs held by incumbent workers influence firms’ decisions about the type of
CBT they select. Firms in which the core employees performed complex tasks prior to the
computerization decision and thus were skilled-labor abundant firms, would tend to adopt skill-
biased CBT that complements employees’ high skills, whereas firms where core employees’
tasks were simple would tend to adopt non-skill-biased CBT that substitutes employees’ low
skills, or replaces these employees.
The ideas presented above can be captured in a simple model of individual skill accumulation
similar to that of Lucas (1988).5 The model relates the growth of skill, dxds(x) , to the level
already attained, )(xs , and the effort devoted to acquiring more, such that:
))(
1()(
)(10
xsxs
dx
xds (1)
where x represents CBT use, 0)(, xsx . The term ))(( 10 xs captures the way CBT
influences the demand for skills, which depends inversely on the skill level already attained,
)(xs .
5 By ―human capital‖ Lucas (1988) means general skill level, and his model focuses on the fact that the way an
individual allocates time over various activities in the current period affects the skill level in future periods.

12
In equation (1), we assume that 00 and 01 . Given that 0)( xs , there is already a level
of skill, )(* xs such that 0)( dxxds and thus for *)( sxs (that is, a ―high‖ level of existing
skill) the level of skill will increase as CBT rises, 0)( dxxds , but for *)( sxs (which we
interpret as unskilled-labor) the level of skill will decrease as CBT rises, 0)( dxxds .
We summarize the foregoing discussion as follows.
H2: CBT has a positive effect on the level of skills required for occupations that, pre-CBT,
were intensive in complex tasks, and a negative effect or no effect for other occupations.
Solving the differential equation in (1), we obtain the relationship between skill levels and levels
of CBT use,
xCexs 1
1
0)(
(2)
Figure 3 plots the curve in (2). Different values of the parameters 10 , account for three
alternative hypotheses concerning the impact of CBT use on skills: 0, 10 represents the
skilling or optimistic approach whereby the impact of CBT use on skills is always positive
(Figure 3.a); 0, 10 represents the deskilling or pessimistic view that CBT use always has a
negative impact on skills (Figure 3.b); and 00 and 01 represents our contingent view that
the impact of CBT use on skills is positive for skilled-labor endowments but negative for
unskilled-labor endowments (Figure 3.c). Although Figures 3.a, 3.b, and 3.c have the same
values for 0 and 1 , they have different levels of pre-computer skill endowment,

13
jj Cs )()0( 10 , with j indicating occupation, that generate different slopes. Only Figure
3.c is consistent with both hypotheses H1 and H2.
Figure 3 here
In sum, both the decision whether to use CBT and its intensity, and the decision whether to
invest in a skill-biased CBT or in a non-skill-biased CBT are influenced by the same variable:
pre-CBT skill requirements. Unskilled-labor abundant firms performing simple tasks will tend to
choose low-intensity CBT that substitutes for human skills, whereas skilled-labor abundant firms
performing more complex tasks will tend to promote CBT use that complements human skills.
III. DATA DESCRIPTION
The empirical objectives of this paper, which have driven the collection of the data and the
construction of the variables described in this section, are as follows. First, we seek to evaluate
the relationship between pre-CBT skill level and subsequent introduction of CBT. Second, we
wish to investigate the relationship between CBT and skill change. Third, we want to examine
the relationship between CBT and the post-CBT task environment. Most of the variables come
from our firm-level original survey, which was designed, in part, to provide information relevant
to the investigation of the relationships described above. Additional key variables at the level of
occupations were derived from various public datasets that were used by ALM and other
researchers who have studied the question of CBT and skill change.
III. 1. The dataset
The primary dataset used in this study comes from the ―Minnesota Human Resource
Management Practices Survey 2000‖ (MHRMPS-2000). We obtained additional information for
14
our sample firms from Dunn & Bradstreet for sales and the Minnesota State Department of
Economic Security for average wages. Information about tasks associated with sample
occupations is derived from Fourth Edition 1977 DOT and other sources described briefly later
(ALM describe these data sources in detail). Historical wages, educational attainment and
employment for sample occupations are extracted from Integrated Public Use Microdata Series,
Current Population Survey (IPUMS-CPS). The number of workers engaged in R&D activity for
sample industries is drawn from 2001 Survey of Industrial Research and Development by the
National Science Foundation.
The MHRMPS-2000 survey was administered in late 1999 and in 2000 by mail, with a phone
survey administered to firms that did not respond. The data comprise 819 privately-held and
publicly-traded firms that employed 20 or more employees in diverse industries (NAICS 22-92)
outside agriculture, forestry, fishing, hunting, and mineral industries, headquartered in Minnesota
and with at least 50% of their employees working within that state. The choice of a single state
offers several advantages. First, the workforce is likely to be more homogeneous than in firms
operating in several states. Second, all firms are subject to the same state laws and regulations.
Third, crucial firm-level data that are not in the public domain are available from State of
Minnesota agencies. Fourth, response rates are much higher in in-state survey than those that
have a broader geographical scope. The survey was completed by a senior human resource
manager for the firm and the overall response rate was 33.37%. MHRMPS-2000 was designed
to explore a broad range of issues relating to firms and their employees. The sample was
constructed to include a diverse group of Minnesota-based firms that represent the variety of
workplace programs and practices found in U.S. companies as well as a wide range of

15
production technologies. One of the survey’s aims was to shed light on the relationship between
use of CBT and employees’ skills.6
III. 2. Measures
Table 1 presents the description of the variables and their sources. The variables concern the
sample firms’ core employees in Minnesota, as well as firm, occupation and industry-level
variables. Descriptive statistics are in Table 2.
Table 1 here
Change in core employees’ skills. MHRMPS-2000 contains information about various aspects of
core employees’ skills and tasks. Core employees are non–supervisory, non–managerial
employees at the firm who are directly involved in making the product or providing the service
(Osterman, 1991). These employees represent a relatively homogeneous group. A group of
survey items focused expressly on the relationship between CBT and skills, asking respondents
to rate ―to what extent does reliance on computer-based technology reduce or enhance the skill
sets possessed by core employees.‖ This question addresses separately changes in seven types of
skills: content, process, social, complex problem-solving, technical, system, and resources
management skills. The skill change is on a 7-point scale, with -1, -2, -3, indicating that reliance
on computer-based technology reduces skill from ―slightly‖ to ―greatly,‖ with 0 indicating ‖no
change,‖ and with 1, 2, 3 indicating that reliance on computer-based technology enhances skill
from ―slightly‖ to ―greatly.‖ The question does not ask respondents to date the introduction of
6 For a detailed discussion of the sampling strategy, including response rates, see Appendix A. The survey is
available upon request.

16
CBT, only to assess its effects on changes in the seven skills. In Table 2 all means of change
indicators are positive but close to 0.7
Core employees’ task attributes. MHRMPS-2000 provides information on the nature of the tasks
carried out by core employees, task complexity and task routine, and about the degree of skill
needed to execute these tasks, task skill requirement, all rated on a 5-point scale, with 0 ―not al
all‖ 1 ―slightly‖ 2 ―moderately‖ 3 ―very‖ and 4 ―extremely.‖ This information pertains to the
year of the survey.
CBT and core employees. The extent of reliance on CBT is captured by a 5-point scale question:
―Are the tasks of core employees affected by computer based technology?‖ This measure of CBT
use captures exactly the concept in which we are interested.8
Occupational titles of core employees. MHRMPS-2000 contains information on core
employees’ job titles, such as software engineer, waiter, check-out cashier, and assembly worker.
We have coded this information using the Occupational Information Network (O*NET) database
system, the US Department of Labor’ recent successor to the DOT. As a result, 221 distinct 8-
digit O*NET-SOC 2000 codes were identified (out of a total of 1167 occupations).9 Thus each
sample firm has one core employee group, which has one occupational title.
7 There might be a concern with the fact that survey responses on skill changes are not accurate because CBT was
introduced several years before the survey was conducted. The use of retrospective data may cause two kinds of
recall errors: memory effects (forgetting the precise nature of some events or that they even took place) and
telescoping effects (incorrectly timing an event). The problem here has to do with memory effects and may cause
measurement errors in the dependent variable. However, the memory distortion process is likely to be random and
not associated with firm CBT at the time of survey or the complexity of tasks of their core employees’ occupation in
the 1970s. 8 Other common measures of CBT, the percentage of workers using computers and investment in IT, are
comparatively indirect and weak proxies for the extent of influence that technology exercises on the tasks of
employees. 9 O*NET-SOC is the current O*NET taxonomy, which represents the transition from the former Occupational Units
(OUs) of O*NET 98 to the SOC (Levine, Nottingham, Paige, and Lewis, 2000).

17
To test whether computer use represents a selection effect, we examine whether pre-computer
skill endowment explains computer use. Many consider the introduction of the IBM-PC in 1981
as the beginning of the ―computer revolution‖ (Card and DiNardo, 2002), and microprocessors
were first introduced on a wide scale in manufacturing machinery in the 1970s (Autor, Katz, and
Krueger, 1998). In a survey that we conducted in the middle of the 1990s with similar sampling
frame as MHRMPS-2000 we also asked about the year in which firms implemented their CBT.
The results are plotted in Appendix C Figure C1. They portray the same picture that is presented
in many sources on the basis of less direct data (e.g., the percentage of workers using computers,
as in ALM, or the widely-used expenditure on computers), that is, a surge in CBT adoption
occurred in the early 1980s. We consider specifically the year 1971 as the pre-CBT date for
practical reasons. The data about the complexity associated with occupations were collected in
1971. Historical (pre-CBT) data on task complexity of an occupation from the Fourth Edition of
DOT (1977) are used as proxy for pre-computer skill endowment. Task complexity reflects the
demands that jobs make on workers, hence it requires greater skill.
Pre-CBT occupational complexity in relation to data, people and things. We used sample SOC
2000 codes to append variables from the pre-computer era to the MHRMPS-2000 survey dataset.
We obtained the levels of complexity at which workers in different occupation functioned during
the pre-CBT era in relation to data, people, and things.10
The three occupational-level variables
are Datai, 1971, which is measured on a scale of 1 to 7, Peoplei, 1971, on a scale of 1 to 9, and
Thingsi, 1971, on a scale of 1 to 8. The scales were created from ordinal ranks of the tasks that are
10
We first mapped sample SOC codes to 1970 Census Occupational Classification (COC) using crosswalks
provided by the National Crosswalk Service Center, obtaining 152 1970 COC codes (26.5% of the total number of
occupational categories of the 1970 Census, versus 36.7% by ALM). Next, we appended weighted means (using
weights to approximate U.S. civilian labor force) of 1977 DOT task measures to sample 1970 COC codes using the
April 1971 CPS augmented with DOT characteristics data file.

18
used to characterize the degree of complexity of work, listed in Appendix B Table B1 and
explained in detail in Table B2.
Pre-CBT education and wages. Educational attainment and annual wages from the pre-computer
era are also appended to sample 1970 COC codes11
. Educationi, 1971 is measured on a scale of 1 to
9 and Wagesi, 1971 indicates occupational pre-tax wage and salary income in thousands of dollars.
Control variables. Other variables included in the analyses are the number of core employees,
percentage of unionized core employees, average age, education, wage and percentage of
females for all employees in the firm, and firm sales.12
The number of full-time equivalent R&D
scientists and engineers for 42 NAICS codes in the sample is included to reflect industry-level
R&D intensity.
IV. EMPIRICAL ANALYSIS
Table 2 presents descriptive statistics, the minimum and maximum values for each variable, and
the number of observations. The number of observations varies across variables because of
missing observations in the various datasets used in this study. The first seven variables in Table
2 concern change in various skills, and about 20% of respondents failed to provide this
information (mostly phone respondents, 131 out of 177 non-respondents to this question). This is
a difficult question to which respondents may not have an answer or do not wish to spend the
time to figure it out. The non-responses are inversely correlated with the degree of CBT, such
that a higher proportion of firms that report low CBT are among the non-respondents than firms
11
Weighted means for educational attainment and annual wages in 1971 extracted from IPUMS-CPS are appended
to sample 1970 COC codes. 12
We lagged both firm-level average wages and sales by one year.

19
with high CBT.13
This pattern suggests that the estimated relationship between CBT and skill
change reported in Table 5 is likely to be unaffected by the missing observations. For job titles of
core employees, discussed in the previous section, we have just one missing observation, and six
for pre-computer complexity in relation to data, people, and things. However, several
occupations could not be matched with data on average wage and education in 1971, which
reduces sample size for relevant estimations to 746 (in Table 4). A substantial number of missing
observations occurs for the firm-level unionization rate and average wage, which are used as
control variables in the analysis of the relationship between CBT and task environment (Table
6). We ran the analysis without these variables and obtained similar results to those reported in
the text.
Table 2 here
Table 3 presents Pearson’s correlations for the variables included in the analysis. The intensity of
CBT use is positively associated with skilling across all seven skills. Computerization is
positively correlated with contemporary (survey year) task complexity and with task skill
requirement (complementarity effect) but negatively correlated with task routine (substitution
effect), consistent with ALM’s framework. CBT use is positively correlated with average
employees’ wage (a standard finding), education and age, as well as with productivity (sales per
core employee) and R&D intensity. These cross-sectional correlations are interesting but, as
DiNardo and Pischke (1997) caution, they do not inform about causality. More suggestive about
causality is the positive correlation between pre-computer (1971) task complexity in working
13
For instance, the number of non-respondents to change in complex problem-solving skills by CBT is: 65 if
CBT=1; 59 if CBT=2; 32 if CBT=3; 12 if CBT=4. Skill change is equal to 0 for all CBT=0. Figures are similar
across all seven skills and this pattern prevails for both mail and phone respondents.

20
with data, people, and things, and subsequent CBT use, as well as between pre-computer
employees’ education and wages and subsequent CBT use.
Table 3 here
In the remainder of this section, we examine these relationships in detail. Our empirical analysis
proceeds in three steps. First, we estimate in Table 4 the relationship between pre-CBT task
complexity and subsequent CBT adoption and use. We test whether a firm whose core
employees’ tasks were complex before computerization and were executed by skilled workers
will tend to choose a more intensive use of CBT than a firm whose core employees’ tasks prior
to computerization were simple and run by unskilled workers. Second, in Table 5 we present
firm-level estimations of the probability that a positive change in skills is associated with the use
of CBT, conditional on historical values of task complexity. We test the hypothesis that, in
addition to influencing the intensity of use of CBT, pre-CBT task complexity determines whether
CBT is a skill-biased technology. Finally, in Table 6 we examine the relationship between the
intensity of CBT use and the task environment (complexity, routine and skill requirements).
IV.1. Pre-computer task complexity favoring adoption and use of CBT
ALM (2003) estimate industry-level CBT adoption (the percentile rank of an industry in
computer use in 1997) as a function of industry-level routine task intensity in 1960. As noted,
they find that CBT is positively related to historically routine task intensity. We expand on their
model by developing a richer and more detailed description of the nature of pre-CBT work;
instead of routine, we characterize tasks in terms of three dimensions of complexity: in relation
to data, people, and things. These three facets of complexity require different skills and can

21
capture greater diversity among different occupations than the single dimension of routine, as
shown by the low correlations among them in Table 3. Figure 4 shows mean values of firm-level
CBT by pre-CBT complexity in our sample core employees’ occupation. CBT intensity increases
with pre-computer task complexity, with the strongest pattern revealed for complexity in
working with data. We test further how this multidimensional complexity influences subsequent
CBT use by estimating the following equation:
)1971,1971,1971,2000, ,,( iiii ThingsPeopleDatafx ) (3)
where x measures CBT (adoption or intensity of use) for each firm’s core employee group, i,
1971t refers to the pre-CBT era (with ixi, 01971 ) and 2000t to the survey reference
year. The explanatory variables are pre-CBT task complexity in relation to data, people and
things. Equation (3) includes not only a linear combination of complexity with respect to data,
people, and things but also interactions among them to capture multidimensionality or task
variety as an additional source of task complexity.
Figure 4 here
Results for alternative specifications of equation (3) are displayed in Table 4. In the first
specification the dependent variable is whether a firm uses CBT, and logit estimates are reported.
In the second specification the dependent variable is the intensity of CBT use on a 4-point scale,
from ―slightly‖ to ―extremely,‖ so that non-users are excluded; ordered logit estimates are
presented. In the third specification the dependent variable is the intensity of CBT use on a 5-
point intensity scale, from ―not at all‖ to ―extremely,‖ so that non-users are included in the
Poisson estimation. For each specification, we first show a control model (columns 1.a, 2.a, and

22
3.a) with pre-CBT occupation average wages and educational levels as the explanatory variables
that capture pre-CBT skill at the firm level. The second, third, and fourth models (columns b, c,
and d in each specification) focus on the subsample of firms with occupations for which one of
the three dimensions – data, people, or things – is not relevant.14
For example, there are 121
sample firms where the core employees’ occupations concern data and people but not things,
represented in column 1.b. The fifth model (columns 1.e, 2.e and 3.e) includes all three types of
task complexity and interactions among them.
Table 4 here
There are four principal findings. (1) Pre-CBT educational attainment and wages at the
occupation/firm level affect positively both CBT adoption and intensity of use; this finding
supports the conjecture that intensive CBT users possess skills which have to do with education
and are in higher-paying occupations. (2) Pre-CBT complexity with respect to data stands out as
the most significant dimension affecting CBT adoption and intensity of use. Furthermore,
complexity with respect to data and with respect to people exhibits multiplicative effects when
explaining CBT adoption (see column 1.e.) and complexity with respect to data, people, and
things also exhibits multiplicative effects when explaining both CBT adoption and intensity of
use (see columns 1.e., 2.e., and 3.e.). (3) Pre-CBT complexity with respect to things also matters:
it positively impacts CBT adoption and use, on its own and in the presence of people-
complexity, and it negatively impacts CBT adoption and use in the presence of data-complexity.
The interactive effect of complexity with respect to data and things shows a declining effect on
both CBT adoption and the intensity of its use. (4) Pre-CBT people-complexity exhibits little
14
We consider that a complexity dimension – data, people, or things – is not relevant for an occupation when its
value is less than or equal to the 15th
percentile of its corresponding 1971 distribution.

23
relevance for the adoption of CBT. Together with data or with things, pre-CBT complexity with
respect to people positively influences CBT adoption and intensity of use but has no effect on its
own.
In sum, we find broad evidence that pre-computer task complexity has a significant effect on
CBT adoption and intensity of use. The distinction among data, people, and things related tasks
has proven to be valuable in explaining CBT; the impacts are positive for pre-computer task
complexity in relation to data and things acting on their own as well as in relation to people when
any of the other complexity dimensions are involved. These results support hypothesis H1.
IV.2. CBT and skills
In order to shed light on the impact of CBT on skills, we next estimate the relationship between
changes in skills, )(xs )(xds , and changes in CBT, dx , as represented in equation (1). We
estimate this relationship at the firm-level, with i indicating the firm. In the pre-CBT era, i.e., at
1971t such that ixi 01971, , we assume that firms differ in their skill endowments
depending on their core occupation, denoted by j: jj C)/δδ()(s 100 for all firms with the
same core occupation, according to equation (2). We proxy marginal changes in (1) by the
following discrete changes: )()()( 1971,2000, iii xsxsxs for )(xds , and 1971,2000, iii xxx for
dx , where 2000t refers to the survey reference year. Substituting ixi 01971, and the
discrete changes in equation (1), we obtain the following equation to estimate:
iijii xsxs 2000,12000,0 )0(~~
(4)

24
where i is random error, and 0),0( 2000, ij xs . CBT interacts with pre-CBT skill endowment,
)0(js , which we proxy by a linear combination of pre-CBT task complexity in working with
data, people and things from 1971 CPS augmented with DOT Fourth edition occupation-level
data. We hypothesized in H2 that, in addition to influencing the intensity to which CBT is used,
but not as a mere consequence of such influence, pre-CBT complexity determines whether or not
CBT positively impacts skills. In particular, for high enough levels of pre-CBT complexity we
expect a positive impact, but for low levels of pre-computer complexity we expect a negative or
null impact, which in terms of equation (4) implies that 0~
0 and 0~
1 .
Table 5 reports estimations of equation (4) assuming a complementary log-log cumulative
density function for the probability of increases in the level of skill.15
As in Figure 1, we define
is in (4) as a binary variable that equals 1 for cases of skilling ( 0 is ) and 0 for cases of
deskilling or no change ( 0 is ). Seven complementary log-log regressions are estimated, one
for each skill: content, process, social, complex problem-solving, technical, system, and
resources management skills. For each skill, estimates are shown first for CBT without
interaction terms (columns a), second for CBT and the interaction between CBT and pre-CBT
wages16
(columns b), and third for CBT and the interaction between CBT and pre-CBT task
complexity (columns c). In this last specification, for the sake of reliability and consistent with
our analyses of CBT adoption and use in Table 4, we consider complexity with respect to data,
people, and things not interacted but separately. Weaker than the levels when explaining CBT
use, inclusion of interacted terms here would cause severe multicollinearity problems.
15
Additional regression models, available upon request, show similar results. 16
Estimates for CBT and the interaction between CBT and pre-CBT educational level were also calculated, but not
considered because of severe multicollinearity problems.

25
In the simplest specification of CBT affecting skills, without interaction terms (columns a), CBT
is significantly positive for process skills and somewhat for technical skills, insignificant for
content and system skills, and significantly negative for social, complex problem-solving, and
resources management skills. But when the interaction term of CBT with pre-computer wage is
introduced (columns b), the CBT coefficients turn negative or more negative in both magnitude
and statistical significance, but the interaction between CBT and pre-computer wages is
significantly positive for all skills except for social and system skills, which is not significant.
Hence the positive effect of CBT increases with pre-CBT skills as proxied here by pre-CBT
wages.
Table 5 here
Similar results are obtained when interactions terms of CBT with pre-computer task complexity
are introduced: significant negative CBT coefficients for content, social, complex problem-
solving, technical, system, and resources management skills and insignificant for process skills,
combined with significant positive coefficients for the interaction between CBT and pre-CBT
data complexity in the case of content and complex problem-solving; significant positive
coefficients for the interaction between CBT and pre-CBT people complexity in the case of
process and social skills; and significant positive coefficient for the interaction between CBT and
pre-CBT things complexity in the case of technical skills. The positive values of the interaction
terms are consistent with results found above as well as in other studies, and, except for social
skills, the model overall estimation exhibits higher significance. The only negative interaction
between CBT and pre-CBT complexity is for data in the case of social skills.

26
In H2 we hypothesized a contingent approach regarding the change in skill levels resulting from
the adoption of CBT, with pre-CBT task complexity mediating the CBT-skills relationship. Our
results generally support the contingent approach, with distinctions made among the different
types of skill. The bifurcation is most evident for content, complex problem-solving, and
technical skills, where occupations with low pre-CBT complexity levels experienced declines or
no change in these skills, but those with high pre-CBT complexity gained in these skills. In
particular, the effect will be negative for tasks whose pre-CBT complexity in relation to data is
lower than 4 over 7 for content skills, and 6.25 over 7 for complex problem solving skills, and
positive otherwise. In the same way, the effect will be negative for tasks whose pre_CBT
complexity in relation to things is lower than 5.25 over 8 for technical skills. Process skills seem
to improve with pre-CBT complexity in relation to data and social skills decline for occupations
whose pre-CBT complexity in relation to people is lower than 4.45 over 9 and increase
otherwise, when there is no pre-CBT complexity in relation to data. In other words, there is no
skilling for these skills effect without pre-computer task complexity. Figure 5 illustrates these
predictions for the particular case of complex problem-solving skills, in a way that resembles
Figure 2. In the case of other skills, there seems to be little contingency in the change of skill
levels: system and resource management skills have declined uniformly.
Figure 5 here
The fact that one observes CBT skill effects only for CBT users,17
which is a nonrandom sample,
may cause a sample selection bias when explaining the effect of CBT on skills. Therefore, as a
robustness check, Heckman selection model is applied to correct for this non-randomness of
17
In the sample, out of 810 firms, 165 do not use CBT, and for them we don’t have a value for CBT skill variation

27
using CBT in our regression results. A two-step estimation is used whereby in the first stage the
probability of using CBT is predicted according to the model estimated in Table 4. Results,
presented in Appendix C Table C1, show that CBT does not affect skills on its own but in the
presence of pre-CBT complexity, in particular of data complexity in the case of content, process,
complex problem-solving, and resource management skills; of people complexity in the case of
content, process, and social skills; and of things complexity in the case of technical and system
skills. These estimates corroborate our previous results.
IV.3. CBT and task environment
[in preparation]
Table 6 here
V. DISCUSSION AND CONCLUSIONS
What is the effect of technological change on workers’ skills? Thinking for the moment of an
undifferentiated notion of skill, one can envision technological change that raises the skill-level
demanded of those who work with the new technology. For example, the introduction of the
typewriter required the acquisition of additional skills for secretaries, including coordination
among 10 digits, reading and typing at the same time, and performing some maintenance on the
typewriters. This is a skilling technological change, and so might have been the introduction of
computers for secretaries, who needed to learn about many functions embedded in word
processing software and who almost universally have to carry out activities on computers that
require more skills than before the introduction of computers. On the other hand, in the same
way that tailors experienced deskilling when technological change resulted in the introduction of

28
mass production of clothes,18
cashiers in supermarkets and many other workers have likely seen
some of their skill requirements lowered as a result of computerized scanning.
In the sample of firms analyzed in this paper there are both skilling and deskilling cases: waiters,
bartenders, tellers, and cashiers are examples of workers whose skills have been lowered by CBT
use, while truck repairers, salespeople, and project engineers are examples of workers whose
skills were enhanced by CBT.
In this paper we advanced two propositions. First, we argued that the intensity of CBT use is
predicted in part by the historical complexity of the tasks carried out by the incumbent workers.
Corroborating our expectations, we find that CBT is used more intensively in high-complexity
occupations. We found that it is useful to distinguish different types of complexity, whether in
relation to data, people, or things. Whereas data and things complexity affect positively CBT,
complexity with respect to people only affects CBT through interactions with the other two
complexity dimensions. This result suggests that multidimensionality or task variety, as it
increases overall task complexity, also contributes to CBT adoption and intensity of use. But the
combined effect of task complexity in relation to data and things has a diminishing effect of the
intensity of use of CBT. Since it is likely that tasks that are simple with respect to both data and
things are more amenable to automation than complex ones, this finding is consistent with Autor,
Levy and Murnane’s (2003) finding that industries and occupations that are initially intensive in
labor input of simpler and routine tasks use CBT more intensely.
Second, we argued that pre-CBT task complexity influences the relationship between CBT and
skills, so that low pre-CBT task complexity results in deskilling following introduction of CBT
18
The transition from artisanal production to factories in the nineteenth century has been largely regarded as
deskilling (Cain and Paterson, 1986; James and Skinner, 1985)

29
and high pre-CBT task complexity leads to skilling on the wake of adoption of CBT. In our
sample firms, this bifurcation effect is obtained with respect to content, complex problem-
solving, and technical skills, where occupations with low pre-CBT complexity levels
experienced declines in these skills, but those with high pre-CBT complexity gained in these
skills. In the case of process skills, they seem to improve for those in occupations that were
complex with respect to people pre-CBT, and in the case of social skills, whereas they are
negatively affected by data pre-CBT, the bifurcation appears with respect to people pre-CBT. In
other words, there is no skilling for these skills effect without pre-computer task complexity. In
the case of other skills there seems to be little contingency in the change of skill levels: system
and resource management skills declined uniformly.
These findings resemble Autor, Levy and Murnane’s (2002)’s conclusions in a case study of two
different jobs, deposit and exception processing of checks in a large bank, jobs that were affected
differentially by the introduction of the same technological change. Underlying each managerial
decision were the distinct nature and goals of the two different sets of tasks. In the case of
deposit processing, the greater access to information, provided by the introduction of the new
technology, allowed managers to pursue a cost reduction strategy by the exploitation of
economies of specialization, subdividing the tasks that were not computerized into narrower,
simpler jobs. In the case of exception processing, the informating capacity of technology was
used instead to exploit task interdependencies in order to improve customer service, combining
tasks into broader, more complex jobs.
Are these findings particular to our sample forms or period? It should be noted that our sample
occupations, although not entirely random, concern a substantial percentage of occupations

30
covered by the DOT classification (20%). Furthermore, there are indications that these
bifurcation trends are widespread and the process is still continuing. Figure D1 in Appendix D
depicts the relative growth in employment and wages for occupations that were high in pre-CBT
task complexity versus occupations that were low in task complexity, by for the US workforce
for the period 1970-1998, by task complexity in relation to data, people, and things. Employment
and wages of occupations that were pre-CBT complex in relation to data and people have been
rising relative to employment and wages of simpler occupations. For complexity in relation to
things, an opposite trend is observed: employment and wages have been rising for simpler
occupations as compared with more complex occupations. 19
Considering two broad categories of jobs, managerial and production jobs and focusing on recent
years (2002-2008) we find a similar bifurcation in terms of complex problem-solving skill
changes. Two main conclusions can be drawn from Figure D2 in Appendix D, for the US labor
force.20
First, regarding computer use, high-skill (managerial) occupations use computers more
intensely than low-skill (production) occupations. Second, regarding skill change, high-skill
workers who use computers more intensely see higher increases in their complex problem-
solving skills, whereas low-skill workers who use computers become even less skilled.
19
A related and similar picture is described for Britain by Goos and Manning (2007). 20
Skills from O*NET 4.0 Database (2002) and skills from O*NET 13.0 Database (2008) are compared
for both low-CBT and high-CBT occupations.

31
REFERENCES
Acemoglu, D. (1998). Why do new technologies complement skills? Directed technical change
and wage inequality. Quarterly Journal of Economics, 1055-1089.
Appelbaum, E., Bailey, T., & Kalleberg, A.L. (2000) Manufacturing Advantage: Why High-
Performance Work Systems Pay Off. Ithaca and London: Cornell University Press.
Arrow, K.J. (1962). The economic implications of learning by doing. Review of Economic
Studies, 29, 155-173.
Autor, D.H., Katz, L.F., & Krueger, A.B. (1998). Computing inequality: Have computers
changed the labor market? Quarterly Journal of Economics, 68, 1169-1213.
Autor, D.H., Levy, F., & Murnane, R.J. (2003). The skill content of recent technological change:
An empirical exploration. Quarterly Journal of Economics, 118(4), 1279-1333.
Autor, D.H., Levy, F., & Murnane, R.J. (2002). Upstairs, downstairs: Computers and skills on
two floors of a large bank. Industrial and Labor Relations Review, 55(3), 432-447.
Bartel, A.P., and Lechtenberg, F.R. (1987). The comparative advantage of educated workers in
implementing new technology. The Review of Economics and Statistics, 69, 1-11.
Berman, E., Bound, J., & Griliches, Z. (1994). Changes in the demand for skilled labor within
U.S. Manufacturing industries. Quarterly Journal of Economics, 109, 367-398.
Blauner, R. (1964). Alienation and freedom: The factory worker and his job. Chicago: University
of Chicago Press.

32
Bound, J. (1996). Discussion. New England Economic Review, 3, 154-156.
Braverman, H. (1974). Labor and Monopoly Capital, New York: Monthly Review Press.
Braverman, H. (1975). Work and unemployment, New York: Monthly Review Press.
Bresnahan, T.F., Brynjolfsson, E., & Hitt, L.M. (2002). Information technology, workplace
organization, and the demand for skilled labor: Firm-level evidence. Quarterly Journal of
Economics, 117(1), 339-376.
Bresnahan, T.F., and Trajtenberg, M. (1996). General purpose technologies: engines of growth?
Journal of Econometrics, 65, 83-108.
Cain, L.P., and Paterson, D.G. (1986). Biased technical change, scale, and factor substitution in
American industry, 1850-1919. Journal of Economic History, 46, 153-164.
Capelli, P. (1996). Technology and skill requirements: Implications for establishment wage
structures, New England Economic Review, 3, 139-155.
Card, D., & DiNardo, J.E., (2002). Skill-biased technological change and rising wage inequality:
Some problems and puzzles, Journal of Labor Economics, 20, 733 -783.
Caselli, F. and Coleman, W.J. (2006). The world technology frontier, Working Paper.
Cramer, D. (2003). Advanced quantitative data analysis. Maindehead, PA: Open University
Press.
Darrah, C.N. (1996). Learning and work: An exploration in industrial ethnography. New York:
Garland Publishing.

33
DiNardo, J.E., and Pischke, J.S. (1997). The returns to computer use revisited: Have pencils
changed the wage structure too? Quarterly Journal of Economics, 112, 291-303.
Doms, M., Dunne, T., & Troske, K.R. (1997). Workers, wages, and technology. Quarterly
Journal of Economics, 112, 253-290.
Dunne, T., & Troske, K.R. (1995). Human capital, research, and development expenditures and
the adoption of new technologies. Mimeo, Center for Economic Studies, U.S. Bureau of the
Census, Washington, D.C.
Elliott, S.W. (2007). Projecting the impact of computers on work in 2030, paper prepared for the
National Academies Workshop on Research Evidence Related to Future Skill Demands.
Available: http://www7.nationalacademies.org/cfe/Stuart_Elliot_Paper.pdf
Form, W., Kauffman, R., Parcel, T., & Wallace, M. (1988). The impact of technology on work
organization and work outcomes. In G. Farkas & P. England (Eds.), Industries, firms and jobs:
Sociological and economic approaches (pp. 303-328). New York: Plenum.
Frank, D., & Eck, A. (2003). National Industry-Occupation Employment Matrix: 2000, 2010
[Computer file]. Washington, D.C.: Bureau of Labor Statistics [producer], 2001. La Jolla, CA:
Social Sciences Data Collection.
Goldin, C., & Katz, L.F. (1998). The origins of technology-skill complementarity. Quarterly
Journal of Economics, 693-732.
Greenwood, J., and Yorukoglu, M. (1997). 1974. Carnegie-Rochester Conference Series on
Public Policy, 46, 49-95.

34
Hempell, T. (2006). Computers and productivity. How firms make a general purpose technology
work. ZEW Economic Studies, 33, Physica-Verlag.
Hirsch, S. (1965). The United States electronics industry and international trade. National
Institute Economic Review, 34, 92-107.
Hirschhorn, L. (1984). Beyond mechanization: Work and technology in a post-industrial age.
Cambridge: MIT Press.
James, J.A., and Skinner, J.S. (1985). The resolution of the labor-scarcity paradox. Journal of
Economic History, 45, 513-540.
Katz, L.F., & Autor, D.H. (1999). Changes in the wage structure and earnings inequality. In O.
Ashenfelter and D. Cards (Eds.), Handbook of Labour Economics, 3. Amsterdam, North
Holland: Elsevier.
King, M., Ruggles, S., Alexander, T., Leicach, D., and Sobek, M. (2009). Integrated Public Use
Microdata Series, Current Population Survey: Version 2.0 [Machine-readable database].
Minneapolis, MN: Minnesota Population Center [producer and distributor].
Levine, J., Nottingham, J., Paige, B., & Lewis, P. (2000). Transitioning O*NET to the Standard
Occupational Classification. National Center for O*NET Development.
Levy, F., & Murnane, R.J. (1992). U.S. earnings and earnings inequality: A review of recent
trends and proposed explanations. Journal of Economic Literature, 30, 1333-1381.
Levy, F., & Murnane, R.J. (2004). The new division of labor: How computers are creating the
next job market. New York: Russell Sage Foundation.

35
Lucas, R.E. (1988). On the mechanics of economic development. Journal of Monetary
Economics, 22, 3-42.
Machin, S. (2001). The changing nature of labour demand in the new economy and skill-biased
technological change. Oxford Bulleting of Economics and Statistics, 63, 753-776.
National Academy of Science (1981). Current Population Survey, April 1971, Augmented with
DOT Characteristics. Committee on Occupational Classification and Analysis. ICPSR
Document No. 7845, Ann Arbor, MI
Nelson, R.R., and Phelps, E.S. (1966). Investment in humans, technological diffusion, and
economic growth. American Economic Review, 56, 69-75.
Osterman, P., 1991, The impact of IT on jobs and skills, In The Corporation of the 1990s:
Information Technology and Organizational Transformation, ed. M. S. Morton, 220-43. Oxford:
Oxford University Press.
Schultz, T.W. (1975). The value of the ability to deal with disequilibria. Journal of Economic
Literature, 13, 827-846.
Spenner, K.I. (1983). Deciphering Prometeus: Temporal change in the skill level of work.
American Sociological Review, 48, 824-837.
Vernon, R. (1966). International investment and international trade in the product life cycle.
Quarterly Journal of Economics, 80, 190-207.
Welch, F. (1970). Education in production. Journal of Political Economy, 78, 35-59.

36
Wood, S. (1982). Introduction. In S. Wood (Ed.), The degradation of labour? Skill, deskilling
and the labour process (pp.11-22). London: Hutchinson.
Zuboff, S. (1988). In the Age of the Smart Machine: The Future of Work and Power. New York:
Basic Books.

Table 1. Description and sources of variables Variable name Description Source
Core employee-level variables
Survey question: To what extent does reliance on computer-based technology reduce or
enhance the skill sets possessed by core employees? [ -3, -2, -1, 0, 1, 2, 3] scale
Minnesota Human Resource Management Practices
Survey 2000 - MHRMPS-2000
1. Change in content skills Basic knowledge and skills that enable reading, computing, listening, writing, and speaking
2. Change in process skills Skills needed to process information and facilitate procedures (e.g., critical thinking,
monitoring, working with new information, etc.)
3. Change in social skills Skills needed for working with people to achieve goals (e.g., social perceptiveness,
coordination and negotiation skills, persuasion and instruction skills, and team-working skills)
4. Change in complex
problem-solving skills
Skills needed for solving problems (e.g., idea generating and evaluation, implementation
planning, and assessing outcomes, etc.)
5. Change in technical skills Skills needed for designing, operating, and maintaining equipment (e.g., equipment selection,
installation, programming, operating, testing, and repairing)
6. Change in system skills Skills needed for understanding a system as a whole and acting upon it
7. Change in resources
management skills
Skills needed for working with resources in creating products (e.g. time management,
financial, materials, and personnel management)
8. Task complexity Survey question: Are the tasks performed by core employees complex? 0, 4 scale MHRMPS-2000
9. Task skill requirement Survey question: Are the tasks performed by core employees highly skilled? 0, 4 scale MHRMPS-2000
10. Task routine Survey question: Are the tasks performed by core employees routine? 0, 4 scale MHRMPS-2000
11. Computer-based
technologies (CBT)
Survey question: Are the tasks of core employees affected by computer-based technology? 0,
4 scale
MHRMPS-2000
12. Number of core employees Number of core employees MHRMPS-2000
13. Unionization Percentage of core employees that are unionized MHRMPS-2000
Firm-level variables
14. Sales Sales in 1999 (in millions of dollars) Dunn & Bradstreet
15. Wage Average wage in 1998 (in thousands of dollars) MN State Department of Economic Security
16. Education Average education (in years) of employees in Minnesota MHRMPS-2000
17. Employee age Average age (in years) of employees in Minnesota MHRMPS-2000
18. Females Proportion of females in workforce in Minnesota MHRMPS-2000
19. Firm age Years in business MHRMPS-2000
Occupation-level variables
20. Complexity-Data1971 Average level of complexity at which the worker performs in relation to data 1,7 scale April 1971 CPS augmented with DOT Fourth Ed.
1977, for 1970 Census Occupation Codes
21. Complexity-People1971 Average level of complexity at which the worker performs in relation to people 1, 9 scale April 1971 CPS augmented with DOT Fourth Ed.
1977, for 1970 Census Occupation Codes
22. Complexity-Things1971 Average level of complexity at which the worker performs in relation to things 1,8 scale April 1971 CPS augmented with DOT Fourth Ed.
1977, for 1970 Census Occupation Codes
23. Education1971 Average educational attainment [1, 9] scale IPUMS-CPS for 1970 Census Occupation Codes
24. Wages1971 Average annual wages (in thousands of dollars) IPUMS-CPS for 1970 Census Occupation Codes
Industry-level variables
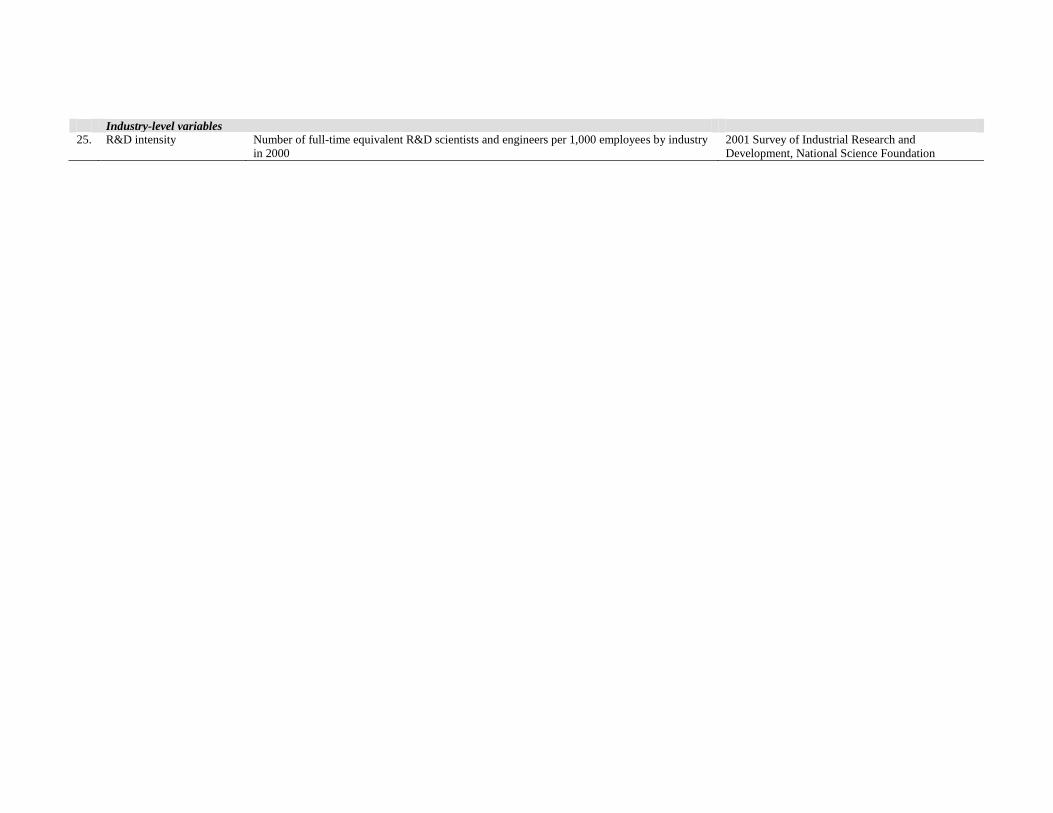
25. R&D intensity Number of full-time equivalent R&D scientists and engineers per 1,000 employees by industry
in 2000
2001 Survey of Industrial Research and
Development, National Science Foundation

Table 2. Descriptive statistics
Variable Mean SD Min Max N
Core employee-level variables
1. Change in content skills .84 1.09 -2.00 3.00 642
2. Change in process skills .95 1.14 -3.00 3.00 644
3. Change in social skills .29 .91 -3.00 3.00 643
4. Change in complex problem-solving skills .62 1.01 -3.00 3.00 642
5. Change in technical skills .89 1.21 -3.00 3.00 642
6. Change in system skills .71 1.06 -3.00 3.00 641
7. Change in resources management skills .65 1.07 -3.00 3.00 640
8. Task complexity 1.86 .94 .00 4.00 802
9. Task skill requirement 1.82 1.07 .00 4.00 805
10. Task routine 2.23 .94 .00 4.00 807
11. Computer-based technologies (CBT) 1.82 1.30 .00 4.00 810
12. Number of core employees 88.30 234.83 1.50 330.00 805
13. Unionization 18.03 37.34 .00 100.00 638
Firm-level variables
14. Sales 46.78 229.81 .01 3357.76 759
15. Wage 35.00 21.03 .56 177.29 634
16. Education 13.13 1.50 8.00 18.00 704
17. Employee age 34.26 7.14 10.00 55.00 745
18. Females (%) 45.68 25.75 .00 100.00 794
19. Firm age 34.57 27.64 .00 153.00 773
Occupation-level variables
20. Complexity-Data1971 3.75 1.39 1.00 7.00 813
21. Complexity-People1971 2.28 1.18 1.00 8.34 813
22. Complexity-Things1971 3.63 2.24 1.00 7.82 813
23. Education1971 6.07 .75 3.48 8.63 754
24. Wages1971 5.93 3.21 1.63 24.44 754
25. R&D intensity 50.16 54.82 1.00 366.00 766

Table 3. Pearson correlations
Variable 1 2 3 4 5 6 7 8 9 10 11 12 13 14 15 16 17 18 19 20 21 22 23
1. Change in content skills
2. Change in process skills .63*
3. Change in social skills .29* .29*
4. Change in complex problem-solving skills .49* .51* .33*
5. Change in technical skills .45* .49* .19* .55*
6. Change in system skills .45* .50* .34* .54* .60*
7. Change in resources management skills .38* .44* .27* .46* .48* .52*
8. Task complexity .29* .34* .05 .31* .36* .27* .25*
9. Task skill requirement .29* .29* .08 .28* .30* .22* .24* .70*
10. Task routine -.17* -.12* .00 -.12* -.10* -.15* -.08 -.23* -.21*
11. Computer-based technologies (CBT) .53* .53* .16* .43* .51* .48* .38* .36* .31* -.13*
12. Unionization .01 .01 .03 .05 .03 .06 .05 .11* .08 .02 -.01
13. Productivity .14* .15* .05 .15* .17* .19* .13* .13* .06 -.05 .12* .10
14. Wage .25* .22* .04 .23* .28* .22* .13* .32* .30* -.22* .27* .17* .23*
15. Education .28* .32* .00 .27* .25* .20* .24* .30* .29* -.20* .32* -.04 .05 .39*
16. Employee age .18* .18* .03 .23* .21* .19* .14* .24* .16* -.05 .23* .23* .16* .38* .16*
17. Females -.06 -.06 .00 -.10* -.25* -.13* -.04 -.18* -.23* .09 -.07 -.27* -.11* -.34* -.03 -.23*
18. Firm age .06 .10 .05 .07 .07 .08 .01 .02 -.02 .04 .09 .25* .12* .09 -.04 .31* -.11*
19. Complexity-Data1971 .33* .30* .03 .24* .19* .22* .21* .33* .34* -.25* .36* -.10 .08 .26* .35* .07 -.01 .00
20. Complexity-People1971 .25* .21* .08 .12* .05 .12* .18* .14* .10* -.14* .20* -.10 .01 .07 .26* -.04 .25* .00 .59*
21. Complexity-Things1971 .03 .10 .01 .08 .20* .13* .02 .26* .25* -.03 .13* .18* .00 .24* .05 .25* -.33* .14* .12* -.29*
22. Education1971 .34* .30* .12* .21* .12* .18* .20* .13* .10* -.13* .36* -.10* .05 .08 .27* .01 .25* .06 .63* .70* -.27*
23. Wages1971 .31* .31* .08 .29* .31* .25* .24* .30* .29* -.18* .35* .16* .20* .42* .25* .37* -.31* .21* .58* .28* .15* .43*
24. R&D intensity .27* .28* .00 .27* .28* .31* .17* .19* .15* -.19* .34* -.10 .08 .24* .31* .15* -.13* -.06 .27* .12* .04 .23* .15*
*p<.01

Table 4. Estimates of CBT adoption and intensity of CBT use
1. Adoption of CBT
Logit
2. Intensity of CBT use
Ordered logit; Non-users excluded
3. Intensity of CBT use
Poisson; Non-users included
(1a) (1b) (1c) (1d) (1e) (2a) (2b) (2c) (2d) (2e) (3a) (3b) (3c) (3d) (3e)
Pre-CBT complexity
variables
Data - .69
(.51)
.10
(.92) -
.70***
(.15) -
1.58**
(.55)
2.11*
(.98) -
.68***
(.10) -
.54***
(.13)
.56+
(.29) -
.26***
(.03)
People - .16
(.50) -
-1.01
(.65)
-.18
(.17) -
.06
(.45) -
.02
(.92)
.09
(.13) -
.17
(.17) -
-.24
(.32)
.00
(.04)
Things - - .26
(.94)
-.52
(1.11)
.38**
(.12) - -
-1.9+
(1.09)
3.07*
(1.35)
.12
(.10) - -
-.41
(.32)
.47
(.56)
.12***
(.03)
Data×People - -.02
(.29) - -
.41**
(.13) -
-.34
(.34) - -
.08
(.10) -
-.17
(.13) - -
.05
(.03)
Data×Things - - -.54
(.58) -
-.32*
(.16) - -
-.96+
(.57) -
-.22*
(.11) - -
-.35+
(.19) -
-.15***
(.03)
People×Things - - - -.37
(.29)
.06
(.17) - - -
3.42*
(1.69)
-.02
(.14) - - -
.24
(.67)
-.02
(.05)
Data×People×Things - - - - .27+
(.16) - - - -
.28*
(.12) - - - -
.11*
(.04)
Pre-CBT skills variables
Education .56**
(.18) - - - -
.75***
(.12) - - - -
.22***
(.04) - - - -
Wages .26***
(.04) - - - -
.06*
(.02) - - - -
.04***
(.01) - - - -
N 746 121 124 121 804 585 79 99 89 639 746 121 124 121 804
Wald 46.87*** 7.89+ 4.31 7.50* 52.86*** 78.10*** 11.11* 5.38 8.15* 79.49*** 179.9*** 28.2*** 5.78 2.69 167***
+: p<.10; *: p<.05; **: p<.01; ***: p<.001 Notes: (a) Robust standard errors of estimated coefficients are in parentheses. (b) A constant term was included in the logit and Poisson estimations, and three cut points were included in
the ordered logit estimation (omitted here for space reasons). (c) Pre-CBT complexity variables are centered to control for multicollinearity.

Table 5. Complementary log-log regressions for CBT and change in skills
Change in
1. Content skills 2. Process skills 3. Social skills
4. Complex problem-
solving skills
(1a) (1b) (1c) (2a) (2b) (2c) (3a) (3b) (3c) (4a) (4b) (4c)
CBT .04
(.02)
-.12+
(.06)
-.20*
(.09)
.09***
(.02)
-.11+
(.06)
-.12
(.09)
-.41***
(.04)
-.47***
(.09)
-.49***
(.14)
-.08**
(.02)
-.27***
(.06)
-.25*
(.10)
CBT×Wages - .02*
(.01) - -
.03***
(.01) - -
.01
(.01) - -
.02**
(.01) -
CBT×Data - -
.05*
(.02) - -
.01
(.02) - -
-.07+
(.04) - -
.04+
(.02)
CBT×People - -
.02
(03) - -
.05*
(03) - -
.11**
(.04) - -
.00
(.03)
CBT×Things
-.01
(.01)
.00
(.01)
.02
(.02)
-.01
(.01)
N 642 585 638 644 587 640 643 586 639 642 585 638
Wald χ2 2.70 6.11* 19.27*** 18.10*** 24.01*** 28.14*** 114.69*** 93.25*** 113.4*** 9.17** 18.13*** 14.65**
Change in
5. Technical skills 6. System skills
7. Resources
management skills
(5a) (5b) (5c) (6a) (6b) (6c) (7a) (7b) (7c)
CBT .04+
(.02)
-.12*
(.06)
-.21*
(.09)
-.01
(.02)
-.08
(.06)
-.17+
(.09)
-.10***
(.02)
-.27***
(.06)
-.31**
(.10)
CBT×Wages -
.02**
(.01) - -
.01
(.01) - -
.02**
(.01) -
CBT×Data - -
.01
(.02) - -
.01
(.02) - -
.03
(.02)
CBT×People
.02
(.03)
.02
(.03)
.03
(.03)
CBT×Things - - .04**
(.01) - -
.02
(.01) - -
.00
(.01)
N 642 586 638 641 585 637 640 583 636
Wald χ2 3.16+ 8.90* 15.71** 0.13 2.81 3.58 15.15*** 22.13*** 21.51***

+: p<.10; *: p<.05; **: p<.01; ***: p<.001
Notes: (a) Robust standard errors of estimated coefficients are in parentheses. (b) Regression equations have no constant. (c) Estimates include firms with
CBT=0, which have no skill variation (results are identical if CBT non-users are excluded).
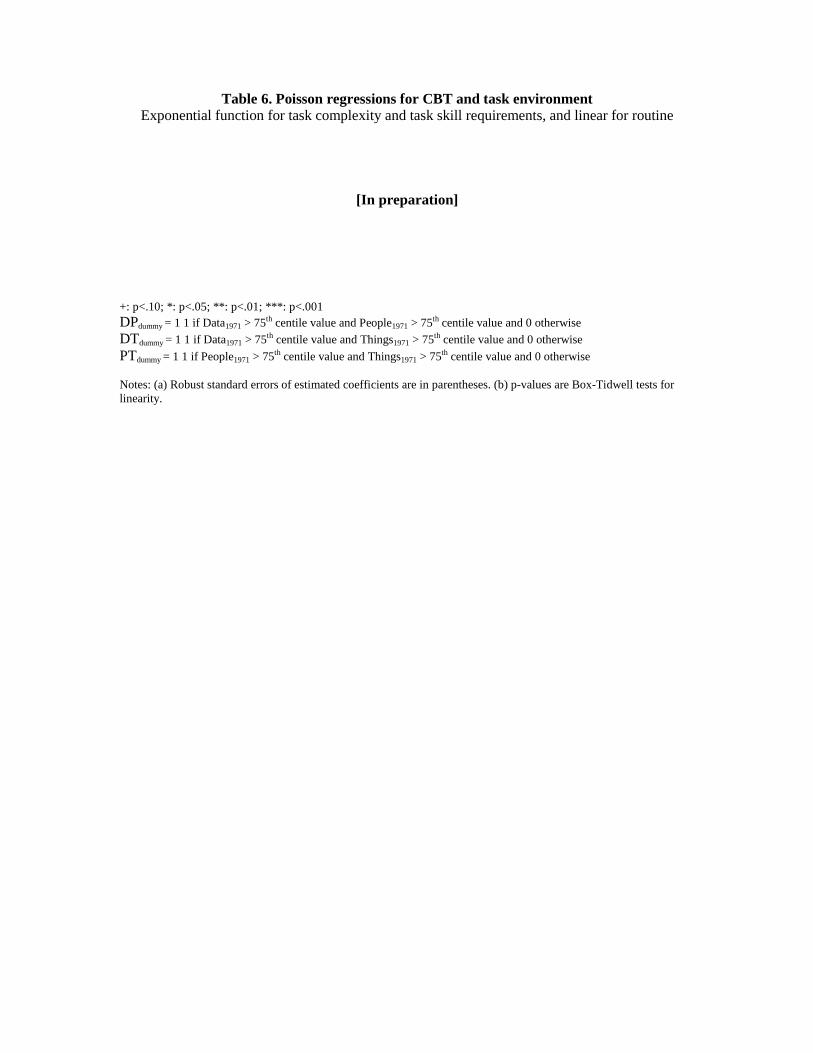
Table 6. Poisson regressions for CBT and task environment
Exponential function for task complexity and task skill requirements, and linear for routine
[In preparation]
+: p<.10; *: p<.05; **: p<.01; ***: p<.001
DPdummy = 1 1 if Data1971 > 75th centile value and People1971 > 75th centile value and 0 otherwise
DTdummy = 1 1 if Data1971 > 75th centile value and Things1971 > 75th centile value and 0 otherwise
PTdummy = 1 1 if People1971 > 75th centile value and Things1971 > 75th centile value and 0 otherwise
Notes: (a) Robust standard errors of estimated coefficients are in parentheses. (b) p-values are Box-Tidwell tests for
linearity.

54.0545.95
No Yes
Content Skills
49.38 50.62
No Yes
Process Skills
79.63
20.37
No Yes
Social Skills
63.24
36.76
No Yes
Complex Problem-Solving Skills
53.5846.42
No Yes
Technical Skills
58.35
41.65
No Yes
System Skills
62.81
37.19
No Yes
Resources Management Skills
N (number of sample firms) varies slightly between 640 and 644
(Percentage of Sample Firms)
Figure 1. Do Computer-Based Technologies Positively Affect Skills?
Notes: Summary of firm-level survey responses to the question: “To what extent does reliance on computer-based
technology reduce or enhance the skill sets possessed by core employees?” for seven types of skill. Survey responses,
rated on a 7-point scale (from -3 to 3), are reduced to “No” if CBT either “does not change skill set” (0) or “reduces
skill set slightly (-1), moderately (-2), or greatly (-3)”, and to “Yes” if CBT “enhances skill set, slightly (1), moderately
(2), or greatly (3)”.
Source: MHRMPS-2000.

Sources: MHRMPS-2000; and April 1971 CPS augmented with DOT Fourth Ed. 1977, for 1970 Census Occupation
Codes.
Notes: Firms with CBT=0 are excluded.
1
1.5
2
2.5
Skill Change
1 2 3 4
50 100 150
Number of Firms 1 2 3 4
Computer-Based Technologies (CBT)
Number of firms = 477
Figure 2.a - Entire Sample
1.00
1.50
2.00 Skill Change
1 2 3 4
0
25
50
Number of Firms 1 2 3 4
Computer-Based Technologies (CBT)
Number of firms = 106
Figure 2.b - Subsample-High Pre-CBT Task Complexity
1.00
1.50
2.00 Skill Change
1 2 3 4
0
25
50
Number of Firms 1 2 3 4
Computer-Based Technologies (CBT)
Number of firms = 74
Figure 2.c - Subsample-Low Pre-CBT Task Complexity
Figure 2. Change in Complex Problem-Solving Skills by CBT use

0
10
20
30
Skills
0 1 2 3 4 Use of Computer-Based Technologies
Figure 3.a – Skilling Hypothesis
0
1
2
3
4
Skills
0 1 2 3 4 Use of Computer-Based Technologies
Figure 3.b - Deskilling Hypothesis
0
2
4
6
8
10
Skills
0 1 2 3 4 Use of Computer-Based Technologies
Figure 3.c - Contingent Hypothesis
Figure 3. Alternative hypotheses concerning the impact of CBT use on skills

12
34
56
78
9
Pre
-Com
pu
ter
Ta
sk C
om
ple
xity
0 1 2 3 4
Computer-Based Technologies
Complexity-Data Complexity-People
Complexity-Things
N=804
Figure 4. Mean Values of Pre-Computer Task Complexity by CBT
Sources: MHRMPS-2000; and April 1971 CPS augmented with DOT Fourth Ed. 1977, for 1970 Census Occupation
Codes.

0.0
00
.25
0.5
00
.75
1.0
0
Pr(
Skill C
ha
ng
e>
0)
1 2 3 4
05
01
00
15
0
Nu
mb
er
of
Fir
ms
1 2 3 4Computer-Based Technologies (CBT)
Number of firms = 645
Figure 5.a - Entire Sample
0.0
00
.25
0.5
00
.75
1.0
0
Pr(
Skill C
ha
ng
e>
0)
1 2 3 4
01
53
0Nu
mb
er
of
Fir
ms
1 2 3 4Computer-Based Technologies (CBT)
Number of firms = 30
Figure 5.b - Subsample-High Pre-CBT Task Complexity
0.0
00
.25
0.5
00
.75
1.0
0
Pr(
Skill C
ha
ng
e>
0)
1 2 3 4
01
53
0
Nu
mb
er
of
Fir
ms
1 2 3 4Computer-Based Technologies (CBT)
Number of firms = 177
Figure 5.c - Subsample-Low Pre-CBT Task Complexity
in Complex Problem-Solving Skills
Figure 5. Estimated Probability of Positive Changes
Notes: Firms with CBT=0 are excluded.
Sources: MHRMPS-2000; and April 1971 CPS augmented with DOT Fourth Ed. 1977, for 1970 Census Occupation
Codes.

Appendix A. Data collection: Sampling Strategy and Returns
The data collection effort was generously funded by the Centers for Disease Control and
Prevention-National Institute for Occupational Safety and Health, with additional funding from
the University of Minnesota-Sloan Foundation Food Industry Center.
The sampling strategy, closely emulating our previous survey efforts, was based on our desire to
include large numbers of different types of for-profit firms from diverse industries. We also
wanted to over-sample firms with employee-stock ownership plans (ESOP) and firms in the retail
food industry, largely because our previous survey efforts had emphasized these firms and we
wished to continue with the longitudinal aspects of the database. Our focus was on for-profit
firms with at least 20 employees in diverse industries outside agriculture [SIC: 1000-8999],
headquartered and operating (majority of employees) in Minnesota. The sample firms belonged to
one five groups:
1. ESOP Firms: The names of these firms were retrieved from three independent sources:
The National Center for Employee Ownership data set (1998), the Minnesota ESOP
Association membership list (1998), and Form 5500 of 1997 (the federal tax form filed
under ERISA). There were 246 such firms.
2. Public Firms: All publicly traded firms that appeared on the 1998 CompuStat database
but were not already included above. There were 379 firms identified using this method.
3. Retail Food Firms: All firms in the retail and wholesale food industry [SIC: 5140-5149,
5400-5499, 5810-5813] with 20 or more employees, not already included above. These
firms were identified in the 1999 Dunn and Bradstreet database. There were 1191 such
firms.
4. Survivor firms from the earlier survey: All firms that were still operational who had
previously responded to our 1994/1996 survey (MHRMPS-1996) not already included
above. The number of firms in this category was 609.
5. Randomly Selected Firms: A random sample of private firms not already included above,
identified in the 1999 Dunn and Bradstreet database. There were 268 firms identified in
this manner.
Surveys were mailed to 2,693 firms in November 1999. Reminder postcards and a second mailing
of surveys followed in early 2000. By June 2000 478 firms (19.5%) had responded with valid
questionnaires. A telephone survey was conducted to increase the number of responding firms.
Data collection efforts stopped in November 2000. Table 1 presents information about the
number of firms that were mailed the survey, the number of valid candidates (firms that could
have responded - i.e., the post office did not return the survey indicating that it could not be
delivered - excluding firms that responded but did not meet the criteria for inclusion in the
sample), and the number of returned surveys. The total number of valid survey returns was 819,
which represents a response rate of 33.37%. The distribution of the sample across industries is
shown in Table A1, below:
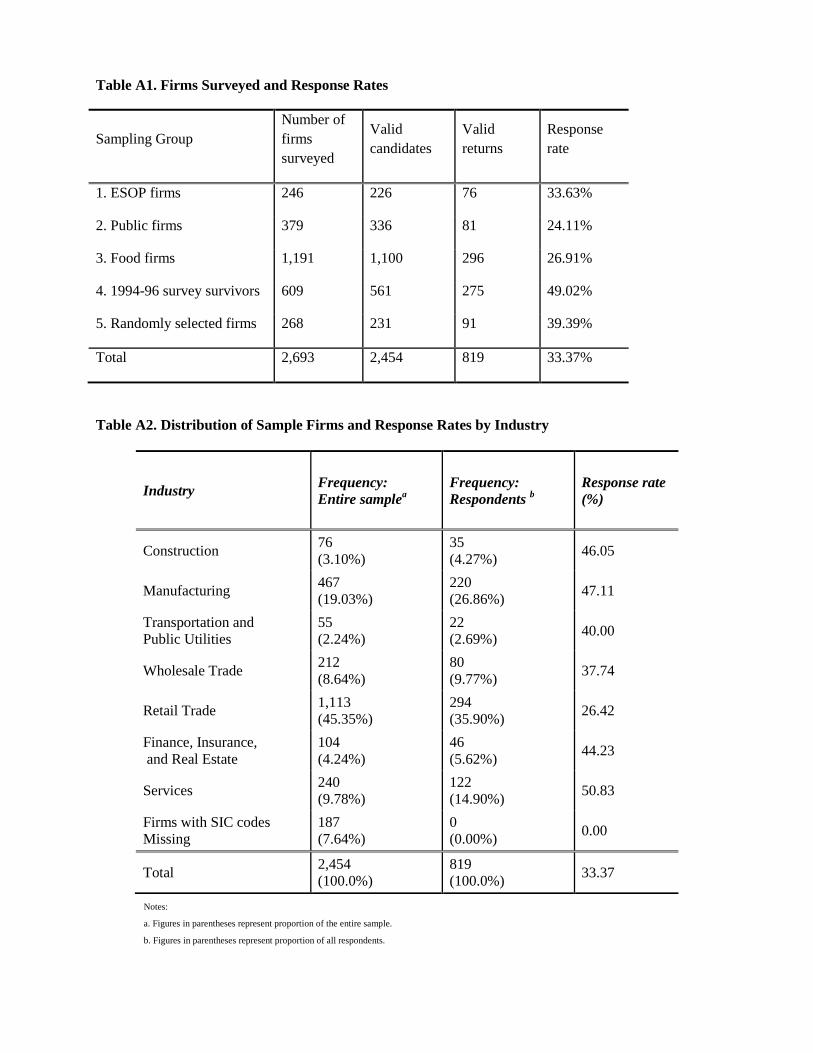
Table A1. Firms Surveyed and Response Rates
Sampling Group
Number of
firms
surveyed
Valid
candidates
Valid
returns
Response
rate
1. ESOP firms 246 226 76 33.63%
2. Public firms 379 336 81 24.11%
3. Food firms 1,191 1,100 296 26.91%
4. 1994-96 survey survivors 609 561 275 49.02%
5. Randomly selected firms 268 231 91 39.39%
Total 2,693 2,454 819 33.37%
Table A2. Distribution of Sample Firms and Response Rates by Industry
Notes:
a. Figures in parentheses represent proportion of the entire sample.
b. Figures in parentheses represent proportion of all respondents.
Industry Frequency:
Entire samplea
Frequency:
Respondents b
Response rate
(%)
Construction 76
(3.10%)
35
(4.27%) 46.05
Manufacturing 467
(19.03%)
220
(26.86%) 47.11
Transportation and
Public Utilities
55
(2.24%)
22
(2.69%) 40.00
Wholesale Trade 212
(8.64%)
80
(9.77%) 37.74
Retail Trade 1,113
(45.35%)
294
(35.90%) 26.42
Finance, Insurance,
and Real Estate
104
(4.24%)
46
(5.62%) 44.23
Services 240
(9.78%)
122
(14.90%) 50.83
Firms with SIC codes
Missing
187
(7.64%)
0
(0.00%) 0.00
Total 2,454
(100.0%)
819
(100.0%) 33.37

Appendix B. Characterization of Occupational Complexity in Terms of Tasks Related to Data, People and Things
Table B1. List of Tasks Related to Data, People and Things, Ordered by the Degree of their Complexity
(Detailed description of the tasks is presented in Table B2)
Data People Things
1 Comparing 1 Taking instructions - Helping 1 Handling
2 Copying 2 Serving 2 Feeding-Offbearing
3 Computing 3 Speaking-Signaling 3 Tending
4 Compiling 4 Persuading 4 Manipulating
5 Analyzing 5 Diverting 5 Driving-Operating
6 Coordinating 6 Supervising 6 Operating-Controlling
7 Synthesizing 7 Instructing 7 Precision Working
8 Negotiating 8 Setting-Up
9 Mentoring Source: U.S. Department of Labor (1977). Dictionary of Occupational Titles. Fourth Ed. Washington, D.C.: U.S. Government Printing Office

Table B2. Detailed description of Tasks Related to Data, People and Things
DATA: Information, knowledge, and conceptions,
related to data, people, or things, obtained by
observation, investigation, interpretation,
visualization, mental creation. Data are intangible
and include numbers, words, symbols, ideas,
concepts, and oral verbalization.
1 Comparing: Judging the readily observable
functional, structural, or compositional
characteristics (whether similar to or divergent
from obvious standards) of data, people, or things.
2 Copying: Transcribing, entering, or posting data.
3 Computing: Performing arithmetic operations and
reporting and/or carrying out a prescribed action
in relation to them. Does not include counting.
4 Compiling: Gathering, collating, or classifying
information about data, people, or things.
Reporting and/or carrying out a prescribed action
in relation to the information is frequently
involved.
5 Analyzing: Examining and evaluating data.
Presenting alternative actions in relation to the
evaluation is frequently involved.
6 Coordinating: Determining time, place, and
sequence of operations or action to be taken on the
basis of analysis of data; executing determinations
and/or reporting events.
7 Synthesizing: Integrating analyses of data to
discover facts and/or develop knowledge concepts
or interpretations.
PEOPLE: Human beings; also animals dealt with
on an individual basis as if they were human.
1 Taking instructions-Helping: Helping applies to
“non-learning” helpers. No variety of
responsibility is involved in this function.
2 Serving: Attending to the needs or requests of
people or animals or the expressed or implicit
wishes of people. Immediate response is
involved.
3 Speaking-Signaling: Talking with and/or
signaling people to convey or exchange
information. Includes giving assignments and/or
directions to helpers or assistants.
4 Persuading: Influencing others in favor of a
product, service, or point of view.
5 Diverting: Amusing others (usually
accomplished through the medium of stage,
screen, television, or radio).
6 Supervising: Determining or interpreting work
procedures for a group of workers, assigning
specific duties to them, maintaining harmonious
relations among them, and promoting efficiently.
A variety of responsibilities is involved in this
function.
7 Instructing: Teaching subject matter to others, or
training others (including animals) through
explanation, demonstration, and supervised
practice; or making recommendations on the
basis of technical disciplines.
8 Negotiating: Exchanging ideas, information, and
opinions with others to formulate policies and
programs and/or arrive jointly at decisions,
conclusions, or solutions.
9 Mentoring: Dealing with individuals in terms of
their total personality in order advise, counsel,
and/or guide them with regard to problems that
may be resolved by legal, scientific, clinical,
spiritual, and/or other professional principles.
THINGS: Inanimate objects as distinguished from human beings; substances
or materials; machines, tools, equipment, and products. A thing is tangible
and has shape, form, and other physical characteristics.
1 Handling: Using body members, handtools, and/or special devices to work,
move, or carry objects or materials. Involves little or no latitude for
judgment with regard to attainment of standards or in selecting appropriate
tool, object, or material.
2 Feeding-Offbearing: Inserting, throwing, dumping, or placing materials in
or removing them from machines or equipment which are automatic or
tended or operated by other workers.
3 Tending: Staring, stopping, and observing the functioning of machines and
equipment. Involves adjusting materials or controls of the machine, such as
changing guides, adjusting timers and temperature gages, turning valves to
allow flow of materials, and flipping switches in response to lights. Little
judgment is involved in making these adjustments.
4 Manipulating: Using body members, tools, or special devices to work,
move, guide, or place objects or materials. Involves some latitude for
judgment with regard to precision attained and selecting appropriate tool,
object, or material, although this is readily manifest.
5 Driving-Operating: Starting, stopping, and controlling the actions of
machines or equipment for which a course must be steered, or which must
be guided, in order to fabricate, process, and/or move things or people.
Involves such activities as observing gages and dials; estimating distances
and determining speed and direction of other objects; turning cranks and
wheels; pushing clutches or brakes; and pushing or pulling gear lifts or
levers. Includes such machines as cranes, conveyor systems, tractors,
furnace charging machines, paving machines, and hoisting machines.
Excludes manually powered machines, such as handtrucks and dollies, and
power assisted machines, such as electric wheelbarrows and handtrucks.
6 Operating-Controlling: Starting, stopping, controlling, and adjusting the
progress of machines or equipment. Operating machines involves setting
up and adjusting the machine or material(s) as the work progresses.
Controlling involves observing gages, dials, etc., and turning valves and
other devices to regulate factors such as temperature, pressure, flow of
liquids, speed of pumps, and reactions of materials.
7 Precision Working: Using body members and/or tools or work aids to
work, move, guide, or place objects or materials in situations where
ultimate responsibility for the attainment of standards occurs and selection
of appropriate tools, objects, or materials, and the adjustment of the tool to

the task require exercise of considerable judgment.
8. Setting-up: Adjusting machines or equipment by replacing or altering
tools, jigs, fixtures, and attachments to prepare them to perform their
functions, change their performance, or restore their proper functioning if
they break down. Workers who set up one or a number of machines for other
workers or who set up and personally operate a variety of machines are
included here.
Source: U.S. Department of Labor (1977). Dictionary of Occupational Titles. Fourth Ed., pp. 1369-1371. Washington, D.C.: U.S. Government Printing Office

Appendix C. Robustness tests
02
04
06
08
01
00
Cum
ula
tive
perc
ent
1960 1970 1980 1990 2000Year
Computer-Based Technologies, 1965-2000
Figure C1. Trends in Firm Adoption of
Source: MHRMPS-1996 and MHRMPS-2000.
Note. This figure was constructed using MHRMPS-1996, a survey similar to MHRMPS-2000, which contains firm-
level information on the year of CBT adoption. MHRMPS-1996 was administered in two rounds, first in mid-1994 to
early 1995 to 587 firms, and second in early 1996 to 1434 firms, all for-profit firms with at least 20 employees in
diverse industries outside agriculture, headquartered and operating in the state of Minnesota. The data point for 2000 is
derived from MHRMPS-2000 and reflects the use of at least some CBT. The segment between 1996 and 2000 reflects
interpolation (by linking the two data points).

Table C1. Heckman selection correction model for CBT and change in skills
1.
Content
skills
2.
Process
skills
3.
Social
skills
4.
Complex
problem-
solving
skills
5.
Technical
skills
6.
System
skills
7. Resources
management
skills
2nd Stage:
explaining change in skills
CBT .12
(.16)
.10
(.16)
-.04
(.11)
.14
(.18)
.29+
(.18)
.23*
(.11)
.04
(.17)
CBT×Data .07*
(.03)
.06*
(.03)
.00
(.02)
.07**
(.02)
.05*
(.03)
.03
(.02)
.06**
(.02)
CBT×People .06*
(.03)
.05+
(.03)
.08**
(.02)
.00
(.03)
-.01
(.03)
.03
(.02)
.04
(.03)
CBT×Things .01
(.01)
.02+
(.01)
.02+
(.01)
.01
(.01)
.04***
(.01)
.03**
(.01)
.01
(.01) N 638 640 639 638 638 637 636
Wald χ2 603.6*** 425.8*** 111.8*** 261.5*** 425.3*** 409.4*** 191.0***
1st Stage: explaining
CBT adoption
Constant .67***
(.07)
.67***
(.07)
.67***
(.08)
.67***
(.06)
.67***
(.08)
.67***
(.08)
.67***
(.08)
Data .44***
(.10)
.45***
(.10)
.44**
(.10)
.45***
(.09)
.44***
(.09)
.44***
(.10)
.44***
(.10)
People -.07 (.11)
-.08 (.11)
-.07 (.10)
-.09 (.12)
-.08 (.10)
-.07 (.11)
-.08 (.12)
Things .20**
(.08)
.20*
(.09)
.21**
(.08)
.21**
(.07)
.21**
(.07)
.21**
(.07)
.20**
(.07)
Data×People .26**
(.09)
.26*
(.10)
.26**
(.09)
.27**
(.09)
.26**
(.10)
.26**
(.08)
.26**
(.09)
Data×Things -.17 (.12)
-.17 (.11)
-.17 (.12)
-.18+ (.10)
-.17 (.11)
-.17+ (.10)
-.17 (.11)
People×Things .01
(.12)
.00
(.10)
.01
(.12)
.02
(.12)
.01
(.13)
.01
(.11)
.01
(.09)
Data×People×Things .22***
(.07)
.22+
(13)
.22+
(.12)
.22
(.13)
.21+
(.13)
.21*
(.10)
.21*
(.10)
Lambda 1.79***
(.33)
1.96*** (.35)
1.83***
(.27)
1.58*** (.39)
1.56***
(.37)
1.50*** (.24)
1.94***
(.40)
+: p<.10; *: p<.05; **: p<.01; ***: p<.001
Notes. (a) Bootstrap standard errors of estimated coefficients are in parentheses. (b) In the 2nd stage, the dependent
variable is change in skills measured as a 4-point scale variable with 1 meaning negative or zero change, and 2, 3, 4
positive change from slightly to greatly. (c) Regression equations explaining change in skills have no constant. (d) In
the 1st stage a probit model is used to predict the probability of CBT adoption. (e) When explaining CBT adoption, pre-
CBT complexity variables are centered to control for multicollinearity.

Appendix D. Aggregate Data – National Samples
Figure D1. Relative Employment and Wage Trends, 1970-1999, by high (above-mean)
and low (below-mean) pre-CBT task complexity
Sources: April 1971 CPS augmented with DOT Fourth Ed. 1977, for 1970 Census Occupation Codes; and IPUMS-CPS for 1950
Census Occupation Codes (individual-level data).
NOTE.─ Figures are for US employees in private industry that work for wages or salary from 1970 to 1998. IPUMS-CPS person-
level weights have been used.

Figure D2. Changes in Complex Problem-Solving Skills by CBT use, 2002-2008
Sources: Skills from O*NET 4.0 Database (June 2002) and O*NET 13.0 Database (June 2008); Tsacoumis and Iddenking (2006)
for standardized mean differences between incumbent and analysts ratings by SOC major groups; computer use form Current
Population Survey (CPS), October 2003, School Enrolment and Computer Use Supplement File; and IPUMS-USA for person
weights.
NOTE.─ The upper graphs show mean differences between complex problem-solving skills in 2009 (from O*NET 13.0
Database, mostly collected by incumbents) and in 2002 (from O*NET 4.0 Database, collected by analysts) for both low-CBT use
and high-CBT use (being the median the cutpoint) and separately for managerial occupations and production occupations. Low
and high-CBT use Tsacoumis and Iddekinge (2006) show that incumbents seem to inflate their ratings in relation to the analyst
ratings (about 2/3 a standard deviation higher, which represents between a medium to large effect), being this inflation
particularly large for production occupations. Therefore, corrections, proposed by Tsacoumis and Iddekinge (2006), have been
applied in the case of production occupations.