Embed Size (px)
Citation preview
DIVISION S-6-SOIL AND WATER MANAGEMENTAND CONSERVATION
Computer Simulation of Water Drop Impact in a 9.6-mm Deep Pool1
ALFREDO G. FERREIRA, BRUCE E. LAROCK, AND MICHAEL J. SiNGER2
ABSTRACTThe interaction between impact of a 3.2-mm drop and a water
layer over the soil surface was studied by simulating drop impactthrough the solution of the Navier-Stokes and continuity equationsfor a viscous and incompressible fluid on an Eulerian grid, using afinite difference method. The simulation was validated by experi-ments. The velocity field produced by the simulation showed a re-versal of the velocity vectors at the time of maximum crater devel-opment, followed by crater collapse and formation of the Rayleighjet. A comparison of measured and simulated crater and crown de-velopment showed good agreement. The energy balance from thecomputer simulation showed that the shear energy development alongthe bottom of the pool reached a maximum value during the cratercollapse when the velocity vectors in the corresponding velocity fieldwere pointing inwards and upwards.
Additional Index Words: drop impact simulation, shear energy,kinetic energy, energy balance, soil erosion.
Ferreira, A.G., B.E. Larock, and M.J. Singer. 1985. Computer sim-ulation of water drop impact in a 9.6-mm deep pool. Soil Sci. Soc.Am. J. 49:1502-1507.
THE INTERACTION between rainfall and shallowoverland flow is known to cause an increase in
sediment yield over that produced by either processalone (Ferreira and Singer, 1985). One way to under-stand this phenomenon is to study the physics of wa-terdrop impact on a water layer that overlies a hardsurface.
Engel (1966; 1967) produced the first theoreticalanalysis of drop impact by deriving an equation forthe depth of the impact crater created upon drop im-
1 Contribution from the Dep. of Land, Air and Water Resourcesand the Dep. Civil Engineering, University of California, Davis.Received 7 Sept. 1984. Approved 15 July 1985.2 Graduate Student, Professor, Dep. of Civil Engineering, and As-sociate Professor, Dep. of Land, Air and Water Resources, Univ.of California, Davis,. Davis, CA 95616. Address of the senior authoris Univ. de Evora, Evora, Portugal.
pact in a deep pool. Experimentally she observed thestreamlines around the growing crater and showed thatthey resemble the lines offeree around a bar magnet.Later Harlow and Shannon (1967) used the marker-and-cell technique (Harlow and Welch, 1965) to ob-tain approximate solutions of the Navier-Stokes equa-tions for an incompressible fluid; they used a dimen-sionless form of the equations of motion, neglectedsurface tension, and kept the viscosity term very smallso that the splash characteristics were determined bythe Froude number.
Wang (1970) used the marker-and-cell technique tosolve the continuity and Navier-Stokes equations fora viscous incompressible water drop impact on a shal-low pool, and he also experimentally measured thepressure developed upon impact. The most relevantconclusions of his work were the following: (i) thepressure below the point of impact is a maximum whenno water is on the surface and decreases with increas-ing water depth, (ii) for a simulated rainfall of 245mm h~' intensity the duration of the impact is 0.040s for a drop at terminal velocity, and the time intervalbetween two drops impacting at the same point is 0.42s and (iii) for drops at terminal velocity the pressureand shear stress on the bottom of the pool are onlyeffective inside a circle centered on the impact pointand having a diameter on the order of 10 times thedrop diameter.
The detailed mechanics of drop impact when a shal-low layer of water is over the surface are still not com-pletely understood. We studied this process by ex-amining changes in the different forms of energy duringthe simulated splash of single 3.2-mm drops in a shal-low pool with a nondeformable bottom. The objectiveof this study was to validate the computer model bycomparing the observed and simulated splash shapeand timing. We also compared energy balances ob-tained by calculations made from observations andsimulations.
FERREIRA ET AL.: COMPUTER SIMULATION OF WATER DROP IMPACT IN A 9.6-MM DEEP POOL 1503
METHOD OF SIMULATIONThe numerical solution of the continuity and Navier-
Stokes equations was used to simulate the drop splash eventand obtain an energy balance. This solution was validatedby using the experimental observations (Ferreira, 1984, p.65; Ferreira and Singer, 1985).
The incompressible Navier-Stokes and continuity equa-tions, assuming axial symmetry, take the following form:
dt'
dv'
9 r' p 37 T*'
il^-4) [1]\9r '2 9z'2 '' 3r-
/ dv' , i dv' 1 9o'' ^7 + u 97 = - p 9&+^
'" (g / 2 "^ g?2 + ^ 97jdu' , dv' , uf_ _dr' dz' r'
[2]
[3]
In these equations r1 and z7 are the polar coordinates in theradial and axial directions, u' and V are the radial and axialvelocity components, respectively; p' is the pressure, p is thefluid specific mass, cis the coefficient of kinematic viscosity,and gr and gz are the components of acceleration due to thebody force in the radial and axial directions.
These equations were rewritten in the nondimensionalform using impact velocity as the reference velocity (SV)and drop diameter as the reference length (SL).
The dimensionless form of the variables are the following:
r = //SL z = zf/SL u = u'/SVv = v'/SV p = p'/pSV21 = t'SV/SL.
By substitution in Eq. [1], [2], and [3], simplifying, andrearranging we get the dimensionless form of the Navier-Stokes and continuity equations:
|M+w|«+t;|« = _ 9 £9/ dr dz dr
SL
SLSV \ 9,2 8z2 dr [4]
._dt 9r
SL'SV2
--SLSV(_9^ + _92
£ I A \I 9r2 9z2 r dr )
dr dz [6]
where gr (SL/SV2) and gz (SL/SV2) are the inverse of theradial (Fr) and axial (F2) components of the Froud numberand J>/SLSV is the inverse of the Reynolds number (Re).
The final forms of the equations are
dr dz dr
dvdt dr dz
d2v
dz F2
L 92u . dv
du , dv , u _-r— T —— T — —or dz r [9]
The numerical solution was computed by the use of anEulerian finite-difference marker-and-cell method (Harlowand Welch, 1965). The computer code was a version ofSOLA-VOF (Nichols et al., 1980), a simplified version ofthe basic solution algorithm (SOLA) used in the marker-and-cell technique with fractional fluid volume concept(VOF) and the potential for employing a variable mesh size.The code uses a combination of the donor-acceptor and cen-tered-finite-difference methods in solving the Navier-Stokesequations. The two methods are combined into a singleexpression with a parameter that controls the relative weightgiven to each method.
The solution domain boundary conditions at the top, bot-tom, right, and left edges of the computational field are cre-ated in a subroutine for the following conditions: (i) rigidfree-slip wall, (ii) rigid nonslip wall, (iii) an outflow condi-tion that allows the fluid to escape from the computationalfield, (iv) periodic boundary in axial direction that allowssome type of periodicity at the left and right boundaries,and (v) specified constant pressure boundary. We presentresults for a rigid nonslip bottom and either a free-slip rightor outflow right boundary condition in this paper. The free-slip condition was used when the energy balance was cal-culated; the left boundary was considered a rigid free-slipwall.
To prevent numerical instability, care is required inchoosing the mesh increment, the time step, and donor-ac-ceptor weight factor in the solution process. Once the meshis selected, the time increment is bounded by the followingrestrictions: (i) the fluid can not cross one complete cell pertime step, (ii) the diffusion of momentum must not exceedone cell per time step, and (iii) if surface tension is consid-ered, capillary waves must not travel more than one cell pertime step.
Assumptions made for the drop impact simulation were:(i) no interfacial tension when the drop strikes the pool sur-face, (ii) no entrainment of air during the splash, (iii) con-stant water density and temperature, (iv) axisymmetric phe-nomenon, and (v) spherical drop.
Initial conditions used in the solution were: (i) the dropwas tangent to the horizontal pool surface, (ii) the drop ve-locity had only a vertical component, (iii) the pool waterwas motionless, and (iv) acceleration due to the body forcehad only a vertical component due to gravity.
The computational domain was a mesh of 336 equal size0.8- X 1.2-mm cells covering a real area of 17.6 X 14.4 mmwhich was sufficient for the simulation according to Wang(1970). In Sola-Vof a function (F) was used to identify cellscontaining fluid. A free surface cell is defined as having anonzero value of F but having at least one neighboring cellwith a zero F value.
The solution of the set of equations through one timeincrement consists of three steps:
1. The explicit approximation of the transient Navier-Stokes equations is used to calculate the velocities atthe new time level using the initial conditions or datafrom the previous time increment.
2. To satisfy the continuity equation the pressures are it-eratively adjusted in each cell and the changes in ve-locity are added to the known velocity.
3. The function defining the fluid regions (F) is updatedfor the new fluid configuration.
1504 SOIL SCI. SOC. AM. J., VOL. 49, 1985
An energy balance was calculated using a dimensionlessenergy equation, which was obtained by multiplying each ofthe dimensionless component Navier-Stokes equations bythe respective dimensionless velocity components, and thenadding and rearranging the equations. Surface and shear dis-sipated energies were calculated separately. The surface en-ergy term is obtained from the product of the dimensionlessnet free surface area element and the inverse of the Webernumber integrated over the fluid surface. The shear dissi-pated energy term R, is calculated by integrating, over thebottom surface, the change of the horizontal component ofthe dimensionless velocity in the vertical direction withinthe boundary layer, the inverse of the Reynolds number, thedimensionless horizontal average velocity in the boundarylayer, and the dimensionless bottom area element.
The total energy TE is given byTE = KE + PP + PE + VE + SE + SH . [10]
Total energy (TE) was calculated by integrating the kinetic(KE), potential (PE), pressure change (PP), and viscous dis-sipated (VE) energy terms in the energy equation over thefluid domain. The surface energy term (SE) is integratedover the fluid surface. The shear dissipated energy term (SH)is integrated over the bottom surface. Finally the viscousand shear energy dissipation terms are also integrated overtime.
Kinetic energy, KE, due to the movement of the fluid is
KE-i 3?
dV. [11]
[12]
Potential energy is a function of fluid position above somereference level, which in this case was the undisturbed poolsurface prior to drop impact [13]:
ay dy
Energy due to change in pressure, PP, isr
PP = IMdP/dx) + v(dP/dy)]dV.
PE = + v/Fy)dV. [13]
Viscous dissipated energy (VE) due to internal fluid fric-tion was calculated as
d2u , 32» , J_ 3» _ _u_
dt. [14]
Surface energy (SE) due to surface tension [15] and sheardissipated energy (SH) due to friction on the bottom [16]were calculated as
andSE = (I/We) (dA
vA[15]
SH = I/Re §t[JAlu(du/dx)dAl]dt [16]
where V is total fluid volume, A is the net free surface areaof the fluid, Al is the total bottom surface area, and t is time.
The computer model was validated by experiments re-ported by Ferreira (1984), who also presents more infor-mation on the development and computation of the energyterms.
RESULTS AND DISCUSSIONValidation
We compared the timing and magnitude of ob-served splash features with the computer simulationto validate the computer simulation. Crater and crowndevelopment during the impact of 3.2-mm drops onthree surfaces was compared to two simulations (Ta-ble 1). A free-slip condition at the right boundary al-lows movement of fluid in direct contact with theboundary during a simulation. The outflow boundaryallows fluid to escape from the computational field.The two boundary conditions gave identical results upto 0.020 s for crater diameter at the water surface (CT)and crown height (CW). After 0.020 s the simulatedcrater diameters were larger for the outflow boundarycondition than for the free-slip boundary.
Maximum CT was measured at 0.040 s on the threesurfaces and was simulated accurately by the free-slipboundary. The outflow boundary condition moreclosely simulated the magnitude of CT for very finesand and silt plus clay bottoms, but the free-slipboundary more closely simulated a plexiglass bottom.Bubbles formed in the experiments in which silt plusclay and plexiglass bottoms were used. The very finesand bottom produced a Rayleigh jet at 0.060 s whichwas accurately simulated by the computer code usingeither right boundary condition.
Crater width at the bottom (BCT) was accuratelysimulated with the free-slip right boundary condition.Maximum BCT occurred at 0.030 s and the magni-tudes of the experimental and simulation results werecomparable. Crown height was less accurately simu-lated, possibly because of the small computational field.The field limited the duration of a simulated impactsequence to the interval up to the instant when thecrown penetrated the upper boundary. Crater dimen-sions are smaller than those measured experimentally.The measurement accuracy on the films was ± 2%; inthe simulation the expected accuracy is ± 4% for thecrater and ± 6% for the crown.
Simulations for shallower water layers were good,but they were also limited by the grid size. Waterdepths of 3.2 mm (1 drop diam) and 1.1 mm (1/3 dropdiam) could be simulated for 0.015 and 0.008 s, re-spectively. A simulation of a 3.2-mm drop onto a hardsurface without water over the surface showed watervelocities at the drop edge to be 1.5 to 2 times largerthan the initial impact velocity of 7040 mm s~'. Thisagrees with the results of Huang et al. (1982) and Har-low and Shannon (1967).
We concluded from these comparisons that thecomputer simulation produces a reasonably good rep-resentation of water drop impact into a static waterpool. The results that follow are from a simulation ofdrop impact into a 9.6-mm (3 drop diam) pool depthand impact velocity of 8690 mm s"1. The velocityfields and energy calculations help to explain observederosion phenomena.
SimulationCrater development begins at the moment of drop
impact and continues until the maximum crater di-ameter at the surface is reached. During crater devel-
FERREIRA ET AL.: COMPUTER SIMULATION OF WATER DROP IMPACT IN A 9.6-MM DEEP POOL 1505
T= 0.006S T= 0.010 S
z1-UJKO
\<
14
12
10
8
6
4
?n
- ^^(
s S^N^ .-*. * 4 t A
1 \\ ^^V-^*-1* "S" - " ' » • * < • < • / < <
* 1 1 I 1 1 1 1 1 1 1 1 1
0 2 4 6 8 10 12 14 16 18 20 22 24RADIAL DIRECTION
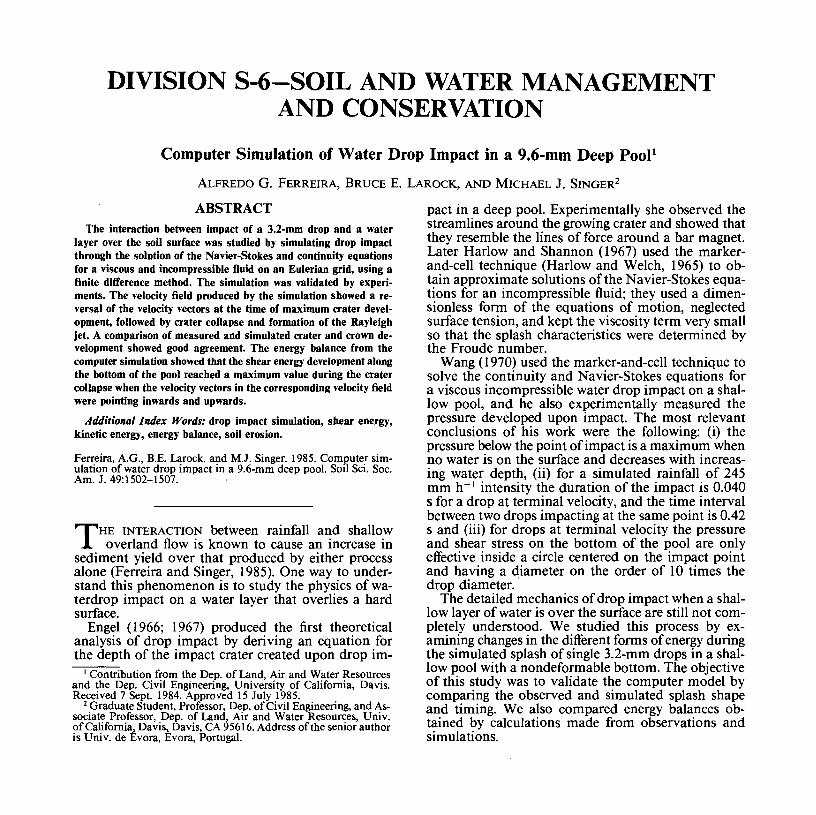
Fig. 1. Calculated velocity field for a 3.2-mm drop falling at VO =8690 mm s"1 into a pool depth D = 9.6 mm; T = 0.006 s afterimpact.
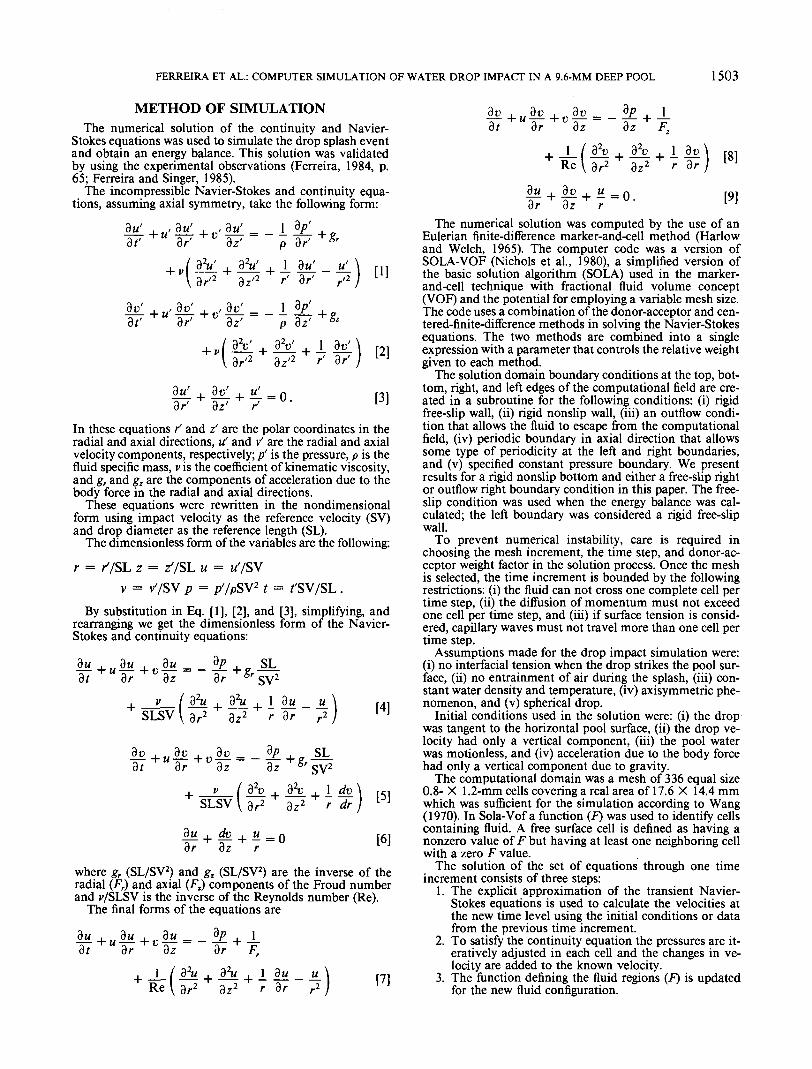
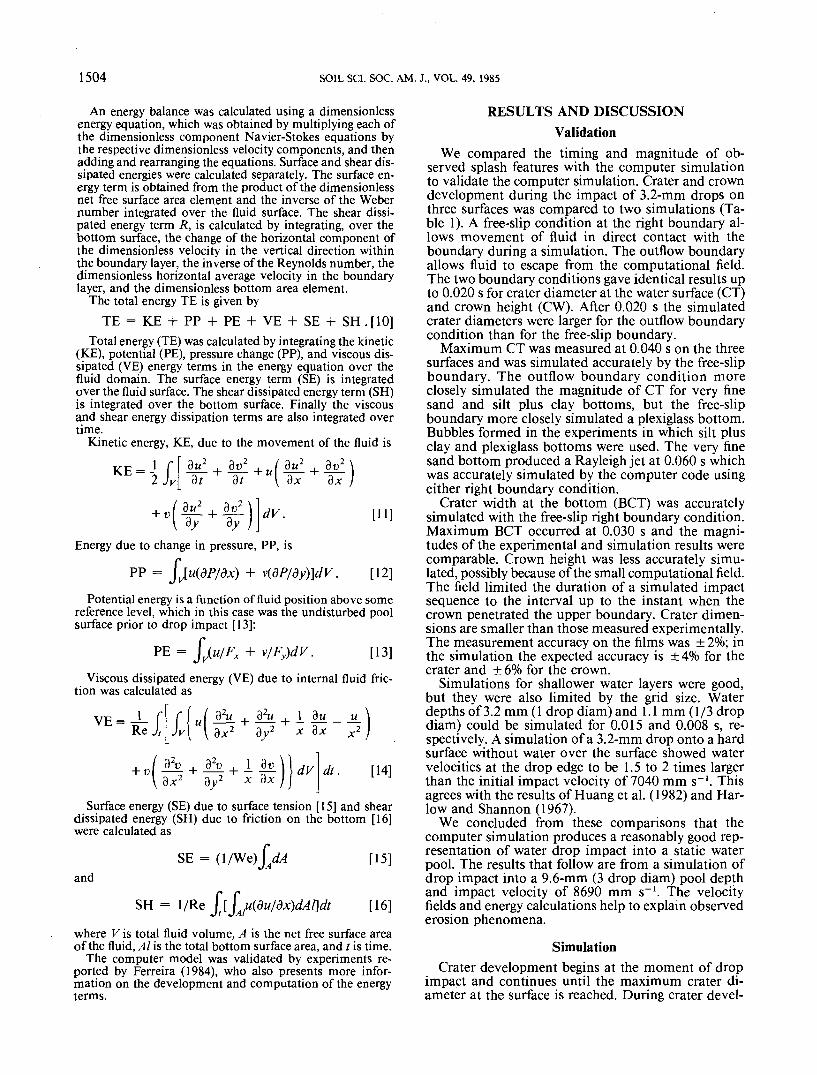
opment the drop energy, mainly kinetic energy, istransmitted to the liquid of the pool and the splashstarts. This is observed in the computer generated ve-locity field for a drop impacting on a 9.6-mm deepwater layer at a velocity of 8690 mm s~'. The velocityfield is seen 0.006 s after impact in Fig. 1. The num-bers along the axis in the radial and axial directionsidentify the cell position in the grid; as axial symmetrywas assumed, only half of the crater and crown areshown. Comparing Fig. 1 and 2, which display thevelocity field at 0.006 and 0.010 s, respectively, onecan see the rapid change in crater diameter. Compar-ing the velocity field generated at 0.010 and 0.020 s(Fig. 2 and 3), a lower rate of change of the craterdiameter can be observed. This agrees well with theexperimental results (Ferreira and Singer, 1985).
During this period it was observed in experiments(Ferreira and Singer, 1985) that the crown reaches itsmaximum height, ejects some droplets, and starts re-ceding. The energy in the droplets ejected from thecrown or from the Rayleigh jet is negligible, usuallyaccounting for <3% of the impact energy.
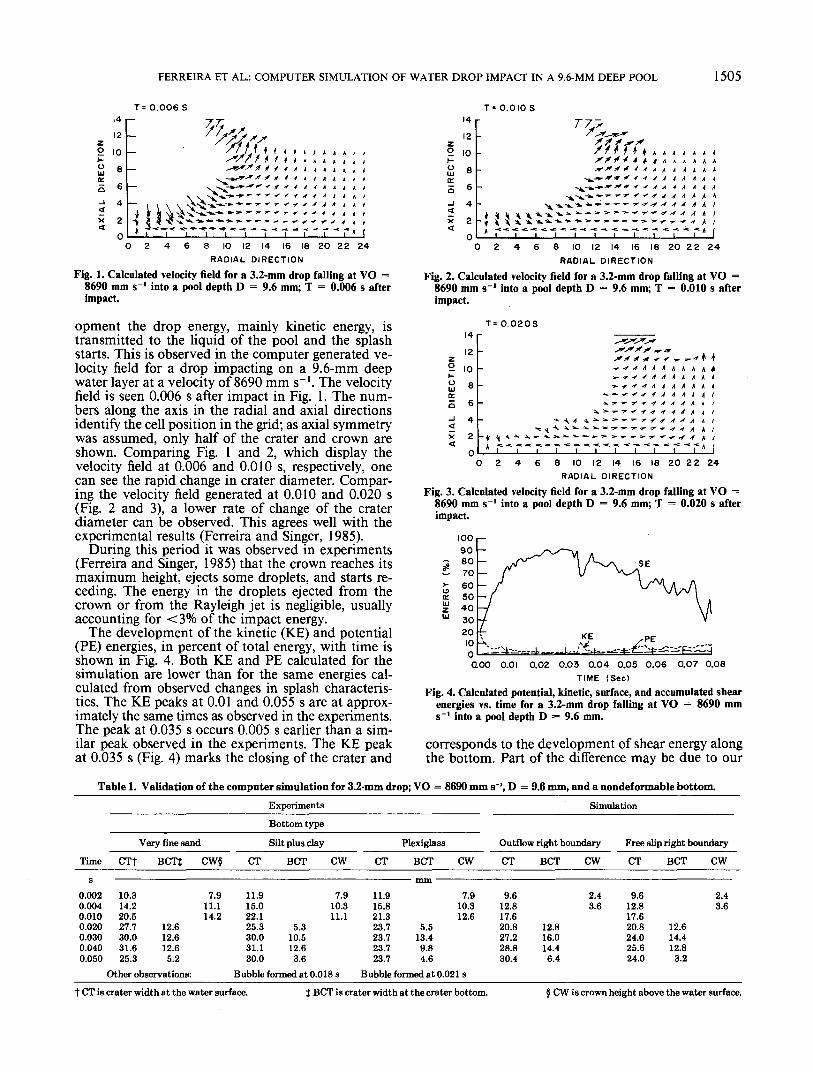
The development of the kinetic (KE) and potential(PE) energies, in percent of total energy, with time isshown in Fig. 4. Both KE and PE calculated for thesimulation are lower than for the same energies cal-culated from observed changes in splash characteris-tics. The KE peaks at 0.01 and 0.055 s are at approx-imately the same times as observed in the experiments.The peak at 0.035 s occurs 0.005 s earlier than a sim-ilar peak observed in the experiments. The KE peakat 0.035 s (Fig. 4) marks the closing of the crater and
zot-(JUl
o
4X
14
12
10
8
6
4
2
n
f.% f jf*st* n * A AXX * ¥ 4 t 4 A
x^iV--: — -^-t «l X*.^-^^^***"*"*^"-
A i i i i i i i i i
4 J A k 1
1 1 * (
0 2 4 6 8 10 12 14 16 18 20 22 24RADIAL DIRECTION
Fig. 2. Calculated velocity field for a 3.2-mm drop falling at VO =8690 mm s'1 into a pool depth D = 9.6 mm; T = 0.010 s afterimpact.
T= 0.020S
7gi-<jUl
u_j
et
1?
10
8
4
2
n
i X^S? tt 41 s* *" 4 ^•»• •* J t K A A— f •> -t 4 4 A
* -\ 4 * ^^ »• " »• ' •< -> •/
* 1 1 I 1 1 1 1 1 1 1
r** HA A A 4A A
' /I* A k 1•f 4 A /
T" '0 2 4 6 8 10 12 14 16 18 20 22 24
RADIAL DIRECTION
Fig. 3. Calculated velocity field for a 3.2-mm drop falling at VO =8690 mm s~' into a pool depth D = 9.6 mm; T = 0.020 s afterimpact.
10090807O6O50403020100
SE
QOO O.OI 0.02 0.03 0.04 0.05 0.06 0.07 0.08TIME (Sec)
Fig. 4. Calculated potential, kinetic, surface, and accumulated shearenergies vs. time for a 3.2-mm drop falling at VO = 8690 mms~' into a pool depth D = 9.6 mm.
corresponds to the development of shear energy alongthe bottom. Part of the difference may be due to our
Table 1. Validation of the computer simulation for 3.2-mm drop; VO = 8690 mm s'1, D = 9.6 mm, and a nondefonnable bottom.Experiments SimulationBottom type
Very fine sandTime
s0.0020.0040.0100.0200.0300.0400.050
CTT BCTJ
10.314.220.527.7 12.630.0 12.631.6 12.625.3 5.2
Other observations:
CW§
7.911.114.2
Silt plus dayCT BCT CW
11.9 7.915.0 10.322.1 11.125.3 5.330.0 10.531.1 12.630.0 3.6
Bubble formed at 0.018 s
CT
PlexiglassBCT
Outflow right boundaryCW
11.9 7.915.8 10.321.3 12.623.7 5.523.7 13.423.7 9.823.7 4.6
Bubble formed at 0.021 s
CT
9.612.817.620.827.228.830.4
BCT CW
2.43.6
12.816.014.46.4
Free slip right boundaryCT
9.612.817.620.824.025.624.0
BCT
12.614.412.83.2
CW
2.43.6
t CT is crater width at the water surface. } BCT is crater width at the crater bottom. § CW is crown height above the water surface.
1506 SOIL SCI. SOC. AM. J., VOL. 49, 1985
T= 0.030 s T- O.O5OS
OUJ
14
12
10
8
6
4
0
7"•*.-».
•*••-.•?•
\ *> *•V y -I -\V *| 'I ^ -
^ y V V •» -* * t f V •)
A V > - / - < - k ' 1 ' »
A V A v ^ ^ M l > , ^ ^ ^ - ^ < < - 1 1
^ 1 1 1 1 1 1 1 1
~^r~^*-*• * >r7-f f -f -f 4* 4 t K V* -r ^ * k•• * •/ K /I^ *" "^ 4 /
i tr^ "»*'-»• ^
i i i
, ,A
AA
AyVV
A 1
8 10 12 14 16 18 20 22 24RADIAL DIRECTION
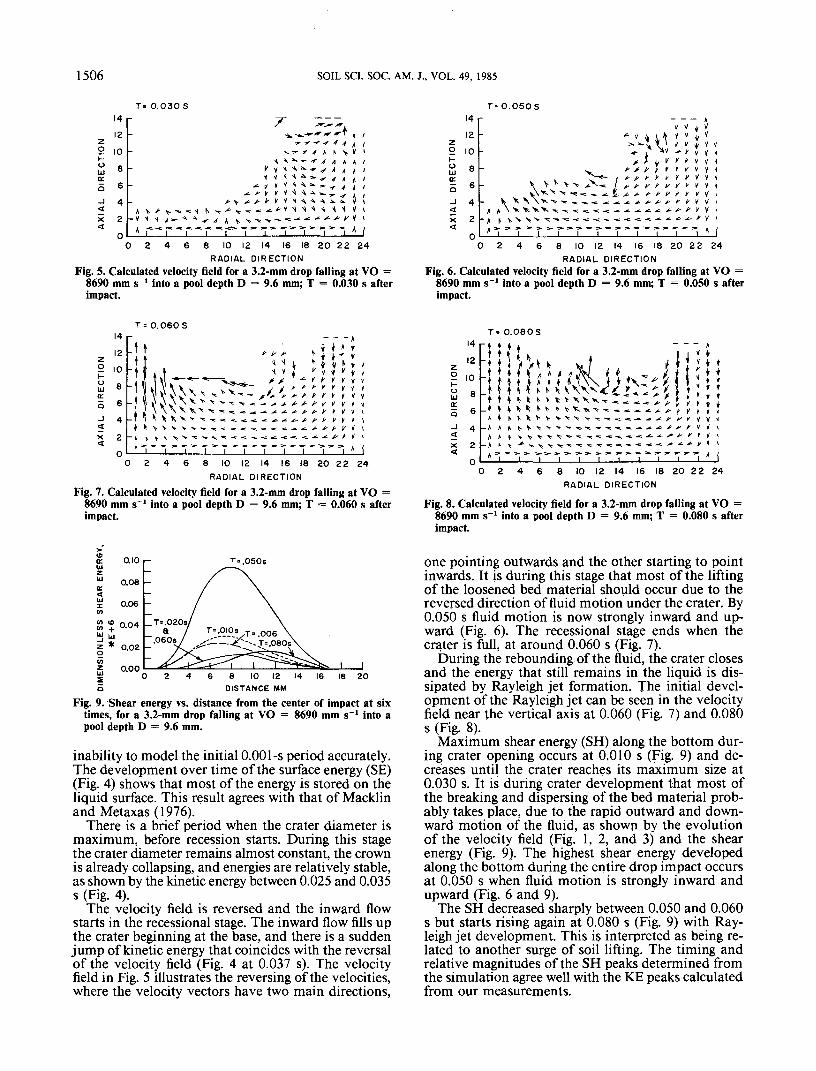
Fig. 5. Calculated velocity field for a 3.2-mm drop falling at VO =8690 mm s~> into a pool depth D = 9.6 mm; T = 0.030 s afterimpact.
vW> »-«-=«.«. l)V X \\^>! ^ ^ ^ .
' 1 1 1 1 1 1
V V Y^ > J. 1 k « V j,
f * Vv i: j *
•.*.*.t- + * l ' * ' l
1 1 1 1
A\tV
VV
VV
VVV
A
V
14gN
'
! 4 6 8 10 12 14 16 18 20 22 24RADIAL DIRECTION
Fig. 6. Calculated velocity field for a 3.2-mm drop falling at VO =8690 mm s~' into a pool depth D = 9.6 mm; T = 0.050 s afterimpact.
T= 0.060S
zoi-<jiij(E0
_J<
X<
14
12
10
8
6
4
2
n
"t
• t (
- t
-tt
»"
/ - / - / - V I I IA -1 ; <• } ; k
, t ^_^, __ X, ^^H'» A \ v v ^ CT^^ / / * * " ' ' *V V v v ^ > ^ * • * • * ' ' ' ' '\\\\^^^^-:^^^^S. * ,.? V
V v V > t > ' ^ ^ ' : - = ^ ^ i - = - : * - = ^ ' 1 ^ ' - '
1 1 1 1 1 1 1 1 1 1
**t V
1 1
</A j
T= 0.080S
0 2 4 6 8 10 12 14 16 18 20 22 24RADIAL DIRECTION
Fig. 7. Calculated velocity field for a 3.2-mm drop falling at VO =8690 mm s~' into a pool depth D = 9.6 mm; T == 0.060 s afterimpact.
zoi-oUJuo
X<
14
12
10
8
6
4
2
0
:HUs> f- t l i f f V i j f f c M t *M M ^ K * * v\\v<:/ tt t O ^ V » * V X\X-r «: * t V ^ t ' ( - V v V r v ^ - = ^ —
A t V ^ t t ' V V X ^ ^ ^ ^ ^ - ,
-A K > ^ v > ^ ^ ^ ^ ^ ^ - : -
A 1 1 1 1 1 1 1
— — — A
x^j i j i j*" •* / ! ' J » t f-- > A ; v » » *— ^ ^ / - A K » V
^ ^ -. ^ ^ ^ A V
7"T:";s"; * (0 2 8 10 12 14 16 18 20 22 24
RADIAL DIRECTION
Fig. 8. Calculated velocity field for a 3.2-mm drop falling at VO =8690 mm s~' into a pool depth D = 9.6 mm; T = 0.080 s afterimpact.
0.10
O.O8
0.06
S ? 0.04y uiz * 0.02
0.00
T=.050s
_T=.020s,
8 10 12DISTANCE MM
Fig. 9. Shear energy vs. distance from the center of impact at sixtimes, for a 3.2-mm drop falling at VO = 8690 mm s'1 into apool depth D = 9.6 mm.
inability to model the initial 0.001-s period accurately.The development over time of the surface energy (SE)(Fig. 4) shows that most of the energy is stored on theliquid surface. This result agrees with that of MacklinandMetaxas (1976).
There is a brief period when the crater diameter ismaximum, before recession starts. During this stagethe crater diameter remains almost constant, the crownis already collapsing, and energies are relatively stable,as shown by the kinetic energy between 0.025 and 0.035s (Fig. 4).
The velocity field is reversed and the inward flowstarts in the recessional stage. The inward flow fills upthe crater beginning at the base, and there is a suddenjump of kinetic energy that coincides with the reversalof the velocity field (Fig. 4 at 0.037 s). The velocityfield in Fig. 5 illustrates the reversing of the velocities,where the velocity vectors have two main directions,
one pointing outwards and the other starting to pointinwards. It is during this stage that most of the liftingof the loosened bed material should occur due to thereversed direction of fluid motion under the crater. By0.050 s fluid motion is now strongly inward and up-ward (Fig. 6). The recessional stage ends when thecrater is full, at around 0.060 s (Fig. 7).
During the rebounding of the fluid, the crater closesand the energy that still remains in the liquid is dis-sipated by Rayleigh jet formation. The initial devel-opment of the Rayleigh jet can be seen in the velocityfield near the vertical axis at 0.060 (Fig. 7) and 0.080s (Fig. 8).
Maximum shear energy (SH) along the bottom dur-ing crater opening occurs at 0.010 s (Fig. 9) and de-creases until the crater reaches its maximum size at0.030 s. It is during crater development that most ofthe breaking and dispersing of the bed material prob-ably takes place, due to the rapid outward and down-ward motion of the fluid, as shown by the evolutionof the velocity field (Fig. 1, 2, and 3) and the shearenergy (Fig. 9). The highest shear energy developedalong the bottom during the entire drop impact occursat 0.050 s when fluid motion is strongly inward andupward (Fig. 6 and 9).
The SH decreased sharply between 0.050 and 0.060s but starts rising again at 0.080 s (Fig. 9) with Ray-leigh jet development. This is interpreted as being re-lated to another surge of soil lifting. The timing andrelative magnitudes of the SH peaks determined fromthe simulation agree well with the ICE peaks calculatedfrom our measurements.
FERREIRA ET AL.: COMPUTER SIMULATION OF WATER DROP IMPACT IN A 9.6-MM DEEP POOL 1507
- 80
u>KUlzUJ
SO
40
2Ov^rr.H—fc--,~—^|-~^-
0.00 0.01 0.02 0.03 0.04 O.O5 O.O6 0.07 O.O8TIME (Sec)
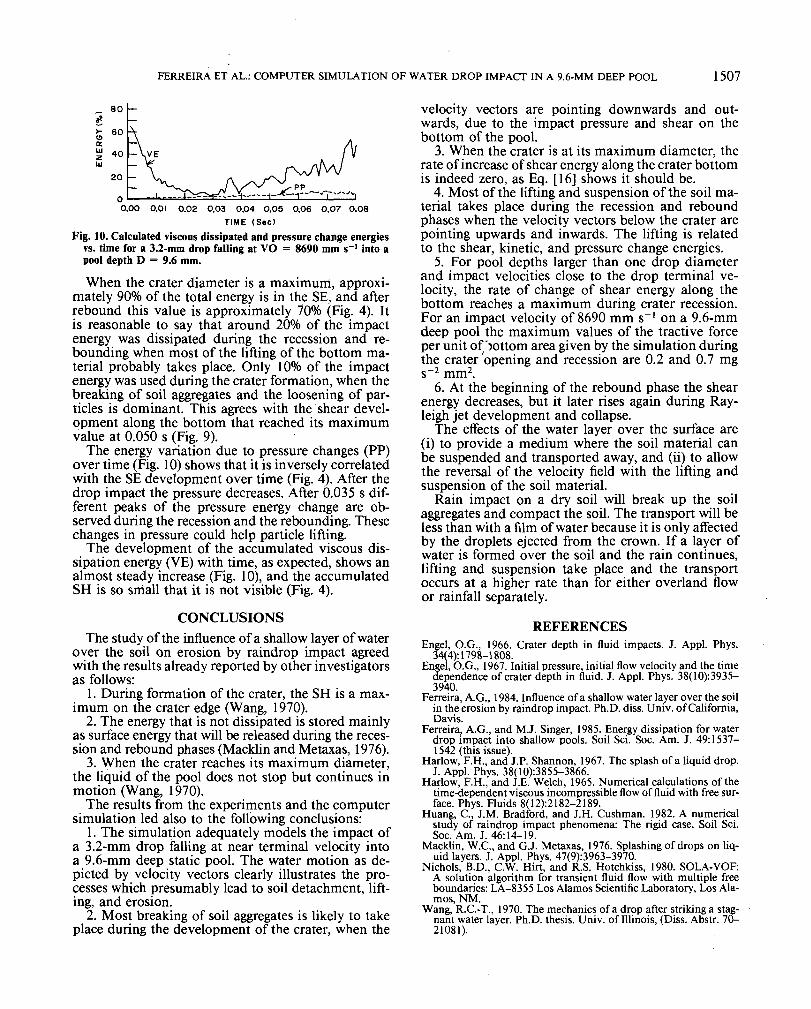
Fig. 10. Calculated viscous dissipated and pressure change energiesvs. time for a 3.2-mm drop falling at VO = 8690 mm s~' into apool depth D = 9.6 mm.
When the crater diameter is a maximum, approxi-mately 90% of the total energy is in the SE, and afterrebound this value is approximately 70% (Fig. 4). Itis reasonable to say that around 20% of the impactenergy was dissipated during the recession and re-bounding when most of the lifting of the bottom ma-terial probably takes place. Only 10% of the impactenergy was used during the crater formation, when thebreaking of soil aggregates and the loosening of par-ticles is dominant. This agrees with the shear devel-opment along the bottom that reached its maximumvalue at 0.050 s (Fig. 9).
The energy variation due to pressure changes (PP)over time (Fig. 10) shows that it is inversely correlatedwith the SE development over time (Fig. 4). After thedrop impact the pressure decreases. After 0.035 s dif-ferent peaks of the pressure energy change are ob-served during the recession and the rebounding. Thesechanges in pressure could help particle lifting.
The development of the accumulated viscous dis-sipation energy (VE) with time, as expected, shows analmost steady increase (Fig. 10), and the accumulatedSH is so small that it is not visible (Fig. 4).
CONCLUSIONSThe study of the influence of a shallow layer of water
over the soil on erosion by raindrop impact agreedwith the results already reported by other investigatorsas follows:
1. During formation of the crater, the SH is a max-imum on the crater edge (Wang, 1970).
2. The energy that is not dissipated is stored mainlyas surface energy that will be released during the reces-sion and rebound phases (Macklin and Metaxas, 1976).
3. When the crater reaches its maximum diameter,the liquid of the pool does not stop but continues inmotion (Wang, 1970).
The results from the experiments and the computersimulation led also to the following conclusions:
1. The simulation adequately models the impact ofa 3.2-mm drop falling at near terminal velocity intoa 9.6-mm deep static pool. The water motion as de-picted by velocity vectors clearly illustrates the pro-cesses which presumably lead to soil detachment, lift-ing, and erosion.
2. Most breaking of soil aggregates is likely to takeplace during the development of the crater, when the
velocity vectors are pointing downwards and out-wards, due to the impact pressure and shear on thebottom of the pool.
3. When the crater is at its maximum diameter, therate of increase of shear energy along the crater bottomis indeed zero, as Eq. [16] shows it should be.
4. Most of the lifting and suspension of the soil ma-terial takes place during the recession and reboundphases when the velocity vectors below the crater arepointing upwards and inwards. The lifting is relatedto the shear, kinetic, and pressure change energies.
5. For pool depths larger than one drop diameterand impact velocities close to the drop terminal ve-locity, the rate of change of shear energy along thebottom reaches a maximum during crater recession.For an impact velocity of 8690 mm s~' on a 9.6-mmdeep pool the maximum values of the tractive forceper unit of bottom area given by the simulation duringthe crater opening and recession are 0.2 and 0.7 mgs~2 mm2.
6. At the beginning of the rebound phase the shearenergy decreases, but it later rises again during Ray-leigh jet development and collapse.
The effects of the water layer over the surface are(i) to provide a medium where the soil material canbe suspended and transported away, and (ii) to allowthe reversal of the velocity field with the lifting andsuspension of the soil material.
Rain impact on a dry soil will break up the soilaggregates and compact the soil. The transport will beless than with a film of water because it is only affectedby the droplets ejected from the crown. If a layer ofwater is formed over the soil and the rain continues,lifting and suspension take place and the transportoccurs at a higher rate than for either overland flowor rainfall separately.


![Air Springs [9.6 mb]](https://img.pdfslide.us/doc/110x75/58541aa21a28abfa398fda21/air-springs-96-mb.jpg)