Embed Size (px)
Citation preview
Ce
ND
a
ARAA
KSCLL
1
osatwtpdeltair
Ioppmit
0d
Journal of Power Sources 196 (2011) 6870–6876
Contents lists available at ScienceDirect
Journal of Power Sources
journa l homepage: www.e lsev ier .com/ locate / jpowsour
omputer modeling of lithium phosphate and thiophosphatelectrolyte materials
.A.W. Holzwarth ∗, N.D. Lepley, Yaojun A. Du1
epartment of Physics, Wake Forest University, Winston-Salem, NC 27109, USA
r t i c l e i n f o
rticle history:eceived 8 July 2010ccepted 16 August 2010
a b s t r a c t
In this work, several lithium phosphate and thiophosphate materials are modeled to determine theiroptimized lattice structures, their total energies, and their electronic structures. Included in this studyare materials characterized by isolated phosphate and thiophosphate groups – Li3PS4 and Li3PO4 and
vailable online 28 September 2010
eywords:olid electrolyteomputer modelingithium phosphate
materials characterized by phosphate and thiophosphate dimers – Li4P2S6 and Li4P2O6 and Li4P2S7 andLi4P2O7. In addition, the superionic conducting material Li7P3S11 is also modeled as are recently discov-ered crystalline argyrodite materials Li7PS6 and Li6PS5Cl. A comparison of Li ion vacancy migration inLi4P2S7 and Li4P2O7 shows the migration energy barriers in the thiophosphate to be smaller (less thanone-half) than in the phosphate.
ithium thiophosphate
. Introduction
Lithium phosphorous oxynitride (LiPON) films were devel-ped at Oak Ridge National Laboratory [1–4] as very promisingolid-state electrolytes for use in rechargeable batteries and otherpplications. The films have compositions close to that of crys-alline Li3PO4 and ionic conductivities of 10−6 S cm−1. In previousork [5–9], we investigated detailed mechanisms for Li ion migra-
ion in idealized models of LiPON based on Li3PO4 and relatedhosphonitrides. In those materials we found that Li ions caniffuse by vacancy and interstitial mechanisms with migrationnergies of 0.3–0.7 eV. In the present work, we report pre-iminary results for extending this modeling study to lithiumhiophosphate materials which have recently received attentions promising candidates for solid-state electrolytes [10–19] wherencreased ionic conductivity as large as 10−3 S cm−1 has beeneported.
In Section 2, the computational methods are briefly described.n Section 3, results are presented for the optimized structuresf the materials, comparing corresponding phosphates and thio-hosphates when possible. In Section 4, heats of formation areresented and compared with available experimental measure-
ents. In Section 5, partial densities of states are presentedn order to develop qualitative pictures of the bonding proper-ies of the materials. In Section 6, ion migration energies are
∗ Corresponding author. Tel.: +1 336 758 5510; fax: +1 336 758 6142.E-mail address: [email protected] (N.A.W. Holzwarth).
1 ICAMS, Ruhr-Universität, 44780 Bochum, Germany.
378-7753/$ – see front matter © 2010 Elsevier B.V. All rights reserved.oi:10.1016/j.jpowsour.2010.08.042
© 2010 Elsevier B.V. All rights reserved.
presented for one of the phosphate and thiophosphate materi-als. A summary and some conclusions are presented in Section7.
2. Computational methods
The computational methods used in this work were the same asthose used in our previous studies of electrolytes related to LiPON.In Ref. [9], the choice of calculational parameters and the validationof the calculational methods are presented. Briefly, we used densityfunctional theory [20,21] to treat the electronic states and the Born-Oppenheimer approximation to treat the atomic positions {Ra},resulting in a determination of the “total energy” E({Ra}) of the sys-tem. The local density approximation (LDA) [22] was used for theexchange-correlation functional. Most of the computations werecarried out using the PWscf package [23]; while a few calculationswere performed using the abinit [24] and pwpaw [25] packages aswell. Visualizations were constructed using the OpenDX [26] andXCrySDEN [27] software packages.
Starting from experimental information for each material or arelated material, restricted optimization of the total energy E({Ra})with respect to the atomic positions {Ra} and unit cell parametersallows us to determine stable and meta-stable structures presentedin Section 3 and to estimate the heat of formation (�H) presentedin Section 4. For each meta-stable structure, a qualitative picture ofthe valence state distribution can be determined from the averaged
partial densities of states 〈Na(E) 〉 presented in Section 5. In addi-tion, migration energies (Em) for Li ion migration were estimatedusing the “nudged elastic band” (NEB) method [28–30], presentedin Section 6.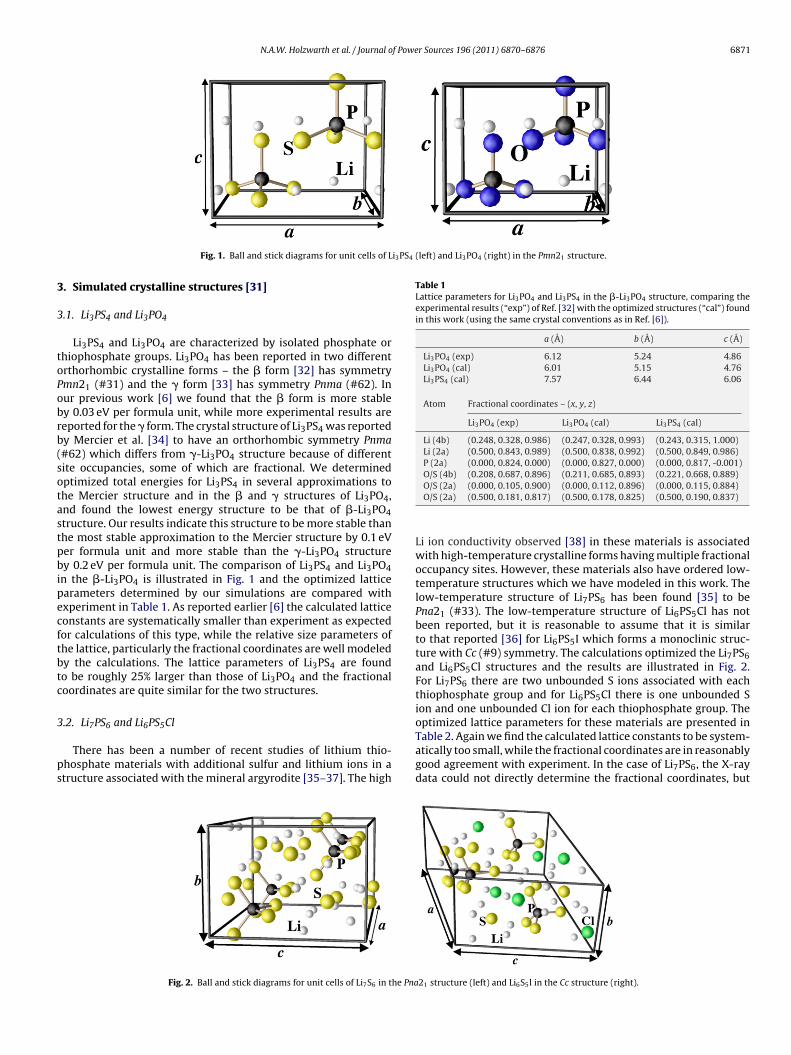
N.A.W. Holzwarth et al. / Journal of Power Sources 196 (2011) 6870–6876 6871
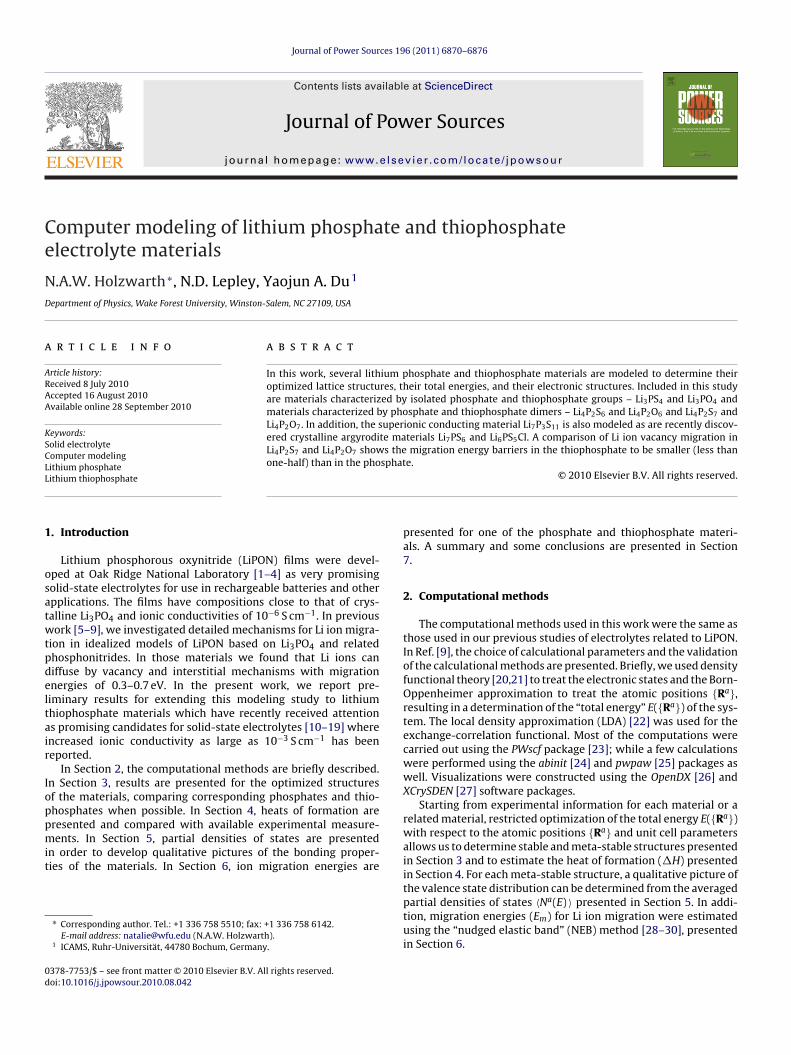
i3PS4 (left) and Li3PO4 (right) in the Pmn21 structure.
3
3
toPobrb(sotastpbipecftbtc
3
ps
Table 1Lattice parameters for Li3PO4 and Li3PS4 in the �-Li3PO4 structure, comparing theexperimental results (“exp”) of Ref. [32] with the optimized structures (“cal”) foundin this work (using the same crystal conventions as in Ref. [6]).
a (A) b (A) c (A)
Li3PO4 (exp) 6.12 5.24 4.86Li3PO4 (cal) 6.01 5.15 4.76Li3PS4 (cal) 7.57 6.44 6.06
Atom Fractional coordinates – (x, y, z)
Li3PO4 (exp) Li3PO4 (cal) Li3PS4 (cal)
Li (4b) (0.248, 0.328, 0.986) (0.247, 0.328, 0.993) (0.243, 0.315, 1.000)Li (2a) (0.500, 0.843, 0.989) (0.500, 0.838, 0.992) (0.500, 0.849, 0.986)P (2a) (0.000, 0.824, 0.000) (0.000, 0.827, 0.000) (0.000, 0.817, -0.001)O/S (4b) (0.208, 0.687, 0.896) (0.211, 0.685, 0.893) (0.221, 0.668, 0.889)
Fig. 1. Ball and stick diagrams for unit cells of L
. Simulated crystalline structures [31]
.1. Li3PS4 and Li3PO4
Li3PS4 and Li3PO4 are characterized by isolated phosphate orhiophosphate groups. Li3PO4 has been reported in two differentrthorhombic crystalline forms – the � form [32] has symmetrymn21 (#31) and the � form [33] has symmetry Pnma (#62). Inur previous work [6] we found that the � form is more stabley 0.03 eV per formula unit, while more experimental results areeported for the � form. The crystal structure of Li3PS4 was reportedy Mercier et al. [34] to have an orthorhombic symmetry Pnma#62) which differs from �-Li3PO4 structure because of differentite occupancies, some of which are fractional. We determinedptimized total energies for Li3PS4 in several approximations tohe Mercier structure and in the � and � structures of Li3PO4,nd found the lowest energy structure to be that of �-Li3PO4tructure. Our results indicate this structure to be more stable thanhe most stable approximation to the Mercier structure by 0.1 eVer formula unit and more stable than the �-Li3PO4 structurey 0.2 eV per formula unit. The comparison of Li3PS4 and Li3PO4
n the �-Li3PO4 is illustrated in Fig. 1 and the optimized latticearameters determined by our simulations are compared withxperiment in Table 1. As reported earlier [6] the calculated latticeonstants are systematically smaller than experiment as expectedor calculations of this type, while the relative size parameters ofhe lattice, particularly the fractional coordinates are well modeledy the calculations. The lattice parameters of Li3PS4 are foundo be roughly 25% larger than those of Li3PO4 and the fractionaloordinates are quite similar for the two structures.
.2. Li7PS6 and Li6PS5Cl
There has been a number of recent studies of lithium thio-hosphate materials with additional sulfur and lithium ions in atructure associated with the mineral argyrodite [35–37]. The high
Fig. 2. Ball and stick diagrams for unit cells of Li7S6 in the Pna
O/S (2a) (0.000, 0.105, 0.900) (0.000, 0.112, 0.896) (0.000, 0.115, 0.884)O/S (2a) (0.500, 0.181, 0.817) (0.500, 0.178, 0.825) (0.500, 0.190, 0.837)
Li ion conductivity observed [38] in these materials is associatedwith high-temperature crystalline forms having multiple fractionaloccupancy sites. However, these materials also have ordered low-temperature structures which we have modeled in this work. Thelow-temperature structure of Li7PS6 has been found [35] to bePna21 (#33). The low-temperature structure of Li6PS5Cl has notbeen reported, but it is reasonable to assume that it is similarto that reported [36] for Li6PS5I which forms a monoclinic struc-ture with Cc (#9) symmetry. The calculations optimized the Li7PS6and Li6PS5Cl structures and the results are illustrated in Fig. 2.For Li7PS6 there are two unbounded S ions associated with eachthiophosphate group and for Li6PS5Cl there is one unbounded Sion and one unbounded Cl ion for each thiophosphate group. Theoptimized lattice parameters for these materials are presented inTable 2. Again we find the calculated lattice constants to be system-
atically too small, while the fractional coordinates are in reasonablygood agreement with experiment. In the case of Li7PS6, the X-raydata could not directly determine the fractional coordinates, but21 structure (left) and Li6S5l in the Cc structure (right).
6872 N.A.W. Holzwarth et al. / Journal of Power Sources 196 (2011) 6870–6876
Table 2(A) Lattice parameters for low-temperature form of Li7PS6 in the Pna21 structurecomparing the experimental results of Ref. [35] with the calculational results. (B)Lattice parameters for low-temperature form of Li6PS5Cl in the Cc structure com-paring the experimental results of Ref. [36] for Li6PS5I with the calculational resultsfor the Cl material.
A
a (A) b (A) c (A)
Li7PS6 (exp) 14.08 6.92 9.96Li7PS6 (cal) 13.82 6.90 9.62
Atom Fractional coordinates – (x, y, z)
Li7PS6 (exp) Li7PS6 (cal)
Li (1) (0.238, 0.464, 0.998) (0.228, 0.533, 0.948)Li (2) (0.771, 0.416, 0.047) (0.777, 0.401, 0.048)Li (3) (0.294, 0.768, 0.745) (0.314, 0.784, 0.734)Li (4) (0.967, 0.092, 0.088) (0.971, 0.167, 0.097)Li (5) (0.551, 0.936, 0.928) (0.541, 0.949, 0.946)Li (6) (0.857, 0.021, 0.365) (0.912, 0.050, 0.409)Li (7) (0.377, 0.830, 0.270) (0.376, 0.848, 0.257)P (0.124, 0.753, 0.250) (0.118, 0.775 0.245)S (1) (0.002, 0.757, 0.118) (0.000, 0.793, 0.116)S (2) (0.251, 0.251, 0.624) (0.262, 0.270, 0.624)S (3) (0.379, 0.504, 0.876) (0.391, 0.510, 0.873)S (4) (0.881, 0.505, 0.873) (0.886, 0.468, 0.866)S (5) (0.125, 0.718, 0.735) (0.142, 0.698, 0.761)S (6) (0.385, 0.740, 0.506) (0.372, 0.762, 0.499)
B
a (A) b (A) c (A) ˇ
Li6PS5I (exp) 12.32 7.14 12.45 109.5◦
Li6PS5Cl (cal) 11.96 6.93 11.64 110.3◦
Atom Fractional coordinates – (x, y, z)
Li6PS5I (exp) Li6PS5Cl (cal)
Li (1) (0.985, 0.305, 0.371) (1.004, 0.363, 0.408)Li (2) (0.765, 0.017, 0.885) (0.841, 0.009, 0.878)Li (3) (0.830, 0.515, 0.385) (0.799, 0.533, 0.373)Li (4) (0.709, 0.740, 0.066) (0.684, 0.749, 0.025)Li (5) (0.980, 0.953, 0.131) (0.982, 0.913, 0.169)Li (6) (0.997, 0.415, 0.679) (0.976, 0.459, 0.664)P (0.747, 0.743, 0.624) (0.745, 0.764, 0.621)S (1) (0.691, 0.983, 0.672) (0.680, 0.995, 0.177)S (2) (0.685, 0.480, 0.180) (0.678, 0.484, 0.166)S (3) (0.921, 0.248, 0.174) (0.927, 0.228, 0.203)S (4) (0.692, 0.734, 0.444) (0.701, 0.782, 0.435)S (5) (0.872, 0.248, 0.490) (0.871, 0.270, 0.500)I/Cl (-0.004, 0.747, 0.371) (-0.018, 0.714, 0.354)
Table 3Lattice parameters of Li4P2S6 (compared with the experimental measurements ofRef. [39]) and Li4P2O6 in the P31m structure.
a (A) c (A) xP xS zS
Li4P2S6 (exp) 6.070 6.577 0.1715 0.3237 0.2500
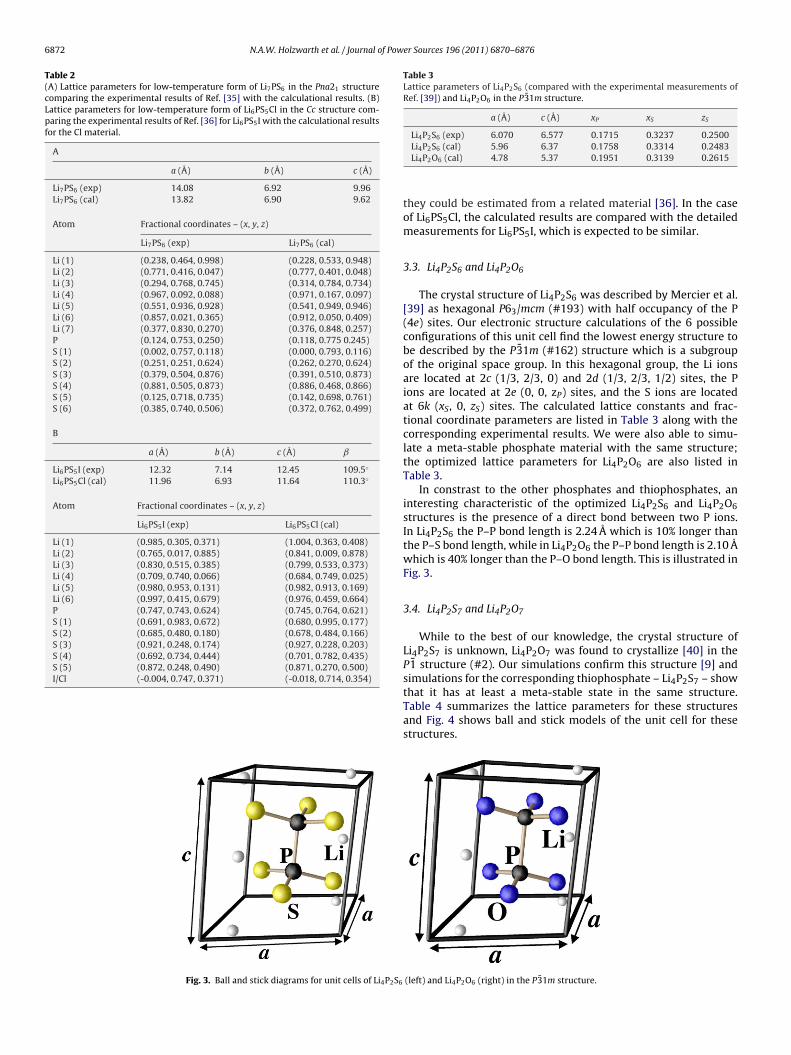
Fig. 3. Ball and stick diagrams for unit cells of Li4P2S6
Li4P2S6 (cal) 5.96 6.37 0.1758 0.3314 0.2483Li4P2O6 (cal) 4.78 5.37 0.1951 0.3139 0.2615
they could be estimated from a related material [36]. In the caseof Li6PS5Cl, the calculated results are compared with the detailedmeasurements for Li6PS5I, which is expected to be similar.
3.3. Li4P2S6 and Li4P2O6
The crystal structure of Li4P2S6 was described by Mercier et al.[39] as hexagonal P63/mcm (#193) with half occupancy of the P(4e) sites. Our electronic structure calculations of the 6 possibleconfigurations of this unit cell find the lowest energy structure tobe described by the P31m (#162) structure which is a subgroupof the original space group. In this hexagonal group, the Li ionsare located at 2c (1/3, 2/3, 0) and 2d (1/3, 2/3, 1/2) sites, the Pions are located at 2e (0, 0, zP) sites, and the S ions are locatedat 6k (xS, 0, zS) sites. The calculated lattice constants and frac-tional coordinate parameters are listed in Table 3 along with thecorresponding experimental results. We were also able to simu-late a meta-stable phosphate material with the same structure;the optimized lattice parameters for Li4P2O6 are also listed inTable 3.
In constrast to the other phosphates and thiophosphates, aninteresting characteristic of the optimized Li4P2S6 and Li4P2O6structures is the presence of a direct bond between two P ions.In Li4P2S6 the P–P bond length is 2.24 A which is 10% longer thanthe P–S bond length, while in Li4P2O6 the P–P bond length is 2.10 Awhich is 40% longer than the P–O bond length. This is illustrated inFig. 3.
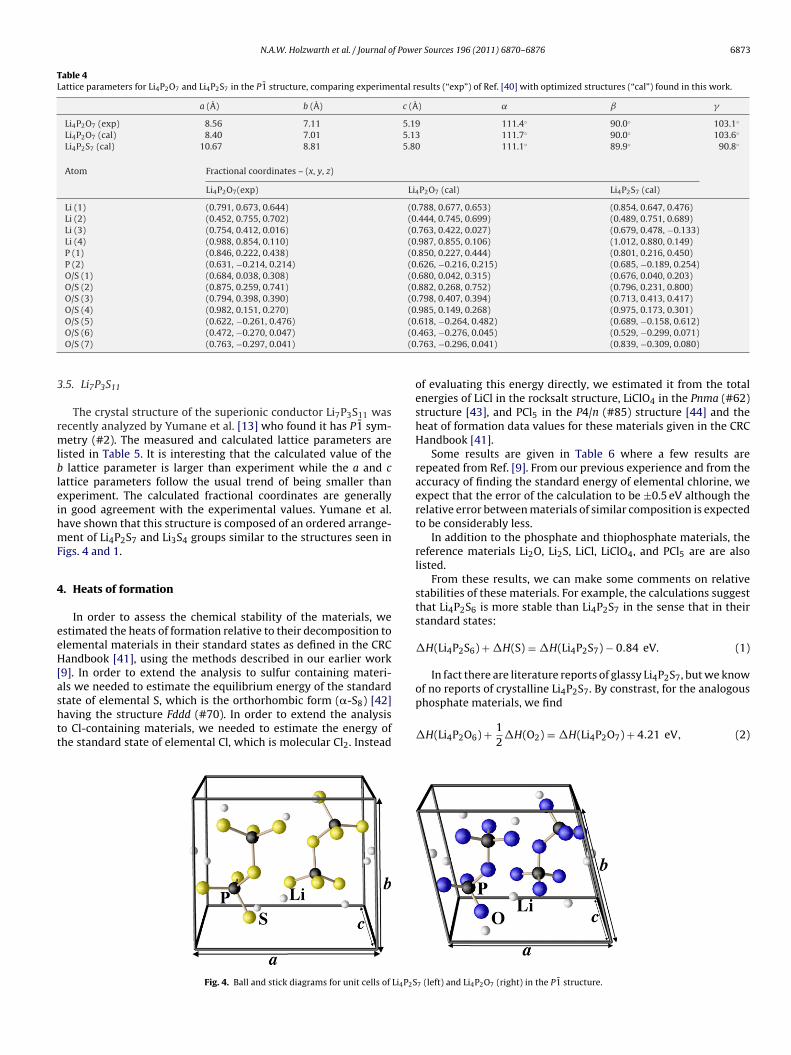
3.4. Li4P2S7 and Li4P2O7
While to the best of our knowledge, the crystal structure ofLi4P2S7 is unknown, Li4P2O7 was found to crystallize [40] in theP1 structure (#2). Our simulations confirm this structure [9] andsimulations for the corresponding thiophosphate – Li4P2S7 – showthat it has at least a meta-stable state in the same structure.
Table 4 summarizes the lattice parameters for these structuresand Fig. 4 shows ball and stick models of the unit cell for thesestructures.(left) and Li4P2O6 (right) in the P31m structure.
N.A.W. Holzwarth et al. / Journal of Power Sources 196 (2011) 6870–6876 6873
Table 4Lattice parameters for Li4P2O7 and Li4P2S7 in the P1 structure, comparing experimental results (“exp”) of Ref. [40] with optimized structures (“cal”) found in this work.
a (A) b (A) c (A) ˛ ˇ �
Li4P2O7 (exp) 8.56 7.11 5.19 111.4◦ 90.0◦ 103.1◦
Li4P2O7 (cal) 8.40 7.01 5.13 111.7◦ 90.0◦ 103.6◦
Li4P2S7 (cal) 10.67 8.81 5.80 111.1◦ 89.9◦ 90.8◦
Atom Fractional coordinates – (x, y, z)
Li4P2O7(exp) Li4P2O7 (cal) Li4P2S7 (cal)
Li (1) (0.791, 0.673, 0.644) (0.788, 0.677, 0.653) (0.854, 0.647, 0.476)Li (2) (0.452, 0.755, 0.702) (0.444, 0.745, 0.699) (0.489, 0.751, 0.689)Li (3) (0.754, 0.412, 0.016) (0.763, 0.422, 0.027) (0.679, 0.478, −0.133)Li (4) (0.988, 0.854, 0.110) (0.987, 0.855, 0.106) (1.012, 0.880, 0.149)P (1) (0.846, 0.222, 0.438) (0.850, 0.227, 0.444) (0.801, 0.216, 0.450)P (2) (0.631, −0.214, 0.214) (0.626, −0.216, 0.215) (0.685, −0.189, 0.254)O/S (1) (0.684, 0.038, 0.308) (0.680, 0.042, 0.315) (0.676, 0.040, 0.203)O/S (2) (0.875, 0.259, 0.741) (0.882, 0.268, 0.752) (0.796, 0.231, 0.800)O/S (3) (0.794, 0.398, 0.390) (0.798, 0.407, 0.394) (0.713, 0.413, 0.417)O/S (4) (0.982, 0.151, 0.270) (0.985, 0.149, 0.268) (0.975, 0.173, 0.301)O/S (5) (0.622, −0.261, 0.476) (0.618, −0.264, 0.482) (0.689, −0.158, 0.612)
(0(0
3
rmlbleihmF
4
eeH[ashtt
O/S (6) (0.472, −0.270, 0.047)O/S (7) (0.763, −0.297, 0.041)
.5. Li7P3S11
The crystal structure of the superionic conductor Li7P3S11 wasecently analyzed by Yumane et al. [13] who found it has P1 sym-etry (#2). The measured and calculated lattice parameters are
isted in Table 5. It is interesting that the calculated value of thelattice parameter is larger than experiment while the a and c
attice parameters follow the usual trend of being smaller thanxperiment. The calculated fractional coordinates are generallyn good agreement with the experimental values. Yumane et al.ave shown that this structure is composed of an ordered arrange-ent of Li4P2S7 and Li3S4 groups similar to the structures seen in
igs. 4 and 1.
. Heats of formation
In order to assess the chemical stability of the materials, westimated the heats of formation relative to their decomposition tolemental materials in their standard states as defined in the CRCandbook [41], using the methods described in our earlier work
9]. In order to extend the analysis to sulfur containing materi-ls we needed to estimate the equilibrium energy of the standard
tate of elemental S, which is the orthorhombic form (�-S8) [42]aving the structure Fddd (#70). In order to extend the analysiso Cl-containing materials, we needed to estimate the energy ofhe standard state of elemental Cl, which is molecular Cl2. InsteadFig. 4. Ball and stick diagrams for unit cells of Li4P2S
.463, −0.276, 0.045) (0.529, −0.299, 0.071)
.763, −0.296, 0.041) (0.839, −0.309, 0.080)
of evaluating this energy directly, we estimated it from the totalenergies of LiCl in the rocksalt structure, LiClO4 in the Pnma (#62)structure [43], and PCl5 in the P4/n (#85) structure [44] and theheat of formation data values for these materials given in the CRCHandbook [41].
Some results are given in Table 6 where a few results arerepeated from Ref. [9]. From our previous experience and from theaccuracy of finding the standard energy of elemental chlorine, weexpect that the error of the calculation to be ±0.5 eV although therelative error between materials of similar composition is expectedto be considerably less.
In addition to the phosphate and thiophosphate materials, thereference materials Li2O, Li2S, LiCl, LiClO4, and PCl5 are are alsolisted.
From these results, we can make some comments on relativestabilities of these materials. For example, the calculations suggestthat Li4P2S6 is more stable than Li4P2S7 in the sense that in theirstandard states:
�H(Li4P2S6) + �H(S) = �H(Li4P2S7) − 0.84 eV. (1)
In fact there are literature reports of glassy Li4P2S7, but we knowof no reports of crystalline Li4P2S7. By constrast, for the analogous
phosphate materials, we find�H(Li4P2O6) + 12
�H(O2) = �H(Li4P2O7) + 4.21 eV, (2)
7 (left) and Li4P2O7 (right) in the P1 structure.
6874 N.A.W. Holzwarth et al. / Journal of Power Sources 196 (2011) 6870–6876
Table 5Lattice parameters for Li7P3S11 in the P1 structure, comparing experimental results(“exp”) of Ref. [13] with optimized structures (“cal”) found in this work.
a (A) b (A) c (A) ˛ ˇ �
Li7P3S11 (exp) 12.50 6.03 12.53 102.8◦ 113.2◦ 74.5◦
Li7P3S11 (cal) 12.00 6.16 12.24 102.4◦ 113.8◦ 72.1◦
Fractional coordinates – (x, y, z)
Atom Li7P3S11 (cal) Li7P3S11 (cal)
Li (1) (0.669, 0.132, 0.092) (0.669, 0.070, 0.094)Li (2) (0.638, 0.402, 0.866) (0.600, 0.549, 0.880)Li (3) (0.216, 0.530, 0.740) (0.199, 0.489, 0.707)Li (4) (−0.058, 0.786, 0.270) (−0.030, 0.837, 0.251)Li (5) (0.359, 0.591, 0.337) (0.299, 0.771, 0.298)Li (6) (0.637, 0.734, 0.498) (0.680, 0.648, 0.508)Li (7) (0.139, 0.294, 0.134) (0.129, 0.268, 0.116)P (1) (0.794, 0.033, 0.465) (0.780, 0.054, 0.452)P (2) (0.493, 0.038, 0.297) (0.472, −0.007, 0.273)P (3) (0.840, 0.270, 0.059) (0.830, 0.318, 0.057)S (1) (0.861, 0.236, 0.620) (0.822, 0.289, 0.598)S (2) (0.824, 0.105, 0.334) (0.811, 0.118, 0.314)S (3) (0.840, −0.317, 0.468) (0.853, −0.271, 0.488)S (4) (0.618, 0.160, 0.453) (0.583, 0.170, 0.425)S (5) (0.331, 0.227, 0.288) (0.304, 0.152, 0.294)S (6) (0.509, 0.080, 0.151) (0.478, 0.047, 0.120)S (7) (0.509, −0.300, 0.307) (0.522, −0.343, 0.302)S (8) (0.841, 0.330, −0.097 (0.820, 0.394, −0.102)S (9) (0.828, −0.073, 0.046) (0.865, −0.028, 0.057)
sIc
Lt
�
�Td
�
THps�
S (10) (0.678, 0.487, 0.064) (0.663, 0.474, 0.081)S (11) (0.977, 0.351, 0.188) (0.968, 0.429, 0.203)
uggesting that Li4P2O6 is significantly unstable relative to Li4P2O7.n fact we know of no literature reports of observations of Li4P2O6rystals.
For the argyrodite material, the calculations also suggest thati7PS6 is unstable relative to decomposition into Li3PS4 and Li2S inhe sense that
H(Li7PS6) = �H(Li3PS4) + 2�H(Li2S) + 0.32 eV. (3)
In this estimate, we used the �-Li3PO4 structure to evaluateH(Li3PS4) and the result is within our expected calculation error.
he material with chlorine is also marginally unstable relative to
ecomposition into Li3PS4, Li2S, and LiCl as shown in the equationH(Li6PS5Cl) = �H(Li3PS4) + �H(Li2S) + �H(LiCl) + 0.38 eV. (4)
able 6eats of formation per formula unit calculated for the listed reference and lithiumhosphate and thiophosphate materials. The structure is described in terms of thepace group using the notation of Ref. [31]. When available, experimental values ofH from Ref. [41] are also listed.
Material Structure �Hcal (eV) �Hexp (eV)
Li2O Fm3m (#225) −6.13 −6.20�-Li3PO4 Pmn21 (#31) −21.31�-Li3PO4 Pnma (#62) −21.28 −21.72Li4P2O7 P1 (#2) −34.10Li4P2O6 P31m (#162) −29.89
Li2S Fm3m (#225) −4.26 −4.57�-Li3PS4 Pmn21 (#31) −8.32�-Li3PS4 Pnma (#62) −8.12Li7PS6 Pna21 (#33) −16.51Li4P2S7 P1 (#2) −11.51Li4P2S6 P31m (#162) −12.35Li7P3S11 P1 (#2) −19.89
LiCl Fm3m (#225) −3.80 −4.23LiClO4 Pnma (#62) −4.49 −3.95PCl5 P4/n (#85) −4.08 −4.60Li6PS5Cl Cc (#9) −16.00
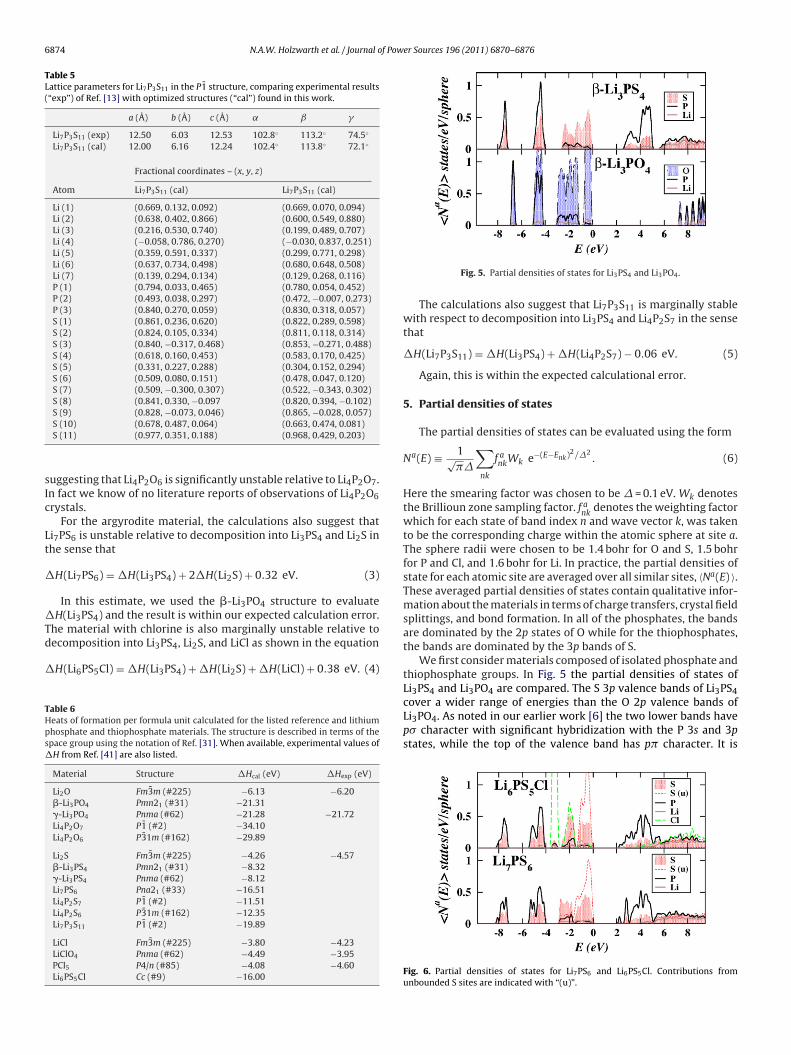
Fig. 5. Partial densities of states for Li3PS4 and Li3PO4.
The calculations also suggest that Li7P3S11 is marginally stablewith respect to decomposition into Li3PS4 and Li4P2S7 in the sensethat
�H(Li7P3S11) = �H(Li3PS4) + �H(Li4P2S7) − 0.06 eV. (5)
Again, this is within the expected calculational error.
5. Partial densities of states
The partial densities of states can be evaluated using the form
Na(E) ≡ 1√��
∑
nk
f ankWk e−(E−Enk)2/�2
. (6)
Here the smearing factor was chosen to be � = 0.1 eV. Wk denotesthe Brillioun zone sampling factor. f a
nkdenotes the weighting factor
which for each state of band index n and wave vector k, was takento be the corresponding charge within the atomic sphere at site a.The sphere radii were chosen to be 1.4 bohr for O and S, 1.5 bohrfor P and Cl, and 1.6 bohr for Li. In practice, the partial densities ofstate for each atomic site are averaged over all similar sites, 〈Na(E) 〉.These averaged partial densities of states contain qualitative infor-mation about the materials in terms of charge transfers, crystal fieldsplittings, and bond formation. In all of the phosphates, the bandsare dominated by the 2p states of O while for the thiophosphates,the bands are dominated by the 3p bands of S.
We first consider materials composed of isolated phosphate andthiophosphate groups. In Fig. 5 the partial densities of states ofLi3PS4 and Li3PO4 are compared. The S 3p valence bands of Li3PS4
cover a wider range of energies than the O 2p valence bands ofLi3PO4. As noted in our earlier work [6] the two lower bands havep� character with significant hybridization with the P 3s and 3pstates, while the top of the valence band has p� character. It isFig. 6. Partial densities of states for Li7PS6 and Li6PS5Cl. Contributions fromunbounded S sites are indicated with “(u)”.
N.A.W. Holzwarth et al. / Journal of Power Sources 196 (2011) 6870–6876 6875
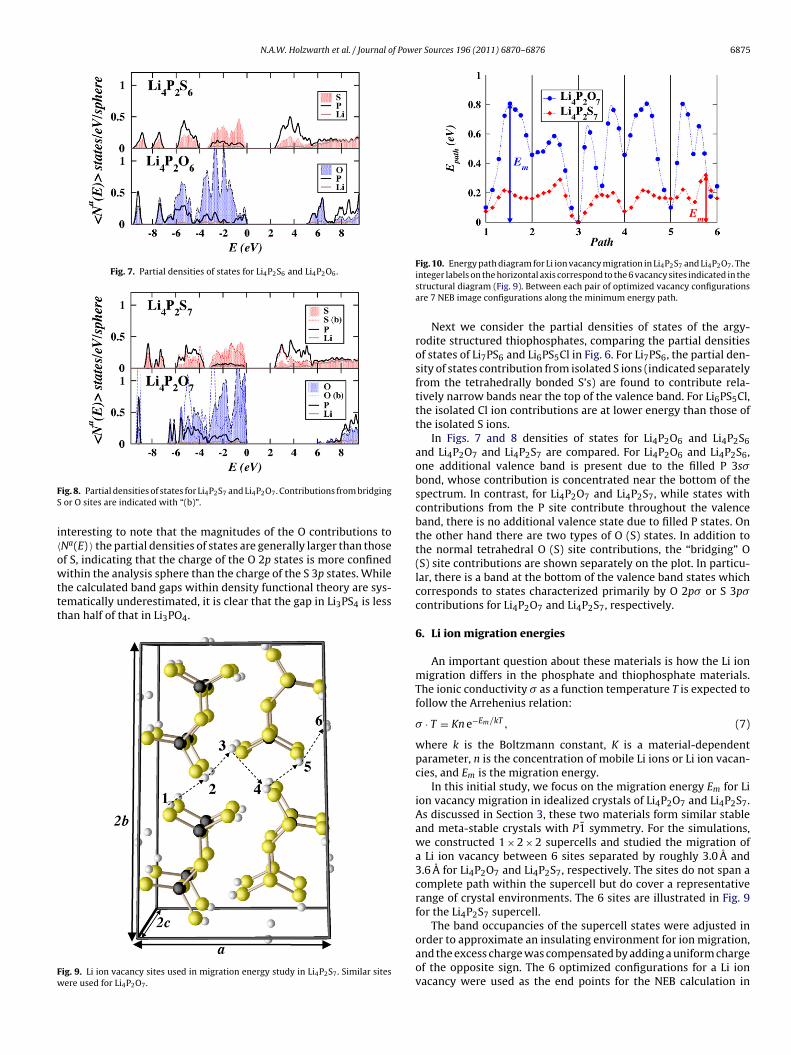
Fig. 7. Partial densities of states for Li4P2S6 and Li4P2O6.
FS
i〈owttt
Fw
Fig. 10. Energy path diagram for Li ion vacancy migration in Li4P2S7 and Li4P2O7. The
ig. 8. Partial densities of states for Li4P2S7 and Li4P2O7. Contributions from bridgingor O sites are indicated with “(b)”.
nteresting to note that the magnitudes of the O contributions toNa(E) 〉 the partial densities of states are generally larger than thosef S, indicating that the charge of the O 2p states is more confined
ithin the analysis sphere than the charge of the S 3p states. Whilehe calculated band gaps within density functional theory are sys-ematically underestimated, it is clear that the gap in Li3PS4 is lesshan half of that in Li3PO4.
ig. 9. Li ion vacancy sites used in migration energy study in Li4P2S7. Similar sitesere used for Li4P2O7.
integer labels on the horizontal axis correspond to the 6 vacancy sites indicated in thestructural diagram (Fig. 9). Between each pair of optimized vacancy configurationsare 7 NEB image configurations along the minimum energy path.
Next we consider the partial densities of states of the argy-rodite structured thiophosphates, comparing the partial densitiesof states of Li7PS6 and Li6PS5Cl in Fig. 6. For Li7PS6, the partial den-sity of states contribution from isolated S ions (indicated separatelyfrom the tetrahedrally bonded S’s) are found to contribute rela-tively narrow bands near the top of the valence band. For Li6PS5Cl,the isolated Cl ion contributions are at lower energy than those ofthe isolated S ions.
In Figs. 7 and 8 densities of states for Li4P2O6 and Li4P2S6and Li4P2O7 and Li4P2S7 are compared. For Li4P2O6 and Li4P2S6,one additional valence band is present due to the filled P 3s�bond, whose contribution is concentrated near the bottom of thespectrum. In contrast, for Li4P2O7 and Li4P2S7, while states withcontributions from the P site contribute throughout the valenceband, there is no additional valence state due to filled P states. Onthe other hand there are two types of O (S) states. In addition tothe normal tetrahedral O (S) site contributions, the “bridging” O(S) site contributions are shown separately on the plot. In particu-lar, there is a band at the bottom of the valence band states whichcorresponds to states characterized primarily by O 2p� or S 3p�contributions for Li4P2O7 and Li4P2S7, respectively.
6. Li ion migration energies
An important question about these materials is how the Li ionmigration differs in the phosphate and thiophosphate materials.The ionic conductivity � as a function temperature T is expected tofollow the Arrehenius relation:
� · T = Kn e−Em/kT , (7)
where k is the Boltzmann constant, K is a material-dependentparameter, n is the concentration of mobile Li ions or Li ion vacan-cies, and Em is the migration energy.
In this initial study, we focus on the migration energy Em for Liion vacancy migration in idealized crystals of Li4P2O7 and Li4P2S7.As discussed in Section 3, these two materials form similar stableand meta-stable crystals with P1 symmetry. For the simulations,we constructed 1 × 2 × 2 supercells and studied the migration ofa Li ion vacancy between 6 sites separated by roughly 3.0 A and3.6 A for Li4P2O7 and Li4P2S7, respectively. The sites do not span acomplete path within the supercell but do cover a representativerange of crystal environments. The 6 sites are illustrated in Fig. 9for the Li4P2S7 supercell.
The band occupancies of the supercell states were adjusted in
order to approximate an insulating environment for ion migration,and the excess charge was compensated by adding a uniform chargeof the opposite sign. The 6 optimized configurations for a Li ionvacancy were used as the end points for the NEB calculation in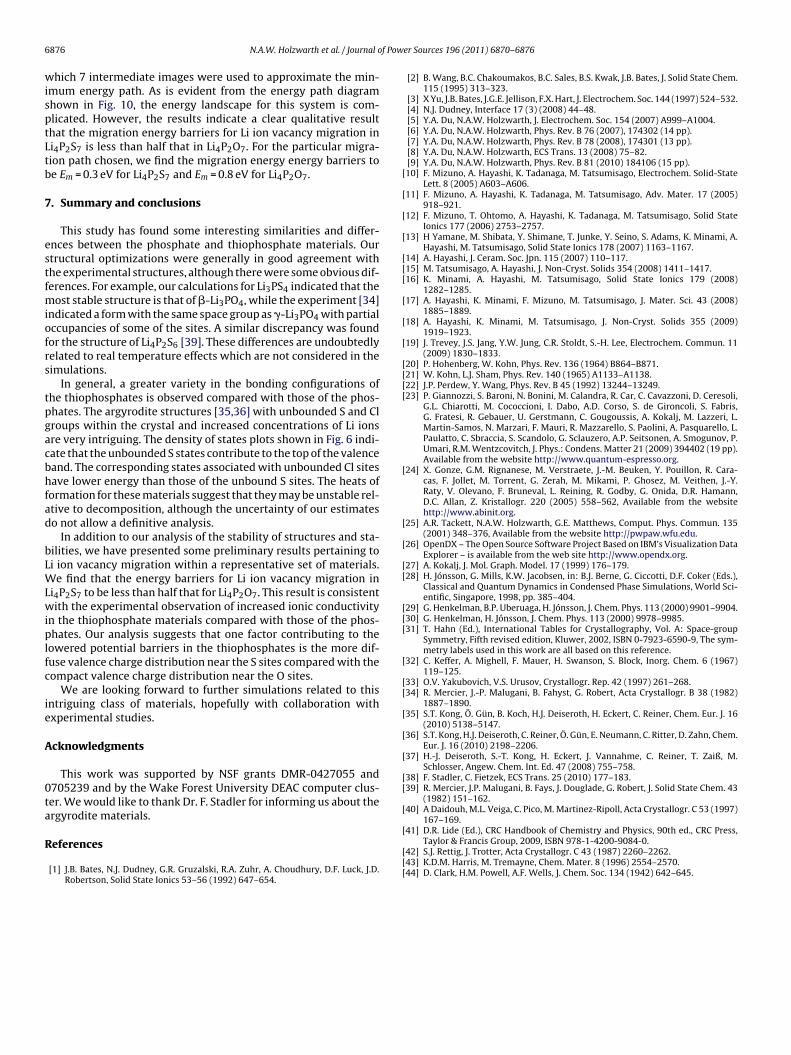
6 f Pow
wisptLtb
7
estfmiofrs
tpgacbhfad
bLWLwiplfc
ie
A
0ta
R
[
[
[
[
[[[
[
[
[
[[[[
[
[
[
[[
[[[
[
[[
[
[
[
[[
[
[41] D.R. Lide (Ed.), CRC Handbook of Chemistry and Physics, 90th ed., CRC Press,
876 N.A.W. Holzwarth et al. / Journal o
hich 7 intermediate images were used to approximate the min-mum energy path. As is evident from the energy path diagramhown in Fig. 10, the energy landscape for this system is com-licated. However, the results indicate a clear qualitative resulthat the migration energy barriers for Li ion vacancy migration ini4P2S7 is less than half that in Li4P2O7. For the particular migra-ion path chosen, we find the migration energy energy barriers toe Em = 0.3 eV for Li4P2S7 and Em = 0.8 eV for Li4P2O7.
. Summary and conclusions
This study has found some interesting similarities and differ-nces between the phosphate and thiophosphate materials. Ourtructural optimizations were generally in good agreement withhe experimental structures, although there were some obvious dif-erences. For example, our calculations for Li3PS4 indicated that the
ost stable structure is that of �-Li3PO4, while the experiment [34]ndicated a form with the same space group as �-Li3PO4 with partialccupancies of some of the sites. A similar discrepancy was foundor the structure of Li4P2S6 [39]. These differences are undoubtedlyelated to real temperature effects which are not considered in theimulations.
In general, a greater variety in the bonding configurations ofhe thiophosphates is observed compared with those of the phos-hates. The argyrodite structures [35,36] with unbounded S and Clroups within the crystal and increased concentrations of Li ionsre very intriguing. The density of states plots shown in Fig. 6 indi-ate that the unbounded S states contribute to the top of the valenceand. The corresponding states associated with unbounded Cl sitesave lower energy than those of the unbound S sites. The heats of
ormation for these materials suggest that they may be unstable rel-tive to decomposition, although the uncertainty of our estimateso not allow a definitive analysis.
In addition to our analysis of the stability of structures and sta-ilities, we have presented some preliminary results pertaining toi ion vacancy migration within a representative set of materials.
e find that the energy barriers for Li ion vacancy migration ini4P2S7 to be less than half that for Li4P2O7. This result is consistentith the experimental observation of increased ionic conductivity
n the thiophosphate materials compared with those of the phos-hates. Our analysis suggests that one factor contributing to the
owered potential barriers in the thiophosphates is the more dif-use valence charge distribution near the S sites compared with theompact valence charge distribution near the O sites.
We are looking forward to further simulations related to thisntriguing class of materials, hopefully with collaboration withxperimental studies.
cknowledgments
This work was supported by NSF grants DMR-0427055 and705239 and by the Wake Forest University DEAC computer clus-er. We would like to thank Dr. F. Stadler for informing us about thergyrodite materials.
eferences
[1] J.B. Bates, N.J. Dudney, G.R. Gruzalski, R.A. Zuhr, A. Choudhury, D.F. Luck, J.D.Robertson, Solid State Ionics 53–56 (1992) 647–654.
[[[
er Sources 196 (2011) 6870–6876
[2] B. Wang, B.C. Chakoumakos, B.C. Sales, B.S. Kwak, J.B. Bates, J. Solid State Chem.115 (1995) 313–323.
[3] X Yu, J.B. Bates, J.G.E. Jellison, F.X. Hart, J. Electrochem. Soc. 144 (1997) 524–532.[4] N.J. Dudney, Interface 17 (3) (2008) 44–48.[5] Y.A. Du, N.A.W. Holzwarth, J. Electrochem. Soc. 154 (2007) A999–A1004.[6] Y.A. Du, N.A.W. Holzwarth, Phys. Rev. B 76 (2007), 174302 (14 pp).[7] Y.A. Du, N.A.W. Holzwarth, Phys. Rev. B 78 (2008), 174301 (13 pp).[8] Y.A. Du, N.A.W. Holzwarth, ECS Trans. 13 (2008) 75–82.[9] Y.A. Du, N.A.W. Holzwarth, Phys. Rev. B 81 (2010) 184106 (15 pp).10] F. Mizuno, A. Hayashi, K. Tadanaga, M. Tatsumisago, Electrochem. Solid-State
Lett. 8 (2005) A603–A606.11] F. Mizuno, A. Hayashi, K. Tadanaga, M. Tatsumisago, Adv. Mater. 17 (2005)
918–921.12] F. Mizuno, T. Ohtomo, A. Hayashi, K. Tadanaga, M. Tatsumisago, Solid State
Ionics 177 (2006) 2753–2757.13] H Yamane, M. Shibata, Y. Shimane, T. Junke, Y. Seino, S. Adams, K. Minami, A.
Hayashi, M. Tatsumisago, Solid State Ionics 178 (2007) 1163–1167.14] A. Hayashi, J. Ceram. Soc. Jpn. 115 (2007) 110–117.15] M. Tatsumisago, A. Hayashi, J. Non-Cryst. Solids 354 (2008) 1411–1417.16] K. Minami, A. Hayashi, M. Tatsumisago, Solid State Ionics 179 (2008)
1282–1285.17] A. Hayashi, K. Minami, F. Mizuno, M. Tatsumisago, J. Mater. Sci. 43 (2008)
1885–1889.18] A. Hayashi, K. Minami, M. Tatsumisago, J. Non-Cryst. Solids 355 (2009)
1919–1923.19] J. Trevey, J.S. Jang, Y.W. Jung, C.R. Stoldt, S.-H. Lee, Electrochem. Commun. 11
(2009) 1830–1833.20] P. Hohenberg, W. Kohn, Phys. Rev. 136 (1964) B864–B871.21] W. Kohn, L.J. Sham, Phys. Rev. 140 (1965) A1133–A1138.22] J.P. Perdew, Y. Wang, Phys. Rev. B 45 (1992) 13244–13249.23] P. Giannozzi, S. Baroni, N. Bonini, M. Calandra, R. Car, C. Cavazzoni, D. Ceresoli,
G.L. Chiarotti, M. Cococcioni, I. Dabo, A.D. Corso, S. de Gironcoli, S. Fabris,G. Fratesi, R. Gebauer, U. Gerstmann, C. Gougoussis, A. Kokalj, M. Lazzeri, L.Martin-Samos, N. Marzari, F. Mauri, R. Mazzarello, S. Paolini, A. Pasquarello, L.Paulatto, C. Sbraccia, S. Scandolo, G. Sclauzero, A.P. Seitsonen, A. Smogunov, P.Umari, R.M. Wentzcovitch, J. Phys.: Condens. Matter 21 (2009) 394402 (19 pp).Available from the website http://www.quantum-espresso.org.
24] X. Gonze, G.M. Rignanese, M. Verstraete, J.-M. Beuken, Y. Pouillon, R. Cara-cas, F. Jollet, M. Torrent, G. Zerah, M. Mikami, P. Ghosez, M. Veithen, J.-Y.Raty, V. Olevano, F. Bruneval, L. Reining, R. Godby, G. Onida, D.R. Hamann,D.C. Allan, Z. Kristallogr. 220 (2005) 558–562, Available from the websitehttp://www.abinit.org.
25] A.R. Tackett, N.A.W. Holzwarth, G.E. Matthews, Comput. Phys. Commun. 135(2001) 348–376, Available from the website http://pwpaw.wfu.edu.
26] OpenDX – The Open Source Software Project Based on IBM’s Visualization DataExplorer – is available from the web site http://www.opendx.org.
27] A. Kokalj, J. Mol. Graph. Model. 17 (1999) 176–179.28] H. Jónsson, G. Mills, K.W. Jacobsen, in: B.J. Berne, G. Ciccotti, D.F. Coker (Eds.),
Classical and Quantum Dynamics in Condensed Phase Simulations, World Sci-entific, Singapore, 1998, pp. 385–404.
29] G. Henkelman, B.P. Uberuaga, H. Jónsson, J. Chem. Phys. 113 (2000) 9901–9904.30] G. Henkelman, H. Jónsson, J. Chem. Phys. 113 (2000) 9978–9985.31] T. Hahn (Ed.), International Tables for Crystallography, Vol. A: Space-group
Symmetry, Fifth revised edition, Kluwer, 2002, ISBN 0-7923-6590-9, The sym-metry labels used in this work are all based on this reference.
32] C. Keffer, A. Mighell, F. Mauer, H. Swanson, S. Block, Inorg. Chem. 6 (1967)119–125.
33] O.V. Yakubovich, V.S. Urusov, Crystallogr. Rep. 42 (1997) 261–268.34] R. Mercier, J.-P. Malugani, B. Fahyst, G. Robert, Acta Crystallogr. B 38 (1982)
1887–1890.35] S.T. Kong, Ö. Gün, B. Koch, H.J. Deiseroth, H. Eckert, C. Reiner, Chem. Eur. J. 16
(2010) 5138–5147.36] S.T. Kong, H.J. Deiseroth, C. Reiner, Ö. Gün, E. Neumann, C. Ritter, D. Zahn, Chem.
Eur. J. 16 (2010) 2198–2206.37] H.-J. Deiseroth, S.-T. Kong, H. Eckert, J. Vannahme, C. Reiner, T. Zaiß, M.
Schlosser, Angew. Chem. Int. Ed. 47 (2008) 755–758.38] F. Stadler, C. Fietzek, ECS Trans. 25 (2010) 177–183.39] R. Mercier, J.P. Malugani, B. Fays, J. Douglade, G. Robert, J. Solid State Chem. 43
(1982) 151–162.40] A Daidouh, M.L. Veiga, C. Pico, M. Martinez-Ripoll, Acta Crystallogr. C 53 (1997)
167–169.
Taylor & Francis Group, 2009, ISBN 978-1-4200-9084-0.42] S.J. Rettig, J. Trotter, Acta Crystallogr. C 43 (1987) 2260–2262.43] K.D.M. Harris, M. Tremayne, Chem. Mater. 8 (1996) 2554–2570.44] D. Clark, H.M. Powell, A.F. Wells, J. Chem. Soc. 134 (1942) 642–645.


![Lithium Ferro Phosphate Batteries À X sZ> ]](https://img.pdfslide.us/doc/110x75/6233b6f8981f423dc57ea6f8/lithium-ferro-phosphate-batteries-x-szgt-.jpg)