Embed Size (px)
Citation preview
Computer Graphics and
Geometric Modeling

Springer Science+Business Media, LLC
David Salomon
Computer Graphics and
Geometric Modeling
With 335 Illustrations
, Springer
David Salomon Department of Computer Science California State University Northridge, CA 91330-8281 USA
Library of Congress Cataloging-in-Publication Data Salomon, D. (David), 1938-
Computer graphics and geometric modeling / David Salomon. p. cm.
lncludes bibliographical references and index. ISBN 978-1-4612-7170-3 ISBN 978-1-4612-1504-2 (eBook)
DOI 10.1007/978-1-4612-1504-2
1. Computer graphics. 2. Mathematical models. 1. Title. T38S.S243 1999 006.6--dc21 98-33424
Printed on acid-free paper.
© 1999 Springer Science+Business Media New York Originally published by Springer-Verlag New York, lnc. in 1999
Softcover reprint of the hardcover 1 st edition 1999 Ali rights reserved. This work may not be translated or copied in whole or in part without the written permission of the publisher Springer Science+Business Media, LLC, except for brief excerpts in connection with reviews or scholarly analysis. U se in connection with any form of information storage and retrieval, electronic adaptation, computer software, or by similar or dissimilar methodology now known or hereafter developed is forbidden. The use of general descriptive names, trade narnes, trademarks, etc., in this publication, even if the former are not especially identified, is not to be taken as a sign that such narnes, as understood by the Trade Marks and Merchandise Marks Act, may accordingly be used freely by anyone.
Production managed by Jenny Wolkowicki; manufacturing supervised by Jeffrey Taub. Carnera-ready copy provided by the author.
9 8 7 6 5 432 1
ISBN 978-1-4612-7170-3

To my family, without whose help, patience, and support this book would not have been written.
Preface Joseph-Louis Lagrange (1736-1813), one of the greatest mathematicians of the 18th century, made important contributions to the theory of numbers and to analytical and celestial mechanics. His most important work is Mecanique Analytique (1788), the textbook on which all subsequent work in this field is based. A contemporary reader is surprised to find no diagrams or figures of any kind in this book on mechanics. This reflects one extreme approach to graphics, namely considering it unimportant or even detracting as a teaching tool and not using it. Today, of course, this approach is unthinkable. Graphics, especially computer graphics, is commonly used in texts, advertisements, and movies to illustrate concepts, to emphasize points being discussed, and to entertain.
Our approach to graphics has been completely reversed since the days of Lagrange, and it seems that much of this change is due to the use of computers. Computer graphics today is a mature, successful, and growing field. It is used by many people for many purposes and it is enjoyed by even more people. One criterion for the maturity of a field of study is its size. When a certain discipline becomes so big that no one person can keep all of it in their head, we say that that discipline has matured (or has come of age). This is what happened to computer graphics in the last decade or so. It is now a large field consisting of many subfields such as curve and surface design, rendering methods, and computer animation. Even a person who has written a book covering the entire field cannot claim that they keep all that material in their head all the time, which is precisely the reason why textbooks are being written.
Lagrange was born in Thrin, Italy and his original name was Giuseppe Luigi LaGrangia. Here is a quote from the preface to his book:
''The reader will find no figures in this work. The methods which I set forth do not require either constructions or geometrical or mechanical reasonings, but only algebraic operations, subject to a regular and uniform rule of procedure. '
The material presented here has been developed during many years of teaching computer graphics. It has been revised and distilled many times, with many
viii Preface
examples and exercises added. The text emphasizes the mathematics behind computer graphics and is intended for readers who want to understand how graphics programs work and how present-day computer graphics can generate and display realistic-looking curves, surfaces, and solid objects.
Most of the necessary mathematical background (such as vectors and matrices) is covered in the Appendix. However, some math concepts that are used only once (such as the mediation operator and points vs. vectors) are discussed right where they are introduced.
The many exercises sprinkled in the text are not a cosmetic feature. They deal with important topics, and should be worked out. Answers are provided but they should be consulted only as a last resort.
The main topics covered in this book are the following: 1. Scan conversion methods. These are used to select the best pixels for
generating lines, circles, and other geometrical figures. 2. Geometric transformations and projections. This topic starts with simple
concepts of translating and rotating objects, and ends with a complete picture of how an observer (or a camera) can be made to move around a three-dimensional scene, step by step, and project it on a two-dimensional screen. Perspective projections (a traditionally confusing topic) are discussed in two ways, first using the traditional approach, found in most texts, then using a novel, coordinate-free, vectorbased approach. As a bonus, transformations and projections in many dimensions are discussed, as well as several interesting types of nonlinear projections.
3. Curves and surfaces. A realistic-looking object is calculated and displayed on the screen by simulating the light reflected from its surface, which is why surfaces are important in computer graphics. The key to constructing a surface, however, is to know how to draw a single curve. This is the main reason why curves are also important. The discussion is mathematical and it proceeds from curves to wireframe surfaces, to the calculation of the normal to a surface, to the rendering of a solid surface. Quite a few methods are discussed, each illustrated by examples.
4. Several other topics are presented, such as CRT operation, antialiasing, computer animation, color and color perception, half toning and dithering, polygonal surfaces, and compression of graphics files.
An important feature of this text is the attention to "orphans." Those are topics that most texts on computer graphics either mention briefly or completely ignore. Examples are perspective projections, curves, surfaces, quaternions, and image compression. The reader will find that this text discusses orphans in great detail, including numerous examples and exercises.
The book is intended as a textbook for a two-course sequence on computer graphics and geometric modeling for graduate and advanced undergraduate students. However, it is the author's belief that the book can also serve as a professional book, widening the horizons of professionals in other fields who are interested in a thorough, mathematical exposition of the principles, methods, and techniques used in computer graphics. The mathematical background required for a complete understanding of this material includes polynomials, vectors, matrices, determinants, and differentiation.
Preface ix
Historical Notes
The history of computer graphics started in the early 1950s. This is very early, considering that the history of the modern digital electronic computer itself started in the late 1940s. However, due to high hardware prices, the field was originally the domain of a few lucky individuals, and it was only in the 1970s that it started growing fast and eventually became the wide discipline that we know today. Here is a short chronology.
By 1951 the Whirlwind computer installed at MIT had two 16-inch graphics displays (actually, modified oscilloscopes). Surprisingly, there were no immediate users.
Plotters came into use as graphics output devices in 1953. In 1955, the SAGE air defense system started its operations. It used vector
scanned monitors as its main output and light pens as its input devices. Digital Equipment Corporation (DEC) was founded in 1957. It started making
minicomputers that were later used in the early development of computer graphics. Light pens came into wide use in 1958, the same year as the first microfilm
recorder. In 1959, a partnership of General Motors and IBM produced the first piece
of drawing software, the DAC-1 (Design Augmented by Computers). Users could input the three-dimensional description of a car, view the car in perspective, and rotate it.
It was in the 1960s that the field got its first big push. In 1961, Ivan Sutherland developed Sketchpad, a drawing program, as his Ph.D. thesis at MIT. Sketchpad used a light pen as its main input device and an oscilloscope (modified to do vector scan) as its output device. The first version handled two-dimensional figures only, and was later extended to draw, transform, and project three-dimensional objects, and also to perform engineering calculations such as stress analysis. One important feature of Sketchpad was its ability to recognize constraints. The user could draw, e.g., a rough square, then instruct the software to convert it to an exact square. Another feature was the ability to deal with objects, not just individual curve segments. The user could build an object out of segments, then ask the software to scale it. For information and images related to Sketchpad, see http://www.sun.com/960710/feature3/sketchpad.html#sketch.
At about the same time, Steven Russell, another MIT student, developed the first video game, Spacewar. This program was written for the PDP-1 and was later used by DEC salesmen to attract customers for that minicomputer.
In 1963, the first computer-generated film, titled Simulation of a two-giro gravity attitude control system, was created by E. E. Zajac at Bell laboratories. Other researchers at Bell, Boeing, and Lawrence Radiation Laboratory followed soon with more films.
The first digitizer, the RAND tablet, appeared in 1964. In the mid-1960s, interest in computer graphics was picking up. More and
more companies started projects involving graphics, which gave IBM the idea of developing the first graphics terminal, the IBM 2250. At about the same time, David Evans and Ivan Sutherland cofounded their company which made, among
x Preface
other things, vector scan displays. Those displays are historically important since they gave a tremendous boost to computer graphics throughout the sixties.
In 1966, Sutherland developed the first three-dimensional head-mounted display (HMD). It displayed a stereoscopic pair of wire-frame images. This device was rediscovered in the 1980s and is commonly used today in virtual-reality applications.
In the late 1960s, both Sutherland and Evans were invited to develop a program in computer science at the University of Utah in Salt Lake City. Computer graphics quickly became the specialty of their department, and for years maintained its position as the primary world center for this field. Many important methods and techniques were developed at the UU computer graphics lab, among them illumination models, hidden-surface algorithms, and basic rendering techniques for polygonal surfaces. Names of UU students such as Phong Bui-Tuong, Henri Gouraud, James Blinn, and Ed Catmull are associated with many basic algorithms still in use today. A short history of computer graphics at UU can be found at URL
http://www.cs.utah.edu/-riloff/cs-history.html. Computer graphics in the 1960s was expensive since hardware was expensive.
There were no personal computers or workstations. Users had to pay for mainframe time by the second or buy expensive minicomputers. Display monitors used vector scan and were black and white. The result was that only computer professionals could do computer graphics and the software was noninteractive and nonportable.
The advent of the microprocessor, in the mid-1970s, was another factor in the rapid advance of computer graphics. Personal computers appeared on the market and suddenly anyone could afford to own a computer. This encouraged the formation of small companies that developed computer animation, mostly to be used in TV commercials. Names such as Abel and Associates, Information International Inc., Digital Effects, and Systems Simulation Ltd. became well known and produced short pieces that demonstrated dazzling effects.
SIGGRAPH, the Special Interest Group on Computer Graphics (part of the ACM) , held its first conference in 1973. It attracted 1200 attendees and later conferences boasted as many as 30,000 participants and hundreds of exhibitors.
The famous Utah teapot (see page 479) was developed in 1975. This is perhaps the best known three-dimensional model in computer graphics. The original teapot this model is based on can be seen at the Computer Museum in Boston.
It was during the 1970s that activity in basic computer graphics research started moving from UU first to NYIT, the New York Institute of Technology, then to Lucasfilm. Computer animation and computer painting were two topics seriously developed at those places.
The technique of (and hardware for) raster scan was developed in the 1970s by Richard Shoupe at Xerox Palo Alto Research Center (PARC). Workers in the field soon realized the advantages of raster scan and the word "pixel" entered the field of computer graphics.
Like any other mature discipline, computer graphics eventually got its first periodic publication. Computer Graphics World started carrying news and reviews in late 1977.
Fractals, developed by Benoit Mandelbrot in the 1960s and 1970s, were applied to computer graphics in the late 1970s by Loren Carpenter and others.
Preface xi
Ray tracing, a sophisticated rendering method, was developed by Turner Whitted of Bell labs and published in 1980.
Silicon Graphics Inc. (SGI) was founded in 1982 and has been building highperformance graphics computers since.
The technique of particle systems was developed in the early eighties at Lucasfilm. Morphing was developed at the same time at NYIT.
The data glove, very popular today for virtual-reality applications, was developed at Atari in 1983.
Radiosity came out of Cornell University in 1984. This is a sophisticated rendering method that simulates light reflection between surfaces by determining the exchange of energy between them.
GUI, graphical user interfaces, appeared in 1984 with the release of the first Macintosh computer.
In 1985 came the first ISO standard, the High Sierra, for CD-ROMs. The Commodore Amiga personal computer was also introduced the same year. It immediately became popular for what today are called multimedia applications.
The 1980s saw the emergence of raster-scan display monitors as the main graphics output device. This technology has benefited from experience gained with television and has resulted in the cheap, reliable color monitors of today.
The late 1980s and early 1990s also saw the developments of graphics standards such as GKS and PRIGS.
MS Windows 3.0 was first shipped in 1990 and, of course, gave a tremendous boost to the concept of GUI. More and more applications were developed to run under MS Windows.
Released in 1997, Toy Story is the first full-length (79 minutes, which translates to more than 114,000 animation frames at 24 frames per second) feature film that's completely computer-animated. It represents a milestone in computer graphics and marks the beginning of an era when computer graphics rendering techniques have become so sophisticated that viewers may find it impossible to tell if an image is real or if it is a mathematical model being rendered.
~ Shaw's plays are the price we pay for Shaw's prefaces. - James Agate
Resources for Computer Graphics
As is natural to expect, the World Wide Web has many resources for computer graphics. There are also many periodicals on various aspects of graphics. Here is a list of some of the most important resources, current as of 1998 .
• http://www.siggraph.org/ is the official home page of SIGGRAPH, the special interest group for graphics, one of many SIGs that are part of the ACM .
• http://www.siggraph.org/conferences/fundamentals has course notes from SIGGRAPH conferences.
xii Preface
• http://www.primenet.comrgrieggs/cg_faq.htmlby John Grieggs contains answers to frequently asked questions on graphics, as well as pointers to other resources.
• The most recent version of Richard Parent's book on computer animation is at http://www . cis. ohio-state. edurparent/bookl outline. html.
• http://mambo.ucsc.edu/psl/ cg. html is a jumping point to many sites that deal with computer graphics.
• A similar site is http://www.cs.rit.edurncs/graphics.htmlthat also has many links to CG sites.
• A very extensive site of computer-graphics-related pointers is http://ls7 -www.informatik.uni-dortmund.de/html/englisch/servers.html.
• Search the Internet under "history of computer graphics" for many sites.
• It is also a good idea to search the Internet for subjects such as computer graphics, computer animation, image processing, computer vision, and computerassisted design (CAD).
• IEEE Computer Graphics and Applications is a technical journal carrying research papers and news. See http: I I computer. orgl cga.
• Animation Magazine is a monthly publication covering the entire animation field, computer and otherwise. Check either at http: I I animag . coml or URL http://www.bcdonline.com/animag/.
• Computer Graphics World is a monthly publication concentrating on news (http://www.cgw.com/).
• Digital Imaging is a bimonthly reporting on the digital imaging industry.
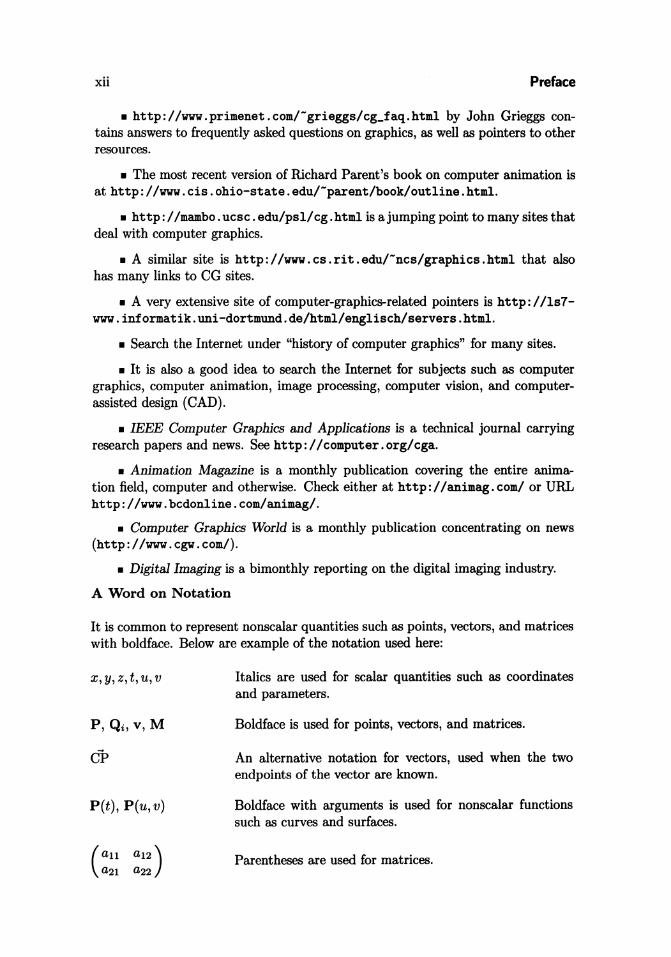
A Word on Notation
It is common to represent nonscalar quantities such as points, vectors, and matrices with boldface. Below are example of the notation used here:
x, y,z, t, U,V
CP
P(t), P(u,v)
Italics are used for scalar quantities such as coordinates and parameters.
Boldface is used for points, vectors, and matrices.
An alternative notation for vectors, used when the two endpoints of the vector are known.
Boldface with arguments is used for nonscalar functions such as curves and surfaces.
Parentheses are used for matrices.
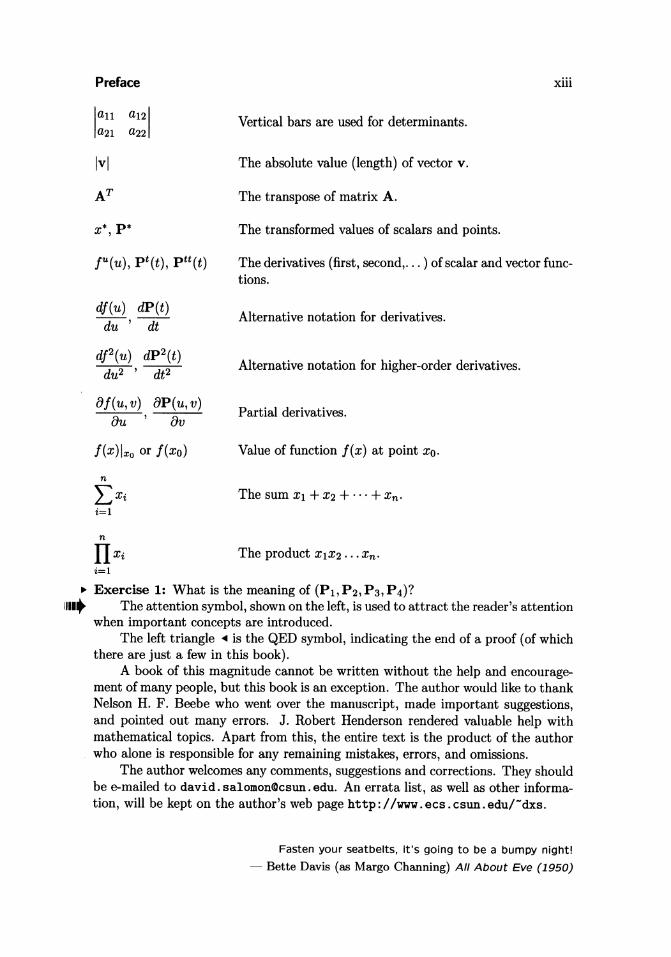
Preface
Ivl
x*, P*
df(u) dP(t) --;t;;:' dt
af(u, v) ap(u, v) au av
f(x)lxo or f(xo)
i=l
xiii
Vertical bars are used for determinants.
The absolute value (length) of vector v.
The transpose of matrix A.
The transformed values of scalars and points.
The derivatives (first, second, ... ) of scalar and vector functions.
Alternative notation for derivatives.
Alternative notation for higher-order derivatives.
Partial derivatives.
Value of function f(x) at point Xo.
The sum Xl + X2 + ... + xn .
The product XlX2 ••• xn .
~ Exercise 1: What is the meaning of (Pb P2, P3, P 4)? 1IIIt The attention symbol, shown on the left, is used to attract the reader's attention
when important concepts are introduced. The left triangle ... is the QED symbol, indicating the end of a proof (of which
there are just a few in this book). A book of this magnitude cannot be written without the help and encourage
ment of many people, but this book is an exception. The author would like to thank Nelson H. F. Beebe who went over the manuscript, made important suggestions, and pointed out many errors. J. Robert Henderson rendered valuable help with mathematical topics. Apart from this, the entire text is the product of the author who alone is responsible for any remaining mistakes, errors, and omissions.
The author welcomes any comments, suggestions and corrections. They should be e-mailed to david.salomon<ocsun.edu. An errata list, as well as other information, will be kept on the author's web page http://www .ecs. csun.edurdxs.
Fasten your seatbelts, it's going to be a bumpy night!
- Bette Davis (as Margo Channing) All About Eve (1950)
Contents
Preface vii
1. First Principles 1
1 Graphics Output 2 2 Bitmap Scaling 16 3 Bitmap Rotation 20 4 A Practical Drawing Program 23
2. Scan-Converting Methods 27
1 Scan-Converting Lines 27 2 Midpoint Subdivision 28 3 DDA Methods 28 4 Double-Step DDA 34 5 Best-Fit DDA 38 6 Scan-Converting in Parallel 39 7 Scan-Converting Circles 42 8 Thick Curves 49 9 Antialiasing 50
3. Transformations and Projections 59 1 Introduction 59 2 Two-Dimensional Transformations 61 3 Windowing 88 4 Clipping 90 5 Three-Dimensional Transformations 91 6 Transforming the Coordinate System 102 7 Projections 103 8 Parallel Projections 103 9 Perspective Projections 112
10 Application: Stereo Image 137 11 The Viewing Volume 141 12 Going Beyond the Third Dimension 144 13 Nonlinear Projections 153
xvi Contents
4. Curves 113 1 Points and Vectors 174 2 Parametric Blending 180 3 Curve Representations 181 4 The Lagrange Polynomial 198 5 The Newton Polynomial 205 6 Spline Methods for Curves 206 7 Hermite Interpolation 207 8 The Cubic Spline Curve 225 9 The Quadratic Spline 247
10 Cardinal Splines 248 11 Parabolic Blending: Catmull-Rom Curves 251 12 Kochanek-Bartels Splines 258 13 Fitting a PC to Experimental Points 262 14 The Bezier Curve 266 15 Subdivision Curves 321 16 The B-Spline 328 17 The Beta Spline 389 18 Barycentric Sums Revisited 393 19 Symmetry in Curves 394 20 Conic Sections 397 21 Parametric Space of a Curve 401 22 Curvature and Torsion 402 23 The Hough Transform 410
5. Surfaces 415
1 Input Three-Dimensional Points 416 2 Basic Concepts 417 3 Polygonal Surfaces 419 4 Delaunay Triangulation 427 5 Bilinear Surfaces 434 6 Lofted Surfaces 439 7 Coons Surfaces 443 8 The Cartesian Product 456 9 The Biquadratic Surface Patch 457
10 The Bicubic Surface Patch 459 11 Catmull-Rom Surfaces 468 12 Rectangular Bezier Surfaces 471 13 Triangular Bezier Surfaces 483 14 Converting Bezier Patches 488 15 The Gregory Patch 495 16 Gordon Surfaces 498 17 Uniform B-Spline Surfaces 499 18 Surfaces of Revolution 516 19 Sweep Surfaces 526 20 Polygonal Surfaces by Subdivision 530 21 Curves on Surfaces 533 22 Surface Normals 535
Contents xvii
6. Rendering 537
1 Introduction 537 2 A Simple Shading Model 538 3 Gouraud and Phong Shading 548 4 Palette Optimization 549 5 Ray Tracing 551 6 Texturing 552 7 Bump Mapping 554
7. Color 557
1 Color and the Eye 557 2 The HLS Color Model 559 3 The HSV Color Model 559 4 The RGB Color Model 561 5 Additive and Subtractive Colors 563 6 Complementary Colors 567 7 Spectral Density 567 8 The CIE Standard 571
8. Computer Animation 575
1 Background 575 2 Interpolating Positions 578 3 Interpolating Orientations: I 583 4 Interpolating Orientations: II 593 5 Nonuniform Interpolation 600 6 Morphing 606 7 Free-Form Deformations 607
9. Image Compression 609
1 Introduction 610 2 Variable-Size Codes 611 3 Run-Length Encoding 612 4 Fax Compression 615 5 Cell Encoding 622 6 Quadtrees 624 7 Progressive Image Compression 630 8 FELICS 634 9 The Golomb Code 642
10 Progressive FELICS 643 11 MLP 646 12 Differential Lossless Image Compression 654 13 Wavelets 656
xviii Contents
10.
A.
Short Topics 661
1 Graphics Standards 661 2 Boundary Fill 668 3 Half toning 669 4 Dithering 671 5 Fractals 680 6 A Fractal Line 681 7 Branching Rules 684 8 Iterated Function Systems (IFS) 685 9 Image Processing 688 Mathematical Topics 693
1 Fourier Transforms 693 2 Forward Differences 698 3 Coordinate Systems 700 4 Vector Algebra 702 5 Matrices 709 6 Trigonometric Identities 711 7 The Greek Alphabet 715 8 Complex Numbers 716 9 Quaternions 717
10 Groups 719 11 Fields 720
References 723
Answers to Exercises 733
Index 833
To me style is just the outside of content, and content the inside of style, like the outside and the inside of the human body both go together, they can't be separated.
- Jean-Luc Godard
Computer Graphics and
Geometric Modeling