Embed Size (px)
Citation preview
DOCUMENT RESUME
ED 433 663 EC 307 408
AUTHOR Brown-Chidsey, Rachel; Boscardin, Mary Lynn; Sireci, StephenG.
TITLE Computer Attitudes and Opinions of Students with and withoutLearning Disabilities.
PUB DATE 1999-03-00NOTE 39p.
PUB TYPE Reports Research (143)EDRS PRICE MF01/PCO2 Plus Postage.DESCRIPTORS *Accessibility (for Disabled); *Computer Attitudes;
*Computer Uses in Education; Computers; EducationalEnvironment; Elementary Secondary Education; *LearningDisabilities; *Predictor Variables; Pretests Posttests;Research Design; *Student Attitudes; Student Surveys
ABSTRACTThis study investigated the attitudes and opinions of 970
students with and without learning disabilities regarding the use ofcomputers for school-related work. Using a quasi-experimental design withthree non-equivalent groups, within and between subjects effects were studiedusing a survey instrument. The students in grades 5 through 12 at threeschool sites completed pre- and post-test surveys at the beginning and end ofthe school year. One site served as the experimental group, while the othertwo were control groups. The experimental condition consisted of theinstallation of a campus-wide computer network for use by all students at theexperimental site. A 24-item scale measured participants' attitudes about thegeneral use of computers in schools and the use of computers by students withspecial needs. The most significant variables related to students' attitudesand opinions were their past experiences using computers and their schoolaffiliation. These data also showed there was no relationship between theinstallation of a campus-wide computer network and changes in students'attitudes and opinions about computer use in special education. There were nosignificant differences in attitudes toward computers between students withand without learning disabilities. (Contains 25 references.) (Author/CR)
********************************************************************************* Reproductions supplied by EDRS are the best that can be made *
* from the original document. *
********************************************************************************
Running Head: COMPUTERS
Computer Attitudes and Opinions
Of Students With and Without Learning Disabilities
Rachel Brown-Chidsey, Mary Lynn Boscardin, and Stephen G. Sireci
University of Massachusetts, Amherst
U.S. DEPARTMENT OF EDUCATIONOff ic of Educational Research and Improvement
ED ATIONAL RESOURCES INFORMATIONCENTER (ERIC)
This document has been reproduced asreceived from the person or organization
originating it.Minor changes have been made to
improve reproduction quality.
Points of view or opinions stated in thisdocument do not necessarily representofficial OERI position or policy.
March 1999
2
PERMISSION TO REPRODUCE AND
DISSEMINATE THIS MATERIAL HAS
BEEN GRANTED BY
(own - ck;_ctley_
TO THE EDUCATIONAL RESOURCESINFORMATION CENTER (ERIC)
BESTCOPYAVA1LABLE
Computers 1
Computers 2Abstract
There is little research regarding the use of computers among students with learning difficulties.
This study investigated the attitudes and opinions of students with and without learning disabilities
regarding the use of computers for school-related work. Using a quasi-experimental design with three
non-equivalent groups, within and between subjects effects were studied using a survey instrument. The
students, in grades 5 through 12, at three school sites, completed in pre and post-test surveys at the
beginning and end of the school year. One site served as the "experimental" group, while the other two
were control groups. The experimental condition consisted of the installation of a campus-wide
computer network for use by all students at the experimental site. A 24-item scale measured
participants' attitudes about the general use of computers in schools and the use of computers by
students with special needs. The most significant variables related to students' attitudes and opinions
were their past experience using computers and their school affiliation. These data also showed there
was no relationship between the installation of a campus-wide computer network and changes in
students' attitudes and opinions about computer use in special education. There were no significant
differences in attitudes towards computers between students with and without learning disabilities.
Computers 3
Computer Attitudes and Opinions
Of Students With and Without Learning Disabilities
Computers have had a major impact on modern society. In the last two decades they have
changed the conduct of business and industry around the world. Computers have also influenced
education, but not as dramatically as the changes in the workplace. Many educators and lay persons see
computers as a positive addition to classrooms while others view them as unwelcome foreign invaders.
The use of computers for instructional purposes grew considerably in the last decade and it appears that
their use will continue to expand (Blackhurst, 1997; Bork, 1997; Molnar, 1997).
From the first days of instructional technology, educators who work with students with special
needs have recognized the opportunities that computers can offer such students. Early services included
adaptive and assistive devices for students with communication disorders and mobility impairments.
More recently, instructional technology has been used with students with so-called mild disabilities,
(e.g. learning disabilities), as a tool for practicing skills, remedial work, and strategy instruction. Given
the increasing costs of special education services, it is important to determine whether such technologies
offer supports and services for students with special needs that are not otherwise available. An
increasing body of research indicates that computers and other forms of instructional technology are
positively related to student achievement, as measured by both curriculum-based and standardized
outcome variables (Fletcher-Flinn & Gravatt, 1995; Khalili & Shashaani, 1994; Kulik, 1994). Other
studies have shown that instructional technology can be especially effective for students with special
needs (Fitzgerald & Koury, 1996; Goldenberg, 1984; Male, 1994).
One important variable that has not been extensively studied is the attitudes and opinions of
students about the use of technology in schools, both in general and as this technology relates to students
with special needs. The lack of data about student attitudes is significant because the attitudes students
4
Computers 4hold are likely to influence their actual use of computers. Students' beliefs about computers are likely to
shape the extent to which instructional technology enhances their achievement -- academically, socially,
or personally. This study investigated students' attitudes and opinions concerning the use of computers
in schools with a special focus on the use of instructional technology by students who perhaps stand to
benefit the most from it: students with special learning needs. The purpose of this research was to learn
whether students with and without learning disabilities believe that instructional technology makes a
difference in students' learning, whether these students believe that instructional technology can benefit
students with special needs more than others, whether their own computer skills are related to these
beliefs, and whether there are differences in the computer attitudes and beliefs of students with and
without learning disabilities. These data provided indicators of the relationships between students'
computer skills and experiences and their attitudes about the role of computers in school-based
instruction.
Previous investigations of both teachers' and students' computer-related beliefs were considered
in designing this study. A few studies looked at both students' (King, 1995; Kinnear, 1995; Proctor &
Burnett, 1996; Riggs & Enochs, 1993) and teachers' (Delcourt & Kinzie, 1993; Marsh, 1995; Moore,
Rieth & Ebeling, 1994; Murphy, Coover & Owen, 1989; Olivier & Shapiro, 1993; Siegel, Good &
Moore 1996; Yaghi, 1996) beliefs about computer use in schools and offered preliminary findings about
attitudes, opinions and overall use. The Riggs and Enochs (1993) as well as the Murphy et al. (1989)
studies suggested methods for how to construct a computer beliefs instruments. King's (1995) study
showed that students do not always perceive computers as generally helpful, and that other variables
influence their usefulness. Proctor and Burnett (1996) found that frequency of access and use of
computers is related to student attitudes. Kinnear's (1995) work suggested that more study of how
students perceive computer use is needed.
5

Computers 5
Delcourt and Kinzie (1993), Moore, et al. (1994) and Siegel, et al. (1996) pointed to the need
for far greater teacher training in the use of computers. Yaghi (1996) found that there is a need for
greater integration of computers in the overall curriculum. Marsh identified the importance of "making
special education portable" by using computers as part of inclusive practices in special education
(Reynolds & Birch, 1988, cited in Marsh, 1995). Olivier and Shapiro (1993) showed that there is a very
high correlation between use and computer efficacy among students. This finding, more than the others,
points to the importance of understanding more about students' computer skills, beliefs and attitudes.
While the prior research has shown that computers are related to positive outcomes in student
achievement, little research has been done to learn about the relationships between computer use and
students' attitudes and opinions about their use. Some researchers have found that computers can be
especially useful for students with special needs (Church & Bender, 1989; Fitzgerald & Koury, 1996;
Goldenberg, 1989; Goldenberg & Russell et al., 1984; Kearsley, Hunter & Furlong, 1992; Male, 1993,
1994) but little research has investigated whether students are aware of these findings or even hold such
beliefs.
Research Questions
The specific research questions addressed in this study are:
1. Do attitudes and opinions about student computer use in schools differ among students from
different schools and between students with and without learning disabilities?
2. What factors are related to the attitudes and opinions of students with and without learning
disabilities regarding student computer use in schools?
3. Do perceptions about the use of computers in schools and the quality of student performance differ
between students with and without learning disabilities both before and after installation of
computers throughout the school?
6

Computers 6
These questions were designed to help reveal what students believe about the use of computers in
schools and how they perceive computers to influence instruction and student performance. This
information should provide a better understanding of the role computers play in schools, and whether
computers are especially helpful for students with special needs. The unique opportunity to survey
students and teachers at the inception of a new computer network provided a chance to investigate how
such expanded computer services are related to students' attitudes about computers. The research
literature suggests that installation of expanded computer resources would be beneficial to students and
may be related to certain student outcome measures such as grades, standardized test scores, and overall
attitudes about computers (Delcourt & Kinzie, 1994; Murphy, et al., 1989).
Method
A survey questionnaire was administered twice. First in October, just at the start of the
implementation of the treatment school's new computer network, and again in May, after the new
computers had been used by students for school work. The data were analyzed by comparing the survey
scores from the beginning and the end of the year across the experimental and control schools.
Relationships among demographic and survey variables were also investigated. Although the non-
equivalency of the groups diminished the overall degree to which group differences can be attributed to
the installation of instructional technology, they do reflect real-world differences present among these
schools and allow for a comparison of pre and post-test results as well as treatment effects.
Interpretation of the results included consideration of pre-existing differences among the non-equivalent
groups.
Participants
The data were collected at three different schools: Riverview, a public elementary school with
grades pre-k through 6, Fairmont, a private boys' boarding school for grades 6-9, and Wesley Academy,
Computers 7
a private co-educational boarding school for grades 7-12.1 All three schools are located in non-urban
communities in the Northeast United States. For the purposes of this study, students in grades 5 through
12 participated. The sites were chosen because they are located in communities near the university
where the researchers are affiliated. Initially, Riverview and Fairmont were both selected for this study
because they planned to implement new computer networks. Due to scheduling and funding problems,
the computers for Riverview were not installed at all during the school year when the study was
conducted. Given that some data were already collected, it was decided that the students at this site
would still participate and serve as additional controls. Thus, the new computer network at Fairmont
became the "experimental" condition and Riverview and Fairmont were "control" conditions at which
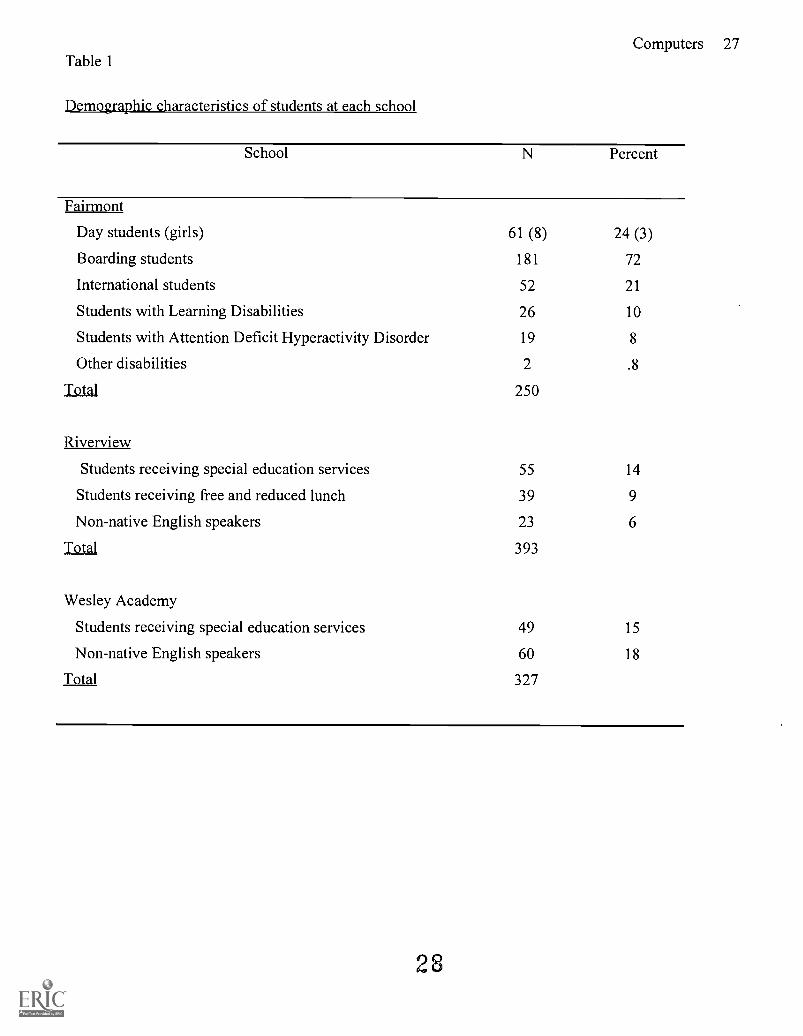
no new computer equipment was installed. Demographic information for the students at all three
schools is given in Table 1.
<Insert Table 1 about here>
Installation of New Computers
The computer (experimental) school, Fairmont, is a middle grades boarding school. The school
admits boys, and a few girls, in grades 6 through 9. Demographic data about the school's students at the
time of the study are found in Table 1. Approximately 25 percent of the students were day students
from surrounding towns and the rest were boarding students. Of the day students, a small number
(around 8%) were girls because the daughters of faculty and staff are permitted to attend the school. On
average, the school has a very diverse population with students from up to 30 states and 11 foreign
countries. Of the 250 students who participated in the study, approximately 21 percent were
international and not native English speakers (n = 52). The school's students represent a very diverse
range of academic abilities. Ten percent (n = 26) of study year students had diagnosed learning
disabilities (LD), 8% had Attention Deficit Hyperactivity Disorder (ADHD; n = 19); four students had
School names are pseudonyms
8
Computers 8
both a learning disability and ADHD. In addition, one student with a hearing impairment and one
student with physical disabilities attended the school. Overall, the school's population of students with
special learning needs was 16 percent, slightly above the national average of about 12 percent. Students
with special learning needs are fully included in all regular classes, with the occasional exception of a
foreign language waiver being granted to students with language learning disabilities. Most of the
students with learning disabilities or ADHD attend the school's resource room program one period a
day. Additional academic support is provided when needed by privately hired tutors. The school also
has a number of students with very strong academic skills, including students who have participated in
nationally screened programs for students identified as talented and gifted.
Instructional Technology Program
The "treatment" condition evaluated in this study was the implementation of a school-wide
technology plan (Solberg, 1996). At the center of this plan was the installation of a school-wide wide
area network (WAN). This WAN connected the classrooms, library, faculty work areas, administrative
offices, and dormitories on one network. The backbone of the WAN is fiber optic cable that connects
each building to the main servers. Category five (UTP) data cabling was used within buildings for
individual workstation connections. The existing computer lab was completely re-done and 14 new,
network capable, Power Macintosh computers for student and faculty use were installed. During the
study year the computer room was available for individual and class use throughout the class day and for
individual student and faculty use during the afternoon study hall hour. It was also made available to
boarding students during free times on weekends for academic projects. These computers provided a
range of software, including Microsoft Word, Claris Works, Hyper Studio, and several typing tutorials.
Seven of the computer room computers were linked to the network, allowing Internet access for
supervised use exclusively during elective periods
Computers 9The existing search station computers in the library, five Hewlett-Packard Vectra 4/66 series,
were updated with new software for electronic database searches. An additional IBM Pentium series
Internet station was added for student and faculty use. Four of the old computer room Macintosh LC II
computers were placed in the library equipped with Microsoft Word and Internet software for student
use. All of the classrooms in the main classroom building were wired with category five data
transmission cable for teachers to use to connect computers for classroom use. Two of the old computer
room Macintosh LC II's were placed in the special education resource room; both included Microsoft
Word and a typing program; one had Internet and e-mail access. The remaining Macintosh computers
were equipped with network cards as well as Microsoft Word and e-mail software and placed in the
commons rooms of each dormitory. These computers were made available for student e-mail and word
processing use during the students' free time and study halls.
No school-wide training for students was provided because individual faculty incorporated
computer use and instruction in some of their classes. The English department established a computer
literacy program for all students in the ninth grade. This program consisted of direct instruction in basic
word processing skills by the computer teacher and the requirement that certain English assignments be
completed using a word processor. In addition, computer-related elective courses, ranging from typing,
Hyper Studio, Internet use, and computer rendering were offered throughout the school year. These
programs were supported by one full time computer teacher and a full time computer coordinator. In
addition, several students organized and taught two computer related classes with the support and
supervision of faculty members.
Comparison Schools
Both Riverview and Wesley Academy served as control sites for this research. Both these
schools had some computer facilities on campus but no new academically-related equipmentwas
installed during the school year when the study was conducted.
Computers 10
Riverview
A public elementary school serving students in grades pre-kindergarten through 6 served as one
of the control sites. As stated, this school was to have served as a second experimental site, however,
the planned computer network was delayed by one year. Opened the year the study was conducted, this
school was designed with the use of technology in mind. The necessary wiring to support academic and
administrative computing was installed at the time of construction. The funding to purchase the
necessary computer hardware and software was provided by a supplementary budget. As a result these
items were not in place when the school opened. The school provides a range of special education
services on site, ranging from mild to severe special needs. Where possible, inclusive educational
practices are used to provide students with special needs an education in the least restrictive
environment (LRE). Fifteen percent (n = 55) of the school's students received special education
services, 10% (n = 39) were eligible for free and reduced lunches, and 6% (n = 23) were non-native
English speakers. Among the students who participated in the study (n = 108), 14 (13%) were identified
as having special needs and were receiving special education services via an individualized education
plan (IEP).
Existing computer resources from the two former elementary schools were brought over to the
new school when it opened. These resources included several administrative computers and 14 stand-
alone Commodore 64 computers which were placed in the fifth grade math teacher's classroom. In
addition, all the other fifth and sixth grade teachers had one Apple Ile computer in their classrooms for
student and teacher use. There was no appointed technology teacher, but one of the fifth grade teachers
served as the unofficial coordinator for the building during the study year.
Wesley Academy
The secondary school site was chosen for two reasons. First, this school has a well-established
program for students with special needs and such students represent about 15% of the student body (n =
11
Computers 11
49 students). Second, no additional computer resources were planned for the year the study was
conducted. Wesley is a co-educational private boarding school with traditions dating from before the
U.S. Civil War. The school enrolls students in grades 7 through post-graduate year. Students in the
middle school, grades 7 and 8, have their own program and separate classes and most middle school
students are day students. The school attracts a diverse student body with an international student
population of approximately 18 % (n = approximately 60). Specific information about subtypes of
special needs was unavailable, however, the support program is designed for students with specific
learning disabilities. Students with disabilities are fully included in all regular classes, with the
exception of some language waivers. Specific learning needs are addressed during daily one-on-one
sessions with the special education faculty members.
Existing technology resources included a computer lab with 12 Macintosh and 4 Power
Macintosh computers. This lab was available for individual and class use throughout the class day and
during study hall times during the study year. In addition, each department chair had a Power
Macintosh or Macintosh computer in the departmental office. All the middle school classrooms had one
Macintosh Classic or SE computer for student use. Most administrative offices had stand-alone
computers. The library had two single-user CD-ROM search stations and software for student and
faculty use. The card catalog was not computerized. There was no central computer network or server.
Modems were available for use by students with their own computers in the dorm and for department
chairs to use for Internet connections. There was one part- time technology coordinator.
Selection of Students and Participant Consent
Subject selection was not random, but involved all the students and teachers at the three sites
who were willing to participate, with the exception of an age-selected group at the elementary school.
While enrollment at the two private schools is by admission only, these schools have traditionally
admitted students with varying ranges of ability, including students with special needs. Thus, the
12
Computers 12population of students with special needs at these schools (15-16%) is near enough to the national
average of 12% to make the results potentially generalizable to the overall population of students with
special needs. The parents of the students were contacted by mail to inform them of the survey at least
two weeks before any data were collected. Passive consent for the survey was assumed unless the
parent(s) contacted the researchers. The students were informed of their right not to participate in the
survey in the cover letter accompanying the survey.
Survey Instrument
The attitude data were collected using the Computer Opinion Survey (COS). This questionnaire
consisted of 24 Likert-type questions from which two subscores were derived. Questions for the survey
were written by the first author based on other similar instruments found in the literature (Delcourt &
Kinzie, 1993; Kinnear, 1995; Murphy, et al., 1989; Olivier & Shapiro, 1993; Riggs & Enochs, 1993).
Items and item descriptions from the above studies were used in the creation of the items for this survey.
The items created for the instrument used in this study concentrated on two categories not covered by
previous research: 1) general attitudes and opinions held about the use of computers by students in
schools, and 2) the use of computers by students with special learning needs. A separate subscore was
computed for each category. The survey questions were initially reviewed by a panel of four experts
familiar with survey development. Several questions were amended or omitted as a result of
consultation with these colleagues. The survey was then pilot-tested and further revisions were made.
After the survey was administered, an item analysis was conducted. The internal consistency reliability
(coefficient alpha) of the survey scores for the 19 item general attitudes scale was .84. The four item set
about the use of computers by students with special needs scale had an internal consistency reliability of
.66. The survey items are presented in Table 2.
<Insert Table 2 about here>
13
Computers 13
In addition to the general and special needs attitudes items, an item related to whether new
computers installed during the study year influenced student work was asked on the post-test version of
the survey. All items allowed for one of five Likert-type responses, ranging from 1, strongly disagree,
to 5, strongly agree. The survey was organized into three sections and all responses were written on a
separate machine readable answer sheet. Section I included instructions for completing the survey and
basic demographic information about respondents, including name, sex, race, grade, age, school, native
language, citizenship, computer ownership/access, computer skills (self-reported), frequency of
computer use, years of computer experience, types of computer use, grade/education, and special
need/disability. Section II included additional demographic questions and questions related to subjects'
access to and experience with computers. Section III comprised the survey items. The additional
question relating to whether the new computers enhanced student work was asked on the post-test
survey at all three sites.
For students at the computer school, Fairmont, the students' socio-economic data based on
financial aid status were also collected. Such information was not available for students at the other
schools. Day-student/boarding status was collected for students at Fairmont and Wesley Academy. The
surveys were handed out and collected during the students' math and English classes. Students took
approximately twenty minutes to complete the survey. Incomplete cases and those which appeared to
reflect non-serious responses (e.g., all one Likert scale response) were deleted.
Data Analyses
The data were analyzed using SPSS, version 8.0. Statistical procedures were applied to answer
each of the three research questions. Two primary outcome measures were used: (a) the sum of the
items on the general attitudes scale (19 items), and (b) the sum of the items on the special learning needs
scale (4 items). The post-test item about the relationship of computers to quality of student work served
as an additional outcome measure. Except where indicated, all tests for significance were at the .05
14

Computers 14
level. Analysis of variance (ANOVA) and multiple comparison procedures were used to compare the
means by school and group (student with or without learning disability) on each outcome measure.
Multiple regression was also used to discern variables predictive of students' attitudes. For all subjects,
the predictor variables were: race, sex, age, native language, computer ownership/access, computer
skills (self-reported), frequency of computer use, years of computer experience, types of computer use,
grade, and special need/disability. Regression procedures were also used to determine if differences in
attitudes existed across the two student groups, after controlling for the other variables listed above.
Results
Data on both the pre-test and post-test surveys were not available for all students. Some students
had missing data on the pre-test, while others had missing data on the post-test. Therefore, two
strategies were used to analyze the data across groups. First, we analyzed the pre-test and post-test data
separately. These analyses compared the responses of the students with and without learning disabilities
from the different schools at the same point in time. Second, we analyzed the data for students who
participated in both the pre-test and post-test surveys. The first set of analyses utilized all of the data
available, while the second set of analyses allowed for investigation of change over time for the same
students. The results of these analyses are reported below, as are the results of the multiple regression
analyses.
Separate Pre-test and Posttest Analyses
Comparisons by School
The mean attitude scores for each school on the pre-test and post-test surveys are reported in
Table 3. The means for each school were similar for the pre-test and post-test groups; however, the
mean attitudes varied according to the school. A one-way ANOVA on the pre-test data revealed
statistically significant differences across schools on the general attitude (FEZ, 6,9) = 15.75, p = .0004) and
special needs (F(2649) = 3.70, p =.025) measures. On the post-test, only the differences across schools on
the general scale were statistically significant (F (2,5,5) = 14.62, p = .0001).
15

Computers 15
<Insert Table 3 about here>
To determine which schools were statistically significantly different from each other, post-hoc
multiple comparison procedures were used. Due to the unequal sample sizes coupled with the presence
of heterogeneity of variance, the Games-Howell test was used. These tests showed that Riverview, one
of the two control schools, had a mean general attitude score that was statistically higher than the other
schools at the pre-test. On the special needs scale, significant differences were found between Fairmont
(the "experimental" school) and Riverview only. As with the general attitudes scale, Riverview had a
statistically significant higher mean (13.5) than Fairmont (12.6). At post-test, again, the general
attitudes for Riverview students were significantly higher than the other two schools, but their mean
actually decreased (the decrease was not statistically significant, p = .524). These findings do not
support the hypothesis that putting computers in a school will improve students' attitudes toward them.
Comparisons between Students with and without Learning Disabilities
Similar comparisons were made between the groups of participants: students with learning
disabilities and students without learning disabilities. Means and standard deviations for these groups
for the pre and post-test are found in Table 4. Analysis of variance (ANOVA) results showed no
significant differences between these groups (F(2 619) = 2.75, p = .060) for either outcome measure.
<Insert Table 4 about here>
Combined Pre-test/Posttest Analyses
The data for students who took both the pre-test and post-test surveys were analyzed using
repeated measures analysis of variance (RMANOVA). There were 390 students who completed both
the pre and post-test surveys, which represented 58% of the total number of students who took at least
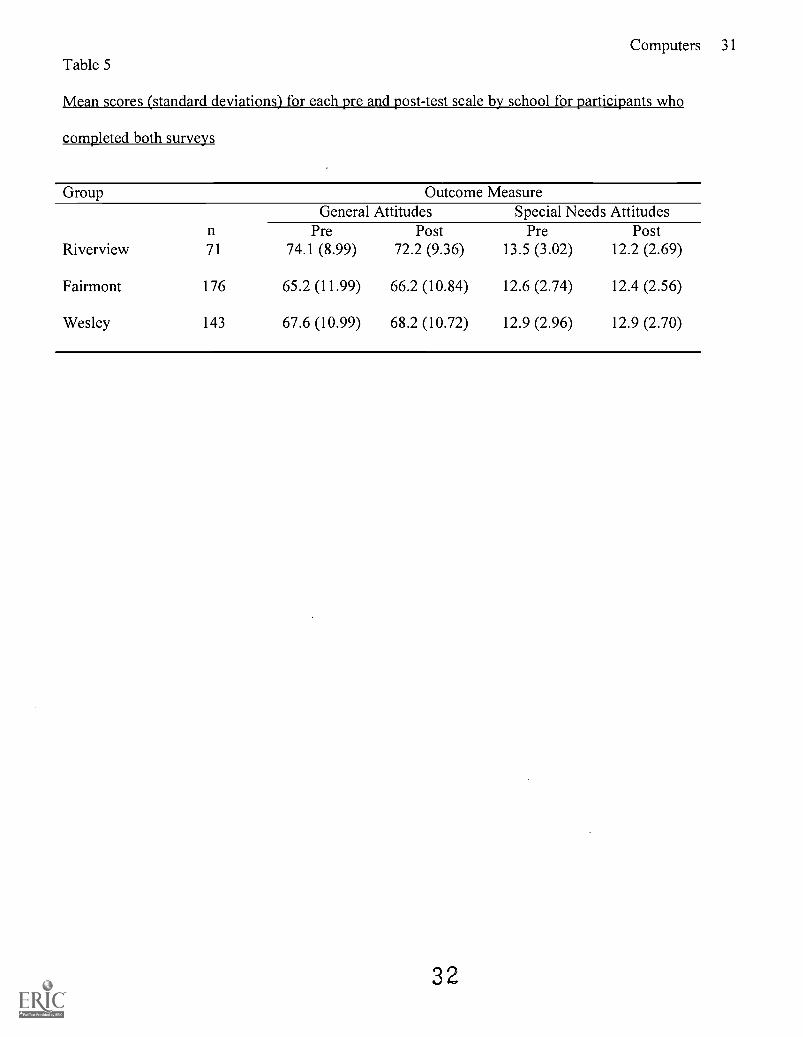
one survey. The means and standard deviations for these students are presented in Table 5. A three-way
repeated measures model (school-by-group-by-pre to post-test change) was applied to investigate
differences among school and student groups. Unfortunately, the homogeneity of variance test was not
satisfied for this analysis (F(15,8369) = .2.581, p = .001), and coupled with the unequal samples sizes across
16
Computers 16
schools, these results were not interpretable. Therefore, separate two-way RMANOVAs were
conducted: one, comparing the pre-test and post-test scores across schools (i.e., collapsing across
students with and without learning disabilities), and the other comparing students with and without
learning disabilities from pre-test to post-test (i.e., collapsing across schools).
<Insert Table 5 about here>
Comparisons Across Schools
Results of the RMANOVAs (collapsing across students with and without learning disabilities)
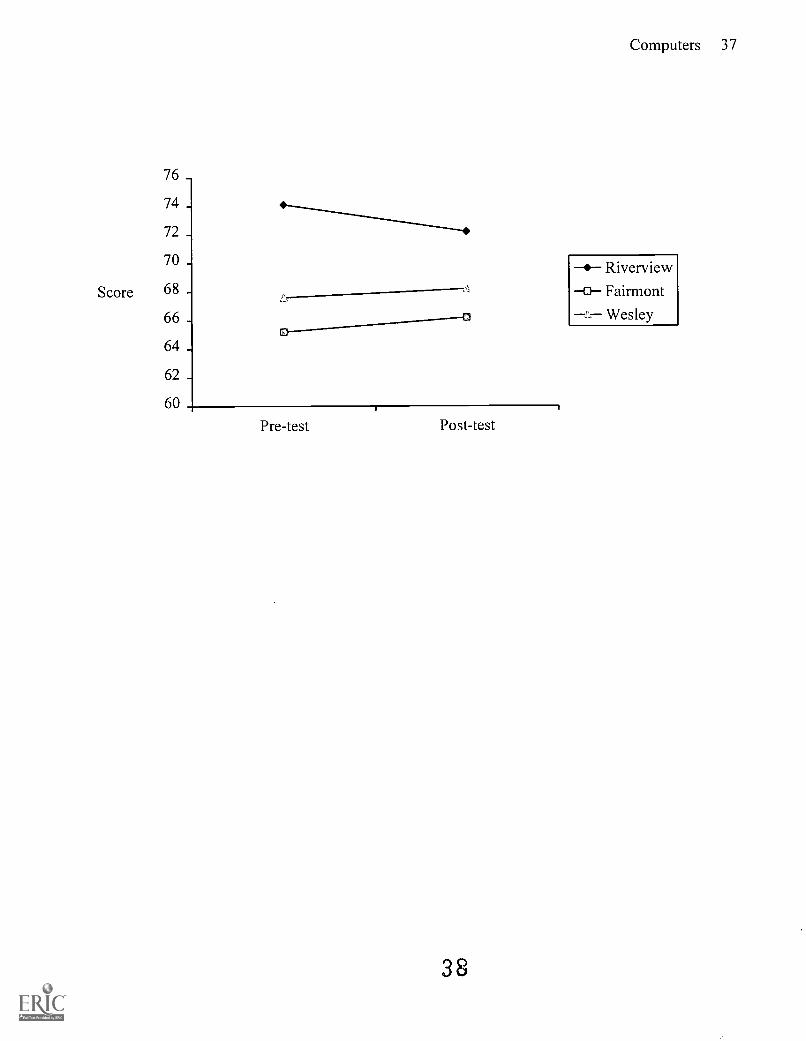
revealed significant between-school differences on the general attitudes scale (F(2,387) = 13.90, p = .0005),
but no significant changes in the students' attitudes over time. These data are summarized in Table 6 and
Figure 1. The interaction (school-by-time) was also statistically significant (F(2, 387) =4.22, p = .015). The
significant interaction and main effect for school is due to the decrease in general attitude from pre-test
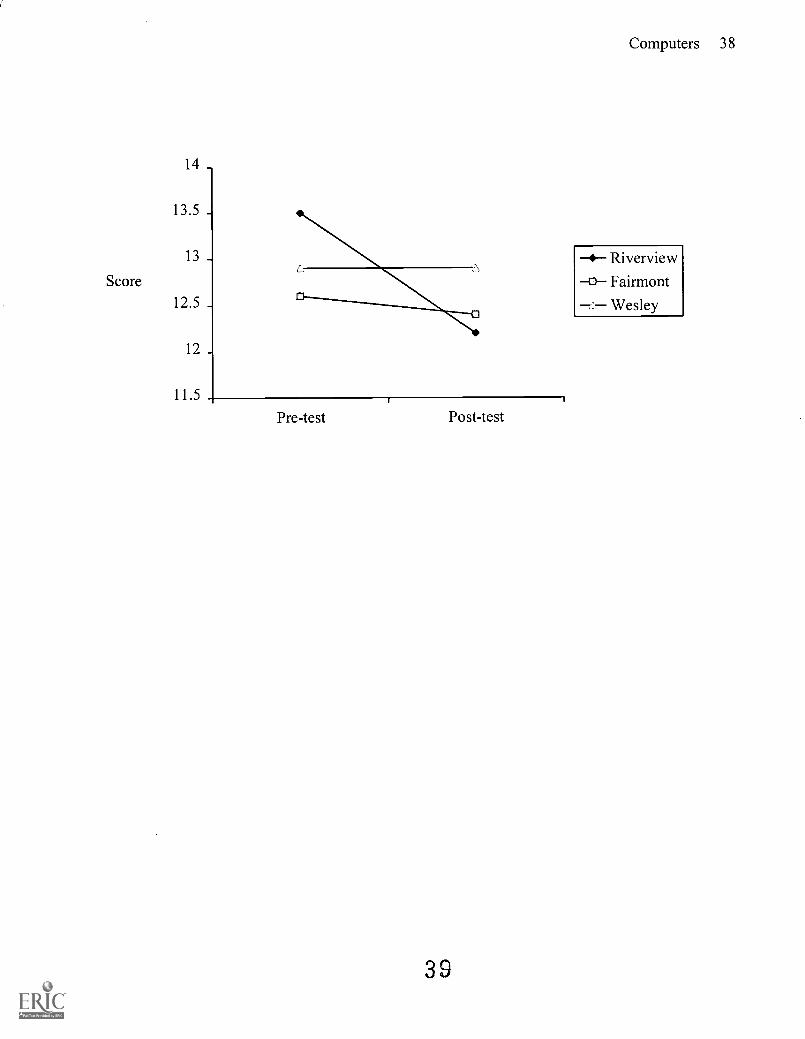
to posttest for the Riverview school only. For the special needs scale, the main effect for school was not
statistically significant, but statistically significant effects were observed for time (F(,, 395) = 11.24, p =
.001) and for the interaction (F(z 395) = 13.90, p = .007). Once again, the main effect and interaction were
due to Riverview, where there was a relatively large decrease (13.5 to 12.2) in the special needs attitude
scores of the students from pre-test to post-test (see Figure 2). Given that: (a) the only statistically
significant findings were related to the control school that exhibited the highest attitudes at pre-test, (b)
the pre-test/post-test differences were relatively small, and (c) the differences for the control school
reflected a decrease in attitude from pre-test to post-test, it is clear that changes in these attitudes over
time are not related to the experimental condition of the computer network.
<Insert Table 6 about here>
<Insert Figure 1 about here>
<Insert Figure 2 about here>
17
Computers 17Students with and without Learning Disabilities
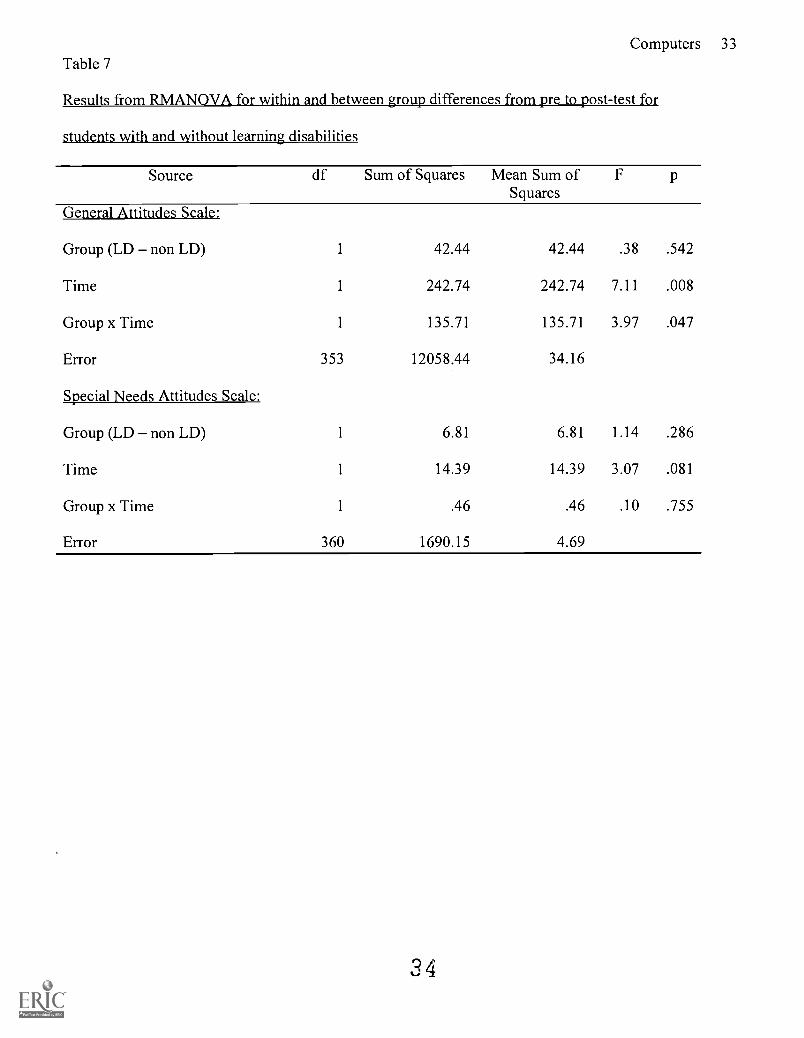
Results of the RMANOVAs collapsing across schools are presented in Table 7. There were no
statistically significant effects for the special needs scale. For the general attitudes scale, the main effect
for time, and the interaction (time-by-group) were statistically significant. For students with learning
disabilities, the score on the general attitudes scale increased almost three points from pre to post-test
(from 67.0 to 69.8). For the students without learning disabilities, the score increase was less than half a
point (67.3 67.7). Thus, the interaction is due to the relatively larger pre-test/post-test increase for the
students with learning disabilities. Although this finding is interesting, the effect size was small (.03).
Furthermore, the positive change in attitude from pretest to posttest was not associated with the
"experimental" school (Fairmont), where very little change in attitude was observed across pre-test and
post-test. Thus, the experimental condition of the new computer network did not appear to be related to
changes in these students' attitudes about computers.
<Insert Table 7 about here>
Overall Sense of Change
In addition to comparing students' pre- and post-test responses, an additional item was included
on the post-test to ascertain students' sense of how computers influenced school work during the school
year ("I believe that the new computers installed this year have helped students to improve the quality of
their work"). This item was targeted primarily at the experimental group, but was asked of all subjects,
to investigate differences among the groups. The mean responses to this item for each student group in
each school are reported in Table 8; of note, very few students from Riverview and Wesley responded to
this item. Because so few students from Riverview and Wesley answered the question, only the
responses from Fairmont were interpreted. An independent samples t-test showed that there were no
statistically significant differences between the responses of Fairmont students with and without learning
disabilities (t (219) = .163, p = .871) on the change item.
<Insert Table 8 about here>
18
Computers 18
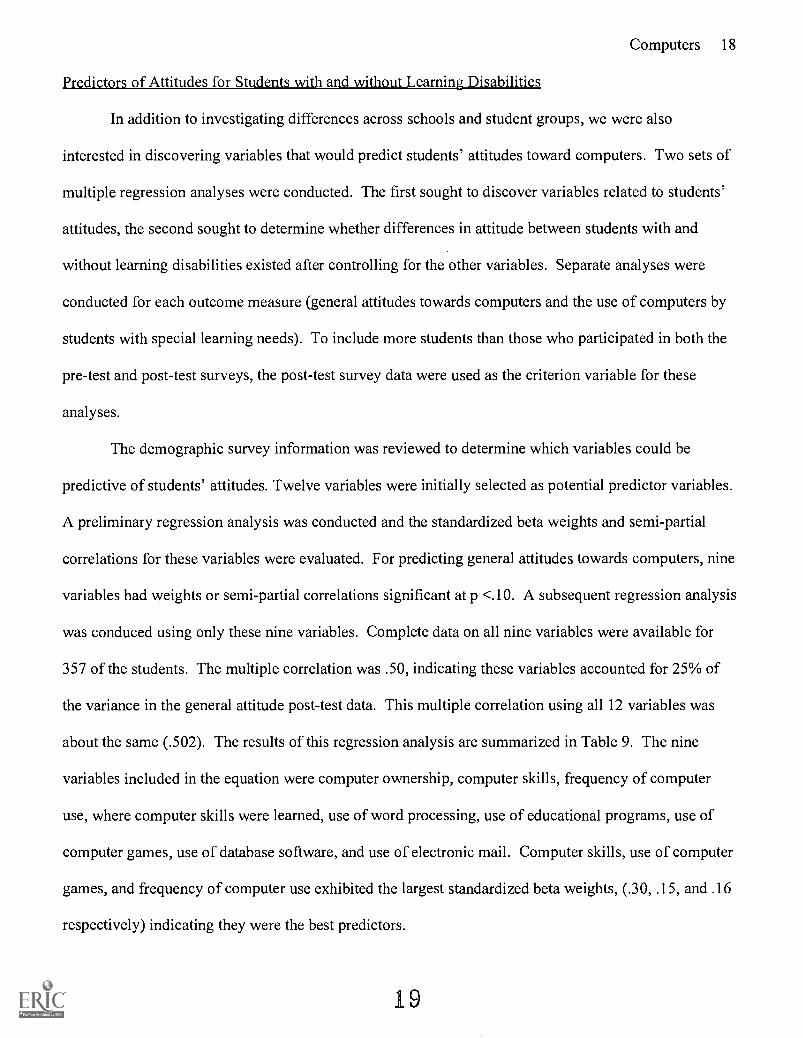
Predictors of Attitudes for Students with and without Learning Disabilities
In addition to investigating differences across schools and student groups, we were also
interested in discovering variables that would predict students' attitudes toward computers. Two sets of
multiple regression analyses were conducted. The first sought to discover variables related to students'
attitudes, the second sought to determine whether differences in attitude between students with and
without learning disabilities existed after controlling for the other variables. Separate analyses were
conducted for each outcome measure (general attitudes towards computers and the use of computers by
students with special learning needs). To include more students than those who participated in both the
pre-test and post-test surveys, the post-test survey data were used as the criterion variable for these
analyses.
The demographic survey information was reviewed to determine which variables could be
predictive of students' attitudes. Twelve variables were initially selected as potential predictor variables.
A preliminary regression analysis was conducted and the standardized beta weights and semi-partial
correlations for these variables were evaluated. For predicting general attitudes towards computers, nine
variables had weights or semi-partial correlations significant at p <.10. A subsequent regression analysis
was conduced using only these nine variables. Complete data on all nine variables were available for
357 of the students. The multiple correlation was .50, indicating these variables accounted for 25% of
the variance in the general attitude post-test data. This multiple correlation using all 12 variables was
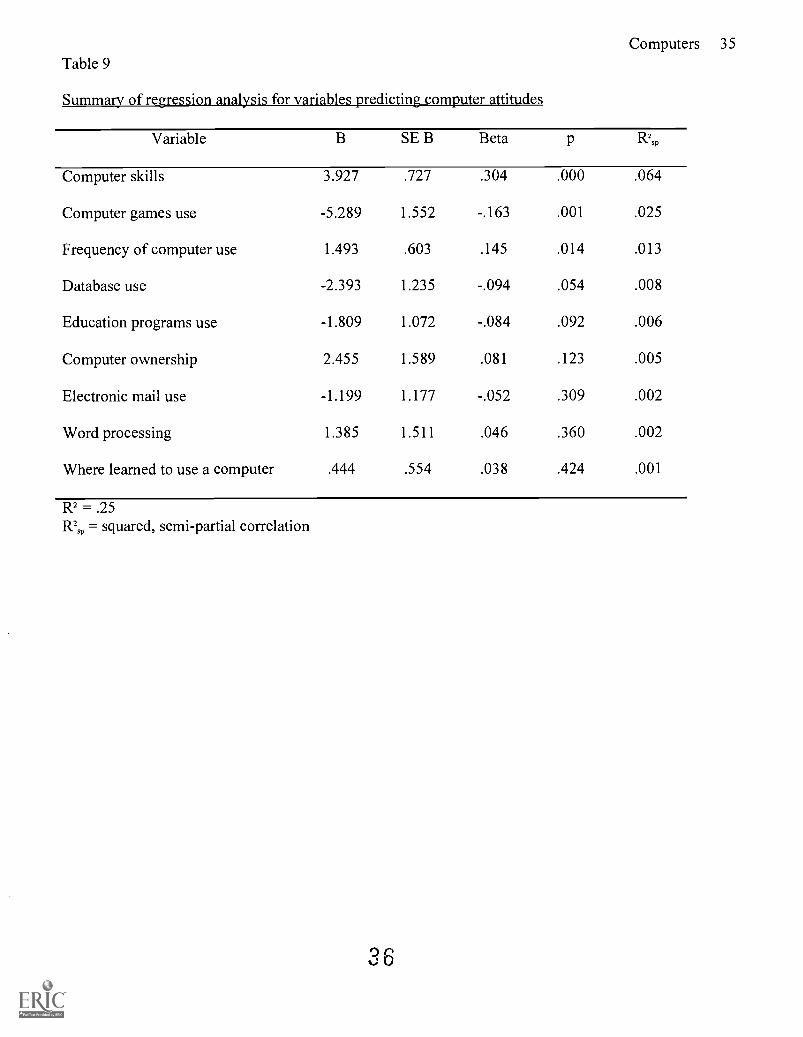
about the same (.502). The results of this regression analysis are summarized in Table 9. The nine
variables included in the equation were computer ownership, computer skills, frequency of computer
use, where computer skills were learned, use of word processing, use of educational programs, use of
computer games, use of database software, and use of electronic mail. Computer skills, use of computer
games, and frequency of computer use exhibited the largest standardized beta weights, (.30, .15, and .16
respectively) indicating they were the best predictors.
19
Computers 19<Insert Table 9 about here>
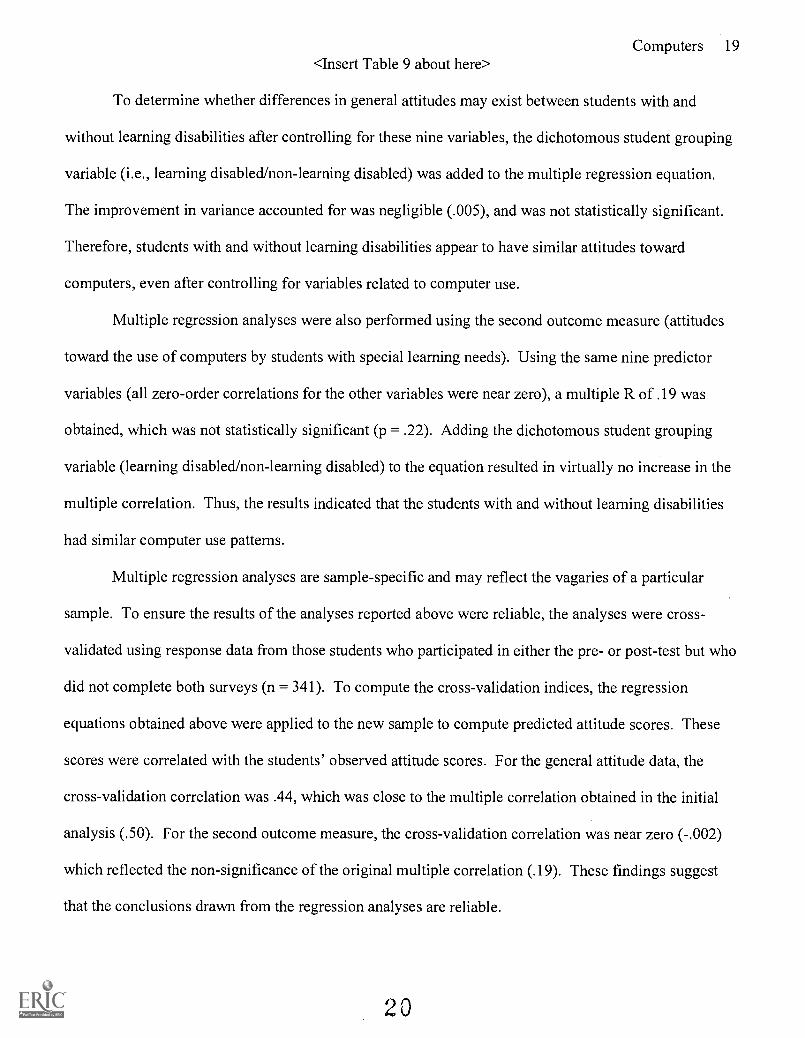
To determine whether differences in general attitudes may exist between students with and
without learning disabilities after controlling for these nine variables, the dichotomous student grouping
variable (i.e., learning disabled/non-learning disabled) was added to the multiple regression equation.
The improvement in variance accounted for was negligible (.005), and was not statistically significant.
Therefore, students with and without learning disabilities appear to have similar attitudes toward
computers, even after controlling for variables related to computer use.
Multiple regression analyses were also performed using the second outcome measure (attitudes
toward the use of computers by students with special learning needs). Using the same nine predictor
variables (all zero-order correlations for the other variables were near zero), a multiple R of .19 was
obtained, which was not statistically significant (p = .22). Adding the dichotomous student grouping
variable (learning disabled/non-learning disabled) to the equation resulted in virtually no increase in the
multiple correlation. Thus, the results indicated that the students with and without learning disabilities
had similar computer use patterns.
Multiple regression analyses are sample-specific and may reflect the vagaries of a particular
sample. To ensure the results of the analyses reported above were reliable, the analyses were cross-
validated using response data from those students who participated in either the pre- or post-test but who
did not complete both surveys (n = 341). To compute the cross-validation indices, the regression
equations obtained above were applied to the new sample to compute predicted attitude scores. These
scores were correlated with the students' observed attitude scores. For the general attitude data, the
cross-validation correlation was .44, which was close to the multiple correlation obtained in the initial
analysis (.50). For the second outcome measure, the cross-validation correlation was near zero (-.002)
which reflected the non-significance of the original multiple correlation (.19). These findings suggest
that the conclusions drawn from the regression analyses are reliable.
20

Computers 20Discussion
Comparisons by School and Group
Interestingly, the ANOVA results and post-hoc tests showed that there were no significant
differences in the overall attitude scores of students with and without learning disabilities. While
students with learning disabilities may have unique learning needs, their attitudes about computers may
be no different than non-disabled peers. Given the positive effects of computer-based instruction (CBI)
for students with learning disabilities, (Fitzgerald & Koury, 1996; Khali li & Shashaani, 1994; Kulik,
1994) it appears that inclusive instructional practices which incorporate computer-based activities could
be a parsimonious way to ensure full inclusion of students with learning disabilities in the least
restrictive environment of the general education classroom while providing instruction (e.g., CBI)
shown to be effective for such students.
Comparisons of the scores obtained by students from the three schools on the two outcome
measures showed significant differences in general attitudes about computer use in schools as well as
use of computers by students with special needs. Post-hoc tests showed that Riverview's scores differed
significantly from both Fairmont and Wesley Academy on both measures. Of note, the scores for
Riverview were higher than the other schools on both measures. Related factors may be that Riverview
had the youngest students and was supposed to receive a new computer network during the study year.
Nonetheless, the existence of these differences between the schools suggests that school environment
may be an important factor in students' attitudes about computers. Even though previous researchers
(Kinnear, 1995; Murphy, et al, 1989; Proctor & Burnett, 1996) noted the importance of computer access
in students' computer attitudes, there is virtually no other research into between-school comparisons of
students' computer attitudes and so replication of these findings is needed.
Changes over Time
Repeated measures analysis of variance (RMANOVA) across school and student groups showed
that, while there were some changes in attitudes over the course of the study, these were not related to
21

Computers 21the implementation of a new computer network. The comparisons showed that school may be related to
changes in general and special needs-related computer attitudes over time but these changes were not
specific to the treatment condition at Fairmont. This is an important finding because of the focus and
importance given to computers in schools and society today (Blackhurst, 1997; Bork, 1997). Just
putting computers into the classroom may have no effect on students' attitudes about them.
Similarly, comparisons between students with and without learning disabilities showed that there
were minimal differences in the changes in attitudes among these students during the study year. Given
that there were no statistically significant changes in the attitudes of students with or without learning
disabilities at Fairmont, it appears that the treatment condition did not influence the attitudes of students
with learning disabilities differently that those without. The overall similarities in changes between the
student groups further supports the finding that having a learning disability is not related to how students
view computers.
The Change Question
Fairmont, the experimental site, experienced an infusion of new technology from which students
at that school reported an increase in the quality of students' work.. Still, the mean responses for both
the students with and without learning disabilities were near the midpoint of the survey scale and must
be interpreted cautiously. Overall, it may be that, according to the responses to change item, the
experimental condition -- the installation of a campus-wide computer network -- had the expected result
of being related to students' perceptions of the relationship of the quality of student work with computer
use. However, the difference in the change item scores for Fairmont students with and without learning
disabilities was not statistically significantly different, suggesting that both groups of students saw some,
if slight, improvement in the quality of students' school work because of the new computer network.
This finding contradicts the results from the repeated measures analysis of variance which suggested that
the Fairmont students' overall attitudes about computers did not change at all over the course of the
school year. Possibly, participants had an overt sense of a change in work quality even though
Computers 22componential evaluation of such change was not reflected in the pre and post-test scale score
comparisons. This finding is in line with many societal expectations of what computers should do for
schools and students (Blackhurst, 1997; Bork, 1997). More research into the real changes that
computers may offer students is needed.
Predictors of Computer Attitudes
Computer skills, use of computer games, and frequency of computer use were the best predictors
of students attitudes about computer use. These findings were in line with prior research (e.g., Kinnear,
1995; Murphy, et al, 1989; Proctor & Burnett, 1996) and suggest that how often students have access to
computers and what they use them for may influence their attitudes about the potential benefit of
computers for school-related work. The finding that there were no significant differences between the
predictive variables for students with and without learning disabilities supports the general comparisons
between the student groups; it appears that the variables that best predict students' general attitudes
about computers are no different for those students with learning disabilities and those without. These
results further support the use of inclusive instructional practices involving computer-based instruction.
The results highlight the importance of students' computer skill level and frequency of computer use on
their general attitudes about computers (Kinnear, 1995; Murphy, et al, 1989; Olivier & Shapiro, 1993;
Proctor & Burnett, 1996). Thus, it appears that ensuring that all students have equitable access to
computers is an important step toward enhancing the likelihood that students will view computer use in
a positive fashion and be able to take advantage of the benefits that computer-based instruction can offer
as suggested by Goldenberg et. al (1984) and Male (1994).
Conclusion
The findings from this survey suggest that there are few differences in the computer-related
attitudes of students with and without learning disabilities. The results also indicated that the students'
computer attitudes were not linked with the treatment condition of a computer network. There were,
however, significant differences in the attitudes of students by school, suggesting that school may be an

Computers 23important factor in the development of students' attitudes about computers. Evaluation of computer-
related variables suggested that computer-related experience is the most important predictor of students'
attitudes about computers.
Data concerning the changes in students' attitudes over the course of the school year when a
computer network was installed at the Fairmont campus showed that the treatment condition was not
related to changes in students' computer-related attitudes. Importantly, the lack of significant difference
between the attitudes and changes in attitudes among students with and without learning disabilities
suggests that students with learning disabilities may be able to take part in CBI in the general education
classroom alongside their non-disabled peers. Such practices allow for inclusive educational approaches
which focus on maintaining the least restrictive environment for all students. Additionally, inclusive
instruction using CBI allows for resources to be allocated for hardware, software, and teacher training,
which will likely further enhance the actual use of computer-based instruction. Given the literature
evidence that CBI is especially effective for students with learning disabilities and other special needs,
optimizing its use appears to be an important effort for students with special learning needs.
24
Computers 24REFERENCES
Blackhurst, A. E. (1997). Perspectives on technology in special education. Teaching
Exceptional Children, 29(5), 41-47.
Bork, A. (1997). The future of computers and learning. Technology Horizons in Education,
24(11), 69-77.
Church, G. & Bender, M. (1989). Teaching with computers: A curriculum for special educators.
Boston: Little, Brown & Company.
Delcourt, M. A. & Kinzie, M. B. (1993). Computer technologies in teacher educations: The
measurement of attitudes and self-efficacy. Journal of Research and Development in Education, 27(1),
35-41.
Fitzgerald, G. E. & Koury, K. A. (1996). Empirical advances in technology-assisted instruction
for students with mild and moderate disabilities. Journal of Research on Computing in Education, 28(4),
526-553.
Fletcher-Flinn, C. M. & Gravatt, B. (1995). The efficacy of computer assisted instruction (CAI):
A Meta-analysis. Journal of Educational Computing Research, 12(3), 219-242.
Goldenberg, E. P. (1979). Special technology for special children: Computers to serve
communication and autonomy in the education of handicapped children. Baltimore: University Park
Press.
Goldenberg, E. P. & Russell, S. J., et alia. (1984). Computers, education and special needs.
Reading, MA: Addison-Wesley Publishing Co.
Kearsley, G., Hunter, B. & Furlong, M. (1992). We Teach with Technology: New Visions for
Education. Wilsonville, OR: Franklin, Beedle & Associates, Inc.
25
Computers 25Khali li, A. & Shashaani, L. (1994). The effectiveness of computer applications: A meta-
analysis. The Journal of Research on Computing in Education, 27(1), 48-61.
King, J. A. (1995). Fear or frustration? Students' attitudes toward computers and school. The
Journal of Research on Computing in Education, 27(2), 154-70.
Kinnear, A. (1995). Introduction of microcomputers: A case study of patterns of use and
children's perceptions. Journal of Educational Computing Research, 13(1), 27-40.
Kulik, J. A. (1994). Meta-analytic studies of findings on computer-based instruction. In, Eva L.
Baker & Harold F. O'Neil, Jr. (Eds.), Technology Assessment in Education and Training, (9-33).
Hillsdale, NJ: Lawrence Erlbaum Associates, Publishers.
Male, M. (1993). Cooperative learning and computers in social studies: Integrating special needs
students into general education classrooms. Social Studies Review, 32(2), 56-62.
Male, M. (1994). Technology for Inclusion: Meeting the Needs of All Students. Boston: Allyn
& Bacon.
Marsh, S. C. (1995). The role of computer-assisted instruction and other techniques to modify
instruction in inclusive first grade classrooms: "You're doing the work, but the work's fun." Doctoral
dissertation, Boston University.
Molnar, A. R. (1997). Computers in education: A brief history. Technology Horizons in
Education. 24(11), 63-68.
Moore, P. R., Reith, H.J. & Ebeling, M. (1994). An analysis of the impact of computer
placement and training on special education teachers' attitudes and perceptions of the role of computers
in instruction. Teacher Education and Special Education, 17(4), 236-248.
Murphy, C. A., Coover, D. & Owen, S. V. (1989). Development and validation of the computer
self-efficacy scale. Educational and Psychological Measurement. 49, 893-899.
26
Computers 26Olivier, T. A. & Shapiro, F. (1993). Self-efficacy and computers. Journal of Computer-Based
Instruction, 20(3), 81-85.
Proctor, R. & Burnett, P. C. (1996). Computer attitude and classroom computers. Computers in
the Schools, 12(3), 33-41.
Riggs, I. M. & Enochs, L. G. (1993). A microcomputer beliefs inventory for middle school
students: Scale development and validation. Journal of Research on Computing in Education, 25(3),
383-389.
Siegel, J., Good, K. & Moore, J. (1996). Integrating technology into educating preservice special
education teachers. Action in Teacher Education, 27(4), 53-63.
Solberg, S. (1996). Technology Master Plan for Fairmont School: Summer Project 1996.
Deerfield, MA: Fairmont School.
Yaghi, H. (1996). The role of the computer in the school as perceived by computer using
teachers and school administrators. Journal of Educational Computing Research, 15(2), 137-155.
Computers 27Table 1
Demographic characteristics of students at each school
School N Percent
Fairmont
Day students (girls) 61 (8) 24 (3)
Boarding students 181 72
International students 52 21
Students with Learning Disabilities 26 10
Students with Attention Deficit Hyperactivity Disorder 19 8
Other disabilities 2 .8
Total 250
Riverview
55 14Students receiving special education services
Students receiving free and reduced lunch 39 9
Non-native English speakers 23 6
Total 393
Wesley Academy
Students receiving special education services 49 15
Non-native English speakers 60 18
Total 327
28

Computers 28Table 2
Item categories and individual items
CATEGORY ITEMS
Generalattitudesabout the useof computersin schools
Attitudesabout use ofcomputers bystudents withspeciallearningneeds
Change item
1. I feel comfortable with my ability to work on a computer.
2. The thought of using a computer frightens me.
3. I worry about using computers because I feel like I might break them.
4. Computers are helpful tools for school assignments.
5. There should be one or more computers in every classroom.
6. Computers help make schools more connected to the "real world."
7. Computers provide information and resources not otherwise available in schools.
8. Computers make school fun for students.
9. Writing is easier for students when using a computer.
10. Students who use computers for school work get better grades.
11. Computers encourage student imagination and creativity.
12. Students should be required to learn how to use computers.
13. Students should use computers regularly to do school-related work.
14. Computers make it easier for students to succeed in school.
15. Students receive enough training to use computers for school-related work
16. Computers help students learn how to work together and solve problemscooperatively.
17. Computers put pressure on students to learn more and get better grades.
18. Computers take time away from students working together.
19. Computers are a distraction to students and take time away from instruction.
20. Students with special needs believe that computers can help them to improve theirgrades.
21. Students with special learning needs believe that computers can help improve thequality of their work.
22. In general, students with special learning needs believe that computers can helpthem to compensate for their disabilities.
23. Computers benefit students with special learning needs more than students withoutspecial learning needs.
24. I believe that the new computers installed this year have helped students to improvethe quality of their work.
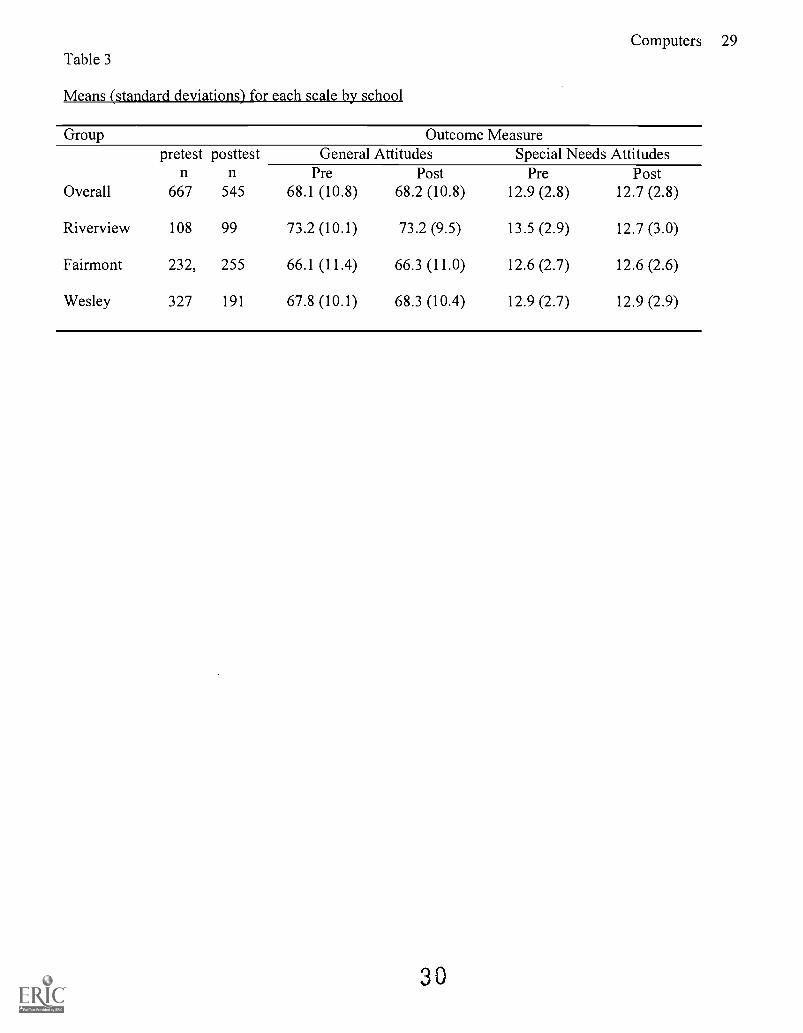
Computers 29Table 3
Means (standard deviations) for each scale by school
Group Outcome Measurepretest posttest General Attitudes Special Needs Attitudes
n n Pre Post Pre PostOverall 667 545 68.1 (10.8) 68.2 (10.8) 12.9 (2.8) 12.7 (2.8)
Riverview 108 99 73.2 (10.1) 73.2 (9.5) 13.5 (2.9) 12.7 (3.0)
Fairmont 232, 255 66.1 (11.4) 66.3 (11.0) 12.6 (2.7) 12.6 (2.6)
Wesley 327 191 67.8 (10.1) 68.3 (10.4) 12.9 (2.7) 12.9 (2.9)
30

Computers 30Table 4
Means (standard deviations) for each scale by student groups
(students with and without learning disabilities)
Group Outcome Measurepretest posttest General Attitudes Special Needs Attitudes
n n Pre Post Pre PostStudents with Learning 97 65 67.2 (10.6) 69.9 (12.0) 12.8 (2.7) 13.0 (3.4)Disabilities
Students without 497 432 67.8 (8.8) 67.8 (10.8) 12.9 (2.1) 12.6 (2.7)Learning Disabilities
31
Computers 31
Table 5
Mean scores (standard deviations) for each pre and post-test scale by school for participants who
completed both surveys
Group Outcome MeasureGeneral Attitudes Special Needs Attitudes
n Pre Post Pre PostRiverview 71 74.1 (8.99) 72.2 (9.36) 13.5 (3.02) 12.2 (2.69)
Fairmont 176 65.2 (11.99) 66.2 (10.84) 12.6 (2.74) 12.4 (2.56)
Wesley 143 67.6 (10.99) 68.2 (10.72) 12.9 (2.96) 12.9 (2.70)

Computers 32Table 6
Results from RMANOVA for within and between-school differences from pre to post-test
Source df Sum of Squares Mean Sum ofSquares
F p
General Attitudes Scale:
School 2 2816.05 1408.02 13.90 .000
Time 1 4.50 4.50 .14 .707
School x Time 2 268.93 134.47 4.22 .015
Error 387 12334.55 31.87
Special Needs Attitudes Scale:
School 2 13.62 6.81 1.22 .296
Time 1 49.12 49.12 11.24 .001
School x Time 2 43.70 21.85 5.00 .007
Error 395 1725.82 4.37
Computers 33
Table 7
Results from RMANOVA for within and between group differences from pre to post-test for
students with and without learning disabilities
Source df Sum of Squares Mean Sum ofSquares
F p
General Attitudes Scale:
Group (LD non LD) 1 42.44 42.44 .38 .542
Time 1 242.74 242.74 7.11 .008
Group x Time 1 135.71 135.71 3.97 .047
Error 353 12058.44 34.16
Special Needs Attitudes Scale:
Group (LD non LD) 1 6.81 6.81 1.14 .286
Time 1 14.39 14.39 3.07 .081
Group x Time 1 .46 .46 .10 .755
Error 360 1690.15 4.69
4
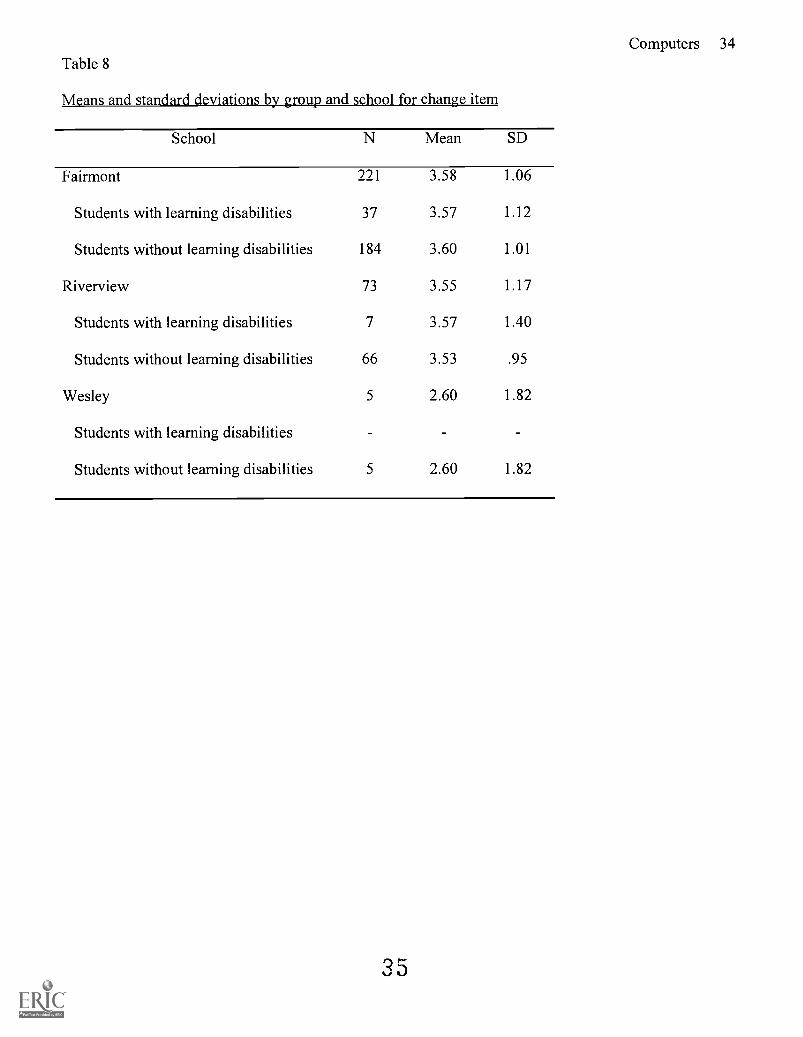
Table 8Computers 34
Means and standard deviations by group and school for change item
School N Mean SD
Fairmont 221 3.58 1.06
Students with learning disabilities 37 3.57 1.12
Students without learning disabilities 184 3.60 1.01
Riverview 73 3.55 1.17
Students with learning disabilities 7 3.57 1.40
Students without learning disabilities 66 3.53 .95
Wesley 5 2.60 1.82
Students with learning disabilities -
Students without learning disabilities 5 2.60 1.82
35
Computers 35
Table 9
Summary of regression analysis for variables predicting computer attitudes
Variable B SE B Beta p R2
Computer skills 3.927 .727 .304 .000 .064
Computer games use -5.289 1.552 -.163 .001 .025
Frequency of computer use 1.493 .603 .145 .014 .013
Database use -2.393 1.235 -.094 .054 .008
Education programs use -1.809 1.072 -.084 .092 .006
Computer ownership 2.455 1.589 .081 .123 .005
Electronic mail use -1.199 1.177 -.052 .309 .002
Word processing 1.385 1.511 .046 .360 .002
Where learned to use a computer .444 .554 .038 .424 .001
R2 = .25R25P = squared, semi-partial correlation
36
Computers 36Figure Captions
Figure 1. Pre and post-test means by school for general attitudes scale for students who completed bothsurveys.
Figure 2. Pre and post-test means by school for special needs scale for students who completed bothsurveys.
37
Score
76 _
74 _
72 _
70 _
68 _
66 _
64 _
62
60
Pre-test Post-test
38
Computers 37
Riverview
0 FairmontWesley
Score
14
13.5 _
13 _
12.5 _
12_
11 5
Pre-test
39
Post-test
Computers 38
+ Riverview0 Fairmont
Wesley
ERIe Reproduction Release Form - HTML
U.S. DEPARTMENT OF EDUCATIONOffice of Educational Research and Improvement (OERI)
Educational Resources Information Center (ERIC)
REPRODUCTION RELEASE(Specific Document)
I. DOCUMENT IDENTIFICATION:
Title: COmP,i-fe roi 1 *y Lt S and Opi n 1 orsLe.ta-rn 1 ru3 s aiiities
Author(s): p_aohLk 6,ro von _cut H cuN
Corporate Source:
Publication Date:
H. REPRODUCTION RELEASE:
http://www.ericec.org/reprofrm.htm
q-6-1-voLuck curl ok
1-yin In coL dui r g b4-bp Inevi -
In order to disseminate as widely as possible timely and significant materials of interest to the educational community, documentsannounced in the monthly abstract journal of the ERIC system, Resources in Education (RIE), are usually made available to usersin microfiche, reproduced paper copy, and electronic/optical media, and sold through the ERIC Document Reproduction Service(EDRS) or other ERIC vendors. Credit is given to the source of each document, and, if reproduction release is granted, one of thefollowing notices is affixed to the document.
If permission is granted to reproduce the identified document, please CHECK ONE of the following options and sign the releasebelow.
Check Here, Please
Check here for Level I Release, permitting reproduction and dissemination in microfiche and other ERIC archival media(e.g., electronic) and paper copy.
Or
Check here for Level 2A release, permitting reproduction and dissemination in microfiche and in electronic media forERIC archival collection subscribers only.
or
Check here for Level 2B release, permitting reproduction and dissemination in microfiche only.
Sign Here, Please
Documents will be processed as indicated provided reproduction quality permits. If permission to reproduce is granted, but neitherbox is checked, documents will be processed at Level I.
"I hereby grant to the Educational Resources Information Center (ERIC) nonexclusive permission to reproduce this document asindicated above. Reproduction from the ERIC microfiche or electronic/optical media by persons other than ERIC employees andits system contractors requires permission from the copyright holder. Exception is made for non-profit reproduction by librariesand other service agencies to satisfy information needs of educators in response to discrete inquiries."
Signatu
Printed Name: che-1 rtrwr) ChicAddress: (1-3 1-ki I I S
i vca t-f-y c9F flArntlast I DO 3
III. DOCUMENT AVAILABILITY INFORMATION (FROM NON-ERIC SOURCE):
Position: clocizral (and ict 0-1-e-y Organization: Uri i vexsi=f-y 1v 1A 55 a (../4_4_,(
Telephone Number: 4 ..1 -5D5 - 0942Date: IS- Se_f4urvd-jor ( 9 2
If permission to reproduce is not granted to ERIC, or, if you wish ERIC to cite the availability of this document from anothersource, please provide the following information regarding the availability of the document. (ERIC will not announce a documentunless it is publicly available, and a dependable source can be specified. Contributors should also be aware that ERIC selectioncriteria are significantly more stringent for documents which cannot be made available through EDRS.)
Publisher/Distributor:
Address:
Price Per Copy:
of Amhcr-t-
1 of 2 9/14/99 7:32 AM

ERIC Reproduction Release Form - HTML http://www.ericec.org/reprofrm.htm
Quantity Price:T.
IV. REFERRAL OF ERIC TO COPYRIGHT/REPRODUCTION RIGHTS HOLDER:
If the right to grant a reproduction release is held by someone other than the addressee, please provide the appropriate name andaddress:
Name and address of current copyright/reproduction rights holder:
Name:
Address:
V. WHERE TO SEND THIS FORM:
Send this form to the following ERIC Clearinghouse:
You can send this form and your document to the ERIC Clearinghouse on Disabilities and Gifted Education. They will forwardyour materials to the appropriate ERIC Clearinghouse.
ERIC AcquisitionsERIC Clearinghouse on Disabilities and Gifted Education1920 Association DriveReston, VA 20191-1589(800) [email protected]://ericec.org
2 of 2 9/14/99 7:32 AM