Embed Size (px)
Citation preview

COMPUTER-ASSISTED METHODOLOGYFOR THE DETERMINATIONOF THE OPTIMAL NUMBER
AND LOCATION OF TOOL SHEDS

Report Documentation Page Form ApprovedOMB No. 0704-0188
Public reporting burden for the collection of information is estimated to average 1 hour per response, including the time for reviewing instructions, searching existing data sources, gathering andmaintaining the data needed, and completing and reviewing the collection of information. Send comments regarding this burden estimate or any other aspect of this collection of information,including suggestions for reducing this burden, to Washington Headquarters Services, Directorate for Information Operations and Reports, 1215 Jefferson Davis Highway, Suite 1204, ArlingtonVA 22202-4302. Respondents should be aware that notwithstanding any other provision of law, no person shall be subject to a penalty for failing to comply with a collection of information if itdoes not display a currently valid OMB control number.
1. REPORT DATE JUL 1986
2. REPORT TYPE N/A
3. DATES COVERED -
4. TITLE AND SUBTITLE Computer-Assisted Methodology for the Determination of the OptimalNumber and Location of Tool Sheds
5a. CONTRACT NUMBER
5b. GRANT NUMBER
5c. PROGRAM ELEMENT NUMBER
6. AUTHOR(S) 5d. PROJECT NUMBER
5e. TASK NUMBER
5f. WORK UNIT NUMBER
7. PERFORMING ORGANIZATION NAME(S) AND ADDRESS(ES) Naval Surface Warfare Center CD Code 2230 - Design Integration ToolsBuilding 192 Room 128 9500 MacArthur Blvd Bethesda, MD 20817-5700
8. PERFORMING ORGANIZATIONREPORT NUMBER
9. SPONSORING/MONITORING AGENCY NAME(S) AND ADDRESS(ES) 10. SPONSOR/MONITOR’S ACRONYM(S)
11. SPONSOR/MONITOR’S REPORT NUMBER(S)
12. DISTRIBUTION/AVAILABILITY STATEMENT Approved for public release, distribution unlimited
13. SUPPLEMENTARY NOTES
14. ABSTRACT
15. SUBJECT TERMS
16. SECURITY CLASSIFICATION OF: 17. LIMITATION OF ABSTRACT
SAR
18. NUMBEROF PAGES
128
19a. NAME OFRESPONSIBLE PERSON
a. REPORT unclassified
b. ABSTRACT unclassified
c. THIS PAGE unclassified
Standard Form 298 (Rev. 8-98) Prescribed by ANSI Std Z39-18


THE NATIONAL SHIPBUILDINGRESEARCH PROGRAM
Task EC-26Computer-Assisted Methodology
for the Determinationof the Optimal Number
and Location of Tool Sheds
CONDUCTED AT:Mechanical -Enqineerinq Department FU-10
Industrial Enqineerinq ProqramUniversity of Washington
Seattle, Washinqton 98195
January 1986 throuqh July 1986
FOR :
Bath Iron Works Corporation700 Washinqton St.Bath, Maine 04530
The Society of NavalArchitects and Marine Enqineers
Ship Production CommitteeSp-8 Panel on Industrial Enqineerinq
The U.S. Department of TransportationMaritime Administration

This project is managed and cost-shared by Bath
Iron Works Corporation for the National Shipbuilding
Research Program. The program is a cooperative
effort of the Maritime Administration’s Office of
Advanced Ship Development, the U.S. Navy, the U.S.
shipbuilding industry, and selected academic
institutions.

Executive Summary
This project was performed by the University of Washington toprovide computer assistance for choosinq optimal locations fortoolrooms in shipyards. The tool used to accomplish this taskis a computer proqram entitled Computer-Assisted ToolroomDesiqn (CATD). The CATD program is executable on the IBM-ATand the IBM-PC with an 8087 co-processor chip. Its operation and maintenance is outlined in the user and technical manualenclosed in the report.
The CATD proqram provides the user with the ability to analyzea shipyard with respect to the utilization of its resources inreqards to toolroom locations. BY determining optimal toolroomlocations, the user gains an insiqht of the system and thesystems possible improvements by varyinq the locations.Futhermore, proposed toolrooms can be tested in the proqram todetermine their economic feasibility for expansion. Anapplication of the program was performed at Inqall’s Shipyard.
The program will be most applicable at shipyards that havelimited resources in workforce? toolrooms and equipment. Tento fifteen percent cost savinqs ~ based on the craftsmenunproductive time spent queueing and travelinq, can beestimated for shipyards from the preliminary analysis.


REPORT To MANAGEMENT
1.1 Introduction
CATD is a computer program written in Fortran77 that runs
on the IBM-AT and is accessible on the IBM-PC with a 8087 Co-
Processor Chip. It is designed to provide computer assistance
for choosinq optimal locations of toolrooms in a shipyard.
CATD proqram
system and
for the CATD
provides a solid basis for a continued research
can be used with little difficulty. Documentation
proqram includes two manuals: (1) User Manual (2)
Technical Manual.
1.2 Description of
1.2.1 User manual
Documentation
The user manua1 describes the operations of the CATD
proqram. Complete procedures for usinq the personal computer
is subsumed, where the manual assumes that the indiviual
operating the system has little experience prior to usinq the
computer. Futhermore, its intended audience is an individual
who will be using the tool by entering the necessary data to
qet statistics about the toolroorm, and their optimal locations.
1.1
The manua1 provides a brief tutorial that walks the user
throuqh the program and indicates how the data is entered. In
addition, the proqram checks for mistyped data.
The technical manua1 provides the necessary information
for maintaining and upgradinq the CATD proqram. It was written
for an individual responsible for maintaining the software at a
shipyard. The individual should have experience in desiqninq
modular proqrams and know Fortran77. The appendices contain
the data flow diaqrams, data dictionary, process specifications
structured charts and source listinq that describe CATD
proqram. The desiqn of the proqram can be referred to and is
followed by a structured analysis and structured desiqn
methodology as described in Structured Analysis and System
Specification by Tom de Marco (1) and The Practical Guide to
Structured Systems Desiqn by Meilir Page-Jones (2). The manual
describes the desiqninq process in the book and recommends the
procedures for upqradinq the CATD proqram.
1.3 The CATD PR0GRAM
CATD proqram provides a user with the ability to evaluate
toolroom locations for present and future uses. The proqram
characterizes the toolroom environment by analyzinq the traffic
of workers in the toolroom. The model l asumes that the workers
who are served
a mathematical
will randomly arrive at the toolroom; therefore,
servinq or queueinq model can be applied in this
1.2

. .
tuation. The cost of serving the toolroom is determined as a
function of the productivity of the craftsmen. Their work
efficiency is decreased
travelinq to and queueing
areas of the craftsmen
throuqh unproductive time spent in
at the toolrooms. When the work
is specified, the CATD proqram
determines the optimal location of the toolroom. Hence, the
proqram is able to postulate the efficiency with which the
system is currently operating and the level to which it can be
improved by varying the toolroom locations.
The program also exercises flexibility by estimating the
consequences or benefits of a proposed decision. For example,
it allows the user to evaluate the feasibility of an additional
or future toolroom, without actually implementing. In this
sense, the model can be modified superficially in order to
determine how the system would respond to chanqes in the number
of toolrooms.
The required input for the CATD program is obtained fairly
easily. An actual illustration of the program’s capabilities
was tested at Inqall’s Shipyard.
1.4 Applications
1.4.1 Inqall’s Shipyard
The data gathered at the Inqall’s Shipyard consisted of
four phases: financial travel, workers, and queueinq
information. The financial data consisted of the buildinq and
inventory cost for each toolroom, plus the averaqe worker’s
waqe. The travel information includes the distance between the
1.3

toolroom and service areas, and the walkinq rate of a normal
worker . Lastly, the worker and queueing data can be tabulated
simultaneously by the attendant who records the number of
workers beinq serviced in the toolroom and the time taken to
service them. The technical manual provides a minimum data
listinq and its mean for acquisition.
By inputtinq the data into the CATD proqram, it was
determined that shipyards could anticipate a considerable
savinqs by optimizing the locations of their toolrooms. The
user’s manual tutorial section has the print-out of the
session. For the existinq toolroom, Fabric Shop Toolroom, a
cost reduction of $62.90/day was estimated. Feedback was
attained at the Inqall’s Shipbuilding while demonstrateinq the
use of the proqram to their Supervisor of Tool Control, Section
Manaqer of Operations Data Control and various Industrial
Enqineerinq staff. There existed a concensus that the tool
could provide a savinqs brouqht about by increased productivity
of the craftsmen and that it is useful as a decision-makinq
tool in providinq evidence to support the implementation of
chanqes in the location of the toolrooms.
1.4.2 Generic Model
The CATD proqram proved to be successful in the
Inqall’s Shipyard, and can be effective when applied to other
shipyards. The program's potential will depend largely on the
shipyard setting and its operating characteristics.
Shipyard environments that have limited available
resources will benefit most from the model, where limitinq
1.4

resources include workforce, toolrooms, and equipment.
Shipyards that are subjected to a confined number of toolrooms
in proportion to its needs will find the CATD proqram can
determine optimal locations for the toolroom, and aid in
decision-makinq of additional toolrooms. An estimated ten to
fifteen percent of the craftsmen’s unproductive time is the
anticipated cost savings based on the preliminary analysis.
Shipyards that have a sufficient number of toolrooms that are
centrally located within the service areas will find the model
less useful . In addition, shipyards who distribute the tools
permanently at the service areas will find the model
unapplicable.
1.5 Potential Expansion
The CATD program provides a computer system that can be
integrated into the shipyards. Personal computers ara powerful
enouqh for supporting complicated simulation applications and
expert systems. The algorthim used in determininq toolroom
locations by calculating centroids of service areas can further
be enhanced with a continuing deqree of sophistication.
Appendix A includes a listinq of readinq with applications to
further simulations that can compliment the CATD proqram.
1.6 Other Applications
The followinq section discusses research and computer
applications in the shipbuilding industries and related
1.5
industries.
1.6.1 Shipbuilding Industry
Computers were first used in ship desiqn. Development in
this field over the past two decades has allowed a full
structural analysis to be performed on marine vehicles.
Computer graphics has played a major role in updatinq the
traditional methods.
In consideration of preliminary desiqn, the computer is
used primarily for producing a range of feasible designs.
However, problems lie in the selection of criteria for
evaluating the design. Advanced technology provides the
designer with computer-aided-design and manufacturing (CAD,CAM)
for revising final drawings used for the production process.
Preparation-effort and draftinq time has been greatly reduced
by these methods. In addition, Hull Surface Generation has
developed into three major approaches: Computerization of the
Graphical Method, Mathematical Fairing, Surface Generation.
Each approach
parameters.
Computer
is essentially a fittinq process within specified
software is presently, being developed for
facilitating decision-makinq and the control of production.
The packages are yet to be fully satisfactory. Many material
billing, inventory control and purchasing software have been
developed, but its practicalities will depend on the qoal of
the company. It is clear that there is still further
development in the application of computers. Some examples of
computer integration and research for shipyards are found in
Appendix B.
1.6

The computer
efficiency and
is fully accepted as a tool for achieving
cost-effectiveness in a larqe number of
industries such as automotive, aerospace, and manufacturing.
These industries are analogical to the production process in
shipbuilding for these industries produce large scale assembled
products. The car assembly line is a good example of robot use
in the manufacturing industry. Robots have not yet come into
widespread general use in the shipbuilding industry because of
problems with the large geometry of the work pieces. Greater
automation in the shipyard is expected to increase and develop.
In Appendix B, there are articles supplemented with brief
descriptions to gain
doing to increase
applications.
overview
production
of what other industries are
through research into computer
1.7

Appendix A
Potential Expansions
1.8

Diesslin, R.L. “A Survey of CAD/CAM Technology Applications inthe U.S. Shipbuilding Industry.” National Shipbuilding ResearchProgram report 0188, Department of Transportation,Washinqton,DC
Summary:This paper presents a comprehensive survey of CAD/CAM
equipment installed and planned for installation in U.S.shipyards. The main emphasis of the paper was ratinq thevarious applications for quality of software and effectivenessof applications in executing the assigned tasks. Futuredevelopments sought by the shipyards were described andproblems with acheivinq these goals were discussed.
Example:none given
Application:This survey gives a good overview of the installed
computer base in U.S. shipyards as of 1981. The general trendsand problems of CAD/CAM are well defined. Recent improvementsin minicomputers work stations and software most likely makethe specifics of this report obsolete.
1.9

FortenBerry, J.C.; Cox, J.F. “Multiple Criteria Approach to theFacilities Layout Problem.” int. J. Prod. Res., vol.23, no.4(JUL/AUG 1985) p. 773
Summary:This paper describes an algorithm for facility layout.
The prior algorithms for facility layout optimization usedweighed flow and closeness values to determine best layout.Weights were determined throuqh empirical experience. Thisalgorithm uses the A,E,I,O,U,X evaluation developed by Muther,flow, transit distance between activities, and the assumptionthat all entities are of equal size. The author claims thatthe assumption of equal size is reasonable in application. Theuse of a negative X value for entities that should be separatedis more effective than the O or 1 value used by otheralgorithms.
Example:The examples given are the proof examples from the other
methods considered. In each case the “transit cost” wasreduced by the authors algorithm. No full scale applicationswere described.
Application:This approach provides a reasonable general alqorithm for
shipyard facilities. The equal entity size assumption may makethis algorithm useless for the optimum tool shed problem, butassignment of flow limits in addition to flow rates couldchanqe the output sufficiently to give a good representation.
Since no discussion was provided in the paper oflimitations on either the flow or transit distance values$ itappears the algorithm can not include limits. This can beovercome by using simulation to model the algorithm andlimitations.
1.10

Goemanov, L.A. “Industrial Production Simulation SystemTheoretical Approach” ACTA Polytech. Scand. no.Ma31 (1979),pq.66-70
Summary:This
industrialcreated by
paper presents a stochastic model for simulatingprocesses. The stochastic element of this model isMarkov descriptions of network.
Example:none given
Application:This paper provides a theoretical model for process
simulation under stochastic conditions. The mathematicalrepresentation is complete and other papers describing theapplication of this model to manufacturinq are cited. Thispaper provides proven approaches for consideration instochastic modelinq.
Simulation of shipyard procedures is usually done ondiscrete, deterministic data. Detailed analysis of real worldprocedures will require some stochastic element to model theuncertainties involved in any major construction project.Specifically the use of stochastic models in jUSt i n timeinventory management is necessary since the effect of randomenvironmental influences can be a critical influence on just intime inventory management operating in the diffuse U.S. supplysystem (as compared to the geoqraphical nearness ofmanagement.) Other applications for stochastic modelinq includestandard work packaqe optimization and initial constructionfacilities.
1.11

Graves, R. J.; Simth, J. M.; Kerbache,L. “Material Hand 1inqProblem Analysis Usinq Queueing Networks.” Proceedings of theAnnual Industrial Engineering Conference & Exposition,Louisville, KY (1983) P.269
Summary:This paper describes a queueing network decomposition for
planning a manufacturing facility. The algorithm used isdiscussed in Smith ’85. A network with two subnets was used todescribe the system. One subnet is the circulation network fornon-instantaneous transitions of product. The other subnet isan activity, machines, and departments network. An openqueueing model is used in the representation.
Example:The example used
layout process used forfactory. The buildingfor aesthetic reason.
in this paper describes the facilityconverting an historic buildinq into ashell was preserved as much as possible
This caused constraints on thedistribution of activities and types of transportation systems, employed.
Application:The facilities layout algorithm developed by Smith et.al.
is demonstrated in a manufacturing environment. Althouqh thisis an analytical algorithm vs. simulation model it does showflexibility and depth in this application and prior 1ibraryproblem the model described couldsimulation model, as an alternativepurposes, or as a macro levelhierarchy.
be used as the basis for amethod for illustrative
procedure in a planning
1.12

Karpowicz, A.S. and Simone, V. “A Contribution to ComputerSimulation Methods, Application in Ship Production Process.”Conference Proceedings of Ship Desiqn and Automation Meetinqs,North Holland Publication. pg.69-79
Summary:This paper is a description of one attempt to write
computer code for optimizing the scheduling of a product workbreakdown system of ship construction. The simulation wasbased on two variables; material in tons, time in months. Themodel was deterministic.
The program was found to be useful but lackinq in detail.
Example:The simulation of a ship’s construction is used to
demonstrate the proqram. The input was found to be to sparsefor accurate simulation. Truncation of time units when lenqthof a process was not exactly a multiple of one month causederrors in time of process estimation. The material units didnot allow qualitative distinctions.
AoDlication:The program described in this paper does not have a
sufficiently detailed field of variables to be used on the toolshed placement problem. The product unit, referred to asmar ine technology units (MTU’s), is consistent with modernshipbuilding practices and proved usedful in the demonstrationprogram. A more data rich MTU would have to be used on thetool shed problem.
1.13

Knapp, S.M. “A Floor Space Simulator for Shipyard Steel.”Procedinqs SPC/IREAPS Technical Symposium, (23-25 AUG 1983)P. 501
Summary:This paper is a description of a computer program that
simulates the landinq of steel parts on a ship underconstruction. The program is a SPAR planning program whichwill interface with PERT-PAC scheduling proqrams withoutmodificaiton. It is discrete and deterministic. Only minimaltheory is presented.
Example:This paper describes the approach taken in modelinq the
activities to be simulated in the program. The proqramrequires the programmer to define spaces, sub-spaces, andprohibited spaces in a relative 3 dimensional space(X,Y,Z),These spaces are filled with the parts and subassembliesdefined by the programmer.
Application:The program described has immediate application potential
in the shipbuilding industry. Its output includes informationon activity site, order, and duration for optimized production.When installed on a mainframe computer, the proqram can be usedto plan new schedules in minutes after receivinq newinformation on the work completed.
1.14

Levy, F.K.; Thompson, G.L.; Wiest, J.S. “Multi-Shop, WorkloadSmoothinq Proqram”. Naval Research Loqistics Quarterly, VO1.9,no.1 (1963)
Summary:This paper describes a schedule levelinq proqram. The
critical path method is used with all events scheduled forregular early start (D). The program seeks the highest manhourdemand day, selects events with slack manhour and delays theseevents. The result is a reduction in peak labor demand. Thisprocess is iterated until no improvement is made thru delays orno delays are possible for selected day.
ExamplesThe example, and proof, was based on fabricated data
projected from historical values.
Application:The general approach is similar to some facility layout
algorithms in it’s sinqle comparison method of iterations. Thenature of the calculations allows scale of smoothinq level tovary i.e. operational, tactical, strateqic. This can beachieved by creatinq a hierarchy with the nodes representinqwork packaqes, then blocks, then completed products.
The use of this paper in the toolroom optimizationproqram would be limited to the discussion of hierarchies sincethe proqram does not allow the depth of detail for eleqance ofexecution that more modern algorithms include.
1.15

Lewis; W.P. and Block, T.E. “On the Applications of ComputerAids to Plant Layout.” International Journal of ProductionResearch VO1.18, no.1 (JAN/FEB),pq.11-20
Summary:This paper describes a procedure and computer program for
optimizing facility layout. Various programs forlayout are discussed. The two basic divisions of theare: 1) construction layout, and 2) optimizing layout.
facilityprograms
Example:No example is qiven, however the program descriptions
include methodology for each proqrams facility layoutalqorithm. The basic approach is to switch module sites thentest to see if the system is more efficient. This approach canbe very expensive computationally since it is exhaustive. Somediscussion of computation costs is included.
Application:The concepts for the algorithm described in this paper
can be easily applied to shipyard use.In the toolroom optimization problem the basic approach
this alqorithm would take is; simulate a given feasible set oftoolroom and work site locations to determine time spent ontool distributions next - toolroom relative size or site wouldbe modified to some feasible value and the new layout would besimulated to determine time spent on tool distributions thelayout with minimal distribution time would then be selected.This process would be exhaustively iterated within the feasiblebounds and step sizes.
When usinq a limited set of feasible layouts in a jobshop this approach can provide a rapid layout optimization.
1.16

Masri. S. and Moodie, C. “Usinq an Electronic Spreadsheet toAnalyze Manufacturing Flow Systems.” Computers and IndustrialEnqineering VO1.9, no.2 (1985)
Summary:This paper describes the use of a microcomputer based
spreadsheet to create small scale computer simulation. Desiqnof the model assumes the system described is a flow system.Job shop simulation can be accomplished by adding constraintsto the model.
Example:The paper uses a management resource planning model
(MRP) for developing a bill of materials. The example proqramwas oriented toward inventory management. A discussion of therelative merits of mainframe simulation VS . this spreadsheetbased program is included in the paper.
Application:This paper has no direct application in the resent study
of shipyard use of simulation.Future consideration miqht be given this low end
approach to simulation for on site modification of processscheduling. The approach may provide sufficient computationalability for regular application of simulation to small shopoperations.
1.17

McGinnis, L. and Graves, R. “A Decision Support System for theOutfit Planninq Problem.” Washington, D.C., Department ofTransportation (1980,1982)
Summary:This paper describes the work done to write a computer
code for ship oufittinq optimization. The outfit problem is tomaximize outfitting at the unit levels with on block outfittingconsidered next, and on board outfitting as least desirable,while operatinq within scheduling and facility constraints.Computer code, theory, and test data are included. Computercode is experimental, i.e. it is not optimized. A usefulbibliography is included.
Example:The example given in this paper is based on a computer
generated model of a ship constructed in a product workbreakdown structure environment (PWBS). The model qives areasonable proof of the ability of the computer proqram tooptimize an outfitting problem.
Application:This paper offers a great deal of information on
formulating proqrams of shipbuilding simulation. Six basicassumptions are made about the feasible range of values and theassumptions are shown empirically reasonable. Sufficientvariables are described to provide detailed simlation.
The optimization is approached by runninq a selectionproqram to find the optimum plan with no labor or facilityscheduling constraints considered. The next step is to takethe selected plan and check for violated schedulingconstraints.
1.18

Okayama, Y. and Chirillo, L.S. “Product Work BreakdownStructure.” National Shipbuilding Research Proqram report 0164,Washington D.C., Department of Transportation (DEC 1982)
Summary:This paper is a report on the management methodology used
by IHI shipyard in Japan to classify and organize work so thethe large construction project of shipbuilding can be dividedinto manageable work packages.
Example:This report is an explanation of an operating management
system. There are no illustrative examples given.
Replication:The information in this report is the “state of the art”
for shipyard management methods. It is a report on themethodology used to successfully employ group technology inshipbuilding.
The PWBS provides a format for organizinq workassignments. The basic breakdown is 3x2 matrix of work type.One side of the matriz is hull, outfitting, and painting work,the other side of the matrix is fabrication and assembly.These definitions form a 6 unit vector which is the thirddimension added to the 4x4 product resources and productaspects matrix. Product resources are: material, manpower,facilities, and expenses. Product aspects are: systems area ,zone, stage. By defininq all work packaqes with a 6x4x4matrix, information about the work is rationalized andmanageable.
The toolroom optimization project can use this workbreakdown to define work packaqe tool needs. The PWBS isreadily computerized and rich in detail.
1.19

Smith, J.M. and Bouanada, B. “ Queueing Network Decompositionand Facilities Planning.” Computer & Operations Research vol.12,no.1 (1985) pg. 1-16
Summary:This paper describes a network based facilities planning
optimization model. Two networks are formulated to created themodel; one for product, one for facility. Two transactionlevels are used; the aggregate between major nodes, detailedfor within major nodes.
The algorithm is analytical and therefore faster thantraditional simulation. However, it is also less detailed thansimulation.
Example:This paper uses the optimizing of a library facility as an
example. The MNET V network lanquaqe was used along withFortran V.
Application:The algorithm in this paper is probably not directly.
applicable to large scale problems encountered with thetoolroom design problem. The network formulation may provideinsight to the use of multiple networks to describe a singlefacility.
The paper was well documented, both on a theoretical andapplication experience level, it may provide leads to otherapproaches to the facility layout problem.
1.20

Appendix B
Other Applications
1.21

Shipbuilding
(1) Roper, Robert R. “The Shipbuilding Technology TransferProqram.” Levinqston Shipbuilding Company, Oranqe, TX. File
Brief Description:Levingston Shipbuilding Company has established a
Technology Transfer Program (TTP) with Ishikawajima HarimaHeavy Industries (IHI). The objective of the proqram is to (1)study IHI system, methods and techniques (2) compare practicesand identify their applicability to American Shipyards (3)implement chanqes. The TTP is a third of the way throuqh theproqram and has been researching in the areas of EnqineerinqDesiqn, Planning and Production, Quality Insurances, andIndustrial Enqineerinq. The utilization of computer-aid desiqn,standards, jiqs and fixtures, and accurate controls are a fewof the significant findings of discrepancies.
(2) White, Stephen G. and Keyte, James H. “ComputerizedShipboard Inventory Management: The STIMS Project”. MarineTechnology VO1.21, April 1984, pg. 170-5
Brief Description:The Sun Transport Company is a marine transporting
company. The company’s Materials Management department beqan aprocess to automate its inventory functions. The computersystem streamlines operations and also provides requiredmanagement inforamtion to Maintenance, Operations, and otherdepartments. The project focuses on shipboard inventorycontrol, restocking and spare part control, The computerprovides a process control system throuqh a data base, whereeach part is labeled with a numerical codinq system.
(3) Dr. Kuo, University of Strathclyde and Dr. MacCallum,university of Strathclyde. “Computer Aided Applications in ShipTechnology”. Computers in Industry. May 1984, pq. 211-219
Brief Description:The article is a very good overview of shipyard knowledqe
and computer applications. The computer applications are cross-referenced to specific journal in a very useful biblioqrapy.
1.22

Automotive
(4) Berqstorm, Rabin P. “Computer-Aided SQC Makes Impact onPontiac”. Manufacturing Enqineerinq, May 1985, pq. 71+
Brief Description:The Pontiac Motor Division has developed a computer-aided
qaqinq information and statistical quality contro1 (SQC)proqram. The system required an interface of mechanical qaqinqoperations and mini-computer production monitoring network atlocal levels. The system reduced, cost in scrap, warrantyclaims, operator inefficiency and eliminated lonqstatistical quality control paperwork because the systemthe problem at its source.
handspots
(5) Mullins, Peter. “Perkins Aims at Fully IntegratedManufacture inq”. Automotive Industry vol:164, January 1984, pq.32
Brief Description:Perkins produces diesel engine and has computerized most
facets of the company. Computer systems currently beinq usedinclude: Computer-Aided Design and Manufacturing, Data Basesystem linked to IBM, and ASPRO (Assembly Proqramminq). Thesystem was most rewardinq within the central computer systemsuch that information can be translated quickly for continousmonitoring of materials.
(6) “Advanced Manufactuinq Technology”. Toolinq and ProductionV01:50, September 1985, pg.96
Brief Description:Chrysler assembly plant is applyinq control systems by
using micro-processor based resistance welding controlsmanufactured by Medar Inc. Farminqton Hills, MI. The expectedbenefits are reduced downtime by helpinq maintenance personnelquickly pinpoint problems.
(7) Society of Automotive Enqineerinq. “Computer-AidedEnqineering :a Step Beyond”. Automotive Enqineering . V0l:92March 1984, pq. 30-3
Brief Description:A general article that describes how computers can assist
design efforts and manufactuinq. However, the article’s mainemphasis is on technology selection, which is rather useful.
1.23

Aerospace
(8) Whitinq, Frank T. “Computer Systems”. Astronauts andAerospace V01:21, December 1983, pg. 59+
Brief Description:The article describes a number of computer systems with
special interest in the computer-aided design systems. Uponadaption to the system, the biggest savinqs appear to come fromthe design revisions and data base. The data base allows quickretrieval of information and feedback on the design.
(9) “From Design to Flight, Computers Guide AerospaceIndustry”. Aviation Week and Space Technology V01:120 Auqust13,1984, pg. 89-148
Brief Description:Computer systems are integrated into controls, desiqn,
and inspection. The article discussed the CAD systems as beinquseful tools in simulating aircraft superstructure stress. Inaddition, the aerospace industry is increasing their use inmini-computers and micro-computers because of their growinqcapabilities.
Manufacturing
(l0) Advanced Manufacturing Technology. “Computer ProqramminqPays Off”. Tooling and Production V01:121 September 1984
Brief Description:Precise Tool and Mold Company, a manufacturing company for
the plastics industry, has used computers to assist in mold-makinq and developing NC tapes quickly and efficiently. Thearticle describes how they installed a computer qraphic systeminto a fairly small company.
(11) Quinian, Joseph C. “Flexible Assembly-manufacturinq’snewest frontier” Tool and Production V01:121 Septemer 1984 pq.33
Brief Description:The article defines three forms of robotics: cell,
flexible and FDS. It dicuss the benefits and cost ofrobotics and how a company may approach integrating suchequipment.
1.24

User’s Manual
2.1 Introduction
The following is the CATD User’s Manual for the IBM-AT
Computer and the IBM-PC with 8087 Co-Processor Chip. It will
provide the user with a step-by-step guide for operating the
computer and running the CATD proqram.
2.2 Operating the Computer
2.2.1 How To Get Started
(1) Turn on the power to the system unit by flippinq on
the red rocker switch which is located on the power strip. The
power strip is the plug-in device for the computer. The strip
is usually attached to the underneath side of the desk, or
behind the computer. If you have problems findinq the strip,
just follow the cord of the computer
switch will be lit when the system is
to the strip. The rocker
turned on.
(2) If the unit is already on, but the display or screen
is blank, turn the top knob to the right of the screen
clockwise.
2.1

knob
1
Screen
(3) Insert the disk containing the CATD executable into
the disk drive. Diskettes are loaded into the drive with the
label-side of the disk facing the liqht of the disk drive.
Turn the lever over the disk slot to secure the disk in the
drive.
Disk Drive
(4) The computer screen will display A:\> or C:\>, which
2.2
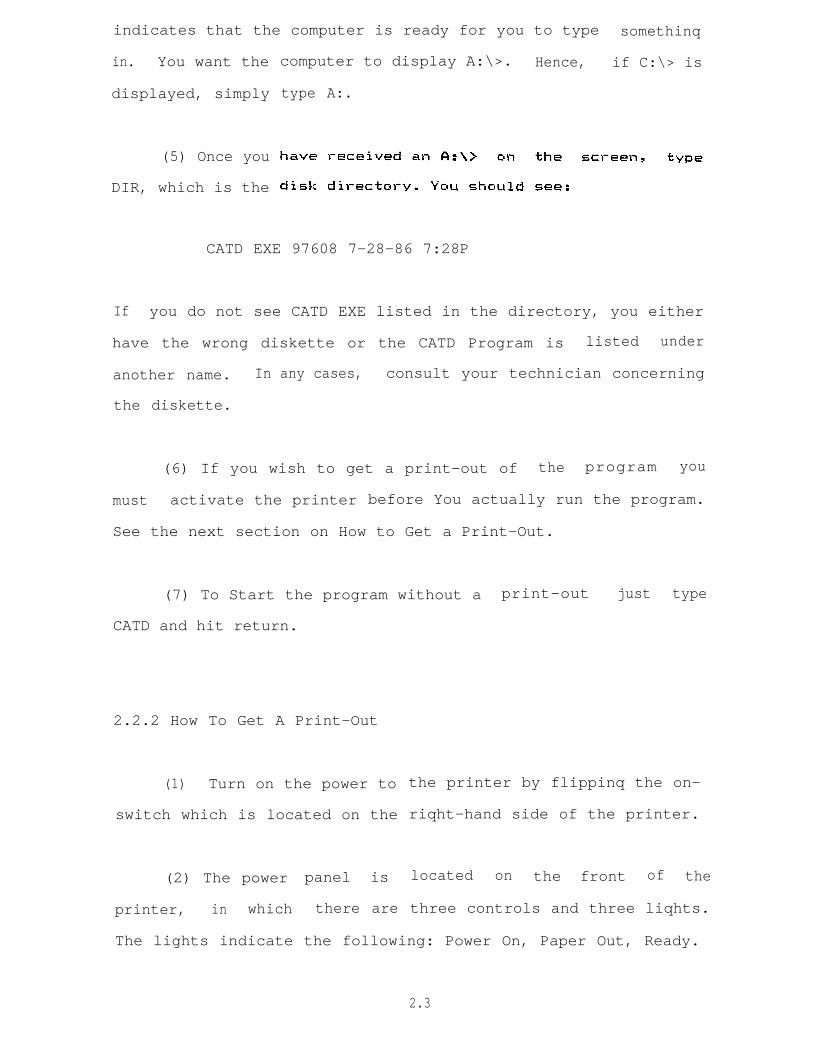
indicates that the computer is ready for you to type somethinq
in. You want the
displayed, simply
(5) Once you
DIR, which is the
computer to display A:\>. Hence, if C:\> is
type A:.
CATD EXE 97608 7-28-86 7:28P
If you do not see CATD EXE listed in the directory, you either
have the wrong diskette or the CATD Program is listed under
another name. In any cases, consult your technician concerning
the diskette.
(6) If you wish to get a print-out of the program you
must activate the printer before You actually run the program.
See the next section on How to Get a Print-Out.
(7) To Start the program without a print-out just type
CATD and hit return.
2.2.2 How To Get A Print-Out
(1) Turn on the power to
switch which is located on the
(2) The power panel is
printer, in which there are
the printer by flippinq the on-
riqht-hand side of the printer.
located on the front of the
three controls and three liqhts.
The lights indicate the following: Power On, Paper Out, Ready.
2.3

Printer
(3) Type CATD, but before hittinq the return, press the
Cntrl key and
return. At
the Prt Sc key simultaneously, and then hit
this. Point the printer will print all the
the screen until You inactivate the printer. A
display of the keyboard is shown on the next paqe.
Keyboard
2.4

(4) YoU should see the beginning of the program and hear
the printer running. If the printer is not operating, exit
from the Program and try typing CATD Cntrl PrtSc again. If you
have difficulties ask your technician for help. It is
possible that the printer is not workinq correctly.
(5) After you are throuqh usinq the proqram, press Cntrl
and PrtSc keys to stop the printer.
(6) TO get the paper out of the printer, press the paper
cut button on the power panel of the printer.
2.3 Running the Program
2.3.1 Entering Data
Once YOU have the CATD proqram started, the program will
prompt You for all the needed input. The followinq section
shows you how to enter Your data into the program.
The program will ask You to choose one of the following
options:
1- TOOLROOM STATISTICS
2- TOOLROOM ECONOMICS
3- OPTIMAL LOCATION
2.5

—
The first option gives statistical serving or queueing
information for the toolroom. The second option finds the cost
of Serving each toolroom. Lastly, the third option determines a
best location for the toolroom.
The screen will next display:
INTEGER
ENTER :
The ENTER prompts you for an input. The INTEGER indicates
that the number you type in
exclude the decimal point.
option two and typed in 2.0
display:
must be a whole number, therefore
For example, if you were to choose
instead of 2, the screen would
***ERROR***MISTYPED DATA
1- TOOLROOM STATISTICS
2- TOOLROOM ECONOMICS
3- OPTIMAL LOCATION
INTEGER
ENTER :
The program qives you your options again and prompts you for
an input. Hence, YoU must type l,2,or 3.
After- each input, the computer displays:
ENTER 1 TO CORRECT ELSE <RETURN> TO CONTINUE
This statement allows YoU to change the data You just entered.
Suppose you choose option two , and therefore typed in 2.
However, you realized that YoU made a mistake and wanted
option one. YoU would simply type a 1 after this command and
the program would list your options again. If you wish not to
make any chanqes just hit return and go on to the next input
statement.
After choosing an option, the program will ask You:
2.6

INPUT THE NUMBER OF TOOLROOMS
INTEGER
ENTER :
Type in the number of toolrooms you want to analyze. The
program can handle ten different toolrooms, So You should
enter a whole number between 1 and 10.
The program will ask you questions Concerninq each
toolroom:
INPUT THE NAME OF TOOLROOM #1:
CHARACTER
ENTER S
The CHARACTER ENTER tells you that the computer wants
alphabetic input. The computer can hold 20 letters. Hence,
if you type more than 20 letters, the name will be trunaicated
after 20 letters. If the first toolroom is called
type TRACK-3. The Computer will
first toolroom or track-3:
INPUT THE FOLLOWING
NUMBER OF WINDOWS
INTEGER
ENTER :
YOU WOUld type in the number O f
ask YOU questions
DATA FOR TRACK-3
remembering tht integer indicates a whole
will next be asked to input:
NUMBER OF ATTENDANTS
INTEGER
ENTER :
Again, just enter the appropriate data, and
the computer will display:
MEAN SERVICE
in the
track-3,
about the
number input. you
hit return. Next ,
2.7

REAL
ENTER :
This input request is different than the previous request in
the respect that the program is asking for a real number input.
This means that a decimal number is expected. For example, if
the mean service rated is 1.48, YoU must type 1.48. If you
were to type 148, the program would not give You an error
messaqe. However? you would be entering in misleading data,
since 1.48 is not equal to 148.
Finally, YoU will be asked to enter the mean arrival rate.
Just enter the your data, keeping in mind what type of data is
to be inputted: integer, real, or character. This is the
minimum amount of input required to run the first option. If
you had chosen option one, the program would print out the
statistical data for each toollroom. After the print out of
each tooroom the computer will ask:
CHOOSE THE FORM TO DISPLAY P(N)
1- TABLE
2- CHART
The first option will give you a listing of the probability of
the number of units in the service area. The second option
prints out a bar graph of the probability.
After all the statistical data is printed out the computer
will display:
ENTER ONE OF THE FOLLOWING TO:
1- CONTINUE WITH THE MODEL
2- RETURN TO STARTUP MENU
3- QUIT
The first option will give YoU the statistical data again with
your option of display. The second option will return YoU the
2.8

to beqinning of the program. The third option will exit you
from the proqram. If You choose to start the program again to
analyze the economics or optimal location
program will save the data You have
Computer will display:
THE NUMBER OF TOOLROOMS IS
of the toolroom, the
already entered. The
2.
ENTER 1 To CORRECT ELSE <RETURN> TO CONTINUE
If the data is incorrect or you wish to change the data? type a
1. The proqram will ask YoU to enter the correct input:
INPUT THE NUMBER OF TOOLROOMS
INTEGER
ENTER :
The proqram will ask you various
toolroom dependinq on what options, you
questions about each
choose. The following
is a list of data requirements for the different options:
*
*
*
*
*
*
*
*
*
All 0ptions
Number of Toolrooms
Name of Toolrooms
For Each Toolroom:
Number of Attendants
Mean Service Rate
Mean Arrival Rate
Option TWo
Number of Service Areas
Names of the Service Areas
Distances between Service Area and Toolroom
Buildinq Cost
2.9
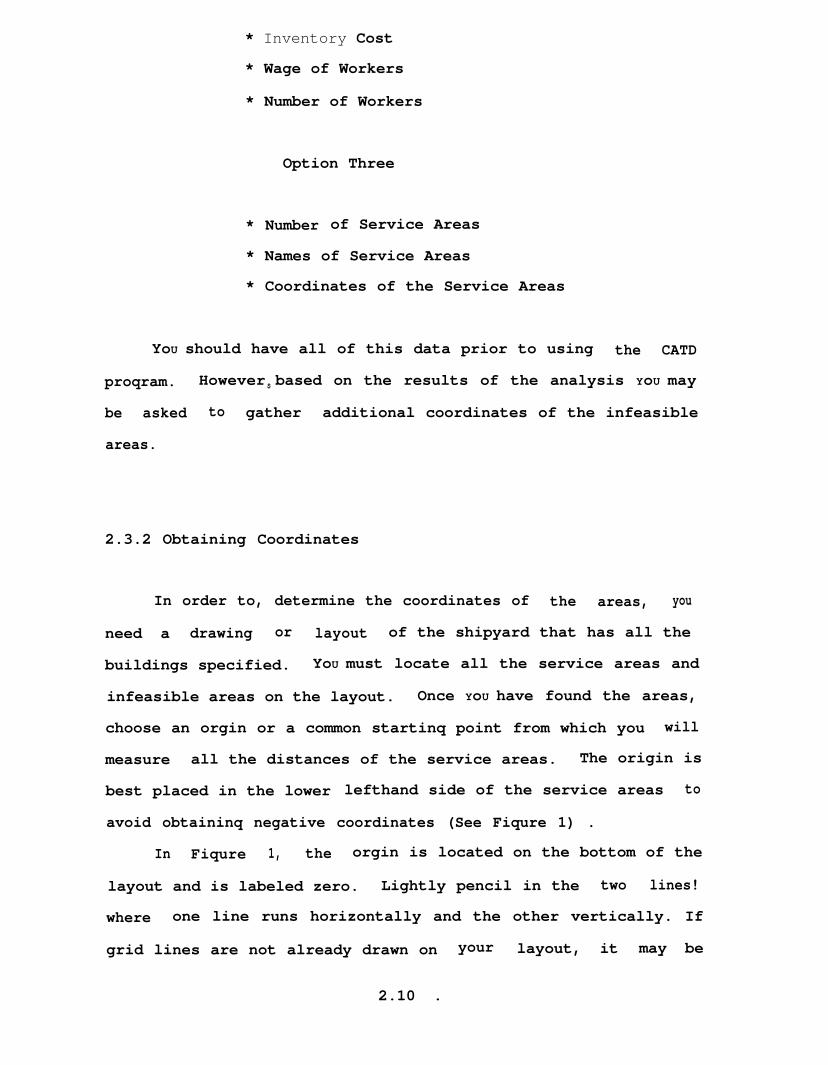
* Inventory Cost
* Wage of Workers
* Number of Workers
Option Three
* Number of Service Areas
* Names of Service Areas
* Coordinates of the Service Areas
YoU should have all of this data prior to using the CATD
proqram. However $ based on the results of the analysis YoU may
be asked to gather additional coordinates of the infeasible
areas.
2.3.2 Obtaining Coordinates
In order to, determine the coordinates of the areas, you
need a drawing or layout of the shipyard that has all the
buildings specified. YoU must locate all the service areas and
infeasible areas on the layout. Once YoU have found the areas,
choose an orgin or a common startinq point from which you will
measure all the distances of the service areas. The origin is
best placed in the lower lefthand side of the service areas to
avoid obtaininq negative coordinates (See Fiqure 1) .
In Fiqure 1, the orgin is located on the bottom of the
layout and is labeled zero. Lightly pencil in the two lines!
where one line runs horizontally and the other vertically. If
grid lines are not already drawn on your layout, it may be
2.10 .


advisable to pencil the grid lines in for scaling purposes. I n
this examples the
feet in distance.
which establishes
also establish the
grid lines are 1 inch apart representing 200
The scale to right indicates that 1“=200
the dimensions of grid lines. YoU should
Your layout. In figure 1,
was found by labeling the
measuring the distances.
The following section is a tutorial from an actual
session. It may be helpful to use this tutorial as a visual
aid during your first sessions with the CATD.
2.12


MEAN SERVICE RATEREALENTER :1.25
ENTER 1 TO CORRECT ELSE! < RETURN> TO CONTINUE
MEAN ARRIVAL RATEREALENTER :201
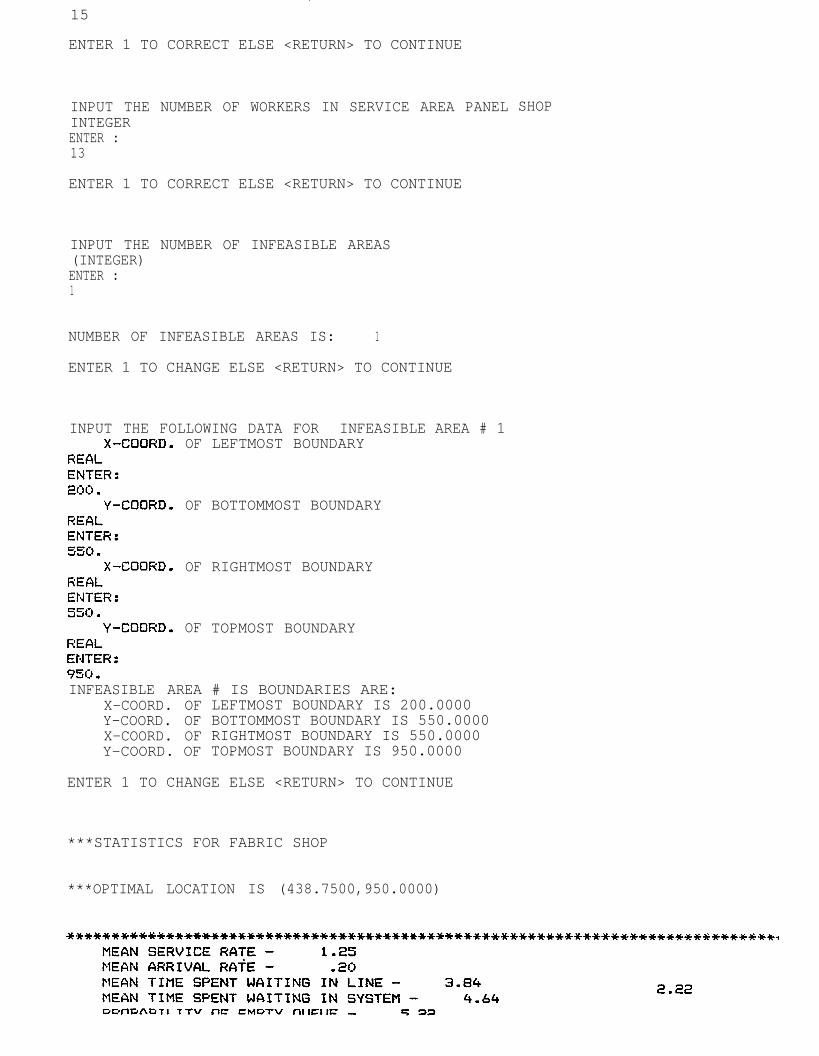
***STATISTICS FOR FABRIC SHOP
*****************************************************************************MEAN SERVICE RATE - 1.25MEAN ARRIVAL RATE - .20MEAN TIME SPENT WAITING IN LINE – 3.84MEAN TIME SPENT WAITING IN SYSTEM - 4.64PROBABILITY OF EMPTY QUEUE - 5.22UTILIZATION FACTOR – 16EXPECTED NUMBER OF UNITS IN SYSTEM - .93MEAN LENGTH OF QUEUE – .77
*******************************************************************************
NUMBER OF UNITS PROBABILITY OF OCCURRENCE
ENTER ONE OF1 -2 -3 -
INTEGERENTER :
2PLEASE ENTER
83921349
.01217
.0035
.0006
THE FOLLOWING TO:CONTINUE WITH MODELRETURN TO STARTUP MENUQUIT
THE APPROPRIATE INTEGERTO CHOOSE ONE OF THE FOLLOWING OPTIONS
1 – TOOLROOM STATISTICS2 - TOOLROOM ECONOMICS3 - OPTIMAL LOCATIONS
INTEGERENTER:2

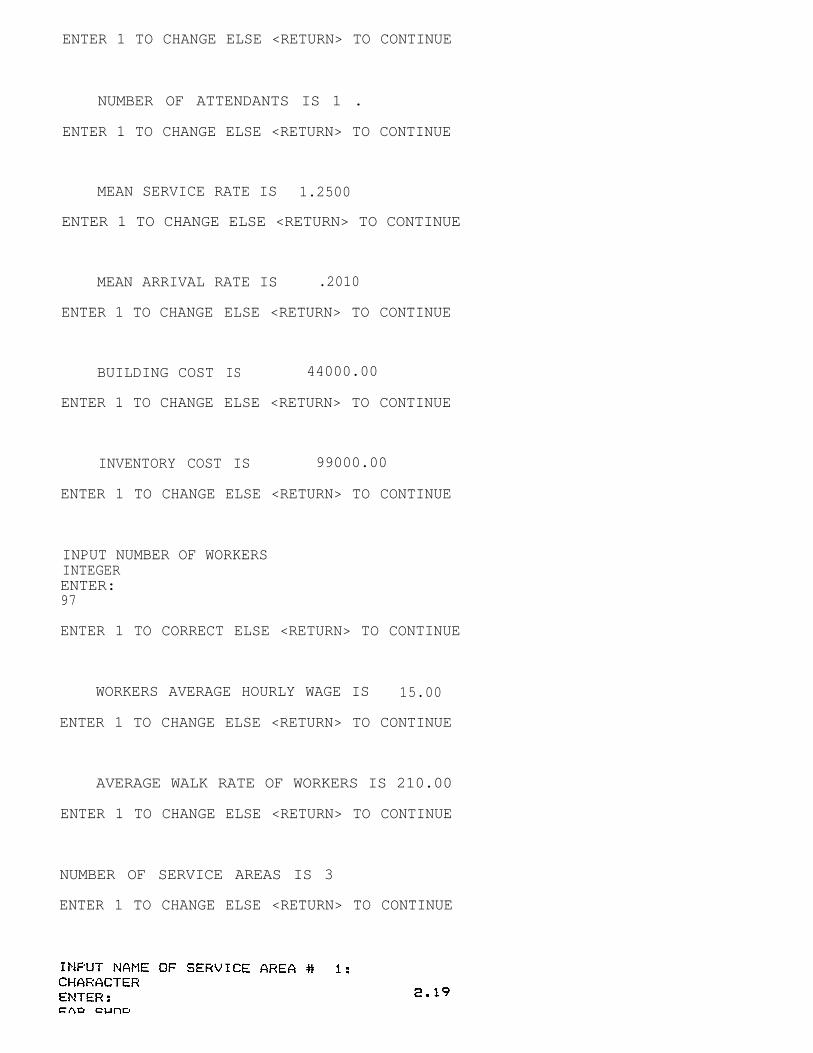
CURRENT NUMBER OF TOOLROOMS IS 1
ENTER A 1 TO CHANGE ELSE <RETURN> TO CONTINUE
TOOLROOM NAME IS FABRIC SHOP
ENTER 1 TO CHANGE ELSE <RETURN>. TO CONTINUE
lNPUT THE FOLLOWING DATA FOR FABRIC SHOP
NUMBER
ENTER 1 TO
NUMBER
ENTER 1 TO
OF WINDOWS IS 2
CHANGE ELSE <RETURN> TO CONTINUE
OF ATTENDANTS IS 1
CHANGE ELSE <RETURN> TO CONTINUE
MEAN SERVICE RATE IS 1.2500
ENTER 1 TO CHANGE ELSE <RETURN> TO CONTINUE
MEAN ARRIVAL RATE IS .2010
ENTER 1 TO CHANGE ELSE <RETURN> TO CONTINUE
BUILDING COSTREALENTER :44000.
ENTER 1 TO CORRECT ELSE <RETURN> TO CONTINUE
INVENTORY COSTREALENTER :99000.
ENTER 1 TO CORRECT ELSE <RETURN> TO CONTINUE

ENTER 1 TO CORRECT ELSE <RETURN> TO CONTINUE
AVERAGE WALK RATE OF WORKERSREALENTER :21O.
ENTER 1 TO CORRECT ELSE <RETURN> TO CONTINUE
INPUT NUMBER OF SERVICE AREASI N T E G E R ENTER :3
ENTER 1 TO CORRECT ELSE <RETURN> TO CONTINUE
INPUT NAME OF SERVICE AREA # 1:CHARACTERENTER :FAB SHOP
ENTER 1 TO CORRECT ELSE <RETURN> TO CONTINUE
INPUT NAME OF SERVICE AREA # 2:CHARACTERENTER:SHELL SHOP
ENTER 1 TO CORRECT ELSE <RETURN> TO CONTINUE
INPUT NAME OF SERVICE AREA # 3:CHARACTERENTER :PANEL SHOP
ENTER 1 TO CORRECT ELSE <RETURN> TO CONTINUE
INPUT THE AVERAGE NUMBER OF WORKERS THAT USE FABRIC SHOPREALENTER :97.
ENTER A 1 TO CORRECT ELSE <RETURN> TO CONTINUE
ENTER THE AVERAGE DISTANCE BETWEEN:TOOLROOM: FABRIC SHOPSERVICE AREA:FAB SHOPREALENTER :800.

ENTER 1 TO CORRECT ELSE <RETURN> TO CONTINUE
TOOLROOM: FABRIC SHOPSERVICE AREA:SHELL SHOPREALENTER :400.
ENTER 1 TO CORRECT ELSE <RETURN> TO CONTINUE
TOOLROOM: FABRIC SHOPSERVICE AREA:PANEL SHOPREALENTER:450.
ENTER 1 TO CORRECT ELSE <RETURN> TO CONTINUE
***STATISTICS FOR FABRIC SHOP
CHOOSE THE FORM TO DISPLAY P(N)1 - TABLE2 - CHART
FLOT OF P(N) - PROBABILITY OF N UNITS IN SYSTEM

4
UNITS
COST FOR ALL TOOLROOMS - 163655.60******************************************************************************
ENTER ONE OF1 -2 -3 -
INTEGERENTER :
2PLEASE ENTER
THE FOLLOWING TO:CONTINUE WITH MODELRETURN TO STARTUP MENUQUIT
THE APPROPRIATE INTEGERTO CHOOSE ONE OF THE FOLLOWING OPTIONS
1 – TOOLROOM STATISTICS2 - TOOLROOM ECONOMICS3 - OPTIMAL LOCATIONS
INTEGERENTER :3
CURRENT NUMBER OF TOOLROOMS IS 1
ENTER A 1 TO CHANGE ELSE <RETURN> TO CONTINUE
TOOLROOM NAME IS FABRIC SHOP
ENTER 1 TO CHANGE ELSE <RETURN> TO CONTINUE
INPUT THE FOLLOWING DATA FOR FABRIC SHOP
NUMBER OF WINDOWS IS 2 2.18
ENTER 1 TO CHANGE ELSE <RETURN> TO CONTINUE
NUMBER OF ATTENDANTS IS 1 .
ENTER 1 TO CHANGE ELSE <RETURN> TO CONTINUE
MEAN SERVICE RATE IS 1.2500
ENTER 1 TO CHANGE ELSE <RETURN> TO CONTINUE
MEAN ARRIVAL RATE IS .2010
ENTER 1 TO CHANGE
BUILDING COST
ENTER 1 TO CHANGE
ELSE <RETURN> TO CONTINUE
IS 44000.00
ELSE <RETURN> TO CONTINUE
INVENTORY COST IS 99000.00
ENTER 1 TO CHANGE ELSE <RETURN> TO CONTINUE
INPUT NUMBER OF WORKERSINTEGERENTER: 97
ENTER 1 TO CORRECT ELSE <RETURN> TO CONTINUE
WORKERS AVERAGE HOURLY WAGE IS 15.00
ENTER 1 TO CHANGE ELSE <RETURN> TO CONTINUE
AVERAGE WALK RATE OF WORKERS IS 210.00
ENTER 1 TO CHANGE ELSE <RETURN> TO CONTINUE
NUMBER OF SERVICE AREAS IS 3
ENTER 1 TO CHANGE ELSE <RETURN> TO CONTINUE

.
ENTER 1 TO CORRECT ELSE <RETURN> TO CONTINUE
INPUT THE FOLLOWING DATA FOR SERVICE AREA: FAB SHOP
X-COORD. OF LEFTMOST BOUNDARYREALENTER :150.
Y-COORD. OF BOTTOMMOST B0UNDARYREALENTER :1050.
X-COORD. OF RIGHTMOST BOUNDARYREALENTER :600.
Y-COORD. OF TOPMOST BOUNDARY REAL
ENTER :1700.
ENTER 1 TO CORRECT ELSE <RETURN>
INPUT NAME OF SERVICE AREA # 2:CHARACTERENTER :SHELL SHOP
ENTER 1 TO CORRECT ELSE <RETURN>
TO CONTINUE
TO CONTINUE
INPUT THE FOLLOWING DATA FOR SERVICE AREA: SHELL SHOP
X-COORD.REALENTER :825.
Y-COORD.REALENTER :800 .
X-COORD.REALENTER :1000.
LEFTMOST BOUNDARY
BOTTOMMOST BOUNDARY
RIGHTMOST BOUNDARY
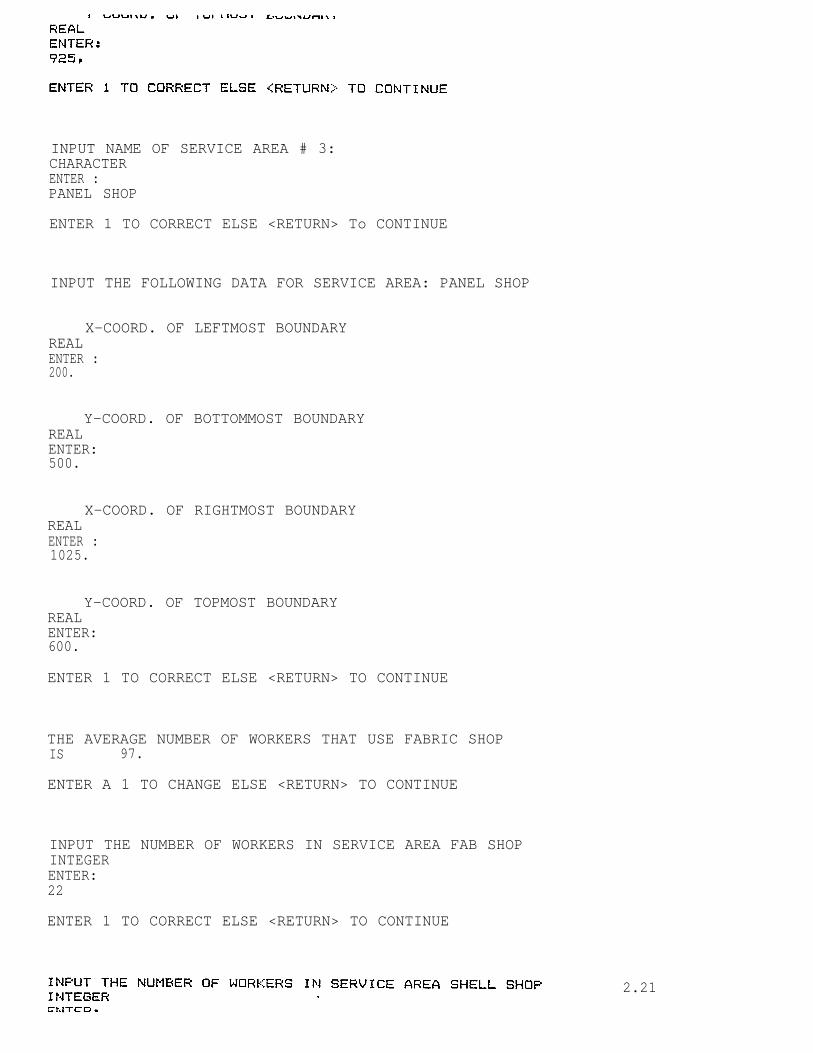
INPUT NAME OF SERVICE AREA # 3:CHARACTERENTER :PANEL SHOP
ENTER 1 TO CORRECT ELSE <RETURN> To CONTINUE
INPUT THE FOLLOWING DATA FOR SERVICE AREA: PANEL SHOP
X-COORD. OF LEFTMOST BOUNDARYREALENTER :200.
Y-COORD. OF BOTTOMMOST BOUNDARYREALENTER:500.
X-COORD. OF RIGHTMOST BOUNDARYREALENTER :1025.
Y-COORD. OF TOPMOST BOUNDARYREALENTER:600.
ENTER 1 TO CORRECT ELSE <RETURN> TO CONTINUE
THE AVERAGE NUMBER OF WORKERS THAT USE FABRIC SHOPIS 97.
ENTER A 1 TO CHANGE ELSE <RETURN> TO CONTINUE
INPUT THE NUMBER OF WORKERS IN SERVICE AREA FAB SHOPINTEGERENTER:22
ENTER 1 TO CORRECT ELSE <RETURN> TO CONTINUE
2.21
.15
ENTER 1 TO CORRECT ELSE <RETURN> TO CONTINUE
INPUT THE NUMBER OF WORKERS IN SERVICE AREA PANELINTEGERENTER :13
ENTER 1 TO CORRECT ELSE <RETURN> TO CONTINUE
INPUT THE NUMBER OF INFEASIBLE AREAS(INTEGER)ENTER :1
NUMBER OF INFEASIBLE AREAS IS: 1
ENTER 1 TO CHANGE ELSE <RETURN> TO CONTINUE
INPUT THE FOLLOWING DATA FOR INFEASIBLE AREA # 1OF
OF
OF
OF
INFEASIBLE AREAX-COORD. OFY-COORD. OFX-COORD. OFY-COORD. OF
LEFTMOST BOUNDARY
BOTTOMMOST BOUNDARY
RIGHTMOST BOUNDARY
TOPMOST BOUNDARY
# IS BOUNDARIES ARE:LEFTMOST BOUNDARY IS 200.0000BOTTOMMOST BOUNDARY IS 550.0000RIGHTMOST BOUNDARY IS 550.0000TOPMOST BOUNDARY IS 950.0000
ENTER 1 TO CHANGE ELSE <RETURN> TO CONTINUE
***STATISTICS FOR FABRIC SHOP
***OPTIMAL LOCATION IS (438.7500,950.0000)
SHOP

CHOOSE THE FORM TO DISPLAY P(N)1 - TABLE2 - CHART
1
NUMBER OF UNITS PROBABILITY OF OCCURRENCE
1 .8392 2 .13493 .02174 .00355 .0006
ALL TOOLROOM
ENTER ONE OF1 -2 -3 -
INTEGERENTER :
3Pause.Please press
LOCATIONS ARE OPTIMAL
THE FOLLOWING TO:CONTINUE WITH MODELRETURN TO STARTUP MENUQUIT
<return> to continue.
2.23

2.4 Interpreting the Results
Once YOU have run the program it is important to
interpret the output data. If You are analyzing the optimal
location of a present toolroom, the user should compare the
cost of queuing for the optimal toolroom and the present
toolroom to estimate the possible savings. If you are
evaluating the feasibility of an additional toolroom, you
should note the Cost of queuinq for each alternative.
2.24

3.1 Introduction
This is the CATD Technical Manual. Its purpose is to
provide the details necessary to maintain and upgrade the
CATD program. The intended audience for this manual is a
person with a few years of software experience knows
FORTRAN77 and familiar with running and developing software on
microcomputers.
The CATD tool is to be used as an aid for choosing
optimal locations of toolrooms in a shipyard. Its limitations
should be understood since the results of the program can be
no better than the inputted data.
3.1

and reduce the numbers of errors that can surface durinq test
and debug periods and later during maintenance. They improve
the probability that the software will perform as required.
The writing of the software consisted of three phases:
requirements design, and code. Each of these phases use
different aspects of structured methods and are described in
the following sections.
3.2.1 Requirements
The use of structured analysis methods assist in
defining the problem and its solution. The designer must
first consider the overall function of the system. In this
case, the function of the system would be choosing optimal
toolroom locations. After the function of the system has been
determined, the system can be broken into sub-systems. These
sub-systems should put similiar items into blocks. For this
reason, the system has been broken into five blocks or
modules: (1) Get Valid Input (2) Set Up Shipyard Model (3) Do
Queuing Theory (4) Calculate Cost of Shipyard Model (5) Output
Shipyard Model, and Statistics. Each of these modules can be
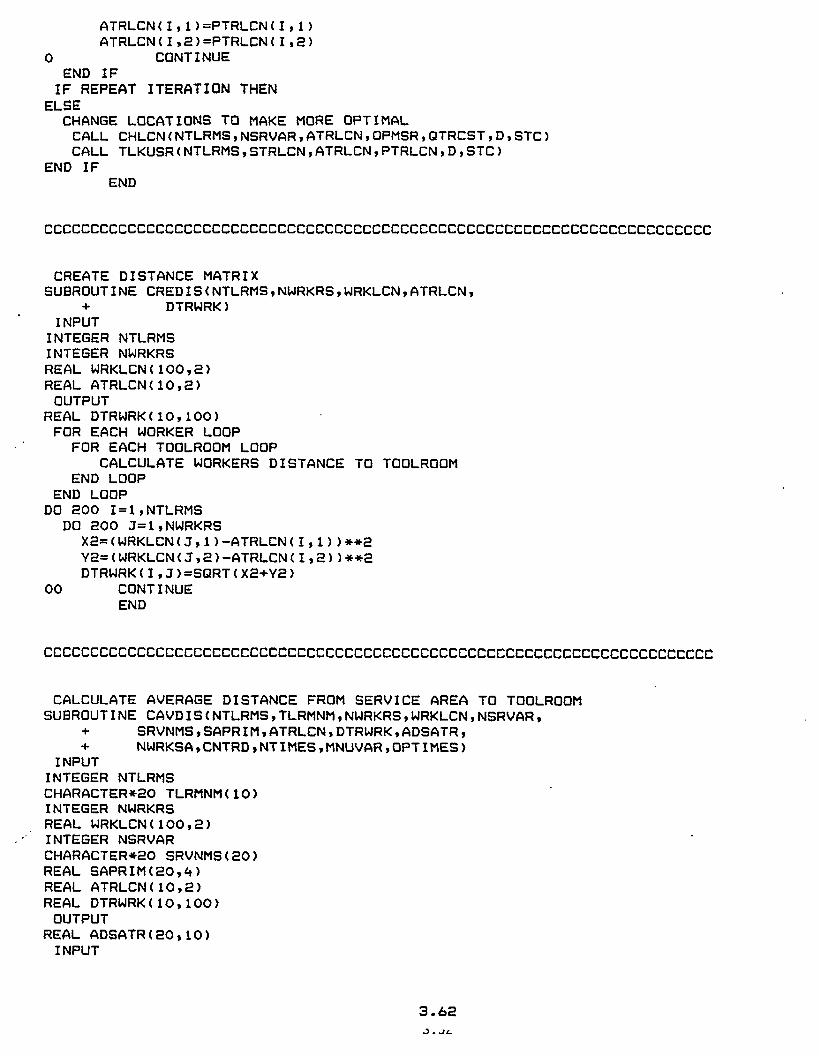
broken down further and further until a simple function is
processed.
To limit the complexity of each module, the modules are
refined into even sma1ler modules that serve only one
function. Upon establishing what modules are required to
serve each sub-system, data flow diagrams are used to show the
flow of data through the system. In Appendix A, you will find
data flow diagrams for the entry system and for each sub-
3.2

system. In addition you will see a data dictionary which
clarifies the abbreviated names of the data. Decomposition of
the data flow diagram levels the design allowinq the designer
to portray the system at various levels of detail. This
decomposition prevents overly busy diagrams and aids in
quickly grasping what is going on in the system.
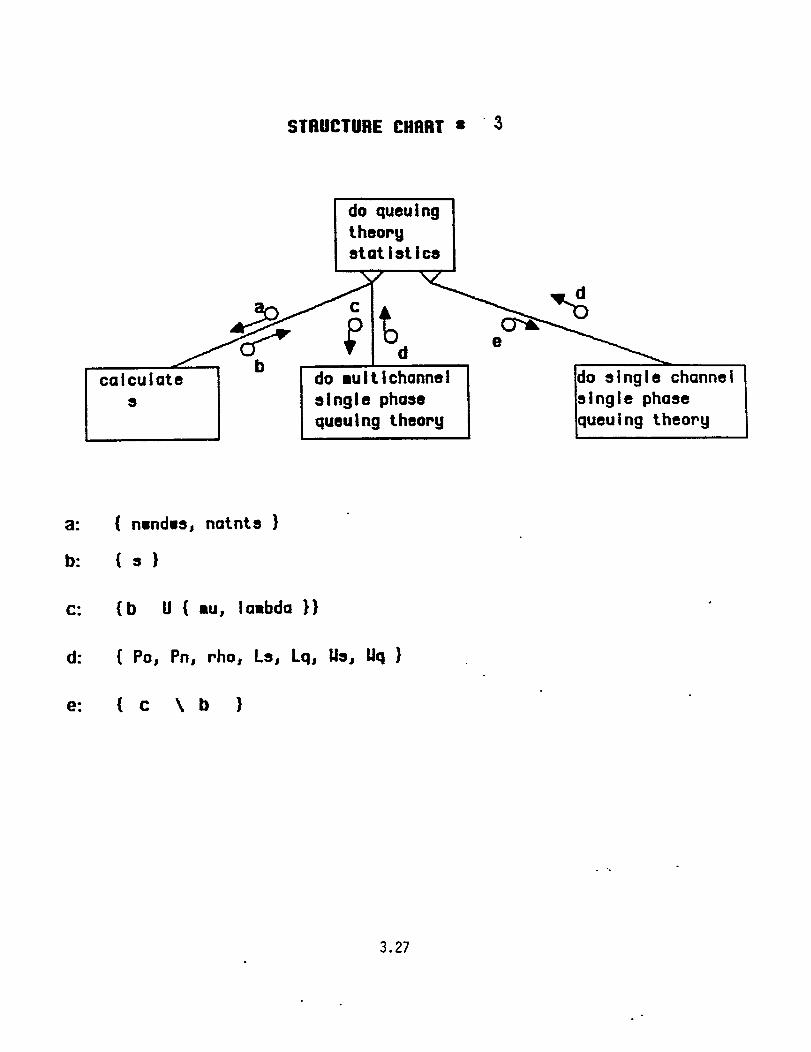
3.2.2 Design
The use of structured design methods assist in
transforming the data flow diagrams that represent the concept
of a system into the code. During this phase, data flow
diagrams are transformed into structured charts. The
structured charts are enclosed in Appendix B. From the flow
diagrams, the designer is able to see the data dependency of
each sub-system and its modules. Hence, control
characteristic can be uncovered and help define interfaces
between the modules.
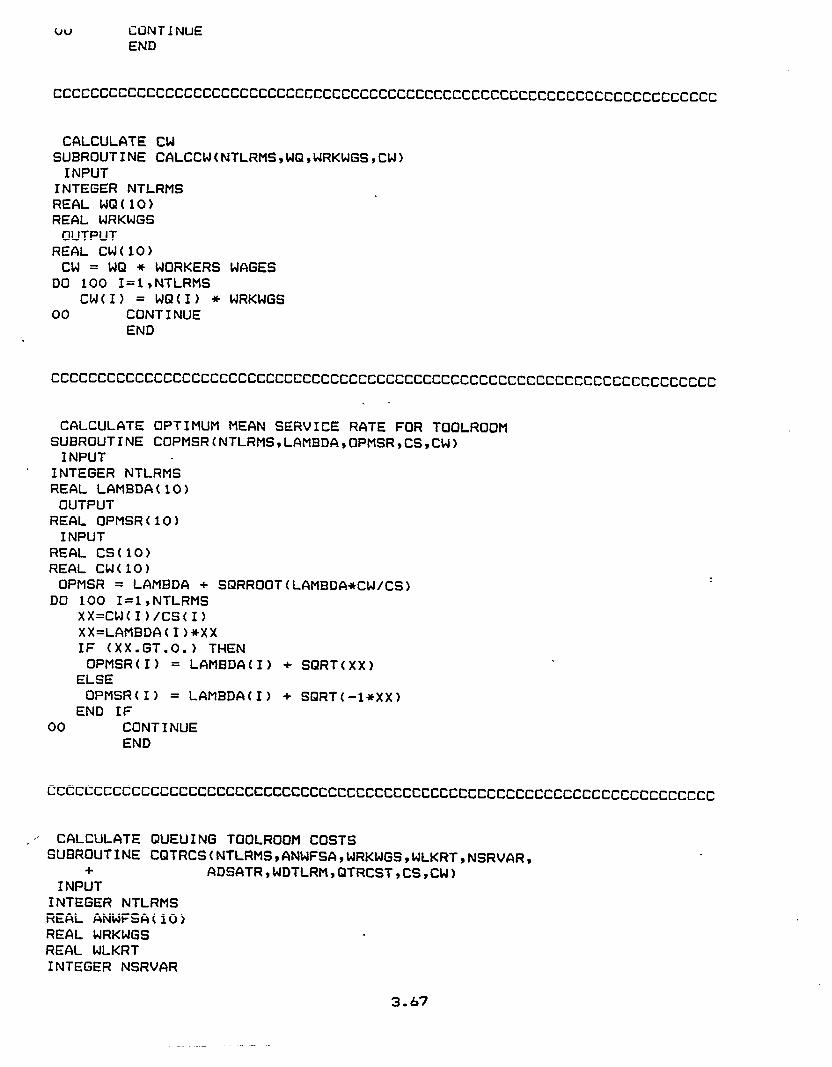
3.2.3 Code
Once the structured charts are drawn, a psuedo-language
format is first used to develop code. The designer describes
each module depicted in the structured charts using the
psuedo-code. This phase is found in Appendix C, and is
referred to as process specification. The process
specification outlines the algorithm of the system, where the
order of the modules are determined by the structured charts.
3.3

After the algorithm is developed the psuedo-code is
translated into the target language in this cases, Fortran77.
Each part of the algorithm must be translated into a group of
Fortran statements. The final code is included in Appendix D,
where each module is documented for clarity.
3.3 Correcting a Discovered Error
While structured methodolgies decrease the chance of bugs
occurring, they cannot completely prevent their occurrence.
When an error is discovered, the technician has various ways
to approach the problem depending on the type of bug and the
tools available for debugginq. If a symbolic debugger is
available, the error can be traced relatively easily. Without
such a too l, adding write statements to output variables at
different steps in the program can be used. When the reason
for the error is discovered, the technician should correct the
error and document its correction. It may be necessary to
change the structured charts, the data flow diagrams, and/or
the process specifications depending on the severity of the
error.
When it becomes necessary to tailor the program for
particular needs or enhance the program to increase its
applicability, one must begin with the data flow diagrams. It
is strongly suggested that the person responsible for

Insert the change
note any changes to
this design change
of dependent data
into the previous data flow diagrams, and
the levelinq of the system. (4) Carry
through the structured charts. (5) Beware
modules and interface the modules
accordingly. (6) Carry this design change through the process
specifications and finally, Fortran77. It is advisable that
the actual code be the last thing changed in this situation.
Tampering with an involved system carelessly could lead
to errors that are difficult to detect.
3.5 Data
Prior to using the CATD program, toolroom data needs to
be gathered. The data can be broken into four categories:
financial, travel, worker and queueing information. Care must
be taken when gathering data to avoid misleading results of
the program.
3.5.1 Financial Information
The financial data primarily consist of building and
inventory cost of each toolroom. Also, any possible
expansions to the toolroom should be documented. In addition,
the average salary of the workers should be determined for
each toolroom, including fringe benefits.
3.5

3.5.2 Travel Information
The travel data is based on the distances between the
toolroom and each service area. You should keep all distance
measurements consistent, in which rounding to the nearest tens
of feet or meters is acceptable. Include the average walking
time of a normal worker, where allowances for fatigue,
personal and delay factors should be considered. The walking
rate will be in units of distance/time or feet/second.
3.5.3 Worker Information
The average number of workers or customers who are
serviced in the toolroom during one day should be recorded.
Depending on the traffic in the toolroom, the queuing study
and the number of customers being served could be tabulated
at the same time.
A queueing study should be performed for each toolroom,
This is most easily done by the attendant and a stopwatch.
The attendant needs to record the following: (1) Arrival Time
at the Toolroom (2) Arrival Time at the Window (3) Departure
Time from the window (4) (origin of the Customer. Again, if
3.6

all of the customers who enter the tool room can be recorded,
the queuing study and number of customers being serviced can
be done at the same time. Once enough data is processed, the
average number of persons arriving at the window per minute
can be determined for the model. The model assumes that
arrivals are randomly distributed, which characterizes a
Poisson distribution. Hence, the average arrival rate and
mean service rate are the only rates needing to be calculated.
3.7

Appendix A
Data Flow Diagrams
Data Dictionary
3.8


Structured Charts
3.22


Appendix C
Process Specification
3.33


Appendix D
Final Code
3.39

COMPUTER TOOL FOR CHOOSING TOOLROOM LOCATIONSPROGRAM MAINSWITCHES 1 PRINT BANNER + 4 DELETE AFTER PRINTING + 16 PRINT PAGEHEADERS + 64 APPEND A FINAL FORM QUEUE
PROGRAM MAIN(SWITCHES=85)
INTEGER NTLRMSCHARACTER*20 TLRMNM(10)INTEGER NWNDWS( 10),NATNTS(1O)REAL MU(10),LAMBDA(1O)REAL STRLCN(10,2)REAL BLDCST( 10),INVCST(1O)REAL ANWFSA( 10),ATNWGS(1O)REAL YRDPRM(4)INTEGER NWRKRSREAL WRKLCN(1OO,2)REAL WRKWGSREAL WLKRTINTEGER NSRVARCHARACTER*2O SRVNMS(20)REAL SAPRIM(20,4)
REAL WQ(lO),WS( 1O),PO(1O)REAL PN(5O,1O)REAL RHO(lO),LS(1O),LQ(1O)REAL ATRLCN(10,2)REAL DTRWRK(10,1OO)REAL ADSATR(2O,1O)REAL WDTLRM(10)REAL OPMSR(10)REAL QTRCST(10)REAL TTRCST(10)REAL TOTCSTREAL CS(10),CW(1O)INTEGER NWRKSA(20)REAL CNTRD(20,2)REAL PTRLCN(10,2)INTEGER NTIMESINTEGER QUITITINTEGER MNUVARINTEGER OPTIMES
DISPLAY ACTIVITY
WRITE(*,l)
OPTION MENU
FORMAT(////,lX,80(’*’ ),//,33X,’***CATD***’ ,//,8O(’*’),////)
OPTIMES = 1WRITE(*,3)FORMAT(lX,’PLEASE ENTER THE APPROPRIATE INTEGER’)
WRITE(*,4)FORMAT(2X,’TO CHOOSE ONE
WRITE(*,5)FORMAT(1OX,’1 - TOOLROOM
WRITE(*,6)FORMAT(1OX,’2 - TOOLROOM
OF THE FOLLOWING OPTIONS’)
STATISTICS’ )
ECONOMICS’)
3.40

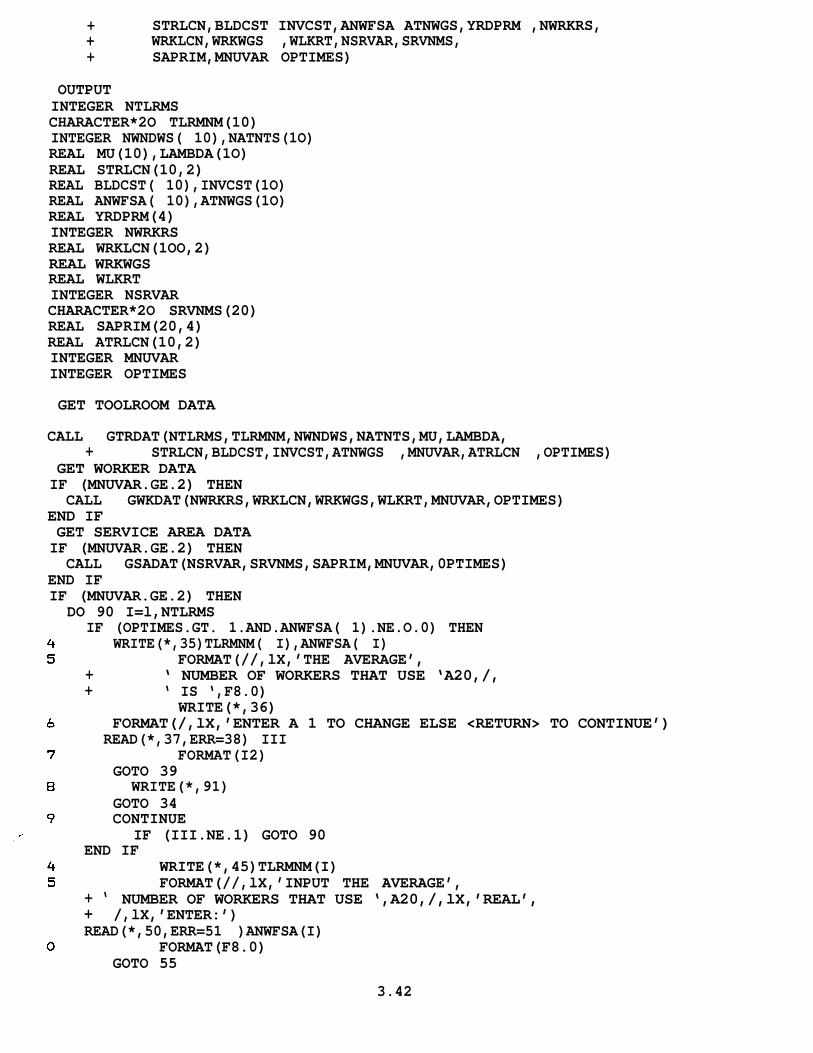
+ STRLCN,BLDCST INVCST,ANWFSA ATNWGS,YRDPRM ,NWRKRS,+ WRKLCN,WRKWGS ,WLKRT,NSRVAR,SRVNMS,+ SAPRIM,MNUVAR OPTIMES)
OUTPUTINTEGER NTLRMSCHARACTER*2O TLRMNM(10)INTEGER NWNDWS( 10),NATNTS(1O)REAL MU(10),LAMBDA(1O)REAL STRLCN(10,2)REAL BLDCST( 10),INVCST(1O)REAL ANWFSA( 10),ATNWGS(1O)REAL YRDPRM(4)INTEGER NWRKRSREAL WRKLCN(1OO,2)REAL WRKWGSREAL WLKRTINTEGER NSRVARCHARACTER*2O SRVNMS(20)REAL SAPRIM(20,4)REAL ATRLCN(10,2)INTEGER MNUVARINTEGER OPTIMES
GET TOOLROOM DATA
CALL GTRDAT(NTLRMS,TLRMNM,NWNDWS,NATNTS,MU,LAMBDA,+ STRLCN,BLDCST,INVCST,ATNWGS ,MNUVAR,ATRLCN ,OPTIMES)
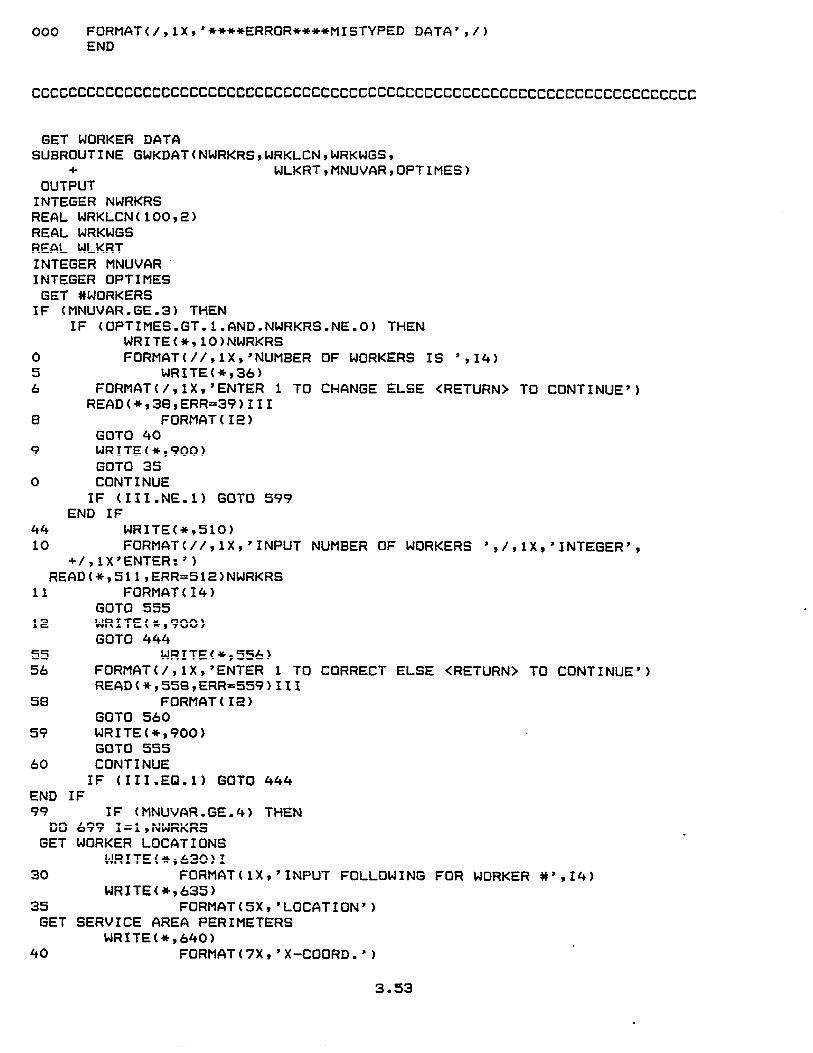
GET WORKER DATAIF (MNUVAR.GE.2) THENCALL GWKDAT(NWRKRS,WRKLCN,WRKWGS,WLKRT,MNUVAR,OPTIMES)
END IFGET SERVICE AREA DATAIF (MNUVAR.GE.2) THENCALL GSADAT(NSRVAR,SRVNMS,SAPRIM,MNUVAR,0PTIMES)
END IFIF (MNUVAR.GE.2) THENDO 90 I=l,NTLRMS
IF (OPTIMES.GT. 1.AND.ANWFSA( 1).NE.O.0) THENWRITE(*,35)TLRMNM( I),ANWFSA( I)
FORMAT(//,lX,’THE AVERAGE’,+ ‘ NUMBER OF WORKERS THAT USE ‘A20,/,+ ‘ IS ‘,F8.0)
WRITE(*,36)FORMAT(/,lX,’ENTER A 1 TO CHANGE ELSE <RETURN> TO CONTINUE’)
READ(*,37,ERR=38) IIIFORMAT(I2)
GOTO 39WRITE(*,91)
GOTO 34CONTINUE
IF (III.NE.1) GOTO 90END IF
WRITE(*,45)TLRMNM(I)FORMAT(//,lX,’INPUT THE AVERAGE’,
+ ‘ NUMBER OF WORKERS THAT USE ‘,A20,/,lX,’REAL’,+ /,lX,’ENTER:’)READ(*,50,ERR=51 )ANWFSA(I)
FORMAT(F8.0)GOTO 55
3.42

WRITE(*,91)GOTO 44
WRITE(*,56)FORMAT(/,lX,’ENTER A 1 TO CORRECT ELSE <RETURN> TO CONTINUE’)READ(*,58,ERR=59) III
FORMAT(I2)(GOT0 60
WRITE(*,91)GOTO 55
CONTINUEIF (III.EQ.1) GOTO 44CONTINUE
FORMAT(/,lX,’****ERROR****MISTYPED DATA’,/)END
ccccccccccccccccccccccccccccccccccccccccccccccccccccccccccccccccccccccc
ANALYZE SHIPYARD TOOLROOMSSUBROUTINE ASTLRM(NTLRMS,TLRMNM,NWNDWS,NATNTS,MU,LAMEDA,
+ STRLCN,BLDCST,INVCST,ANWFSA, ATNWGS,YRDPRM ,NWRKRS,+ WRKLCN,WRKWGS,WLKRT,NSRVAR,SRVNMS,SAPRIM,+ WQ,WS,PO,PN,RHO,LS,LQ,ATRLCN,DTRWRK ,ADSATR,+ WDTLRM,OPMSR ,QTRCST,TTRCST ,TOTCST,CS,CW,+ NWRKSA,CNTRD ,PTRLCN,NTIMES,MNUVAR,OPTIMES)
INPUTINTEGER NTLRMSCHARACTER*2O TLRMNM(10)INTEGER NWNDWS( 10),NATNTS(1O)REAL MU(10),LAMBDA(1O)REAL STRLCN(10,2)REAL BLDCST( 10),INVCST(1O)REAL ANWFSA( 10),ATNWGS(1O)REAL YRDPRM(4)INTEGER NWRKRSREAL WRKLCN(1OO,2)REAL WRKWGSREAL WLKRTINTEGER NSRVARCHARACTER*2O SRVNMS(20)REAL SAPRIM(20,4)
OUTPUTREAL WQ(lO),WS( 1O),PO(1O)
REAL PN(5O,1O)REAL RHO(lO),LS( 1O),LQ(1O).REAL ATRLCN(10,2)REAL DTRWRK(10,1OO)REAL ADSATR(2O,1O)REAL WDTLRM(10)REAL OPMSR(10)REAL QTRCST(10)REAL TTRCST(10)REAL TOTCSTREAL CS(10),CW(1O)INTEGER NWRKSA(20)REAL CNTRD(20,2)
3.43

REAL PTRLCN(10,2)OTHER INPUTINTEGER NTIMESINTEGER MNUVARINTEGER OPTIMES
SET UP SHIPYARD MODELIF (MNUVAR.GE.2) THENCALL SETMOD(NTLRMS,TLRMNM}STRLCN,YRDPRM,NWRKRS,WRKLCN,
+ NSRVAR,SRVNMS,SAPRIM,ATRLCN,DTRWRK,ADSATR, WDTLRM,+ OPMSR,QTRCST ,NWRKSA,CNTRD ,PTRLCN,+ NTIMES,MNUVAR ,OPTIMES)
END IFDO QUEUING THOERY
CALL DQTHRY(NTLRMS,NWNDWS,NATNTS,MU,LAMBDA,+ WQ,WS,PO,PN,RHO,LS,LQ)
CALCULATE COST OF CURRENT MODELIF (MNUVAR.GE.2) THENCALL CSTMOD(NTLRMS,LAMBDA,WQ,WS,BLDCST, INVCST,
+ ANWFSA,ATNWGS,WRKWGS,WLKRT,NSRVAR,ADSATR,WDTLRM,+ OPMSR,GITRCST,TTRCST,TOTCST,+ CS,CW,MNUVAR)
END IFEND
ccccccccccccccccccccccccccccccccccccccccccccccccccccccccccccccccccccccc
OUTPUT SHIPYARD MODELSUBROUTINE OSMDAS(NTLRMS,TLRMNM,NWNDWS,NATNTS,MU,
+ LAMBDA,BLDCST,INVCST,ANWFSA ,NSRVAR,SRVNMS,WQ,+ WS,PO,PN,RHO ,LS,LQ,ATRLCN ,DTRWRK,ADSATR ,+ WDTLRM,OPMSR,QTRCST,TTRCST ,+ TOTCST,CS,CW,NWRKSA,MNUVAR )
INTEGER NTLRMSCHARACTER*2O TLRMNM(10)INTEGER NWNDWS( 10),NATNTS(1O)REAL MU(10),LAMBDA(1O)REAL BLDCST( 10),INVCST(1O)REAL ANWFSA(10)INTEGER NSRVARCHARACTER*2O SRVNMS(20)REAL
REALREALREALREAL
REALREALREALREALREALREAL
WQ(lO).,WS( 1O),PO(1O)REAL PN(5O,1O)
RHO(lO),LS( 1O),LQ(1O)ATRLCN(10,2)DTRWRK(10,1OO)ADSATR(20,10)WDTLRM(10)OPMSR(10)QTRCST(10)TTRCST(10)TOTCSTCS(l0),cw(lo)
INTEGER NWRKSA(20)INTEGER MNUVAR
3.44


7 DO 999 I=1, NTLRMSGET TOOLROOM NAMES
IF (OPTIMES.GT.1) THENWRITE(*, 1OO)TLRMNM(I)
00 FORMAT(//,lX,’TOOLROOM NAME IS' ,A20)35 WRITE(*,136)36 FORMAT(/,lX,'ENTER 1 TO CHANGE ELSE <RETURN> TO CONTINUE’)
READ(*s 138,ERR=139)III38 FORMAT(I2)
GOTO 14039 WRITE(*,1OOO)
GOTO 13540 CONTINUE
IF (111.NE.1) GOTO 200END IF
50 WRITE(*,175)I75 FORMAT(//,lX,'INPUT NAME OF TOOLROOM # ',12,’:’,/,lX,’CHARACTE
+/,1X,'ENTER:’)READ(*, 180,ERR=181 )TLRMNM( I)
80 FORMAT(A20)GOTO 182
81 WRITE(*,1OOO)GOTO 150
02 CONTINUE87 WRITE(*,189)89 FORMAT(/,lX,’ENTER 1 TO CORRECT ELSE <RETURN> TO CONTINUE’)
READ(*, 190,ERR=191)II I 90 FORMAT(I2)
GOTO 19291 WRITE(*,1OOO)
GOTO 18792 CONTINUE
IF III.EQ.1) GOTO 15000 WRITE(*,205)TLRMNM(I)05 FORMAT(//,lX,’INPUT THE FOLLOWING DATA FOR', A20)GET #WINDOWS
IF (OPTIMES.GT.1) THENwRITE(*,330)NWNDWS(I)
30 FORMAT(//,5X,’NUMBER OF WINDOWS IS‘,13)35 WRITE(*,336)36 FORMAT(//,lX,’ENTER 1 TO CHANGE ELSE <RETURN> TO CONTINUE’)
READ(*,338,ERR=339)IIIGO TO 340
39 WRITE(*,1OOO)GOTO 335
40 CONTINUE30 FORMAT(I2)
IF (III.NE.1) GOTO 499END IF
99 WRITE(*,400)00 FORMAT(//,5X,’NUMEER OF WINDOWS‘,/,lX,’INTEGER’,
+/,lX,’ENTER:’)READ(*,401,ERR=402)NWNDWS(I)
01 FORMAT(I4)GOTO 455
02 WRITE(*,1OOO)GOTO 399
55 WRITE(*,456)56 FORMAT(/,lX,’ENTER 1 TO CORRECT ELSE <RETURN> TO CONTINUE’)
3.49


. —
IF (III.EQ.1) GOTO 44END IF9 IF (MNUV9R.GE.2) THEN
DO 600 I=l,NSRVARGET SERVICE AREA NAMES
IF (OPTIMES.GT. 1.AND.SRVNMS(1).NE.' ') THENWRITE(*, 1OO)I,SRVNMS(I)
00 FORMAT(//,lX,.’NAME OF SERVICE AREA # ',13,+ ‘ IS ‘,A20)
35 WRITE(*,136)36 FORMAT(/,lX,’ENTER 1 TO CHANGE ELSE <RETURN> TO CONTINUE’)
READ(*, 138,ERR=139)III38 FORMAT(12)
GOTO 14039 WRITE(*,601)
GOTO 13540 CONTINUE
IF (III.NE.1) GOTO 199END IF
44 WRITE(*,150)I50 FORMAT(//,lX,’INPUT NAME OF SERVICE AREA # ',12,’:’,/,lX,
+ 'CHARACTER’,/,lX,’ENTER: ')READ(*, 151,ERR=152)SRVNMS(1)
51 FORMAT(A20)GOTO 155
52 WRITE(*,601)GOTO 144
55 WRITE(*,156)56 FORMAT(/,lX,’ENTER 1 TO CORRECT ELSE <RETURN> TO CONTINUE’)
READ(*, 158,ERR=159)III58 FORMAT(I2)
GOTO 16059 WRITE(*,601)
GOTO 15560 CONTINUE
IF (III.EQ.1) GOTO 14499 IF (MNUVAR.GE.3) THEN
WRITE(*,200)SRVNMS(I)00 FORMAT(//,lX,’INPUT THE FOLLOWING DATA FOR SERVICE AREA: ',A20)GET SERVICE AREA PERIMETERS
IF (OPTIMES.GT. 1.AND.SAPRIM( 1,1).NE.O.0) THENWRITE(*,201)SAPRIM(I,1)
01 FORMAT(5X, ’X-COORD. OF LEFTMOST BOUNDARY IS ',F8.4)WRITE(*,202)SAPRIM( 192)
02 FORMAT(5X, 'Y-COORD. OF BOTTOMMOST BOUNDARY IS ',FE.4)WRITE(*,203)SAPRIM( I,3)
03 FORMAT(5X, ’X-COORD. OF RIGHTMOST BOUNDARY IS ',F8.4)WRITE(*,204)SAPRIM( I,4)
04 FORMAT(SX, ’Y-COORD. OF TOPMOST BOUNDARY IS ‘,FS.4)'35 WRITE(*,236)36 FORMAT(/,lX,’ENTER 1 TO CHANGE ELSE <RETURN> TO CONTINUE’)
READ(*,238,ERR=239 )III 38 FORMAT(I2)
GOTO 24039 WRITE(*,602)
GOTO 23540 CONTINUE
IF (III.NE.1) GOTO 600END IF
44 WRITE(*,245)
3.56