Embed Size (px)
Citation preview

Instructional Science Elsevier Publishing Company, Amsterdam - Printed in the Netherlands
C O M P U T E R - A S S I S T E D I N S T R U C T I O N F O R D I S P E R S E D
P O P U L A T I O N S : S Y S T E M C O S T M O D E L S 1
JOHN BALL and DEAN JAMISON 2 Stanford University, Stanford, Calif. 94305
ABSTRACT
Provision of CAI of any sophistication requires - at least with present tech- nology - the existence of a large central computing system. Thus, if rural regions or dispersed populations (e.g. deaf students) are to be able to share in the potential of CAI, an extensive communication system is required. This paper provides cost esti- mates for a CAI system capable of handling 1300 highly despersed student terminals; in order to do this it develops cost models for alternative te restrial and satellite communication systems. Perhaps the most interesting result to emerge from the analysis is the viability of a satellite based system; for average terminal to computer distances on the order of 500 miles there is a distinct advantage for satellite based systems. Assuming 2,000 hours per year usuage of the student erminals, the system cost for a satellite based system serving a highly dispersed population is $ 0.85 per student contact hour.
I. I n t r o d u c t i o n
In r e c e n t yea r s a d v a n c e s in c o m m u n i c a t i o n a nd e d u c a t i o n have m a d e
poss ib le t w o v e r y a t t r a c t i v e classes o f e d u c a t i o n a l t e c h n o l o g y . T h e first o f
these is t he d e v e l o p m e n t o f b r o a d c a s t t e c h n o l o g y b y w h i c h r ad io or
t e l ev i s ion p r o g r a m s o r i g i n a t i n g at a s ingle p o i n t can be d i s t r i b u t e d to,
p o t e n t i a l l y , m a n y m i l l i o n s of e d u c a t i o n a l users . T h e s e c o n d a nd m u c h
i This work was supported by Grant No. OEG-0-70-4797 from the Bureau of Educa- tion for the Handicapped, U.S. Office of Education , to the Institute for Mathematical Studies in the Social Sciences (IMSSS), Stanford University. Portions of the paper were previously presented at the XXII International Congress of the International Astronautical Federation, Brussels, September 1971, and at the International School on Computers in Education, Pugnochiuso, Italy, July 1972. 2 John Ball is the manager of the Computer Based Laboratory of IMSSS; Dean Jamison is a staff member of IMSSS, Assistant Professor of Management Science, Graduate School of Business, and Assistant Professor (by courtesy), School of Educa- tion, Stanford University. The authors are indebted to J. E. G. Ferraz and Joanne Leslie Jamison for valuable assistance with this paper.
4 6 9

more recent of these advances centers around potential use of a com- puting system to provide interactive instruction. By tailoring curriculum to an individual's needs and providing immediate and accurate feedback, instruction via computer offers great potential, perhaps greater than the broadcast media. Computer-assisted instruction (CAI) is an increasingly familiar technology at academic research institutions and in the journals. Problems of cost and availability have, however, stalled efforts at imple- mentat ion on any substantial scale. For this reason, in our work on CAI development at Stanford University's Institute for Mathematical Studies in the Social Sciences (IMSSS), we have paid increasing attention to the basic economic trade-offs involved and to the problems of implementation facing a school administration that wants to utilize CAI.
Provision of CAI or CMI (computer-managed instruction) of any sophistication implies the need for one or a few large central computing facilities - at least with presently available technology. Thus, if rural regions or dispersed populations are to be able to share in the potential of interactive educational technologies, an extensive communication system is required. In a previous paper - Jamison e t al. (1970) - we examined the basic economics of providing CAI in urban areas. 3 Since all student terminals can, under urban conditions, be located reasonably close to the central computat ion facility, cost and implementation problems are reduced. In this present paper we examine the somewhat more difficult problem of providing CAI to dispersed populations. Our work in devel- oping cost models for distribution of CAI to dispersed populations has been part of a project funded by the Bureau of Education for the Handicapped, U.S. Office of Education, to develop CAI materials for deaf students. The deaf constitute a rather highly dispersed population within the United States and problems of communication to support a CAI system for them are paradigmatic for dispersed populations of other types. Other dispersed populations include American Indians, Americans whose first language is Spanish, medical doctors, students at isolated rural schools, and migrant workers (who have the additional communication difficulty of being mobile).
Experience has indicated that the cost and complexity of terrestrial communicat ion systems for CAI are often a stumbling block to provision of service in rural areas; establishing and servicing circuits in remote areas is difficult. Independent telephone companies do not always provide data
3 Cost estimates for a very large-scale system (4,000 terminals) are given in Bitzer and Skaperdas (1969), and Stetten (1972) gives cost estimates for a system with 125 terminals. Both sets of estimates assume the terminals are clustered at the computer center or within 100 miles of it.
470

services or equipment. There are areas in the United States which cannot be reached by this type of CAI service due to lack of telephone company facilities. It could be argued that because it is more difficult to supply these dispersed populations with CAI than to supply more concentrated populations, the dispersed populations should be left until last. Our view is that, at the very least, we should examine with care the costs of different technologies that could provide CA! service to dispersed popula- tions (including satellite communication), and on the basis of these costs let the decision makers responsible for providing education to these groups make decisions about how their resources should be allocated.
In this paper we outline a CAI system capable of reaching dispersed populations without excessive communication costs (i.e., the system requires only about 110 bits per second communications capability for each student terminal). 4 This low communication requirement makes service for dispersed populations economically feasible. Then we present models of several communications alternatives for the system. We expect that these procedures of system modeling and design trade-off will play an increasingly important role in education. The results of this modeling constitute approximate minimum cost communicat ion designs for many configurations of population dispersal. Finally we describe some of the basic economic trade-offs and implementation alternatives relevant to educators who must decide whether or not to use CAI for certain student populations.
II. Central Facility and Student Terminal Cost Model
CAI systems are commercially available for under $ 50,000. They support a few fixed courses on 8 to 20 local terminals and provide daily progress statistics to the teachers. These systems are of considerable interest for a number of uses and will perhaps assume a larger role in our educational processes in the future. Jamison e t al. (1970) provide a cost analysis for systems of this sort. However, the cost of a large and versatile system that is capable of research use and supporting hundreds of ter- minals will be our focus in this section. Our costs are based on a system modeled after the one presently used for research and operations at IMSSS, but dedicated to CAI terminal service full time. Using modern versions of our present equipment designs we estimate that such a system
4 Detailed descriptions of earlier IMSSS CAI systems can be found in Suppes et al. (1968), Suppes (1971 ), and Suppes and Morningstar (1972).
471

could support 1,000 users simultaneously. Assuming that only 70% of the terminals would be on-line at once, the system could handle 1,300 terminals.
Three cost categories - capital equipment, design and construction, and continuing operations - will be discussed in this section. These cost categories apply to the central computat ion facility and terminals; Sec- tion III discusses the data communication cost models that are the focus of this paper.
A. C A P I T A L E Q U I P M E N T
The system would be modeled along the lines of the IMSSS system except that it would be newer and larger. All of the equipment can be purchased or built t o d a y .
TABLE I
Equipment Cost of CAI System Components for 1,300 Terminals (Excluding Communications)
Component Description Cost ($)
Core Memory System 256K words on-line plus two working spare 32K boxes. Including individual 6-port inter- faces and port connectors.
Program compatible with the PDP-10 and including a pager.
4.5 million word storage on three drums.
Two separate systems each with about 50 million words of storage.
Includes a multiplex computer and a special purpose multiplexer.
Local test and patch facilities and test equip- ment. (See Section IV for remote equip- ment and operating costs.)
1,450 student terminals @ $900 10 system terminals @ $4,000
Magnetic tape drives, Line printers, Disc packs, magnetic tapes, terminal spare parts, storage facilities, etc.
Central Processor
Drum
Disc
I/O Multiplexer
Data Communicat ion
Terminals
Miscellaneous
TOTAL
330,000
300,000
235,000
240,000
225,000
100,000
1,305,000 40,000
100,000 50,000
100,000
3,007,000
472
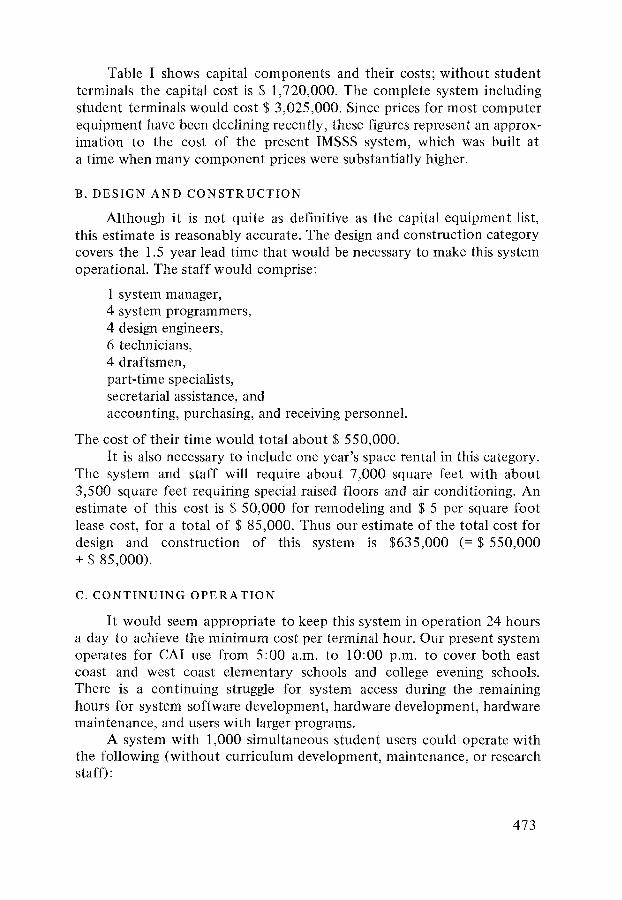
Table I shows capital components and their costs; wi thout student terminals the capital cost is $ 1,720,000. The complete system including student terminals would cost $ 3,025,000. Since prices for most computer equipment have been declining recently, these figures represent an approx- imation to the cost of the present IMSSS system, which was built at a time when many component prices were substantially higher.
B. DESIGN AND CONSTRUCTION
Although it is not quite as definitive as the capital equipment list, this estimate is reasonably accurate. The design and construction category covers the 1.5 year lead time that would be necessary to make this system operational. The staff would comprise:
1 system manager, 4 system programmers, 4 design engineers, 6 technicians, 4 draftsmen, part-time specialists, secretarial assistance, and accounting, purchasing, and receiving personnel.
The cost of their time would total about $ 550,000. It is also necessary to include one year's space rental in this category.
The system and staff will require about 7,000 square feet with about 3,500 square feet requiring special raised floors and air conditioning. An estimate of this cost is $ 50,000 for remodeling and $ 5 per square foot lease cost, for a total of $ 85,000. Thus our estimate of the total cost for design and construction of this system is $635,000 (--$ 550,000 + $ 85,000).
c. CONTINUING OPERATION
It would seem appropriate to keep this system in operation 24 hours a day to achieve the minimum cost per terminal hour. Our present system operates for CAI use from 5:00 a.m. to 10:00 p.m. to cover both east coast and west coast elementary schools and college evening schools. There is a continuing struggle for system access during the remaining hours for system software development, hardware development, hardware maintenance, and users with larger programs.
A system with 1,000 simultaneous student users could operate with the following (wi thout curriculum development, maintenance, or research staff):
473
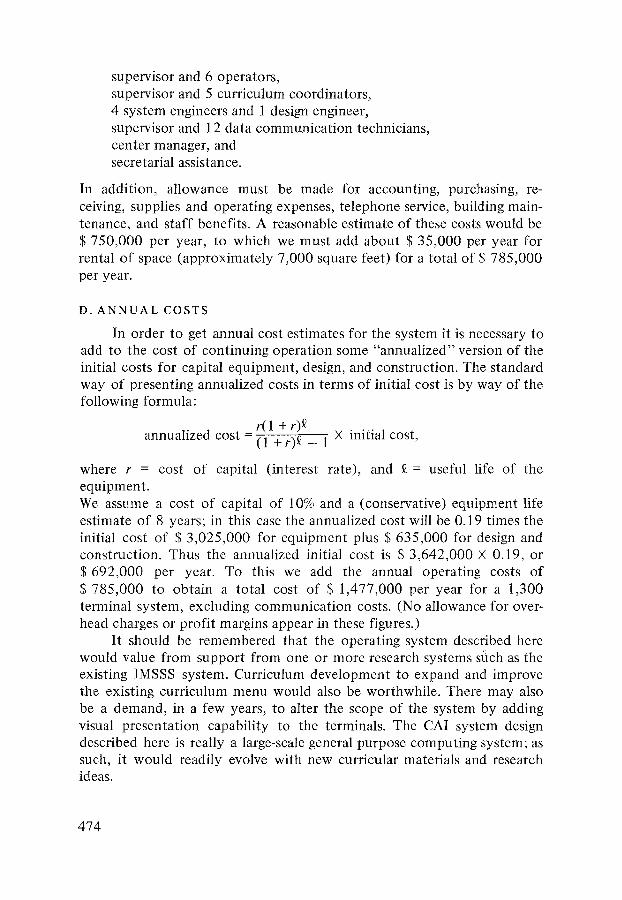
supervisor and 6 operators, supervisor and 5 curriculum coordinators, 4 system engineers and 1 design engineer, supervisor and 12 data communication technicians, center manager, and secretarial assistance.
In addition, allowance must be made for accounting, purchasing, re- ceiving, supplies and operating expenses, telephone service, building main- tenance, and staff benefits. A reasonable estimate of these costs would be $ 750,000 per year, to which we must add about $ 35,000 per year for rental of space (approximately 7,000 square feet) for a total of $ 785,000 per year.
D. ANNUAL COSTS
In order to get annual cost estimates for the system it is necessary to add to the cost of continuing operation some "annualized" version of the initial costs for capital equipment, design, and construction. The standard way of presenting annualized costs in terms of initial cost is by way of the following formula:
r(1 + r)~ annualized cost = (1 + r)~ - 1 X initial cost,
where r = cost of capital (interest rate), and £ = useful life of the equipment. We assume a cost of capital of 10% and a (conservative) equipment life estimate of 8 years; in this case the annualized cost will be 0.19 times the initial cost of $ 3,025,000 for equipment plus $ 635,000 for design and construction. Thus the annualized initial cost is $ 3,642,000 X 0.19, or $ 692,000 per year. To this we add the annual operating costs of $ 785,000 to obtain a total cost of $ 1,477,000 per year for a 1,300 terminal system, excluding communication costs. (No allowance for over- head charges or profit margins appear in these figures.)
It should be remembered that the operating system described here would value from support from one or more research systems sfich as the existing IMSSS system. Curriculum development to expand and improve the existing curriculum menu would also be worthwhile. There may also be a demand, in a few years, to alter the scope of the system by adding visual presentation capability to the terminals. The CAI system design described here is really a large-scale general purpose computing system; as such, it would readily evolve with new curricular materials and research ideas.
474

III. Data Communication Cost Models
This section will develop comparative cost models for alternative communicat ion systems for a CAI network serving a dispersed population. The communicat ion process to be modeled is sl~own in Fig. 1. The centralized computing system and low data rate terminals are parameters determined from the system description in Section II. Our analysis here will not deal with large clusters of terminals located very close to the central computer; our purpose is to ascertain the cost of serving sparse concentrations of terminals located several hundred miles or more away from the central computer facility. We develop cost models based on use of communicat ion satellites, as well as the surface phone network, for provision of the communicat ion capacity.
The satellite communicat ion system shown in Fig. 2 follows easily from the model shown in Fig. 1. The satellite is assumed to have a beam width sufficient to cover the area of interest, possibly the entire con- tinental United States, and sufficient power to service the remote sites.
LARGE-SCALE CAI
COMPUTER SYSTEM
CENTRALIZED ~ COMPUTER
COMMUNICATIONS [ INTERFACE
~ COMMUN~;ATIONS 2 - WAY INTERACTI VE ~ ~
REMOTE TERMINALS @ IlO BAUD
Fig. 1. Computer-assisted instruction communication model.
475

LARGE-SCALE CAI
COMPUTER SYSTEM
COMMUNICATIONS NTERFACE
I TERMINAL CLUSTER
RADIO FREQUENCY
SYSTEM ~ 1 1 / / /
/ /
/ /
/ J
J /
/ , /
/
TERMINAL
CLUSTER
Fig. 2. Computer-assisted instruction satellite communication network.
SATELLITE
© I I I I t l I I I
Appropriate cost for these assumptions will be included in our analysis. Such a satellite system would be relatively independent of placement of remote sites.
A system using telephone lines in its communication net cannot be sketched so easily. Telephone line costs are governed, today, by tariff rate schedules. Several variables in these schedules make it necessary to con- sider differing forms of the communication net. Also, the bandwidth constraints on phone lines force us to start new circuits as the capacity of previous circuits are reached. Line costs follow a flat rate within each state. Lines which cross state boundaries have a declining rate schedule based on mileage. Charges are also made for end termination and condi- tioning of the lines.
In the first subsection of this part, cost models for five separate telephone communicat ion systems are developed. The next subsection develops a satellite system cost model and the third subsection contains tables that present the cost results parametrically. The final subsection discusses the results.
476

LARGE-SCALE CAI
COMPUTER SYSTEM
/ TERMINAL ] CLUSTER
[ TERMINAL]
CLUSTER [
I
Fig. 3. Linear terrestrial communica t i on network.
COMMUN I CAT I ON INTERFACE
TERMINAL
CLUSTER
I TERM I NAL ]
CLUSTER I
I
TERMINAL ]
CLUSTER
A. TELEPHONE LINE COMMUNICATION MODELS
Two styles of communicat ion network designs will be considered here: the linear net and the cluster net. These two are representative of organizational extremes possible with telephone nets. The linear net is shown in Fig. 3. Each cluster of terminals serves as a forwarding link for all terminals farther away from the central system. A speed constraint of 4800 baud s imposed on the fastest lines allows a maximum of about 68 terminals in each linear group. A cluster net design is shown in Fig. 4. The
s The term "baud" is a measure of communica t i on capacity; a voice-grade line has a capacity of up to 9600 baud.
477

LARGE-SCALE CAI
COMPUTER SYSTEM
TERMINAL
MULTIPLEXER
I TERMINAL CLUSTER
TERMINAL
CLUSTER
I 'TERMINAL I
CLUSTER I
TERMINAL MULTIPLEXER ~ . , , , ~ •
TERMINAL CLUSTER ]
Fig. 4. Clustered terrestrial communication network.
size constraints are the same as the linear system since a 4800 baud line is used as the feeder to the cluster. Distances to peripheral clusters may be assumed to be small, perhaps less than 25% of the feeder distance. Equipment in the cluster center will forward data to all clusters attached to it.
We will present distance variants within each cost model which can be adjusted to reflect either regional or national systems. The costs of a satellite system are almost independent of terminal placement. The cost
478

models will compare a satellite communication system with five telephone networks as follows:
(1) A cluster system with a large interstate distance to the multiplex centers and smaller intrastate distances from centers to the small clusters.
(2) A cluster system located entirely within the computing center state, i.e., a large dense semilocal system.
(3) A linear system with a large interstate distance to the first cluster and smaller interstate distances among the remaining clusters. Every cluster in each of the linear nets must be in a different state. This forces a wide area terminal distribution.
(4) A linear system located entirely within the computing center state, i.e., a large dense local system.
(5) A linear system with a large interstate distance to the first cluster and smaller intrastate distances between the remaining clusters in the linear network. All clusters are located in the same remote state. This produces a regional terminal distribution.
Cluster system For system (1) the basic design of each cluster is shown in Fig. 5.
The parameters of this system are shown in Table II. Three cost terms will appear in the cost equation: multiplex system, 6 long lines, and local lines.
To develop the multiplex system cost the number of long lines, and hence the number of clusters, is needed:
T number of long lines -
8(K + 1)"
The annualized cost of capital, the annual maintenance cost, and the multiplex cost per cluster are the remaining factors in the multiplex system cost equation:
T 1) Mr[0.1 + k (~,r)] multiplex system cost - 8(K +
The 0.1 factor represents a 10% annual maintenance charge for all in- stalled electronics equipment. The annualizing formula, described before, is
k(~,r)- r(1 + r)~ (1 +r ) ~ - 1"
If an equipment lifetime of eight years and a constant interest rate of 10% are used, then k(8, 0.1 ) = 0.19.
6 The multiplexing system assembles and disassembles signals in the communication line for direction to the individual terminals.
479

0c
0
48
00
B
AU
D D
AT
A
FRO
M C
AI
SY
ST
EM
M
OD
EI~
H IG
H'S
PE
ED
D
AT
A L
INE
I NTE
RFA
CE
MS
~-8
00
M
ICR
O
PR
OC
ES
SO
R
LOW
-SP
EE
D
DA
TA
LIN
E
INT
ER
FA
CE
S
HIG
H-S
PE
ED
D
AT
A L
INE
INT
ER
FA
CE
HIG
H-S
PE
ED
D
AT
A L
INE
INT
ER
FA
CE
LOC
AL
TE
RM
INA
LS
ET
C.
MO
DE
M
HIG
H-S
PE
ED
D
AT
A L
INE
INTE
RFA
CE
MS
I - 800
MIC
RO
P
RO
CE
SS
OR
LOW
- S
P E
E D
D
AT
A L
I NE
INT
ER
FA
CE
oo
o
TE
RM
INA
LS
Fig.
5.
Clu
ster
mul
tipl
ex s
yste
m.

TABLE II
Parameter Definitions for a Cluster Model of a CAI System*
Parameter Definition
D
d
K
T
Mt
r
COST
Long lines, mean distance.
Short lines, mean distance.
Number of clusters of 8 student terminals, each feeding into a multi- plexing center (4 ~< K ~> 8).
Number of terminals in the whole system.
Cost of the multiplex equipment to supply each group of K clusters located remotely from the multiplexing center plus the one cluster assumed to be located at the center.
Annual interest rate (or social discount rate).
Lifetime expected of capital equipment, in years.
Annual cost for the telephone system
* A cluster is defined as 8 terminals which can supply one CAI course to over 240 students each day.
TABLE III
Multiplex System Costs for a Cluster Communication Network*
Number Item required Unit cost Cost
8 channel multiplex K + 1 1.6 1.6(K + I)
1200 baud modems** 2K 0.5 1 .OK
Central multiplex system 1 7.0 7.0
4800 baud modems** 2 5.4 10.8
Central CAI system line unit 1 2.5 2.5
Assembly and testing 4.0 Mt = 2.6K + 25.9
* Costs are given in thousands of d o l l a r s .
** A modem changes the digital signals coming to or from the various terminals into signals suitable for transmission on a phone line. Modems capable of transmitting infor- mation at faster rates are substantially more expensive.
481

The multiplex system cost, Mr, can be derived from the data in Table III and is given by, in thousands of dollars per year,
T M t - - - ( 2 . 6 K + 2 5 . 9 ) [0.1 +k(~,r)] . 8(K+ 1)
The second term in our cost equation represents the cost of renting long lines service from the telephone company. Long lines service is interstate in the model for system (1). Monthly costs by distance, in dollars, are derived from rate information as follows:
3.30 D 82.50
255.75 503.25 790.75
V = + [2.31(D - 25)] + [ 1.65(D - 100)] + [1.15(D - 250)] + [0.825(D - 500)1
1 < D ~< 25 miles 2 6 < D ~ < 100miles 101 ~< D ~< 250 miles 251 ~< D < 500 miles 501 ~<D.
To these mileage charges must be added conditioning charges of $ 60 per month and termination charges of $ 27.50 per month. Therefore, the cost equation for telephone long l ines becomes:
T interstate mileage charge - [87.50 + V(D)].
8(K + 1)
For the short lines costs of system (1), intrastate rates are needed. Intrastate mileage charge is a constant function of mileage which varies from state to state but approximates $ 4 per mile. For intrastate mileage charges we use, therefore, a monthly cost of $ 4d, where d is the length of the intrastate link. To this must be added conditioning charges of $ 91 per month and terminal charges as follows:
T(d) = terminal charges = t $ 44, D > 25 miles
$ 22, D ~< 25 miles.
The total cost equation for telephone short lines then becomes:
T intrastate mileage charge - 8(K + 1) K(4d + T(d) + 91).
The total communicat ion cost equation for system (1) is the sum of the multiplexing costs and inter- and intrastate line costs. These costs, in thousands of dollars per year, are given by:
T COST1 - 8 ( K + 1 ) (2 .6K + 25.9) [0.1 + k(~,r)]
T 12 + - - - (27.50 + 60 + V(D))
8 ( K + 1) 1000
482

T 12K (4d + T(d) + 91 ). + 8(K + 1000
When the entire system is located within the state of the central com- puter, intrastate line costs must be used for both D and d. This gives us the annual cost system (2) as:
T C O S T 2 - 8 ( K + 1) (2.6K + 25.9) [0.1 + k(~,r)]
+ T 12 (4D + T(D) + 91)
8(K + 1) 1000
T 12K (4d + T(d) + 91).
8(K + 1) 1000 -t-
Linear systems The linear configuration of systems (3), (4), and (5) can be seen in
Fig. 6. The linear circuit begins at the CAI computer and connects each group of 8 terminals in turn, dropping 8 terminals and forwarding the rest. As the number of terminals on the line decreases, the modem speed can be correspondingly reduced. For all three of the linear systems, a distance of D miles to the first terminal group and a constant d miles between each of the remaining groups is used for our cost derivation. The systems differ in the extent to which interstate lines are involved.
Just as before, the total number of circuits needed (equal to the number of strings of terminal clusters) can be expressed by:
T number of circuits - 8(K + 1) ' 4 ~< K ~< 8.
To compute Mt, the terminal capacity of various modems must be considered. A 4800 baud modem can handle 68 terminals; a 2400 baud modem, 32 terminals; and a 1200 baud modem, 8 terminals. The number of modems needed for K = 4, 5, 6, 7, and 8 can be counted by drawing the circuits. The results are as follows:
4800 baud 2400 baud 1200 baud
K = 4 2 + 6 + 2 K = 5 4 + 6 + 2 K = 6 6 + 6 + 2 K = 7 8 + 6 + 2 K = 8 10 + 6 + 2
483

This data allows the multiplex cost shown in Table IV to be derived. Except for the last group in each linear group of terminals, all multiplex systems are assumed to be of equal cost.
T A B L E IV
Mul t ip lex Sys tem Cost of a L inear C o m m u n i c a t i o n N e t w o r k *
N u m b e r I t em requi red Uni t cost Cost
8 channe l mu l t i p l ex sys tem (for t h e last t e r m i n a l g roup) 1 1.6 1.6
1200 baud m o d e m s 2 0.5 1.0
2400 baud m o d e m s 6 1.75 10.5
4800 baud m o d e m s 2(K + 1 - 4) 5.4 10.8(K - 3)
Mul t ip lex sys tem K 10.0 10.0K
Line un i t at CAI cen te r 2.5
Assembly and tes t ing 4 .0
Mt = 2 0 . 8 K - 12.8
* Costs are given in t h o u s a n d s of dollars.
To compute the telephone charges for the linear model varying assumptions can be made. There are two mileage figures involved, the distance to the first group D and the other intergroup distances d. These will be costed here as
System (3) - all interstate, System (4) - all intrastate, and System (5) - D interstate and d intrastate.
Other combinations will give costs which can be interpolated from these cases.
For system (3) the telephone line costs are
T (V(D) + KV(d)) .
8 ( K + 1)
Adding the terminal and conditioning charges as before gives a monthly telephone line cost of
T [ V(D) + (K X V(d)) + (K + 1) (27.50 + 60)]
8(K + 1)
484

48
00
BA
UD
DA
TA
FRO
M P
RE
VIO
US
T
ER
MIN
AL
SIT
E
HIG
H-S
PE
ED
D
ATA
LIN
E
INTE
RFA
CE
MS
I-8
00
M
ICR
O
PR
OC
ES
SO
R
MIC
RO
CO
DE
.PR
OG
RA
MM
ED
FO
R T
ER
MIN
AL
MU
LTIP
LEX
HIG
H-S
PE
ED
D
ATA
LIN
E
INTE
RFA
CE
4
80
0
BA
UD
DA
TA
TO N
EX
T
TE
RM
INA
L S
ITE
LOW
-SP
EE
D
DA
TA L
INE
IN
TER
FAC
ES
LOC
AL
TER
MIN
ALS
Fig.
6.
Lin
ear
mul
tipl
ex s
yste
m.
0¢

for system (3). Similarly, the telephone line costs for the other two systems are
T [4D + 4Kd + (K + 1) (44 + 91)]
8 ( K + l)
for system (4), and
T [ V(D) + 27.50 + 60) + K(4d + 44 + 91)]
8 ( K + 1)
for system (5). Complete cost equations, in thousands of dollars per year, for systems (3), (4), and (5) can then be written as
T COST3,4, 5 - 8(K + 1)
where
telephone line c o s t =
( 2 0 . 8 K - 12.8) [0.1 + k(fLr)]
12 (telephone line cost), +1--666
T 8(K + 1)
T 8(K + 1)
T 8(K + 1)
[ V(D) + KV(d) + (K + 1)(27.50 + 60)1,
for system (3) (all interstate)
[4(D + K d ) + ( K + 1)(44 + 91)],
for system (4) (all intrastate)
IV(D) + 27.50 + 60 + K(4d + 44 + 91)],
for system (5) (mixed),
with 4 ~< K ~< 8 and D, d > 25 miles. Cost of regional or national systems can be determined by adjusting D, d, and K. Data for various interesting combinations of these parameters, for all five telephone line oriented systems, will be presented after the satellite system cost model is devel- oped.
B. S A T E L L I T E C O M M U N I C A T I O N M O D E L
Now we will look at the cost of a satellite communicat ion system and compare that with the telephone line communicat ion systems already described. Except for consideration of the satellite's coverage pattern, the system design shown in Fig. 2 could be a suitable replacement for any of the telephone systems described in this section.
486
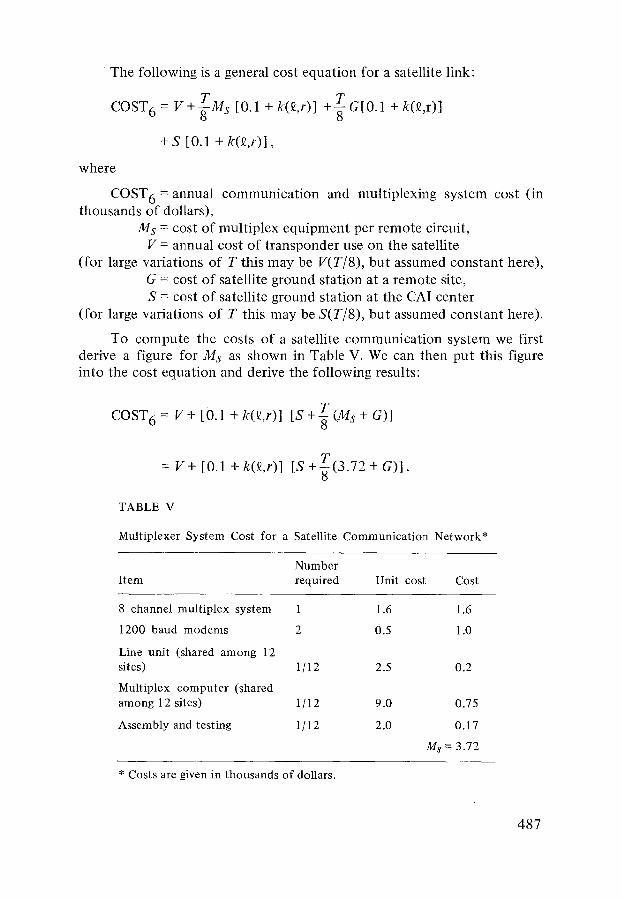
The following is a general cost equation for a satellite link:
COST 6 = v+TMs [0.1 + k(Lr)] + T G [ 0 . 1 + k(~,r)] 8
+ S [0.1 +k(~,r)],
where
COST 6 = annual communication and multiplexing system cost (in thousands of dollars),
Ms = cost of multiplex equipment per remote circuit, V = annual cost of transponder use on the satellite
(for large variations of T this may be V(T/8), but assumed constant here), G -- cost of satellite ground station at a remote site, S = cost of satellite ground station at the CAI center
(for large variations of T this may be S(T/8), but assumed constant here).
To compute the costs of a satellite communicat ion system we first derive a figure for Ms as shown in Table V. We can then put this figure into the cost equation and derive the following results:
COST 6 = V+ [0.1 + k(~,r)] [s+T(Ms + G)] 8
= V+ [0.1 + k(f~,r)] [S + T ( 3 . 7 2 + G)].
TABLE V
Multiplexer System Cost for a Satellite Communication Network*
Number Item required Unit cost Cost
8 channel multiplex system 1 1.6
1200 baud modems 2 0.5
Line unit (shared among 12 sites) 1/12 2.5
Multiplex computer (shared among 12 sites) 1/12 9.0
Assembly and testing 1 / 12 2.0
1.6
1.0
0.2
0.75
0.17
M s = 3.72
* Costs are given in thousands of dollars.
487

Three unknowns remain:
V-- satellite usage charges, S = central R F v installation cost. G = remote ground station costs.
Based on our current work with the ATS-3 satellite, unpublished papers of Dr. J. Jankey and Dr. James Potter, and conversation with others, we propose (1) to fix S at $ 80,000, (2) to s tudy three values for G - $ 1,000, $ 3,000, and $ 6,000 - and ( 3 ) t o allow V to vary from zero to $ 500,000 per year. More detailed information on satellite and ground stat ion costs for educational applications may be found in Dunn et al. (1972).
The satellite cost equation then can be represented as:
COST 6 =
0 100 200 300 400 500
+ [0.1 +k(%r)l [ 8 0 + T ( 3 . 7 2 11I + 3 6
)1.
C. PARAMETRIC COST SUMMARIES
Summarizing the types of systems to be costed, together with their variables, we have:
System ( 1 ), Cluster: System (2), Cluster: System (3), Linear: System (4), Linear: System (5), Linear: Sys tem (6), Satellite:
D - i n t e r s t a t e , d - i n t r a s t a t e , K, T D - i n t r a s t a t e , d - i n t r a s t a t e , K, T D - i n t e r s t a t e , d - i n t e r s t a t e , K, T D - i n t r a s t a t e , d - i n t r a s t a t e , K, T D - i n t e r s t a t e , d - i n t r a s t a t e , K, T KG, T.
Tables VI to XI show various costs for each communication model considering different configurations within the model. The cost of capital and an equipment life o f 10% and 8 years is fixed in these tables.
As an example of how these tables might be used to obtain minimum cost configurations, consider the problem of supplying CAI to a popula- tion whose average distance from the main computer center is 1,000 miles with a large number of clusters in each local group of clusters (K = 8). The intrastate distance (between each local cluster and its cluster center) is
7 "RF" refers to the radio frequency electronic equipment.
488

TABLE VI
Cost of Communication System 1: Clustered Organization with Interstate/Intrastate Mix*
K** D = interstate distance d = intrastate distance 4 6 8
(A. 300 terminals) 2,000
1,500
500
(B. 1,000 terminals) 2,000
1,500
1,000
500
200 606 561 536 100 461 406 376
50 389 329 296
200 569 535 516 100 424 380 355
50 352 302 275
200 495 482 475 100 350 327 314
50 278 249 234
200 2021 1872 1789 100 t539 1356 1254
50 1298 1098 986
200 1897 1784 1721 100 1415 1267 1185
50 1174 1009 918
200 1773 1695 1652 100 1291 1179 1116
50 1051 921 849
200 1649 1607 1583 100 1168 1091 1048
50 927 832 780
* The costs given in the last three columns are annual costs in thousands of dollars; communication and multiplexing costs are included with capital costs annualized at an interest rate of 10% with an 8 year lifetime. ** K is the number of clusters of 8 terminals each connected to each long line.
4 8 9

TABLE VII
Cost of Communication System 2: Cluster Organization Single State Coverage*
K*** D = interstate distance** d = intrastate distance 4 6 8
(A. 300 terminals) 500
300
(B. 1,000 terminals) 500
300
200 608 563 538 100 464 408 377 50 392 331 297
200 536 511 498 100 392 357 337
50 319 279 257
200 2029 1878 1794 100 1547 1362 1258 50 1306 1103 991
200 1788 1706 1660 100 1306 1189 1125 50 1065 931 857
* The costs given in the last three columns are annual costs in thousands of dollars; communication and multiplexing costs are included with capital costs annualized at an interest rate of 10% with an 8 year lifetime. ** The term "interstate" is used here to denote the long-line distance and "intrastate" to denote the short-line distance even though all communication is within one state. *** Kis the number of clusters of 8 terminals each connected to each long line.
assumed to equal 50 miles. F o r 1,000 terminals, three o f the configura-
t ions p roposed here are relevant: cluster system (1), linear system (5), and the satellite sys tem (6). Fo r sys tem (1) the cost (on a per- terminal basis) is
$ 850 per year; for system (5) it is $ 1,276; for system (6) it is $ 564 under the conservative assumpt ion that the ground stat ion cost is $ 3 ,000 and the satellite usage cost is $ 300 ,000 per year. For this conf igurat ion,
then, the satellite appears superior, as it would for any more dispersed popula t ion . In the very wors t case o f satellite costs, with $ 6 ,000 ground
stat ions and a $ 500 ,000 annual satellite use cost, the cost o f system (6) becomes $ 872, slightly more than that o f system (1). Many o the r combi- nat ions o f requi rements can be similarly analyzed using these tables.
It m a y be o f interest to con t inue this example to the poin t o f
490

TABLE VIII
Cost of Communication System 3 : Linear Organization with All Interstate Connections*
K D = interstate distance d = intrastate distance 4 6 8
(A. 300terminals) 2,000
1,500
1,000
500
(B. 1,000 terminals) 2,000
1,500
600 688 679 674 400 617 602 595 200 525 504 493 100 465 440 427
50 224 396 380
600 650 652 653 400 579 576 574 200 488 478 472 100 428 414 406
50 387 369 360
600 613 626 632 400 542 549 553 200 450 451 451 100 391 387 385
50 349 343 339
600 576 599 612 400 505 523 533 200 413 425 431 100 354 36! 365
50 312 316 319
600 2293 2263 2246 400 2056 2009 1983 200 1750 1681 1643 100 1552 1469 1423
600 2169 2175 2178 400 1932 1921 1914 200 1626 1593 1574 100 1428 1381 1354
50 1290 1232 1200
491

T A B L E VIII ( c o n t i n u e d )
D = in t e r s t a t e d i s tance d = in t r a s t a t e d is tance K** 4 6 8
1,000
500
600 2046 2086 2109 400 1809 1832 1846 200 1503 1504 1506 100 1305 1292 1286
50 1166 1144 1132
600 1922 1998 2040 400 1685 1744 1777 200 1379 1416 1437 t 0 0 1181 1204 1217
50 1042 1055 1063
* The costs given in the last t h ree co l um ns are annua l costs in t h o u s a n d s of dollars; c o m m u n i c a t i o n and mul t ip lex ing costs are inc luded w i th capi ta l costs annua l ized at an in te res t ra te of 10% w i t h an 8 year l i fe t ime. ** K is the n u m b e r of c lusters of 8 t e rmina l s each c o n n e c t e d to each long line.
computing total per student contact hour costs of this communication configuration. At the end of Section II we estimated an annual cost for the system - including capital costs, operations, and maintenance - of $ 1,477,000 per year for 1,300 terminals or $ 1,135 per terminal per year. To this must be added the $ 565 satellite communication costs for a total of $ 1,700 per terminal per year, or a little less than $ 150 per terminal per month, or $ 0.85 per student contact hour, if we assume the optimis- tic goal of 2,000 hours of terminal use per year.
D. C O N C L U S I O N S
The foregoing communication models and their costs provide a basic cost analysis for providing interactive instructional materials to dispersed populations. Our approach has been to develop cost functions for alterna- tive approaches to solving the communication problem for a CAI system. The values these cost functions take depend on many parameters. The advantage of this approach is that it enables one to ascertain quickly the approximate minimum cost configuration for any specification of the input parameters. More exact cost estimates would, of course, have to be
492

TABLE IX
Cost of Communication System 4: Linear Organization with Single State Coverage*
K*** D = interstate distance** d = intrastate distance 4 6 8
(A. 300 terminals) 500
300
(B. 1,000 terminals) 500
300
200 682 672 666 100 537 517 505
50 465 439 425
200 610 620 626 100 465 465 465
50 393 388 385
200 2274 2240 2221 100 1792 1723 1685
50 1551 1465 1418
200 2033 2067 2087 100 1551 1551 1551
50 1310 1293 1284
* The costs given in the last three columns are annual costs in thousands of dollars; communication and multiplexing costs are included with capital costs annualized at an interest rate of 10% with an 8 year lifetime. ** The term "interstate" is used here to denote the long-line distance and "intrastate" to denote the short-line distance even though all communication is within one state. *** K is the number of clusters of 8 terminals each connected to each long line.
g e n e r a t e d at the t ime o f p r e p a r a t i o n of the design o f a spec i f ic s y s t e m ?
The cen t ra l n u m e r i c a l resul ts o f this sec t ion a p p e a r e d in Tab les VI to
XI. These t ab les show h o w annua l i zed c o m m u n i c a t i o n and m u l t i p l e x i n g
sy s t em cos ts va ry as a f u n c t i o n o f the m o s t cr i t ica l p a r a m e t e r s fo r th ree
c o n c e p t u a l l y d i s t i nc t a p p r o a c h e s to the c o m m u n i c a t i o n s n e t w o r k - a
c lus te red t e l e p h o n e l ine s y s t e m (Tables VI and VII ) , a l inear t e l e p h o n e
l ine sy s t em (Tab les V I I I - X ) , and a sa te l l i t e -based sys t em (Tab le XI). The
d i f f e r en t t ab les for the t e l ephone - l i ne -ba s e d s y s t e m s show costs for differ-
en t c o n f i g u r a t i o n s o f i n t e r s t a t e and i n t r a s t a t e sys tems ; this s epa ra t i on is
8 To apply this model in a European setting, a different rate structure system would, of course, have to be substituted.
493

TABLE X
Cost of Communication System 5: Linear Organization with Interstate/Intrastate Mix*
K** D = interstate distance d = intrastate distance 4 6 8
(A. 300 terminals) 2,000
1,500
1,000
500
(B.l,OOOterminals) 2,000
1,500
1,000
500
200 679 670 665 100 535 515 504 50 463 438 424
200 642 643 644 100 498 488 483
50 425 411 403
200 605 617 623 100 461 462 463
50 388 385 382
200 568 590 603 100 424 425 442
50 351 358 362
200 2266 2234 2216 100 1784 1718 1681
50 1543 1459 1413
200 2142 2145 2147 100 1660 1629 1612
50 1419 1371 1344
200 2018 2057 2079 100 1536 1541 1543
50 1296 1283 1276
200 1895 1969 2010 100 1413 1452 1474
50 1172 1194 • 1207
* The costs given in the last three columns are annual costs in thousands of dollars communication and multiplexing costs are included with capital costs annualized at an interest rate of 10% with an 8 year lifetime. ** K is the number of clusters of 8 terminals each connected to each long line.
4 9 4

TABLE XI
Cost of Communication System 6: Satellite Distribution*
G*** V*** $ 1,000 $ 3,000 $ 6,000
(A. 300terminals) 0 73 95 127
100 173 195 227 300 373 395 427 500 573 595 627
(B. 1,000terminals) 0 192 264 272
100 292 364 472 300 492 564 672 500 692 764 872
* The costs given in the last three columns are annual costs in thousands of dollars; communication and multiplexing costs are included with capital costs annualized at an interest rate of 10% with an 8 year lifetime. ** V = annual cost in thousands of dollars of satellite transponder capital cost or use charges. *** G = cost of R F portion of each remote ground station.
necessar i ly due to the s t ruc tu re o f the t e l ephone t a r i f f sys tem.
Perhaps the m o s t in teres t ing resul t t ha t emerges f r o m this deta i led analysis is the v iabi l i ty o f a sate l l i te-based sys tem. F o r d is tances o f the o rder o f 500 miles there a l ready appears to be a dis t inct cost advantage for the satel l i te a p p r o a c h ; for d is tances o f a t h o u s a n d miles or m o r e the advan tage is qui te p r o n o u n c e d . The i m p o r t a n c e o f this f inding depends on the f o r m o f the evo lu t ion o f usage o f the higher qua l i ty ins t ruc t ion made
possible by in te rac t ive sys tems. I f a large ins t ruc t iona l c o m p u t e r sys t em serves on ly its i m m e d i a t e geographica l locale, it is clear tha t c o m m u n i c a - t ions are best hand led by t e l e p h o n e or cable sys tems. However , rel iance on t e l e p h o n e line sy s t ems seems to p rec lude access to this f o r m o f high qua l i ty in s t ruc t ion for dispersed popu la t ions . Satel l i tes will p lay a critical role for d i s t r ibu t ion o f in te rac t ive ins t ruc t ion if na t iona l pr ior i t ies indicate
sensi t iv i ty to the needs of dispersed popu la t i ons pr ior to the t ime when ( p r o b a b l y 15 or 20 yea r hence) every geographica l local i ty has its own in te rac t ive ins t ruc t iona l sys tem, or cable n e t w o r k s b e c o m e versat i le enough and suf f ic ien t ly dense to serve as an in terac t ive sys t em c o m m u n i - ca t ion n e t w o r k .
495

IV. Implementation Alternatives for CAI Networks
In the preceding sections we discussed the costs of alternative meth- ods of providing CAI to dispersed populations. In this section we use these costs as an input to analysis of the basic economics of providing CAI, and the various implementation alternatives available.
A. BASIC ECONOMICS OF PROVIDING CAI
The cost per operational CAI terminal in a school depends on many factors related to the basic organization of the system that provides the service. Later in this section, we will discuss a number of alternatives to that presented in this paper and reference more detailed cost estimates for them. First, however, we will make analyses of basic economic trade-offs, simply using conservative cost values based on estimates for the immediate future; we emphasize, however, that many components of these costs are declining.
Our basic cost assumption for this analysis in that for $ 300 per month a Teletype terminal can be maintained in a typical school. This is deliberately highly conservative in order to allow a high margin for proctor costs and start-up inefficiencies. For a typical configuration with a 1,300-terminal system and a highly dispersed user population, Sections II and III indicate that the central facility, communication and multiplexing, and terminal costs would total $ 125 to $ 200 per month per terminal. This cost includes amortization of capital costs, use of the central com- puter system, communications, terminals, and operations and mainte- nance. It does not include any expenditures associated with making classroom space available, and it assumes the curriculum to already be available. We also assume that for 20 days per month an average of 25 student sessions per day are given at each Teletype. Thus, we assume 500 sessions per terminal per month at a cost of $ 300, or $ 0.60 per session. We have observed high variance in the number of sessions per terminal per day obtained by different schools, and with effective scheduling it is feasible to obtain many more sessions per terminal per day than the 25 we assume. Some schools currently participating on the IMSSS network are obtaining utilization rates in the range of 35 to 40 sessions per terminal per day, suggesting the possibility of substantially lower costs per session than the $ 0.60 that we use. Also, we have assumed a six-hour school day; some residential schools for the deaf are using their terminals eight to ten hours per day, further increasing the number of sessions per terminal per day and further decreasing the cost per session. (In the preceding section we saw the possibility of reducing costs to $ 0.85 per student contact
496
hour if usage can be pushed up to 2,000 hours per terminal per year.) The decision of whether to provide CAI a n d how much CAI to
provide depends not only on cost per session but on two other critical factors. First, of course, is the performance of CAI in raising student achievement. We will not examine data on CAI as an instructional tool in the paper bu t evaluations of IMSSS CAI curriculum can be found in Fletcher and Atkinson (1971), Suppes and Morningstar (1969), and else- where. 9 Second is the issue of what must be given up in order to have CAI. Given that budgets are inevitably constrained, the more CAI an administrator provides his students, the less he can provide of something else. A requirement of good administration is to make these trade-offs explicitly, both in terms of their cost and of their performance.
We will examine the situation in schools for the deaf, which cur- rently use about half of the IMSSS student terminals, to illustrate how administrators might evaluate decisions about the use of CAI. Due to the low student-to-staff ratios, a larger fraction of resources goes into staff in schools for the deaf than in other schools, and the most feasible way of financing CAI is, therefore, through slight increases in the student-to-staff ratio. This method is the most feasible even if new resources for acquiring CAI come from outside the school; the new funds could have been allocated to lowering the ratio of students to staff rather than to providing CAI.
The trade-offs are summarized in the following equation adapted from Jamison ( 1971).
S * = S + I (SW(1-R) )+(C(N)SZR) 1 W -(C(N)SR )
where
S* is student-to-staff ratio after introduction of CAI, S is student-to-staff ratio before introduction of CAI, W is average annual salary of the instructional staff, R is ratio of the post-CAI instructional cost per student to the
pre-CAI cost, and C(N) is the cost of providing a student N sessions of CAI per year.
To estimate the "oppor tun i ty" cost of CAI, we solve the equation for S* as a function of N (the number of CAI sessions per student per year) under the assumption that R = 1; i.e., we assume that CAI is introduced into schools for the deaf with no net increase or decrease in
9 A survey of these evaluations, as well as a study of the impact of CAI on the distribution of achievement, may be found in Jamison et al. (1972).
497

per-student instructional costs. To complete the calculation we need to know staff salaries and staff-to-student ratios and, to take an example, Table XII displays this information for a number of different types of schools for the deaf. For the present illustration, we consider public day schools where the instructional staff salaries recently averaged $ 8,760 per year and the student-to-instruction-staff ratio was 4.5. We have, then, S = 4.5, W = 8760, R = 1, and, using the previous assumptions about costs, C(N) = $ 0.60N. The trade-off equation then becomes:
S* = 4.5 + 12.15N/(8760 - 2.7N).
TABLE XII
Salaries and Student-to-Staff Ratios in Schools for the Deaf for the 1968-69 School Year*
Type of school Average annual salary of in- Ratio of students to instruc- structional staff ($) tional staff
Public res. schools 7564 5.6 Private res. schools 6251 4.9 Public day schools 8760 4.5 Private day schools 6009 4.5 Public day classes 7721 3.9 Private day classes 7740 4.4
* Source: "Tabular Statement of American Schools and Classes for the Deaf, October 31, 1968," pp. 6 2 2 - 2 3 of the Directory o f Services for the Deafin the United States - American Annals o f the Deaf, May, 1969.
TABLE XIII
Student-to-Staff Ratio Required to Leave Per-Student Instructional Costs Cons'rant with Implementation of CAI*
Number of CAI sessions per year Student-to-instructional-staff ratio
0 4.5 1 O0 4.64 200 4.79 300 4.95 500 5.30
1000 6.50
* The figures in this table assume a pre-CAI student-to-instructional-staff ratio of 4.5 and an average annual salary for the instructional staff of $ 8760. CAI is assumed to $ 0.60 per 6 to 10 minute session.
498

Table XIII shows the student-to-staff ratio calculated from the above equation required to leave per-student instructional costs unaltered if each student has N CAI sessions per year for six values of N.
It is evident from Table XIII that substantial amounts of CAI are feasible with only minor increases in student-to-staff ratios. For example, increasing the student-to-staff ratio by 10%, from 4.5 to 4.95, would allow each child to have almost two CAI sessions daily (300 per year). The question facing the school administrator is whether the achievement gains resulting from this amount of CAI would counterbalance the achievement losses (if any) resulting from the slightly higher student-to-staff ratio.
B. IMPLEMENTATION ALTERNATIVES
In the preceding subsection, we outlined the basic economic consid- erations that would lie behind an administrative decision to utilize CAI in schools for the deaf. Now we will look at four possibilities for imple- menting CAI in schools for the deaf. Again, the schools for the deaf are simply used as an example of a typical dispersed population. These alternatives are equally possible for other groups of CAI users.
The first implementation alternative would consist of operational utilization of the IMSSS facility at Stanford, with the Stanford staff continuing in their present liaison, maintenance, and administrative roles. By the beginning of the 1973-74 school year, up to 300 terminals at various locations around the country could be made available enabling 5,000 to 10,000 deaf students to receive CAI as a standard part of their curriculum. The total cost per terminal per month would be between $ 250 and $ 400. This approach would have the advantage of being a direct extension of the services currently provided by Stanford and implementation problems would be minimized. Further, if curriculum development for the deaf were continued at Stanford, new and revised curriculum materials would be immediately available to all students in the network.
The second implementation alternative is identical to the first except that major administrative and operational responsibilities would be trans- ferred to a school serving the deaf community. That school would be responsible for liaison with other schools, communications, Teletype maintenance, and administration of everything except the central compu- tation facility at Stanford. The major attraction of this approach lies in the gradual but explicit transfer of technological expertise and control from the developers of a CAI system to its users.
A third alternative would be to implement the curriculums developed at Stanford with stand-alone mini-computer systems. The central proces-
499

sor on such systems requires no operator, and it is capable of serving 8 to 32 student terminals with relatively simple curriculum materials. Jamison, e t al. (1970) provide a more detailed description and cost analysis for systems of this sort. Communication and multiplexing costs would be minimized by the small geographical dispersion of users. Pre-terminal costs using this approach would be approximately two-thirds to three-fourths the costs involved in the first and second alternatives. However, the range of curriculums offered on mini-systems is more limited than in the first and second alternatives, and curriculum revision is far more difficult.
A fourth alternative, diametrically opposite to the third, would be to establish a large CAI center for the deaf that would be capable of simultaneously running 500 to 1,500 terminals such as the system de- scribed in this paper. Such a center would require nationwide communica- tions. It could take full advantage of new and revised curriculums as they become available, and it could provide a wider range of curriculums than could a mini-system. As was shown in Section III, the use of communica- tion satellites appears to be an economically attractive way of distributing CAI to a population as dispersed as that of deaf students. Per-terminal costs for a large-scale system such as this would probably fall between those of a mini-system and those of an expanded Stanford-based system. The difficulty with proceeding directly to this option is the substantial time lag between decision and implementation and the administrative difficulties inherent in expanding a small scale of operations to a very large one.
The above four alternatives summarize our current ideas for opera- tionally implementing the results of presently available curriculum devel- opment efforts. These alternatives are not mutually exclusive. For exam- ple, it would be very natural to conceive of the second alternative evolving into the fourth. Similarly, a useful experiment to undertake would be to compare either the first or second alternative with the third, using differ- ent schools for the deaf in the two approaches.
The decision as to how to best educate any student population is always complex, and is usually made more difficult by budget constraints. One important factor in such decisions involves the relative effectiveness of different instructional methods for the particular students under con- sideration. We feel that it is also important for the educators who make such decisions to consider the relative costs of different instructional methods; and we have shown in this paper that, in terms of cost, CAI is a viable alternative for instructing dispersed student populations, particularly with the possibility of a satellite communication network.
500

References
Bitzer, D. and Skaperdas, D. (1969). "The design of an economically viable large scale computer based education system." CERL Report X-5, February, 1969, University of Illinois.
Dunn, D., Lusignan, B. and Parker, E. (1972). "Teleconferencing: Cost optimization of satellite and ground systems for continuing professional education and medical services." Radioseience Laboratory Report, May, 1972, Stanford University.
Fletcher, J. D. and Atkinson, R. C. (1971). "An evaluation of the Stanford CAI program in initial reading (grades K through 3)." Technical Report No. 168, March 12, 1971, Stanford University, Institute for Mathematical Studies in the Social Sciences.
Jamison, D. (1971). "Alternative strategies for primary education in Indonesia: A cost-effectiveness analysis." Research Paper 46, September, 1971, Stanford Univer- sity, Graduate School of Business.
Jamison, D., Suppes, P. and Butler, C. (1970). "Estimated costs of computer assisted instruction for compensatory education in urban areas." Educational Technology, 10: 49-57 .
Jamison, D., Fletcher, J. D., Suppes, P. and Atkinson, R. (1972). "Cost and perfor- mance of computer-assisted instruction for education of disadvantaged children." In R. Radner and J. Froomkin (Eds.), Education as an Industry. National Bureau of Economic Research. (Available as Research Paper 20, Graduate School of Business, Stanford University, 1971 .)
Stetten, K. 1972. Toward a Market Success for CAI: An Overview o f the TICCIT Program, MacLean, Va.: The MITRE Corp.
Suppes, P. (1971). "Computer-assisted instruction at Stanford." Technical Report No. 174, May 19, 1971, Stanford University, Institute for Mathematical Studies in the Social Sciences.
Suppes, P. and Morningstar, M. (1969). "Computer-assisted instruction." Science, 166: 343-50.
Suppes, P. and Morningstar, M. (1972). Computer-Assisted Instruction at Stanford, 1966-68 : Data, Models and Evaluation o f the Ari thmetic Program. New York: Academic Press.
Suppes, P., Jerman, M. and Brian, D. (1968). Computer-Assisted Instruction: Stan- ford's 1 9 6 5 - 6 6 Ari thmetic Program. New York: Academic Press.
Suppes, P., Goldberg, A., Kanz, G., Searle, B. and Stauffer, C. (1971). "Teacher's handbook for CAI courses." Technical Report No. 178, September 1, 1971, Stan- ford University, Institute for Mathematical Studies in the Social Sciences.
501
![Preparation and characterization of very highly dispersed ... · pient wetness method resulted in well dispersed alumina-supported systems [16] but less well dispersed silica-supported](https://img.pdfslide.us/doc/110x75/5edc8590ad6a402d666736ef/preparation-and-characterization-of-very-highly-dispersed-pient-wetness-method.jpg)


![Medication-Assisted Treatment (MAT) for Criminal Justice Populations [Insert trainer Name and affiliation information here]](https://img.pdfslide.us/doc/110x75/56649e875503460f94b8bd92/medication-assisted-treatment-mat-for-criminal-justice-populations-insert.jpg)