Embed Size (px)
Citation preview
Computer Added Monitoring of Drilling Rig Systems
SORIN DAN GRIGORESCU
Faculty of Electrical Engineering
Politehnica University of Bucharest
Splaiul Independentei 313, s.6, Bucharest
ROMANIA
ION POTARNICHE
S.C. ICPE-Actel SA, Bucharest
ROMANIA
COSTIN CEPISCA
Faculty of Electrical Engineering
Politehnica University of Bucharest
Splaiul Independentei 313, s.6, Bucharest
ROMANIA
OCTAVIAN MIHAI GHITA
Faculty of Electrical Engineering
Politehnica University of Bucharest
Splaiul Independentei 313, s.6, Bucharest
ROMANIA
MIRCEA COVRIG
Faculty of Electrical Engineering
Politehnica University of Bucharest
Splaiul Independentei 313, s.6, Bucharest
ROMANIA
Abstract: – This paper describes a computer added system for monitoring and control for inland and offshore
drilling rig appliances. LabVIEW graphic oriented software provides a flexible and reliable support for SCADA.
World wide drilling is developing for oil, gas or water resources demanding computer added monitoring and
control for exploitation and supervising personnel. This applied engineering software offers a complete
monitoring for diesel generators of the local power station and electrical drives of the drilling rig.
Key -Words: - computer added monitoring, drilling rig, monitoring software, virtual instrumentation
1 Introduction
Drilling control and monitoring process is performed
from the so called: “chief driller desk” which is
located at the main running level of the oil well
(gauge circa 1000 x 600 x 1600 mm), where all the
elements of human-machine interface (HMI)
monitoring system are located [1], [2], [3], [4], [5].
The drilling process is a decisional one, highly ordered
and hierarchic with a strict sequence of operations to
follow.
The development of newer software platforms, such as
LabVIEW proves to be a useful tool for developing
application and engineering software for high reliability
COMPUTING and COMPUTATIONAL INTELLIGENCE
ISSN: 1790-5117 169 ISBN: 978-960-474-088-8
and risky processes, as drilling for new resources.
Regardless of drilling type – with electrical
installations where power-line supplies are available
or hydraulic diesel installations for remote areas -
remote control and parameter monitoring of drilling
installation must be performed (usually from a
platform located 10 m above ground) in order to
achieve good results in the process.
The main parameters of the drilling process
monitored by the system are [6], [7], [8]:
- rotational speed and sense of draw-works;
- rotational speed of mud pump drives;
- rotational speed and sense of rotary table;
- drive torque of rotary table;
- mud column pressures and flows;
- drilling depth;
- currents, voltages, frequency of supply source;
- auxiliary service pressures and flows etc.
More than 75% of the total drilling rigs are powered
electrically. To command drilling activities, these
drives and motors are controlled by a command and
control station CCS which is manned by the chief
driller (named PS), as shown in figure 1. Usually the
command and control system is provided by the
electrical drilling equipment manufacturer.
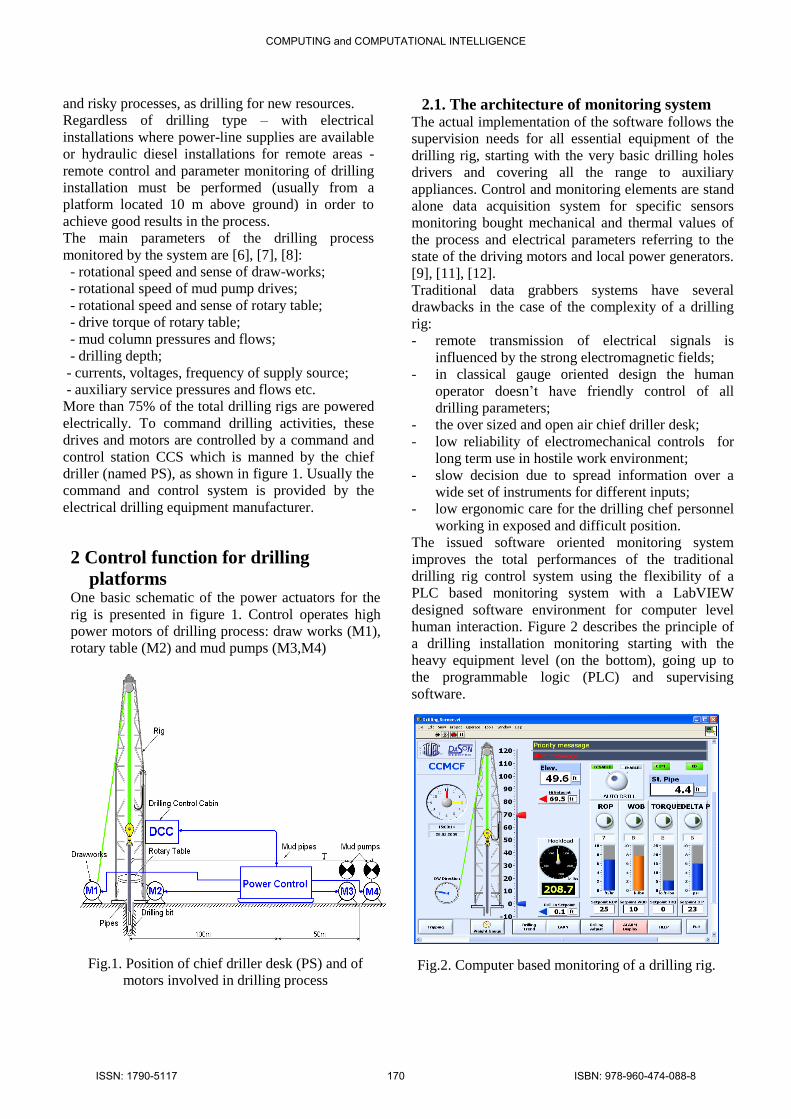
2 Control function for drilling
platforms One basic schematic of the power actuators for the
rig is presented in figure 1. Control operates high
power motors of drilling process: draw works (M1),
rotary table (M2) and mud pumps (M3,M4)
Fig.1. Position of chief driller desk (PS) and of
motors involved in drilling process
2.1. The architecture of monitoring system The actual implementation of the software follows the
supervision needs for all essential equipment of the
drilling rig, starting with the very basic drilling holes
drivers and covering all the range to auxiliary
appliances. Control and monitoring elements are stand
alone data acquisition system for specific sensors
monitoring bought mechanical and thermal values of
the process and electrical parameters referring to the
state of the driving motors and local power generators.
[9], [11], [12].
Traditional data grabbers systems have several
drawbacks in the case of the complexity of a drilling
rig:
- remote transmission of electrical signals is
influenced by the strong electromagnetic fields;
- in classical gauge oriented design the human
operator doesn’t have friendly control of all
drilling parameters;
- the over sized and open air chief driller desk;
- low reliability of electromechanical controls for
long term use in hostile work environment;
- slow decision due to spread information over a
wide set of instruments for different inputs;
- low ergonomic care for the drilling chef personnel
working in exposed and difficult position.
The issued software oriented monitoring system
improves the total performances of the traditional
drilling rig control system using the flexibility of a
PLC based monitoring system with a LabVIEW
designed software environment for computer level
human interaction. Figure 2 describes the principle of
a drilling installation monitoring starting with the
heavy equipment level (on the bottom), going up to
the programmable logic (PLC) and supervising
software.
Fig.2. Computer based monitoring of a drilling rig.
COMPUTING and COMPUTATIONAL INTELLIGENCE
ISSN: 1790-5117 170 ISBN: 978-960-474-088-8
The design target is to integrate the standard control
desk into a computer based framework allowing
monitoring and control of the drilling process
parameters, saving data and commands into a
database providing events and alarms management
and a virtual black-box of the rig to improve the
protection level of this complex equipment. All these
can be obtained using a command controller for
drilling software based on:
- LabVIEW virtual instruments – console
equipment to replace the existing devices on the
drilling platforms allowing friendly use functions to
human operator for the most important drilling
parameters;
- reliable fiber optic communication;
- PLC interface with connected equipment and
sensors.
The interface must be reconfigured with the latest
technologies keeping the door open for future
development and upgrade.
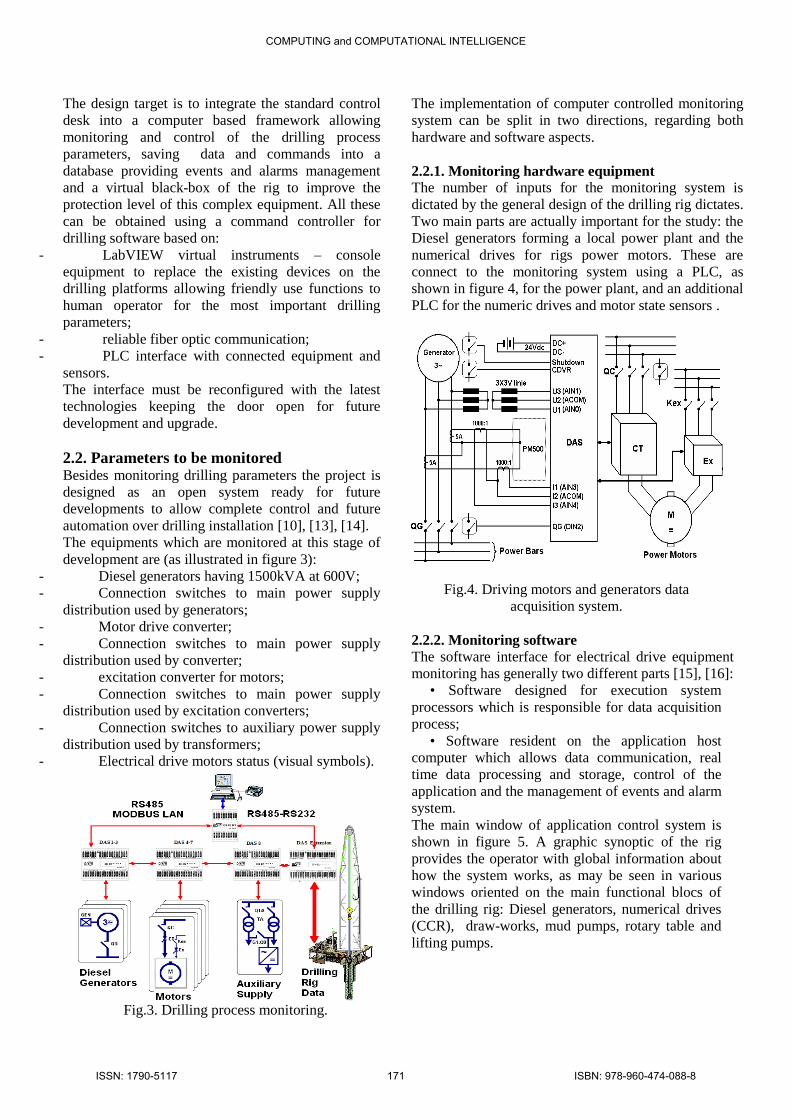
2.2. Parameters to be monitored Besides monitoring drilling parameters the project is
designed as an open system ready for future
developments to allow complete control and future
automation over drilling installation [10], [13], [14].
The equipments which are monitored at this stage of
development are (as illustrated in figure 3):
- Diesel generators having 1500kVA at 600V;
- Connection switches to main power supply
distribution used by generators;
- Motor drive converter;
- Connection switches to main power supply
distribution used by converter;
- excitation converter for motors;
- Connection switches to main power supply
distribution used by excitation converters;
- Connection switches to auxiliary power supply
distribution used by transformers;
- Electrical drive motors status (visual symbols).
Fig.3. Drilling process monitoring.
The implementation of computer controlled monitoring
system can be split in two directions, regarding both
hardware and software aspects.
2.2.1. Monitoring hardware equipment
The number of inputs for the monitoring system is
dictated by the general design of the drilling rig dictates.
Two main parts are actually important for the study: the
Diesel generators forming a local power plant and the
numerical drives for rigs power motors. These are
connect to the monitoring system using a PLC, as
shown in figure 4, for the power plant, and an additional
PLC for the numeric drives and motor state sensors .
Fig.4. Driving motors and generators data
acquisition system.
2.2.2. Monitoring software
The software interface for electrical drive equipment
monitoring has generally two different parts [15], [16]:
• Software designed for execution system
processors which is responsible for data acquisition
process;
• Software resident on the application host
computer which allows data communication, real
time data processing and storage, control of the
application and the management of events and alarm
system.
The main window of application control system is
shown in figure 5. A graphic synoptic of the rig
provides the operator with global information about
how the system works, as may be seen in various
windows oriented on the main functional blocs of
the drilling rig: Diesel generators, numerical drives
(CCR), draw-works, mud pumps, rotary table and
lifting pumps.
COMPUTING and COMPUTATIONAL INTELLIGENCE
ISSN: 1790-5117 171 ISBN: 978-960-474-088-8
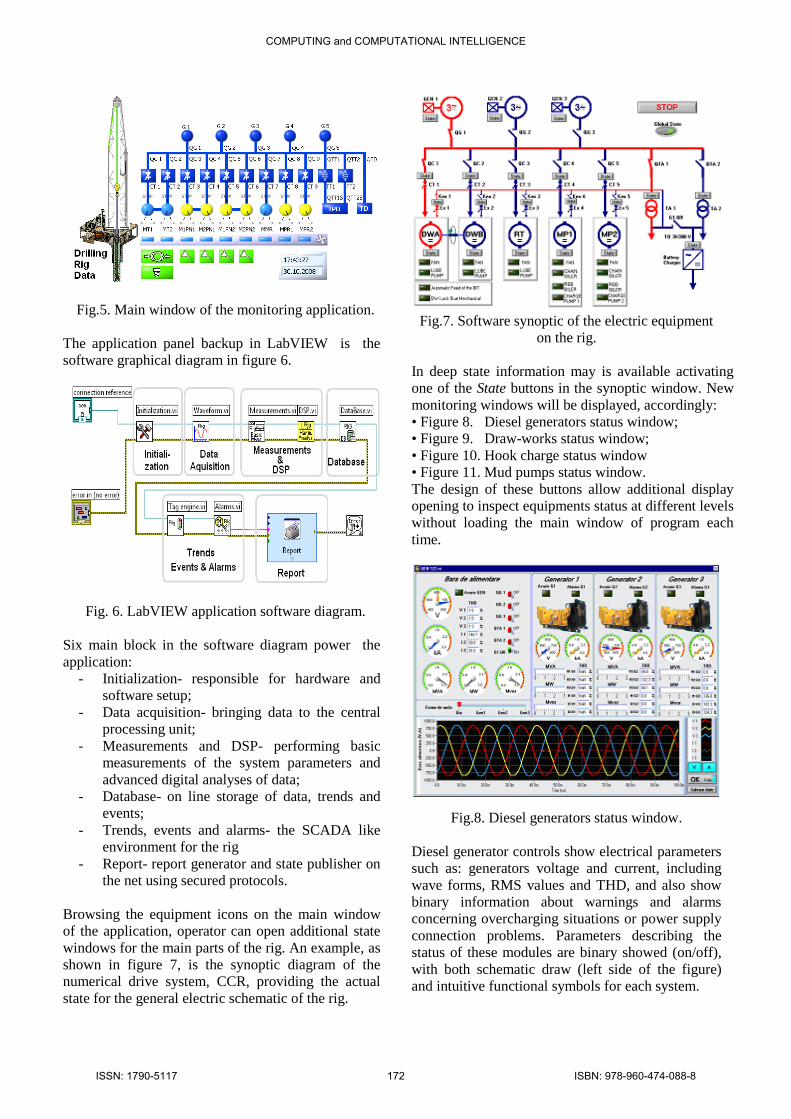
Fig.5. Main window of the monitoring application.
The application panel backup in LabVIEW is the
software graphical diagram in figure 6.
Fig. 6. LabVIEW application software diagram.
Six main block in the software diagram power the
application:
- Initialization- responsible for hardware and
software setup;
- Data acquisition- bringing data to the central
processing unit;
- Measurements and DSP- performing basic
measurements of the system parameters and
advanced digital analyses of data;
- Database- on line storage of data, trends and
events;
- Trends, events and alarms- the SCADA like
environment for the rig
- Report- report generator and state publisher on
the net using secured protocols.
Browsing the equipment icons on the main window
of the application, operator can open additional state
windows for the main parts of the rig. An example, as
shown in figure 7, is the synoptic diagram of the
numerical drive system, CCR, providing the actual
state for the general electric schematic of the rig.
Fig.7. Software synoptic of the electric equipment
on the rig.
In deep state information may is available activating
one of the State buttons in the synoptic window. New
monitoring windows will be displayed, accordingly:
• Figure 8. Diesel generators status window;
• Figure 9. Draw-works status window;
• Figure 10. Hook charge status window
• Figure 11. Mud pumps status window.
The design of these buttons allow additional display
opening to inspect equipments status at different levels
without loading the main window of program each
time.
Fig.8. Diesel generators status window.
Diesel generator controls show electrical parameters
such as: generators voltage and current, including
wave forms, RMS values and THD, and also show
binary information about warnings and alarms
concerning overcharging situations or power supply
connection problems. Parameters describing the
status of these modules are binary showed (on/off),
with both schematic draw (left side of the figure)
and intuitive functional symbols for each system.
COMPUTING and COMPUTATIONAL INTELLIGENCE
ISSN: 1790-5117 172 ISBN: 978-960-474-088-8
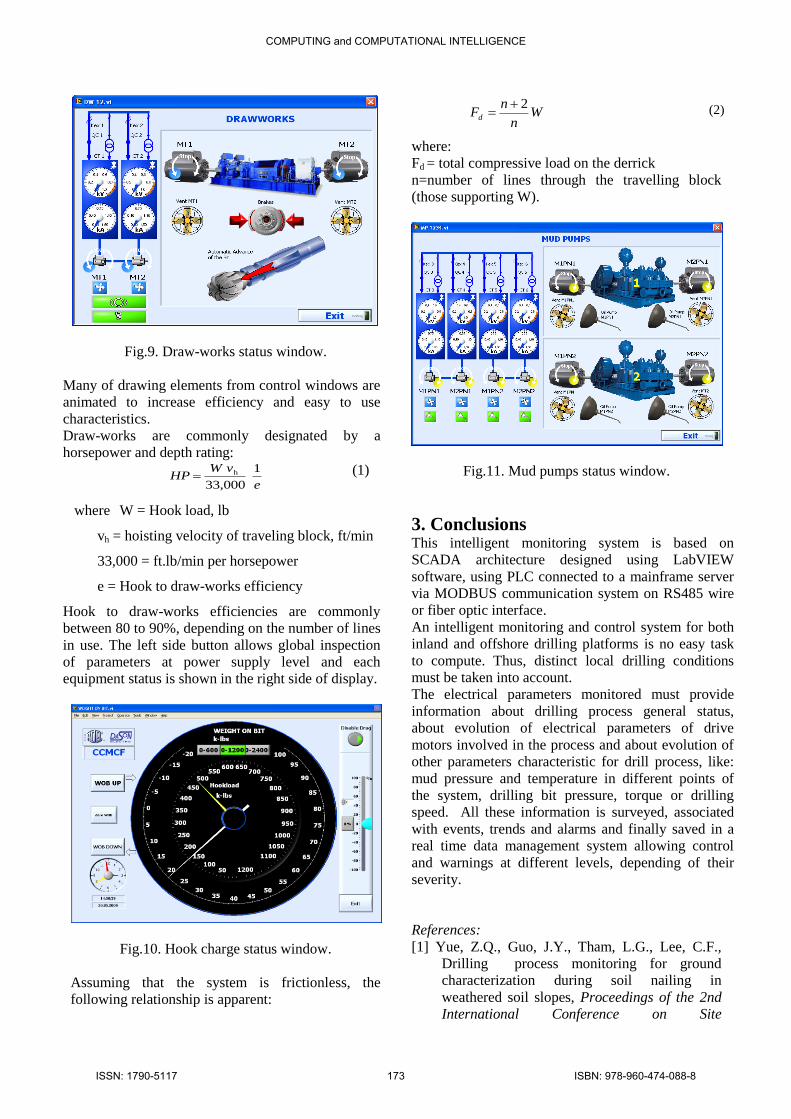
Fig.9. Draw-works status window.
Many of drawing elements from control windows are
animated to increase efficiency and easy to use
characteristics.
Draw-works are commonly designated by a
horsepower and depth rating:
e
vWHP
1
33,000
h (1)
where W = Hook load, lb
vh = hoisting velocity of traveling block, ft/min
33,000 = ft.lb/min per horsepower
e = Hook to draw-works efficiency
Hook to draw-works efficiencies are commonly
between 80 to 90%, depending on the number of lines
in use. The left side button allows global inspection
of parameters at power supply level and each
equipment status is shown in the right side of display.
Fig.10. Hook charge status window.
Assuming that the system is frictionless, the
following relationship is apparent:
Wn
nFd
2 (2)
where:
Fd = total compressive load on the derrick
n=number of lines through the travelling block
(those supporting W).
Fig.11. Mud pumps status window.
3. Conclusions This intelligent monitoring system is based on
SCADA architecture designed using LabVIEW
software, using PLC connected to a mainframe server
via MODBUS communication system on RS485 wire
or fiber optic interface.
An intelligent monitoring and control system for both
inland and offshore drilling platforms is no easy task
to compute. Thus, distinct local drilling conditions
must be taken into account.
The electrical parameters monitored must provide
information about drilling process general status,
about evolution of electrical parameters of drive
motors involved in the process and about evolution of
other parameters characteristic for drill process, like:
mud pressure and temperature in different points of
the system, drilling bit pressure, torque or drilling
speed. All these information is surveyed, associated
with events, trends and alarms and finally saved in a
real time data management system allowing control
and warnings at different levels, depending of their
severity.
References:
[1] Yue, Z.Q., Guo, J.Y., Tham, L.G., Lee, C.F.,
Drilling process monitoring for ground
characterization during soil nailing in
weathered soil slopes, Proceedings of the 2nd
International Conference on Site
COMPUTING and COMPUTATIONAL INTELLIGENCE
ISSN: 1790-5117 173 ISBN: 978-960-474-088-8
Characterization (ISC-2), Porto, Portugal,
September 19-22, 2004. Vol. 2, pp.1219-1224.
[2] Fortunati,F., Pellegrino, G., The use of
electronics in the management of site
investigation and soil improvement works:
principles and applications, Proc. First Int.
Conference on Site Characterization, 1998,
Atlanta, USA, 1 , pp. 359-364.
[3] Peck, J.,Vynne, J.F., Current status and future
trends of monitoring technology for drills,
Proceedings of Int. Mining Geology
Conference, Kalgoorlie, Australia, 1993,
pp.311-325.
[4] Garassino, A.L., Schinelli, M.L.,. Detection of
cavities by monitored borehole drilling, Proc.,
First Int. Conference on Site Characterization,
1998, Atlanta, USA, 1, pp.365-370.
[5] Hamelin, J.P., Levallois, J., Pfister, P.,
Enregistrement des parameters de forage:
nouveaux developments. Bull. Assoc. Int.
Geologie Ingenieur, 1982. 1(26), pp.83-88.
[6] Pfister, P., Recording drilling parameters in
ground engineering, J.Ground Engineering,
1985, 18,pp.16-21.
[7] Yue, Z.Q., Lee, C.F., Law, K.T., Tham, L.G.,
Automatic monitoring of rotary-percussive
drilling for ground characterization – illustrated
by a case example in Hong Kong, International
Journal of Rock Mechanics & Mining Science,
2004,41,573-612.
[8] Yue, Z.Q., Lee, C.F., Tham, L.G., Automatic
drilling process monitoring for rationalizing
soil nail design and construction, Proceedings
of the 2004 Annual Seminar of HKIE
Geotechnical Division, Hong Kong, China,
May 14, 2004, pp. 217-234.
[9] Cepisca,C, Digital Measurements of Non-
Sinusoidal Electrical Quantities and
Metrological Performance, 2nd WSEAS
European Computing Conference, Malta,
September 11-13, 2008.
[10] Macrea D, Cepisca C, Grigorescu,SD,
Required Energy Calculation by Hot Rolling of
Tubes and of the Main Drive Motors Power for
a Stretch Reducing Mill, WSEAS Transaction
on Power Systems, Issue 5, Volume 3, May
2008,pp.320-329.
[11] Cepisca,C,Andrei,H,Grigorescu,S.D,Covrg,M,
Jula,N, Current transformers and the accuracy
of electrical powers and energies
measurements, WSEAS Transactions on
Electronics, Issue 6, V3 June2006, pp.321-326.
[12] Dogaru,V, Cepisca,C, Andrei, H, Dogaru,
Cristina, Contribution concerning the
LabVIEW simulation of the electric
transformer, WSEAS Transactions on Circuits
and Systems, Issue 8, vol. 5, Aug.2006.
[13] Rutkowski,J., Grzechca,D., Use of artificial
intelligence techniques to fault diagnosis in
analog systems, New aspects on computing
research, WSEAS Press,2008, pp.267-275.
[14] Pusik,P, Hangyun,J, Daekyo,S, Kitaeg,L,
Jongchan,C, Design and implementation of the
Vision Interactive Architecture, New aspects
on computing research, WSEAS Press,2008,
pp.355-359.
[15] Siller-Alcala,I, Abderrachime,F, Jaimes-
Ponce,J, Alcalantararamirez,R, Position
predictive control for an induction motor,
Mathematical Methods and Computational
Techniques in Research and Education.,
WSEAS Press, 2007, pp.224-229.
[16] Najib,M, Jadin,M,S, raja,M,T, Mohd,R,M,
Desig and implementation of PID Controller in
programmable logic controller for DC Motor
position, Mathematical Methods and
Computational Techniques in Research and
Education., WSEAS Press, 2007, pp.266-271.
COMPUTING and COMPUTATIONAL INTELLIGENCE
ISSN: 1790-5117 174 ISBN: 978-960-474-088-8