Embed Size (px)
Citation preview
Thesis for the degree of Doctor of Philosophy
Computational studies of nickel catalysed reactions relevant for hydrocarbon
gasification
Abas Mohsenzadeh

ii
Copyright © Abas Mohsenzadeh Syouki
Swedish Centre for Resource Recovery University of Borås SE-501 90 Borås, Sweden Digital version: http://urn.kb.se/resolve?urn=urn:nbn:se:hb:diva-323 ISBN 978-91-87525-67-4 (printed) ISBN 978-91-87525-68-1 (electronic) ISSN 0280-381X Skrifter från Högskolan i Borås, nr. 60 Printed in Sweden by RESPONSTRYCK AB Borås 2015

iii
Abstract
Sustainable energy sources are of great importance, and will become even more important in the future. Gasification of biomass is an important process for utilization of biomass, as a renewable energy carrier, to produce fuels and chemicals. Density functional theory (DFT) calculations were used to investigate i) the effect of co-adsorption of water and CO on the Ni(111) catalysed water splitting reaction, ii) water adsorption and dissociation on Ni(111), Ni(100) and Ni(110) surfaces, as well as iii) formyl oxidation and dissociation, iv) hydrocarbon combustion and synthesis, and v) the water gas shift (WGS) reaction on these surfaces.
The results show that the structures of an adsorbed water molecule and its splitting transition state are significantly changed by co-adsorption of a CO molecule on the Ni(111) surface. This leads to less exothermic reaction energy and larger activation barrier in the presence of CO which means that far fewer water molecules will dissociate in the presence of CO.
For the adsorption and dissociation of water on different Ni surfaces, the binding energies for H2O and OH decrease in the order Ni(110) > Ni(100) > Ni(111), and the binding energies for O and H atoms decrease in the order Ni(100) > Ni(111) > Ni(110). In total, the complete water dissociation reaction rate decreases in the order Ni(110) > Ni(100) > Ni(111).
The reaction rates for both formyl dissociation to CH + O and to CO + H decrease in the order Ni(110) > Ni(111) > Ni(100). However, the dissociation to CO + H is kinetically favoured. The oxidation of formyl has the lowest activation energy on the Ni(111) surface.
For combustion and synthesis of hydrocarbons, the Ni(110) surface shows a better catalytic activity for hydrocarbon combustion compared to the other surfaces. Calculations show that Ni is a better catalyst for the combustion reaction compared to the hydrocarbon synthesis, where the reaction rate constants are small.
It was found that the WGS reaction occurs mainly via the direct pathway with the CO + O → CO2 reaction as the rate limiting step on all three surfaces. The activation barrier obtained for this rate limiting step decreases in the order Ni(110) > Ni(111) > Ni(100). Thus, the WGS reaction is fastest on the Ni(100) surface if O species are present on the surfaces. However, the barrier for desorption of water (as the source of the O species) is lower than its dissociation reaction on the Ni(111) and Ni(100) surfaces, but not on the Ni(110) surface. Therefore the direct pathway on the Ni(110) surface will dominate and will be the rate limiting step at low H2O(g) pressures. The calculations also reveal that the WGS reaction does not primarily occur via the formate pathway, since this species is a stable intermediate on all surfaces.
All reactions studied in this work support the Brønsted-Evans-Polanyi (BEP) principles.
Keywords: DFT, H2O, CO, adsorption, dissociation, formyl, hydrocarbon combustion, hydrocarbon synthesis, water gas shift, gasification, Ni(111), Ni(110) and Ni(100)

iv
v
List of Publications
This thesis is mainly based on the results presented in the following publications:
Paper I: A. Mohsenzadeh, A. Borjesson, J.H. Wang, T. Richards, K. Bolton, The Effect of Carbon Monoxide Co-Adsorption on Ni-Catalysed Water Dissociation, International Journal of Molecular Science, 14 (2013) 23301-23314.
Paper II: A. Mohsenzadeh, K. Bolton, T. Richards, DFT study of the adsorption and dissociation of water on Ni (111), Ni (110) and Ni (100) surfaces, Surface Science, 627 (2014) 1-10.
Paper III: A. Mohsenzadeh, K. Bolton, T. Richards, Oxidation and dissociation of formyl on Ni(111), Ni(110) and Ni(100) surfaces: A comparative density functional theory study, Topics in Catalysis, (2015) 1-14.
Paper IV: A. Mohsenzadeh, T. Richards, K. Bolton, A density functional theory study of hydrocarbon combustion and synthesis on Ni surfaces, Journal of Molecular Modeling, 21 (2015) 1-11.
Paper V: A. Mohsenzadeh, T. Richards, K. Bolton, DFT study of the water gas shift reaction on Ni(111), Ni(100) and Ni(110) surfaces, In press.
Statement of Contribution
Paper I: Performed all the calculations and responsible for the data analyses and writing the manuscript and its revision.
Paper II: Performed all the calculations and responsible for the data analyses and writing the manuscript and its revision.
Paper III: Performed all the calculations and responsible for the data analyses and writing the manuscript and its revision.
Paper IV: Performed all the calculations and responsible for the data analyses and writing the manuscript and its revision.
Paper V: Performed all the calculations and responsible for the data analyses and writing the manuscript and its revision.

vi
vii
TABLE OF CONTENTS
INTRODUCTION .................................................................................................................... 1
1.1 Background .................................................................................................................. 2
1.2 Objectives .................................................................................................................... 3
1.3 Outline of the thesis ..................................................................................................... 4
COMPUTATIONAL METHODS .......................................................................................... 5
2.1 The many-body problem ............................................................................................. 5
2.2 The density functional formalism ................................................................................ 7
2.3 The plane-wave basis ................................................................................................... 9
2.4 Pseudopotentials ........................................................................................................ 10
2.5 Integration over the Brillouin zone ............................................................................ 11
MODELING MATERIALS PROPERTIES ....................................................................... 13
3.1 Slab model ................................................................................................................. 13
3.2 Adsorption sites ......................................................................................................... 14
3.3 The potential energy surface and vibrational frequencies ......................................... 15
3.4 Adsorption energies ................................................................................................... 16
3.5 Transition states and activation barriers .................................................................... 16
3.6 Rate constants and reaction kinetics .......................................................................... 18
3.7 Density of states and charge density .......................................................................... 18
3.8 Brønsted-Evans-Polanyi principle and the transition state scaling method .............. 19
SUMMARY OF THE APPENDED PAPERS ..................................................................... 21
4.1 Paper I ........................................................................................................................ 21
4.2 Paper II ...................................................................................................................... 23
4.3 Paper III ..................................................................................................................... 26
4.4 Paper IV ..................................................................................................................... 30
4.4.1 Catalytic hydrocarbon combustion ................................................................. 30
4.4.2 Catalytic hydrocarbon synthesis ..................................................................... 32
4.5 Paper V ...................................................................................................................... 34
4.6 The transition state scaling for Papers II-V ............................................................... 39
CONCLUSIONS ..................................................................................................................... 41
SUGGESTIONS FOR FUTURE WORK ............................................................................ 45
ACKNOWLEDGEMENTS ................................................................................................... 47
REFERENCES ....................................................................................................................... 49

viii

1
CHAPTER 1
INTRODUCTION
The emission of greenhouse gases such as CO2 is one of the main reasons for climate changes [1, 2]. It is therefore important to move to a carbon-neutral fuel economy, and one route towards such an economy is the conversion of biomass into fuels [3]. Biomass, which is generated from CO2 and H2O by photosynthesis, can thereby be converted into fuels that are again combusted to H2O and CO2. In this scheme, energy is extracted from sunlight, through a short period carbon cycle, without release of carbon from fossil fuel reserves. Four of the six steps in the carbon cycle, labelled as 1-4 in the Figure 1.1, use heterogeneous catalysis. Understanding the mechanisms of these catalytic processes is needed to improve their efficiency and to identify optimal catalysts and operating conditions.
Figure 1.1 Carbon cycle, the catalytic steps are labelled 1-4.
The density functional theory (DFT) can be used to understand the ionic and electronic structure of atomic complexes and surface structures and consequently reactions occurring in

2
heterogeneous catalysis. The DFT is a reliable tool for studying chemical reactions, providing adsorption energies and reaction barriers as well as minimum energy paths on the potential energy surface connecting reactant(s), transition state(s), and product(s). The output of DFT calculations can be coupled to properties at the mesoscopic level via ab initio thermodynamics, and in particular, kinetic modelling.
There are some limitations with DFT method. The band-gaps in semiconductors and insulators are underestimated, whereas, the lattice constants, cohesive energies, and bulk moduli are overestimated [4, 5]. Also, the strong correlations and van‐der‐Waals interactions are neglected in traditional DFT methods. It also may be noted that, compared to many other techniques such as force fields, the DFT is costly in terms of computer resources. However, this method has been shown to give impressive results [5], and is widely used to study the trends of heterogeneous catalytic reactions [6-14].
1.1 Background
Gasification of biomass is an important process for utilization of biomass, as a renewable energy carrier, to produce fuels and chemicals. In fact, the gasification process involves the partial combustion of biomass to produce gaseous fuels (which are often referred to as synthesis gas or syngas) by heating in a gasification medium such as steam, oxygen or air. The gaseous products can be used for generation of heat or electricity, synthesis of liquid transportation fuels, production of hydrogen fuel, synthesis of chemicals, manufacturing of fuel cells, etc. [15].
The water gas shift (WGS) reaction, CO + H2O ⇌ CO2 + H2, is one of the main reactions during gasification process [16] and several other industrial processes, such as steam reforming of natural gas, methanation and production of hydrogen for use in, e.g., fuel cells [17]. Different catalysts are used to increase the efficiency of this reaction, e.g., nickel which is widely applied due to its high heat conductivity, high catalytic conversion and the capability of being manufactured in different shapes [6, 17-20]. Recent investigations suggest that the reaction mainly occurs via three possible mechanisms including the direct, carboxyl, and formate pathways [6, 14, 21, 22]. It is believed that dissociation of water is one of the rate determining steps of the WGS reaction [23]. The interaction of water with solid surfaces is of great importance in many other physical, chemical and biological processes, e.g., steam methane reforming (SMR) [14, 24] where nickel is frequently used as the catalyst.
Also, the formate (HCOO) species is an intermediate that has the highest concentration in the WGS reaction [25-27] and is central in the formate mechanism, where oxidation of CHO is one of the possible routes of its formation (CHO + O ⇌ HCOO).
3
For a more complete understanding of heterogeneous catalysis, it is essential to account for the effect of co-adsorption of reactive chemical species on catalyst surfaces. A typical species can be co-adsorbed is CO, which plays a key role in many catalytic reactions, e.g., the oxidation of carbon monoxide and CO methanation [28-35].
Another important technology which has been developed for efficient energy production with minimum pollutant formation is catalytic combustion of hydrocarbons. Compared to conventional flame combustion, catalytic combustion is used at lower temperatures, and the catalyst plays a decisive role in the improvement of this process [36-38]. A conclusion drawn from earlier studies [39, 40] was that the combustion process proceeds via dissociation of the hydrocarbon into hydrogen and carbon followed by oxidation reactions. However, recent studies suggest that the direct reaction between oxygen and CH fragments can be the most important pathway where an oxymethylidyne (CHO, formyl) intermediate is formed and then dissociates to carbon monoxide and hydrogen [41, 42].
The synthesis of hydrocarbons from syngas is probably the most important method for production of fuels and chemicals using non-petroleum based sources since the early developmental work by Fischer and Tropsch and their co-workers [43]. In the Fischer-Tropsch synthesis (FTS) process, the synthesis gas is converted into various hydrocarbons and water over catalysts such as transition metals [44, 45]. These hydrocarbons can be used as fuel or as feedstock in the chemical industry. The FTS has been investigated both theoretically [42, 46, 47] and experimentally [48-50]. Recent investigations reveal that the reaction via CHO intermediate is the main reaction pathway [51-54]. However, previous studies suggested that both CO and H2 adsorb on the catalyst surface and subsequently dissociate. Then both carbon and oxygen are hydrogenated to CH2 and H2O [55].
Previous studies indicate that the catalytic properties and reaction energies are affected by surface orientation, steps and defects [56-58]. The particles of nickel can grow on oxide or graphite substrates and have polyhedral shapes exhibiting (111), (100) and (110) facets [59].
1.2 Objectives
The objective of this study is to investigate the effect of crystallographic structure of the nickel catalyst on several heterogeneous catalysis processes including the water dissociation, the formyl oxidation and dissociation, the hydrocarbon combustion and synthesis and the WGS reaction. For this purpose, the DFT simulation tools were employed to investigate the energetics, and to optimize the geometrical structures of intermediates in the catalytic surface reactions discussed in the previous section. The same methods and models are used for all surfaces and reactions to elucidate how the reactant, transition state or product relative energies or vibrational frequencies are affected by the crystallographic structure of the nickel
4
catalyst. These data can be used to model the kinetics of the process, to bridge a direct connection between macroscopic observations in experiments and microscopic understating from computations, and to design novel catalysts for these processes.
1.3 Outline of the thesis
This thesis focuses on water splitting on a Ni(111) surface in the absence and presence of a co-adsorbed CO molecule (paper I), as well as comparative DFT studies of the water adsorption and dissociation (paper II), formyl oxidation and dissociation (paper III), the hydrocarbon combustion and synthesis (paper IV) and WGS reaction (paper V) on the Ni(111), Ni(100) and Ni(110) surfaces to postulate potential pathways for these reactions.

5
CHAPTER 2
COMPUTATIONAL METHODS
The electronic structure reflects the spatial and energetic distribution of electrons of an atom, a molecule or a piece of bulk material. The density functional theory (DFT) provides a framework to obtain the electronic structure and the total energy using the concepts of quantum mechanics [60, 61], and therefore can be employed to find stable geometries, calculate binding energies, magnetic, and electronic properties etc. The DFT can be used to address a vast variety of systems and problems in physics, chemistry, biology, and materials science. In this section, a brief summary of the fundamental points of the DFT formalism is provided focusing on a particular scheme, i.e., where the formulation of plane-waves (PWs) in combination with pseudopotentials (PPs) are considered [61].
2.1 The many-body problem
We need to solve time-independent Schrödinger equation (which is a second order, partial differential equation, and it is written here in the eigenvalue form) for studying and analysing the stationary properties of matter:
𝐻𝑡𝑡𝑡𝛹𝑡𝑡𝑡(𝐑, 𝐫) = 𝐸𝑡𝑡𝑡𝛹𝑡𝑡𝑡(𝐑, 𝐫) (2.1)
where 𝐻𝑡𝑡𝑡 is the total Hamiltonian, 𝛹𝑡𝑡𝑡 is the total many-body wavefunction, and 𝐸𝑡𝑡𝑡 is the total energy of the system. 𝛹 are eigenfunctions with the corresponding energy eigenvalues 𝐸, and the lowest energy eigenvalue is referred to as the ground-state energy of the system (𝐸0).

6
All energies higher than the ground-state energy are excited states, and physical and chemical properties of a system can be determined if 𝛹 and 𝐸 are known.
Since the mass of the nucleus is much larger compared to the electron (at least three orders of magnitude), the electronic and nuclear degrees of freedom can be separated. This gives a many-body wavefunction in a separable form as
𝛹𝑡𝑡𝑡(𝐑, 𝐫) = 𝛹𝑒(𝐑, 𝐫)𝛬(𝐑) (2.2)
where 𝛹𝑒(𝐑, 𝐫) is the electronic part and 𝛬(𝐑) is the nuclear part. This approach is referred to as the Born-Oppenheimer (BO) approximation [62]. Thus, the problem is simplified to the time-independent, non-relativistic Schrödinger equation (note that the atomic units are used in Equation 2.3, i.e., ћ = 1
4𝜋𝜀0 = me = e = 1):
𝐻𝑒𝛹𝑒(𝐫𝑖) = 𝐸𝑒𝛹𝑒(𝐫𝑖) (2.3)
where
𝐻𝑒 = 𝑇𝑒 + 𝑉𝑛𝑒 + 𝑉𝑒𝑒 + 𝑉𝑛𝑛 (2.4)
and
𝑇𝑒 = −12∑ ∇𝑖2𝑁𝑒𝑒𝑒𝑒𝑖 (2.5)
𝑉𝑛𝑒 = −∑ ∑ 𝑍𝑎|𝐑𝑎−𝐫𝑖|
𝑁𝑒𝑒𝑒𝑒𝑖
𝑁𝑛𝑛𝑒𝑒𝑒𝑖𝑎 (2.6)
𝑉𝑒𝑒 = ∑ ∑ 1�𝐫𝑖−𝐫𝑗�
𝑁𝑒𝑒𝑒𝑒𝑗>𝑖
𝑁𝑒𝑒𝑒𝑒𝑖 (2.7)
𝑉𝑛𝑛 = ∑ ∑ 𝑍𝑎𝑍𝑏|𝐑𝑎−𝐑𝑏|
𝑁𝑛𝑛𝑒𝑒𝑒𝑖𝑏>𝑎
𝑁𝑛𝑛𝑒𝑒𝑒𝑖𝑎 (2.8)
where 𝑇𝑒 is the kinetic energy, 𝑉𝑛𝑒 is the electron-nuclei Coulomb potential, 𝑉𝑒𝑒 is the electron-electron Coulomb potential, and 𝑉𝑛𝑛 is the nuclei-nuclei Coulomb potential. Za is the atomic number of nucleus a, R and r denote nuclear and electronic coordinates, and ∇𝐫𝑖
2 is the Laplace operator of particle i given as
∇𝐫𝑖2 = � 𝜕2
𝜕𝑥𝑖2 + 𝜕2
𝜕𝑦𝑖2 + 𝜕2
𝜕𝑧𝑖2� (2.9)
The potential that the nuclei move in is obtained by solving the electron density. Therefore, the total groundstate energy can be expressed as a function of the coordinates of nuclei which yields the potential energy surface (PES).
It may be noted that even within the BO-approximation, it is still hard to solve the electronic problem for systems with more than one electron.

7
One approach to solve the electronic problem is the Hartree-Fock approach which is based on approximations of the electronic many-body wavefunction [63-67]. Another approach, suggested by Thomas [68] and Fermi [69], is to use the electron density, n(r), instead of the many-body wavefunction. In their model the problem for a system of N interacting electrons is reduced to only 3 dimensions.
2.2 The density functional formalism
For a system of N electrons, solutions for Equations 2.3-2.8 can be utilized to construct an electron density n(r), which implies that n(r) is determined by the external potential. Two theorems developed by Hohenberg and Kohn [60] state that the opposite is also true. The total energy of a system is a unique functional of the electronic density (to an additive constant), and therefore the ground-state energy (𝐸0) is known by knowing the ground-state density (𝑛0). This can be written as
𝐸[𝑛] = ∫ 𝜐𝑒𝑥𝑡(𝐫)𝑛(𝐫)𝑑𝐫 + 𝐹[𝑛] (2.10)
and
𝐸0[𝑛0] = ∫ 𝜐𝑒𝑥𝑡(𝐫)𝑛0(𝐫)𝑑𝐫 + 𝐹[𝑛0] (2.11)
and
𝐹[𝑛] = 𝑇𝑒[𝑛] + 𝑉𝑒𝑒[𝑛] (2.12)
where F[n] is a universal functional with no dependence on the external potential and contains the kinetic and the Coulomb energies of the system. Hence, the ground-state energy is obtained through a minimization problem as
𝐸0 = min 𝐸[𝑛(𝐫)] =𝐸[𝑛0(𝐫)] (2.13)
Kohn and Sham [70] developed a method to calculate 𝑛0 and 𝐸0 within the DFT formalism, which presently is used in most DFT implementation. They constructed an effective potential (𝜐𝑒𝑒𝑒) for a fictitious system (referred to as a KS system) of non-interacting electrons to calculate an electron density which is identical to that of the real system of interacting electrons. The universal functional for 𝐹[𝑛] can be expressed as
𝐹[𝑛] = 𝑇�𝑒[𝑛(𝐫)] + 12 ∫
𝑛(𝐫)|𝐫−𝐫′|
𝑑𝐫 + 𝐸𝑥𝑥[𝑛(𝐫)] (2.14)
where the first term, 𝑇�𝑒, is the kinetic energy of the non-interacting system with a density 𝑛(𝐫), the second term contains the classical, direct Coulomb energy (also referred to as the Hartree energy), and the last term is the exchange-correlation energy, 𝐸𝑥𝑥, which collects the
8
difference in kinetic energy between the real (interacting) and fictitious (non-interacting) systems (𝑇�𝑒 − 𝑇𝑒) as well as the non-direct electron-electron interaction; exchange and correlation. Each electron in the system is interacting to itself since the Coulomb term includes the density of all electrons. This self-interaction is cancelled due to the exact treatment of exchange in a Hartree-Fock formulation. In density functional theory, however, these contributions are cancelled if the true form of the exchange-correlation potential is known. Consequently, it is critical in DFT to approximate the exchange-correlation potential since the exact form, which includes all the many-body effects, is unknown. The exchange-correlation potential is defined as
𝑉𝑥𝑥 = 𝛿𝐸𝑥𝑒[𝑛]𝛿𝑛(𝐫)
(2.15)
The local density approximation (LDA) approach was suggested Kohn and Sham [70] where the inhomogeneous system is considered as locally homogeneous. Therefore, the local terms are calculated by an integral over the exchange-correlation energy per electron (ϵxc) as
𝐸𝑥𝑥𝐿𝐿𝐿[𝑛] = ∫𝑛(𝐫)𝜖𝑥𝑥 [𝑛(𝐫)]𝑑𝐫 (2.16)
The constructed density decays in an asymptotic exponential manner which causes many of the problems related to the LDA approximation such as overestimation of the dissociation energies of molecules. An improved method beyond the LDA is the generalized gradient approximation (GGA) [71, 72] which includes density gradients in addition to the local electron density as
𝐸𝑥𝑥𝐺𝐺𝐿[𝑛] = ∫𝑛(𝐫)𝜖𝑥𝑥 [𝑛(𝐫),∇𝑛(𝐫)]𝑑𝐫 (2.17)
A number of functionals have been developed based on the GGA approach including Perdew-Wang-91 (PW91) [73], Perdew-Burke-Ernzerhof (PBE) [74], revised PBE [75], and RPBE [76]. Although, the behaviour and the accuracy of functionals should be evaluated for each situation, the GGA functionals generally give results that are in better agreement with experimental chemisorption, binding and atomic energies, and bond lengths and angles compared to LDA [76, 77]. It may be noted that there is a limit for the accuracy of the GGAs due to the exchange term, the inadequate description of the non-local contributions, and presence of self-interaction in the Hartree term. In addition to LDA and GGA functionals, there are other functionals that use higher levels of theory at the expense of increased computational costs, e.g., the meta-GGA and hybrid functionals which include higher order derivatives of the density change and combine the exact exchange from a Hartree-Fock theory with correlation energy calculated from, e.g., GGA calculations. PBE0 [78] and B3LYP [79] are the most common hybrid functionals within DFT.
The minimization problem suggested by Hohenberg and Kohn leads to a set of KS-equations that can be solved for the KS-orbital under the constraint that the total number of electrons is conserved. This can be written as
�− 12∇2 + 𝜐𝑒𝑒𝑒(𝐫)� 𝜙𝑖(𝐫) = 𝜖𝑖𝜙𝑖(𝐫) (2.18)
9
Here, 𝜖𝑖 is the orbital energy of the corresponding KS-orbital, 𝜙𝑖(𝐫), and
𝜐𝑒𝑒𝑒(𝐫) = 𝜐𝑒𝑥𝑡(𝐫) + 𝜐𝐻(𝐫) + 𝜐𝑥𝑥(𝐫) (2.19)
where 𝜐𝑒𝑥𝑡 is the external potential acting on the interacting system, 𝜐𝐻 is the Hartree (or Coulomb) potential, and 𝜐𝑥𝑥 is the exchange-correlation potential.
The density is calculated as
𝑛(𝐫) = ∑ 𝜙𝑖∗(𝐫)𝜙𝑖(𝐫)𝑁𝑖=1 (2.20)
where N is the number of electrons and 𝜙𝑖(𝐫) is the KS-orbital.
It may be noted that the energy eigenvalues (𝜖𝑖) are a consequence of the applied variational principle and appear as Lagrange multipliers, and therefore they have no obvious physical meaning. The KS-orbitals, 𝜙𝑖(𝐫), are constructed to satisfy Equation 2.18 and to provide the correct electron density. They also have no clear physical meaning. In practice, however, 𝜖𝑖 and 𝜙𝑖(𝐫), can be used to draw qualitative conclusions. The sum of 𝜖𝑖 is a large part of the total energy, and KS-orbitals are associated with the electron density.
The exchange correlation and the Hartree potentials need to be evaluated for solving the one-electron KS-equations (Equation 2.18) at the same time that they are a function of the electron density. The density is obtained by the KS-orbitals which in turn are given by solving the KS-equations. Therefore, an iterative approach is applied where a set of trial orbitals, {𝜙𝑖}𝑗, is used to construct the initial density. Then, the KS-equations are solved for a new set {𝜙𝑖}𝑗+1. The solution (which consequently is the ground-state density) has been found if the new and the old sets are consistent. In practice, a combination of new and old densities is used for the iterations until the calculated orbitals do not vary from one cycle to another. This is referred to as the self-consistent field (SCF) loop.
2.3 The plane-wave basis
The choice of the expansion functions for KS-orbitals [𝜙(r)] is of great importance in the application of DFT. The plane-wave (PW) method originates from calculations of extended bulk and surface systems. According to the Bloch's theorem, the KS-orbitals can be written as a product of a periodic cell and a wave-like part as
𝜙𝑗(𝐫) = 𝑒𝑖𝐤∙𝐫𝑢𝑗(𝐫) (2.21)
where k is a point in Brillouin zone, 𝑢𝑗(𝐫) is a function which has the same periodicity as the cell, and 𝑒𝑖𝐤∙𝐫 is a plane wave. The periodic cell contribution can be expressed as a sum using a basis set of plane-waves as

10
𝑢𝑗(𝐫) = ∑ 𝑐𝑗,𝐆𝑒𝑖𝐆∙𝐫𝐆 (2.22)
where 𝑐𝑗,𝐆 are expansion coefficients and G are the reciprocal lattice vectors defined as
𝐆 ∙ 𝑎 = 2𝜋𝑛 (2.23)
where 𝑎 are the real space lattice vectors and n is an integer.
The final expression of the KS-orbitals, where each electronic wavefunction is expressed as a sum of plane-waves, can be written as
𝜙𝑗(𝐫) = ∑ 𝑐𝑗,𝐤+𝐆𝑒𝑖(𝐤+𝐆)∙𝐫𝐆 (2.24)
The summation is applied over all wave vectors (𝐆). The expansion coefficients (𝑐𝑗,𝐆), in practice, decrease by increasing |𝐤 + 𝐆|, which implies that a reduced set of plane-wave expansion terms must be considered: |𝐤 + 𝐆|2 ≤ 2𝐸𝑥𝑐𝑡. This is a simple way to control the computational accuracy since the basis set size varies accordingly together with the accuracy by setting the cut-off energy, Ecut.
Plane wave basis set is complete and unbiased and is not dependent on atomic positions. However, the number of plane waves needed is quite large. Also, the size of basis set increases with increasing the box size, i.e., the vacuum region is included in the calculations which considerably affects the computational costs [80].
2.4 Pseudopotentials
Many of the physical and chemical properties of molecules and solids are derived due to the interactions between the valence electrons. The core electrons do not directly contribute to bonding properties, and are not affected by changes in bonding. These electrons are important due to screening of the nucleus charge and forming an effective potential for the valence states. Therefore, the interactions between the core and the valance electrons can be replaced by a weaker fictitious potential which is referred to as a pseudopotential (PP). It is difficult to describe the rapid oscillations of core and valence states in the core region, and therefore using pseudopotentials leads to a highly reduced basis set.
The effect of the nucleus and core electrons on the valance states are modelled by potentials as
𝑉𝑃𝑃(𝐫) = 𝜐𝐿𝑃𝑃(𝐫) + ∑ 𝜐𝑁𝐿𝑃𝑃(𝐫)𝑙 𝑃�𝑙 (2.25)

11
where the first term, 𝜐𝐿𝑃𝑃(𝐫), is the local part and the second term, the non-local part, accounts for orthogonality between the valence and core states. 𝑃�𝑙 is the projection operator used to project out the different angular components of the wave function.
Several conditions should be fulfilled to construct pseudopotentials. The charge which is integrated within a cut-off radius (rc) should agree between the all-electron (AE) and pseudo-descriptions. This is referred to as norm-conservation. In addition, the calculations using pseudopotentials should provide the same KS-eigenvalues (ϵi) as all electron calculations. It may be noted that choosing a suitable pseudization radius, that will not affect the valence states and consequently the chemical bonding, is of great importance. A larger basis is needed for a smaller radius, i.e., a larger cut-off or more plane-waves. This is referred to as hardness.
It is expected that the same pseudopotential can be transferred between different chemical environments and still reproduce accurate results, which is referred to as transferability of pseudopotentials. However, the idea that the same potential is able to describe different configurations turns out to be questionable sometimes since the pseudopotentials are generated with a specific electronic configuration. Norm-conserving [81] and ultrasoft [82] potentials are the most commonly used potentials. Ultrasoft pseudopotentials (UPPs) have often better transferability and the norm-conservation conditions are "softer" for them. Thus a smaller number of basis functions are needed and therefore smaller cut-offs, which considerably reduces computational costs. In may be noted that UPPs are more difficult to construct.
The projector augmented wave (PAW) method, introduced by Peter Blöchl in 1994 [83], is a generalization of the pseudopotential and linear augmented plane wave (LAPW) methods. The LAPW basis is constructed by dividing the unit cell into spheres around each atom, where the wavefunctions are atomic-like and oscillate rapidly, and the remaining region, where the wavefunctions are not atomic-like and smoothly vary. Each basis function is then defined as a linear combination of atomic-like functions in the spheres connected to a plane wave in the interstitial region. Similarly, the PAW method addresses the rapidly oscillating wavefunctions near the core into smooth wavefunctions which allows for DFT calculations to be performed with greater computational efficiency. Generally, the accuracy of PAW method is improved compared to the UPPs and generation of datasets is easier than for UPPs. In the presented study, the PAW method has been applied for all the calculations.
2.5 Integration over the Brillouin zone
The calculations of the total energy involve integrals over the Brillouin zone. Among the suggested approximations that allow one to consider a reduced set of k-points and to replace the integration with a summation, a 4×4×1 Monkhorst-Pack scheme [84] has been applied in
12
the present study for the numerical integration in reciprocal space. It worth to mention that the size of the k-mesh used depends on the size of the computational cell and the type of the material which is investigated. Smaller Brillouin zone (BZ) sampling intervals (5×5×1 and 6×6×1) were tested and showed insignificant differences in the energies of the optimized structures (less than 0.01 eV).

13
CHAPTER 3
MODELING MATERIALS PROPERTIES
3.1 Slab model
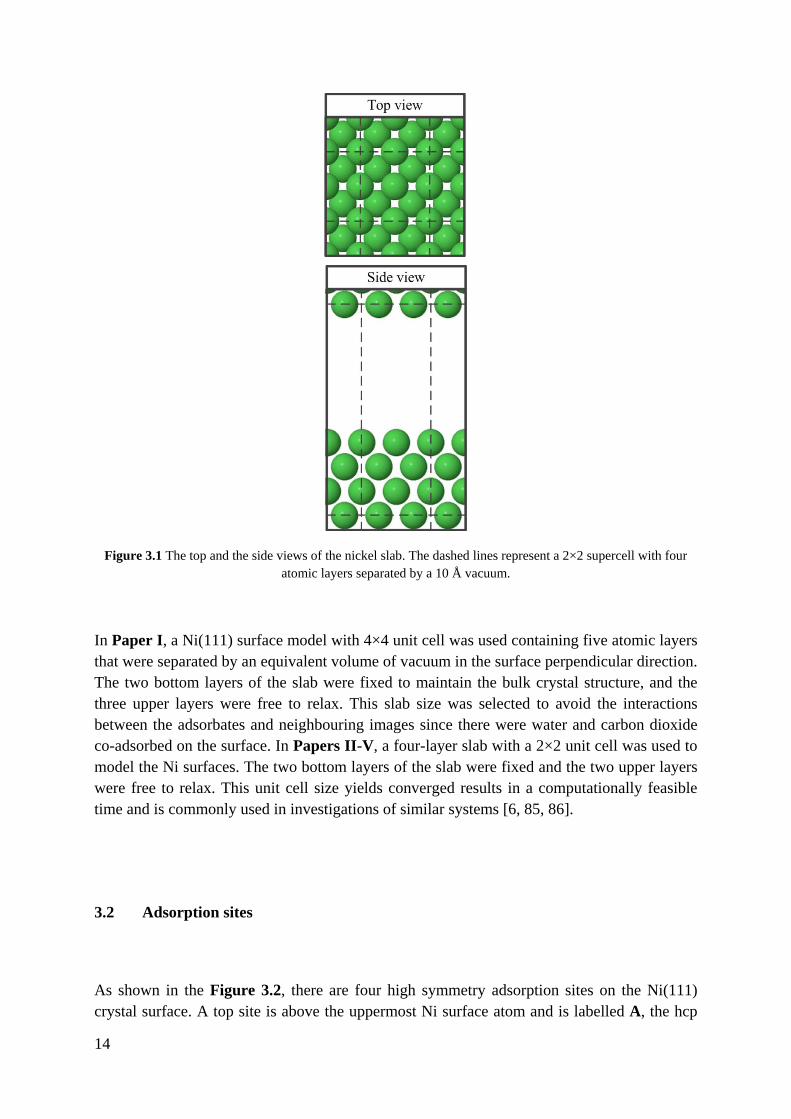
Computational resources available for simulations are limited and consequently modelling all the atoms in a large particle is not possible. A strategy is therefore required in order to reduce the size of the system. A slab approach has been selected for the calculations in the present study, in order to describe surfaces with periodic structure in the surface plane. This is shown in Figure 3.1. The dashed lines represent the computational cell, often referred to as a supercell, which is repeated in the three directions to model an infinite two dimensional surface.
The corresponding bulk material is truncated in the desired crystallographic direction in order to construct the surface slab model. Truncating the bulk affects the electronic structure. Thus the slab thickness needs to be large enough to retain this effect, where the bottom layers of the slab are fixed in their bulk positions to provide a representative model of the semi-infinite bulk material.
Also, a large enough volume of vacuum in the surface perpendicular direction (z-direction) is needed to avoid the interaction between atoms on the surface and the neighbouring cell (see Figure 3.1).
It may be noted that the results of calculations, e.g., adsorption energies, are affected by the coverage due to the electrostatics between adsorbates in neighbouring computational cells.
14
Figure 3.1 The top and the side views of the nickel slab. The dashed lines represent a 2×2 supercell with four atomic layers separated by a 10 Å vacuum.
In Paper I, a Ni(111) surface model with 4×4 unit cell was used containing five atomic layers that were separated by an equivalent volume of vacuum in the surface perpendicular direction. The two bottom layers of the slab were fixed to maintain the bulk crystal structure, and the three upper layers were free to relax. This slab size was selected to avoid the interactions between the adsorbates and neighbouring images since there were water and carbon dioxide co-adsorbed on the surface. In Papers II-V, a four-layer slab with a 2×2 unit cell was used to model the Ni surfaces. The two bottom layers of the slab were fixed and the two upper layers were free to relax. This unit cell size yields converged results in a computationally feasible time and is commonly used in investigations of similar systems [6, 85, 86].
3.2 Adsorption sites
As shown in the Figure 3.2, there are four high symmetry adsorption sites on the Ni(111) crystal surface. A top site is above the uppermost Ni surface atom and is labelled A, the hcp

15
3-fold hollow site is labelled C, the fcc 3-fold hollow site is labelled C' and the 2-fold bridge site between two neighbouring atoms is labelled B. In addition to the top and bridge sites labelled A and B, the Ni(100) crystal surface has a square 4-fold hollow adsorption site labelled D'. There are five high symmetry adsorption sites on the Ni(110) surface. These are the top site labelled A, a 2-fold long bridge site labelled E, a 2-fold short bridge site labelled F, a rectangular 4-fold hollow site labelled D and a quasi 3-fold hollow site labelled G.
Figure 3.2 Different adsorption sites on the Ni(111), Ni(100) and Ni(110) surfaces. A is a top site; B is a bridge site; C is a hcp site; C′ is a fcc site; D is a rectangular 4-fold hollow site; D′ is a square 4-fold hollow site; E is a
long bridge site; F is a short bridge site; G is a pseudo 3-fold hollow site.
3.3 The potential energy surface and vibrational frequencies
The potential experienced by the nuclei is obtained by solving the electronic problem. Optimizations are generally done by evaluating the forces (F) acting on the ions, i.e., the derivative of the energy with respect to the position of the atoms (𝑅𝑖) as
𝐅 = −∇𝑅𝑖𝐸𝑡𝑡𝑡 (3.1)
where ∇ is the gradient operator and 𝐸𝑡𝑡𝑡 is the total energy of the system.
Vibrational frequencies can be calculated from electronic structure calculations when ΔF = 0, i.e, at the stationary points on the potential energy surface. A second-derivative matrix of the energy, often referred to as the Hessian matrix [87], can be constructed as

16
𝐇𝑖𝑗 = 1
�𝑚𝑖𝑚𝑗
𝛿2𝐸𝛿𝛿𝑖𝛿𝛿𝑗
(3.2)
where qi and qj are coordinates of atoms i and j, with corresponding masses of mi and mj. Finite differences are used to estimate the second order derivatives. The corresponding eigenvalues and eigenvectors, which are the vibrational frequencies and normal mode eigenvectors, are calculated by diagonalizing the Hessian matrix. The calculated vibrational frequencies can be used to confirm that the stationary structures are minimum energy (zero imaginary frequencies) or transition states (one imaginary frequency) and to calculate the vibrational partition functions and zero point vibrational energies (ZPVEs).
3.4 Adsorption energies
The system rearranges to minimize the total energy when an atom or molecule approaches the surface. The adsorption energy can therefore be calculated by looking at energies of two extreme systems, i.e., the relaxed and the non-interacting system. The adsorption energies (Eads) of the reactants and products were calculated as
Eads = Esurf + adsorbate – Esurf – Eadsorbate (3.3)
where Esurf is the total energy of the geometry optimized surface, Eadsorbate is the total energy of the isolated, geometry optimized adsorbate(s) in the gas phase and Esurf +adsorbate is the total energy of the geometry optimized surface-adsorbate(s) system.
3.5 Transition states and activation barriers
Density functional theory has been successfully used to calculate transition states and activation barriers of chemical reactions [5]. This can be done by identifying a minimum energy path (MEP) on the potential energy surface (PES) that connects a reactant and a product structure. In a chemical reaction, the transition state is a particular configuration along the reaction coordinate which has the highest potential energy. Therefore, a first-order saddle point, between the reactant and the product structures, needs to be located on the PES. At this point, the curvature in all directions, except one, is positive. A schematic representation of a potential energy surface is shown in Figure 3.3.

17
The reactant needs to overcome an energy barrier, which is referred to as activation energy or barrier, as the reaction proceeds to product. It may be noted that both reactants and products are local minimums on the PES, and a specific reactant may lead to different products.
The climbing image-nudged elastic band (CI-NEB) method [88, 89] was used to locate the transition states, where the lowest energy reactant and product configurations are selected as the initial and final states. Then, six images are placed between the reactant and product geometries. In a regular NEB [90] method, the calculations are performed making use of a series of constrained optimizations between the reactant and product states. In contrast, in the CI-NEB method, the corresponding maximum-energy image does not feel the constraint imposed on the rest of the images, and therefore results in the true transition state.
The dimer approach [91] was also employed to locate some of the transition states using the same convergence criteria. In this method, the most stable configuration of the reactant on the surface is determined using a standard DFT minimization method before searching for a nearby saddle point.
As mentioned before, a frequency analysis is needed to validate the TS where the vibrational frequency calculation yields one imaginary frequency while the other frequencies are positive as a consequence of the gradient requirement on PES. The imaginary eigenvector was used to validate that the TS was correct for the desired reactant-products reaction path.
Figure 3.3 A schematic representation of a potential energy surface (PES). The figure is inspired by Ref. [92].
18
3.6 Rate constants and reaction kinetics
The vibrational frequencies are also used to estimate the rate constants (k) from the transition state theory [93] as
𝑘 = �𝑘𝐵𝑇ℎ� �𝛿
‡
𝛿� 𝑒−
Ea𝑘𝐵𝑇 (3.4)
where kB is Boltzmann’s constant, T is the absolute temperature and h is Planck’s constant. q and q‡ are the partition functions for the reactant and the transition state, respectively, and Ea is the ZPVE corrected activation energy. The partition functions were calculated using harmonic vibrations. Although this approximation may affect the quantitative results presented in this study, it is not expected to affect the trends [13, 57, 85, 94, 95].
For the reaction kinetics, the ODE45 solver in the MATLAB R2013a simulation package [96] was employed to solve the related ordinary differential equations (ODEs) using the rate constants determined by the DFT calculations.
3.7 Density of states and charge density
Interpretation of the electronic structure aids the understanding of material properties and clarifying the results. The number of states per energy E, normalized to the total number N, is obtained by a direct projection of the state-density on the energy as
𝐷𝐷𝐷 = 𝐷(𝐸) = 1𝑁∑ ⟨𝜙𝑛|𝜙𝑛⟩𝛿(𝐸 − 𝐸𝑛)𝑛 (3.5)
where 𝐸𝑛 are the eigenvalues of the KS eigenstates (𝜙𝑛). A schematic representation of the density of states corresponding to a number states available within an energy interval is shown in Figure 3.4.
The projected density of states (PDOS) provides further resolution by considering contributions from different angular momenta as
𝑃𝐷𝐷𝐷 = 𝐷𝑙𝑚(𝐸) = 1𝑁∑ ⟨𝜙𝑛|𝜙𝑙𝑚⟩⟨𝜙𝑙𝑚|𝜙𝑛⟩𝛿(𝐸 − 𝐸𝑛)𝑛 (3.6)
The charge density on each ion was calculated by integrating the valence charge density within the Wigner-Seitz spheres around each atom. The radius was selected such that the total volume over all atoms is approximately 100% and that the ratios of the atomic radii is equal to that of the ionic radii [97].

19
Figure 3.4 A schematic representation of the density of states corresponding to a number states available within an energy interval.
3.8 Brønsted-Evans-Polanyi principle and the transition state scaling method
These methods have been applied to validate the results of the calculations. The Brønsted-Evans-Polanyi (BEP) principle states that the activation energy for a given reaction should be linearly proportional to the reaction energy [98, 99]. The transition state scaling (TSS) method [100, 101] is often used interchangeably with the BEP relationship. This method correlates the energy of the transition state (ETS) with the energy of either the initial state (EIS) or final state (EFS) of a reaction.

20

21
CHAPTER 4
SUMMARY OF THE APPENDED PAPERS
4.1 Paper I
Using DFT calculations, the effect of co-adsorption of carbon monoxide on the adsorption and dissociation of water on the Ni(111) surface has been studied. As discussed in Paper I, the geometry optimizations of the reactants and products were performed on the sites that have previously been shown [14] to yield the lowest energy structures, i.e., the most favourable sites. The results are shown in Table 4.1.
In the absence of CO, the water molecule (the reactant) is adsorbed on the top site (site A in Figure 3.2) via its O atom with an binding energy of −0.27 eV. Both of its O-H bonds have similar lengths. Both OH and H (the products) are adsorbed on the fcc site (site C´ in Figure 3.2) with an adsorption energy of –5.83 eV. The OH is adsorbed via the O atom similarly to the water molecule.
For co-adsorbed CO and H2O, and for co-adsorbed CO, H and OH, the obtained energies are −2.32 eV and −7.63 eV, respectively. The presence of the CO does not affect the preferred adsorption sites. However the reactant geometry is affected by co-adsorbed CO. The O-H bonds in the single water molecule are almost the same whereas, in the presence of CO, the O-H bond closest to the CO molecule is 0.015 Å longer than the other bond. This is probably due to interactions between the CO molecule and this H atom since the distance between them is only 1.88 Å. These interactions are also reflected in the vibrational frequencies as the asymmetric stretching mode is lowered from 3612 cm−1 to 3412 cm−1 in the absence and
22
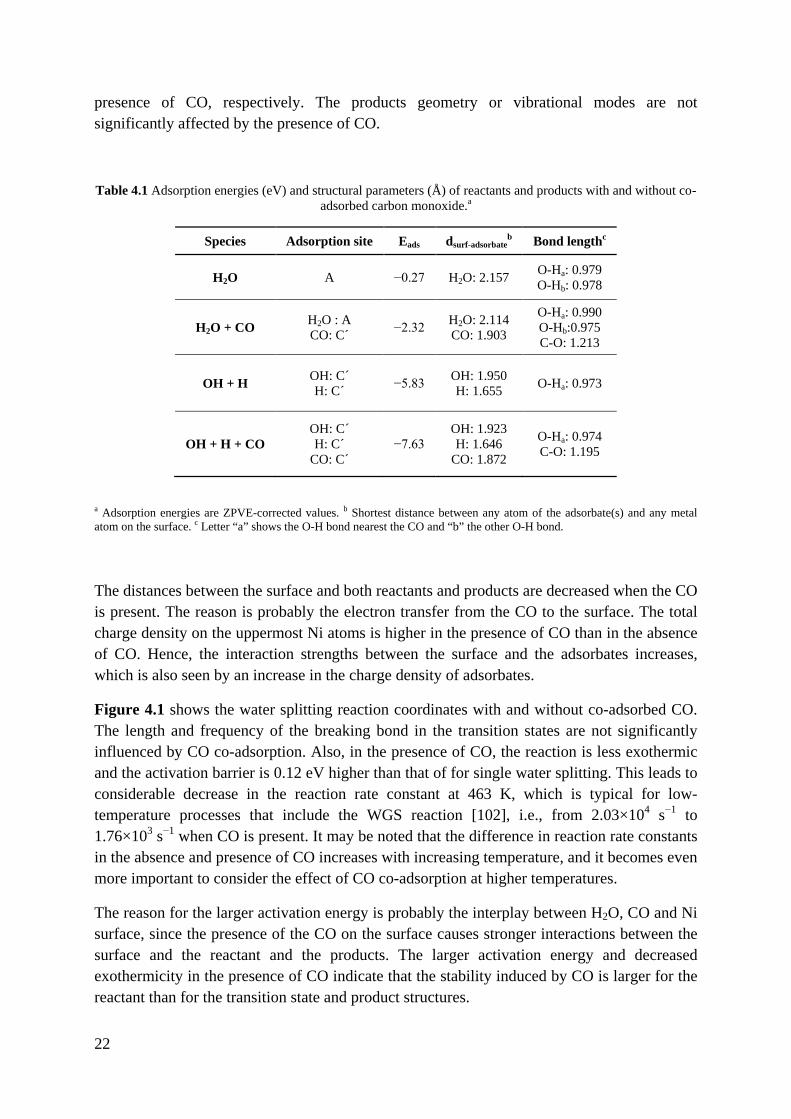
presence of CO, respectively. The products geometry or vibrational modes are not significantly affected by the presence of CO.
Table 4.1 Adsorption energies (eV) and structural parameters (Å) of reactants and products with and without co-adsorbed carbon monoxide.a
Species Adsorption site Eads dsurf-adsorbateb Bond lengthc
H2O A −0.27 H2O: 2.157 O-Ha: 0.979 O-Hb: 0.978
H2O + CO H2O : A CO: C´ −2.32 H2O: 2.114
CO: 1.903
O-Ha: 0.990 O-Hb:0.975 C-O: 1.213
OH + H OH: C´ H: C´ −5.83 OH: 1.950
H: 1.655 O-Ha: 0.973
OH + H + CO OH: C´ H: C´
CO: C´ −7.63
OH: 1.923 H: 1.646
CO: 1.872
O-Ha: 0.974 C-O: 1.195
a Adsorption energies are ZPVE-corrected values. b Shortest distance between any atom of the adsorbate(s) and any metal atom on the surface. c Letter “a” shows the O-H bond nearest the CO and “b” the other O-H bond.
The distances between the surface and both reactants and products are decreased when the CO is present. The reason is probably the electron transfer from the CO to the surface. The total charge density on the uppermost Ni atoms is higher in the presence of CO than in the absence of CO. Hence, the interaction strengths between the surface and the adsorbates increases, which is also seen by an increase in the charge density of adsorbates.
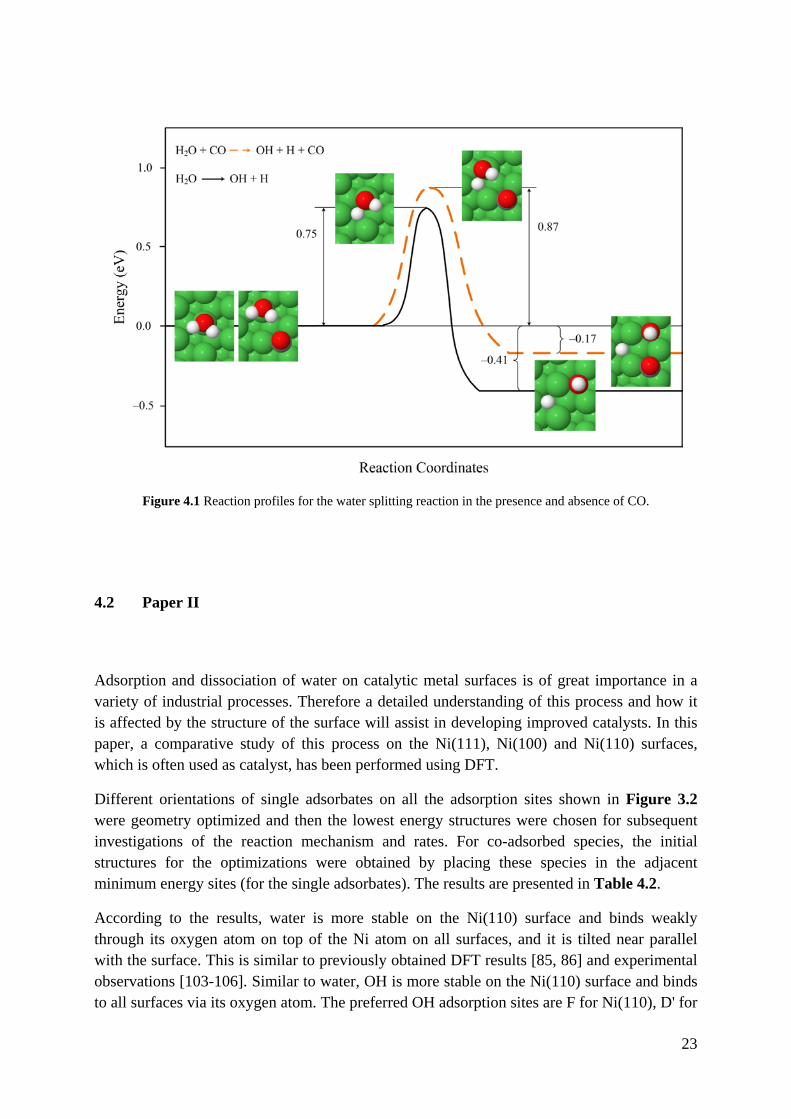
Figure 4.1 shows the water splitting reaction coordinates with and without co-adsorbed CO. The length and frequency of the breaking bond in the transition states are not significantly influenced by CO co-adsorption. Also, in the presence of CO, the reaction is less exothermic and the activation barrier is 0.12 eV higher than that of for single water splitting. This leads to considerable decrease in the reaction rate constant at 463 K, which is typical for low-temperature processes that include the WGS reaction [102], i.e., from 2.03×10⁴ s−1 to 1.76×10³ s−1 when CO is present. It may be noted that the difference in reaction rate constants in the absence and presence of CO increases with increasing temperature, and it becomes even more important to consider the effect of CO co-adsorption at higher temperatures.
The reason for the larger activation energy is probably the interplay between H2O, CO and Ni surface, since the presence of the CO on the surface causes stronger interactions between the surface and the reactant and the products. The larger activation energy and decreased exothermicity in the presence of CO indicate that the stability induced by CO is larger for the reactant than for the transition state and product structures.
23
Figure 4.1 Reaction profiles for the water splitting reaction in the presence and absence of CO.
4.2 Paper II
Adsorption and dissociation of water on catalytic metal surfaces is of great importance in a variety of industrial processes. Therefore a detailed understanding of this process and how it is affected by the structure of the surface will assist in developing improved catalysts. In this paper, a comparative study of this process on the Ni(111), Ni(100) and Ni(110) surfaces, which is often used as catalyst, has been performed using DFT.
Different orientations of single adsorbates on all the adsorption sites shown in Figure 3.2 were geometry optimized and then the lowest energy structures were chosen for subsequent investigations of the reaction mechanism and rates. For co-adsorbed species, the initial structures for the optimizations were obtained by placing these species in the adjacent minimum energy sites (for the single adsorbates). The results are presented in Table 4.2.
According to the results, water is more stable on the Ni(110) surface and binds weakly through its oxygen atom on top of the Ni atom on all surfaces, and it is tilted near parallel with the surface. This is similar to previously obtained DFT results [85, 86] and experimental observations [103-106]. Similar to water, OH is more stable on the Ni(110) surface and binds to all surfaces via its oxygen atom. The preferred OH adsorption sites are F for Ni(110), D' for

24
Ni(100) and C' for Ni(111). For both H2O and OH, the surface-adsorbate distance is smallest when the binding energy is strongest. The results obtained for OH are in agreement with previously calculated data when available [85, 86].
Table 4.2 Adsorption and co-adsorption energies (eV) for the chemical species involved in H2O dissociation. Values are ZPVE-corrected.
Species surface Adsorption site Eads
H2O Ni(111) A −0.20 Ni(100) A −0.27 Ni(110) A −0.39
OH Ni(111) C' −3.08 Ni(100) D' −3.27 Ni(110) F −3.44
O Ni(111) C' −5.31 Ni(100) D' −5.63 Ni(110) E −4.98
H Ni(111) C' −2.66 Ni(100) D' −2.70 Ni(110) G −2.51
OH + H Ni(111) OH: C', H: C' −5.52 Ni(100) OH: D', H: D' −5.80 Ni(110) OH: F, H: G −6.09
O + H Ni(111) O: C', H: C' −7.63 Ni(100) O: D', H: D' −8.01 Ni(110) O: G, H: G −7.84
Oxygen and hydrogen, unlike the water and OH, have the strongest bonding on the Ni(100) surface. The trends obtained here are in agreement with those previously calculated [85, 107-109]. For example, Fajín et al. [85] reported oxygen adsorption energies of −5.60 eV and −5.49 eV for the Ni(111) and Ni(110), respectively and Blaylock et al. [107] obtained adsorption energies of −4.81 eV and −5.46 eV for the Ni(111) and Ni(100) surfaces, respectively. The most stable adsorption sites for oxygen are C' on the Ni(111) surface, D' on Ni(100), and E on Ni(110), respectively. For hydrogen, the preferred sites are C' on the Ni(111) surface, D' on the Ni(100) surface and G on the Ni(110) surface, respectively. In contrast to water and OH, the surface-adsorbate distance for oxygen and hydrogen does not decrease with increasing adhesion strength.
All co-adsorbed species prefer the same adsorption sites as those found for the single adsorbates, except for the oxygen on the Ni(110) surface where the oxygen is shifted from the E to the G site.
Generally, adsorbates bind more strongly to the high symmetry sites than to the low symmetry sites, and to atoms with low coordination numbers rather than high coordination

25
numbers [9, 110, 111]. The surface metal atoms coordination numbers for the Ni(111), Ni(100) and Ni(110) surfaces are 9, 8 and 7, respectively. In addition, we have seen that all of the adsorbates are more negatively charged than when they are in vacuum [112]. This extra electron density is assumed to come from the frontier d orbitals of the metal surface. The intensities of the occupied orbitals at the Fermi level for the Ni(111), Ni(100) and Ni(110) surfaces are 2.0, 2.2 and 2.7 states/eV, respectively and therefore the Ni(110) surface can donate a higher electron density to the adsorbate. Hence, in agreement with this typical behaviour, water and OH have stronger adsorption energies on the Ni(110) and Ni(100) surfaces compared to the Ni(111) surface. In contrast, O and H have the strongest bonding on the Ni(100) surface. The reason is not clear, however, this is similar to what is reported in previous calculations which is further discussed in the paper.
The reaction profiles for the entire water dissociation process are compared in Figure 4.2. As it can be seen, the water splitting reaction is exothermic on all surfaces (see Figure 4.2(a)) and the activation barrier on Ni(110) is 0.07 eV and 0.31 eV lower than on the Ni(100) and Ni(111) surfaces, respectively. The water splitting rate constants are strongly influenced by the surface structure, and at 463 K they decrease from 7.36×10⁷ s−1 on Ni(110) to 7.62×10⁶ s−1 on Ni(100) and to 1.23×10⁴ s−1 on Ni(111). These results are supported by experimental observations [113-115] which are discussed in detail in the Section 3.2 in Paper II.
Similarly to water splitting, the lowest barrier for OH splitting is obtained on the Ni(110) surface. However, the barrier on the Ni(111) surface is lower than that for the Ni(100) surface. The OH splitting is endothermic on the Ni(110) surface, while it is exothermic on the other two surfaces. The rate constants at 463 K decrease from 1.43×10⁶ s−1 on Ni(110) to 1.14×10⁴ s−1 on Ni(111) and to 1.26×10³ s−1 on Ni(100).
Since, the difference in reaction rate constants significantly increases with increasing temperature [58, 112], it becomes even more important to consider the effect of surface configuration at elevated temperatures.
The d-band centre describes the distribution of surface electronic energy levels [116, 117] and the ability to eject an electron from the d-band of the metal to the adsorbate. This can explain differences in catalytic activity of the different surfaces. The calculated d-band centres are at –1.75, –1.98 and –2.08 eV for the Ni(110), Ni(100) and Ni(111) surfaces, respectively. Generally, the surface is more reactive when the d-band centre is closer to the Fermi level [116, 117]. As expected, the reaction barrier for the water and OH splitting on the three surfaces is the lowest on the Ni(110) surface, which has a d-band centre that is closest to the Fermi level.
Based on the rate constants obtained from DFT, a kinetics model was developed to investigate the overall water dissociation reaction (for more details see Section 2.3 in Paper II). The results showed that the overall reaction is fastest on Ni(110) and follows the order Ni(110) > Ni(100) > Ni(111).

26
Figure 4.2 Reaction profiles for the (a) water and (b) OH splitting over Ni(111) (solid black line), Ni(100) (long-dashed blue line) and Ni(110) (short-dashed red line).
4.3 Paper III
Formyl plays a key role in industrial processes such as water gas shift (WGS), Fischer Tropsch synthesis (FTS) and catalytic hydrocarbon combustion reactions. In this paper, the adsorption, reaction and activation energies of formyl oxidation and dissociation on the Ni(111), Ni(100) and Ni(110) surfaces were investigated using DFT calculations. Same procedure as explained in Section 4.2 was used here to calculate the adsorption energies. For calculating the co-adsorption energies, all possible adsorption sites were examined for the
27
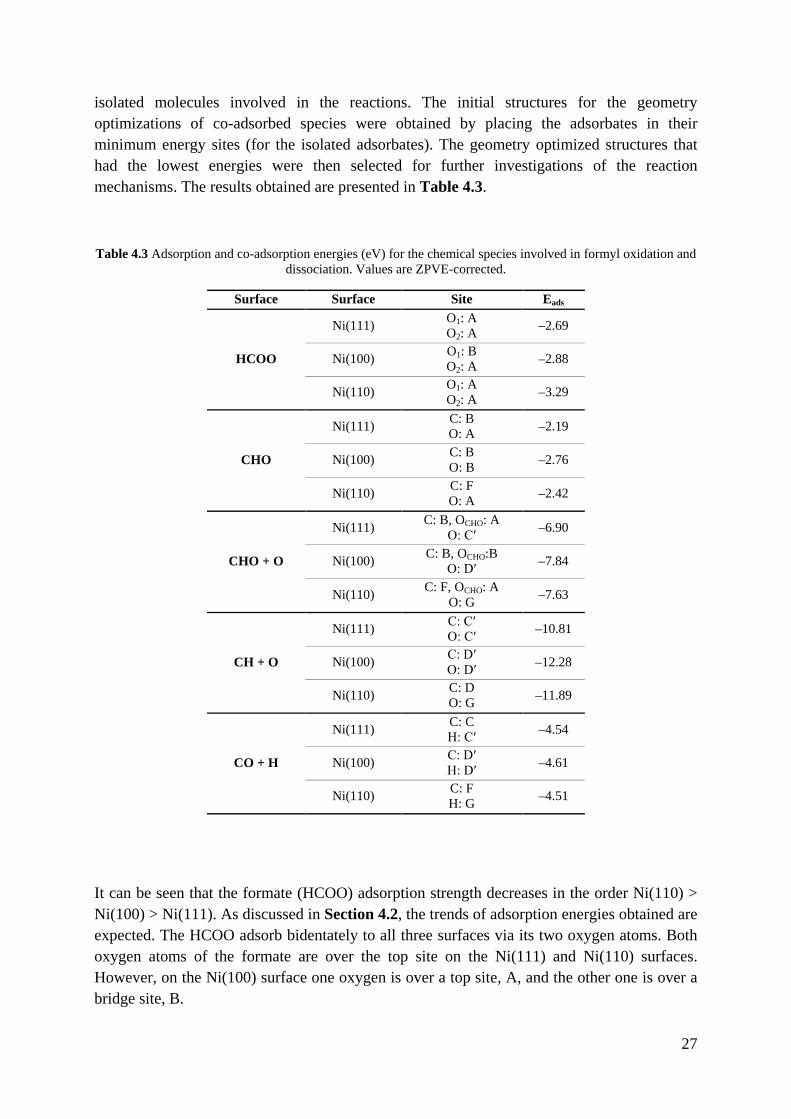
isolated molecules involved in the reactions. The initial structures for the geometry optimizations of co-adsorbed species were obtained by placing the adsorbates in their minimum energy sites (for the isolated adsorbates). The geometry optimized structures that had the lowest energies were then selected for further investigations of the reaction mechanisms. The results obtained are presented in Table 4.3.
Table 4.3 Adsorption and co-adsorption energies (eV) for the chemical species involved in formyl oxidation and dissociation. Values are ZPVE-corrected.
Surface Surface Site Eads
HCOO
Ni(111) O1: A O2: A –2.69
Ni(100) O1: B O2: A –2.88
Ni(110) O1: A O2: A –3.29
CHO
Ni(111) C: B O: A –2.19
Ni(100) C: B O: B –2.76
Ni(110) C: F O: A –2.42
CHO + O
Ni(111) C: B, OCHO: A O: C′ –6.90
Ni(100) C: B, OCHO:B O: D′ –7.84
Ni(110) C: F, OCHO: A O: G –7.63
CH + O
Ni(111) C: C′ O: C′ –10.81
Ni(100) C: D′ O: D′ –12.28
Ni(110) C: D O: G –11.89
CO + H
Ni(111) C: C H: C′ –4.54
Ni(100) C: D′ H: D′ –4.61
Ni(110) C: F H: G –4.51
It can be seen that the formate (HCOO) adsorption strength decreases in the order Ni(110) > Ni(100) > Ni(111). As discussed in Section 4.2, the trends of adsorption energies obtained are expected. The HCOO adsorb bidentately to all three surfaces via its two oxygen atoms. Both oxygen atoms of the formate are over the top site on the Ni(111) and Ni(110) surfaces. However, on the Ni(100) surface one oxygen is over a top site, A, and the other one is over a bridge site, B.
28
For CHO the strongest adsorption was obtained for the Ni(100) surface which is in contrast to the trend that molecules bind most strongly to the Ni(110) surface. The reason could be the orientation of the formyl molecule on the Ni(100) surface. The C-O bond is almost parallel to this surface, while the carbon atom points towards the surface on the other two surfaces.
Except for oxygen on the Ni(110) surface, in all cases the co-adsorption sites are the same as those found for the isolated adsorbates. The strongest adsorption energy for O on the Ni(110) surface was obtained at the long bridge site E, whereas the co-adsorbed CHO shifts the oxygen from the E to the G site.
The co-adsorption is strongest on the Ni(100) surface similarly to CHO. Also, similarly to CHO, co-adsorption of CHO + O and CH + O is stronger on the Ni(110) surface than on the Ni(111) surface. Although CO + H co-adsorption is stronger on the Ni(111) surface than on the Ni(110) surface.
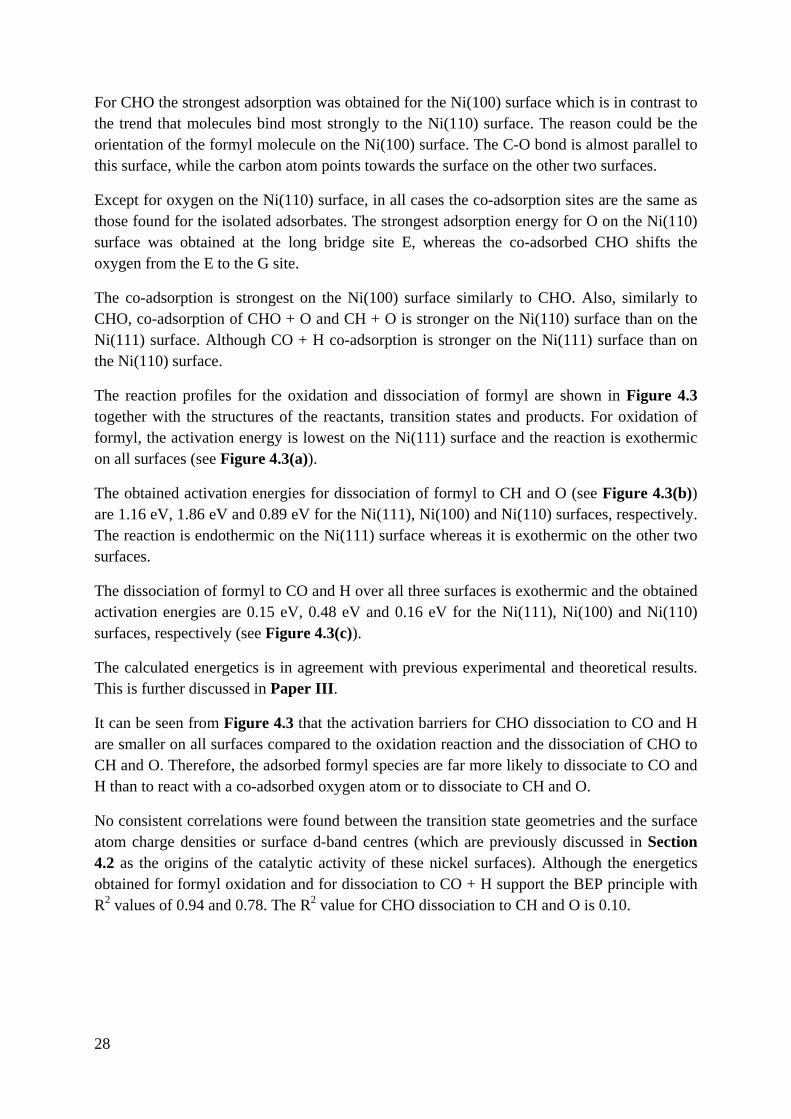
The reaction profiles for the oxidation and dissociation of formyl are shown in Figure 4.3 together with the structures of the reactants, transition states and products. For oxidation of formyl, the activation energy is lowest on the Ni(111) surface and the reaction is exothermic on all surfaces (see Figure 4.3(a)).
The obtained activation energies for dissociation of formyl to CH and O (see Figure 4.3(b)) are 1.16 eV, 1.86 eV and 0.89 eV for the Ni(111), Ni(100) and Ni(110) surfaces, respectively. The reaction is endothermic on the Ni(111) surface whereas it is exothermic on the other two surfaces.
The dissociation of formyl to CO and H over all three surfaces is exothermic and the obtained activation energies are 0.15 eV, 0.48 eV and 0.16 eV for the Ni(111), Ni(100) and Ni(110) surfaces, respectively (see Figure 4.3(c)).
The calculated energetics is in agreement with previous experimental and theoretical results. This is further discussed in Paper III.
It can be seen from Figure 4.3 that the activation barriers for CHO dissociation to CO and H are smaller on all surfaces compared to the oxidation reaction and the dissociation of CHO to CH and O. Therefore, the adsorbed formyl species are far more likely to dissociate to CO and H than to react with a co-adsorbed oxygen atom or to dissociate to CH and O.
No consistent correlations were found between the transition state geometries and the surface atom charge densities or surface d-band centres (which are previously discussed in Section 4.2 as the origins of the catalytic activity of these nickel surfaces). Although the energetics obtained for formyl oxidation and for dissociation to CO + H support the BEP principle with R2 values of 0.94 and 0.78. The R2 value for CHO dissociation to CH and O is 0.10.

29
Figure 4.3 Reaction profiles for the (a) water and (b) OH splitting over Ni(111) (solid black line), Ni(100) (long-dashed blue line) and Ni(110) (short-dashed red line).

30
4.4 Paper IV
Combustion and synthesis of hydrocarbons may occur directly (CH → C + H and CO → C + O) or via a formyl (CHO) intermediate. In Paper IV, the energetics of these reactions is investigated on Ni(111), Ni(100) and Ni(110) surfaces.
4.4.1 Catalytic hydrocarbon combustion
The activation and reaction energies for the catalytic combustion of hydrocarbons are given in Table 4.4.
Table 4.4 The activation and reaction energies (eV) for the hydrocarbon combustion. Values are ZPVE-corrected.
Surface CH → C + H CH + O → CHO CHO → CO + H
Ea ∆E Ea ∆E Ea ∆E
Ni(111) 1.15 0.49 0.85 –0.30 0.15 –1.38
Ni(100) 0.45 –0.21 2.46 0.59 0.48 –0.88
Ni(110) 0.33 –0.22 1.43 0.54 0.16 –1.13
For dissociation of CH, the calculated activation energies are 1.15 eV, 0.45 eV and 0.33 eV on the Ni(111), Ni(100) and Ni(110) surfaces, respectively. The reaction is endothermic on the Ni(111) surface while as it is exothermic on the other two surfaces.
The lowest activation barrier for methylidyne oxidation was obtained on the Ni(111) surface, i.e., 0.85 eV compared to 2.46 eV and 1.43 eV on the Ni(100) and Ni(110) surfaces, respectively. The oxidation reaction is endothermic on the Ni(100) and Ni(110) surfaces whereas it is exothermic on the Ni(111) surface.
The activation energies for CHO dissociation to CO and H are 0.15 eV, 0.0.48 eV and 0.16 eV for the Ni(111), Ni(100) and Ni(110) surfaces, respectively. The trend is the same as CH oxidation, and the reaction is exothermic on all surfaces.
The geometries of the reactants, transition states and products which are presented in Table 4.4, are shown in Figure 4.4(a). The adsorption and co-adsorption energies together with the details of these structures are given in Tables S1, S3 and S4 in the Supporting Information of Paper IV.

31
Figure 4.4 Reactant, transition state and product structures for the reactions involved in catalytic hydrocarbon (a) combustion and (b) synthesis.
The calculations reveal that the fraction of CH that undergoes direct dissociation prior to oxidation is very small due to its higher activation barrier (1.15 eV compared to 0.85 eV) when there is sufficient co-adsorbed oxygen on the Ni(111) surface.

32
On the Ni(100) and Ni(110) surfaces, in contrast, the CH dissociation barrier is lower than the its oxidation barriers. This means that the direct dissociation of CH to C and H is preferred to oxidation via a CHO intermediate on these surfaces, since the barrier for formation of CHO intermediate is about five times larger than that of for the direct dissociation.The reaction rate constants (k values given in Table 1 in Paper IV) for CH and CHO dissociation are largest on the Ni(110) surface as expected regarding the d-band centre discussed before. Although, the rate constant for CH oxidation is bigger on the Ni(111) surface compared the other surfaces.
4.4.2 Catalytic hydrocarbon synthesis
The activation barriers and reaction energies calculated for the catalytic hydrocarbon synthesis are given in Table 4.5.
Table 4.5 The activation and reaction energies (eV) for the hydrocarbon synthesis. Values are ZPVE-corrected.
Surface CO → C + O CO + H → CHO CHO → CH + O
Ea ∆E Ea ∆E Ea ∆E
Ni(111) 2.99 2.60 1.53 1.38 1.16 0.30
Ni(100) 1.98 0.82 1.36 0.88 1.86 – 0.59
Ni(110) 1.83 0.76 1.29 1.13 0.89 – 0.54
The lowest activation energy for CO dissociation is on the Ni(110) surface, and is 1.83 eV compared to 2.99 eV and 1.98 eV on the Ni(111) and Ni(100) surfaces, respectively, and the reaction is endothermic on all three surfaces.
For the hydrogenation of CO, the activation barrier obtained are 1.53 eV, 1.36 eV and 1.29 eV for the Ni(111), Ni(100) and Ni(110) surfaces, respectively. Similarly to the dissociation reaction, the lowest barrier is obtained on the Ni(110) surface, and the reaction is endothermic on all surfaces.
For formyl dissociation to CH and O, however, the obtained barrier decreases in the order Ni(100) > Ni(111) > Ni(110). The reaction is endothermic on the Ni(111) surface while it is exothermic on the Ni(110) and Ni(100) surfaces.
Figure 4.4(b) shows geometries of the reactants, transition states and products for the reactions given in Table 4.5. The adsorption and co-adsorption energies together with the details of these structures are given in Tables S2, S3 and S4 in the Supporting Information of Paper IV.
33
The activation energies on the different surfaces increases in the order Ni(110) < Ni(100) < Ni(111) except for CHO dissociation to CH and O, where the barrier on the Ni(100) surface is higher compared to the Ni(111) surface.
The activation energies for dissociation of CO are higher on all surfaces compared to its hydrogenation. The obtained CO adsorption energies are –1.89 eV, –1.96 eV and –1.89 eV on the Ni(111), Ni(100) and Ni(110), respectively. Thus, dissociation of CO is favoured on the Ni(110) surface while on the Ni(111) and Ni(100) surfaces, CO desorption will compete with dissociation. However, the activation energies for hydrogenation of CO are lower than those for its dissociation and desorption on all surfaces. Therefore, the adsorbed CO species is more likely to react with co-adsorbed hydrogen than to dissociate to C and O or to desorb from the surface, when hydrogen is co-adsorbed on the Ni surface.
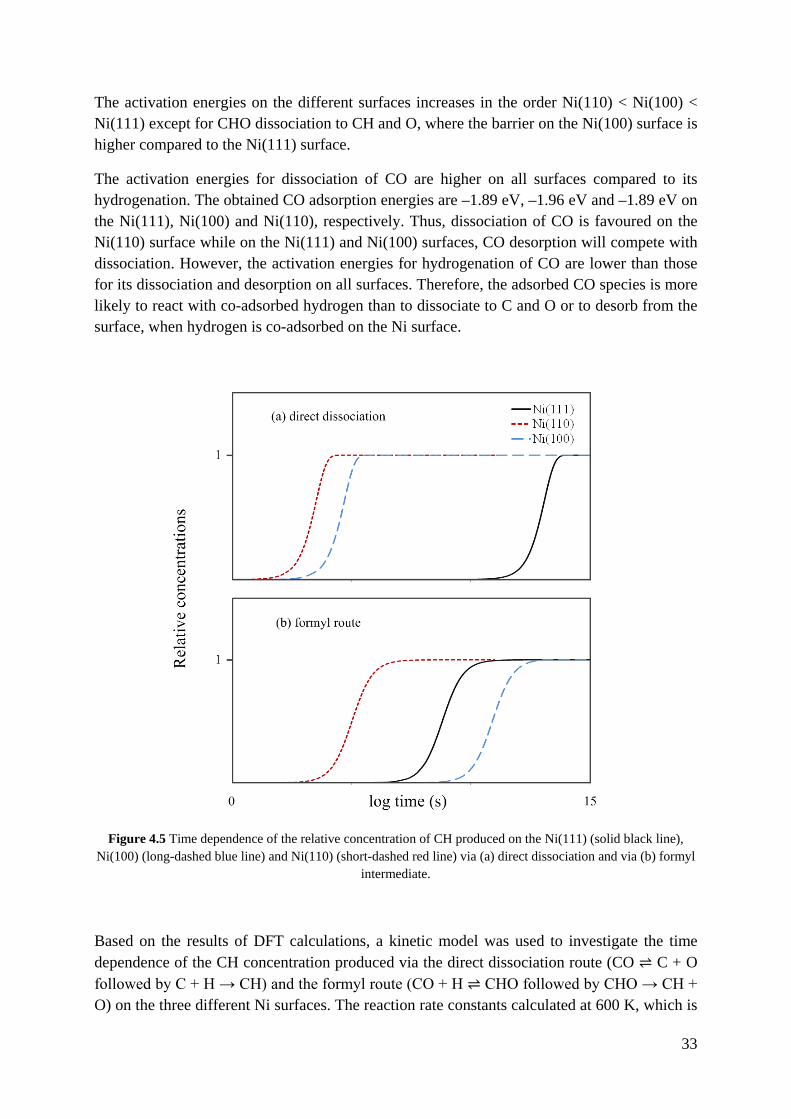
Figure 4.5 Time dependence of the relative concentration of CH produced on the Ni(111) (solid black line), Ni(100) (long-dashed blue line) and Ni(110) (short-dashed red line) via (a) direct dissociation and via (b) formyl
intermediate.
Based on the results of DFT calculations, a kinetic model was used to investigate the time dependence of the CH concentration produced via the direct dissociation route (CO ⇌ C + O followed by C + H → CH) and the formyl route (CO + H ⇌ CHO followed by CHO → CH + O) on the three different Ni surfaces. The reaction rate constants calculated at 600 K, which is

34
a typical temperature for synthesis and low temperature catalytic combustion of hydrocarbons [118-120], and the initial concentration of adsorbed CO and H are 1 (arbitrary units of concentration). Figure 4.5 shows the average CH formation rate from each CO molecule on the surface, therefore the concentration of the produced CH increases until it reaches 1. As it can be seen, both routes are fastest on the Ni(110) surface. Also, on the Ni(110) and Ni(100) surfaces, the direct route is faster, while the formyl route will dominate on the Ni(111) surface. Different H concentrations (between 0.25 and 1.5) were used in the kinetics model and yielded the same trends. It may be noted that the calculated the rate constants (see Table 2 in Paper IV) for synthesis reactions are far smaller than those for the combustion reactions (see Table 1 in Paper IV). Thus Ni is a better catalyst for hydrocarbon combustion.
4.5 Paper V
In Paper V, the water gas shift reaction (WGS) reaction was studied by looking at the adsorption energies for ten species involved in the reaction together with activation barriers and reaction energies for the nine most important elementary steps using DFT calculations.
The structures of the adsorbed and co-adsorbed species involved in the WGS reaction were obtained using the same procedure explained in Paper III and Paper IV. The trends obtained for adsorption and co-adsorption energies are further discussed in the Paper V and the details of the structures are given in Supporting Information of the paper. These structures were then selected for investigations of the reaction mechanism.
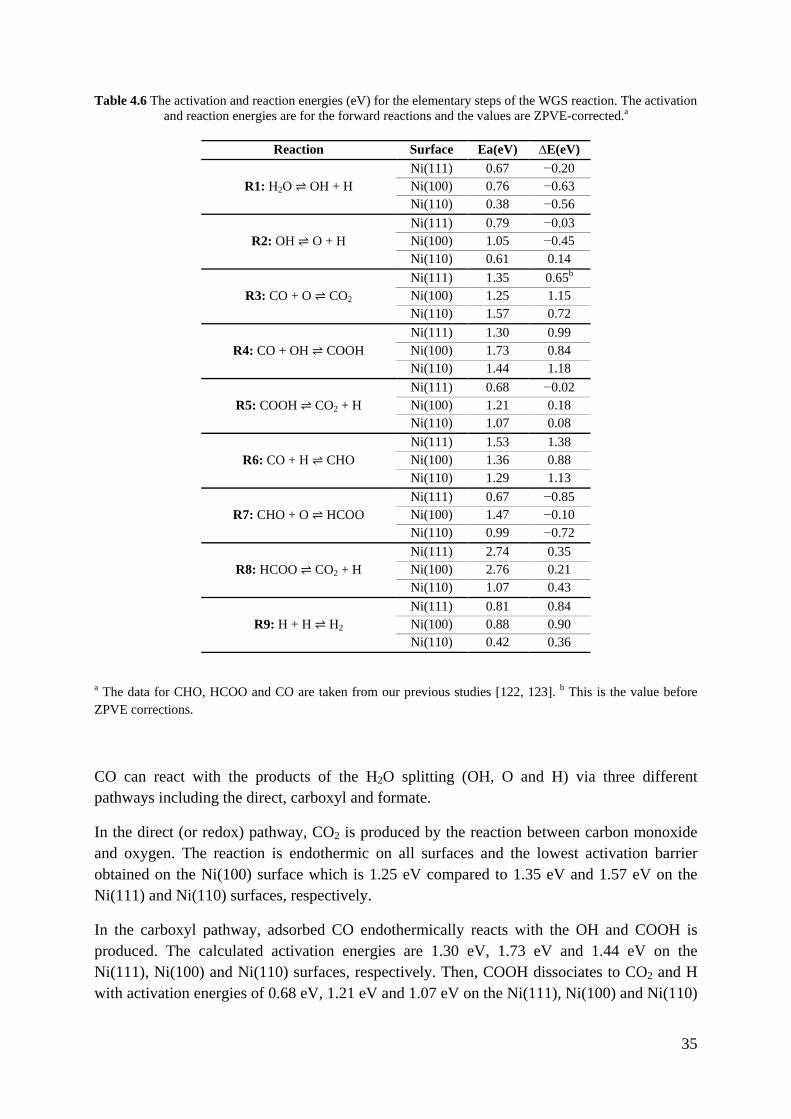
The activation and reaction energies of all the elementary steps (R1-R9) are summarized in Table 4.6. Details of the structures of the reactants, products and transition states are given in the Supporting Information of the paper (Tables S1-S9 and Figures S1-S9).
The adsorbed carbon monoxide cannot react directly with H2O [14, 121]. So, the WGS reaction starts by H2O splitting to OH and H. The activation energies of both H2O and OH splitting reactions follow the order Ni(100) > Ni(111) > Ni(110). The barriers of the H2O splitting are larger than the adsorption energies of the water on both the Ni(111) and Ni(100) surfaces. Hence, it is expected that most of the H2O molecules desorb without proceeding to OH + H species. On the Ni(110) surface, in contrast, the calculated adsorption energy is slightly higher than the splitting barrier. Experimental studies, which are further discussed in the paper, support these results [113-115].
35
Table 4.6 The activation and reaction energies (eV) for the elementary steps of the WGS reaction. The activation and reaction energies are for the forward reactions and the values are ZPVE-corrected.a
Reaction Surface Ea(eV) ∆E(eV)
R1: H2O ⇌ OH + H Ni(111) 0.67 −0.20 Ni(100) 0.76 −0.63 Ni(110) 0.38 −0.56
R2: OH ⇌ O + H Ni(111) 0.79 −0.03 Ni(100) 1.05 −0.45 Ni(110) 0.61 0.14
R3: CO + O ⇌ CO2 Ni(111) 1.35 0.65b Ni(100) 1.25 1.15 Ni(110) 1.57 0.72
R4: CO + OH ⇌ COOH Ni(111) 1.30 0.99 Ni(100) 1.73 0.84 Ni(110) 1.44 1.18
R5: COOH ⇌ CO2 + H Ni(111) 0.68 −0.02 Ni(100) 1.21 0.18 Ni(110) 1.07 0.08
R6: CO + H ⇌ CHO Ni(111) 1.53 1.38 Ni(100) 1.36 0.88 Ni(110) 1.29 1.13
R7: CHO + O ⇌ HCOO Ni(111) 0.67 −0.85 Ni(100) 1.47 −0.10 Ni(110) 0.99 −0.72
R8: HCOO ⇌ CO2 + H Ni(111) 2.74 0.35 Ni(100) 2.76 0.21 Ni(110) 1.07 0.43
R9: H + H ⇌ H2 Ni(111) 0.81 0.84 Ni(100) 0.88 0.90 Ni(110) 0.42 0.36
a The data for CHO, HCOO and CO are taken from our previous studies [122, 123]. b This is the value before ZPVE corrections.
CO can react with the products of the H2O splitting (OH, O and H) via three different pathways including the direct, carboxyl and formate.
In the direct (or redox) pathway, CO2 is produced by the reaction between carbon monoxide and oxygen. The reaction is endothermic on all surfaces and the lowest activation barrier obtained on the Ni(100) surface which is 1.25 eV compared to 1.35 eV and 1.57 eV on the Ni(111) and Ni(110) surfaces, respectively.
In the carboxyl pathway, adsorbed CO endothermically reacts with the OH and COOH is produced. The calculated activation energies are 1.30 eV, 1.73 eV and 1.44 eV on the Ni(111), Ni(100) and Ni(110) surfaces, respectively. Then, COOH dissociates to CO2 and H with activation energies of 0.68 eV, 1.21 eV and 1.07 eV on the Ni(111), Ni(100) and Ni(110)

36
surfaces, respectively. This step is slightly exothermic on the Ni(111) surface, whereas it is endothermic on the other two surfaces.
In the formate pathway, the adsorbed CO reacts with an adsorbed H atom to produce CHO. The reaction is endothermic on all three surfaces and activation barriers are 1.53 eV, 1.36 eV and 1.29 eV on the Ni(111), Ni(100) and Ni(110) surfaces, respectively. The experimental values reported for CO hydrogenation on the Ni(111) and Ni(100) surfaces are 1.67 eV [124] and 1.07 eV [125], respectively, which support the trends presented here. The formyl is then exothermically oxidized to formate with activation barriers of 0.67 eV, 1.47 eV and 0.99 eV on the Ni(111), Ni(100) and Ni(110) surfaces, respectively. The HCOO subsequently dissociates to CO2 and H. The calculated activation energies for this step are 2.74 eV, 2.76 eV and 1.07 eV on the Ni(111), Ni(100) and Ni(110) surfaces, respectively, and the reaction is endothermic on all three surfaces. HCOO has a high barrier for dissociation which could explain why the formate is the most frequently observed intermediate in WGS experiments [26, 27, 126-129].
Finally, the adsorbed H atoms produce H2 which subsequently desorbs. The obtained activation barriers are 0.81 eV, 0.88 eV and 0.42 eV on the Ni(111), Ni(100) and Ni(110) surfaces, respectively, and the reaction is endothermic on all three surfaces. It may be noted that the calculated activation energies are slightly smaller than the reaction energies on Ni(111) and Ni(100) surfaces. However, this is within the statistical uncertainty of the method since DFT-GGA accuracy is about 0.1 eV [130]. The similarity of Ea and ∆E has also been seen previously by Lin et al. [14] and Catapan et al. [6]. They found a difference of 0.03 eV and 0.08 eV between Ea and ∆E on the Ni(111) surface, respectively.
The trends found for reactions R1, R2, R6, R8 and R9 can be explained by d-band centre of three nickel surfaces (which is discussed in detail in Paper II). However, for reactions R4, R5 and R7 the lowest barrier is obtained on the Ni(111) surface, and for R3 the lowest barrier is obtained on the Ni(100) surface.
The energy profiles for the direct, carboxyl and formate pathways of CO oxidation to carbon dioxide on the Ni(111), Ni(100) and Ni(110) surfaces are shown in Figure 4.6. For the Ni(111) surface, the direct and the carboxyl pathways are preferred to as a result of the lower barriers for consuming carbon monoxide. The activation barrier of forming CO2 via the direct pathway (R3) is 1.35 eV. COOH is produced via the carboxyl pathway (R4), where the activation energy is 1.30 eV, and then dissociate to CO2 and H (R5) with a barrier of 0.68 eV. Although, the barrier for the reverse reaction of R4 is almost half of the R5 reaction barrier, i.e., 0.31 eV compared to 0.68 eV. Therefore, the rate of formation of CO2 via carboxyl pathway is lowered by the two activation barriers (R4 and R5) and the reverse of R4 (COOH → CO and OH) is faster than R5.
The CO hydrogenation (R6) barrier is about 0.2 eV higher compared to its oxidation (R3 in the direct pathway), and the dissociation barrier of the produced CHO (via the reverse of reaction R6) is considerably lower than the activation barrier of R7 (formate production). In addition, the barrier of formate dissociation to CO2 and H is very large (2.74 eV) which makes reaction via the formate pathway very slow.

37
Therefore, on the Ni(111) surface, the direct pathway is favoured and the reaction R3 (CO + O → CO2) is the rate limiting step.
Figure 4.6 Reaction profiles for the WGS reaction on (a) Ni(111), (b) Ni(100) and (c) Ni(110) via direct (long-dashed blue line), carboxyl (short dashed green line) and formate pathways (solid orange line).

38
For the Ni(100) surfaces, a similar analysis shows that the direct pathway is preferred since the reaction barrier for carbon dioxide consumption in this pathway (R3: 1.25 eV) is smaller than in the carboxyl pathway (R4: 1.73 eV) and in the formate pathway (R6: 1.36 eV). The produced formyl via R6 can be oxidized to formate (R7) which is a stable intermediate due to its large barrier for carbon dioxide production (R8: 2.76 eV) and the high barrier for its dissociation to CHO and O (reverse of R7, 1.47 eV). The formyl can also dissociate to CO and H (reverse of R6) instead of oxidizing to CO2 (R7), as the barrier of its dissociation (reverse of R6) is almost one third of the barrier for its oxidation (R7), i.e., 0.48 compared to 1.47 eV.
Hence, on the Ni(100) surface, the direct pathway is the main route of the WGS reaction and the rate determining step is the oxidation of carbon dioxide (R3).
For the Ni(110) surface, the hydrogenation of CO (R6) has a lower barrier (1.29 eV) than CO oxidation (R3, direct pathway, 1.57 eV) or CO reacting with OH (R4, carboxyl pathway, 1.44 eV). The produced CHO via reaction R6, however, has a large barrier (0.99 eV) to form formate via R7, and the barrier of the reverse of R6 is very low compared to R7, i.e., 0.16 eV compared to 0.99 eV. This further hinders the formation of formate via R7, and indicates that the formate pathway is not the route for CO2 production.
The reaction involving CO with OH (R4) to form COOH has a barrier of 1.44 eV, and the barrier for COOH dissociation to carbon dioxide and hydrogen (R5) is 1.07 eV. However, the barrier for the reverse of R4 is far smaller than the barrier of R5, i.e., 0.26 eV compared to 1.07 eV, which reduces the rate of CO2 production via the carboxyl pathway.
Consequently, CO2 is primarily produced via the direct pathway, similarly to the other two surfaces, and R3 is the rate limiting step.
According to the trends obtained for activation barrier of reaction R3, the direct pathway on the Ni(100) will be the dominant mechanism on all three Ni surfaces if O intermediates are present on the surface. However, the barriers for water dissociation are larger than desorption energies on the Ni(111) and Ni(100) surfaces. Therefore, at low H2O(g) pressures the direct pathway on the Ni(110) will dominate.
In addition to the energetics, the main pathway of CO2 formation depends on the coverage of the co-reactant, O, which favours the direct path, OH, which favours the carboxyl path, or H, which favours the formate path.
The results obtained from the DFT calculations are consistent with previous theoretical and experimental investigations [6, 14, 19, 131-141] which are further discussed in the Paper V. For example, Hilaire et al. [135] studied the WGS reaction over ceria supported metallic catalysts including nickel. Their study showed that the mechanism for the reaction involves a direct pathway.
The results obtained here support the validity of the TSS method. The data yield an equation of ETS = 0.96 EFS − 3.20 with a R2 value of 0.99. It should be noted that only three Ni facets

39
have been studied in this work, and studies of more facets would improve the statistical relevance of the results.
4.6 The transition state scaling for Papers II-V
Figure 4.7 shows the TSS correlations for all the reactions studied in Papers II-V (Paper I is excluded, since a different supercell size is used for the calculations). As it can be seen, the results support the TSS method and yield an equation of ETS = 0.96 EFS – 2.91 with a R2 value of 0.99. The activation barrier for other reactions occurring on these nickel facets can therefore be estimated by this reaction. Those activation barriers can then be used for kinetic modelling which is a part of the future work.
Figure 4.7 The transition state scaling (TSS) relation for all of the studied reactions on the Ni(111), Ni(100), and
Ni(110) surfaces.

40

41
CHAPTER 5
CONCLUSIONS
Density functional theory (DFT) calculations were used to study the effect of co-adsorption of water and CO on the Ni(111) surface as well as the water adsorption and dissociation, formyl oxidation and dissociation, hydrocarbon combustion and synthesis, and the WGS reaction on Ni(111), Ni(100) and Ni(110) surfaces.
The results show that:
The co-adsorption of CO alters the geometry of the adsorbed reactant water molecule. The O-H bond that is closest to the carbon monoxide is lengthened and weakened. The distance between the surface and the reactants and products decreases in the presence of the co-adsorbed CO. These changes lead to a dissociation energy that is 0.24 eV less exothermic, and to an activation energy for H2O dissociation which is 0.12 eV higher in the presence of the co-adsorbed CO. At 463 K, the rate constant in the presence of CO is about twelve times smaller than in the absence of CO. This difference increases with increasing temperature. Therefore, it is important to account for co-adsorbed carbon monoxide when water dissociation occurs on nickel surface in a CO-rich environment.
For adsorption and dissociation of water, the H2O and OH adsorbates bind more strongly to the less packed Ni(110) and Ni(100) surfaces compared to the highly packed Ni(111) which is in agreement with the fact that the d-band center of the Ni(110) surface is closer to the Fermi level than for the other two surfaces. However, O and H bind strongest to the Ni(100) surface. At 463 K, the overall reaction rate for the entire water dissociation reaction decreases in the order Ni(110) > Ni(100) > Ni(111).
For the formyl dissociation, the barrier for CHO → CH + O (FTS process) is higher than that for CHO → CO + H (catalytic combustion) on all three surfaces, and

42
reaction rate constant decreases in the order Ni(110) > Ni(111) > Ni(100). For oxidation of formyl (CHO + O → HCOO), the lowest activation energy is on the Ni(111) surface and increases in the order Ni(111) < Ni(110) < Ni(100). The barrier for CHO → CH + O and CHO + O → HCOO is seven and four times higher, respectively, compared to CHO → CO + H on the Ni(111) surface. Therefore, at 463K, the rate constant for CHO → CO + H is 3×10¹² and 3×10⁶ times larger than those for formate formation and formyl dissociation to CH and O. The barrier for dissociation of CHO to CO and H is lower compared to the other two reactions irrespective of the crystallographic structure of the Ni surfaces. Hence, formyl prefers to dissociate to CO and H instead of reacting with co-adsorbed oxygen atoms or dissociating to CH and O. Consequently, nickel performs better for this reaction (catalytic combustion) compared the FTS process. The results also show that the WGS reaction with a Ni catalyst does not, to a large extent, occur via the formate pathway.
For catalytic hydrocarbon combustion, the CH dissociation is favoured on the Ni(110) and Ni(100) surfaces, while its oxidation to CHO is favoured on the Ni(111) surface. The dissociation barrier increases in the order Ni(110) < Ni(100) < Ni(111) and the oxidation barrier decreases in the order Ni(100) > Ni(110) > Ni(111). The barrier for formyl dissociation to CO and H follows the same order as CH oxidation. For the catalytic hydrocarbon synthesis, the CO hydrogenation to CHO is favoured over nickel in the presence of sufficient co-adsorbed H, since the CO dissociation barrier is significantly higher compared to its hydrogenation barrier on all three nickel surfaces. The rate of both reactions decreases in the order Ni(110) > Ni(100) > Ni(111). Based on DFT calculations, the Ni(110) surface showed a better catalytic activity for hydrocarbon combustion than for hydrocarbon synthesis. The d-band centre can explain the relative catalytic activity of all facets of the Ni surface, except for CH oxidation which is faster on the Ni(111) surface. All reactions studied support the BEP relations with R2 values of 0.85 for C-H bond breaking/forming and 0.72 for C-O bond breaking /forming.
For the WGS reaction, H2O, OH, HCOO, CO2 and H2 bind strongest to the Ni(110) surface whereas COOH, CHO, CO, O and H bind strongest to the Ni(100) surface. The lowest barrier obtained for the water dissociation (reactions R1 and R2), formyl formation (R6), formate dissociation (R8) and H2 formation (R9) obtained on the Ni(110) surface, while the lowest barrier for CO oxidation to CO2 (R3) is on the Ni(100) surface. Analysis of energetics indicates that the direct (redox) pathway is favoured on all three surfaces via the reaction CO + O → CO2 as the rate determining step. The barrier obtained for this elementary step decreases in the order Ni(110) > Ni(111) > Ni(100). Hence the Ni(100) surface is more active for the WGS reaction compared to the other surfaces if adsorbed oxygen atoms are present. Although, due to higher barriers for H2O dissociation than for H2O desorption on the Ni(111) and Ni(100) surfaces, the direct pathway on the Ni(110) will dominate at low H2O(g) pressures. The results also reveal that formate is a stable intermediate on all surfaces due to its high dissociation barriers which can explain the experimental observations
43
of formate on Ni surfaces. Hence, formate is not an active species in the conversion of CO to carbon dioxide in the WGS reaction. BEP relationships are valid for the studied reactions on these surfaces, with an R2 value of 0.99.

44

45
SUGGESTIONS FOR FUTURE WORK
Understanding the mechanisms of heterogeneous catalytic processes is of great importance in order to improve the efficiencies and to identify optimal catalysts and operating conditions. The following investigations are suggested for the future work:
Kinetic modelling of the WGS reaction using DFT results The steam methane reforming (SMR) over Ni different facets where nickel is
frequently used as the catalyst Hydrocarbon combustion and synthesis on different transition metals to investigate the
catalytic activity of the transition metals during these processes

46

47
ACKNOWLEDGEMENTS
The work I have presented in the thesis would not have been possible without the support from a number of people. First of all I would like thank my supervisor Prof. Tobias Richards for accepting me as a student and for all his encouragement and support along the way.
I am also grateful for the help from Prof. Kim Bolton. It has been a great privilege to have had the chance to work with you. Thank you for always being available and for your constructive comments.
I am also grateful for the help from Dr. Anders Börjesson who contributed with discussions and practical help with the early calculations. Also Prof. Jeng-Han Wang group deserve a special thanks for sharing both their experiences and their knowledge.
I am also grateful to Prof. Mohammad Taherzadeh for the valuable guidance and encouragement extended to me.
I owe my deepest gratitude to Dr. Saeed Nouri and Mrs. Shahnaz Bemanian for the encouragement. Your advice on my career have been priceless.
The staff at the Swedish Center for Resource Recovery at University of Borås are acknowledged for their contributions in many areas, spanning from nice conversations, help with course work and teaching to practical help with technical and administrative tasks.
I extend my gratitude to all PhD students at the Swedish Center for Resource Recovery for being such a wonderful friends and creating a pleasant working environment.
I am deeply thankful to my wonderful friends Hossein Mehraban, Ebrahim Karimi, Nima Noushiri, and Alireza Akbari for their supports and encouragements.
I would also thank my friends Kambiz Mirahmadi, Ali Hashemi, Neda Haghayegh, Farokh Sahraei, Shahram Zare, Masoud Salehi, Rouzbeh Farzan, Amir Hossein Ghanbari, Davoud
48
Dadkhast, Hamid Sefidari, Amir Saeedfar, Parsa Jabbari, Abbas Afaghi, Hossein Ghayour, Arash Helmi, Saleh Houshmand, Hoda Fathali, Mitra Kaeini, Rokhsareh Yazdani, Mehdi Rezaeipour, Nazli Akhbari, Amir Bahrani, Ehsan Komasi, Narges Razmjou, Amir Mozaheb, Farokh Farzaneh, Morteza Esmaeili, Amirsaeed Mohammadi, Mehdi Khodaverdi, and Alireza Torabi for the wonderful moments we have had together.
I am grateful for the financial support obtained from Stiftelsen Föreningssparbanken Sjuhärad and for the computer time provided by the Swedish National Infrastructure for Computing (SNIC) at PDC Centre for High Performance Computing (PDC-HPC) and the Uppsala Multidisciplinary Centre for Advanced Computational Science (UPPMAX). I also acknowledge that the results of this research have been achieved using the PRACE-2IP project (FP7 RI-283493) resource Abel based in Norway at UiO.
Above all I am thankful for all the support from my lovely family. Especially my wife Khatereh who has been very patient and supportive during the hard times of this work. I would also like to thank Khosro and Zohreh for their support and concern.
Abas Mohsenzadeh
September 2015

49
REFERENCES
[1] G. Walker, D. King, The hot topic: what we can do about global warming, Houghton Mifflin Harcourt, 2008. [2] D.A. King, Climate Change Science: Adapt, Mitigate, or Ignore?, Science, 303 (2004) 176-177. [3] G.W. Huber, S. Iborra, A. Corma, Synthesis of Transportation Fuels from Biomass: Chemistry, Catalysts, and Engineering, CHEM REV, 106 (2006) 4044-4098. [4] D. Sholl, J.A. Steckel, Density functional theory: a practical introduction, John Wiley & Sons, 2011. [5] F. Jensen, Introduction to computational chemistry, John Wiley & Sons, 2013. [6] R.C. Catapan, A.A. Oliveira, Y. Chen, D.G. Vlachos, DFT Study of the Water–Gas Shift Reaction and Coke Formation on Ni (111) and Ni (211) Surfaces, J. Phys. Chem. C, 116 (2012) 20281-20291. [7] I. Ciobica, F. Frechard, R. Van Santen, A. Kleyn, J. Hafner, A DFT study of transition states for CH activation on the Ru (0001) surface, J. Phys. Chem. B, 104 (2000) 3364-3369. [8] L.-Y. Gan, R.-Y. Tian, X.-B. Yang, H.-D. Lu, Y.-J. Zhao, Catalytic Reactivity of CuNi Alloys toward H2O and CO Dissociation for an Efficient Water–Gas Shift: A DFT Study, J. Phys. Chem. C, 116 (2011) 745-752. [9] X.-Y. Pang, C. Wang, Y.-H. Zhou, J.-M. Zhao, G.-C. Wang, DFT study of the structure sensitivity for the adsorption of methyl, methoxy, and formate on Ni (111), Ni (100), and Ni (110) surfaces, J MOL STRUC-THEOCHEM, 948 (2010) 1-10. [10] M.B. Zellner, A.M. Goda, O. Skoplyak, M.A. Barteau, J.G. Chen, Trends in the adsorption and decomposition of hydrogen and ethylene on monolayer metal films: A combined DFT and experimental study, SURF SCI, 583 (2005) 281-296. [11] Y.-H. Zhou, P.-H. Lv, G.-C. Wang, DFT studies of methanol decomposition on Ni (100) surface: Compared with Ni (111) surface, J MOL CATAL A-CHEM, 258 (2006) 203-215. [12] Y.-A. Zhu, D. Chen, X.-G. Zhou, W.-K. Yuan, DFT studies of dry reforming of methane on Ni catalyst, Catal. Today, 148 (2009) 260-267. [13] J.L.C. Fajín, M.N.D.S. Cordeiro, F. Illas, J.R.B. Gomes, Influence of step sites in the molecular mechanism of the water gas shift reaction catalyzed by copper, J CATAL, 268 (2009) 131-141. [14] C.-H. Lin, C.-L. Chen, J.-H. Wang, Mechanistic Studies of Water-Gas-Shift Reaction on Transition Metals, J. Phys. Chem. C, 115 (2011) 18582-18588. [15] C. Higman, M.v.d. Burgt, Gasification. 2nd. ed, Gulf Professional Publishing, Oxfrod, UK, 2008. [16] C. Higman, M. Van der Burgt, Gasification, Gulf professional publishing, Jordan Hill, Oxford, UK, 2011. [17] C.A. Callaghan, Kinetics and catalysis of the water-gas-shift reaction: A microkinetic and graph theoretic approach, in, Worcester Polytechnic Institute, 2006. [18] S.H. Kim, S.-W. Nam, T.-H. Lim, H.-I. Lee, Effect of pretreatment on the activity of Ni catalyst for CO removal reaction by water–gas shift and methanation, APPL CATAL B-ENVIRON, 81 (2008) 97-104. [19] Y. Li, Q. Fu, M. Flytzani-Stephanopoulos, Low-temperature water-gas shift reaction over Cu-and Ni-loaded cerium oxide catalysts, APPL CATAL B-ENVIRON, 27 (2000) 179-191.
50
[20] K.-R. Hwang, C.-B. Lee, J.-S. Park, Advanced nickel metal catalyst for water–gas shift reaction, J POWER SOURCES, 196 (2011) 1349-1352. [21] G. Bond, Mechanisms of the gold-catalysed water-gas shift, GOLD BULL, 42 (2009) 337-342. [22] C. Ratnasamy, J.P. Wagner, Water Gas Shift Catalysis, Cat. Rev., 51 (2009) 325-440. [23] P.W. van Grootel, E.J. Hensen, R.A. van Santen, DFT study on H2O activation by stepped and planar Rh surfaces, SURF SCI, 603 (2009) 3275-3281. [24] P.W. van Grootel, E.J.M. Hensen, R.A. van Santen, DFT study on H2O activation by stepped and planar Rh surfaces, SurSc, 603 (2009) 3275-3281. [25] G. Jacobs, L. Williams, U. Graham, D. Sparks, B.H. Davis, Low-temperature water-gas shift: In-situ DRIFTS-reaction study of a Pt/CeO2 catalyst for fuel cell reformer applications, J. Phys. Chem. B, 107 (2003) 10398-10404. [26] K.G. Azzam, I.V. Babich, K. Seshan, L. Lefferts, Bifunctional catalysts for single-stage water-gas shift reaction in fuel cell applications.: Part 1. Effect of the support on the reaction sequence, J CATAL, 251 (2007) 153-162. [27] G. Jacobs, S. Ricote, U.M. Graham, P.M. Patterson, B.H. Davis, Low temperature water gas shift: Type and loading of metal impacts forward decomposition of pseudo-stabilized formate over metal/ceria catalysts, Catal. Today, 106 (2005) 259-264. [28] G.A. Somorjai, Y. Li, Introduction to surface chemistry and catalysis, Wiley, 2010. [29] Y. Morikawa, J.J. Mortensen, B. Hammer, J.K. Nørskov, CO adsorption and dissociation on Pt (111) and Ni (111) surfaces, Surf. Sci., 386 (1997) 67-72. [30] K. Christmann, O. Schober, G. Ertl, Adsorption of CO on a Ni (111) surface, J. Chem. Phys, 60 (1974) 4719. [31] F.P. Netzer, T.E. Madey, The structure of CO on Ni (111), J. Chem. Phys, 76 (1982) 710. [32] A.A. Koverga, S. Frank, M. Koper, Density Functional Theory study of electric field effects on CO and OH adsorption and co-adsorption on gold surfaces, ELECTROCHIM ACTA, (2013). [33] A. Politano, G. Chiarello, Vibrational investigation of catalyst surfaces: change of the adsorption site of CO molecules upon coadsorption, J. Phys. Chem. C, 115 (2011) 13541-13553. [34] I. Fleischer, D.M. Popolan, M. Krstić, V. Bonačić-Koutecký, T.M. Bernhardt, Composition dependent selectivity in the coadsorption of H< sub> 2</sub> O and CO on pure and binary silver-gold clusters, Chemical Physics Letters, (2013). [35] A. Politano, G. Chiarello, G. Benedek, E. Chulkov, P. Echenique, Vibrational spectroscopy and theory of alkali metal adsorption and co-adsorption on single-crystal surfaces, SURF SCI REP, 68 (2013) 305-389. [36] Y. Yazawa, N. Takagi, H. Yoshida, S.-i. Komai, A. Satsuma, T. Tanaka, S. Yoshida, T. Hattori, The support effect on propane combustion over platinum catalyst: control of the oxidation-resistance of platinum by the acid strength of support materials, Appl. Catal., A, 233 (2002) 103-112. [37] R.B. Anderson, K.C. Stein, J.J. Feenan, L.J.E. Hofer, Catalytic Oxidation of Methane, IND ENG CHEM RES, 53 (1961) 809-812. [38] M. Skoglundh, E. Fridell, Strategies for Enhancing Low-Temperature Activity, TOP CATAL, 28 (2004) 79-87. [39] M. Bizzi, G. Saracco, R. Schwiedernoch, O. Deutschmann, Modeling the partial oxidation of methane in a fixed bed with detailed chemistry, AIChE Journal, 50 (2004) 1289-1299. [40] R. Horn, K.A. Williams, N.J. Degenstein, L.D. Schmidt, Syngas by catalytic partial oxidation of methane on rhodium: Mechanistic conclusions from spatially resolved measurements and numerical simulations, J CATAL, 242 (2006) 92-102. [41] O.R. Inderwildi, S.J. Jenkins, D.A. King, An Unexpected Pathway for the Catalytic Oxidation of Methylidyne on Rh{111} as a Route to Syngas, J. Am. Chem. Soc., 129 (2007) 1751-1759. [42] O.R. Inderwildi, S.J. Jenkins, D.A. King, Mechanistic Studies of Hydrocarbon Combustion and Synthesis on Noble Metals, Angew. Chem. Int. Ed., 47 (2008) 5253-5255. [43] F. Fischer, H. Tropsch, The preparation of synthetic oil mixtures (synthol) from carbon monoxide and hydrogen, BRENNST CHEM, 4 (1923) 276-285.

51
[44] M.E. Dry, Practical and theoretical aspects of the catalytic Fischer-Tropsch process, Appl. Catal., A, 138 (1996) 319-344. [45] H. Schulz, Short history and present trends of Fischer-Tropsch synthesis, Appl. Catal., A, 186 (1999) 3-12. [46] Z.-P. Liu, P. Hu, A New Insight into Fischer−Tropsch Synthesis, J. Am. Chem. Soc., 124 (2002) 11568-11569. [47] I.M. Ciobıcă, G.J. Kramer, Q. Ge, M. Neurock, R.A. van Santen, Mechanisms for Chain Growth in Fischer–Tropsch Synthesis over Ru(0001), J CATAL, 212 (2002) 136-144. [48] R.C. Brady, R. Pettit, Reactions of diazomethane on transition-metal surfaces and their relationship to the mechanism of the Fischer-Tropsch reaction, J. Am. Chem. Soc., 102 (1980) 6181-6182. [49] R.C. Brady, R. Pettit, Mechanism of the Fischer-Tropsch reaction. The chain propagation step, J. Am. Chem. Soc., 103 (1981) 1287-1289. [50] J. Wilson, C. de Groot, Atomic-Scale Restructuring in High-Pressure Catalysis, J PHYS CHEM-US, 99 (1995) 7860-7866. [51] O.R. Inderwildi, S.J. Jenkins, D.A. King, Fischer-Tropsch mechanism revisited: Alternative pathways for the production of higher hydrocarbons from synthesis gas, J. Phys. Chem. C, 112 (2008) 1305-1307. [52] M.P. Andersson, F. Abild-Pedersen, I.N. Remediakis, T. Bligaard, G. Jones, J. Engbæk, O. Lytken, S. Horch, J.H. Nielsen, J. Sehested, J.R. Rostrup-Nielsen, J.K. Nørskov, I. Chorkendorff, Structure sensitivity of the methanation reaction: H2-induced CO dissociation on nickel surfaces, J CATAL, 255 (2008) 6-19. [53] J.W.E. Coenen, P.F.M.T. van Nisselrooy, M.H.J.M. de Croon, P.F.H.A. van Dooren, R.Z.C. van Meerten, The dynamics of methanation of carbon monoxide on nickel catalysts, APPL. CATAL., 25 (1986) 1-8. [54] M.P. Andersson, T. Bligaard, A. Kustov, K.E. Larsen, J. Greeley, T. Johannessen, C.H. Christensen, J.K. Nørskov, Toward computational screening in heterogeneous catalysis: Pareto-optimal methanation catalysts, J CATAL, 239 (2006) 501-506. [55] D.J. Klinke Ii, L.J. Broadbelt, Construction of a mechanistic model of Fischer–Tropsch synthesis on Ni(1 1 1) and Co(0 0 0 1) surfaces, Chem. Eng. Sci., 54 (1999) 3379-3389. [56] J.K. Nørskov, T. Bligaard, B. Hvolbæk, F. Abild-Pedersen, I. Chorkendorff, C.H. Christensen, The nature of the active site in heterogeneous metal catalysis, CHEM SOC REV, 37 (2008) 2163-2171. [57] J.L. Fajín, M. Cordeiro, F. Illas, J.R. Gomes, Influence of step sites in the molecular mechanism of the water gas shift reaction catalyzed by copper, J CATAL, 268 (2009) 131-141. [58] A. Mohsenzadeh, K. Bolton, T. Richards, DFT study of the adsorption and dissociation of water on Ni (111), Ni (110) and Ni (100) surfaces, SURF SCI, (2014). [59] C.R. Henry, Surface studies of supported model catalysts, SURF SCI REP, 31 (1998) 231-325. [60] P. Hohenberg, W. Kohn, Phys Rev B 136: 864. doi: 10.1103/PhysRev. 136, B864, (1964). [61] W. Kohn, L.J. Sham, doi: 10.1103/PhysRev. 140. A1133, Phys. Rev. A, 140 (1965) 113. [62] M. Born, R. Oppenheimer, Zur Quantentheorie der Molekeln, Ann. Phys., 84 (1927) 457. [63] V. Fock, Z. physik 61, 126 (1930); jc slater, Phys. Rev, 35 (1930) 210. [64] J.C. Slater, The self consistent field and the structure of atoms, Phys. Rev., 32 (1928) 339. [65] D.R. Hartree, The Wave Mechanics of an Atom with a non-Coulomb Central Field. Part III. Term Values and Intensities in Series in Optical Spectra, Mathematical Proceedings of the Cambridge Philosophical Society, 24 (1928) 426-437. [66] D.R. Hartree, The Wave Mechanics of an Atom with a Non-Coulomb Central Field. Part II. Some Results and Discussion, Mathematical Proceedings of the Cambridge Philosophical Society, 24 (1928) 111-132. [67] D.R. Hartree, The Wave Mechanics of an Atom with a Non-Coulomb Central Field. Part I. Theory and Methods, Mathematical Proceedings of the Cambridge Philosophical Society, 24 (1928) 89-110. [68] L.H. Thomas, The calculation of atomic fields, in: Mathematical Proceedings of the Cambridge Philosophical Society, Cambridge Univ Press, 1927, pp. 542-548.
52
[69] E. Fermi, Statistical method to determine some properties of atoms, Rend. Accad. Naz. Lincei, 6 (1927) 602-607. [70] W. Kohn, L.J. Sham, Self-consistent equations including exchange and correlation effects, Phys. Rev., 140 (1965) A1133. [71] D.C. Langreth, J.P. Perdew, Theory of nonuniform electronic systems. I. Analysis of the gradient approximation and a generalization that works, PHYS REV B, 21 (1980) 5469. [72] D.C. Langreth, M.J. Mehl, Beyond the local-density approximation in calculations of ground-state electronic properties, PHYS REV B, 28 (1983) 1809. [73] J.P. Perdew, J.A. Chevary, S.H. Vosko, K.A. Jackson, M.R. Pederson, D.J. Singh, C. Fiolhais, Atoms, molecules, solids, and surfaces: Applications of the generalized gradient approximation for exchange and correlation, PHYS REV B, 46 (1992) 6671. [74] J.P. Perdew, K. Burke, M. Ernzerhof, Generalized gradient approximation made simple, PHYS REV LETT, 77 (1996) 3865. [75] Y. Zhang, W. Yang, Comment on ``Generalized Gradient Approximation Made Simple'', PHYS REV LETT, 80 (1998) 890-890. [76] B. Hammer, L.B. Hansen, J.K. Nørskov, Improved adsorption energetics within density-functional theory using revised Perdew-Burke-Ernzerhof functionals, PHYS REV B, 59 (1999) 7413. [77] B. Hammer, K.W. Jacobsen, J.K. Nørskov, Role of nonlocal exchange correlation in activated adsorption, PHYS REV LETT, 70 (1993) 3971. [78] C. Adamo, V. Barone, Toward reliable density functional methods without adjustable parameters: The PBE0 model, J CHEM PHYS, 110 (1999) 6158-6170. [79] A.D. Becke, Density-functional thermochemistry. III. The role of exact exchange, J CHEM PHYS, 98 (1993) 5648-5652. [80] R. Car, M. Parrinello, Unified approach for molecular dynamics and density-functional theory, PHYS REV LETT, 55 (1985) 2471. [81] D.R. Hamann, M. Schlüter, C. Chiang, Norm-conserving pseudopotentials, PHYS REV LETT, 43 (1979) 1494. [82] D. Vanderbilt, Soft self-consistent pseudopotentials in a generalized eigenvalue formalism, PHYS REV B, 41 (1990) 7892. [83] P.E. Blöchl, Projector augmented-wave method, PHYS REV B, 50 (1994) 17953-17979. [84] H.J. Monkhorst, J.D. Pack, Special points for Brillouin-zone integrations, PHYS REV B, 13 (1976) 5188-5192. [85] J.L. Fajín, M. Cordeiro, F. Illas, J.R. Gomes, Descriptors controlling the catalytic activity of metallic surfaces toward water splitting, J CATAL, 276 (2010) 92-100. [86] H. Seenivasan, A.K. Tiwari, Water dissociation on Ni (100) and Ni (111): Effect of surface temperature on reactivity, J CHEM PHYS, 139 (2013) 174707-174707. [87] E.W. Bright Jr, J.C. Decius, P.C. Cross, Molecular Vibrations, Molecular Vibrations, (1955). [88] G. Henkelman, B.P. Uberuaga, H. Jónsson, A climbing image nudged elastic band method for finding saddle points and minimum energy paths, J CHEM PHYS, 113 (2000) 9901. [89] G. Henkelman, H. Jónsson, Improved tangent estimate in the nudged elastic band method for finding minimum energy paths and saddle points, J CHEM PHYS, 113 (2000) 9978. [90] H. Jónsson, G. Mills, K.W. Jacobsen, Nudged elastic band method for finding minimum energy paths of transitions, (1998). [91] G. Henkelman, H. Jónsson, A dimer method for finding saddle points on high dimensional potential surfaces using only first derivatives, J CHEM PHYS, 111 (1999) 7010-7022. [92] H.B. Schlegel, Geometry optimization, Wiley Interdisciplinary Reviews: Computational Molecular Science, 1 (2011) 790-809. [93] I. Chorkendorff, J.W. Niemantsverdriet, Concepts of modern catalysis and kinetics, John Wiley & Sons, 2006. [94] J.L. Fajín, M. Cordeiro, F. Illas, J.R. Gomes, Generalized Brønsted–Evans–Polanyi relationships and descriptors for O–H bond cleavage of organic molecules on transition metal surfaces, J CATAL, 313 (2014) 24-33.
53
[95] R. van Harrevelt, K. Honkala, J.K. Nørskov, U. Manthe, The reaction rate for dissociative adsorption of N on stepped Ru (0001): Six-dimensional quantum calculations, J CHEM PHYS, 122 (2005) 234702. [96] MATLAB R2014a, in, The Mathworks Inc. , Natick MA USA, 2013. [97] R.t. Shannon, C.T. Prewitt, Effective ionic radii in oxides and fluorides, Acta. Crystall. B-Stru, 25 (1969) 925-946. [98] J.N. Bronsted, Acid and Basic Catalysis, CHEM REV, 5 (1928) 231-338. [99] M.G. Evans, M. Polanyi, Inertia and driving force of chemical reactions, T FARADAY SOC, 34 (1938) 11-24. [100] J.K. Nørskov, T. Bligaard, A. Logadottir, S. Bahn, L.B. Hansen, M. Bollinger, H. Bengaard, B. Hammer, Z. Sljivancanin, M. Mavrikakis, Y. Xu, S. Dahl, C.J.H. Jacobsen, Universality in Heterogeneous Catalysis, J CATAL, 209 (2002) 275-278. [101] S. Wang, B. Temel, J. Shen, G. Jones, L. Grabow, F. Studt, T. Bligaard, F. Abild-Pedersen, C. Christensen, J. Nørskov, Universal Brønsted-Evans-Polanyi Relations for C–C, C–O, C–N, N–O, N–N, and O–O Dissociation Reactions, CATAL LETT, 141 (2011) 370-373. [102] J. Ayastuy, M. Gutierrez-Ortiz, J. Gonzalez-Marcos, A. Aranzabal, J. Gonzalez-Velasco, Kinetics of the low-temperature WGS reaction over a CuO/ZnO/Al2O3 catalyst, IND ENG CHEM RES, 44 (2005) 41-50. [103] B.W. Callen, K. Griffiths, P.R. Norton, Reorientation of chemisorbed water on Ni(110) by hydrogen bonding to second layer, PHYS REV LETT, 66 (1991) 1634-1637. [104] K. Griffiths, R.V. Kasza, F.J. Esposto, B.W. Callen, S.J. Bushby, P.R. Norton, Infra-red behaviour of sub-monolayer coverages of water on metal surfaces, SURF SCI, 307–309, Part A (1994) 60-64. [105] N. Pangher, A. Schmalz, J. Haase, Structure determination of water chemisorbed on Ni(110) by use of X-ray absorption fine-structure measurements, CHEM PHYS LETT, 221 (1994) 189-193. [106] T. Pache, H.P. Steinrück, W. Huber, D. Menzel, The adsorption of H2O on clean and oxygen precovered Ni(111) studied by ARUPS and TPD, SURF SCI, 224 (1989) 195-214. [107] D.W. Blaylock, Y.-A. Zhu, W.H. Green, Computational Investigation of the Thermochemistry and Kinetics of Steam Methane Reforming Over a Multi-Faceted Nickel Catalyst, TOP CATAL, 54 (2011) 828-844. [108] G. Kresse, J. Hafner, First-principles study of the adsorption of atomic H on Ni (111),(100) and (110), SURF SCI, 459 (2000) 287-302. [109] B. Bhatia, D.S. Sholl, Chemisorption and diffusion of hydrogen on surface and subsurface sites of flat and stepped nickel surfaces, J CHEM PHYS, 122 (2005) 204707. [110] F. Delbecq, P. Sautet, Low-temperature adsorption of formaldehyde on a platinum (111) surface. A theoretical study, Langmuir, 9 (1993) 197-207. [111] R. Smoluchowski, Anisotropy of the electronic work function of metals, Phys. Rev., 60 (1941) 661. [112] A. Mohsenzadeh, A. Borjesson, J.-H. Wang, T. Richards, K. Bolton, The Effect of Carbon Monoxide Co-Adsorption on Ni-Catalysed Water Dissociation, INT J MOL SCI, 14 (2013) 23301-23314. [113] A. Hodgson, S. Haq, Water adsorption and the wetting of metal surfaces, SURF SCI REP, 64 (2009) 381-451. [114] T. Pache, H.-P. Steinrück, W. Huber, D. Menzel, The adsorption of H2O on clean and oxygen precovered Ni (111) studied by ARUPS and TPD, SURF SCI, 224 (1989) 195-214. [115] C. Benndorf, T.E. Madey, Adsorption of H2O on clean and oxygen-preposed Ni (110), SURF SCI, 194 (1988) 63-91. [116] S.D. Miller, J.R. Kitchin, Relating the coverage dependence of oxygen adsorption on Au and Pt fcc (111) surfaces through adsorbate-induced surface electronic structure effects, SURF SCI, 603 (2009) 794-801. [117] J. Li, E. Croiset, L. Ricardez-Sandoval, Methane dissociation on Ni (100), Ni (111), and Ni (553): A comparative density functional theory study, J MOL CATAL A-CHEM, 365 (2012) 103-114. [118] B.C. Enger, A. Holmen, Nickel and Fischer-Tropsch Synthesis, Cat. Rev., 54 (2012) 437-488.
54
[119] N. Li, F. Gaillard, A. Boréave, Electrochemical promotion of Ag catalyst for the low temperature combustion of toluene, Catal. Commun., 9 (2008) 1439-1442. [120] M. Wu, X. Wang, Q. Dai, Y. Gu, D. Li, Low temperature catalytic combustion of chlorobenzene over Mn–Ce–O/γ-Al2O3 mixed oxides catalyst, Catal. Today, 158 (2010) 336-342. [121] S.-C. Huang, C.-H. Lin, J.H. Wang, Trends of Water Gas Shift Reaction on Close-Packed Transition Metal Surfaces, J. Phys. Chem. C, 114 (2010) 9826-9834. [122] A. Mohsenzadeh, K. Bolton, T. Richards, Oxidation and dissociation of formyl on Ni(111), Ni(110) and Ni(100) surfaces: A comparative density functional theory study, TOP CATAL, (2015). [123] A. Mohsenzadeh, T. Richards, K. Bolton, A density functional theory study of hydrocarbon combustion and synthesis on Ni surfaces, Journal of Molecular Modeling C7 - 46, 21 (2015) 1-11. [124] C.-C. Kao, S.-C. Tsai, Y.-W. Chung, Surface electronic properties and CO hydrogenation activity of nickel deposited on rutile TiO 2 (100) as a model supported catalyst, J CATAL, 73 (1982) 136-146. [125] D.W. Goodman, R.D. Kelley, T.E. Madey, J.T. Yates Jr, Kinetics of the hydrogenation of CO over a single crystal nickel catalyst, J CATAL, 63 (1980) 226-234. [126] G. Jacobs, U.M. Graham, E. Chenu, P.M. Patterson, A. Dozier, B.H. Davis, Low-temperature water–gas shift: impact of Pt promoter loading on the partial reduction of ceria and consequences for catalyst design, J CATAL, 229 (2005) 499-512. [127] C.H. Kim, L.T. Thompson, Deactivation of Au/CeOx water gas shift catalysts, J CATAL, 230 (2005) 66-74. [128] F.C. Meunier, D. Reid, A. Goguet, S. Shekhtman, C. Hardacre, R. Burch, W. Deng, M. Flytzani-Stephanopoulos, Quantitative analysis of the reactivity of formate species seen by DRIFTS over a Au/Ce(La)O2 water–gas shift catalyst: First unambiguous evidence of the minority role of formates as reaction intermediates, J CATAL, 247 (2007) 277-287. [129] C.M. Kalamaras, P. Panagiotopoulou, D.I. Kondarides, A.M. Efstathiou, Kinetic and mechanistic studies of the water–gas shift reaction on Pt/TiO2 catalyst, J CATAL, 264 (2009) 117-129. [130] A. Grob, Theoretical surface science: a microscopic perspective, Springer New York, 2003. [131] C.V. Ovesen, B.S. Clausen, B.S. Hammershøi, G. Steffensen, T. Askgaard, I. Chorkendorff, J.K. Nørskov, P.B. Rasmussen, P. Stoltze, P. Taylor, A Microkinetic Analysis of the Water–Gas Shift Reaction under Industrial Conditions, J CATAL, 158 (1996) 170-180. [132] C.V. Ovesen, P. Stoltze, J.K. Nørskov, C.T. Campbell, A kinetic model of the water gas shift reaction, J CATAL, 134 (1992) 445-468. [133] Y. Li, Q. Fu, M. Flytzani-Stephanopoulos, Low-temperature water-gas shift reaction over Cu- and Ni-loaded cerium oxide catalysts, APPL CATAL B-ENVIRON, 27 (2000) 179-191. [134] J. Nakamura, J.M. Campbell, C.T. Campbell, Kinetics and mechanism of the water-gas shift reaction catalysed by the clean and Cs-promoted Cu (110) surface: A comparison with Cu (111), J. Chem. Soc., Faraday Trans., 86 (1990) 2725-2734. [135] S. Hilaire, X. Wang, T. Luo, R.J. Gorte, J. Wagner, A comparative study of water-gas-shift reaction over ceria supported metallic catalysts, Appl. Catal., A, 215 (2001) 271-278. [136] E. Vesselli, L.D. Rogatis, X. Ding, A. Baraldi, L. Savio, L. Vattuone, M. Rocca, P. Fornasiero, M. Peressi, A. Baldereschi, R. Rosei, G. Comelli, Carbon Dioxide Hydrogenation on Ni(110), J. Am. Chem. Soc., 130 (2008) 11417-11422. [137] J. Wambach, G. Illing, H.J. Freund, CO2 activation and reaction with hydrogen on Ni(110): formate formation, CHEM PHYS LETT, 184 (1991) 239-244. [138] G. Jacobs, E. Chenu, P.M. Patterson, L. Williams, D. Sparks, G. Thomas, B.H. Davis, Water-gas shift: comparative screening of metal promoters for metal/ceria systems and role of the metal, Appl. Catal., A, 258 (2004) 203-214. [139] V. Sanchez-Escribano, M.A. Larrubia Vargas, E. Finocchio, G. Busca, On the mechanisms and the selectivity determining steps in syngas conversion over supported metal catalysts: An IR study, Appl. Catal., A, 316 (2007) 68-74. [140] D.C. Grenoble, M.M. Estadt, D.F. Ollis, The chemistry and catalysis of the water gas shift reaction: 1. The kinetics over supported metal catalysts, J CATAL, 67 (1981) 90-102.

55
[141] R.J. Madix, J.L. Gland, G.E. Mitchell, B.A. Sexton, Identification of the intermediates in the dehydration of formic acid on Ni (110) by high resolution electron energy loss vibrational spectroscopy, SURF SCI, 125 (1983) 481-489.

56

Paper I


Int. J. Mol. Sci. 2013, 14, 23301-23314; doi:10.3390/ijms141223301
International Journal of
Molecular Sciences ISSN 1422-0067
www.mdpi.com/journal/ijms
Article
The Effect of Carbon Monoxide Co-Adsorption on Ni-Catalysed
Water Dissociation
Abas Mohsenzadeh 1,*, Anders Borjesson
1,†, Jeng-Han Wang
2,†, Tobias Richards
1,† and
Kim Bolton 1,*
1 School of Engineering, University of Borås, Borås SE 501-90, Sweden;
E-Mails: [email protected] (A.B.); [email protected] (T.R.) 2 Department of Chemistry, National Taiwan University, No. 88, Sec. 4, Ting-Chow Rd,
Taipei 11677, Taiwan; E-mail: [email protected]
† These authors contributed equally to this work.
* Authors to whom correspondence should be addressed; E-Mails: [email protected] (A.M.);
[email protected] (K.B.); Tel.: +46-33-4354487 (A.M.); Fax: +46-33-4354008 (A.M.).
Received: 10 October 2013; in revised form: 12 November 2013 / Accepted: 15 November 2013 /
Published: 26 November 2013
Abstract: The effect of carbon monoxide (CO) co-adsorption on the dissociation of water on
the Ni(111) surface has been studied using density functional theory. The structures of the
adsorbed water molecule and of the transition state are changed by the presence of the CO
molecule. The water O–H bond that is closest to the CO is lengthened compared to the
structure in the absence of the CO, and the breaking O–H bond in the transition state
structure has a larger imaginary frequency in the presence of CO. In addition, the distances
between the Ni surface and H2O reactant and OH and H products decrease in the presence of
the CO. The changes in structures and vibrational frequencies lead to a reaction energy that
is 0.17 eV less exothermic in the presence of the CO, and an activation barrier that is 0.12 eV
larger in the presence of the CO. At 463 K the water dissociation rate constant is an order of
magnitude smaller in the presence of the CO. This reveals that far fewer water molecules
will dissociate in the presence of CO under reaction conditions that are typical for the
water-gas-shift reaction.
Keywords: water adsorption; water dissociation; nickel; water gas shift reaction;
CO; H2O; DFT
OPEN ACCESS
Int. J. Mol. Sci. 2013, 14 23302
1. Introduction
The water gas shift (WGS) reaction, CO + H2O → CO2 + H2, is important in many industrial
processes, including methanol synthesis and production of hydrogen for use in, e.g., fuel cells. It is also
one of the most important reactions in gasification, where carbonaceous materials are converted to a
gaseous product that can be used to produce energy or other desirable chemicals [1–5]. The efficiency of
the WGS reaction is enhanced in the presence of transition metal catalysts such as nickel, which is
widely used due to its high heat conductivity, high catalytic conversion and its capability to be
manufactured in different shapes [6–9].
Due to its industrial significance, several experimental and computational investigations have
focused on the WGS reaction. Bond et al. proposed a modified route for the gold-catalyzed WGS
reaction mechanism by thermal decomposition of a carboxyl species [10]. Steady-state WGS kinetics
were determined on ceria-supported Pd, Pt and Rh catalysts by Gorte et al.; they found that the ceria
structure significantly affects the results [11]. Shekhar et al. have investigated the promotional effect of
alkali additives (Na, Li and K) on the WGS reaction for Pt/Al2O3 and Pt/TiO2 catalysts. They showed
that the active platinum remains in the metallic state and that the promotion by alkali is due the
modification of the support properties [12]. A density functional theory (DFT) study together with
experimental data for the WGS reaction catalyzed by Pt were provided by Gokhale et al. They predicted
that that the most significant reaction channel proceeds via a carboxyl intermediate while formate acts
only as a spectator species [13]. Furthermore, Cordeiro et al. studied the role of the step sites in the WGS
reaction catalyzed by Cu and found that the associative route through the carboxyl intermediate assisted
by co-adsorbed OH is favored in the presence of steps [14].
The four mechanisms that have been suggested for the WGS reaction are the redox, formate,
associative and carbonate mechanisms [15–27]. Previous first principles calculations showed that the
most probable reaction mechanisms are the carboxyl and redox mechanisms, and that the rate-limiting
step is water dissociation [14,15,28–33].
The catalytic dissociation of water is also important in many other industrial processes, such as steam
methane reforming (SMR; CH4 + H2O → CO + 3H2) where nickel is frequently used as catalyst. The
SMR reaction involves the conversion of a hydrocarbon fuel (or an alcohol) into another fuel containing
higher heating value. The SMR reaction is widely implemented for production of hydrogen or other
useful products [34–36]. The water dissociation is believed to be one of the rate controlling elementary
reaction steps in the SMR reaction [37].
The catalytic dissociation of water has been widely studied using both experimental and
computational techniques. For example, hydroxyl radical production following Ni-catalyzed water
dissociation has been investigated experimentally by Keiser et al. [38]. The hydroxyl radicals were
monitored using laser-induced fluorescence and the barrier for their desorption was estimated at
different temperatures and pressures. Fajín et al. studied water dissociation on metal surfaces using DFT.
They predicted that the nickel surface could be effective for catalyzing water dissociation, that the
activation barrier is 0.71 eV and the reaction energy is −0.37 eV [33]. The binding energies, preferred
adsorption sites and configurations for water and its dissociation products (OH and H) were determined
over a number of surfaces, including Ni(111), by Phatak et al. They found that dissociation of H2O to
OH and H is exothermic on Ni(111) and the activation and reaction energies are 0.96 eV and −0.2 eV,

Int. J. Mol. Sci. 2013, 14 23303
respectively [39]. Several studies have also focused on fundamental aspects of water dissociation on
metal surfaces, such as the vibrational modes of the molecular and dissociated water [40–44].
In addition to the WGS reaction discussed above, interaction of CO with transition metal surfaces is
of importance in many catalytic reactions, such as the oxidation of carbon monoxide, CO methanation
and Fischer-Tropsch synthesis [45]. These interactions, including the interactions between adsorbed CO
and H2O, have been investigated over Ni(111) [46–48]. For example, high resolution electron energy
loss spectroscopy (HREELS) measurements by Ellis et al. revealed strong interaction between H2O and
CO adsorbed on Ni(100), where the co-adsorbed CO changes the water OH stretching properties [49].
DFT calculations by Lin et al. yielded a reaction energy of −0.11 eV and an activation barrier of 0.79 eV
for water dissociation in the presence of CO [50]. This reaction energy is less exothermic than those
obtained in the absence of CO (−0.37 and −0.2 eV, see above) and the activation barrier lies between the
values obtained in the absence of CO (0.71 and 0.96 eV). These, and other co-adsorption studies of
reactive chemical species on transition-metal catalysts, [51–54] are essential for a more complete
understanding of heterogeneous catalysis.
The present contribution extends these previous investigations by using DFT to perform a
comparative study of the dissociation of water on a Ni(111) surface in the absence and presence of
co-adsorbed CO. This is the first time that these systems have been studied using the same models and
computational methods, and is important since, if the co-adsorbed CO affects the reactant, transition
state or product relative energies or vibrational frequencies, then the water dissociation rate will depend
on the presence of CO. For example, the rates may be different for the reaction in a CO-rich WGS and
when water dissociates in other processes when CO is not present. In addition, molecular-level
understanding of the water dissociation mechanism which, as discussed above, is a key elementary
step in a number of important reactions such as WGS and SMR, will assist in designing more
effective catalysts.
2. Results and Discussion
2.1. Adsorption Sites and Energies
The top (t), hollow hcp (h) and hollow fcc (f) sites on the Ni(111) surface are shown in Figure 1.
Geometry optimization of the reactants and products was performed on the sites that have previously
been shown [50] to yield the lowest energy structures (i.e., the most favorable sites). The lowest energy
structures in the absence and presence of CO are shown in Figures 2 and 3, respectively, and details of
these structures are shown in Table 1. The * in these figures and table indicates that the specie is
adsorbed on the surface.
In the absence of CO, the preferred adsorption site for water is the top site (t) via the O atom. The
adsorption energy is −0.27 eV (−0.36 eV without zero point vibrational energy [ZPVE] correction). Both
of the OH and H products favor the hollow fcc site (f) and, similarly to the water molecule, the OH is
adsorbed via the O atom. The adsorption energy of these products is −5.83 eV (−6.23 eV without
ZPVE correction).

Int. J. Mol. Sci. 2013, 14 23304
Figure 1. Top (t), hollow hcp (h) and hollow fcc (f) sites on the Ni(111).
Figure 2. Minimum energy structures of the reactant, transition state and product for the
H2O* → OH
* + H
* reaction.
Figure 3. Minimum energy structures of the reactant, transition state and product for the
H2O* + CO
* → OH
* + H
* + CO
* reaction.

Int. J. Mol. Sci. 2013, 14 23305
Table 1. Adsorption energies (eV), vibrational frequencies (cm−1
) and structural parameters
(Å) of reactants and products with and without co-adsorbed carbon monoxide. a
Species Adsorption site
Vibrational frequencies dsurf-mol b Bond length
c
H2O* t −0.36 −0.27
3723, 3612, 1558, 489, 427, 227,
172, 122, 84 H2O: 2.157
O–Ha: 0.979;
O–Hb: 0.978
OH*+H* OH: f; H: f −6.23 −5.83 3712, 1220, 952, 776, 546, 502,
387, 290, 248
OH: 1.950;
H: 1.655 O–Ha: 0.973
H2O*+CO* H2O: t; CO: f −2.38 −2.32
3721, 3412, 1662, 1566, 737,
516, 379, 349, 322, 306, 226,
190, 149, 128, 76
H2O: 2.114;
CO: 1.903
O–Ha: 0.990;
O–Hb: 0.975;
C–O: 1.213
OH* + H* + CO* OH: f; H: f;
CO: f −7.99 −7.63
3704, 1761, 1253, 972, 740, 567,
520, 415, 395, 322, 299, 277,
246, 166, 122
OH: 1.923;
H: 1.646;
CO: 1.872
O–Ha: 0.974;
C–O: 1.195
a For the adsorption energies (Eads); “e” and “°” denote the uncorrected and ZPVE-corrected values, respectively; b Shortest distance
between any atom of the adsorbate(s) and any metal atom on the surface; c Letter “a” shows the O–H bond nearest the CO and “b” the other
O–H bond.
The presence of the CO does not affect the preferred adsorption sites. The favored adsorption site for
water is the top site (t) via the O atom and for carbon monoxide it is the hollow fcc site (f) via the C atom.
The adsorption energy is −2.32eV (−2.38 eV without ZPVE correction). All of the products prefer the
hollow fcc site (f), where the OH is adsorbed via the O atom and CO via the C atom. The adsorption
energy is −7.63 eV (−7.99 eV without ZPVE correction).
The calculations performed for the higher surface coverages yielded similar results to those presented
above. For example, for 1/4 monolayer (only water) and 1/2 monolayer (co-adsorbed water and CO)
coverages, the reactant adsorption energies are −0.20 eV (−0.26 eV without ZPVE correction) and
−2.43 eV (−2.35 eV without ZPVE correction), respectively.
Although the presence of the CO does not affect the preferred adsorption site, it does affect the
reactant geometry. In the absence of the CO the lengths of the O–H bonds in the water molecule are
almost the same (0.98 Å) while, in the presence of CO, the O–H bond closest to the CO molecule is
0.015 Å longer than the other bond. This larger bond length is probably due to interactions between this
H atom and the CO molecule (the distance between this H and the O on the CO is just 1.88 Å), although
the charge density on this H atom is the same as the charge density on the other H atom. This is also
reflected in the vibrational frequencies where the asymmetric stretching mode is lowered by
200 cm−1
(from 3612 to 3412 cm−1
in the absence and presence of CO, respectively). The presence of the
CO does not have a significant effect on the OH product geometry or vibrational frequency.
The co-adsorbed CO also affects the distance between the reactant and products with the Ni surface
(defined as the shortest distance between any atom of the adsorbate and any metal atom on the surface).
The distance between the H2O and the surface decreases from 2.157 Å to 2.114 Å when the CO is
present, for OH the decrease is from 1.950 Å to 1.923 Å, and for H the decrease is from 1.655 Å to 1.646 Å.
The reason that the presence of the CO molecule decreases the height of the reactant and products above
the surface is probably due to electron transfer from the CO to the Ni surface. In the presence of the CO
the total charge density on the uppermost Ni atoms is 0.63 e more than in the absence of the CO. This
increases the interaction strengths (and hence decreases the bond lengths) between the surface and the

Int. J. Mol. Sci. 2013, 14 23306
adsorbants, which is also seen by an increase in the charge density on the H2O, OH and H adsorbants by
0.01, 0.04 and 0.03 e, respectively.
2.2. Transition States and Reaction Energies
Table 2 shows the data of the transition states together with reaction rate constants at 463 K, which is
typical for low-temperature processes that include the WGS reaction [55]. The activation energy (Ea)
without co-adsorbed CO is 0.75 eV (0.96 eV without ZPVE correction) and in the presence of CO it
increases to 0.87 eV (1.09 eV without ZPVE correction), respectively. The activation energy in the
absence of CO is in agreement with that obtained by Fajín et al. (0.71 eV). Similarly, the value
determined in the presence of CO is similar to the value of 0.79 eV reported by Lin et al. The same trend
is found for higher coverages. For the 1/4 and 1/2 monolayer surfaces the activation barrier in the
absence of CO is 0.69 eV (0.87 eV without ZPVE correction) and in the presence of CO it is 1.18 eV
(1.39 eV without ZPVE correction). Hence, the presence of CO increases the activation energy at both
surface coverages.
Table 2. Activation energies (eV), vibrational frequencies (cm−1
), reaction rate constant at
463 K (s−1
), reaction energy (eV), length of the breaking OH bond at the transition state and
its imaginary frequency (cm−1
), with and without co-adsorbed carbon monoxide. a
Species
Vibrational modes k
dO–H Imaginary
frequency
H2O* → OH* + H* 0.96 0.75
3653, 837, 748, 677,
432, 393, 167, 71 2.03×10⁴ −0.30 −0.41 1.559 797
H2O* + CO* → OH* + H* + CO* 1.09 0.87
3623, 1726, 921, 765,
690, 465, 400, 377, 324,
282, 162, 147, 136, 105
1.76×10³ −0.05 −0.17 1.560 817
a For the activation energies (Ea), “e” and “°” denote the uncorrected and ZPVE-corrected values, respectively.
The length of the breaking O–H bond is not significantly influenced by CO co-adsorption, and its
(imaginary) vibrational frequency is increased by only 20 cm−1
. This means that the reaction barrier is
slightly narrower in the presence of the CO. However, this effect is not as significant as it is for the
water reactant, where the presence of the CO decreased the asymmetric vibrational mode frequency by
200 cm−1
.
Unlike the length and frequency of the breaking bond, the reaction rate constant changes considerably
when CO is present, decreasing from 2.03 × 10⁴ s
−1 to 1.76 × 10
3 s
−1. The rate constant in the absence of
CO is smaller than the value of 7.1 × 10⁴ s
−1 obtained by Fajín et al. [33]. This may be due to the
convergence criteria, since repeating the above calculation, but with coarser convergence criteria of
10−5
eV for the total energy and 10−2
eV/Å for the forces acting on ions, yields the same result as that
reported by Fajín et al.
The reaction energy (Ereact), which is the difference between the product and reactant energies, is
significantly affected by the presence of co-adsorbed CO. In the absence of CO Ereact = −0.41 eV
(−0.30 eV without ZPVE correction) which is 0.24 eV more exothermic than the reaction energy in the
presence of CO, which is −0.17 eV (−0.05 eV without ZPVE correction). The reaction energy calculated

Int. J. Mol. Sci. 2013, 14 23307
in the absence of CO is similar to that obtained by Fajín et al. (−0.31 eV). Similarly, the calculated
reaction energy in the presence of co-adsorbed CO is similar to the value of −0.11 eV obtained by
Line et al. [33,50].
A comparison of the reaction profiles with and without adsorbed carbon monoxide is shown in
Figure 4. As discussed above, the co-adsorbed CO increases the activation barrier by 0.12 eV and
decreases the exothermicity by 0.24 eV. A possible reason for the larger activation energy is that the CO
(and Ni surface) induces a larger change in the structure of the water molecule when going from reactant
to transition state. To investigate these we performed single point energy calculations on the water
molecule (in vacuum) in its reactant and transition state structures. It was seen that this does not explain
the trends seen in Figure 4, since the energy of the water molecule in the transition state structure is
lower than the energy in the reactant structure, and hence it is changes in the CO, Ni surface or
interactions between the water-CO-Ni that lead to the increase in energy at the transition state. Similarly,
calculations comparing the energies of the reactant water and product H and OH structures showed that
this cannot explain the decrease in exothermicity in the presence of the CO. In fact, when comparing the
H2O and (H + OH) energies the reaction is endothermic when using the structures from the both systems
(in the absence and presence of the CO).
Figure 4. Reaction profiles for the water dissociation with (dashed line) and without
(solid line) co-adsorbed CO.
These calculations were repeated but where the CO molecule was included (together with the water
molecule). This was done to ascertain whether it is changes in the CO molecule and/or interactions
between the H2O and CO that leads to an increase in the transition state energy compared to the energy of
the reactant. Once again, the H2O-CO energy (in the vacuum) of the transition state structure was lower
than the energy of the reactant structure, and the reaction is more exothermic than that when using the
structures from the system that does not contain CO (thus opposite to what is observed in Figure 4).
Hence, it is the interplay between all three components—the H2O, CO and Ni surface—that leads to
the reaction profiles seen in Figure 4. As discussed above, the presence of the CO on the surface leads to
stronger interactions between the Ni surface and the H2O reactant and H and OH products. The larger
activation energy and decreased exothermicity indicates that the stability induced by the surface in the
presence of CO is larger for the reactant than for the transition state and product structures.

Int. J. Mol. Sci. 2013, 14 23308
Figure 5 shows the effect of temperature on the reaction rate constant. The data is also shown in its
Arrhenius form in the inset to the figure. The difference in reaction rate constants in the absence and
presence of CO increases with increasing temperature, showing that it becomes even more important to
consider the effect of CO co-adsorption at higher temperatures.
Figure 5. Temperature dependence of the reaction rate constant for the water dissociation
reaction with and without co-adsorbed carbon monoxide. The Arrhenius format of the data is
shown in the inset.
3. Methods and Models
The calculations were performed with the Vienna ab initio simulation package (VASP) [56–59] using
spin polarized DFT. The Perdew-Burke-Ernzerhof generalized gradient approach (GGA-PBE) [60] to
the exchange-correlation potential was implemented and the projector-augmented wave method
(PAW) [61,62] was applied to the basis set to account for the effect of the core electrons in the valence
electron density. A 600-eV cutoff for the plane waves expansion was applied and a 4 × 4 × 1
Monkhorst-Pack grid of k-points [63] was used for the numerical integration in reciprocal space. As
shown previously [50] smaller Brillouin zone (BZ) sampling intervals (5 × 5 × 1 and 6 × 6 × 1) and
higher cutoff energies (700 and 800 eV) show insignificant differences in the energies of the
optimized structures (less than 0.01 eV). Hence, the cutoff and Monkhorst-Pack grid used here yield
converged results.
The surface orientation, as well as steps and defects on the surface, could affect its catalytic properties
and reactions energies [14,64]. The face-centered cubic (fcc) nickel, Ni(111), is the most stable Ni
surface and is therefore commonly used in computational studies of heterogeneous catalytic
reactions [65–69]. This surface was also used in the present work, where periodic boundary conditions
were imposed in two directions to model a semi-infinite crystal surface. Tests showed that a Ni(111)
surface containing 4 × 4 unit cells in each layer, and with five layers that are separated by an equivalent
volume of vacuum in the surface perpendicular direction, yield converged results in a computationally
tractable time. The two bottom layers of the slab were fixed to maintain the bulk crystal structure, and
the three upper layers were free to relax. This periodic box size, which yields a 1/16 monolayer coverage
for the water in the absence of CO and a 1/8 monolayer for the co-adsorbed CO and water, prevents
interactions between the surface atoms and adsorbates with their periodic images. Higher surface
0.0E+00
2.0E+06
4.0E+06
6.0E+06
8.0E+06
1.0E+07
1.2E+07
1.4E+07
200 300 400 500 600 700
Temperature (K)
k(s
-1)
H2O H2O + CO
-25
0
25
0.0015 0.003 0.0045
ln k
(s-1
)
1/T (K-1)

Int. J. Mol. Sci. 2013, 14 23309
coverages, including 1/4 and 1/2 monolayer, were also investigated to elucidate if the trends reported
here are sensitive to the surface coverage.
The conjugate-gradient (CG) method was used to obtain the geometry optimized structures of the
adsorbates on the surface. The convergence criteria were 10−6
eV for the total energy and 10−3
eV/Å for
the forces acting on the ions.
Transition states were identified using an improved version of the nudged elastic band (NEB)
method, called climbing-image NEB (CI-NEB) [70,71]. In this method, the lowest energy reactant and
product configurations are selected as the initial and final states, and 6 images were placed along the
minimum energy path (MEP). A −0.5 eVÅ−2
spring force constant between images was used. Due to
computational constraints, a smaller set of k-points (2 × 2 × 1) and a lower energy cutoff (400 eV) was
used to relax all the images until the maximum force acting on an atom was less than 0.01 eV. Single
point energy calculations at the transition state using 4 × 4 × 1 k-mesh and 600 eV cut off showed that the
activation energy differs from that obtained with the less accurate settings by at most 0.02 eV.
Vibrational frequencies were calculated at all stationary points to ensure that they were minimum
energy (zero imaginary frequencies) or transition states (one imaginary frequency) geometries, as well
as to determine the zero point vibrational energies (ZPVEs) and partition functions. The frequencies
were determined by diagonalizing a finite difference construction of the Hessian matrix using
displacements of 0.01 Å (only the adsorbates were allowed to move).
The adsorption energies (Eads) of the reactants and products were calculated from Equation (1).
Eads = Esurf + adsorbate – Esurf – Eadsorbate (1)
where Esurf is the total energy of the Ni(111) surface, Eadsorbate is the total energy of the isolated, geometry
optimized adsorbate(s) in the gas phase and Esurf + adsorbate is the total energy of the surface-adsorbate(s)
system. Results of Eads where ZPVE corrections are excluded ( ) and included (
) are given below
for the sake of completeness and to show the importance of this correction.
The water dissociation rate constant (k) was estimated using transition state theory [72], i.e.,
Equation (2).
(2)
where kB is Boltzmann’s constant, T is the absolute temperature, h is Planck’s constant and Ea is the
activation energy from the ZPVE corrected energies. q and q# are the partition functions for the reactant
and the transition state respectively. Similarly to previous studies [14,33,73], the partition functions have
been calculated assuming harmonic vibrations. Although this approximation may well affect the
quantitative results presented here, it is not expected to affect the trends.
The effect of the CO on the reactant, transition state and product geometries was analyzed using the
atomic charge densities. These calculations were performed using 2 × 2 unit cells in each layer, since
these cells yield the same geometric and energetic trends as the larger unit cells. The charge density on
each ion in the relaxed structure is calculated by integrating the valence charge density within the
Wigner-Seitz spheres around each atom. This radius is selected such that the total volume over all atoms
is approximately 100% and that the ratios of the atomic radii is equal to that of the ionic
radii [74]. The present calculations use a 8 × 8 × 1 k-point meshes and Wigner-Seitz radii equal to
Int. J. Mol. Sci. 2013, 14 23310
1.4 Å for Ni, 1.29 Å for carbon, 1.11 Å for oxygen and 0.7 Å for hydrogen. Altering these radii by up to
10% does not change the trends reported here.
4. Conclusions
The effect of CO co-adsorption on water dissociation over the Ni(111) nickel surface has been
studied using DFT calculations. The results show that the co-adsorption of CO alters the geometry of the
adsorbed reactant water molecule. The O–H bond that is closest to the CO is lengthened and weakened.
In addition, the distance between the reactants and products with the surface decreases in the presence of
the co-adsorbed CO. These changes result in a dissociation energy that is 0.24 eV less exothermic in the
presence of the CO.
The results also show that the activation energy for water dissociation increases by 0.12 eV in the
presence of the co-adsorbed CO. In addition, the breaking O–H bond at the transition state has a slightly
larger imaginary vibrational frequency in the presence of the co-adsorbed CO. These changes (including
changes in the reactant geometries and vibrational frequencies) lead to a considerable decrease in the
rate constant when CO is present. At typical low-temperature process conditions of 463 K, the rate
constant in the presence of CO is approximately twelve times smaller than in the absence of CO,
and this difference increases with increasing temperature. Hence, it is important to account for
co-adsorbed CO when Ni-catalyzed water dissociation occurs in a CO-rich environment.
Acknowledgments
This research presented here was funded by the Stiftelsen Föreningssparbanken Sjuhärad. The
computations and simulations were performed on resources provided by the Swedish National
Infrastructure for Computing (SNIC) at PDC Centre for High Performance Computing (PDC-HPC) and
the Uppsala Multidisciplinary Center for Advanced Computational Science (UPPMAX), as well as the
Abel resource (Oslo, Norway) provided by PRACE.
Conflicts of Interest
The authors declare no conflict of interest.
References
1. Higman, C.; van der Burgt, M. Gasification, 2nd ed.; Gulf Professional Publishing: Jordan Hill,
Oxford, UK, 2008.
2. Yu, J.; Tian, F.; Chow, M.; McKenzie, L.; Li, C. Effect of iron on the gasification of Victorian
brown coal with steam: Enhancement of hydrogen production. Fuel 2006, 85, 127–133.
3. Rozovskii, A.; Lin, G. Fundamentals of methanol synthesis and decomposition. Top. Catal. 2003,
22, 137–150.
4. Larrubia Vargas, M.A.; Busca, G.; Costantino, U.; Marmottini, F.; Montanari, T.; Patrono, P.;
Pinzari, F.; Ramis, G. An IR study of methanol steam reforming over ex-hydrotalcite Cu–Zn–Al
catalysts. J. Mol. Catal. A 2007, 266, 188–197.

Int. J. Mol. Sci. 2013, 14 23311
5. Lee, S.H.D.; Applegate, D.V.; Ahmed, S.; Calderone, S.G.; Harvey, T.L. Hydrogen from natural
gas: Part I—Autothermal reforming in an integrated fuel processor. Int. J. Hydrogen Energy 2005,
30, 829–842.
6. Callaghan, C.A. Kinetics and catalysis of the water-gas-shift reaction: A microkinetic and graph
theoretic approach. Master’s Thesis, Worcester Polytechnic Institute, Worceste, MA, USA, 2006.
7. Hwang, K.-R.; Lee, C.-B.; Park, J.-S. Advanced nickel metal catalyst for water-gas shift reaction.
J. Power Sources 2011, 196, 1349–1352.
8. Li, Y.; Fu, Q.; Flytzani-Stephanopoulos, M. Low-temperature water-gas shift reaction over
Cu- and Ni-loaded cerium oxide catalysts. Appl. Catal. B 2000, 27, 179–191.
9. Kim, S.H.; Nam, S.-W.; Lim, T.-H.; Lee, H.-I. Effect of pretreatment on the activity of Ni catalyst
for CO removal reaction by water-gas shift and methanation. Appl. Catal. B 2008, 81, 97–104.
10. Bond, G. Mechanisms of the gold-catalysed water-gas shift. Gold. Bull. 2009, 42, 337–342.
11. Bunluesin, T.; Gorte, R.J.; Graham, G.W. Studies of the water-gas-shift reaction on
ceria-supported Pt, Pd, and Rh: Implications for oxygen-storage properties. Appl. Catal. B 1998, 15,
107–114.
12. Pazmiño, J.H.; Shekhar, M.; Damion Williams, W.; Cem Akatay, M.; Miller, J.T.;
Nicholas Delgass, W.; Ribeiro, F.H. Metallic Pt as active sites for the water-gas shift reaction on
alkali-promoted supported catalysts. J. Catal. 2012, 286, 279–286.
13. Grabow, L.C.; Gokhale, A.A.; Evans, S.T.; Dumesic, J.A.; Mavrikakis, M. Mechanism of the water
gas shift reaction on Pt: First principles, experiments, and microkinetic modeling.
J. Phys. Chem. C 2008, 112, 4608–4617.
14. Fajín, J.L.; Cordeiro, M.; Illas, F.; Gomes, J.R. Influence of step sites in the molecular mechanism
of the water gas shift reaction catalyzed by copper. J. Catal. 2009, 268, 131–141.
15. Nakamura, J.; Campbell, J.M.; Campbell, C.T. Kinetics and mechanism of the water-gas shift
reaction catalysed by the clean and Cs-promoted Cu (110) surface: A comparison with Cu(111).
J. Chem. Soc. Faraday Trans. 1990, 86, 2725–2734.
16. Ovesen, C.; Stoltze, P.; Nørskov, J.; Campbell, C. A kinetic model of the water gas shift reaction.
J. Catal. 1992, 134, 445–468.
17. Ovesen, C.; Clausen, B.; Hammershøi, B.; Steffensen, G.; Askgaard, T.; Chorkendorff, I.;
Nørskov, J.K.; Rasmussen, P.; Stoltze, P.; Taylor, P. A microkinetic analysis of the water-gas shift
reaction under industrial conditions. J. Catal. 1996, 158, 170–180.
18. Campbell, C.T.; Daube, K. A surface science investigation of the water-gas shift reaction on
Cu(111). J. Catal. 1987, 104, 109–119.
19. Froment, G.F.; Waugh, K. Dynamics of Surfaces and Reaction Kinetics in Heterogeneous
Catalysis; Froment, G.F., Waugh, K.C., Eds.; Elsevier Science: Amsterdam, The Netherlands,
1997; Volume 109.
20. Waugh, K.C. Prediction of global reaction kinetics by solution of the Arrhenius parameterised
component elementary reactions: Microkinetic analysis. Catal. Today 1999, 53, 161–176.
21. Fishtik, I.; Datta, R. A UBI-QEP microkinetic model for the water-gas shift reaction on Cu(111).
Surf. Sci. 2002, 512, 229–254.
22. Rhodes, C.; Hutchings, G.; Ward, A. Water-gas shift reaction: Finding the mechanistic boundary.
Catal. Today 1995, 23, 43–58.
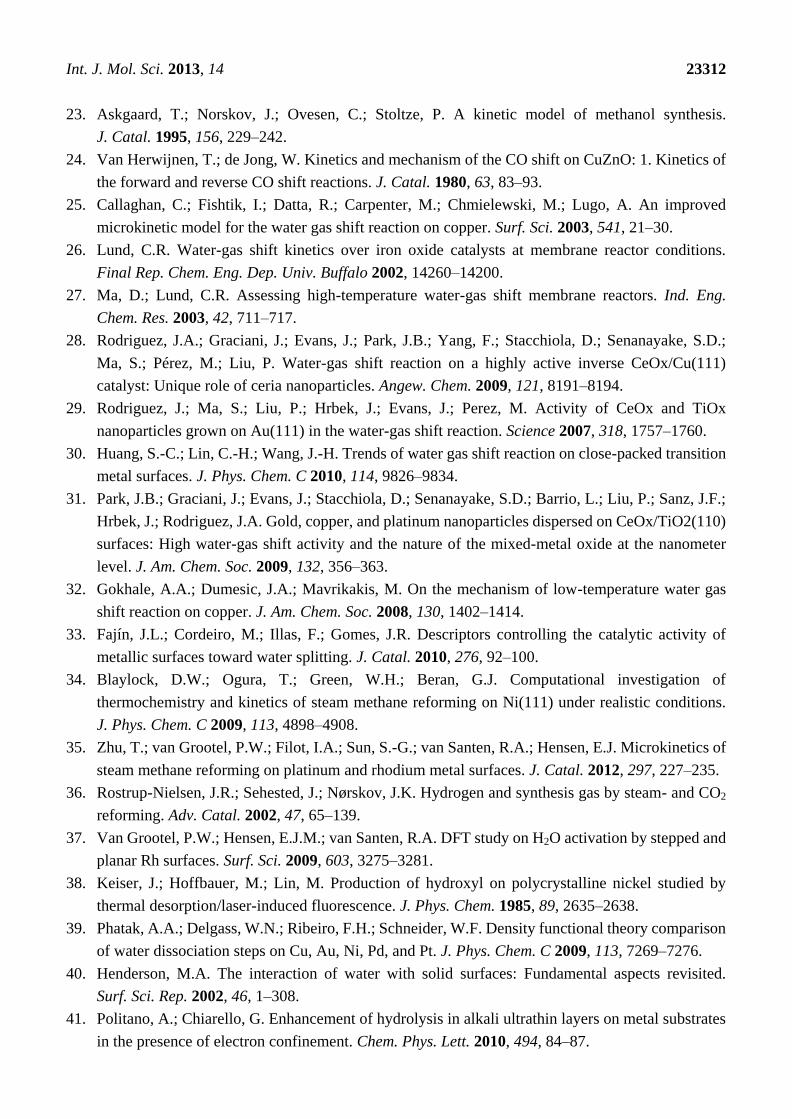
Int. J. Mol. Sci. 2013, 14 23312
23. Askgaard, T.; Norskov, J.; Ovesen, C.; Stoltze, P. A kinetic model of methanol synthesis.
J. Catal. 1995, 156, 229–242.
24. Van Herwijnen, T.; de Jong, W. Kinetics and mechanism of the CO shift on CuZnO: 1. Kinetics of
the forward and reverse CO shift reactions. J. Catal. 1980, 63, 83–93.
25. Callaghan, C.; Fishtik, I.; Datta, R.; Carpenter, M.; Chmielewski, M.; Lugo, A. An improved
microkinetic model for the water gas shift reaction on copper. Surf. Sci. 2003, 541, 21–30.
26. Lund, C.R. Water-gas shift kinetics over iron oxide catalysts at membrane reactor conditions.
Final Rep. Chem. Eng. Dep. Univ. Buffalo 2002, 14260–14200.
27. Ma, D.; Lund, C.R. Assessing high-temperature water-gas shift membrane reactors. Ind. Eng.
Chem. Res. 2003, 42, 711–717.
28. Rodriguez, J.A.; Graciani, J.; Evans, J.; Park, J.B.; Yang, F.; Stacchiola, D.; Senanayake, S.D.;
Ma, S.; Pérez, M.; Liu, P. Water-gas shift reaction on a highly active inverse CeOx/Cu(111)
catalyst: Unique role of ceria nanoparticles. Angew. Chem. 2009, 121, 8191–8194.
29. Rodriguez, J.; Ma, S.; Liu, P.; Hrbek, J.; Evans, J.; Perez, M. Activity of CeOx and TiOx
nanoparticles grown on Au(111) in the water-gas shift reaction. Science 2007, 318, 1757–1760.
30. Huang, S.-C.; Lin, C.-H.; Wang, J.-H. Trends of water gas shift reaction on close-packed transition
metal surfaces. J. Phys. Chem. C 2010, 114, 9826–9834.
31. Park, J.B.; Graciani, J.; Evans, J.; Stacchiola, D.; Senanayake, S.D.; Barrio, L.; Liu, P.; Sanz, J.F.;
Hrbek, J.; Rodriguez, J.A. Gold, copper, and platinum nanoparticles dispersed on CeOx/TiO2(110)
surfaces: High water-gas shift activity and the nature of the mixed-metal oxide at the nanometer
level. J. Am. Chem. Soc. 2009, 132, 356–363.
32. Gokhale, A.A.; Dumesic, J.A.; Mavrikakis, M. On the mechanism of low-temperature water gas
shift reaction on copper. J. Am. Chem. Soc. 2008, 130, 1402–1414.
33. Fajín, J.L.; Cordeiro, M.; Illas, F.; Gomes, J.R. Descriptors controlling the catalytic activity of
metallic surfaces toward water splitting. J. Catal. 2010, 276, 92–100.
34. Blaylock, D.W.; Ogura, T.; Green, W.H.; Beran, G.J. Computational investigation of
thermochemistry and kinetics of steam methane reforming on Ni(111) under realistic conditions.
J. Phys. Chem. C 2009, 113, 4898–4908.
35. Zhu, T.; van Grootel, P.W.; Filot, I.A.; Sun, S.-G.; van Santen, R.A.; Hensen, E.J. Microkinetics of
steam methane reforming on platinum and rhodium metal surfaces. J. Catal. 2012, 297, 227–235.
36. Rostrup-Nielsen, J.R.; Sehested, J.; Nørskov, J.K. Hydrogen and synthesis gas by steam- and CO2
reforming. Adv. Catal. 2002, 47, 65–139.
37. Van Grootel, P.W.; Hensen, E.J.M.; van Santen, R.A. DFT study on H2O activation by stepped and
planar Rh surfaces. Surf. Sci. 2009, 603, 3275–3281.
38. Keiser, J.; Hoffbauer, M.; Lin, M. Production of hydroxyl on polycrystalline nickel studied by
thermal desorption/laser-induced fluorescence. J. Phys. Chem. 1985, 89, 2635–2638.
39. Phatak, A.A.; Delgass, W.N.; Ribeiro, F.H.; Schneider, W.F. Density functional theory comparison
of water dissociation steps on Cu, Au, Ni, Pd, and Pt. J. Phys. Chem. C 2009, 113, 7269–7276.
40. Henderson, M.A. The interaction of water with solid surfaces: Fundamental aspects revisited.
Surf. Sci. Rep. 2002, 46, 1–308.
41. Politano, A.; Chiarello, G. Enhancement of hydrolysis in alkali ultrathin layers on metal substrates
in the presence of electron confinement. Chem. Phys. Lett. 2010, 494, 84–87.

Int. J. Mol. Sci. 2013, 14 23313
42. Liu, K.; Gao, S. Water adsorption on Na/Cu(111): State-specific coupling with quantum well states.
J. Phys. Chem. C 2012, 116, 17613–17618.
43. Meng, S.; Wang, E.; Gao, S. Water adsorption on metal surfaces: A general picture from density
functional theory studies. Phys. Rev. B 2004, 69, 195404.
44. Meng, S.; Xu, L.; Wang, E.; Gao, S. Vibrational recognition of hydrogen-bonded water networks
on a metal surface. Phys. Rev. Lett. 2002, 89, 176104.
45. Somorjai, G.A.; Li, Y. Introduction to surface chemistry and catalysis, 2nd ed.; Wiley: Hoboken,
NJ, USA, 2010.
46. Morikawa, Y.; Mortensen, J.J.; Hammer, B.; Nørskov, J.K. CO adsorption and dissociation on
Pt(111) and Ni(111) surfaces. Surf. Sci. 1997, 386, 67–72.
47. Christmann, K.; Schober, O.; Ertl, G. Adsorption of CO on a Ni(111) surface. J. Chem. Phys. 1974,
60, 4719.
48. Netzer, F.P.; Madey, T.E. The structure of CO on Ni(111). J. Chem. Phys. 1982, 76, 710.
49. Ellis, T.; Kruus, E.; Wang, H. The interaction between water and carbon monoxide coadsorbed onto
Ni(100). Surf. Sci. 1992, 273, 73–87.
50. Lin, C.-H.; Chen, C.-L.; Wang, J.-H. Mechanistic studies of water-gas-shift reaction on transition
metals. J. Phys. Chem. C 2011, 115, 18582–18588.
51. Koverga, A.A.; Frank, S.; Koper, M. Density functional theory study of electric field effects on CO
and OH adsorption and co-adsorption on gold surfaces. Electrochim. Acta 2013, 101, 244–253.
52. Politano, A.; Chiarello, G. Vibrational investigation of catalyst surfaces: Change of the adsorption
site of CO molecules upon coadsorption. J. Phys. Chem. C 2011, 115, 13541–13553.
53. Politano, A.; Chiarello, G.; Benedek, G.; Chulkov, E.; Echenique, P. Vibrational spectroscopy and
theory of alkali metal adsorption and co-adsorption on single-crystal surfaces. Surf. Sci. Rep. 2013,
68, 305–389.
54. Fleischer, I.; Popolan, D.M.; Krstić, M.; Bonačić-Koutecký, V.; Bernhardt, T.M.
Composition dependent selectivity in the coadsorption of H2O and CO on pure and binary
silver-gold clusters. Chem. Phys. Lett. 2013, 565, 74–79.
55. Ayastuy, J.; Gutierrez-Ortiz, M.; González-Marcos, J.; Aranzabal, A.; Gonzalez-Velasco, J.
Kinetics of the low-temperature WGS reaction over a CuO/ZnO/Al2O3 catalyst. Ind. Eng. Chem.
Res. 2005, 44, 41–50.
56. Kresse, G.; Hafner, J. Ab initio molecular dynamics for liquid metals. Phys. Rev. B 1993, 47, 558.
57. Kresse, G.; Hafner, J. Ab initio molecular-dynamics simulation of the
liquid-metal-amorphous-semiconductor transition in germanium. Phys. Rev. B 1994, 49, 14251.
58. Kresse, G.; Furthmüller, J. Efficiency of ab-initio total energy calculations for metals and
semiconductors using a plane-wave basis set. Comput. Mater. Sci. 1996, 6, 15–50.
59. Kresse, G.; Furthmüller, J. Efficient iterative schemes for ab initio total-energy calculations using a
plane-wave basis set. Phys. Rev. B 1996, 54, 11169.
60. Perdew, J.P.; Burke, K.; Ernzerhof, M. Generalized gradient approximation made simple.
Phys. Rev. Lett. 1996, 77, 3865.
61. Pan, Y.; Zhang, H.; Shi, D.; Sun, J.; Du, S.; Liu, F.; Gao, H. Highly ordered, millimeter-scale,
continuous, single-crystalline graphene monolayer formed on Ru(0001). Adv. Mater. 2009, 21,
2777–2780.

Int. J. Mol. Sci. 2013, 14 23314
62. Blöchl, P.E. Projector augmented-wave method. Phys. Rev. B 1994, 50, 17953.
63. Monkhorst, H.J.; Pack, J.D. Special points for Brillouin-zone integrations. Phys. Rev. B 1976, 13,
5188–5192.
64. Nørskov, J.K.; Bligaard, T.; Hvolbæk, B.; Abild-Pedersen, F.; Chorkendorff, I.; Christensen, C.H.
The nature of the active site in heterogeneous metal catalysis. Chem. Soc. Rev. 2008, 37,
2163–2171.
65. Pozzo, M.; Carlini, G.; Rosei, R.; Alfè, D. Comparative study of water dissociation on Rh(111) and
Ni(111) studied with first principles calculations. J. Chem. Phys. 2007, 126, 164706.
66. Hansen, H.A.; Rossmeisl, J.; Nørskov, J.K. Surface Pourbaix diagrams and oxygen reduction
activity of Pt, Ag and Ni(111) surfaces studied by DFT. Phys. Chem. Chem. Phys. 2008, 10,
3722–3730.
67. Remediakis, I.N.; Abild-Pedersen, F.; Nørskov, J.K. DFT study of formaldehyde and methanol
synthesis from CO and H2 on Ni(111). J. Phys. Chem. B 2004, 108, 14535–14540.
68. Mittendorfer, F.; Hafner, J. Hydrogenation of benzene on Ni(111) a DFT study. J. Phys. Chem. B
2002, 106, 13299–13305.
69. Loffreda, D.; Simon, D.; Sautet, P. Vibrational frequency and chemisorption site: A DFT-periodic
study of NO on Pd(111) and Rh(111) surfaces. Chem. Phys. Lett. 1998, 291, 15–23.
70. Henkelman, G.; Uberuaga, B.P.; Jónsson, H. A climbing image nudged elastic band method for
finding saddle points and minimum energy paths. J. Chem. Phys. 2000, 113, 9901.
71. Henkelman, G.; Jónsson, H. Improved tangent estimate in the nudged elastic band method for
finding minimum energy paths and saddle points. J. Chem. Phys. 2000, 113, 9978–9985.
72. Chorkendorff, I.; Niemantsverdriet, J.W. Concepts of Modern Catalysis and Kinetics, 2nd ed.;
Wiley: Weinheim, Germany, 2006.
73. Van Harrevelt, R.; Honkala, K.; Nørskov, J.K.; Manthe, U. The reaction rate for dissociative
adsorption of N on stepped Ru(0001): Six-dimensional quantum calculations. J. Chem. Phys. 2005,
122, 234702.
74. Shannon, R.T.; Prewitt, C.T. Effective ionic radii in oxides and fluorides. Acta Cryst. 1969, 25,
925–946.
© 2013 by the authors; licensee MDPI, Basel, Switzerland. This article is an open access article
distributed under the terms and conditions of the Creative Commons Attribution license
(http://creativecommons.org/licenses/by/3.0/).

Paper II


Surface Science 627 (2014) 1–10
Contents lists available at ScienceDirect
Surface Science
j ourna l homepage: www.e lsev ie r .com/ locate /susc
DFT study of the adsorption and dissociation of water on Ni(111),Ni(110) and Ni(100) surfaces
Abas Mohsenzadeh ⁎, Kim Bolton, Tobias RichardsSchool of Engineering, University of Borås, SE 501-90 Borås, Sweden
⁎ Corresponding author at: University of Borås, SE 501-4354487; fax: +46 33 4354008.
E-mail addresses: [email protected] (A. Mohse(K. Bolton), [email protected] (T. Richards).
http://dx.doi.org/10.1016/j.susc.2014.04.0060039-6028/© 2014 Elsevier B.V. All rights reserved.
a b s t r a c t
a r t i c l e i n f oArticle history:Received 5 March 2014Accepted 8 April 2014Available online 18 April 2014
Keywords:AdsorptionDissociationNickelWaterDFT
Water adsorption and dissociation on catalytic metal surfaces play a key role in a variety of industrial processes,and a detailed understanding of this process and how it is effected by the surface structurewill assist in develop-ing improved catalysts. Hence, a comparative study of the adsorption and dissociation of water on Ni(111),Ni(110) and Ni(100) surfaces, which is often used as catalyst, has been performed using density functional the-ory. The results show that the adsorption energies and dissociation rates depend on the surface structure. The ad-sorption energies for H2O and OH decrease in the order Ni(110) N Ni(100) N Ni(111), and for the O and H atomsthe adsorption energies decrease in the order Ni(100) N Ni(111) N Ni(110). In addition, the splitting of water toOH and H has lower activation energies over less packed Ni(110) and Ni(100) surfaces compared to the highlypacked Ni(111) surface. The subsequent splitting of the OH to O and H also has the lowest activation energyon the Ni(110) surface. At 463 K,which is typical for industrial processes that include thewater gas shift reaction,the H2O splitting is approximately 6000 and 10 times faster on the Ni(110) surface compared to the Ni(111) andNi(100) surfaces, respectively, and OH splitting is 200 and 3000 times faster, respectively. The complete waterdissociation reaction rate decreases in the order Ni(110) N Ni(100) N Ni(111).
© 2014 Elsevier B.V. All rights reserved.
1. Introduction
The interaction of water with solid surfaces is of great importance inmany physical, chemical and biological processes. Water dissociation isbelieved to be one of the rate controlling elementary reaction steps inthe water gas shift reaction (WGS; CO + H2O⇋CO2 + H2) and steammethane reforming (SMR; CH4 + H2O⇋CO + 3H2) [1,2] where nickel isfrequently used as the catalyst. The WGS reaction is widely applied inthe chemical industry to remove CO and to produce additional hydrogen[3]. The SMR reaction is often used for producing hydrogen or other usefulproducts [4–6]. The interaction of water with surfaces also plays a role infuel cells, where there is adsorption-desorption and dissociation-formation of water molecules on metal surfaces. A fundamental under-standing of water-surface interactions will assist in understanding wateradsorption, desorption andheterogeneous catalytic reactionmechanisms.
As reviewed by Thiel et al. [7] and Henderson et al. [8], many exper-imental and computational investigations have focused on wateradsorption and dissociation over metallic surfaces. Water dissociationin most industrial processes occurs in the presence of transition metalcatalysts such as nickel, since it has a large heat conductivity, highcatalytic conversion and it can be manufactured in different shapes [3,
90 Borås, Sweden. Tel.: +46 33
nzadeh), [email protected]
9–11]. Keiser et al. investigated hydroxyl radical production followingNi-catalyzed water splitting [12]. They used laser-induced fluorescenceto monitor the hydroxyl radicals, and obtained the desorption barrier.Guo et al. studied the formation and reactivity of hydroxyl species on aNi(110) surface using temperature-programmed desorption and X-rayphotoelectron spectroscopy. They found that predosed oxygen onNi(110) can significantly modify the nature of the adsorption states ofwater on the surface [13]. Water adsorption on a Ni(100) surface wasinvestigated by Nöbl et al. [14], who found that water dimers form attemperatures below 150 K and at coverages below θ ≈ 0.5 monolayers.The dimers are bound to the nickel surface via both oxygen atoms, andthe linear hydrogen bond axis is oriented parallel to the surface.
Water splitting on metal surfaces has been studied using densityfunctional theory (DFT) by Fajín et al. who found that the nickel surfacecan be an effective catalyst for water dissociation. They estimated thatthe activation barrier and reaction energies are 0.71 and −0.37 eV,respectively, on the Ni(111) surface [15]. Phatak et al. investigated thebinding energies, preferred adsorption sites and configurations forwater and its splitting products (OH and H) over a number of surfaces.They found that the activation and reaction energies are 0.96 and−0.2 eV, respectively for the Ni(111) surface [16]. Sebastiani et al.used DFT to study the energetic details and mechanisms of the adsorp-tion of water on nickel surfaces with and without a step defect. Theyfound that the bindingwas strongest on the step and at the top adhesionsites, and that additional water molecules tend to strengthen the bondbetween the nickel surface and thewater, which is bound to the surface

2 A. Mohsenzadeh et al. / Surface Science 627 (2014) 1–10
via its oxygen atom [17]. Pozzo et al. investigated water dissociation onNi(111) and reported thatwater adsorbs on top nickel surface siteswitha binding energy of 0.35 eV. Activation barriers of 0.89 and 0.97 eV haveto be overcome to split the water into OH and H and to split OH into Oand H, respectively, on Ni(111) [18].
A DFT study of the WGS reaction and coke formation pathways onflat Ni(111) and stepped Ni(211) surfaces was performed by Catapanet al. This included thewater dissociation elementary step. They obtain-ed an activation barrier of 0.90 and 1.01 eV for water and OH splitting,respectively, on Ni(111) [19].
Thepresent contribution extendsprevious investigations byusingDFTto perform a comparative study of the adsorption and dissociation ofwater on Ni(111), Ni(110) and Ni(100) surfaces. This is the first timethat these three different crystallographic orientations of the exposed sur-faces have been studied using the same models and computationalmethods. If the crystallographic structure of the nickel catalyst affectsthe reactant, transition state or product relative energies or the vibrationalfrequencies, then thewater adsorption strength and dissociation ratewilldepend on the type of nickel surface used as catalyst. These results areexpected to aid in identifyingwhich of the three crystallographic surfacesis the most efficient for water dissociation.
2. Methods and models
2.1. Calculation methods
Spin polarized DFT calculationswere performed using the Vienna abinitio simulation package (VASP) [20–23]. The exchange-correlationfunctional with the generalized gradient approximation of Perdew,Burke and Ernzerh (GGA-PBE) [24] was combined with the projector-augmentedwavemethod (PAW) [25,26] to solve the Kohn-Sham equa-tions. The Kohn-Sham orbitals were expanded in a plane-wave basis setusing a 400 eV kinetic energy cut off, and a 4 × 4 × 1 Monkhorst-Packgrid of k-points [27]was used for the numerical integration in reciprocalspace. Test calculations showed that larger cut offs and finer k-meshesyielded the same trends reported below. Also, for the density of statescalculations, a dense 41 × 41 × 1 k-point grid was employed. A 0.1 eVFermi smearingwas used and the convergence criteria for the geometryoptimizations were 10−6 eV for the total energy and 10−3 eVÅ−1 forthe forces acting on the ions. The conjugate-gradient (CG) methodwas used for the geometry optimizations.
Previous studies have shown that the catalytic properties and reac-tion energies are affected by the surface orientation, steps and defects[28,29] and that nickel particles grown on oxide or graphite substrateshave polyhedral shapes exhibiting (111), (110) and (100) facets [30].These nickel facets were, therefore, used to study the water adsorptionand dissociation.
Surfaceswere constructed using 2 × 2 unit cells with four layers, andperiodic boundary conditions in two directions tomodel a semi-infinitecrystal surface. The twoupper layerswere free to relaxwhile the bottomhalf of the slab was fixed tomaintain the bulk crystal structure. This pe-riodic box size, which corresponds to a 1/4 and 1/2 monolayer (ML)coverage when there are one and two adsorbates, respectively, hasbeen widely used in previous investigations of adsorption on transitionmetal surfaces [31–33] and yields converged results in a computational-ly tractable time. Lower surface coverages were also examined andyielded the same trends reported below [34].
Transition states were identified using the climbing image – nudgedelastic band (CI-NEB)method [35,36], where the lowest energy reactantand product configurations are selected as the initial and final states. Siximages were placed along theminimum energy path (MEP) and a−0.5eVÅ−2 spring force constant between imageswas used to relax all of theimages until the maximum force acting on each atom was less than 0.1eVÅ−1. Calculations using a 0.01 eVÅ−1 convergence criteria showedthat the activation energy differs from that obtained with 0.1 eVÅ−1
by at most 0.2 meV.
Vibrational frequencies were calculated at all stationary points (re-actants, products and transition states) by diagonalizing a finite differ-ence construction of the Hessian matrix using displacements of 0.01 Åand where only the adsorbates were allowed to move. These frequen-cies were used to ensure that the structures were minimum energystructures (zero imaginary frequencies) or transition states (one imag-inary frequency) and to calculate the vibrational partition functionsand zero point vibrational energies (ZPVEs).
The adsorption energies (Eads) of the reactants and products werecalculated using Eq. (1).
Eads ¼ Esurfþadsorbate−Esurf−Eadsorbate ð1Þ
where Esurf + adsorbate is the total energy of the surface-adsorbate(s) sys-tem, Esurf is the total energy of the surface and Eadsorbate is the total energyof the isolated, geometry optimized adsorbate(s) in the gas phase. Datafor theuncorrected andZPVE corrected adsorptionenergies are presentedto show the effect of this correction. The dissociation rate constants (k)were estimated from transition state theory [37] using Eq. (2).
k ¼ kBTh
� �q#
q
!e
−EakBT ð2Þ
where kB is Boltzmann's constant, T is the absolute temperature and h isPlanck's constant. q and q# are the partition functions for the reactantand the transition state, respectively, and Ea is the ZPVE corrected activa-tion energy. The partition functions have been estimated assuming har-monic vibrations. Although this approximation may well affect thequantitative results presented here, it is not expected to affect the trends[15,29,38].
2.2. Adsorption sites
As shown in the left panel of Fig. 1, there are four high symmetryadsorption sites on the Ni(111) crystal surface. The top site is abovethe uppermost Ni surface atom and is labeled A, the hcp 3-fold hollowsite (where the central metallic atom in this site is in the second surfacelayer) is labeled C, the fcc 3-fold hollow site (where the central metallicatom is in the third surface layer) is labeled C′ and the 2-fold bridge sitebetween two neighboring atoms is labeled B. There are five high symme-try adsorption sites on the Ni(110) surface. These are the top site labeledA, a 2-fold long bridge site labeled E, a 2-fold short bridge site labeled F, arectangular 4-fold hollow site labeled D and a quasi 3-fold hollow site la-beled G (which is located in themiddle of the short bridge and the 4-foldsites). In addition to the top and bridge sites labeled A and B, the Ni(100)crystal surface has a square 4-fold hollow adsorption site labeled D′.
2.3. Kinetic model
TheODE45 solver in theMATLABR2013a simulation package [39]wasemployed to solve the following ordinary differential equations (ODEs):
d H2O½ �dt
¼ −k1 H2O½ � ð3Þ
d OH½ �dt
¼ k1 H2O½ �−k2 OH½ � ð4Þ
d H½ �dt
¼ k1 H2O½ � þ k2 OH½ � ð5Þ
d O½ �dt
¼ k2 OH½ � ð6Þ

Fig. 1.Different adsorption sites on theNi(111), Ni(100) andNi(110) crystal surfaces. A is a top site, B is a bridge site, C is an hcp site, C′ is an fcc site, D is a rectangular 4-fold hollow site, D′is a square 4-fold hollow site, E is a long bridge site, F is a short bridge site and G is a pseudo 3-fold hollow site.
3A. Mohsenzadeh et al. / Surface Science 627 (2014) 1–10
where [H2O], [OH], [O] and[H] are H2O, OH, O and H concentrations, andk1 and k2 are reaction rate constants for the splitting of water and OH,respectively. They are determined by the DFT calculations.
3. Results and discussion
3.1. Adsorption energies
Geometry optimizations were performed for all adsorption sitesshown in Fig. 1 and for different orientations of the adsorbates. The low-est energy structures were then selected for subsequent investigationsof the reactionmechanism and rates. Details of the lowest energy struc-tures of the individual chemical species that are involved in H2O disso-ciation are presented in Table 1, together with results from previousstudies. The preferred adsorption site for water is the top site (A) for allsurfaces, which is in agreement with previous results (references givenin the table). The strongest adsorption is −0.39 eV (−0.47 eV withoutZPVE) on the Ni(110) surface, compared to−0.27 eV (−0.34 eVwithout
Table 1Adsorption energies (eV), structural parameters (Å and degrees) of for the chemical species in
surface Adsorption site Eadse Eadso dsurf-adsb
H2O Ni(111) A −0.26 −0.20 2.225Ni(110) A −0.47 −0.39 2.117Ni(100) A −0.34 −0.27 2.155
OH Ni(111) C′ −3.41 −3.08 1.976Ni(110) F −3.80 −3.44 1.918Ni(100) D′ −3.62 −3.27 2.102
O Ni(111) C′ −5.39 −5.31 1.836
Ni(110) E −5.04 −4.98 1.897Ni(100) D′ −5.69 −5.63 1.950
H Ni(111) C′ −2.84 −2.66 1.707Ni(110) G −2.68 −2.51 1.699Ni(100) D′ −2.82 −2.70 1.838
a For the adsorption energies (Eads), “e” and “o” denote the uncorrected and ZPVE-corrected valatom on the surface. c O–HB is the bond which is broken during the reaction. d Reference [1(GGA-PW91 calculations using a 2 × 2 unit cell and four layer slab). f Reference [19] (GGA-calculations using a 3 × 2 unit cell and three layer slab). h Reference [41] (GGA-RPBE calculations using a 2 × 2 unit cell and four layer slab). j Reference [43] (GGA-PW91 calculationusing a 2 × 2 unit cell and four layer slab).
ZPVE) for Ni(100) and−0.20 eV (−0.26 eV without ZPVE) for Ni(111).The two O–H bonds have the same lengths on the Ni(111) and Ni(100)surfaces, whereas one of the O–H bonds (the breaking bond) is longerthan the other bond by about 0.01 Å on the Ni(110) surface. Thesurface-adsorbate distance, defined as the distance between any atomof the adsorbate and the nearest Ni atom, is the shortest on the Ni(111)surface (which is also the surface that has the strongest adsorption).The O–H bond lengths and H–O–H angle for the isolated water moleculeare 0.973 Å and 104.2°, respectively, which are smaller compared to theadsorbed water on all surfaces. Hence, the catalyst surfaces increase thebond lengths and bond angle.
Fajín et al. reported water adsorption energies of −0.32 and−0.54 eV, surface-adsorbate distances of 2.23 and 2.09 Å, and O–Hbond lengths of 0.98 and 0.98 Å for Ni(111) and Ni(110), respectively[15]. Seenivasan et al. obtained adsorption energies of −0.17 and−0.26 eV, and O–H bond lengths of 0.98 and 0.98 Å for Ni(111) andNi(100), respectively [42]. They also obtained the heights of H2O oxygenatoms above the Ni(111) and Ni(100) surfaces, respectively, as 2.33 and
volved in H2O dissociation.a
Bond lengthc θH–O–H Previous results for Eadso
O–H: 0.982, O–HB: 0.982 104.6 −0.25d, −0.32e, −0.47f, −0.17i
O–H: 0.979, O–HB: 0.990 105.3 −0.54e
O–H: 0.982, O–HB: 0.982 105.0 −0.26i
O–Hb: 0.974 - −3.14d, −3.34f, −3.05h, −3.31i
O–Hb: 0.978 - -O–Hb: 0.978 - −3.37g, −3.26h, −3.57i
- - −5.50d, −5.60e,−4.81f, −5.14h
- - −5.49e
- - −5.46h
- - −2.78d, −2.77f, −2.80i, −0.60j, −0.49k
- - −0.45j, −0.37k
- - −2.83g, −2.64h, −2.80i, −0.57j, −0.55k
ues, respectively. b Shortest distance between any atom of the adsorbate(s) and any metal8] (GGA-PBE calculations using a 2 × 2 unit cell and three layer slab). e Reference [15]PBE calculations using a 2 × 2 unit cell and four layer slab). g Reference [40] (GGA-PBElations using a 2 × 2 unit cell and three layer slab). i Reference [42] (GGA-PBE calcu-s using a 2 × 2 unit cell and four layer slab). k Reference [44] (GGA-PW91 calculations
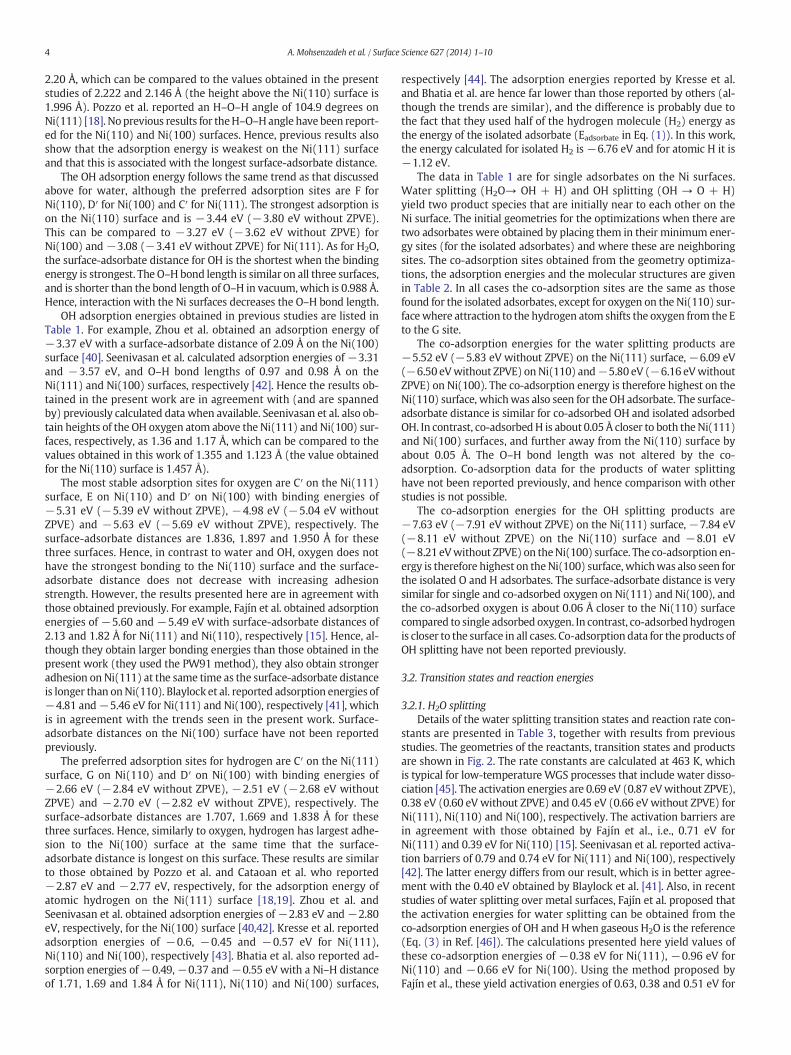
4 A. Mohsenzadeh et al. / Surface Science 627 (2014) 1–10
2.20 Å, which can be compared to the values obtained in the presentstudies of 2.222 and 2.146 Å (the height above the Ni(110) surface is1.996 Å). Pozzo et al. reported an H–O–H angle of 104.9 degrees onNi(111) [18]. Noprevious results for theH–O–Hangle have been report-ed for the Ni(110) and Ni(100) surfaces. Hence, previous results alsoshow that the adsorption energy is weakest on the Ni(111) surfaceand that this is associated with the longest surface-adsorbate distance.
The OH adsorption energy follows the same trend as that discussedabove for water, although the preferred adsorption sites are F forNi(110), D′ for Ni(100) and C′ for Ni(111). The strongest adsorption ison the Ni(110) surface and is −3.44 eV (−3.80 eV without ZPVE).This can be compared to −3.27 eV (−3.62 eV without ZPVE) forNi(100) and −3.08 (−3.41 eV without ZPVE) for Ni(111). As for H2O,the surface-adsorbate distance for OH is the shortest when the bindingenergy is strongest. The O–H bond length is similar on all three surfaces,and is shorter than the bond length of O–H in vacuum,which is 0.988 Å.Hence, interaction with the Ni surfaces decreases the O–H bond length.
OH adsorption energies obtained in previous studies are listed inTable 1. For example, Zhou et al. obtained an adsorption energy of−3.37 eV with a surface-adsorbate distance of 2.09 Å on the Ni(100)surface [40]. Seenivasan et al. calculated adsorption energies of −3.31and −3.57 eV, and O–H bond lengths of 0.97 and 0.98 Å on theNi(111) and Ni(100) surfaces, respectively [42]. Hence the results ob-tained in the present work are in agreement with (and are spannedby) previously calculated data when available. Seenivasan et al. also ob-tain heights of the OH oxygen atom above the Ni(111) and Ni(100) sur-faces, respectively, as 1.36 and 1.17 Å, which can be compared to thevalues obtained in this work of 1.355 and 1.123 Å (the value obtainedfor the Ni(110) surface is 1.457 Å).
The most stable adsorption sites for oxygen are C′ on the Ni(111)surface, E on Ni(110) and D′ on Ni(100) with binding energies of−5.31 eV (−5.39 eV without ZPVE), −4.98 eV (−5.04 eV withoutZPVE) and −5.63 eV (−5.69 eV without ZPVE), respectively. Thesurface-adsorbate distances are 1.836, 1.897 and 1.950 Å for thesethree surfaces. Hence, in contrast to water and OH, oxygen does nothave the strongest bonding to the Ni(110) surface and the surface-adsorbate distance does not decrease with increasing adhesionstrength. However, the results presented here are in agreement withthose obtained previously. For example, Fajín et al. obtained adsorptionenergies of −5.60 and −5.49 eV with surface-adsorbate distances of2.13 and 1.82 Å for Ni(111) and Ni(110), respectively [15]. Hence, al-though they obtain larger bonding energies than those obtained in thepresent work (they used the PW91 method), they also obtain strongeradhesion on Ni(111) at the same time as the surface-adsorbate distanceis longer than onNi(110). Blaylock et al. reported adsorption energies of−4.81 and−5.46 eV for Ni(111) and Ni(100), respectively [41], whichis in agreement with the trends seen in the present work. Surface-adsorbate distances on the Ni(100) surface have not been reportedpreviously.
The preferred adsorption sites for hydrogen are C′ on the Ni(111)surface, G on Ni(110) and D′ on Ni(100) with binding energies of−2.66 eV (−2.84 eV without ZPVE), −2.51 eV (−2.68 eV withoutZPVE) and −2.70 eV (−2.82 eV without ZPVE), respectively. Thesurface-adsorbate distances are 1.707, 1.669 and 1.838 Å for thesethree surfaces. Hence, similarly to oxygen, hydrogen has largest adhe-sion to the Ni(100) surface at the same time that the surface-adsorbate distance is longest on this surface. These results are similarto those obtained by Pozzo et al. and Cataoan et al. who reported−2.87 eV and −2.77 eV, respectively, for the adsorption energy ofatomic hydrogen on the Ni(111) surface [18,19]. Zhou et al. andSeenivasan et al. obtained adsorption energies of −2.83 eV and −2.80eV, respectively, for the Ni(100) surface [40,42]. Kresse et al. reportedadsorption energies of −0.6, −0.45 and −0.57 eV for Ni(111),Ni(110) and Ni(100), respectively [43]. Bhatia et al. also reported ad-sorption energies of−0.49,−0.37 and−0.55 eV with a Ni–H distanceof 1.71, 1.69 and 1.84 Å for Ni(111), Ni(110) and Ni(100) surfaces,
respectively [44]. The adsorption energies reported by Kresse et al.and Bhatia et al. are hence far lower than those reported by others (al-though the trends are similar), and the difference is probably due tothe fact that they used half of the hydrogen molecule (H2) energy asthe energy of the isolated adsorbate (Eadsorbate in Eq. (1)). In this work,the energy calculated for isolated H2 is −6.76 eV and for atomic H it is−1.12 eV.
The data in Table 1 are for single adsorbates on the Ni surfaces.Water splitting (H2O→ OH + H) and OH splitting (OH → O + H)yield two product species that are initially near to each other on theNi surface. The initial geometries for the optimizations when there aretwo adsorbates were obtained by placing them in their minimum ener-gy sites (for the isolated adsorbates) and where these are neighboringsites. The co-adsorption sites obtained from the geometry optimiza-tions, the adsorption energies and the molecular structures are givenin Table 2. In all cases the co-adsorption sites are the same as thosefound for the isolated adsorbates, except for oxygen on the Ni(110) sur-facewhere attraction to the hydrogen atom shifts the oxygen from the Eto the G site.
The co-adsorption energies for the water splitting products are−5.52 eV (−5.83 eV without ZPVE) on the Ni(111) surface, −6.09 eV(−6.50 eVwithout ZPVE) onNi(110) and−5.80 eV (−6.16 eVwithoutZPVE) on Ni(100). The co-adsorption energy is therefore highest on theNi(110) surface, whichwas also seen for the OH adsorbate. The surface-adsorbate distance is similar for co-adsorbed OH and isolated adsorbedOH. In contrast, co-adsorbedH is about 0.05 Å closer to both theNi(111)and Ni(100) surfaces, and further away from the Ni(110) surface byabout 0.05 Å. The O–H bond length was not altered by the co-adsorption. Co-adsorption data for the products of water splittinghave not been reported previously, and hence comparison with otherstudies is not possible.
The co-adsorption energies for the OH splitting products are−7.63 eV (−7.91 eV without ZPVE) on the Ni(111) surface, −7.84 eV(−8.11 eV without ZPVE) on the Ni(110) surface and −8.01 eV(−8.21 eVwithout ZPVE) on theNi(100) surface. The co-adsorption en-ergy is therefore highest on theNi(100) surface, whichwas also seen forthe isolated O and H adsorbates. The surface-adsorbate distance is verysimilar for single and co-adsorbed oxygen on Ni(111) and Ni(100), andthe co-adsorbed oxygen is about 0.06 Å closer to the Ni(110) surfacecompared to single adsorbed oxygen. In contrast, co-adsorbedhydrogenis closer to the surface in all cases. Co-adsorption data for the products ofOH splitting have not been reported previously.
3.2. Transition states and reaction energies
3.2.1. H2O splittingDetails of the water splitting transition states and reaction rate con-
stants are presented in Table 3, together with results from previousstudies. The geometries of the reactants, transition states and productsare shown in Fig. 2. The rate constants are calculated at 463 K, whichis typical for low-temperatureWGS processes that include water disso-ciation [45]. The activation energies are 0.69 eV (0.87 eVwithout ZPVE),0.38 eV (0.60 eV without ZPVE) and 0.45 eV (0.66 eV without ZPVE) forNi(111), Ni(110) and Ni(100), respectively. The activation barriers arein agreement with those obtained by Fajín et al., i.e., 0.71 eV forNi(111) and 0.39 eV for Ni(110) [15]. Seenivasan et al. reported activa-tion barriers of 0.79 and 0.74 eV for Ni(111) and Ni(100), respectively[42]. The latter energy differs from our result, which is in better agree-ment with the 0.40 eV obtained by Blaylock et al. [41]. Also, in recentstudies of water splitting over metal surfaces, Fajín et al. proposed thatthe activation energies for water splitting can be obtained from theco-adsorption energies of OH and H when gaseous H2O is the reference(Eq. (3) in Ref. [46]). The calculations presented here yield values ofthese co-adsorption energies of −0.38 eV for Ni(111), −0.96 eV forNi(110) and −0.66 eV for Ni(100). Using the method proposed byFajín et al., these yield activation energies of 0.63, 0.38 and 0.51 eV for

Table 2Adsorption energies (eV), structural parameters (Å) of products for H2O (top) and OH (bottom) splitting.a
Surface Adsorption site Eadse Eadso dsurf-adsb Bond length
OH + H Ni(111) OH: C′, H: C′ −5.83 −5.52 OH: 1.974, H: 1.660 O–H: 0.974Ni(110) OH: F, H: G −6.50 −6.09 OH: 1.918, H: 1.753 O–H: 0.978Ni(100) OH: D′, H: D′ −6.16 −5.80 OH: 2.104, H: 1.789 O–H: 0.978
O + H Ni(111) O: C′, H: C′ −7.91 −7.63 O: 1.835, H: 1.660 -Ni(110) O: G, H: G −8.11 −7.84 O: 1.835, H: 1.688 -Ni(100) O: D′, H: D′ −8.21 −8.01 O: 1.948, H: 1.786 -
a For the adsorption energies (Eads), “e” and “o” denote the uncorrected and ZPVE-corrected values, respectively. b Shortest distance between any atom of the adsorbate(s) and any metalatom on the surface.
5A. Mohsenzadeh et al. / Surface Science 627 (2014) 1–10
Ni(111), Ni(110) and Ni(100), respectively, which agree very well withthe energies calculated in the present study, i.e., 0.69, 0.38 and 0.45 eV,respectively. Hence, similarly to the trends seen in previous studies, theactivation energy for water splitting is lowest on the Ni(110) surfaceand largest on the Ni(111) surface.
These results are also supported by experimental observations. Sincethe calculated water splitting barrier for the Ni(111) surface is largerthan the water desorption energy, it is expected that water will desorbintact without proceeding to OH+H species. This is in agreement withthe observation that a water monolayer desorbs when heating this sur-face to 165 K,without evidence thatwater splitting products are formed[47,48]. The calculated adsorption energy for the Ni(110) surface islarger than that for the Ni(111) surface, which is in agreement withthe observation that a water monolayer remains adsorbed on theNi(110) surface at temperatures larger than 165 K [47]. In addition,the water splitting barrier on the Ni(110) surface is lower than thedesorption energy, which is consistent with the observation thatthe OH splitting product is observed at temperatures larger than200 K [47]. In addition, Benndorf and Madey used a combination ofexperimental methods (electron stimulated desorption ion angulardistribution, thermal desorption spectroscopy and low energy elec-tron diffraction) to estimate an energy barrier of 0.5 eV for O–Hbond breakage on cleanNi(110), which is close to the barrier calculatedin this work [49].
The length of the breaking O–H bonds of the transition state struc-tures are shorter by about 0.2 Å for both the Ni(110) and Ni(100) sur-faces compared to Ni(111), and the imaginary vibrational frequenciesare higher by about 300 cm−1 for Ni(110) and 100 cm−1 for Ni(100).This is consistent with the fact that lower frequencies are expected forlonger bond lengths, since the curvature of the potential energy curveincreases (i.e., the curve flattens) with increasing bond length. In allcases the breaking O–H bonds are longer than the reactant structures(discussed with reference to Table 1). Although the H–O–H bondangle of the transition state structure on Ni(111) is similar to that ofthe reactant, it is increased by about 16° on the two other surfaces.The distance between the oxygen adsorbate and the nearest Ni atomis very similar for the Ni(110) and Ni(100) surfaces, and is about 0.04Å shorter on the Ni(111) surface. The hydrogen of the O–H breakingbond is 0.3 Å closer to the nearest nickel atom on the Ni(111) and
Table 3H2O splitting activation energies (eV), reaction rate constant at 463 K (s−1), reaction energy (e(cm−1) and structural parameters (Å and degrees).a
Surface Eao k Ereacto
Ni(111) This work 0.69 1.23 × 10⁴ −0.18Previous results 0.89d, 0.71e, 0.90f, 0.90g, 0.79h 7.4 × 10⁴e −0.37e, −0.
Ni(110) This work 0.38 7.36 × 10⁷ −0.57Previous results 0.39e 1.8 × 10⁸e −0.52e
Ni(100) This work 0.45 7.62 × 10⁶ −0.39Previous results 0.40g, 0.74h - −0.49g
a Energies are the ZPVE-corrected values. b Shortest distance between oxygen of the adsorbate aing bond and any metal atom on the surface. d Reference [18] (GGA-PBE calculations using a 2unit cell and four layer slab, rate constants are calculated at 463 K). f Reference [19] (GGA-PBElationsusing a 2 × 2 unit cell and three layer slab). h Reference [42] (GGA-RPBE calculations usinunit cell and four layer slab).
Ni(100) surfaces compared to Ni(110). Fajín et al. obtained O–H break-ing bond lengths of 1.55 and 1.34 Å on Ni(111) and Ni(110), respective-ly, and imaginary frequencies of 747 and 1273 cm−1 [15]which is in fairagreement with the results obtained here. Seenivasan et al. reported O–H breaking bond lengths of 1.48 and 1.53 Å for Ni(111) and Ni(100), re-spectively, and H–O–H angles of 120.0 and 119.8° [42]. Catapan et al.,however, obtained a H–O–H angle of 103.6 degrees on Ni(111), whichis similar to the value obtained here [19].
When water molecules are close to each other on the metal surface,hydrogen bonding affects the structures of the species involved inwaterdissociation as well as the activation energies linking these species [47,50,51]. However, the size of the super cell used in this work which, asdescribed above, is similar to the size used in similar studies, results ina distance between the hydrogen and the oxygen of neighboringwater molecules (i.e., between periodic images) of about 4 Å. This islarger than the typical hydrogen bond length in water, which is 1.97 Å[52]. Hence, hydrogen bonding is not expected to be important in themodels studied here.
The reaction rate constants are strongly influenced by the surfacestructure, and at 463 K they decrease from 7.36 × 10⁷ s−1 on Ni(110)to 7.62 × 10⁶ s−1 on Ni(100) and to 1.23 × 10⁴ s−1 on Ni(111). Thevalues are comparable to 7.4 × 10⁴ s−1 for Ni(111) and 1.8 × 10⁸ s−1
for Ni(110) obtained by Fajín et al. [15]. The small deviations are prob-ably due to differences in the convergence criteria, since repeating thecalculation but with coarser convergence criteria of 10−5 eV for thetotal energy and 10−2 eVÅ−1 for the forces acting on ions yielded thesame results as those reported by Fajín et al. The reason for this is thatthe difference in convergence criteria results in slightly different valuesfor the frequencies and for the activation energies, and hence in the rateconstants calculated from Eq. (2). Rate constants of water splitting onthe Ni(100) surface have not previously been reported, and hence com-parison cannot be made for this surface.
The reaction energies are the differences between the ZPVE-corrected product and reactant energies. The reaction is exothermicon all surfaces, with reaction energies of −0.18, −0.57 and −0.39 eVfor Ni(111), Ni(110) andNi(100), respectively. Themost exothermic re-action occurs on Ni(110)which is 0.18 eV and 0.39 eVmore exothermicthan the reaction energy on Ni(100) and Ni(111), respectively. The re-action energies show the same trends as those obtained by Fajín et al.,
V), length of the breaking OH bond at the transition state (Å) and its imaginary frequency
dO–H Imaginary frequency dNi–O b dNi–H c θH–O–H
1.538 899 1.937 1.764 104.728g 1.55e, 1.586f, 1.48h 747e, 748f, 989h 1.88h 1.14h 120.0h, 103.6i
1.334 1285 2.016 2.007 121.01.34e 1273e - - -1.340 1034 2.001 1.706 122.11.53h 1068h 1.93h 1.17h 119.8h
nd anymetal atom on the surface. c Shortest distance between hydrogen of the O–H break-× 2 unit cell and three layer slab). e Reference [15] (GGA-PW91 calculations using a 2 × 2calculations using a 2 × 2 unit cell and four layer slab). g Reference [41] (GGA-RPBE calcu-g a 2 × 2 unit cell and four layer slab). i Reference [19] (GGA-PBE calculations using a 2 × 2
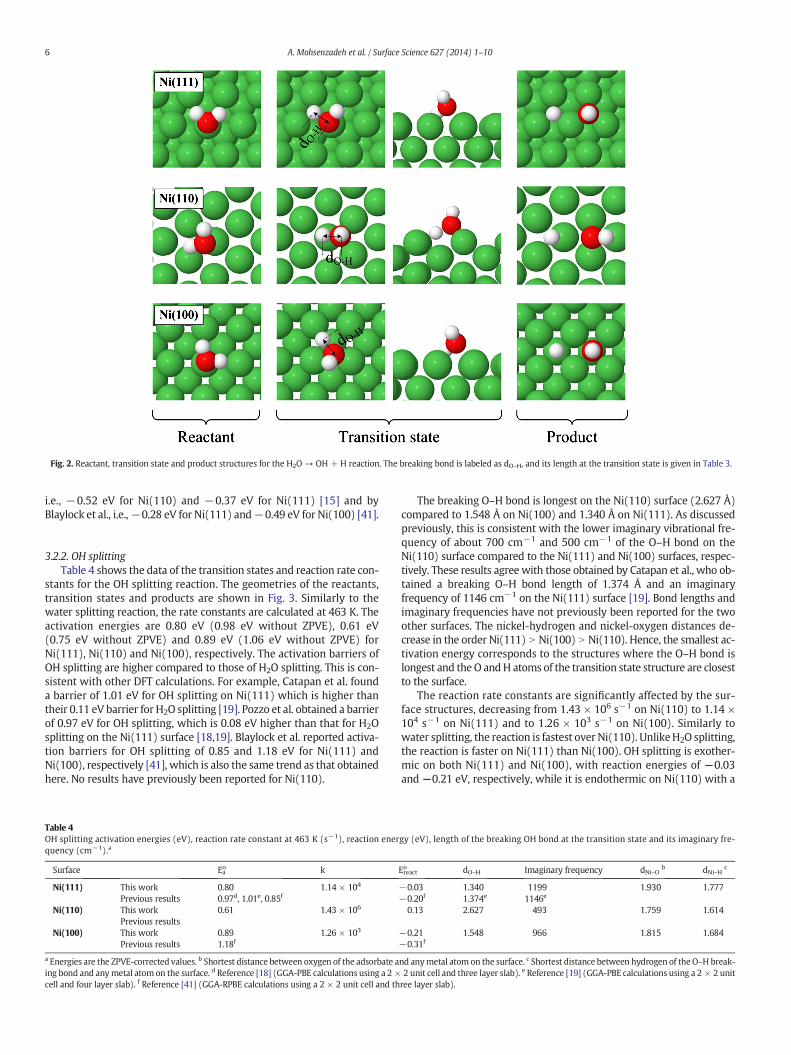
Fig. 2. Reactant, transition state and product structures for the H2O → OH+ H reaction. The breaking bond is labeled as dO–H, and its length at the transition state is given in Table 3.
6 A. Mohsenzadeh et al. / Surface Science 627 (2014) 1–10
i.e., −0.52 eV for Ni(110) and −0.37 eV for Ni(111) [15] and byBlaylock et al., i.e.,−0.28 eV for Ni(111) and−0.49 eV for Ni(100) [41].
3.2.2. OH splittingTable 4 shows the data of the transition states and reaction rate con-
stants for the OH splitting reaction. The geometries of the reactants,transition states and products are shown in Fig. 3. Similarly to thewater splitting reaction, the rate constants are calculated at 463 K. Theactivation energies are 0.80 eV (0.98 eV without ZPVE), 0.61 eV(0.75 eV without ZPVE) and 0.89 eV (1.06 eV without ZPVE) forNi(111), Ni(110) and Ni(100), respectively. The activation barriers ofOH splitting are higher compared to those of H2O splitting. This is con-sistent with other DFT calculations. For example, Catapan et al. founda barrier of 1.01 eV for OH splitting on Ni(111) which is higher thantheir 0.11 eV barrier for H2O splitting [19]. Pozzo et al. obtained a barrierof 0.97 eV for OH splitting, which is 0.08 eV higher than that for H2Osplitting on the Ni(111) surface [18,19]. Blaylock et al. reported activa-tion barriers for OH splitting of 0.85 and 1.18 eV for Ni(111) andNi(100), respectively [41], which is also the same trend as that obtainedhere. No results have previously been reported for Ni(110).
Table 4OH splitting activation energies (eV), reaction rate constant at 463 K (s−1), reaction enerquency (cm−1).a
Surface Eao k
Ni(111) This work 0.80 1.14 × 10⁴
Previous results 0.97d, 1.01e, 0.85f
Ni(110) This work 0.61 1.43 × 10⁶
Previous resultsNi(100) This work 0.89 1.26 × 10³
Previous results 1.18f
a Energies are the ZPVE-corrected values. b Shortest distance between oxygen of the adsorbate aing bond and anymetal atom on the surface. d Reference [18] (GGA-PBE calculations using a 2 ×cell and four layer slab). f Reference [41] (GGA-RPBE calculations using a 2 × 2 unit cell and th
The breaking O–H bond is longest on the Ni(110) surface (2.627 Å)compared to 1.548 Å on Ni(100) and 1.340 Å on Ni(111). As discussedpreviously, this is consistent with the lower imaginary vibrational fre-quency of about 700 cm−1 and 500 cm−1 of the O–H bond on theNi(110) surface compared to the Ni(111) and Ni(100) surfaces, respec-tively. These results agree with those obtained by Catapan et al., who ob-tained a breaking O–H bond length of 1.374 Å and an imaginaryfrequency of 1146 cm−1 on the Ni(111) surface [19]. Bond lengths andimaginary frequencies have not previously been reported for the twoother surfaces. The nickel-hydrogen and nickel-oxygen distances de-crease in the order Ni(111) N Ni(100) N Ni(110). Hence, the smallest ac-tivation energy corresponds to the structures where the O–H bond islongest and the O andH atoms of the transition state structure are closestto the surface.
The reaction rate constants are significantly affected by the sur-face structures, decreasing from 1.43 × 10⁶ s−1 on Ni(110) to 1.14 ×10⁴ s−1 on Ni(111) and to 1.26 × 10³ s−1 on Ni(100). Similarly towater splitting, the reaction is fastest over Ni(110). UnlikeH2O splitting,the reaction is faster on Ni(111) than Ni(100). OH splitting is exother-mic on both Ni(111) and Ni(100), with reaction energies of −0.03and −0.21 eV, respectively, while it is endothermic on Ni(110) with a
gy (eV), length of the breaking OH bond at the transition state and its imaginary fre-
Ereacto dO–H Imaginary frequency dNi–O b dNi–H c
−0.03 1.340 1199 1.930 1.777−0.20f 1.374e 1146e
0.13 2.627 493 1.759 1.614
−0.21 1.548 966 1.815 1.684−0.31f
nd anymetal atom on the surface. c Shortest distance between hydrogen of the O–H break-2 unit cell and three layer slab). e Reference [19] (GGA-PBE calculations using a 2 × 2 unitree layer slab).
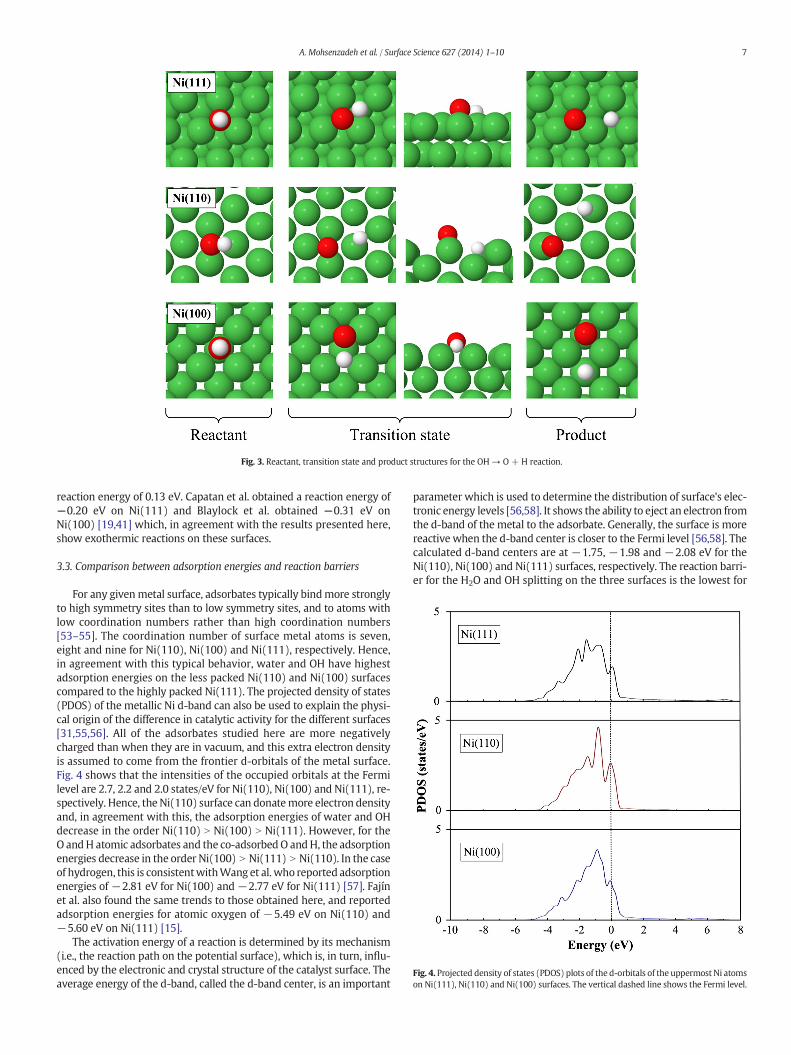
Fig. 3. Reactant, transition state and product structures for the OH→ O + H reaction.
Fig. 4. Projected density of states (PDOS) plots of the d-orbitals of the uppermost Ni atomson Ni(111), Ni(110) and Ni(100) surfaces. The vertical dashed line shows the Fermi level.
7A. Mohsenzadeh et al. / Surface Science 627 (2014) 1–10
reaction energy of 0.13 eV. Capatan et al. obtained a reaction energy of−0.20 eV on Ni(111) and Blaylock et al. obtained −0.31 eV onNi(100) [19,41] which, in agreement with the results presented here,show exothermic reactions on these surfaces.
3.3. Comparison between adsorption energies and reaction barriers
For any givenmetal surface, adsorbates typically bindmore stronglyto high symmetry sites than to low symmetry sites, and to atoms withlow coordination numbers rather than high coordination numbers[53–55]. The coordination number of surface metal atoms is seven,eight and nine for Ni(110), Ni(100) and Ni(111), respectively. Hence,in agreement with this typical behavior, water and OH have highestadsorption energies on the less packed Ni(110) and Ni(100) surfacescompared to the highly packed Ni(111). The projected density of states(PDOS) of the metallic Ni d-band can also be used to explain the physi-cal origin of the difference in catalytic activity for the different surfaces[31,55,56]. All of the adsorbates studied here are more negativelycharged than when they are in vacuum, and this extra electron densityis assumed to come from the frontier d-orbitals of the metal surface.Fig. 4 shows that the intensities of the occupied orbitals at the Fermilevel are 2.7, 2.2 and 2.0 states/eV for Ni(110), Ni(100) and Ni(111), re-spectively. Hence, the Ni(110) surface can donatemore electron densityand, in agreement with this, the adsorption energies of water and OHdecrease in the order Ni(110) N Ni(100) N Ni(111). However, for theO andH atomic adsorbates and the co-adsorbedO andH, the adsorptionenergies decrease in the order Ni(100) N Ni(111) N Ni(110). In the caseof hydrogen, this is consistentwithWang et al. who reported adsorptionenergies of −2.81 eV for Ni(100) and −2.77 eV for Ni(111) [57]. Fajínet al. also found the same trends to those obtained here, and reportedadsorption energies for atomic oxygen of −5.49 eV on Ni(110) and−5.60 eV on Ni(111) [15].
The activation energy of a reaction is determined by its mechanism(i.e., the reaction path on the potential surface), which is, in turn, influ-enced by the electronic and crystal structure of the catalyst surface. Theaverage energy of the d-band, called the d-band center, is an important
parameter which is used to determine the distribution of surface's elec-tronic energy levels [56,58]. It shows the ability to eject an electron fromthe d-band of the metal to the adsorbate. Generally, the surface is morereactive when the d-band center is closer to the Fermi level [56,58]. Thecalculated d-band centers are at −1.75, −1.98 and −2.08 eV for theNi(110), Ni(100) and Ni(111) surfaces, respectively. The reaction barri-er for the H2O and OH splitting on the three surfaces is the lowest for

Fig. 5. Reaction profiles for the water and OH splitting over Ni(111) (solid black line), Ni(110) (short-dashed red line) and Ni(100) (long-dashed blue line).
8 A. Mohsenzadeh et al. / Surface Science 627 (2014) 1–10
Ni(110), which has a d-band center that is closer to the Fermi level byabout 0.33 eV and 0.23 eV compared to the Ni(100) and Ni(111) sur-faces, respectively.
3.4. Reaction kinetics
The reaction profiles for the entire water dissociation process arecompared in Fig. 5. It is evident that the activation energy for H2O split-ting on Ni(110) is 0.07 and 0.31 eV lower than on the Ni(100) andNi(111) surfaces, respectively. This leads to a reaction rate constant at463 K that is 10 and 6 × 10³ times larger on the Ni(110) surface thanon the Ni(100) and Ni(111) surfaces, respectively. The same effect isseen for OH splitting where the reaction rate constant on the Ni(110)surface is 102 and 103 times larger than on the Ni(111) and Ni(100) sur-faces, respectively.
In fact, as shown in Fig. 6, the difference in reaction rate constants in-creases with increasing temperature. This shows that it becomes even
0.00E+00
5.00E+08
1.00E+09
1.50E+09
2.00E+09
2.50E+09
200 300 400 500 600 700
Temperature (K)
H2O splitting
Ni(111)
Ni(110)
Ni(100)
k(s-1
)
Fig. 6. Temperature dependence of the reaction rate constant for water and OH splitting ove
more important to consider the effect of surface configuration at elevat-ed temperatures.
Fig. 7 shows the time dependence of the relative concentrations ofreactant, intermediate and products for water dissociation. The tem-perature is 463 K and it is assumed that the initial concentration ofadsorbed water is 1 (arbitrary units of concentration). For the sakeof clarity it is also assumed that the reaction is much faster thanthe rate of adsorbing newwater molecules. Hence, the concentrationof adsorbed water decreases until it reaches zero. Including the ad-sorption and desorption rates of reactants, intermediates and prod-ucts, as well as the temperature dependence of these processes, isleft for future work.
It is evident that consumption of the reactant (H2O) is fastest onNi(110) and follows the order Ni(110) N Ni(100) N Ni(111). At thesame time more intermediate, OH, is produced on the Ni(110) surfaceand subsequent conversion to O and H products is also fastest on thissurface. Production of H and O is consequently faster on the Ni(110)
0.00E+00
5.00E+07
1.00E+08
1.50E+08
2.00E+08
2.50E+08
3.00E+08
200 300 400 500 600 700
k(s-1
)
Temperature (K)
OH splitting
Ni(111)
Ni(110)
Ni(100)
r Ni(111) (solid black line), Ni(110) (dashed red line) and Ni(100) (dashed blue line).
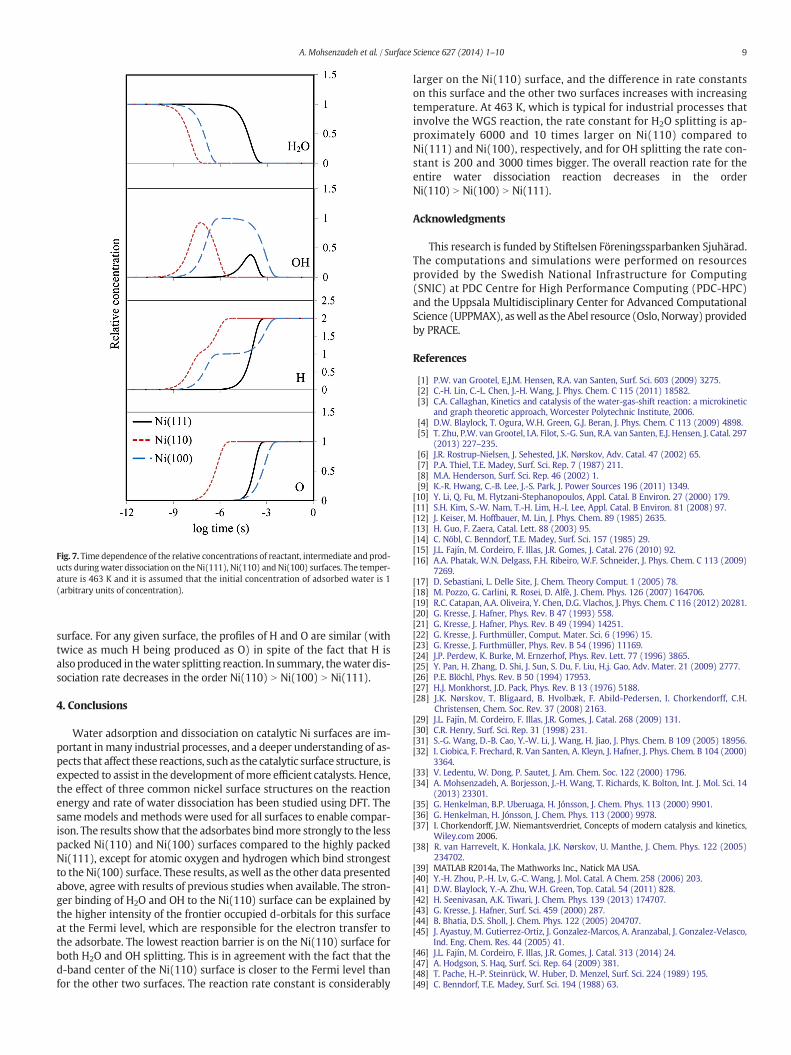
Fig. 7. Time dependence of the relative concentrations of reactant, intermediate and prod-ucts duringwater dissociation on the Ni(111), Ni(110) and Ni(100) surfaces. The temper-ature is 463 K and it is assumed that the initial concentration of adsorbed water is 1(arbitrary units of concentration).
9A. Mohsenzadeh et al. / Surface Science 627 (2014) 1–10
surface. For any given surface, the profiles of H and O are similar (withtwice as much H being produced as O) in spite of the fact that H isalsoproduced in thewater splitting reaction. In summary, thewater dis-sociation rate decreases in the order Ni(110) N Ni(100) N Ni(111).
4. Conclusions
Water adsorption and dissociation on catalytic Ni surfaces are im-portant inmany industrial processes, and a deeper understanding of as-pects that affect these reactions, such as the catalytic surface structure, isexpected to assist in the development of more efficient catalysts. Hence,the effect of three common nickel surface structures on the reactionenergy and rate of water dissociation has been studied using DFT. Thesamemodels andmethods were used for all surfaces to enable compar-ison. The results show that the adsorbates bindmore strongly to the lesspacked Ni(110) and Ni(100) surfaces compared to the highly packedNi(111), except for atomic oxygen and hydrogen which bind strongestto the Ni(100) surface. These results, aswell as the other data presentedabove, agree with results of previous studies when available. The stron-ger binding of H2O and OH to the Ni(110) surface can be explained bythe higher intensity of the frontier occupied d-orbitals for this surfaceat the Fermi level, which are responsible for the electron transfer tothe adsorbate. The lowest reaction barrier is on the Ni(110) surface forboth H2O and OH splitting. This is in agreement with the fact that thed-band center of the Ni(110) surface is closer to the Fermi level thanfor the other two surfaces. The reaction rate constant is considerably
larger on the Ni(110) surface, and the difference in rate constantson this surface and the other two surfaces increases with increasingtemperature. At 463 K, which is typical for industrial processes thatinvolve the WGS reaction, the rate constant for H2O splitting is ap-proximately 6000 and 10 times larger on Ni(110) compared toNi(111) and Ni(100), respectively, and for OH splitting the rate con-stant is 200 and 3000 times bigger. The overall reaction rate for theentire water dissociation reaction decreases in the orderNi(110) N Ni(100) N Ni(111).
Acknowledgments
This research is funded by Stiftelsen Föreningssparbanken Sjuhärad.The computations and simulations were performed on resourcesprovided by the Swedish National Infrastructure for Computing(SNIC) at PDC Centre for High Performance Computing (PDC-HPC)and the Uppsala Multidisciplinary Center for Advanced ComputationalScience (UPPMAX), aswell as the Abel resource (Oslo, Norway) providedby PRACE.
References
[1] P.W. van Grootel, E.J.M. Hensen, R.A. van Santen, Surf. Sci. 603 (2009) 3275.[2] C.-H. Lin, C.-L. Chen, J.-H. Wang, J. Phys. Chem. C 115 (2011) 18582.[3] C.A. Callaghan, Kinetics and catalysis of the water-gas-shift reaction: a microkinetic
and graph theoretic approach, Worcester Polytechnic Institute, 2006.[4] D.W. Blaylock, T. Ogura, W.H. Green, G.J. Beran, J. Phys. Chem. C 113 (2009) 4898.[5] T. Zhu, P.W. van Grootel, I.A. Filot, S.-G. Sun, R.A. van Santen, E.J. Hensen, J. Catal. 297
(2013) 227–235.[6] J.R. Rostrup-Nielsen, J. Sehested, J.K. Nørskov, Adv. Catal. 47 (2002) 65.[7] P.A. Thiel, T.E. Madey, Surf. Sci. Rep. 7 (1987) 211.[8] M.A. Henderson, Surf. Sci. Rep. 46 (2002) 1.[9] K.-R. Hwang, C.-B. Lee, J.-S. Park, J. Power Sources 196 (2011) 1349.
[10] Y. Li, Q. Fu, M. Flytzani-Stephanopoulos, Appl. Catal. B Environ. 27 (2000) 179.[11] S.H. Kim, S.-W. Nam, T.-H. Lim, H.-I. Lee, Appl. Catal. B Environ. 81 (2008) 97.[12] J. Keiser, M. Hoffbauer, M. Lin, J. Phys. Chem. 89 (1985) 2635.[13] H. Guo, F. Zaera, Catal. Lett. 88 (2003) 95.[14] C. Nöbl, C. Benndorf, T.E. Madey, Surf. Sci. 157 (1985) 29.[15] J.L. Fajín, M. Cordeiro, F. Illas, J.R. Gomes, J. Catal. 276 (2010) 92.[16] A.A. Phatak, W.N. Delgass, F.H. Ribeiro, W.F. Schneider, J. Phys. Chem. C 113 (2009)
7269.[17] D. Sebastiani, L. Delle Site, J. Chem. Theory Comput. 1 (2005) 78.[18] M. Pozzo, G. Carlini, R. Rosei, D. Alfè, J. Chem. Phys. 126 (2007) 164706.[19] R.C. Catapan, A.A. Oliveira, Y. Chen, D.G. Vlachos, J. Phys. Chem. C 116 (2012) 20281.[20] G. Kresse, J. Hafner, Phys. Rev. B 47 (1993) 558.[21] G. Kresse, J. Hafner, Phys. Rev. B 49 (1994) 14251.[22] G. Kresse, J. Furthmüller, Comput. Mater. Sci. 6 (1996) 15.[23] G. Kresse, J. Furthmüller, Phys. Rev. B 54 (1996) 11169.[24] J.P. Perdew, K. Burke, M. Ernzerhof, Phys. Rev. Lett. 77 (1996) 3865.[25] Y. Pan, H. Zhang, D. Shi, J. Sun, S. Du, F. Liu, H.j. Gao, Adv. Mater. 21 (2009) 2777.[26] P.E. Blöchl, Phys. Rev. B 50 (1994) 17953.[27] H.J. Monkhorst, J.D. Pack, Phys. Rev. B 13 (1976) 5188.[28] J.K. Nørskov, T. Bligaard, B. Hvolbæk, F. Abild-Pedersen, I. Chorkendorff, C.H.
Christensen, Chem. Soc. Rev. 37 (2008) 2163.[29] J.L. Fajín, M. Cordeiro, F. Illas, J.R. Gomes, J. Catal. 268 (2009) 131.[30] C.R. Henry, Surf. Sci. Rep. 31 (1998) 231.[31] S.-G. Wang, D.-B. Cao, Y.-W. Li, J. Wang, H. Jiao, J. Phys. Chem. B 109 (2005) 18956.[32] I. Ciobica, F. Frechard, R. Van Santen, A. Kleyn, J. Hafner, J. Phys. Chem. B 104 (2000)
3364.[33] V. Ledentu, W. Dong, P. Sautet, J. Am. Chem. Soc. 122 (2000) 1796.[34] A. Mohsenzadeh, A. Borjesson, J.-H. Wang, T. Richards, K. Bolton, Int. J. Mol. Sci. 14
(2013) 23301.[35] G. Henkelman, B.P. Uberuaga, H. Jónsson, J. Chem. Phys. 113 (2000) 9901.[36] G. Henkelman, H. Jónsson, J. Chem. Phys. 113 (2000) 9978.[37] I. Chorkendorff, J.W. Niemantsverdriet, Concepts of modern catalysis and kinetics,
Wiley.com 2006.[38] R. van Harrevelt, K. Honkala, J.K. Nørskov, U. Manthe, J. Chem. Phys. 122 (2005)
234702.[39] MATLAB R2014a, The Mathworks Inc., Natick MA USA.[40] Y.-H. Zhou, P.-H. Lv, G.-C. Wang, J. Mol. Catal. A Chem. 258 (2006) 203.[41] D.W. Blaylock, Y.-A. Zhu, W.H. Green, Top. Catal. 54 (2011) 828.[42] H. Seenivasan, A.K. Tiwari, J. Chem. Phys. 139 (2013) 174707.[43] G. Kresse, J. Hafner, Surf. Sci. 459 (2000) 287.[44] B. Bhatia, D.S. Sholl, J. Chem. Phys. 122 (2005) 204707.[45] J. Ayastuy, M. Gutierrez-Ortiz, J. Gonzalez-Marcos, A. Aranzabal, J. Gonzalez-Velasco,
Ind. Eng. Chem. Res. 44 (2005) 41.[46] J.L. Fajín, M. Cordeiro, F. Illas, J.R. Gomes, J. Catal. 313 (2014) 24.[47] A. Hodgson, S. Haq, Surf. Sci. Rep. 64 (2009) 381.[48] T. Pache, H.-P. Steinrück, W. Huber, D. Menzel, Surf. Sci. 224 (1989) 195.[49] C. Benndorf, T.E. Madey, Surf. Sci. 194 (1988) 63.

10 A. Mohsenzadeh et al. / Surface Science 627 (2014) 1–10
[50] P.J. Feibelman, Science 295 (2002) 99.[51] J. Ren, S. Meng, Phys. Rev. B 77 (2008) 054110.[52] M. Yang, S.S. Stipp, J. Harding, Cryst. Growth Des. 8 (2008) 4066.[53] F. Delbecq, P. Sautet, Langmuir 9 (1993) 197.[54] R. Smoluchowski, Phys. Rev. 60 (1941) 661.
[55] X.-Y. Pang, C. Wang, Y.-H. Zhou, J.-M. Zhao, G.-C. Wang, J. Mol. Struct. THEOCHEM948 (2010) 1.
[56] J. Li, E. Croiset, L. Ricardez-Sandoval, J. Mol. Catal. A Chem. 365 (2012) 103.[57] S.-G. Wang, D.-B. Cao, Y.-W. Li, J. Wang, H. Jiao, Surf. Sci. 600 (2006) 3226.[58] S.D. Miller, J.R. Kitchin, Surf. Sci. 603 (2009) 794.

Paper III


ORIGINAL PAPER
Oxidation and Dissociation of Formyl on Ni(111), Ni(110)and Ni(100) Surfaces: A Comparative Density Functional TheoryStudy
Abas Mohsenzadeh1 • Kim Bolton1 • Tobias Richards1
� Springer Science+Business Media New York 2015
Abstract Formyl (CHO) is an important adsorbate and a
key intermediate in industrial processes such as water gas
shift (WGS), Fischer–Tropsch synthesis (FTS) and cat-
alytic hydrocarbon combustion reactions. Density func-
tional theory (DFT) with the PBE functional was used to
calculate the adsorption, reaction and activation energies of
formyl oxidation and dissociation on Ni(111), Ni(110) and
Ni(100) surfaces. The results show that these energies are
sensitive to the surface structure. The dissociation barrier
for CHO ? CH ? O (FTS process) is higher than that for
CHO ? CO ? H (catalytic combustion) on all three sur-
faces. This means that the dissociation to CO and H is
kinetically favored. The dissociation reaction rate decrea-
ses in the order Ni(110)[Ni(111)[Ni(100) for both
dissociation reactions. The formation of formate
(CHO ? O ? HCOO), which is included in one of the
pathways for the WGS reaction, has lowest activation
energy on the Ni(111) surface, and the energy increases in
the order Ni(111)\Ni(110)\Ni(100). However, the
reaction rate at 463 K, which is a typical temperature for
industrial processes that involve these reactions, is at least
five orders of magnitude higher for the CHO ? CO ? H
reaction than for the other two reactions, irrespective of the
crystallographic structure of the Ni surface. This means
that Ni surfaces studied here are better catalysts for this
reaction. The results also show that the WGS reaction on a
Ni catalyst does not primarily occur via the formate
pathway.
Keywords Nickel � Formyl � Formate � Ni(111) �Ni(110) � Ni(100)
1 Introduction
A fundamental understanding of heterogeneous catalytic
reactions at the microscopic level is of great importance in
surface chemistry. A complete mechanistic study of the
surface reactions includes the study of the elementary
processes and identification of the intermediates. This is
one of the reasons that adsorption of small molecules and
radicals on metal surfaces has been investigated intensively
using both experimental techniques and theoretical studies
over the past few decades [1–9].
Oxymethylidyne (CHO) species, often referred to as
formyl, is a key intermediate in many industrial processes
such as water gas shift (WGS), Fischer–Tropsch synthesis
(FTS) and hydrocarbon combustion reactions. The Fis-
cher–Tropsch process is an important industrial process in
which large hydrocarbons are manufactured from synthesis
gas (CO/H2 2:1) [10]. Recent publications indicate that
formyl is an important intermediate in hydrocarbon syn-
thesis that utilizes the Fischer–Tropsch process [11, 12].
The reaction via CHO is the main reaction pathway and
cleavage of the C–O bond (CHO ? CH ? O) is an
important step in the reaction [11, 12].
Recent studies also suggest that catalytic oxidation of
hydrocarbons is most likely due to the direct reaction of
CH fragments with surface adsorbed oxygen. The CHO
species that forms from this reaction subsequently
& Abas Mohsenzadeh
Kim Bolton
Tobias Richards
1 Swedish Center for Resource Recovery, University of Boras,
501-90 Boras, Sweden
123
Top Catal
DOI 10.1007/s11244-015-0482-x

dissociates to yield adsorbed hydrogen and CO
(CHO ? CO ? H) [13–15].
Goodman et al. [16] studied the kinetics of CO hydro-
genation on Ni(100) using Auger Electron Spectroscopy
(AES). They found that a mechanism involving hydro-
genation of an active carbon species is consistent with their
kinetic data, and that the turnover number for methane
formation is almost the same on the Ni(111) and Ni(100)
surfaces. Low energy electron diffraction (LEED) was used
by Hirano and Tanaka [6, 7] to investigate the methanation
reaction of CO on the Ni(100) and Ni(111) surfaces, with
the aim to study why the catalytic activity of these surfaces
does not appear to be sensitive to the surface structure.
Their results indicate that the accumulation of overlayers of
carbidic intermediates could be the reason, and they con-
cluded that the methanation reaction on Ni(111), Ni(110)
and Ni(100) surfaces involves the same chemical species
that produces the carbide overlayers.
Inderwildi et al. [17] used DFT with the PW91 func-
tional to study hydrocarbon combustion and synthesis on
noble metals. They showed that formyl is an essential
intermediate species in both hydrocarbon combustion and
synthesis and, although different metals are used for dif-
ferent processes, the formation and combustion of hydro-
carbons have very similar mechanisms (but in opposite
directions). Using DFT with the PW91 functional, Zhu
et al. [18] studied the mechanism of methane reforming on
the Ni(111) surface, which includes CHO formation and
decomposition. They predicted that the oxidation step
determines the overall reaction rate for both the CH and C
oxidation pathways. The decomposition of methanol on the
Ni(100) and Ni(111) surfaces was studied by Zhou et al.
[19] using DFT based on the PBE functional. They sug-
gested that the methanol decomposition reaction mecha-
nism may be sensitive to the surface structure, since the
lowest energy reaction paths on the Ni(100) surface
involves breaking both the C–H and O–H bonds, while for
the Ni(111) surface only the O–H bond is broken on the
lowest energy reaction path. CHO formation and decom-
position were also investigated in their study. Pang et al.
[20] used DFT with periodic boundary conditions and the
PBE functional to investigate chemisorption of radical
species, including CH3, CH3O and HCOO, on Ni(111),
Ni(100), and Ni(110) surfaces. They found that the
adsorption energies are sensitive to the surface structure
and increase in the order Ni(111)\Ni(100)\Ni(110).
As mentioned above, formyl also plays a key role in the
WGS reaction (CO ? H2O ? CO2 ? H2). The WGS
reaction is widely used in industrial processes such as
methanol synthesis. It is also one of the most important
reactions in gasification, where carbonaceous materials are
converted to a gaseous product that can be used to produce
energy or other desirable chemicals [21–25]. The WGS
reaction primarily occurs via the redox, formate, associa-
tive and carbonate mechanisms [26]. The formate (HCOO)
species is central in the formate mechanism, where oxi-
dation of CHO is one of the possible routes of HCOO
formation (CHO ? O ? HCOO). Formate is the inter-
mediate that has the highest concentration in the WGS
reaction [27–29]. Some experimental [9, 30, 31] and
computational [2, 32, 33] studies revealed that the formate
might block active sites on the catalyst surface, hence
lowering the catalyst activity. The studies also show that
formate is a rather stable intermediate due to its high for-
mation and decomposition barriers.
Lin et al. [2] used DFT with periodic boundary condi-
tions and the PW91 functional to study the role of formyl in
Fischer–Tropsch synthesis, combustion reactions, and the
formate pathway in the WGS reaction on a series of tran-
sitions metal surfaces, including the Ni(111) surface. They
found that the stability of formate can be attributed to its
lower formation and higher dissociation barriers in the
WGS pathway. The WGS reaction and coke formation
pathways on the Ni(111) and Ni(211) surfaces were studied
by Catapan et al. using DFT [34] based on the PBE func-
tional. Their results suggest that, for the WGS reaction, the
carboxyl pathway is preferred on the flat Ni(111) surface,
while a parallel route via formate and formyl intermediates
is favored on the stepped Ni(211) surface.
In this contribution we develop a consistent picture that
describes the adsorption, oxidation and dissociation of
formyl on the Ni(111), Ni(110) and Ni(100) surfaces using
DFT calculations. This is the first time that the same
models and methods are used to investigate if the reactant,
transition state or product relative energies or vibrational
frequencies of formyl oxidation and dissociation are
affected by the crystallographic structure of the nickel
catalyst. If this is the case, then the formyl adsorption
strength, dissociation and oxidation rates will depend on
the type of nickel surface used as the catalyst.
2 Methods and Models
The calculations were performed using the Vienna ab initio
simulation package (VASP) [35–38] implementing spin
polarized DFT. The exchange–correlation was treated by
the generalized gradient approximation with the Perdew,
Burke and Ernzerh (GGA-PBE) functional [39]. The PBE
functional was selected since it allows for comparison with
previously published data for similar systems [19, 20, 34,
40]. It may be noted that this functional does not include
dispersion interactions, which leads to an underestimation
of the binding energy. However, it has been seen that this
functional provides an accurate description of the whole
series of bulk transition metals [41]. Also, since the binding
Top Catal
123
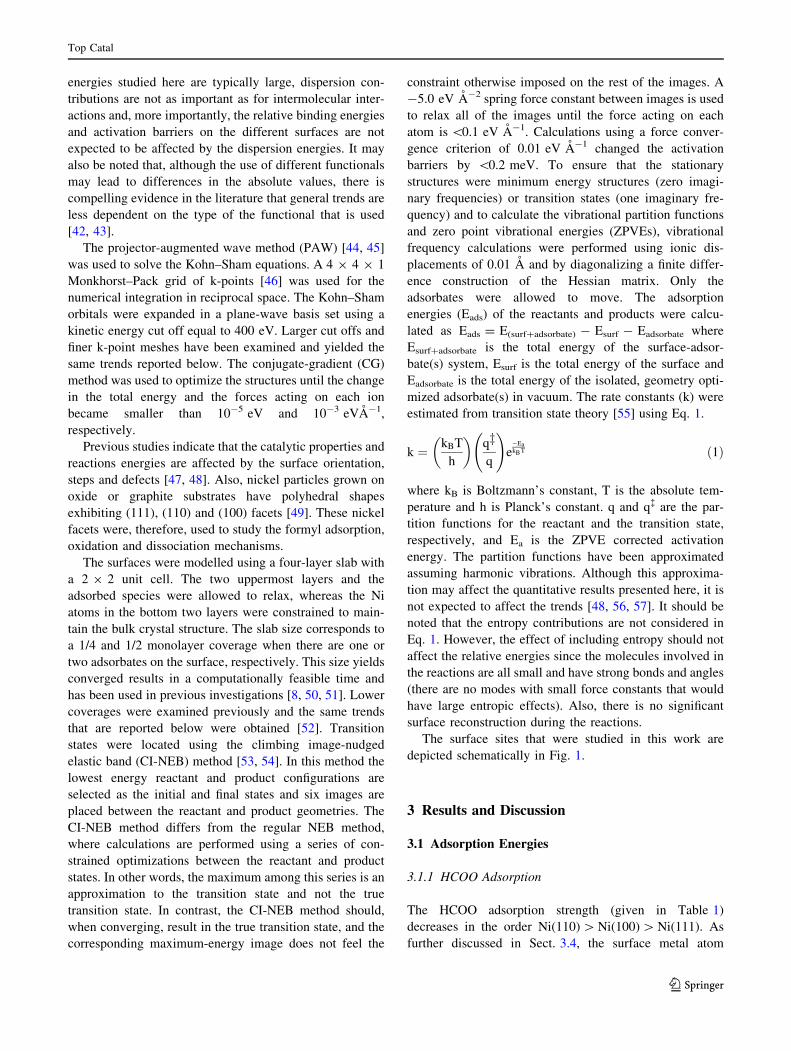
energies studied here are typically large, dispersion con-
tributions are not as important as for intermolecular inter-
actions and, more importantly, the relative binding energies
and activation barriers on the different surfaces are not
expected to be affected by the dispersion energies. It may
also be noted that, although the use of different functionals
may lead to differences in the absolute values, there is
compelling evidence in the literature that general trends are
less dependent on the type of the functional that is used
[42, 43].
The projector-augmented wave method (PAW) [44, 45]
was used to solve the Kohn–Sham equations. A 4 9 4 9 1
Monkhorst–Pack grid of k-points [46] was used for the
numerical integration in reciprocal space. The Kohn–Sham
orbitals were expanded in a plane-wave basis set using a
kinetic energy cut off equal to 400 eV. Larger cut offs and
finer k-point meshes have been examined and yielded the
same trends reported below. The conjugate-gradient (CG)
method was used to optimize the structures until the change
in the total energy and the forces acting on each ion
became smaller than 10-5 eV and 10-3 eVA-1,
respectively.
Previous studies indicate that the catalytic properties and
reactions energies are affected by the surface orientation,
steps and defects [47, 48]. Also, nickel particles grown on
oxide or graphite substrates have polyhedral shapes
exhibiting (111), (110) and (100) facets [49]. These nickel
facets were, therefore, used to study the formyl adsorption,
oxidation and dissociation mechanisms.
The surfaces were modelled using a four-layer slab with
a 2 9 2 unit cell. The two uppermost layers and the
adsorbed species were allowed to relax, whereas the Ni
atoms in the bottom two layers were constrained to main-
tain the bulk crystal structure. The slab size corresponds to
a 1/4 and 1/2 monolayer coverage when there are one or
two adsorbates on the surface, respectively. This size yields
converged results in a computationally feasible time and
has been used in previous investigations [8, 50, 51]. Lower
coverages were examined previously and the same trends
that are reported below were obtained [52]. Transition
states were located using the climbing image-nudged
elastic band (CI-NEB) method [53, 54]. In this method the
lowest energy reactant and product configurations are
selected as the initial and final states and six images are
placed between the reactant and product geometries. The
CI-NEB method differs from the regular NEB method,
where calculations are performed using a series of con-
strained optimizations between the reactant and product
states. In other words, the maximum among this series is an
approximation to the transition state and not the true
transition state. In contrast, the CI-NEB method should,
when converging, result in the true transition state, and the
corresponding maximum-energy image does not feel the
constraint otherwise imposed on the rest of the images. A
-5.0 eV A-2 spring force constant between images is used
to relax all of the images until the force acting on each
atom is \0.1 eV A-1. Calculations using a force conver-
gence criterion of 0.01 eV A-1 changed the activation
barriers by \0.2 meV. To ensure that the stationary
structures were minimum energy structures (zero imagi-
nary frequencies) or transition states (one imaginary fre-
quency) and to calculate the vibrational partition functions
and zero point vibrational energies (ZPVEs), vibrational
frequency calculations were performed using ionic dis-
placements of 0.01 A and by diagonalizing a finite differ-
ence construction of the Hessian matrix. Only the
adsorbates were allowed to move. The adsorption
energies (Eads) of the reactants and products were calcu-
lated as Eads = E(surf?adsorbate) - Esurf - Eadsorbate where
Esurf?adsorbate is the total energy of the surface-adsor-
bate(s) system, Esurf is the total energy of the surface and
Eadsorbate is the total energy of the isolated, geometry opti-
mized adsorbate(s) in vacuum. The rate constants (k) were
estimated from transition state theory [55] using Eq. 1.
k ¼ kBT
h
� �qzq
!e�EakBT ð1Þ
where kB is Boltzmann’s constant, T is the absolute tem-
perature and h is Planck’s constant. q and q� are the par-
tition functions for the reactant and the transition state,
respectively, and Ea is the ZPVE corrected activation
energy. The partition functions have been approximated
assuming harmonic vibrations. Although this approxima-
tion may affect the quantitative results presented here, it is
not expected to affect the trends [48, 56, 57]. It should be
noted that the entropy contributions are not considered in
Eq. 1. However, the effect of including entropy should not
affect the relative energies since the molecules involved in
the reactions are all small and have strong bonds and angles
(there are no modes with small force constants that would
have large entropic effects). Also, there is no significant
surface reconstruction during the reactions.
The surface sites that were studied in this work are
depicted schematically in Fig. 1.
3 Results and Discussion
3.1 Adsorption Energies
3.1.1 HCOO Adsorption
The HCOO adsorption strength (given in Table 1)
decreases in the order Ni(110)[Ni(100)[Ni(111). As
further discussed in Sect. 3.4, the surface metal atom
Top Catal
123

coordination numbers are 9, 8 and 7 for the Ni(111),
Ni(100) and Ni(110) surfaces, respectively. The trends of
adsorption energies obtained are expected since adsorbates
typically bind more strongly to surfaces with low coordi-
nation numbers [20, 58, 59]. The formate is adsorbed via its
two oxygen atoms on all three surfaces. Experimental
studies support these results since the bidentately adsorbed
formate is the species that is observed in high concentra-
tions [2]. On the Ni(111) and Ni(110) surfaces the oxygen
atoms are over the top site (A site in Fig. 1). On the
Ni(100) surface, however, one oxygen is over a top site, A,
and the other one is over a bridge site, B. As shown in
Table 1, the oxygen atoms are closest to the surface on
Ni(110), which is expected since this surface also has the
strongest adsorption. Both C–O bonds have similar lengths
on the Ni(110) and Ni(111) surfaces, but they are different
on the Ni(100) surface where the distance between the
carbon and oxygen atom on the bridge site is about 0.35 A
longer than the other C–O bond. Similar to the bond
lengths, both O–C–H angles are the same on the Ni(111)
and Ni(110) surfaces, but on the Ni(100) surface one angle
is about 2.2� larger than the other. Similar C–O bond
lengths and O–C–H angles on the Ni(111) and Ni(110)
surfaces are expected since both oxygen atoms adsorbs on
top, A, sites. In contrast, these atoms adsorb on different
sites (one on the A site and the other one on B site) on the
Ni(100) surface.
The calculated energies of adsorption are comparable
with most of the previous results (references given in the
Table 1). Pang et al. [20] (using GGA-PBE on a three
layered 2 9 2 unit cell) reported an adsorption energy of
-0.86, -1.60 and -1.07 eV for the Ni(111), Ni(110) and
Ni(100) surfaces, respectively. The discrepancy between
those results and the data presented here is due to the
different methods used for calculating the adsorption
energies. They defined the binding energy of formate with
respect to the gas phase CO2 and � H2. Using the same
method we obtain adsorption energies of -0.46, -1.06 and
-0.65 eV for the Ni(111), Ni(110) and Ni(100) surfaces,
respectively. In this work, the energies calculated for iso-
lated H2 and CO2 are -6.49 and -22.67 eV, respectively.
The trends observed for adsorption, oxidation and disso-
ciation of all of the species studied here, including HCOO,
are discussed further in Sect. 3.4.
The experimentally observed vibrational frequencies for
HCOO on Ni(110) reported by Madix et al. [60] are in
good agreement with the calculated vibrational frequen-
cies. They observed bidentately adsorbed HCOO and
reported 2950 cm-1 as the C–H bond stretching frequency
(compared to 2961 cm-1 calculated here), 1670 cm-1 as
Fig. 1 Different adsorption
sites on the Ni(111), Ni(110)
and Ni(100) surfaces. A is a top
site; B is a bridge site; C is an
hcp site; C0 is a fcc site; D is a
rectangular fourfold hollow site;
D0 is a square fourfold hollow
site; E is a long bridge site; F is
a short bridge site; G is a pseudo
threefold hollow site
Table 1 Adsorption energies
(eV), structural parameters (A
and �) for adsorbed HCOO
Surface Site Eads dsurf–Oa,b dC–O
b hO–C–Hb Previous results for Eads
Ni(111) O1: A
O2: A
-2.69 1.961
1.963(B)
1.272
1.271(B)
O1–C–H: 116.4
O2–C–H: 116.4(B)
-3.14c, -0.86e, -3.02e
Ni(110) O1: A
O2: A
-3.29 1.921
1.921(B)
1.272
1.272(B)
O1–C–H: 115.1
O2–C–H: 115.1(B)
-1.60d
Ni(100) O1: B
O2: A
-2.88 2.028
1.963(B)
1.294
1.259(B)
O1–C–H: 115.8
O2–C–H: 118.0(B)
-1.07d
The adsorption energies are ZPVE-corrected valuesa Shortest distance between the oxygen atom of the adsorbate and any metal atom on the surfaceb (B) refers to the bond which is broken during the reactionc Ref. [2] (GGA-PW91 calculations using a 4 9 4 unit cell and five layer slab)d Ref. [20] (GGA-PBE calculations using a 3 9 2 unit cell and three layer slab)e Ref. [34] (GGA-PBE calculations using a 2 9 2 unit cell and four layer slab)
Top Catal
123

the frequency of the asymmetric vibration of the
O–C–O bond (compared to 1504 cm-1 calculated here),
1370 cm-1 for the O–C–O symmetric vibration (compared
to 1296 cm-1 calculated here), and 780 cm-1 as the fre-
quency for the O–C–O angle (compared to 710 cm-1 cal-
culated here).
3.1.2 CHO Adsorption
As shown in Table 2, the strongest adsorption for CHO is
obtained for the Ni(100) surface. It is -2.76 eV compared
to -2.42 eV for the Ni(110) surface and -2.19 eV for the
Ni(111) surface. This is in contrast to the trend that
molecules bind most strongly to surface with the lowest
coordination number which, as described above, is the
Ni(110) surface. This could be due to the orientation of the
CHO molecule on the Ni(100) surface, since the C–O bond
is almost parallel to the surface, while the carbon atom
points towards the surface on the other two surfaces. The
calculated adsorption energies are in agreement with pre-
vious experimental and theoretical results (references given
in the Table 2). For example Zhou et al. [19] (using GGA-
PBE on a three layered 3 9 2 unit cell) reported a higher
bonding energy for the Ni(100) surface compared to the
Ni(111) surface, i.e., -3.15 and -2.41 eV, respectively.
Blaylock et al. [61] reported experimental adsorption heats
of -1.99 and -2.51 eV on the Ni(111) and Ni(100) sur-
faces, which are comparable to the values reported in this
work and also follow the same trends.
The surface-carbon distance is shortest on the Ni(110)
surface. The surface-oxygen distance is the same for the
Ni(111) and Ni(110) surfaces, and is a bit larger than for
the Ni(100) surface.
The C–H bond length on the Ni(110) surface is larger by
about 0.06 and 0.05 A compared to the Ni(111) and
Ni(100) surfaces, respectively. The longest C–O bond was
obtained on the Ni(100) surface, where it is about 0.096 A
longer than on the Ni(110) surface and about 0.064 A
longer than that on the Ni(111) surface. The angle between
the C, O and H is almost the same for the Ni(111) and
Ni(110) surfaces, and about 5� larger compared to CHO on
the Ni(100) surface.
3.2 Co-adsorption Energies
When calculating the co-adsorption energies, all possible
adsorption sites (as shown in Fig. 1) were examined for the
isolated molecules involved in oxidation and dissociation
of formyl. These are the CHO, CO, CH, H and O species.
The initial structures for the geometry optimizations of co-
adsorbed species were obtained by placing the adsorbates
in their minimum energy sites (for the isolated adsorbates).
The geometry optimized structures that had the lowest
energies were selected for further investigations of the
reaction mechanisms.
The reaction between co-adsorbed oxygen and formyl
that are initially near to each other on the Ni surface yields
formate. The co-adsorption sites obtained from the geom-
etry optimizations, the adsorption energies and the
molecular structures are given in Table 3. In all cases the
co-adsorption sites are the same as those found for the
isolated adsorbates, except for oxygen on the Ni(110)
surface. The strongest adsorption energy for oxygen on the
Ni(110) surface was obtained at the long bridge site E,
whereas the co-adsorbed CHO shifts the oxygen from the E
to the G site. This is probably due to repulsion between the
O atom and the oxygen of the formyl molecule. The co-
adsorption energies of CHO and O are -6.90 eV on the
Ni(111) surface, -7.63 eV on the Ni(110) surface and
-7.84 eV on the Ni(100) surface. This is the same order
Table 2 Adsorption energies (eV), structural parameters (A and �) for adsorbed CHO
Surface Site Eads dsurf–Ca dsurf–O
a dC–H dC–O hO–C–H ab Previous results for Eads
Ni(111) C: B
O: A
-2.19 1.960 1.969 1.110 1.289 117.0 16.1 -2.63c, -2.41d, -2.49e, -2.26f
Ni(110) C: F
O: A
-2.42 1.807 1.969 1.116 1.257 117.9 10.7
Ni(100) C: B
O: B
-2.76 1.916 1.960 1.111 1.353 112.5 5.6 – 3.15f
The adsorption energies are ZPVE-corrected valuesa Shortest distance between the oxygen and carbon atoms of the adsorbate and any metal atom on the surfaceb The angle between the C–O bond and the surface planec Ref. [2] (GGA-PW91 calculations using a 4 9 4 unit cell and five layer slab)d Ref. [19] (GGA-PBE calculations using a 3 9 2 unit cell and three layer slab)e Ref. [34] (GGA-PBE calculations using a 2 9 2 unit cell and four layer slab)f Ref. [18] (GGA-PW91 calculations using a 3 9 3 unit cell and four layer slab)
Top Catal
123

that was seen for CHO adsorption in the absence of oxy-
gen. Both formyl and oxygen are closest to the surface on
the Ni(110) surface. The distance between the formyl and
surface is not changed significantly due to the presence of
the O atom. Due to the presence of the co-adsorbed oxygen
atom, the C–O bond lengths are shorter compared to iso-
lated formyl adsorbed on the surface and the formyl O–C–
H angle is increased. No previous results for the co-ad-
sorption of CHO and O have been found.
The formyl dissociation in FTS yields CH and O [17].
The co-adsorption energies for CHO dissociation products
are -10.81, -11.89 and -12.28 eV on the Ni(111),
Ni(110) and Ni(100) surfaces, respectively (given in
Table 4). The co-adsorption sites are the same as those
found for the isolated adsorbates, except for the oxygen on
the Ni(110) surface which is shifted from the E site to the G
site. This is probably due to interaction with co-adsorbed
CH as this was also observed for co-adsorbed CHO and O.
The shortest surface-adsorbate distance was obtained on
the Ni(111) surface for both CH and O. The C–H bond is
almost the same on the Ni(100) and Ni(110) surfaces and is
a bit longer than that on the Ni(111) surface. The co-ad-
sorption energy on the Ni(111) surface is comparable to
that reported by Wang et al. [40] (using GGA-PBE on a
three layered 2 9 2 unit cell), i.e., -10.61 eV. No data was
found for the other surfaces.
The CHO dissociation in hydrocarbon combustion
yields CO and H [17]. The co-adsorption energies (given in
Table 5) of CO and H are -4.54, -4.51 and -4.61 eV on
the Ni(111), Ni(110) and Ni(100) surfaces, respectively. In
all cases the co-adsorption sites are the same as those found
for the isolated adsorbates. Both CO and H are closest to
the Ni(110) compared to the other surfaces. The shortest
C–O bond is also found for the Ni(110) surface. The co-
adsorption energy on the Ni(111) surface is comparable to
what is obtained by Wang et al. [40] (using GGA-PBE on a
three layered 2 9 2 unit cell), i.e., -4.58 eV. No data was
found for the other surfaces.
3.3 Transition States and Reaction Energies
3.3.1 HCOO Formation
The transition states and reaction rate constants for formate
formation are presented in Table 6. The rate constants are
calculated at 463 K, which is typical for low-temperature
WGS processes [62]. The activation barriers are 0.67 eV,
0.99 eV and 1.47 eV for the Ni(111), Ni(110) and Ni(100)
Table 3 Co-adsorption
energies (eV) and structural
parameters (A and �) for CHO
and O
Surface Site Eads dsurf–Ca dsurf–O
a dC–O,CHO hO–C–H,CHO
Ni(111) C: B
OCHO: A
O: C0
-6.90 1.974 1.745 (atomic O)
2.001 (OCHO)
1.260 119.8
Ni(110) C: F
OCHO: A
O: G
-7.63 1.809 1.818 (atomic O)
1.977 (OCHO)
1.252 118.9
Ni(100) C: B
OCHO:B
O: D0
-7.84 1.921 1.944 (atomic O)
2.058 (OCHO)
1.115 115.3
The adsorption energies are ZPVE-corrected valuesa Shortest distance between any metal atom on the surface and the carbon/oxygen atom of the CHO and the
co-adsorbed oxygen atom
Table 4 Co-adsorption
energies (eV) and structural
parameters (A and �) for CH and
O
Surface Site Eads dsurf–Ca dsurf–O
a dC–H Previous results for Eads
Ni(111) C: C0
O: C0-10.81 1.785 1.810 1.100 – 10.61b
Ni(110) C: D
O: G
-11.89 1.928 1.821 1.113
Ni(100) C: D0
O: D0-12.28 1.899 1.922 1.115
The adsorption energies are ZPVE-corrected valuesa Shortest distance between any metal atom on the surface and the carbon atom of the CH and the oxygen
atomb Ref. [40] (GGA-PBE calculations using a 2 9 2 unit cell and three layer slab)
Top Catal
123
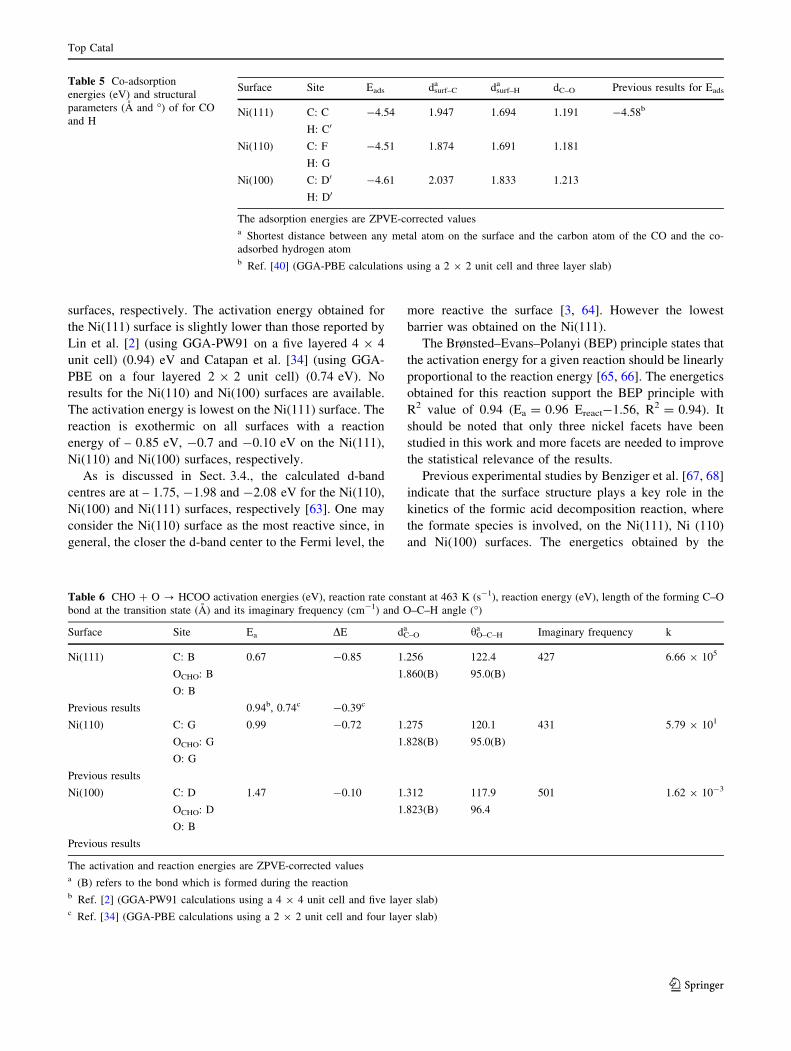
surfaces, respectively. The activation energy obtained for
the Ni(111) surface is slightly lower than those reported by
Lin et al. [2] (using GGA-PW91 on a five layered 4 9 4
unit cell) (0.94) eV and Catapan et al. [34] (using GGA-
PBE on a four layered 2 9 2 unit cell) (0.74 eV). No
results for the Ni(110) and Ni(100) surfaces are available.
The activation energy is lowest on the Ni(111) surface. The
reaction is exothermic on all surfaces with a reaction
energy of – 0.85 eV, -0.7 and -0.10 eV on the Ni(111),
Ni(110) and Ni(100) surfaces, respectively.
As is discussed in Sect. 3.4., the calculated d-band
centres are at – 1.75, -1.98 and -2.08 eV for the Ni(110),
Ni(100) and Ni(111) surfaces, respectively [63]. One may
consider the Ni(110) surface as the most reactive since, in
general, the closer the d-band center to the Fermi level, the
more reactive the surface [3, 64]. However the lowest
barrier was obtained on the Ni(111).
The Brønsted–Evans–Polanyi (BEP) principle states that
the activation energy for a given reaction should be linearly
proportional to the reaction energy [65, 66]. The energetics
obtained for this reaction support the BEP principle with
R2 value of 0.94 (Ea = 0.96 Ereact-1.56, R2 = 0.94). It
should be noted that only three nickel facets have been
studied in this work and more facets are needed to improve
the statistical relevance of the results.
Previous experimental studies by Benziger et al. [67, 68]
indicate that the surface structure plays a key role in the
kinetics of the formic acid decomposition reaction, where
the formate species is involved, on the Ni(111), Ni (110)
and Ni(100) surfaces. The energetics obtained by the
Table 5 Co-adsorption
energies (eV) and structural
parameters (A and �) of for CO
and H
Surface Site Eads dsurf–Ca dsurf–H
a dC–O Previous results for Eads
Ni(111) C: C
H: C0-4.54 1.947 1.694 1.191 -4.58b
Ni(110) C: F
H: G
-4.51 1.874 1.691 1.181
Ni(100) C: D0
H: D0-4.61 2.037 1.833 1.213
The adsorption energies are ZPVE-corrected valuesa Shortest distance between any metal atom on the surface and the carbon atom of the CO and the co-
adsorbed hydrogen atomb Ref. [40] (GGA-PBE calculations using a 2 9 2 unit cell and three layer slab)
Table 6 CHO ? O ? HCOO activation energies (eV), reaction rate constant at 463 K (s-1), reaction energy (eV), length of the forming C–O
bond at the transition state (A) and its imaginary frequency (cm-1) and O–C–H angle (�)
Surface Site Ea DE dC–Oa hO–C–H
a Imaginary frequency k
Ni(111) C: B
OCHO: B
O: B
0.67 -0.85 1.256
1.860(B)
122.4
95.0(B)
427 6.66 9 105
Previous results 0.94b, 0.74c -0.39c
Ni(110) C: G
OCHO: G
O: G
0.99 -0.72 1.275
1.828(B)
120.1
95.0(B)
431 5.79 9 101
Previous results
Ni(100) C: D
OCHO: D
O: B
1.47 -0.10 1.312
1.823(B)
117.9
96.4
501 1.62 9 10-3
Previous results
The activation and reaction energies are ZPVE-corrected valuesa (B) refers to the bond which is formed during the reactionb Ref. [2] (GGA-PW91 calculations using a 4 9 4 unit cell and five layer slab)c Ref. [34] (GGA-PBE calculations using a 2 9 2 unit cell and four layer slab)
Top Catal
123
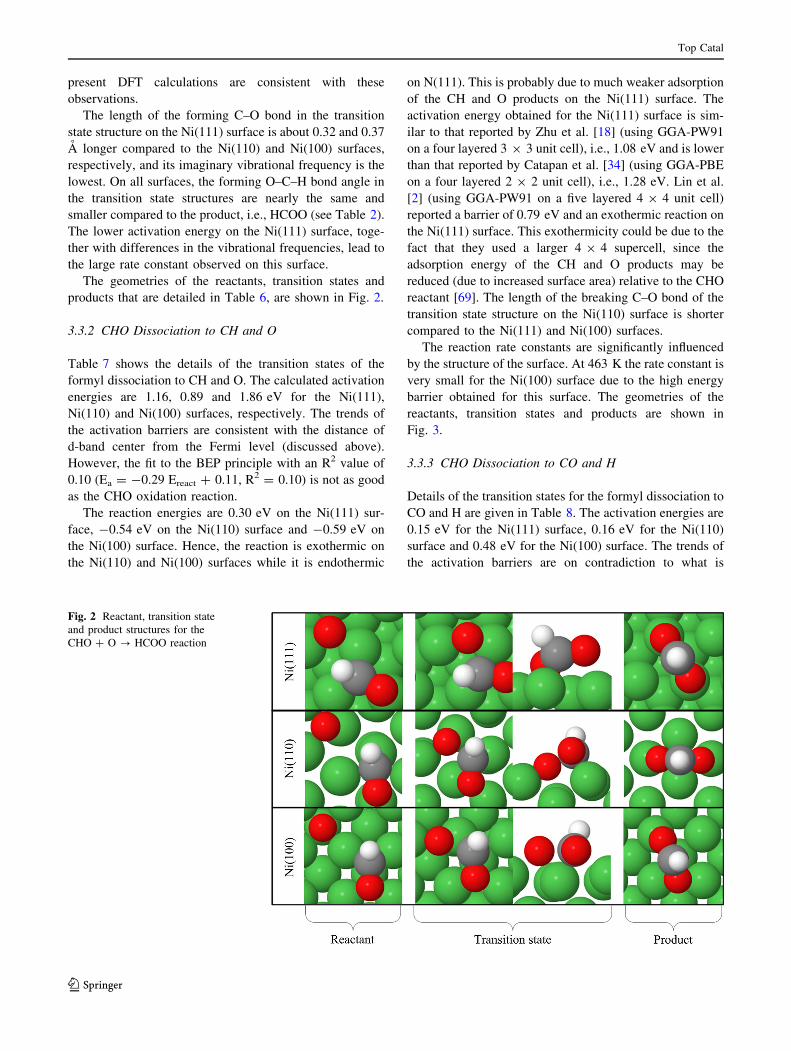
present DFT calculations are consistent with these
observations.
The length of the forming C–O bond in the transition
state structure on the Ni(111) surface is about 0.32 and 0.37
A longer compared to the Ni(110) and Ni(100) surfaces,
respectively, and its imaginary vibrational frequency is the
lowest. On all surfaces, the forming O–C–H bond angle in
the transition state structures are nearly the same and
smaller compared to the product, i.e., HCOO (see Table 2).
The lower activation energy on the Ni(111) surface, toge-
ther with differences in the vibrational frequencies, lead to
the large rate constant observed on this surface.
The geometries of the reactants, transition states and
products that are detailed in Table 6, are shown in Fig. 2.
3.3.2 CHO Dissociation to CH and O
Table 7 shows the details of the transition states of the
formyl dissociation to CH and O. The calculated activation
energies are 1.16, 0.89 and 1.86 eV for the Ni(111),
Ni(110) and Ni(100) surfaces, respectively. The trends of
the activation barriers are consistent with the distance of
d-band center from the Fermi level (discussed above).
However, the fit to the BEP principle with an R2 value of
0.10 (Ea = -0.29 Ereact ? 0.11, R2 = 0.10) is not as good
as the CHO oxidation reaction.
The reaction energies are 0.30 eV on the Ni(111) sur-
face, -0.54 eV on the Ni(110) surface and -0.59 eV on
the Ni(100) surface. Hence, the reaction is exothermic on
the Ni(110) and Ni(100) surfaces while it is endothermic
on N(111). This is probably due to much weaker adsorption
of the CH and O products on the Ni(111) surface. The
activation energy obtained for the Ni(111) surface is sim-
ilar to that reported by Zhu et al. [18] (using GGA-PW91
on a four layered 3 9 3 unit cell), i.e., 1.08 eV and is lower
than that reported by Catapan et al. [34] (using GGA-PBE
on a four layered 2 9 2 unit cell), i.e., 1.28 eV. Lin et al.
[2] (using GGA-PW91 on a five layered 4 9 4 unit cell)
reported a barrier of 0.79 eV and an exothermic reaction on
the Ni(111) surface. This exothermicity could be due to the
fact that they used a larger 4 9 4 supercell, since the
adsorption energy of the CH and O products may be
reduced (due to increased surface area) relative to the CHO
reactant [69]. The length of the breaking C–O bond of the
transition state structure on the Ni(110) surface is shorter
compared to the Ni(111) and Ni(100) surfaces.
The reaction rate constants are significantly influenced
by the structure of the surface. At 463 K the rate constant is
very small for the Ni(100) surface due to the high energy
barrier obtained for this surface. The geometries of the
reactants, transition states and products are shown in
Fig. 3.
3.3.3 CHO Dissociation to CO and H
Details of the transition states for the formyl dissociation to
CO and H are given in Table 8. The activation energies are
0.15 eV for the Ni(111) surface, 0.16 eV for the Ni(110)
surface and 0.48 eV for the Ni(100) surface. The trends of
the activation barriers are on contradiction to what is
Fig. 2 Reactant, transition state
and product structures for the
CHO ? O ? HCOO reaction
Top Catal
123

expected from the distance of d-band center from the Fermi
level, although the energetics obtained for these reactions
support the BEP principle with an R2 value of 0.78
(Ea = 1.17Ereact-1.44, R2 = 0.78).
The reaction over all three surfaces is exothermic with
reaction energies of -1.38, -1.13 and -0.88 eV for the
Ni(111), Ni(110) and Ni(100) surfaces, respectively. The
results are comparable to previous theoretical and experi-
mental studies. For example Zhu et al. [18] (using GGA-
PW91 on a four layered 3 9 3 unit cell) reported an energy
barrier of 0.18 eV and a reaction energy of -1.34 eV on
the Ni(111) surface. Goodman et al. [16] found a CO
hydrogenation barrier of 1.07 eV on the Ni(100) surface
using Auger Electron Spectroscopy (AES) compared to
1.29 eV obtained in this work (activation energy for
backward CHO ? CO ? H reaction). Kao et al. [70] used
a combined ultrahigh-vacuum surface analysis-high-pres-
sure cell system to measure a barrier equal to 1.16 eV for
CO hydrogenation on the Ni(111) surface, which is com-
parable to the activation energy reported here i.e. 1.53 eV.
The trends reported in these experimental studies are
similar to what is found in the present study i.e. the
Table 7 CHO ? CH ? O activation energies (eV), reaction rate constant at 463 K (s-1), reaction energy (eV), length of the breaking C–O
bond at the transition state (A) and its imaginary frequency (cm-1) and O–C–H angle (�)
Surface Site Ea DE dC–O hO–C–H Imaginary frequency k
Ni(111) C: B
O: B
1.16 0.30 1.820 94.7 525 6.65 9 10-1
Previous results 0.79a, 1.28b, 1.08c -0.46a
Ni(110) C: E
O: G
0.89 -0.54 1.848 89.6 443 3.49 9 102
Previous results
Ni(100) C: B
O: B
1.86 -0.59 1.958 92.7 450 5.09 9 10-8
Previous results
The activation and reaction energies are ZPVE-corrected valuesa Ref. [2] (GGA-PW91 calculations using a 4 9 4 unit cell and five layer slab)b Ref. [34] (GGA-PBE calculations using a 2 9 2 unit cell and four layer slab)c Ref. [18] (GGA-PW91 calculations using a 3 9 3 unit cell and four layer slab)
Fig. 3 Reactant, transition state
and product structures for the
CHO ? CH ? O reaction
Top Catal
123

activation energy obtained on the Ni(111) surface is higher
than that for the Ni(100) surface. Also, Bundhoo et al. [71]
investigated CO hydrogenation over unsupported Ni using
chemical transient kinetics, and showed that the processes
involved in CO hydrogenation over pure Ni are reversible.
This supports the low activation barriers obtained for CHO
dissociation to CO and H.
The breaking C–H bond of the transition state structure
on the Ni(100) surface is about 0.15 A longer compared to
the other surfaces. At 463 K, the rate constants are similar
for the Ni(111) and Ni(110) surfaces and approximately
500 times bigger than that obtained for the Ni(100) surface.
Figure 4 shows the geometries of the reactants, transition
states and products.
3.4 Comparison of the Adsorption Energies
and Reaction Barriers Obtained
on the Different Ni Surfaces
Adsorbates typically bind more strongly to high symmetry
sites than to low symmetry sites, and to atoms with low
coordination numbers rather than high coordination numbers
[20, 58, 59]. The surface metal atoms coordination numbers
are 9, 8 and 7 for the Ni(111), Ni(100) and Ni(110) surfaces,
respectively. Hence, one may expect strongest adsorption on
the Ni(110) surface. The projected density of states (PDOS) of
the metallic Ni d-band can also describe the physical origin of
the difference in catalytic activity for the different surfaces
[20, 50, 64]. We have seen previously that all of the adsorbates
are more negatively charged than when they are in vacuum
[52]. This extra electron density is assumed to come from the
frontier d orbitals of the metal surface. The intensities of the
occupied orbitals at the Fermi level are 2.0, 2.2 and 2.7 states/
eV for the Ni(111), Ni(100) and Ni(110) surfaces, respectively
[63]. Thus the Ni(110) surface can donate a higher electron
density to the adsorbate. Hence, both the differences in elec-
tron density and coordination number can explain why the
adsorption energies of HCOO decrease in the order
Ni(110)[Ni(100)[Ni(111). However, for the CHO
adsorbate and the co-adsorbed species the binding energies are
largest on the Ni(100) surface. The reason for the higher
binding energy for CHO on the Ni(100) surface could be due
to the orientation of formyl molecule on the surface. On the
Ni(100) surface, the C–O bond is almost parallel to the sur-
face, whereas the carbon atom is pointing down on the other
surfaces. The angle between the C–O bond and the surface
plane is 5.6�, 10.7� and 16.1� on the Ni(100), Ni(110) and
Ni(111) surfaces, respectively (see Table 2). Similar trends
have been found by Zhou et al. [19] (using GGA-PBE on a
three layered 3 9 2 unit cell), who obtained adsorption
energies of -2.41 and -3.15 eV on Ni(111) and Ni(100)
surfaces, respectively. Similarly to CHO, co-adsorption of
CHO ? O and CO ? H is strongest on the Ni(100) surface.
Also, similarly to CHO, co-adsorption of CHO ? O and
CH ? O is stronger on the Ni(110) surface than on the
Ni(111) surface. In contrast, CO ? H co-adsorption is
stronger on the Ni(111) surface than on the Ni(110) surface.
The reaction profiles for the oxidation and dissociation
of formyl are compared in Fig. 5. It is evident that the
activation energies for CHO dissociation to CO and H are
smaller on all surfaces compared to the oxidation reaction
and the dissociation of CHO to CH and O. Hence, adsorbed
CHO species are far more likely to dissociate to CO and H
than to CH and O or to react with a co-adsorbed oxygen
atom. It can be noted that no consistent correlations could
be found between the transition state geometries and the
Table 8 CHO ? CO ? H activation energies (eV), reaction rate constant at 463 K (s-1), reaction energy (eV), length of the breaking C–H
bond at the transition state (A) and its imaginary frequency (cm-1) and O–C–H angle (�)
Surface Site Ea DE dC–H h Imaginary frequency k
Ni(111) C: C
O: A
0.15 -1.38 1.155 118.6 290 1.51 9 1011
Previous results 0.29a, 0.27b, 0.18c, 0.20d -1.18a, -1.18b, -1.34c
Ni(110) C: B
O: A
0.16 -1.13 1.159 122.5 313 2.20 9 1011
Previous results
Ni(100) C: D
O: D
0.48 -0.88 1.306 114.8 179 3.85 9 108
Previous results 0.79d -0.57d
The activation and reaction energies are ZPVE-corrected valuesa Ref. [40] (GGA-PBE calculations using a 2 9 2 unit cell and three layer slab)b Ref. [2] (GGA-PW91 calculations using a 4 9 4 unit cell and five layer slab)c Ref. [19] (GGA-PBE calculations using a 3 9 2 unit cell and three layer slab)d Ref. [18] (GGA-PW91 calculations using a 3 9 3 unit cell and four layer slab)
Top Catal
123

surface atom charge densities or surface d-band centres
(which describes the distribution of surface electronic
energy levels and demonstrates the ability to eject an
electron from the d-band of the metal to the adsorbate [3,
64]). However the energetics obtained for formyl oxidation
and for dissociation to CO ? H support the BEP principle
with R2 value of 0.94 and 0.78. The R2 value for CHO
dissociation to CH and O is 0.10.
4 Conclusions
Formyl is an important adsorbate and a key intermediate in
many industrial processes. A fundamental understanding of
aspects that affect the reactivity of this intermediate and its
dissociation and oxidation reactions, such as the catalytic
surface structure, is expected to assist in the development
of more efficient catalysts.
Fig. 4 Reactant, transition state
and product structures for the
CHO ? CO ? H reaction
Fig. 5 Reaction profiles for the oxidation and dissociation of formyl over Ni(111) (solid black line), Ni(110) (short-dashed red line) and Ni(100)
(long-dashed blue line)
Top Catal
123
The effect of three common nickel surface structures on
the adsorption and reaction energies of formyl oxidation
and dissociation has been studied by DFT calculations
using the same models and methods for all surfaces. The
results show that the adsorption energies and reaction
barriers are sensitive to the surface structure. For the dis-
sociation of CHO, the barrier for CHO ? CH ? O (FTS
process) is higher than that for CHO ? CO ? H (catalytic
combustion) on all three surfaces. The dissociation reaction
rate constant decreases in the order Ni(110)[Ni(111)[Ni(100). For the formation of formate (CHO ? O ? H-
COO), the lowest activation barrier is on the Ni(111) sur-
face and increases in the order Ni(111)\Ni(110)\Ni(100). On Ni(111), the barrier for CHO ? CH ? O and
CHO ? O ? HCOO is seven and four times higher,
respectively, compared to CHO ? CO ? H. Consequently
the reaction rate constant for CHO ? CO ? H, at 463 K,
is 3 9 1012 and 3 9 106 times larger than those for for-
mate formation and formyl dissociation to CH and O.
Irrespective of the crystallographic structure of the Ni
surfaces, the barrier for dissociation of CHO to CO and H
is lower compared to the other two reactions. This means
that formyl prefers to dissociate to CO and H instead of
reacting with co-adsorbed oxygen atoms or dissociating to
CH and O. This means that Ni performs better for this
reaction (catalytic combustion) compared the FTS process.
However more investigations of different possible inter-
mediate species and reactions are needed to clarify the
nature of the interaction between catalyst surface and
reaction intermediates and to draw a more realistic picture
of the mechanism of these reactions. The results also
indicate that the WGS reaction with a Ni catalyst does not,
to a large extent, occur via the formate pathway.
Acknowledgments This research is funded by Stiftelsen Foren-
ingssparbanken Sjuharad. The computations and simulations were
performed on resources provided by the Swedish National Infras-
tructure for Computing (SNIC) at PDC Centre for High Performance
Computing (PDC-HPC) and the Uppsala Multidisciplinary Center for
Advanced Computational Science (UPPMAX), as well as the Abel
resource (Oslo, Norway) provided by PRACE.
References
1. Zellner MB, Goda AM, Skoplyak O, Barteau MA, Chen JG
(2005) Trends in the adsorption and decomposition of hydrogen
and ethylene on monolayer metal films: a combined DFT and
experimental study. Surf Sci 583(2–3):281–296
2. Lin C-H, Chen C-L, Wang J-H (2011) Mechanistic studies of
water gas shift reaction on transition metals. J Phys Chem C
115(38):18582–18588
3. Miller SD, Kitchin JR (2009) Relating the coverage dependence
of oxygen adsorption on Au and Pt fcc (111) surfaces through
adsorbate-induced surface electronic structure effects. Surf Sci
603(5):794–801
4. Nobl C, Benndorf C, Madey TE (1985) H2O adsorption on Ni
(100): evidence for oriented water dimers. Surf Sci 157(1):29–42
5. Thiel PA, Madey TE (1987) The interaction of water with solid
surfaces: fundamental aspects. Surf Sci Rep 7(6):211–385
6. Hirano H, Tanaka K, Guczi L, Solymosi F, Tetenyi P (1993)
Structure and reactivity of carbidic intermediates for The
methanation reaction on Ni(100), Ni(111) and Ni(110) surfaces.
Stud Surf Sci Catal 75:1575–1578
7. Hirano H, Tanaka K-I (1992) A reason for the structure-insen-
sitive catalytic activity of Ni(100) and Ni(111) surfaces for the
methanation reaction of CO. J Catal 133(2):461–466
8. Ledentu V, Dong W, Sautet P (2000) Heterogeneous catalysis
through subsurface sites. J Am Chem Soc 122(8):1796–1801
9. Meunier FC, Reid D, Goguet A, Shekhtman S, Hardacre C, Burch
R, Deng W, Flytzani-Stephanopoulos M (2007) Quantitative
analysis of the reactivity of formate species seen by DRIFTS over
a Au/Ce(La)O2 water-gas shift catalyst: first unambiguous evi-
dence of the minority role of formates as reaction intermediates.
J Catal 247(2):277–287
10. Schulz H (1999) Short history and present trends of Fischer–
Tropsch synthesis. Appl Catal A Gen 186(1–2):3–12
11. Inderwildi OR, Jenkins SJ, King DA (2008) Fischer–Tropsch
mechanism revisited: alternative pathways for the production of
higher hydrocarbons from synthesis gas. J Phys Chem C
112(5):1305–1307
12. Andersson MP, Abild-Pedersen F, Remediakis IN, Bligaard T,
Jones G, Engbæk J, Lytken O, Horch S, Nielsen JH, Sehested J,
Rostrup-Nielsen JR, Nørskov JK, Chorkendorff I (2008) Struc-
ture sensitivity of the methanation reaction: h2-induced CO dis-
sociation on nickel surfaces. J Catal 255(1):6–19
13. Inderwildi OR, Jenkins SJ, King DA (2007) An unexpected
pathway for the catalytic oxidation of methylidyne on Rh{111}
as a route to syngas. J Am Chem Soc 129(6):1751–1759
14. Horn R, Williams KA, Degenstein NJ, Schmidt LD (2006)
Syngas by catalytic partial oxidation of methane on rhodium:
mechanistic conclusions from spatially resolved measurements
and numerical simulations. J Catal 242(1):92–102. doi:10.1016/j.
jcat.2006.05.008
15. Bizzi M, Saracco G, Schwiedernoch R, Deutschmann O (2004)
Modeling the partial oxidation of methane in a fixed bed with
detailed chemistry. AIChE J 50(6):1289–1299
16. Goodman DW, Kelley RD, Madey TE, Yates JT Jr (1980)
Kinetics of the hydrogenation of CO over a single crystal nickel
catalyst. J Catal 63(1):226–234
17. Inderwildi OR, Jenkins SJ, King DA (2008) Mechanistic studies
of hydrocarbon combustion and synthesis on noble metals.
Angew Chem Int Edit 47(28):5253–5255
18. Zhu Y-A, Chen D, Zhou X-G, Yuan W-K (2009) DFT studies of
dry reforming of methane on Ni catalyst. Catal Today
148(3–4):260–267
19. Zhou Y-H, Lv P-H, Wang G-C (2006) DFT studies of methanol
decomposition on Ni(100) surface: compared with Ni(111) sur-
face. J Mol Catal A Chem 258(1):203–215
20. Pang X-Y, Wang C, Zhou Y-H, Zhao J-M, Wang G-C (2010)
DFT study of the structure sensitivity for the adsorption of
methyl, methoxy, and formate on Ni (111), Ni (100), and Ni (110)
surfaces. J Mol Struc Theochem 948(1):1–10
21. Rozovskii A, Lin G (2003) Fundamentals of methanol synthesis
and decomposition. ToCat 22(3–4):137–150. doi:10.1023/a:
1023555415577
22. Larrubia Vargas MA, Busca G, Costantino U, Marmottini F,
Montanari T, Patrono P, Pinzari F, Ramis G (2007) An IR study
of methanol steam reforming over ex-hydrotalcite Cu–Zn–Al
catalysts. J Mol Catal A Chem 266(1–2):188–197. doi:10.1016/j.
molcata.2006.08.085
Top Catal
123

23. Lee SHD, Applegate DV, Ahmed S, Calderone SG, Harvey TL
(2005) Hydrogen from natural gas: part I—autothermal reforming
in an integrated fuel processor. IJHE 30(8):829–842. doi:10.1016/
j.ijhydene.2004.09.010
24. Higman C, van der Burgt M (2008) Gasification, 2nd edn. Gulf
Professional Publishing, Jordan Hill, Oxford
25. Yu J, Tian F-J, Chow MC, McKenzie LJ, Li C-Z (2006) Effect of
iron on the gasification of Victorian brown coal with steam:
enhancement of hydrogen production. Fuel 85(2):127–133
26. Callaghan CA (2006) Kinetics and catalysis of the water-gas-shift
reaction: a microkinetic and graph theoretic approach. Worcester
Polytechnic Institute, Worceste 200627. Jacobs G, Williams L, Graham U, Sparks D, Davis BH (2003)
Low-temperature water-gas shift: in-situ DRIFTS-reaction study
of a Pt/CeO2 catalyst for fuel cell reformer applications. J Phys
Chem B 107(38):10398–10404
28. Azzam KG, Babich IV, Seshan K, Lefferts L (2007) Bifunctional
catalysts for single-stage water–gas shift reaction in fuel cell
applications.: Part 1. Effect of the support on the reaction
sequence. J Catal 251(1):153–162
29. Jacobs G, Ricote S, Graham UM, Patterson PM, Davis BH (2005)
Low temperature water gas shift: type and loading of metal
impacts forward decomposition of pseudo-stabilized formate over
metal/ceria catalysts. Catal Today 106(1–4):259–264
30. Kim CH, Thompson LT (2005) Deactivation of Au/CeOx water
gas shift catalysts. J Catal 230(1):66–74
31. Kalamaras CM, Panagiotopoulou P, Kondarides DI, Efstathiou
AM (2009) Kinetic and mechanistic studies of the water–gas shift
reaction on Pt/TiO2 catalyst. J Catal 264(2):117–129
32. Grabow LC, Gokhale AA, Evans ST, Dumesic JA, Mavrikakis M
(2008) Mechanism of the water gas shift reaction on Pt: first
principles, experiments, and microkinetic modeling. J Phys Chem
C 112(12):4608–4617
33. Tang Q-L, Chen Z-X, He X (2009) A theoretical study of the
water gas shift reaction mechanism on Cu(111) model system.
Surf Sci 603(13):2138–2144
34. Catapan RC, Oliveira AA, Chen Y, Vlachos DG (2012) DFT Study
of the Water-Gas Shift Reaction and Coke Formation on Ni (111)
and Ni (211) Surfaces. J Phys Chem C 116(38):20281–20291
35. Kresse G, Hafner J (1993) Ab initio molecular dynamics for
liquid metals. Phys Rev B 47(1):558
36. Kresse G, Hafner J (1994) Ab initio molecular-dynamics simu-
lation of the liquid-metal–amorphous-semiconductor transition in
germanium. Phys Rev B 49(20):14251
37. Kresse G, Furthmuller J (1996) Efficiency of ab initio total
energy calculations for metals and semiconductors using a plane-
wave basis set. Comput Mater Sci 6(1):15–50
38. Kresse G, Furthmuller J (1996) Efficient iterative schemes for
ab initio total-energy calculations using a plane-wave basis set.
Phys Rev B 54(16):11169
39. Perdew JP, Burke K, Ernzerhof M (1996) Generalized gradient
approximation made simple. Phys Rev Lett 77(18):3865
40. Wang S-G, Liao X-Y, Hu J, Cao D-B, Li Y-W, Wang J, Jiao H
(2007) Kinetic aspect of CO2 reforming of CH4 on Ni(111): a
density functional theory calculation. Surf Sci 601(5):1271–1284
41. Tonigold K, Groß A (2012) Dispersive interactions in water
bilayers at metallic surfaces: a comparison of the PBE and RPBE
functional including semiempirical dispersion corrections.
J Comput Chem 33(6):695–701
42. Fajın JLC, Gomes JRB, Cordeiro MNDS (2013) DFT study of the
adsorption of d-(l-)cysteine on flat and chiral stepped gold sur-
faces. Langmuir 29(28):8856–8864
43. Tao J, Perdew JP, Staroverov VN, Scuseria GE (2003) Climbing
the density functional ladder: nonempirical meta–generalized
gradient approximation designed for molecules and solids. Phys
Rev Lett 91(14):146401
44. Pan Y, Zhang H, Shi D, Sun J, Du S, Liu F, Hj Gao (2009) Highly
Ordered, Millimeter-Scale, Continuous, Single-Crystalline Gra-
phene Monolayer Formed on Ru (0001). Adv Mater 21(27):
2777–2780
45. Blochl PE (1994) Projector augmented-wave method. Phys Rev B
50(24):17953
46. Monkhorst HJ, Pack JD (1976) Special points for Brillouin-zone
integrations. Phys Rev B 13(12):5188–5192
47. Nørskov JK, Bligaard T, Hvolbæk B, Abild-Pedersen F, Chork-
endorff I, Christensen CH (2008) The nature of the active site in
heterogeneous metal catalysis. Chem Soc Rev 37(10):2163–2171
48. Fajın JL, Cordeiro M, Illas F, Gomes JR (2009) Influence of step
sites in the molecular mechanism of the water gas shift reaction
catalyzed by copper. J Catal 268(1):131–141
49. Henry CR (1998) Surface studies of supported model catalysts.
Surf Sci Rep 31(7):231–325
50. Wang S-G, Cao D-B, Li Y-W, Wang J, Jiao H (2005)
Chemisorption of CO2 on nickel surfaces. J Phys Chem B
109(40):18956–18963
51. Ciobica I, Frechard F, Van Santen R, Kleyn A, Hafner J (2000) A
DFT study of transition states for CH activation on the Ru (0001)
surface. J Phys Chem B 104(14):3364–3369
52. Mohsenzadeh A, Borjesson A, Wang J-H, Richards T, Bolton K
(2013) The effect of carbon monoxide co-adsorption on Ni-
catalysed water dissociation. Int J Mol Sci 14(12):23301–23314
53. Henkelman G, Uberuaga BP, Jonsson H (2000) A climbing image
nudged elastic band method for finding saddle points and mini-
mum energy paths. J Chem Phys 113:9901
54. Henkelman G, Jonsson H (2000) Improved tangent estimate in
the nudged elastic band method for finding minimum energy
paths and saddle points. J Chem Phys 113:9978
55. Chorkendorff I, Niemantsverdriet JW (2006) Concepts of modern
catalysis and kinetics. Wiley, Weinheim
56. Fajın JL, Cordeiro M, Illas F, Gomes JR (2010) Descriptors
controlling the catalytic activity of metallic surfaces toward water
splitting. J Catal 276(1):92–100
57. van Harrevelt R, Honkala K, Nørskov JK, Manthe U (2005) The
reaction rate for dissociative adsorption of N on stepped Ru
(0001): six-dimensional quantum calculations. J Chem Phys
122:234702
58. Delbecq F, Sautet P (1993) Low-temperature adsorption of
formaldehyde on a platinum (111) surface. A theoretical study.
Langmuir 9(1):197–207
59. Smoluchowski R (1941) Anisotropy of the electronic work
function of metals. Phys Rev 60(9):661
60. Madix RJ, Gland JL, Mitchell GE, Sexton BA (1983) Identifi-
cation of the intermediates in the dehydration of formic acid on
Ni(110) by high resolution electron energy loss vibrational
spectroscopy. Surf Sci 125(2):481–489
61. Blaylock DW, Zhu Y-A, Green WH (2011) Computational
investigation of the thermochemistry and kinetics of steam
methane reforming over a multi-faceted nickel catalyst. Top
Catal 54(13–15):828–844
62. Ayastuy J, Gutierrez-Ortiz M, Gonzalez-Marcos J, Aranzabal A,
Gonzalez-Velasco J (2005) Kinetics of the low-temperature WGS
reaction over a CuO/ZnO/Al2O3 catalyst. Ind Eng Chem Res
44(1):41–50
63. Mohsenzadeh A, Bolton K, Richards T (2014) DFT study of the
adsorption and dissociation of water on Ni (111), Ni (110) and Ni
(100) surfaces. Surf Sci 627:1–10
64. Li J, Croiset E, Ricardez-Sandoval L (2012) Methane dissociation
on Ni (100), Ni (111), and Ni (553): a comparative density
functional theory study. J Mol Catal A Chem 365:103–114.
doi:10.1016/j.molcata.2012.08.016
65. Bronsted JN (1928) Acid and basic catalysis. Chem Rev
5(3):231–338
Top Catal
123

66. Evans MG, Polanyi M (1938) Inertia and driving force of
chemical reactions. Trans Faraday Soc 34:11–24
67. Benziger JB, Madix RJ (1979) The decomposition of formic acid
on Ni(100). Surf Sci 79(2):394–412
68. Benziqer JB, Schoofs GR (1984) Influence of adsorbate interac-
tions on heterogeneous reaction kinetics. Formic acid decompo-
sition on nickel. J Phys Chem US 88(19):4439–4444
69. Lim D-H, Lastoskie CM (2009) Density functional theory studies
on the relative reactivity of chloroethenes on zerovalent iron.
Environ Sci Technol 43(14):5443–5448
70. Kao C-C, Tsai S-C, Chung Y-W (1982) Surface electronic
properties and CO hydrogenation activity of nickel deposited on
rutile TiO2(100) as a model supported catalyst. J Catal 73(1):
136–146
71. Bundhoo A, Schweicher J, Frennet A, Kruse N (2009) Chemical
transient kinetics applied to CO hydrogenation over a pure nickel
catalyst. J Phys Chem C 113(24):10731–10739
Top Catal
123

Paper IV


ORIGINAL PAPER
A density functional theory study of hydrocarbon combustionand synthesis on Ni surfaces
Abas Mohsenzadeh & Tobias Richards & Kim Bolton
Received: 10 November 2014 /Accepted: 26 January 2015 /Published online: 18 February 2015# Springer-Verlag Berlin Heidelberg 2015
Abstract Combustion and synthesis of hydrocarbons mayoccur directly (CH → C + H and CO → C + O) or via aformyl (CHO) intermediate. Density functional theory(DFT) calculations were performed to calculate the activationand reaction energies of these reactions on Ni(111), Ni(110),and Ni(100) surfaces. The results show that the energies aresensitive to the surface structure. The dissociation barrier formethylidyne (CH → C + H: catalytic hydrocarbon combus-tion) is lower than that for its oxidation reaction (CH + O →CHO) on the Ni(110) and Ni(100) surfaces. However the ox-idation barrier is lower than that for dissociation on theNi(111) surface. The dissociation barrier for methylidyne dis-sociation decreases in the order Ni(111) > Ni(100) > Ni(110).The barrier of formyl dissociation to CO and H is almost thesame on the Ni(111) and Ni(110) surfaces and is lower com-pared to the Ni(100) surface. The energy barrier for carbonmonoxide dissociation (CO → C + O: catalytic hydrocarbonsynthesis) is higher than that of for its hydrogenation reaction(CO + H → CHO) on all three surfaces. This means that thehydrogenation to CHO is favored on these nickel surfaces.The energy barrier for both reactions decreases in the orderNi(111) > Ni(100) > Ni(110). The barrier for formyl dissoci-
ation to CH + O decreases in the order Ni(100) > Ni(111) >Ni(110). Based on these DFTcalculations, the Ni(110) surfaceshows a better catalytic activity for hydrocarbon combustioncompared to the other surfaces, and Ni is a better catalyst forthe combustion reaction than for hydrocarbon synthesis,where the reaction rate constants are small. The reactions stud-ied here support the BEP principles with R2 values equal to0.85 for C-H bond breaking/forming and 0.72 for C-O bondbreaking /forming reactions.
Keywords DFT . Hydrocarbon combustion . Hydrocarbonsynthesis . Nickel
Introduction
The environmental consequences caused by fossil fuel com-bustion, such as production of pollutants and greenhouse gas-es, increases the importance of sustainable energy sources.Gasification is one of the most important and effectivemethods for sustainable energy generation. Generally, gasifi-cation means the conversion of carbonaceous material to agaseous product, i.e., carbon monoxide and hydrogen (syn-thesis gas which is often referred to as syngas) with an em-ployable heating value [1]. This gaseous product can furtherbe converted into other hydrocarbons and liquid fuels that arecombusted to H2O and CO2.
Catalytic combustion of hydrocarbons is an important tech-nology, and has been developed for efficient energy produc-tion with minimum pollutant formation. It is done at lowertemperatures compared to conventional flame combustion.The catalyst has played a decisive role in the improvementof this process [2–4]. Recent studies revealed that hydrocar-bon oxidation is not a simple dissociation of the hydrocarbon
Electronic supplementary material The online version of this article(doi:10.1007/s00894-015-2590-8) contains supplementary material,which is available to authorized users.
A. Mohsenzadeh (*) : T. Richards :K. BoltonSwedish Centre for Resource Recovery, University of Borås, SE501-90 Borås, Swedene-mail: [email protected]
T. Richardse-mail: [email protected]
K. Boltone-mail: [email protected]
J Mol Model (2015) 21: 46DOI 10.1007/s00894-015-2590-8

into hydrogen and carbon followed by oxidation reactions asassumed in previous studies [5, 6]. Instead, the direct reactionbetween CH fragments and oxygen can be the most importantpathway. In this mechanism, an oxymethylidyne (CHO, for-myl) intermediate is formed and subsequently dissociates tohydrogen and carbon monoxide [7, 8].
Since the early developmental work by Fischer andTropsch and their co-workers [9], the synthesis of hydrocar-bons from syngas is probably the most important source ofchemicals and fuels from non-petroleum based sources.Fischer-Tropsch synthesis (FTS) is a complex catalytic pro-cess in which the synthesis gas is converted into various hy-drocarbons and water over transition metals [10, 11]. Theproduced hydrocarbons can be utilized as feedstock in thechemical industry or as fuel. FTS has been investigated exper-imentally [12–14] and theoretically [8, 15, 16]. For the syn-thesis of hydrocarbons, a conclusion that was drawn fromearlier studies was that both CO and H2 are adsorbed on thecatalyst surface and subsequently dissociate. Then both the Cand O species are hydrogenated to CH2 and H2O [17]. How-ever, recent investigations suggest that the reaction via CHOspecies is the main reaction pathway, similar to catalytic hy-drocarbon combustion [18–21].
Inderwildi et al. [18] used DFT calculations andmicrokinetic simulations to study the FTS mechanism on acobalt surface, and demonstrated that the main reaction path-way is the hydrogenation of CO (forming CHO) and subse-quent cleavage of the C-O bond which yields co-adsorbed CHand O. They also investigated catalytic combustion and syn-thesis on noble metals [8], and found that the combustion andformation of hydrocarbons follow very similar routes but inopposite directions, and that CHO is an essential intermediatein both processes.
Zhu et al. [22] performed DFT calculations to investigatethe methane reforming mechanism on the Ni(111) surface,which includes CHO formation and decomposition. They sug-gested that the oxidation step determines the overall reactionrate for both CH and C oxidation pathways. DFT calculationswere used to study methanol decomposition on the Ni(111)and Ni(100) surfaces by Zhou et al. [23]. CHO formation anddecomposition were also investigated in their study. Theyconcluded that the methanol decomposition reaction mecha-nismmay be sensitive to the surface structure.Wang et al. [24]investigated the reaction pathways of CO2 reforming of CH4
on the Ni(111) surface using DFT calculations. They foundthat CH oxygenation into CHO is more favored than its dis-sociation to C and H.
Goodman et al. [25] used Auger electron spectroscopy(AES) to investigate the kinetics of CO hydrogenation onthe Ni(100) surface. Their results showed that a mechanisminvolving hydrogenation of an active carbon species was con-sistent with their kinetic data, and that the turnover number formethane formation is similar on the Ni(111) and Ni(100)
surfaces. Hirano and Tanaka et al. [26, 27] used low energyelectron diffraction (LEED) to study the methanation reactionof CO on Ni(111), Ni(110), and Ni(100) surfaces, and to ex-plain why the catalytic activity of these surfaces does notappear to be sensitive to the surface structure. They found thatthe accumulation of overlayers of carbidic intermediates couldbe the reason. They concluded that the methanation reaction iscatalyzed by the same compound that produces the carbideoverlayers.
In contrast to methanation of CO on Ni surfaces, manystudies indicate that the catalytic properties and reaction ener-gies are affected by surface orientation, steps and defects[28–30]. Nickel particles grown on oxide or graphite sub-strates have polyhedral shapes exhibiting (111), (110), and(100) facets [31]. These facets have been investigated boththeoretically and experimentally. As discussed above, investi-gations, e.g., of methanol decomposition, have been per-formed on the Ni(111) and Ni(100) surfaces, showing thatthey are stable under experimental conditions. The Ni(110)surface is also stable under experimental conditions. For ex-ample, Madix et al. [32] used high resolution electron energyloss vibrational spectroscopy to study the intermediate formedin the dehydration reaction for formic acid on Ni(110). Theysuggested that the lateral interactions between CO and HCOOcause the autocatalytic decomposition of the formate.
The present contribution provides a comparative DFTstudy of the combustion and the synthesis of hydrocarbonson the Ni(111), Ni(110), and Ni(100) surfaces. To the best ofour knowledge this is the first time that the same methods andmodels are used for all surfaces and reactions to investigatehow the reactant, transition state or product relative energiesor vibrational frequencies are affected by the crystallographicstructure of the nickel catalyst. These results are analyzed toidentify which of the hydrocarbon combustion and synthesisreactions are kinetically favored on each of the surfaces, andwhether these reactions follow the Brønsted-Evans-Polanyi(BEP) principles.
Methods and models
The calculations were performed using the Vienna ab initiosimulation package (VASP) [33–36] implementing spin polar-ized DFT. The generalized gradient approximation with thePerdew, Burke, and Ernzerh of (GGA-PBE) formulation wasused for the exchange-correlation functional [37]. The Kohn-Sham equations were solved using the projector-augmentedwave method (PAW) [38, 39] with a 4×4×1 Monkhorst-Packgrid of k-points [40] for the numerical integration in reciprocalspace. The Kohn-Sham orbitals were expanded in a plane-wave basis set using a kinetic energy cut off of 400 eV. Largercut offs and finer k-meshes were also examined and yieldedthe same trends reported below. The conjugate-gradient (CG)
46 Page 2 of 11 J Mol Model (2015) 21: 46
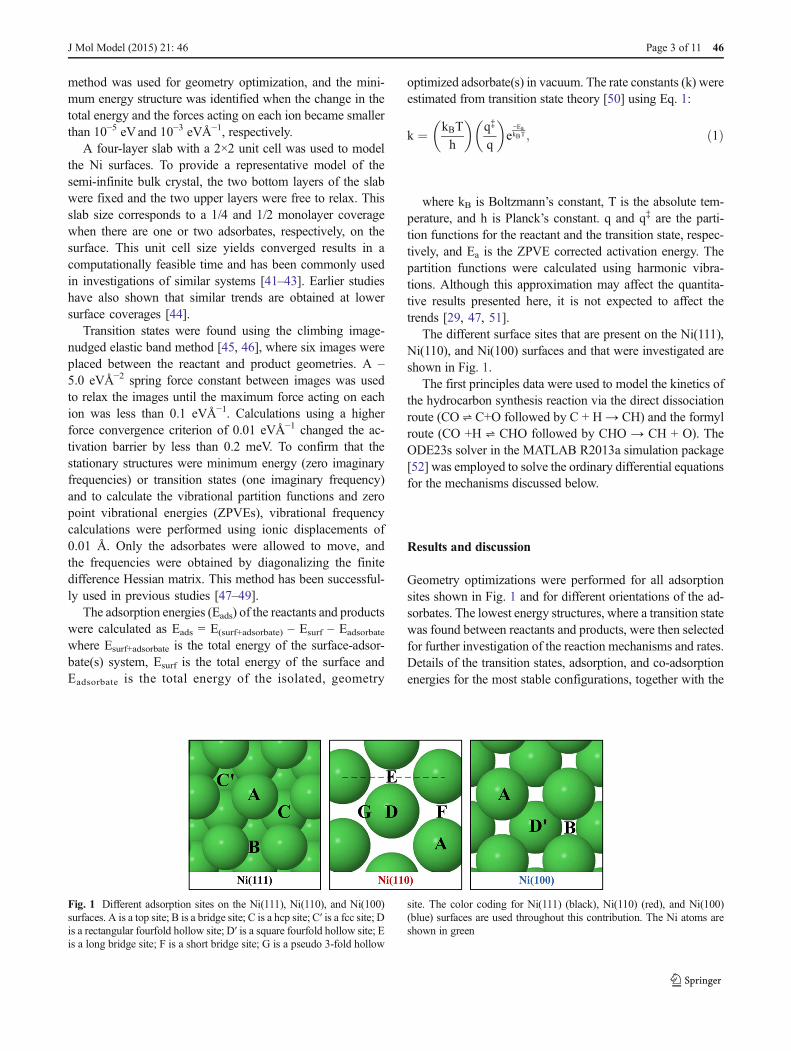
method was used for geometry optimization, and the mini-mum energy structure was identified when the change in thetotal energy and the forces acting on each ion became smallerthan 10−5 eVand 10−3 eVÅ−1, respectively.
A four-layer slab with a 2×2 unit cell was used to modelthe Ni surfaces. To provide a representative model of thesemi-infinite bulk crystal, the two bottom layers of the slabwere fixed and the two upper layers were free to relax. Thisslab size corresponds to a 1/4 and 1/2 monolayer coveragewhen there are one or two adsorbates, respectively, on thesurface. This unit cell size yields converged results in acomputationally feasible time and has been commonly usedin investigations of similar systems [41–43]. Earlier studieshave also shown that similar trends are obtained at lowersurface coverages [44].
Transition states were found using the climbing image-nudged elastic band method [45, 46], where six images wereplaced between the reactant and product geometries. A –5.0 eVÅ−2 spring force constant between images was usedto relax the images until the maximum force acting on eachion was less than 0.1 eVÅ−1. Calculations using a higherforce convergence criterion of 0.01 eVÅ−1 changed the ac-tivation barrier by less than 0.2 meV. To confirm that thestationary structures were minimum energy (zero imaginaryfrequencies) or transition states (one imaginary frequency)and to calculate the vibrational partition functions and zeropoint vibrational energies (ZPVEs), vibrational frequencycalculations were performed using ionic displacements of0.01 Å. Only the adsorbates were allowed to move, andthe frequencies were obtained by diagonalizing the finitedifference Hessian matrix. This method has been successful-ly used in previous studies [47–49].
The adsorption energies (Eads) of the reactants and productswere calculated as Eads = E(surf+adsorbate) – Esurf – Eadsorbate
where Esurf+adsorbate is the total energy of the surface-adsor-bate(s) system, Esurf is the total energy of the surface andEadsorbate is the total energy of the isolated, geometry
optimized adsorbate(s) in vacuum. The rate constants (k) wereestimated from transition state theory [50] using Eq. 1:
k ¼ kBT
h
� �q‡
q
� �e
−EakBT ; ð1Þ
where kB is Boltzmann’s constant, T is the absolute tem-perature, and h is Planck’s constant. q and q‡ are the parti-tion functions for the reactant and the transition state, respec-tively, and Ea is the ZPVE corrected activation energy. Thepartition functions were calculated using harmonic vibra-tions. Although this approximation may affect the quantita-tive results presented here, it is not expected to affect thetrends [29, 47, 51].
The different surface sites that are present on the Ni(111),Ni(110), and Ni(100) surfaces and that were investigated areshown in Fig. 1.
The first principles data were used to model the kinetics ofthe hydrocarbon synthesis reaction via the direct dissociationroute (CO ⇌ C+O followed by C + H→ CH) and the formylroute (CO +H ⇌ CHO followed by CHO → CH + O). TheODE23s solver in the MATLAB R2013a simulation package[52] was employed to solve the ordinary differential equationsfor the mechanisms discussed below.
Results and discussion
Geometry optimizations were performed for all adsorptionsites shown in Fig. 1 and for different orientations of the ad-sorbates. The lowest energy structures, where a transition statewas found between reactants and products, were then selectedfor further investigation of the reaction mechanisms and rates.Details of the transition states, adsorption, and co-adsorptionenergies for the most stable configurations, together with the
Fig. 1 Different adsorption sites on the Ni(111), Ni(110), and Ni(100)surfaces. A is a top site; B is a bridge site; C is a hcp site; C′ is a fcc site; Dis a rectangular fourfold hollow site; D′ is a square fourfold hollow site; Eis a long bridge site; F is a short bridge site; G is a pseudo 3-fold hollow
site. The color coding for Ni(111) (black), Ni(110) (red), and Ni(100)(blue) surfaces are used throughout this contribution. The Ni atoms areshown in green
J Mol Model (2015) 21: 46 Page 3 of 11 46
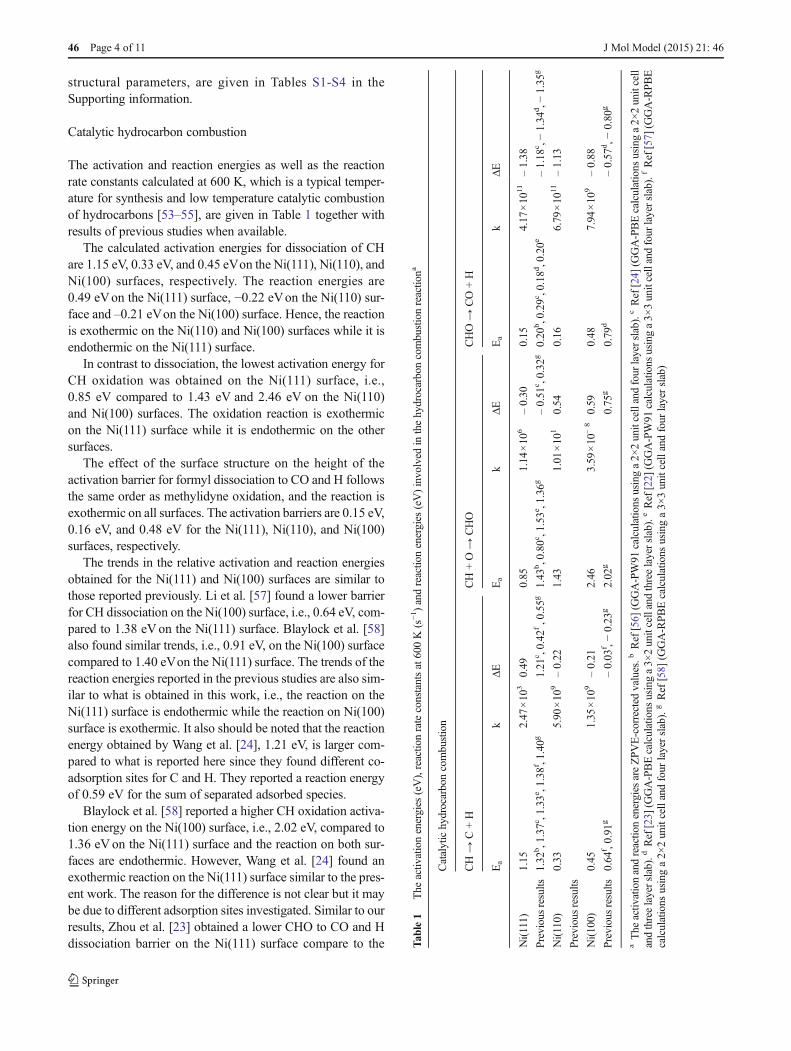
structural parameters, are given in Tables S1-S4 in theSupporting information.
Catalytic hydrocarbon combustion
The activation and reaction energies as well as the reactionrate constants calculated at 600 K, which is a typical temper-ature for synthesis and low temperature catalytic combustionof hydrocarbons [53–55], are given in Table 1 together withresults of previous studies when available.
The calculated activation energies for dissociation of CHare 1.15 eV, 0.33 eV, and 0.45 eVon the Ni(111), Ni(110), andNi(100) surfaces, respectively. The reaction energies are0.49 eVon the Ni(111) surface, −0.22 eVon the Ni(110) sur-face and –0.21 eVon the Ni(100) surface. Hence, the reactionis exothermic on the Ni(110) and Ni(100) surfaces while it isendothermic on the Ni(111) surface.
In contrast to dissociation, the lowest activation energy forCH oxidation was obtained on the Ni(111) surface, i.e.,0.85 eV compared to 1.43 eV and 2.46 eV on the Ni(110)and Ni(100) surfaces. The oxidation reaction is exothermicon the Ni(111) surface while it is endothermic on the othersurfaces.
The effect of the surface structure on the height of theactivation barrier for formyl dissociation to CO and H followsthe same order as methylidyne oxidation, and the reaction isexothermic on all surfaces. The activation barriers are 0.15 eV,0.16 eV, and 0.48 eV for the Ni(111), Ni(110), and Ni(100)surfaces, respectively.
The trends in the relative activation and reaction energiesobtained for the Ni(111) and Ni(100) surfaces are similar tothose reported previously. Li et al. [57] found a lower barrierfor CH dissociation on the Ni(100) surface, i.e., 0.64 eV, com-pared to 1.38 eVon the Ni(111) surface. Blaylock et al. [58]also found similar trends, i.e., 0.91 eV, on the Ni(100) surfacecompared to 1.40 eVon the Ni(111) surface. The trends of thereaction energies reported in the previous studies are also sim-ilar to what is obtained in this work, i.e., the reaction on theNi(111) surface is endothermic while the reaction on Ni(100)surface is exothermic. It also should be noted that the reactionenergy obtained by Wang et al. [24], 1.21 eV, is larger com-pared to what is reported here since they found different co-adsorption sites for C and H. They reported a reaction energyof 0.59 eV for the sum of separated adsorbed species.
Blaylock et al. [58] reported a higher CH oxidation activa-tion energy on the Ni(100) surface, i.e., 2.02 eV, compared to1.36 eVon the Ni(111) surface and the reaction on both sur-faces are endothermic. However, Wang et al. [24] found anexothermic reaction on the Ni(111) surface similar to the pres-ent work. The reason for the difference is not clear but it maybe due to different adsorption sites investigated. Similar to ourresults, Zhou et al. [23] obtained a lower CHO to CO and Hdissociation barrier on the Ni(111) surface compare to the T
able1
The
activ
ationenergies
(eV),reactio
nrateconstantsat600K(s−1)andreactio
nenergies
(eV)involved
inthehydrocarboncombustionreactio
na
Catalytichydrocarboncombustion
CH→
C+H
CH+O→
CHO
CHO→
CO+H
Ea
kΔE
Ea
kΔE
Ea
kΔE
Ni(111)
1.15
2.47
×10
30.49
0.85
1.14
×10
6–0.30
0.15
4.17
×10
11–1.38
Previous
results
1.32
b,1.37c,1.33e,1.38f,1.40g
1.21
c ,0.42
f,0.55g
1.43
b,0.80c,1.53e,1.36g
–0.51
c ,0.32
g0.20
b,0.29c,0.18d,0.20e
–1.18
c ,−1.34
d,−
1.35
g
Ni(110)
0.33
5.90
×10
9–0.22
1.43
1.01
×10
10.54
0.16
6.79
×10
11–1.13
Previous
results
Ni(100)
0.45
1.35
×10
9–0.21
2.46
3.59
×10
–8
0.59
0.48
7.94
×10
9–0.88
Previous
results
0.64
f ,0.91
g–0.03
f ,−0.23
g2.02
g0.75
g0.79
d–0.57
d,−
0.80
g
aThe
activ
ationandreactio
nenergies
areZPVE-corrected
values.b
Ref[56]
(GGA-PW91
calculations
usinga2×
2unitcellandfour
layerslab).
cRef[24]
(GGA-PBEcalculations
usinga2×
2unitcell
andthreelayerslab).
dRef[23]
(GGA-PBEcalculations
usinga3×
2unitcellandthreelayerslab).
eRef[22]
(GGA-PW91
calculations
usinga3×
3unitcellandfour
layerslab).f
Ref[57]
(GGA-RPBE
calculations
usinga2×
2unitcellandfour
layerslab).
gRef
[58]
(GGA-RPB
Ecalculations
usinga3×
3unitcellandfour
layerslab)
46 Page 4 of 11 J Mol Model (2015) 21: 46

Ni(100) surface, i.e. 0.18 eVand 0.79 eV, respectively, whereboth reaction are exothermic.
No results have previously been reported for the Ni(110)surface. The trends observed here (e.g., the effect of the sur-face structure on the barrier height and reaction energies), aswell as those in the BCatalytic hydrocarbon synthesis^ section,are discussed in the BBrønsted-Evans-Polanyi principle andreaction profiles^ section.
The geometries of the reactants, transition states and prod-ucts which are presented in Table 1, are shown in Fig. 2. Theadsorption and co-adsorption energies, together with the
details of these structures, are given in Tables S1, S3, and S4in the Supporting information.
Catalytic hydrocarbon synthesis
The activation barriers, rate constants at 600 K and reactionenergies for hydrocarbon synthesis are given in Table 2.
The highest activation energy for CO dissociation is on theNi(111) surface, and is 2.99 eV compared to 1.98 eV and1.83 eV on the Ni(100) and Ni(110) surfaces, respectively.The reaction is endothermic on all three surfaces.
The activation energy for the hydrogenation of CO followsthe same order as its dissociation, i.e., it decreases in the orderof Ni(111) > Ni(100) > Ni(110). The reaction is endothermicon all surfaces with reaction energies of 1.38 eV, 1.13 eVand0.88 eV for the Ni(111), Ni(110) and Ni(100) surfaces,respectively.
The barrier of formyl dissociation to CH and O, however,decreases in the order of Ni(100) > Ni(111) > Ni(110). Thereaction on the Ni(110) and Ni(100) surfaces is exothermicwhile it is endothermic on the Ni(111) surface.
The results obtained in the present study are similar to thosereported previously (which are shown in Table 2 and are onlyavailable for the Ni(111) surface).
Figure 3 shows geometries of the reactants, transition statesand products for the reactions given in Table 2. The adsorptionand co-adsorption energies together with the details of thesestructures are given in Tables S2, S3, and S4 in the Supportinginformation.
Brønsted-Evans-Polanyi principle and reaction profiles
According to the Brønsted-Evans-Polanyi (BEP) principle theactivation energy for a given reaction should be linearly pro-portional to the reaction energy [59, 60]. Figure 4 shows thesecorrelations for the different Ni surface structures studied here(the data used to draw Fig. 4 is provided in Table S5 in theSupporting information). Results from C-H bond breaking/forming are combined in the upper panel and those for C-Obond breaking/forming are shown in the lower panel.
Figure 4 reveals that these reactions support the BEP prin-ciple with R2 values of 0.85 and 0.72 for C-H and C-O bondbreaking/forming and, respectively. However, it should benoted that only three Ni facets have been studied in this workand more facets would improve the statistical relevance of theresults.
Including all of the data in a single plot, as done in Fig. S1(a) in the Supporting information, yields an R2=0.53. Thisdeterioration of the fit to the BEP principle is expected sincethe chemical species involved in these groups of reactions andalso the reactivity of the surfaces are different [61].
The transition state scaling (TSS) method [61, 62], which isrelated to the BEP principle, correlates the transition state
Fig. 2 Reactant, transition state, and product structures for the reactionsinvolved in catalytic hydrocarbon combustion. Color coding is the sameas in Fig. 1. In addition, oxygen atoms are shown in red, carbon in gray,and hydrogen in white
J Mol Model (2015) 21: 46 Page 5 of 11 46

energy (ETS) with either the initial state (EIS) or final state(EFS) energy (i.e., the energy of the reactants or products). Inthe present work correlation with the initial state is the same aswith the final state since both the forward (bond breaking) andbackward (bond forming) reactions are included in the plots.Similar to previous studies [56, 63], correlation between ETSand EFS (shown in Fig. S1 (b) in the Supporting information)yields a larger R2 (0.96) than that obtained in the BEP plot(0.53). This is partly due to the larger energy intervals in theTSS plot compared to the BEP plot [64].
Figure 5 shows the reaction profiles for hydrocarbon com-bustion. The calculations reveal that, when there is sufficientco-adsorbed oxygen on the Ni(111) surface, the fraction of CHthat undergoes direct dissociation prior to oxidation is verysmall due to its higher activation barrier (1.15 eV comparedto 0.85 eV). The same trends were also observed by Wanget al. [24]. They found a dissociation barrier of 1.37 eVand anoxidation barrier of 0.80 eVon the Ni(111) surface.
In contrast, the dissociation barrier on the Ni(110) andNi(100) surfaces is lower than the oxidation barriers. Thesetrends are similar to what was reported by Blaylock et al. [58].They found that the oxidation and dissociation barriers followopposite orders on the Ni(111) and Ni(100) surfaces, i.e., onthe Ni(111) surface the dissociation has a higher activationenergy compared to oxidation while on the Ni(100) surfacethe dissociation has a lower energy barrier compared to oxi-dation. It is also apparent from Fig. 5 that if the Ni(110) and/orNi(100) surfaces are present with a sufficiently large area,direct combustion of CH to C and H is preferred to oxidationvia a CHO intermediate. That is, the lowest activation energyfor the formation of the CHO intermediate is 0.85 eV (on theNi(111) surface) which is larger than the lowest barriers fordirect combustion (on the Ni(110) and Ni(100) surfaces).
Experimental investigations also support the lower barrierobtained for carbon formation on the Ni(110) surface
compared to the Ni(111) surface. Atoms in the Ni(110) surfaceridges have lower coordination numbers, which is the samefor atoms in the stepped Ni(211) surface, and Abild-Pedersenet al. [65] reported that carbon formation is preferred on thestepped Ni(211) surface compared to the Ni(111) surface.
The d-band center, which describes the distribution of sur-face electronic energy levels [57, 66] and demonstrates theability to eject an electron from the d-band of the metal tothe adsorbate, can be used to explain differences in catalyticactivity of the different surfaces. The calculated d-band cen-ters are at –1.75, −1.98 and –2.08 eV for the Ni(110), Ni(100),and Ni(111) surfaces, respectively [30]. Generally, the surfaceis more reactive when the d-band center is closer to the Fermilevel [57, 66]. Thus, the Ni(110) surface is expected to be themost reactive surface and the activity of different surfacesdecreases in the order Ni(110) > Ni(100) > Ni(111). For cat-alytic hydrocarbon combustion, the reaction rate constants (kvalues given in Table 1) for CH and CHO dissociation arelargest on the Ni(110) surface as expected. However, the rateconstant for CH oxidation is bigger on the Ni(111) surfacecompared to the other surfaces.
The reaction profiles for hydrocarbon synthesis are com-pared in Fig. 6. Except for CHO dissociation to CH and O,where the barrier on the Ni(100) surface is higher compared tothe Ni(111) surface, the activation energies on the differentsurfaces increases in the order Ni(110) < Ni(100) < Ni(111).This trend is also expected from the positions of the d-bandcenters discussed above. It is evident that the activation ener-gies for CO dissociation are higher on all surfaces compared toits hydrogenation. It may also be noted that the adsorptionenergies of CO are –1.89 eV, −1.89 eV, and –1.96 eVon theNi(111), Ni(110), and Ni(100), respectively (see Table S2).Therefore, CO desorption will compete with dissociation onthe Ni(111) and Ni(100) surfaces, while CO dissociation isfavored on the Ni(110) surface.
Table 2 The activation energies (eV), reaction rate constants at 600 K (s−1), and reaction energies (eV) for the reactions involved in hydrocarbonsynthesisa
Catalytic hydrocarbon synthesis
CO→ C + O CO + H → CHO CHO → CH + O
Ea k ΔE Ea k ΔE Ea k ΔE
Ni(111) 2.99 8.20×10– 14 2.60 1.53 1.22×100 1.38 1.16 5.28×10² 0.30
Previous results 3.01b, 2.94c, 3.15d 2.51d 1.35b, 1.48c, 1.47d 1.18d 1.28b, 1.08c, 1.31d 0.51d
Ni(110) 1.83 2.94×10– 4 0.76 1.29 1.00×10² 1.13 0.89 6.39×10⁴ – 0.54
Previous results
Ni(100) 1.98 1.94×10– 5 0.82 1.36 3.83×101 0.88 1.86 2.55×10– 3 – 0.59
Previous results
a The activation and reaction energies are ZPVE-corrected values. b Ref [56] (GGA-PW91 calculations using a 2×2 unit cell and four layer slab). c Ref[22] (GGA-PW91 calculations using a 3×3 unit cell and four layer slab). d Ref [24] (GGA-PBE calculations using a 2×2 unit cell and three layer slab)
46 Page 6 of 11 J Mol Model (2015) 21: 46

When hydrogen is co-adsorbed on the Ni surface the COcan react with these atoms instead of dissociating to C + O ordesorbing. In this case, CO + H forms CHO. In fact, theactivation energies for CHO formation are lower than thosefor CO dissociation and desorption on all surfaces. Theadsorbed CO species is therefore more likely to react withco-adsorbed hydrogen than to dissociate to C and O or todesorb from the surface. These findings are in agreement withthe results of temperature programmed desorption experi-ments done by Andersson et al. [19] in which no CO dissoci-ation was observed on the CO-covered Ni(111) surface. Theysuggested that the reaction via a formyl species has a barrier
below the desorption energy. The preferred formation of CHOcould also be the reason why the formation of volatile car-bonyls are observed for the Fischer-Tropsch process on Ni[67, 68].
Figure 7 shows the time dependence of the CH con-centration produced via the direct dissociation route (CO⇌ C+O followed by C + H → CH) and the formyl route(CO +H ⇌ CHO followed by CHO → CH + O) on thethree different Ni surfaces. The temperature is 600 K. Thedata in the Supporting information shows that the desorp-tion energies of the species involved in these reactions arelarger than the barriers shown in Figs. 5 and 6. Hence, atmoderate pressures all species will be present on the metalsurface. Figure 6 shows the average rate of CH formationfrom each CO molecule on the surface (therefore the con-centration of the produced CH increases until it reaches1). It is evident that both routes are fastest on the Ni(110)surface. Also, the direct route is faster on the Ni(110) andNi(100) surfaces compared to the formyl route. However,the formyl route will dominate if the Ni(111) surface isused. Similar trends were observed when different H con-centrations (between 0.25 and 1.5) were used in the kinet-ics model.
Since the rate constants (see Table 2) for synthesis reactionsare far smaller than those for the combustion reactions (see
Fig. 3 Reactant, transition state, and product structures for the reactionsinvolved in catalytic hydrocarbon synthesis. Color coding is the same asin Fig. 2
y = 0.50x + 1.51
R² = 0.72
0
2
4
-3 -2 -1 0 1 2 3E a
(eV
)
∆E(eV)
(b) C-O bond breaking/forming
y = 0.50x + 0.73
R² = 0.85
0
1
2
-2 -1 0 1 2
E a(e
V)
∆E(eV)
(a) C-H bond breaking/forming
Fig. 4 Brønsted-Evans-Polanyi (BEP) correlations for (a) C-H and (b) C-O bond breaking/forming reactions on the Ni(111), Ni(110) and Ni(100)surfaces
J Mol Model (2015) 21: 46 Page 7 of 11 46
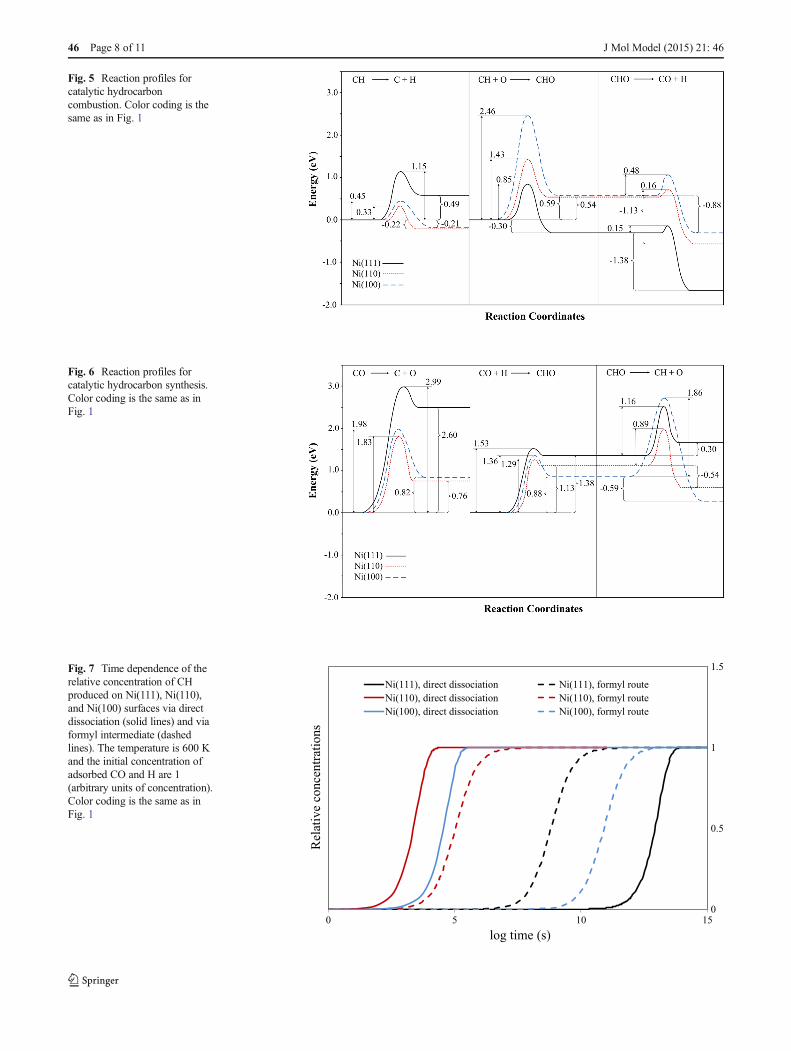
Fig. 5 Reaction profiles forcatalytic hydrocarboncombustion. Color coding is thesame as in Fig. 1
Fig. 6 Reaction profiles forcatalytic hydrocarbon synthesis.Color coding is the same as inFig. 1
0
0.5
1
1.5
0 5 10 15
Ni(111), direct dissociation Ni(111), formyl route
Ni(110), direct dissociation Ni(110), formyl route
Ni(100), direct dissociation Ni(100), formyl route
Rel
ativ
e co
nce
ntr
atio
ns
log time (s)
Fig. 7 Time dependence of therelative concentration of CHproduced on Ni(111), Ni(110),and Ni(100) surfaces via directdissociation (solid lines) and viaformyl intermediate (dashedlines). The temperature is 600 Kand the initial concentration ofadsorbed CO and H are 1(arbitrary units of concentration).Color coding is the same as inFig. 1
46 Page 8 of 11 J Mol Model (2015) 21: 46

Table 1), Ni is a better catalyst for hydrocarbon combustion.This could be the reason for the insensitivity of catalytic ac-tivity to the surface structure that has been observed experi-mentally for FTS reactions [25–27]. It may also be noted thatalthough the transition state theory is expected to be validwhen the activation energy is large (since the slow reactionrate will allow for equilibration of vibrational energy in thereactant(s)), it may not be as good as an approximation forsome of the faster reactions, such as CHO → CH+O on theNi(111) and Ni(110) surfaces.
Conclusions
The effect of three common nickel surface structures onthe reaction energetics of hydrocarbon combustion andsynthesis has been systematically examined by DFT cal-culations using the same models and methods. The re-sults show that the reaction barriers are sensitive to thesurface structure. For catalytic hydrocarbon combustion,the CH dissociation barrier is lower compared to itsoxidation activation energy on the Ni(110) and Ni(100)surfaces. In contrast, the dissociation barrier is higheron the Ni(111) surface. This means that dissociation isfavored on the Ni(110) and Ni(100) surfaces, while ox-idation to CHO is favored on the Ni(111) surface. Thedissociation barrier increases in the order Ni(110) <Ni(100) < Ni(111) and the oxidation barrier decreasesin the order Ni(100) > Ni(110) > Ni(111). The barrierfor CHO dissociation to CO and H follows the sameorder as CH oxidation.
For the catalytic hydrocarbon synthesis, the CO dissocia-tion barrier is significantly higher compared to its hydrogena-tion barrier on all surfaces, which means that hydrogenation toCHO is favored over nickel in the presence of sufficient co-adsorbed H. This could explain why formation of carbonyls inthe nickel-catalyzed Fischer-Tropsch process is observed ex-perimentally [67, 68]. The rate of both reactions decreases inthe order Ni(110) > Ni(100) > Ni(111). For the formyl disso-ciation to CH and O, the lowest barrier was obtained on theNi(110) surface. The barrier on the Ni(100) surface is highercompared to the Ni(111) surface, unlike the oxidation andhydrogenation reactions. Also, the barrier for CHO dissocia-tion to CH and O is higher than the dissociation to CO and H.The calculated rate constants at 600 K are rather small for thesynthesis process, which could be a reason for the experimen-tal observations that the Fischer-Tropsch process is insensitiveto the Ni surface orientation.
Hence, based on DFT calculations, the Ni(110) surfaceshowed a better catalytic activity for hydrocarbon combustionthan for hydrocarbon synthesis.
The reactions studied support the BEP relations with R2
values of 0.85 for C-H bond breaking/forming and 0.85 for
C-O bond breaking/forming. Also the d-band center providesa valid description for the relative catalytic activity of all facetsof the Ni surface, except for CH oxidation which is faster onthe Ni(111) surface even though the d-band center for thisfacet is farthest from the Fermi level.
Acknowledgments This research is funded by StiftelsenFöreningssparbanken Sjuhärad. The computations and simulations wereperformed on resources provided by the Swedish National Infrastructurefor Computing (SNIC) at PDC Centre for High Performance Computing(PDC-HPC) and the Uppsala Multidisciplinary Centre for AdvancedComputational Science (UPPMAX). We also acknowledge that the re-sults of this research have been achieved using the PRACE-2IP project(FP7 RI-283493) resource Abel based in Norway at UiO.
References
1. Higman C, Burgt M (2008) Gasification, 2nd edn. Gulf Professional,Oxfrod
2. Yazawa Y, Takagi N, Yoshida H, Komai S-i, Satsuma A, Tanaka T,Yoshida S, Hattori T (2002) The support effect on propane combus-tion over platinum catalyst: control of the oxidation-resistance ofplatinum by the acid strength of support materials. Appl Catal A233(1–2):103–112
3. Anderson RB, Stein KC, Feenan JJ, Hofer LJE (1961) Catalyticoxidation of methane. Ind Eng Chem Res 53(10):809–812
4. Skoglundh M, Fridell E (2004) Strategies for enhancing low-temperature activity. Top Catal 28(1–4):79–87
5. Bizzi M, Saracco G, Schwiedernoch R, Deutschmann O (2004)Modeling the partial oxidation of methane in a fixed bed with de-tailed chemistry. AIChE J 50(6):1289–1299
6. Horn R,WilliamsKA, Degenstein NJ, Schmidt LD (2006) Syngas bycatalytic partial oxidation of methane on rhodium: mechanistic con-clusions from spatially resolved measurements and numerical simu-lations. J Catal 242(1):92–102. doi:10.1016/j.jcat.2006.05.008
7. Inderwildi OR, Jenkins SJ, King DA (2007) An unexpected pathwayfor the catalytic oxidation of methylidyne on Rh{111} as a route tosyngas. J Am Chem Soc 129(6):1751–1759
8. Inderwildi OR, Jenkins SJ, King DA (2008) Mechanistic studies ofhydrocarbon combustion and synthesis on noble metals. AngewChem Int Ed 47(28):5253–5255
9. Fischer F, Tropsch H (1923) The preparation of synthetic oil mixtures(synthol) from carbon monoxide and hydrogen. Brennst Chem 4:276–285
10. Dry ME (1996) Practical and theoretical aspects of the catalyticFischer-Tropsch process. Appl Catal A 138(2):319–344
11. Schulz H (1999) Short history and present trends of Fischer-Tropschsynthesis. Appl Catal A 186(1–2):3–12
12. Brady RC, Pettit R (1980) Reactions of diazomethane on transition-metal surfaces and their relationship to the mechanism of the Fischer-Tropsch reaction. J Am Chem Soc 102(19):6181–6182
13. Brady RC, Pettit R (1981) Mechanism of the Fischer-Tropsch reac-tion. The chain propagation step. J Am Chem Soc 103(5):1287–1289
14. Wilson J, de Groot C (1995) Atomic-scale restructuring in high-pressure catalysis. J Phys Chem Us 99(20):7860–7866
15. Liu Z-P, Hu P (2002) A new insight into Fischer−Tropsch synthesis. JAm Chem Soc 124(39):11568–11569
16. Ciobîcă IM, Kramer GJ, Ge Q, Neurock M, van Santen RA (2002)Mechanisms for chain growth in Fischer–Tropsch synthesis overRu(0001). J Catal 212(2):136–144
J Mol Model (2015) 21: 46 Page 9 of 11 46

17. Klinke Ii DJ, Broadbelt LJ (1999) Construction of a mechanisticmodel of Fischer–Tropsch synthesis on Ni(111) and Co(0001) sur-faces. Chem Eng Sci 54(15–16):3379–3389
18. Inderwildi OR, Jenkins SJ, King DA (2008) Fischer-Tropsch mech-anism revisited: alternative pathways for the production of higherhydrocarbons from synthesis gas. J Phys Chem C 112(5):1305–1307
19. Andersson MP, Abild-Pedersen F, Remediakis IN, Bligaard T, JonesG, Engbæk J, Lytken O, Horch S, Nielsen JH, Sehested J, Rostrup-Nielsen JR, Nørskov JK, Chorkendorff I (2008) Structure sensitivityof the methanation reaction: H2-induced CO dissociation on nickelsurfaces. J Catal 255(1):6–19
20. Coenen JWE, van Nisselrooy PFMT, de Croon MHJM, van DoorenPFHA, van Meerten RZC (1986) The dynamics of methanation ofcarbon monoxide on nickel catalysts. Appl Catal 25(C):1–8
21. Andersson MP, Bligaard T, Kustov A, Larsen KE, Greeley J,Johannessen T, Christensen CH, Nørskov JK (2006) Toward compu-tational screening in heterogeneous catalysis: Pareto-optimal metha-nation catalysts. J Catal 239(2):501–506
22. Zhu Y-A, Chen D, Zhou X-G, Yuan W-K (2009) DFT studies of dryreforming of methane on Ni catalyst. Catal Today 148(3–4):260–267
23. Zhou Y-H, Lv P-H, Wang G-C (2006) DFT studies of methanoldecomposition on Ni(100) surface: compared with Ni(111) surface.J Mol Catal A Chem 258(1):203–215
24. Wang S-G, Liao X-Y, Hu J, Cao D-B, Li Y-W,Wang J, Jiao H (2007)Kinetic aspect of CO2 reforming of CH4 on Ni(111): a density func-tional theory calculation. Surf Sci 601(5):1271–1284
25. GoodmanDW, Kelley RD,Madey TE, Yates JT Jr (1980) Kinetics ofthe hydrogenation of CO over a single crystal nickel catalyst. J Catal63(1):226–234
26. Hirano H, Tanaka K (1993) Structure and reactivity of carbidicintermediates for the methanation reaction on Ni(100),Ni(111), and Ni(110) surfaces. Stud Surf Sci Catal 75:1575–1578
27. Hirano H, Tanaka K (1992) A reason for the structure-insensitivecatalytic activity of Ni(100) and Ni(111) surfaces for the methanationreaction of CO. J Catal 133(2):461–466
28. Nørskov JK, Bligaard T, Hvolbæk B, Abild-Pedersen F,Chorkendorff I, Christensen CH (2008) The nature of the active sitein heterogeneous metal catalysis. Chem Soc Rev 37(10):2163–2171
29. Fajín JL, CordeiroM, Illas F, Gomes JR (2009) Influence of step sitesin the molecular mechanism of the water gas shift reaction catalyzedby copper. J Catal 268(1):131–141
30. Mohsenzadeh A, Bolton K, Richards T (2014) DFT study of theadsorption and dissociation of water on Ni(111), Ni(110) andNi(100) surfaces. Surf Sci
31. Henry CR (1998) Surface studies of supported model catalysts. SurfSci Rep 31(7):231–325
32. Madix RJ, Gland JL, Mitchell GE, Sexton BA (1983) Identificationof the intermediates in the dehydration of formic acid on Ni(110) byhigh resolution electron energy loss vibrational spectroscopy. SurfSci 125(2):481–489
33. Kresse G, Hafner J (1993) Ab initio molecular dynamics for liquidmetals. Phys Rev B 47(1):558
34. Kresse G, Hafner J (1994) Ab initio molecular-dynamics simulationof the liquid-metal–amorphous-semiconductor transition in germani-um. Phys Rev B 49(20):14251
35. Kresse G, Furthmüller J (1996) Efficiency of ab-initio total energycalculations for metals and semiconductors using a plane-wave basisset. Comput Mater Sci 6(1):15–50
36. Kresse G, Furthmüller J (1996) Efficient iterative schemes for abinitio total-energy calculations using a plane-wave basis set. PhysRev B 54(16):11169
37. Perdew JP, Burke K, Ernzerhof M (1996) Generalized gradient ap-proximation made simple. Phys Rev Lett 77(18):3865
38. Pan Y, Zhang H, Shi D, Sun J, Du S, Liu F, Gao H (2009) Highlyordered, millimeter‐scale, continuous, single‐crystalline graphenemonolayer formed on Ru (0001). Adv Mater 21(27):2777–2780
39. Blöchl PE (1994) Projector augmented-wave method. Phys Rev B50(24):17953
40. Monkhorst HJ, Pack JD (1976) Special points for Brillouin-zoneintegrations. Phys Rev B 13(12):5188–5192
41. Wang S-G, Cao D-B, Li Y-W, Wang J, Jiao H (2005) Chemisorptionof CO2 on nickel surfaces. J Phys Chem B 109(40):18956–18963
42. Ciobica I, Frechard F, Van Santen R, Kleyn A, Hafner J (2000) ADFT study of transition states for CH activation on the Ru (0001)surface. J Phys Chem B 104(14):3364–3369
43. Ledentu V, Dong W, Sautet P (2000) Heterogeneous catalysisthrough subsurface sites. J Am Chem Soc 122(8):1796–1801
44. Mohsenzadeh A, Borjesson A, Wang J-H, Richards T, Bolton K(2013) The effect of carbon monoxide co-adsorption on Ni-catalysed water dissociation. Int J Mol Sci 14(12):23301–23314
45. Henkelman G, Uberuaga BP, Jónsson H (2000) A climbing imagenudged elastic band method for finding saddle points and minimumenergy paths. J Chem Phys 113:9901
46. Henkelman G, Jónsson H (2000) Improved tangent estimate in thenudged elastic band method for finding minimum energy paths andsaddle points. J Chem Phys 113:9978
47. Fajín JL, Cordeiro M, Illas F, Gomes JR (2010) Descriptors control-ling the catalytic activity of metallic surfaces toward water splitting. JCatal 276(1):92–100
48. Fajín JL, Cordeiro M, Illas F, Gomes JR (2014) GeneralizedBrønsted–Evans–Polanyi relationships and descriptors for O–Hbondcleavage of organic molecules on transition metal surfaces. J Catal313:24–33
49. Shojaee K, Montoya A, Haynes BS (2013) Insight into oxygen sta-bility and vacancy formation on Co3O4 model slabs. Comput MaterSci 72:15–25
50. Chorkendorff I, Niemantsverdriet JW (2006) Concepts of moderncatalysis and kinetics. Wiley, Weinheim
51. van Harrevelt R, Honkala K, Nørskov JK, Manthe U (2005) Thereaction rate for dissociative adsorption of N on stepped Ru (0001):Six-dimensional quantum calculations. J Chem Phys 122:234702
52. MATLAB R2014a (2013) The Mathworks Inc, Natick53. Enger BC, Holmen A (2012) Nickel and Fischer-Tropsch synthesis.
Cat Rev 54(4):437–48854. Li N, Gaillard F, Boréave A (2008) Electrochemical promotion of Ag
catalyst for the low temperature combustion of toluene. CatalCommun 9(6):1439–1442
55. WuM,Wang X, Dai Q, Gu Y, Li D (2010) Low temperature catalyticcombustion of chlorobenzene over Mn–Ce–O/γ-Al2O3 mixed ox-ides catalyst. Catal Today 158(3–4):336–342
56. Catapan RC, Oliveira AA, Chen Y, Vlachos DG (2012) DFTstudy ofthe water–gas shift reaction and coke formation on Ni(111) andNi(211) surfaces. J Phys Chem C 116(38):20281–20291
57. Li J, Croiset E, Ricardez-Sandoval L (2012) Methane dissociation onNi(100), Ni(111), and Ni(553): a comparative density functional the-ory study. J Mol Catal A Chem 365:103–114. doi:10.1016/j.molcata.2012.08.016
58. Blaylock DW, Zhu Y-A, Green WH (2011) Computational investi-gation of the thermochemistry and kinetics of steam methanereforming over a multi-faceted nickel catalyst. Top Catal 54(13–15):828–844
59. Bronsted JN (1928) Acid and basic catalysis. Chem Rev 5(3):231–338
60. Evans MG, Polanyi M (1938) Inertia and driving force of chemicalreactions. Trans Faraday Soc 34:11–24
61. Wang S, Temel B, Shen J, Jones G, Grabow L, Studt F, Bligaard T,Abild-Pedersen F, Christensen C, Nørskov J (2011) UniversalBrønsted-Evans-Polanyi relations for C–C, C–O, C–N, N–O, N–N,and O–O dissociation reactions. Catal Lett 141(3):370–373
46 Page 10 of 11 J Mol Model (2015) 21: 46

62. Nørskov JK, Bligaard T, Logadottir A, Bahn S, Hansen LB,Bollinger M, Bengaard H, Hammer B, Sljivancanin Z, MavrikakisM, Xu Y, Dahl S, Jacobsen CJH (2002) Universality in heteroge-neous catalysis. J Catal 209(2):275–278
63. Studt F, Abild-Pedersen F, Bligaard T, Sørensen RZ, Christensen CH,Nørskov JK (2008) Identification of non-precious metal alloy catalystsfor selective hydrogenation of acetylene. Science 320(5881):1320–1322
64. Asthagiri A, Janik MJ (2013) Computational catalysis. The RoyalSociety of Chem, Cambridge
65. Abild-Pedersen F, Lytken O, Engbæk J, Nielsen G,Chorkendorff I, Nørskov JK (2005) Methane activation on
Ni(111): effects of poisons and step defects. Surf Sci590(2–3):127–137
66. Miller SD, Kitchin JR (2009) Relating the coverage dependence ofoxygen adsorption on Au and Pt fcc (111) surfaces throughadsorbate-induced surface electronic structure effects. Surf Sci603(5):794–801
67. Fischer F, Tropsch H (1926) The synthesis of petroleum at atmo-spheric pressures from gasification products of coal. BrennstoffChem 7:97–104
68. Dry ME (2004) FTcatalysts. Studies in surface science and catalysis.Elsevier, Amsterdam
J Mol Model (2015) 21: 46 Page 11 of 11 46

Supporting Information
A density functional theory study of hydrocarbon combustion and
synthesis on Ni surfaces
Abas Mohsenzadeha,*, Tobias Richards a, Kim Boltona
a Swedish Centre for Resource Recovery, University of Borås, SE 501-90 Borås, Sweden
E-Mail Addresses: [email protected] (A. Mohsenzadeh); [email protected] (K. Bolton);
[email protected] (T. Richards)
* Corresponding author: E-Mail: [email protected] (A. Mohsenzadeh); Tel.: +46-33-4354487;
Fax: +46-33-4354008; Address: University of Borås, SE 501-90 Borås, Sweden

1
Table S1. Adsorption energies (eV) and structural parameters (Å) of the chemical species involved in CH dissociation. The adsorption energies are ZPVE-corrected values. dsurf-C and dsurf-H are the shortest
distances between carbon and hydrogen atoms of the adsorbate and any metal atom on the surface.
Surface Site Eads dsurf-C dsurf-H dC-H
Ni(111)
CH
C: C′ – 6.25 1.842 --- 1.101
Ni(110) C: D – 6.24 1.888 --- 1.111
Ni(100) C: D′ – 6.94 1.927 --- 1.114
Ni(111)
TS
C: C′ H: B
--- 1.784 1.620 1.556
Ni(110) C: E H: G
--- 1.821 1.583 1.526
Ni(100) C: D′ H: B
--- 1.827 1.683 1.503
Ni(111)
C + H
C: C H: C′
– 9.20 1.752 1.686 2.934
Ni(110) C: E H: G
– 9.90 1.791 1.698 3.167
Ni(100) C: D′ H: D′
– 10.59 1.817 1.811 2.506

2
Table S2. Adsorption energies (eV) and structural parameters (Å) of the chemical species involved in CO dissociation. The adsorption energies are ZPVE-corrected values. dsurf-C and dsurf-O are the shortest
distances between carbon and oxygen atoms of the adsorbate and any metal atom on the surface.
Surface Site Eads dsurf-C dsurf-O dC-O
Ni(111)
CO
C: C – 1.89 1.948 --- 1.193
Ni(110) C: D – 1.89 1.875 --- 1.183
Ni(100) C: D′ – 1.96 2.039 --- 1.213
Ni(111)
TS
C: B O: B
--- 1.764 1.878 1.870
Ni(110) C: E O: G
--- 1.811 1.801 1.961
Ni(100) C: B O: D′
--- 1.816 1.862 1.940
Ni(111)
C + O
C: C O: C′
– 10.69 1.745 1.827 2.497
Ni(110) C: E O: D
– 12.53 1.789 1.893 3.462
Ni(100) C: D′ O: D′
– 12.54 1.813 1.970 2.709

3
Table S3. Adsorption energies (eV) and structural parameters (Å and degrees) of the chemical species involved in CHO dissociation to CH and O. The adsorption energies are ZPVE-corrected values. dsurf-C and dsurf-O are the shortest distances between carbon and oxygen atoms of the adsorbate and any metal
atom on the surface.
Surface Site Eads dsurf-C dsurf-O dC-H dC-O θ H-C-O
Ni(111)
CHO
C: B O: A
– 2.19 1.960 1.969 1.110 1.289 117.0
Ni(110) C: F O: A
– 2.42 1.807 1.969 1.116 1.257 117.9
Ni(100) C: B O: B
– 2.76 1.916 1.960 1.111 1.353 112.5
Ni(111)
TS
C: B O: B
--- 1.814 1.887 1.097 1.820 94.7
Ni(110) C: E O: G
--- 1.930 1.816 1.121 1.848 89.6
Ni(100) C: B O: B
--- 1.788 1.825 1.096 1.958 92.7
Ni(111)
CH + O
C: C′ O: C′
– 10.81 1.785 1.810 1.100 2.682 ---
Ni(110) C: D O: G
– 11.89 1.928 1.821 1.113 3.704 ---
Ni(100) C: D′ O: D′
– 12.28 1.899 1.922 1.115 3.521 ---

4
Table S4. Adsorption energies (eV) and structural parameters (Å and degrees) of the chemical species involved in CHO dissociation to CO and H. The adsorption energies are ZPVE-corrected. dsurf-C, dsurf-H and dsurf-O are the shortest distances between carbon, hydrogen and oxygen atoms of the adsorbate and
any metal atom on the surface.
Surface Site Eads dsurf-C dsurf-O dsurf-H dC-H dC-O θ H-C-O
Ni(111)
CHO
C: B O: A
– 2.19 1.960 1.969 --- 1.110 1.289 117.0
Ni(110) C: F O: A
– 2.42 1.807 1.969 --- 1.116 1.257 117.9
Ni(100) C: B O: B
– 2.76 1.916 1.960 --- 1.111 1.353 112.5
Ni(111)
TS
C: C H: A
--- 1.942 2.163 1.938 1.155 1.261 118.6
Ni(110) C: F H: A
--- 1.796 2.190 1.942 1.159 1.234 122.5
Ni(100) C: B H: A
--- 1.875 2.355 1.605 1.306 1.244 114.8
Ni(111)
CO + H
C: C H: C′
– 4.54 1.947 2.889 1.694 2.911 1.191 ---
Ni(110) C: F H: G
– 4.51 1.874 2.880 1.691 2.884 1.181 ---
Ni(100) C: D′ H: D′
– 4.61 2.037 2.865 1.833 3.581 1.213 ---

5
Table S5. Activation and reaction energies (eV), as well as energies (eV) of initial (EIS), transition state (ETS) and final (EFS) structures of the species involved in hydrocarbon combustion and synthesis.
Reaction Surface Ea(eV) ∆E(eV) EIS(eV) ETS(eV) EFS(eV)
CH → C+H Ni(111) 1.15 0.49 – 96.1723 – 95.0223 – 95.6821 Ni(110) 0.33 – 0.22 – 91.2742 – 90.9437 – 91.4927 Ni(100) 0.45 – 0.21 – 95.1948 – 94.7453 – 95.4002
CHO → CO+H Ni(111) 0.15 – 1.38 – 102.9301 – 102.7781 – 104.3121 Ni(110) 0.16 – 1.13 – 98.2673 – 98.1031 – 99.3947 Ni(100) 0.48 – 0.88 – 101.8977 – 101.3510 – 102.7127
CO+H → CHO Ni(111) 1.53 1.38 – 104.3121 – 102.7781 – 102.9301 Ni(110) 1.29 1.13 – 99.3947 – 98.1031 – 98.2673 Ni(100) 1.36 0.88 – 102.7127 – 101.3510 – 101.8297
C+H → CH Ni(111) 0.66 – 0.49 – 95.6821 – 95.0223 – 96.1723 Ni(110) 0.55 0.22 – 91.4927 – 90.9437 – 91.2742 Ni(100) 0.65 0.21 – 95.4002 – 94.7453 – 95.1948
CO → C+O Ni(111) 2.99 2.60 – 100.5492 – 97.5590 – 97.9489 Ni(110) 1.83 0.76 – 95.6583 – 93.8245 – 94.8959 Ni(100) 1.98 0.82 – 98.9493 – 96.9652 – 98.1257
CH+O → CHO Ni(111) 0.85 – 0.30 – 102.6270 – 101.7737 – 102.9301 Ni(110) 1.43 0.54 – 98.8084 – 97.3780 – 98.2673 Ni(100) 2.46 0.59 – 102.4247 – 99.9697 – 101.8297
CHO → CH+O Ni(111) 1.16 0.30 – 102.9301 – 101.7737 – 102.6270 Ni(110) 0.89 – 0.54 – 98.2673 – 97.3780 – 98.8084 Ni(100) 1.86 – 0.59 – 101.8297 – 99.9697 – 102.4247
C+O → CO Ni(111) 0.39 – 2.60 – 97.9489 – 97.5590 – 100.5492 Ni(110) 1.07 – 0.76 – 94.8959 – 93.8245 – 95.6583 Ni(100) 1.16 – 0.82 – 98.1257 – 96.9652 – 98.9493
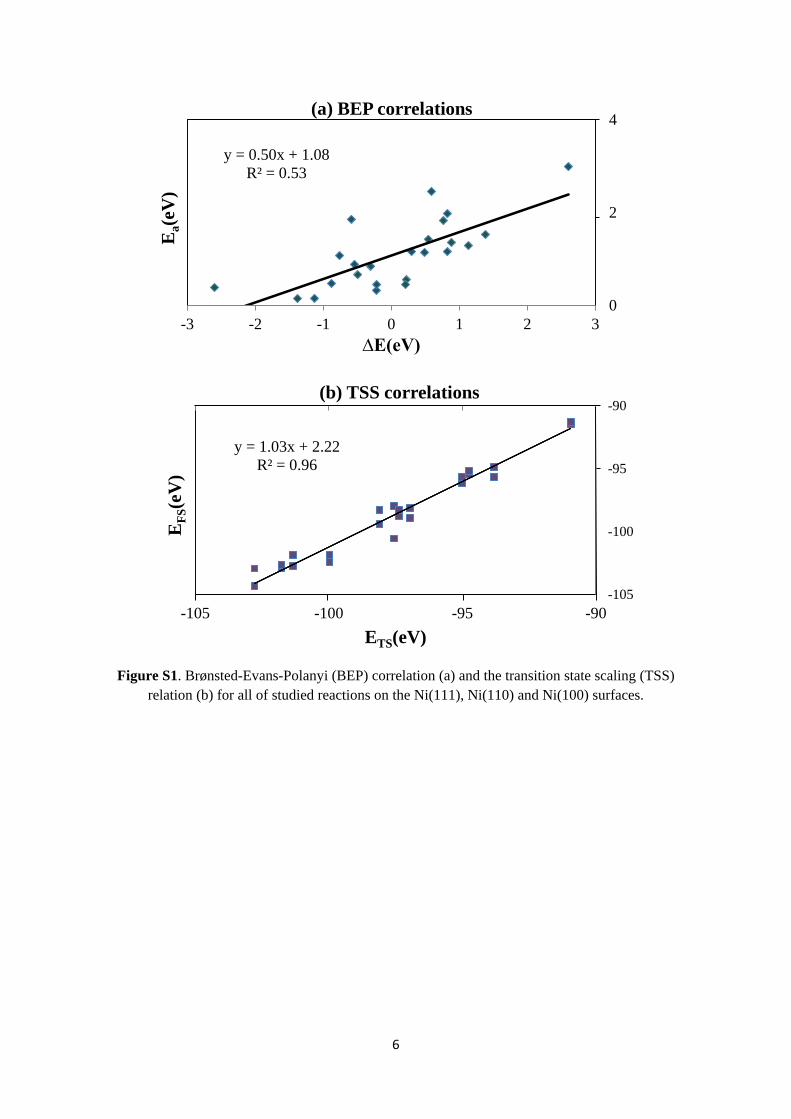
6
Figure S1. Brønsted-Evans-Polanyi (BEP) correlation (a) and the transition state scaling (TSS) relation (b) for all of studied reactions on the Ni(111), Ni(110) and Ni(100) surfaces.
y = 0.50x + 1.08R² = 0.53
0
2
4
-3 -2 -1 0 1 2 3
Ea(
eV)
∆E(eV)
(a) BEP correlations
y = 1.03x + 2.22R² = 0.96
-105
-100
-95
-90
-105 -100 -95 -90
EFS
(eV
)
ETS(eV)
(b) TSS correlations


Paper V


1
DFT study of the water gas shift reaction on Ni(111), Ni(100) and Ni(110) surfaces Abas Mohsenzadeh a, Tobias Richards a, Kim Bolton a,* a Swedish Centre for Resource Recovery, University of Borås, SE 501-90 Borås, Sweden E-Mail Addresses: [email protected] (A. Mohsenzadeh); [email protected] (T. Richards); [email protected] (K. Bolton) * Corresponding author: E-Mail: [email protected]; Tel.: +46-33-4354602; Fax: +46-33-4354008; Address: University of Borås, SE 501-90 Borås, Sweden
Abstract
Density functional theory (DFT) calculations were used to study the water gas shift (WGS) reaction on Ni(111), Ni(100) and Ni(110) surfaces. The adsorption energy for ten species involved in the reaction together with activation barriers and reaction energies for the nine most important elementary steps were determined using the same model and DFT methods. The results reveal that these energies are sensitive to the surface structure. In spite of this, the WGS reaction occurs mainly via the direct (also referred to as redox) pathway with the CO + O → CO2 reaction as the rate determining step on all three surfaces. The activation barrier obtained for this rate limiting step decreases in the order Ni(110) > Ni(111) > Ni(100). Therefore, if O species are present on the surfaces then the WGS reaction is fastest on the Ni(100) surface. However, the barrier for desorption of H2O (which is the source of the O species) is lower than its dissociation reaction on the Ni(111) and Ni(100) surfaces, but not on the Ni(110) surface. Hence, at low H2O(g) pressures, the direct pathway on the Ni(110) surface will dominate and will be the rate limiting step. The calculations also show that the reason that the WGS reaction does not primarily occur via the formate pathway is that this species is a stable intermediate on all surfaces. The reactions studied here support the Brønsted-Evans-Polanyi (BEP) principles with an R2 value of 0.99.
Keywords: water gas shift reaction, DFT, nickel, Ni(111), Ni(100), Ni(110)
1. Introduction
The water gas shift (WGS) reaction, CO + H2O ⇌ CO2 + H2, is of great importance in many industrial processes, including steam reforming of natural gas, methanation and production of hydrogen. This reaction is also one of the most important reactions in gasification, where carbonaceous materials are converted to gaseous products that can be used to produce energy or other chemicals [1-7]. Different metal catalysts such as Cu, Pt and Au are used to increase the rate of the WGS reaction [8]. Nickel is also widely used since it has a large thermal conductivity, high catalytic conversion and it can be manufactured in different shapes [8-12].
Several experimental and computational studies have focused on the WGS reaction because of its importance. Recent investigations have shown that the WGS reaction mechanism primarily includes the direct, carboxyl and formate pathways [12-15]. Most of the recent studies have focused on the role of the support, on the nature of important intermediates and reactions taking place on the nickel particles and on the nature of the active sites involved in the reaction. Hilaire et al. [16] proposed that the reaction occurs via a direct pathway on Ni/CeO2 surfaces, where CO2

2
is produced via the direct oxidation of CO. Grenoble et al. [17] suggested a mechanism which proceeds via formic acid formation over acidic sites on an Al2O3 surface. This formic acid intermediate subsequently decomposes to CO2 and H2. Sanchez-Escribano et al. [18] observed the presence of formate species on Ni/Al2O3 surfaces using FTIR spectroscopy. Based on diffuse reflectance infrared Fourier transform spectroscopy (DRIFTS) studies on Ni/CeO2 catalysts, Jacobs et al. [19] suggested a mechanism where formate is formed over Ce sites. Formate was also observed on the Ni(110) surface using high resolution electron energy loss spectroscopy (HREELS) by Vesselli et al. [20] and Wambach et al. [21]. Dehydration of formic acid on Ni(110) and Ni(110)(4×5)C surfaces was studied using HREELS by Madix et al. [22]. They observed formate on the carbide surface and a mixed adlayer of CO and HCOO on the pure Ni surface. Infrared reflection absorption spectroscopy (IRAS) was employed by Yamakata et al. [23] to investigate the dehydration of formate adsorbed on a Ni(110) surface. They proposed a surface reaction mechanism which includes unimolecular dehydrogenation of formate and suggested that the rate determining step of the dehydrogenation reaction is the C-H bond dissociation.
Experimental studies have been complemented by theoretical calculations. However, only two of these have studied the mechanism of the WGS reaction on Ni surfaces [12, 15]. Most of the computational studies that have been performed on similar systems have focused, instead, on methanol synthesis [24], methane reforming [25-27], trends of the WGS reaction over a variety of transition metals [15, 28, 29], methanation of CO [25, 30], effects of co-adsorbed molecules and step defects on the reactivity of CHx species [25, 31, 32], and formate adsorption and decomposition on Ni surfaces [20, 33-35].
One of the two studies that investigated the mechanism of the WGS reaction on a Ni surface was performed by Lin et al. [15]. They used DFT calculations to investigate the WGS reaction on a series of transition metals including the Ni(111) surface, and their results are compared with the present calculations below. The other study was done by Catapan et al. [12], where DFT was used to study the reaction on Ni(111) and Ni(221) surfaces. They found that the Ni(111) surface is a better catalyst for the WGS reaction, which occurs mainly via the carboxyl pathway with the CO + OH → COOH reaction as the rate determining step. They also suggested that a parallel route via formate and formyl intermediates is favored on the Ni(221) surface.
The WGS reaction mechanism has also been investigated on other surfaces using DFT [36-38] calculations. For example, a DFT study together with experimental data for the WGS reaction catalyzed by Pt were provided by Grabow et al. [39].They predicted that the most important reaction channel proceeds via a carboxyl intermediate while formate acts only as a spectator. Furthermore, Fajín et al. [40] studied the role of step sites in the WGS reaction catalyzed by Cu, and found that the associative route through the carboxyl intermediate is favored in the presence of the steps. Bunluesin et al. [36] determined the steady-state WGS kinetics on ceria-supported Pd, Pt and Rh catalysts and found that the ceria structure significantly affects the results. The promotional effect of alkali additives (Na, Li and K) on the WGS reaction for Pt/Al2O3 and Pt/TiO2 catalysts was investigated by Pazmiño et al. [38]. They found that the active platinum remains in the metallic state and that the promotion by alkali is due to the modification of the support properties.
The experimental and computational studies presented above show that the details of the WGS reaction mechanism are not fully understood. In fact, there are some inconsistencies between
3
experimental and computational results, such as the role of formate species. To address these inconsistencies, a systematic DFT study of the WGS reaction on Ni(111), Ni(100) and Ni(110) surfaces was performed using the same methods and models. The present contribution extends previous investigations by performing a comparative study of the WGS reaction on these three surfaces and identifying the most important reaction pathways. To the best of our knowledge, this is the first time that the WGS reaction on these three crystallographic surface orientations has been studied using the same computational models and methods. These results are expected to aid in identifying which of the three crystallographic surfaces is the most efficient for the WGS reaction, which pathway is favored, and the detailed mechanisms of the WGS reaction on these surfaces.
2. Theory
2.1. Methods
The Vienna ab initio simulation package (VASP) was used for the calculations [41-44]. Spin polarized DFT was used with the generalized gradient approximation and the Perdew, Burke and Ernzerh (GGA-PBE) [45] functional. The Kohn-Sham equations were solved using the projector-augmented wave method (PAW) [46, 47] with a 4×4×1 Monkhorst-Pack grid of k-points [48] for the numerical integration in reciprocal space. The Kohn-Sham orbitals were expanded in a plane-wave basis set using a kinetic energy cut off of 400 eV. Larger cut offs and finer k-meshes were also examined and yielded the same trends as reported below.
The conjugate-gradient (CG) method was used for geometry optimizations, and the minimum energy structure was identified when the change in the total energy and the forces acting on each ion became smaller than 10–5 eV and 10–3 eVÅ–1, respectively. The transition states were located using the climbing image-nudged elastic band method (CI-NEB) [49, 50], where six images were placed between the reactant and product geometries. A –5.0 eVÅ–2 spring force constant between images was used to relax them until the maximum force acting on each ion was less than 0.1 eVÅ–1. Calculations using a stricter force convergence criterion of 0.01 eVÅ–1 changed the activation energy by less than 0.2 meV.
Using the same convergence criteria, the dimer approach [51] was also employed to locate the transition states for R4 and R8 on the Ni(111) surface, R8 and R9 on the Ni(100) surface and R4 on the Ni(110) surface (see Section 2.3). In this method, the most stable configuration of the reactant molecule on the surface is determined using a standard minimization method before searching for a nearby saddle point. The dimer method was used for these elementary steps since it converged to the TS structure in a more computationally efficient way compared to the CI-NEB method.
Vibrational frequencies were calculated using ionic displacements of 0.01 Å. Only the adsorbates were allowed to move, and the frequencies were obtained by diagonalizing the finite difference Hessian matrix. The calculations confirmed that the stationary structures were minimum energy
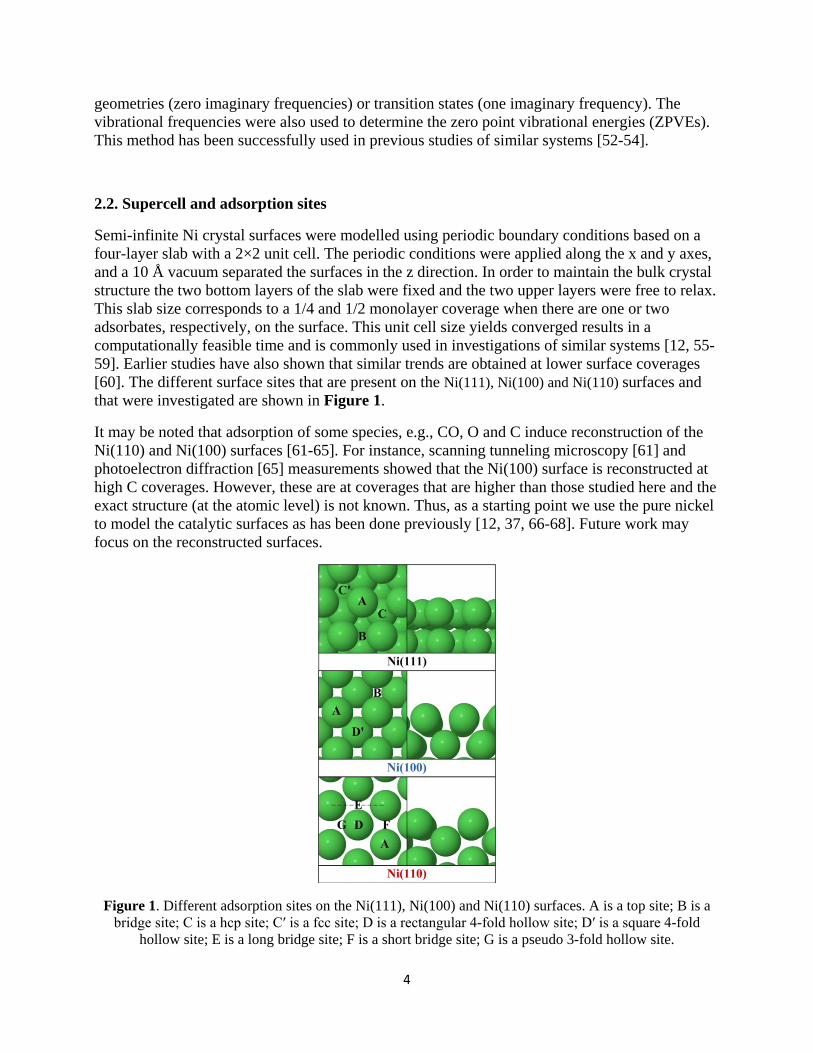
4
geometries (zero imaginary frequencies) or transition states (one imaginary frequency). The vibrational frequencies were also used to determine the zero point vibrational energies (ZPVEs). This method has been successfully used in previous studies of similar systems [52-54].
2.2. Supercell and adsorption sites
Semi-infinite Ni crystal surfaces were modelled using periodic boundary conditions based on a four-layer slab with a 2×2 unit cell. The periodic conditions were applied along the x and y axes, and a 10 Å vacuum separated the surfaces in the z direction. In order to maintain the bulk crystal structure the two bottom layers of the slab were fixed and the two upper layers were free to relax. This slab size corresponds to a 1/4 and 1/2 monolayer coverage when there are one or two adsorbates, respectively, on the surface. This unit cell size yields converged results in a computationally feasible time and is commonly used in investigations of similar systems [12, 55-59]. Earlier studies have also shown that similar trends are obtained at lower surface coverages [60]. The different surface sites that are present on the Ni(111), Ni(100) and Ni(110) surfaces and that were investigated are shown in Figure 1.
It may be noted that adsorption of some species, e.g., CO, O and C induce reconstruction of the Ni(110) and Ni(100) surfaces [61-65]. For instance, scanning tunneling microscopy [61] and photoelectron diffraction [65] measurements showed that the Ni(100) surface is reconstructed at high C coverages. However, these are at coverages that are higher than those studied here and the exact structure (at the atomic level) is not known. Thus, as a starting point we use the pure nickel to model the catalytic surfaces as has been done previously [12, 37, 66-68]. Future work may focus on the reconstructed surfaces.
Figure 1. Different adsorption sites on the Ni(111), Ni(100) and Ni(110) surfaces. A is a top site; B is a bridge site; C is a hcp site; C′ is a fcc site; D is a rectangular 4-fold hollow site; D′ is a square 4-fold
hollow site; E is a long bridge site; F is a short bridge site; G is a pseudo 3-fold hollow site.
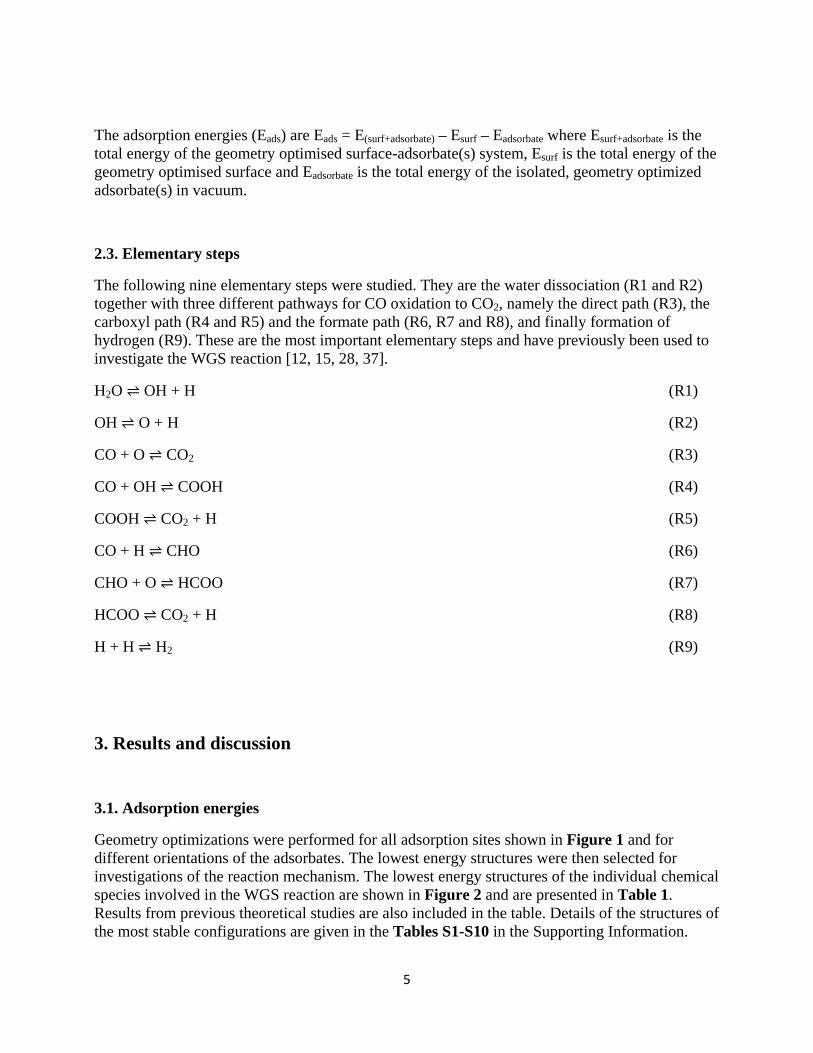
5
The adsorption energies (Eads) are Eads = E(surf+adsorbate) – Esurf – Eadsorbate where Esurf+adsorbate is the total energy of the geometry optimised surface-adsorbate(s) system, Esurf is the total energy of the geometry optimised surface and Eadsorbate is the total energy of the isolated, geometry optimized adsorbate(s) in vacuum.
2.3. Elementary steps
The following nine elementary steps were studied. They are the water dissociation (R1 and R2) together with three different pathways for CO oxidation to CO2, namely the direct path (R3), the carboxyl path (R4 and R5) and the formate path (R6, R7 and R8), and finally formation of hydrogen (R9). These are the most important elementary steps and have previously been used to investigate the WGS reaction [12, 15, 28, 37].
H2O ⇌ OH + H (R1)
OH ⇌ O + H (R2)
CO + O ⇌ CO2 (R3)
CO + OH ⇌ COOH (R4)
COOH ⇌ CO2 + H (R5)
CO + H ⇌ CHO (R6)
CHO + O ⇌ HCOO (R7)
HCOO ⇌ CO2 + H (R8)
H + H ⇌ H2 (R9)
3. Results and discussion
3.1. Adsorption energies
Geometry optimizations were performed for all adsorption sites shown in Figure 1 and for different orientations of the adsorbates. The lowest energy structures were then selected for investigations of the reaction mechanism. The lowest energy structures of the individual chemical species involved in the WGS reaction are shown in Figure 2 and are presented in Table 1. Results from previous theoretical studies are also included in the table. Details of the structures of the most stable configurations are given in the Tables S1-S10 in the Supporting Information.
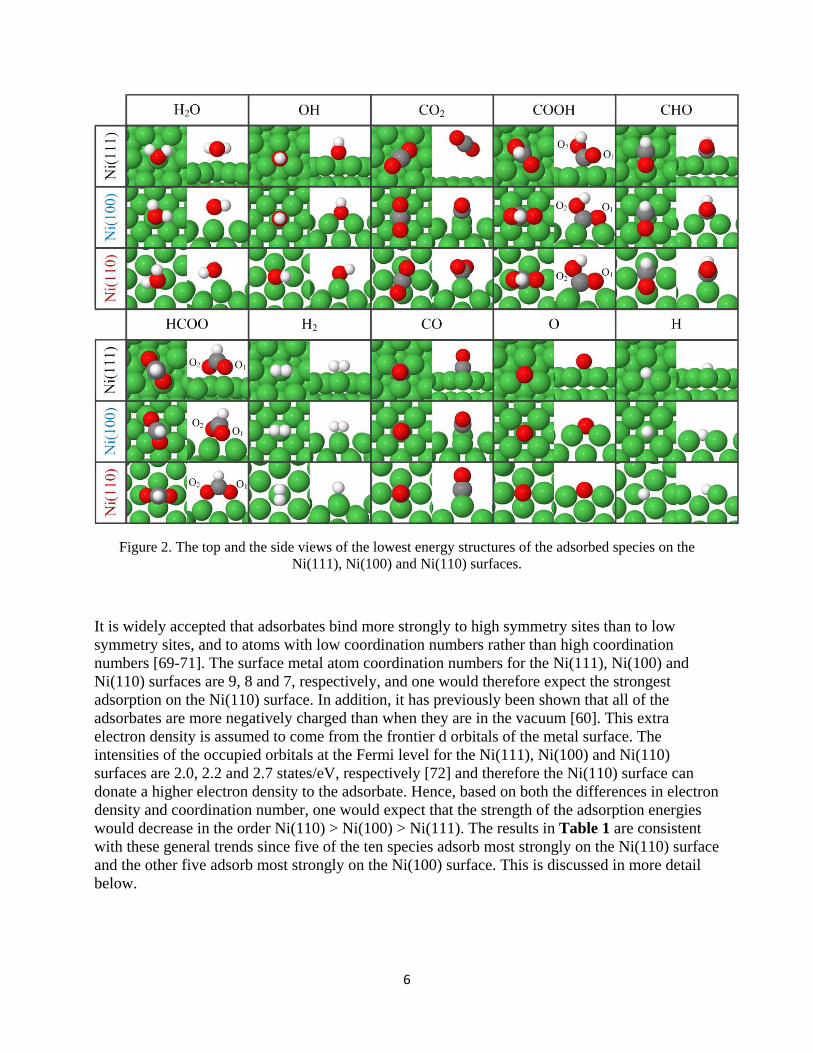
6
Figure 2. The top and the side views of the lowest energy structures of the adsorbed species on the Ni(111), Ni(100) and Ni(110) surfaces.
It is widely accepted that adsorbates bind more strongly to high symmetry sites than to low symmetry sites, and to atoms with low coordination numbers rather than high coordination numbers [69-71]. The surface metal atom coordination numbers for the Ni(111), Ni(100) and Ni(110) surfaces are 9, 8 and 7, respectively, and one would therefore expect the strongest adsorption on the Ni(110) surface. In addition, it has previously been shown that all of the adsorbates are more negatively charged than when they are in the vacuum [60]. This extra electron density is assumed to come from the frontier d orbitals of the metal surface. The intensities of the occupied orbitals at the Fermi level for the Ni(111), Ni(100) and Ni(110) surfaces are 2.0, 2.2 and 2.7 states/eV, respectively [72] and therefore the Ni(110) surface can donate a higher electron density to the adsorbate. Hence, based on both the differences in electron density and coordination number, one would expect that the strength of the adsorption energies would decrease in the order Ni(110) > Ni(100) > Ni(111). The results in Table 1 are consistent with these general trends since five of the ten species adsorb most strongly on the Ni(110) surface and the other five adsorb most strongly on the Ni(100) surface. This is discussed in more detail below.

7
Table 1. Adsorption energies (eV) and adsorption sites of the chemical species involved in the WGS reaction.a The data for CHO, HCOO and CO are taken from our previous studies [73, 74].
Species Surface Site Eads Previous results for Eads
H2O Ni(111) O: A −0.19 −0.25b, −0.32c, −0.17d, −0.47e, −0.29f Ni(100) O: A −0.27 −0.26d Ni(110) O: G −0.40 −0.54c
OH Ni(111) O: C′ −3.10 −3.14b, −3.31d, −3.34e, −3.42f, −3.05k, −2.98s Ni(100) O: D′ −3.30 −3.57d, −3.36g, −3.26k, −3.31s Ni(110) O: F −3.48
CO2 Ni(111) C: B −0.03* −0.12e, −0.02f, +0.31h, +0.03k Ni(100) C: A −0.06 −0.08h Ni(110) C: F −0.25 −0.32i, −0.22r
COOH Ni(111) C: A −2.17 −2.54e, −2.26f, −2.25k, −2.25s Ni(100) C: B −2.70 −2.62s Ni(110) C: E −2.55
CHO[73] Ni(111) C: B, O: A −2.19 −2.49e, −2.41g, −2.26f, −1.99k Ni(100) C: B, O: B −2.76 −3.15g, −2.51k Ni(110) C: F, O: A −2.42
HCOO[73] Ni(111) O1: A, O2: A −2.69 −0.86j, −3.02e, −2.80s Ni(100) O1: A, O2: B −2.88 −1.07j, −3.27s Ni(110) O1: A, O2: A −3.29 −1.60j, −3.42t
H2 Ni(111) A −0.17 −0.22f, −1.17l Ni(100) A −0.22 −1.09l Ni(110) A −0.33 −0.89l
CO[74] Ni(111) C: C −1.89 −2.32g, −1.56k, −2.85q, −1.90s Ni(100) C: D′ −1.96 −2.26g, −1.53k, −3.05q, −2.04s Ni(110) C: F −1.89 −1.42m, −1.58n
O Ni(111) C′ −5.30 −5.50b, −5.49c, −4.81e, −5.14k, −6.68q, −4.94s Ni(100) D′ −5.62 −5.46k, −6.97q, −5.38s Ni(110) E −4.97 −5.49c
H Ni(111) C′ −2.65 −2.78b, −2.80d, −2.77e, −2.95g, −2.64k, −0.60o, −0.49p, −2.81s Ni(100) D′ −2.70 −2.80d, −2.83g, −2.64k, −0.57o, −0.55p, −2.78s Ni(110) G −2.51 −0.45o, −0.37p
a The adsorption energies are ZPVE-corrected values. b Reference [75] (GGA-PBE calculations using a 2×2 unit cell and three layer slab). c Reference [52] (GGA-PW91 calculations using a 2×2 unit cell and four layer slab). d Reference [76] (GGA-PBE calculations using a 3×2 unit cell and three layer slab). e Reference [12] (GGA-PBE calculations using a 2×2 unit cell and four layer slab). f Reference [27] (GGA-PBE calculations using a 3×3 unit cell and four layer slab). g Reference [68] (GGA-PBE calculations using a 3×2 unit cell and three layer slab). h Reference [55] (GGA-PBE calculations using a 2×2 unit cell and three layer slab). i Reference [20] (GGA-PBE calculations using a3×2 unit cell and five layer slab). j Reference [71] (GGA-PBE calculations using a 3×2 unit cell and three layer slab). k Reference [58] (GGA-RPBE calculations using a 2×2 unit cell and four layer slab).l Reference [77] (GGA-PBE calculations using a 2×2 unit cell and four layer slab). m Reference [78] (GGA-PW91 calculations using a 2×1 unit cell and four layer slab). n Reference [79] (GGA-PW91 calculations using a 1×1 unit cell and five layer slab). o Reference [59] (GGA-PW91 calculations using a 2×2 unit cell and four layer slab). p Reference [80] (GGA-PW91 calculations using a 2×2 unit cell and four layer slab). q Reference [81] (GGA-PBE calculations using a 2×2 unit cell and four layer slab). r Reference [82] (GGA-PBE calculations using a 2×2 unit cell and five layer slab). s Reference [83] (GGA-PW91 calculations using a 3×3 unit cell and three-four layer slab). t Reference [20] (GGA-PBE calculations using a 3×2 unit cell and three-four layer slab). * This is the value before ZPVE corrections.

8
As shown in Table 1, water binds most strongly to the Ni(110) surface and the adsorption is via its oxygen atom on top of a Ni atom on all surfaces. This is similar to previous DFT results [12, 52, 58]. The adsorbed water molecule is tilted near parallel with the surface, which is in agreement with earlier experimental observations for Ni(110) [84-86] and Ni(111) surfaces [87]. Pangher et al. [86] used polarization-dependent surface-extended X-ray-absorption fine-structure to study the structure of water adsorbed on the Ni(110) surface. They reported that water is adsorbed via its O atom in a top site with a nearest-neighbor O-Ni separation of 2.06 Å. This is comparable to the 2.12 Å obtained in this work (see Table S1).We also obtained vibrational frequencies of 3713, 1584 and 3828 cm−1 for the symmetric stretching, bending, and the asymmetric stretching of the water molecule, which compare well with the experimental values of 3657, 1595 and 3756 cm−1 obtained by Tennyson et al. [88].
It may be noted that the present calculations were performed with the standard DFT-GGA approach which is known to give accurate descriptions of the relevant systems [12, 15, 26, 37, 40, 52, 53, 68, 75, 77, 89-91]. However, this approach does not include dispersion forces, which are expected to affect the absolute binding energies, especially for weakly adsorbed species such as H2O and CO2. The DFT-GGA binding energies for H2O and CO2 presented here may therefore significantly underestimate the real binding energies. For example Dietz et al. [92] included the dispersion forces in their DFT calculations and obtained an adsorption energy of –0.27 eV for CO2 on the Ni(111) surface compared to −0.03 eV obtained here. However, it is important to note that these differences do not affect the conclusions presented in this study.
Similarly to water, OH binds most strongly to the Ni(110) surface and the adsorption is via the oxygen atom. The calculated O-H and OH-surface stretching frequencies on the Ni(110) surface are 3659 and 437 cm −1, respectively, which are in good agreement with the experimental values of 3580 and 450 cm−1 obtained using HREELS [93]. Also, experimental observations predicted that the OH is inclined on the Ni(110) surface which is consistent with the structure obtained here [93]. The adsorption energies obtained for OH agree with those previously obtained from theoretical studies (see Table 1). However, the values are higher than the activation energies (1.17-1.78 eV) observed experimentally for OH desorption from polycrystalline nickel [94]. The reason for this discrepancy is not known.
According to DFT-GGA, the CO2 molecule does not bind strongly to the Ni(111) and Ni(100) surfaces (although, as discussed above, dispersion forces are not included), and slightly different adsorbate structures are found on the three surfaces. When it is initially placed close to and parallel to the Ni(111) surface (initial surface-CO2 separations from 3 to 7 Å were studied) it moves away from the surface during geometry optimization. An adsorption energy of −0.03 eV was calculated for this surface. It should be noted that this value is without ZPVE corrections since two imaginary frequencies were found for the adsorbed structure. However, the ZPVE corrections do not affect the activation barrier for the production of CO2 (the only reaction that includes single CO2 species, i.e., R3), and the effect on the reaction and adsorption energies is not significant since both modes have very low frequencies. It can also be noted that a second stable structure for CO2 (with no imaginary frequencies) was found on the Ni(111) surface where carbon dioxide has a bent geometry with the carbon atom pointing towards the surface. However, this structure has an adsorption energy of +0.25 eV, which shows that it is a local minimum energy site (endothermic adsorption). This is similar to the results obtained by Dietz et al. [92]. They included the dispersion forces in their DFT calculations and reported that CO2 is weakly

9
interacting with the Ni(111) surface with an adsorption energy of −0.27 eV (compared to −0.03 eV obtained here). They also found a metastable structure where the adsorbed CO2 is bent with an O-C-O angle of 133° (compared to 138° obtained here for the second stable structure). This metastable structure has an adsorption energy of −0.07 eV (compared to +0.25 eV obtained here). Wang et al. [55] also found a similar structure with a positive adsorption energy. The results of the weakly adsorbed structures (and not of the local minimum energy site) are more relevant to the current studies and are therefore reported here. In addition, it can be noted that the reaction to produce the CO2 at both of these adsorption sites has the same transition state structure (which is investigated in Section 3.3). Therefore the reaction dynamics is the same irrespective to which product is selected. Similarly to the results reported here, Catapan et al. [12] and Zhu et al. [27] found a small exothermic adsorption energy for CO2 on the Ni(111) surface. Zhu et al. also reported physisorbed CO2 on the Ni(111) surface with an energy of −0.02 eV. The physisorbed structure on the Ni(111) surface is also consistent with experimental observations by Heiland et al. [95] where they used fast ion beam and fast molecular beam techniques to investigate CO2 dissociation on this surface. They did not detect any chemisorbed CO2 on this surface at low temperatures. The adsorption energy on the Ni(110) surfaces is −0.25 eV. Experimental observations also support the results presented here since the Ni(110) surface is the only transition metal low Miller index surface to which CO2 chemically binds under Ultra High Vacuum (UHV) conditions [96, 97].
A slightly different geometry is obtained for CO2 when it is physisorbed on the Ni(100) and Ni(110) surfaces. It has a bent geometry on both of these surfaces with the carbon atom pointing towards the surface. The CO2 is adsorbed on the short-bridge site on the Ni(110) surface with the molecular plane perpendicular to the surface. This is consistent with previous experimental and theoretical observations [20, 96].
The binding energies for COOH and CHO are largest on the Ni(100) surface. The reason that they bind stronger to this surface than the Ni(110) surface could be due to the orientation of these molecules on the surface. For CHO on the Ni(100) surface, the C-O bond is almost parallel to the surface, whereas the carbon atom points towards the surface on the other two surfaces. The angle between the C-O bond and the surface plane is 5.6, 10.7 and 16.1 degrees on the Ni(100), Ni(110) and Ni(111) surfaces, respectively. For COOH, the angle between the C-O1 bond (see Figure 2) and the surface plane is 2.5, 4.5 and 5.7 degrees on the Ni(100), Ni(110) and Ni(111) surfaces, respectively. Zhou et al. [68] found similar trends for CHO adsorption and reported adsorption energies of –2.41 and –3.15 eV on Ni(111) and Ni(100) surfaces, respectively.
The formate intermediate binds strongest to the Ni(110) surface and is adsorbed via its two oxygen atoms on all three surfaces. Experimental studies support these results since the bidentately adsorbed formate is the species that is observed in high concentrations [15]. On the Ni(111) and the Ni(110) surfaces, both oxygen atoms are adsorbed on the top sites with similar distances while on the Ni(110), one oxygen atom (O2 in Figure 2) is on top site and the other one (O1 in Figure 2) is on the bridge site and is closer to the surface. The O-C-H angles are similar on both Ni(111) and Ni(110) surfaces but not on the Ni(100) surface. The O-C-O angle follows the same order as the adsorption energy, i.e., Ni(110) > Ni(100 > Ni(111).
The experimentally observed vibrational frequencies for HCOO on Ni(110) reported by Haq et al. [98] are in good agreement with those calculated in this work. They observed bidentately adsorbed HCOO and reported 2840 cm−1 as the C-H bond stretching frequency (compared to

10
2961 cm−1 calculated here), 1600 cm−1 for the asymmetric vibration of the O-C-O bond (compared to 1504 cm−1 calculated here), 1352 cm−1 for the O-C-O symmetric vibration (compared to 1296 cm−1 calculated here), 1384 cm−1 for the H-C-O angle vibration (compared to 1344 cm−1 calculated here), 1000 cm−1 for the C-H wagging vibration (compared to 961 cm−1 calculated here) and 770 cm−1 as the frequency for the H-C-O angle (compared to 710 cm−1 calculated here). A C-O-C angle of 129.8° was obtained on the Ni(110) surface, which is similar to that reported in XPD measurements (124°) by Emundts et al. [99]. Pang et al. [71] used DFT to calculate HCOO adsorption energies of –0.86, –1.07 and –1.60 eV on the Ni(111), Ni(100) and Ni(110) surfaces, respectively. They defined the binding energy with respect to the gas phase CO2 and ½H2 molecules. Using the same method we obtain adsorption energies of –0.46, –0.65 and –1.06 eV for the Ni(111), Ni(100) and Ni(110) surfaces, respectively, which has similar trends compared to their results. However the values are about 0.5 eV lower. The reason for the discrepancy between those results and the data presented here could be the larger unit cell that they used in their calculations, and thus their calculated binding energies are expected to be lower than the values obtained in this study. In this work, the energy calculated for isolated CO2 is – 22.67 eV and for H2 it is −6.76 eV.
The hydrogen molecule binds to the top site, A, on all surfaces and binds strongest to the Ni(110) surface. The adsorption energies are smaller than those calculated by Wang et al. [77]. This is expected since they defined the binding energy of H2 as Eads of hydrogen = 2EH/slab – [EHydrogen + 2Eslab], where EH/slab is the total energy of the slab with the chemisorbed atomic H on the surface, EHydrogen is the energy of the H2 molecule and Eslab is the energy of the slab. They reported adsorption energies of –1.17, –1.09 and –0.89 eV for hydrogen on the Ni(111), Ni(100) and Ni(110) surfaces, respectively. Using their method we obtain adsorption energies of –1.15, –1.11 and –0.82 eV for the Ni(111), Ni(100) and Ni(110) surfaces, respectively. These numbers are also in good agreement with previously reported experimental data, i.e. –1.00, –1.00 and –0.93 eV for the Ni(111), Ni(100) and Ni(110) surfaces, respectively [77, 100].
CO binds to the surface via its carbon atom and the binding energy is insensitive to the surface geometry. This is similar to experimental observations by Stuckless et al. [101]. They used calorimetry and obtained adsorption energies of –1.35, –1.27 and –1.37 eV on the Ni(111), Ni(100) and Ni(110) surfaces, respectively. Calculated heats of adsorption in this work are about 0.5 eV higher than the experimental values. This difference may be due to the inability of the PBE functional to accurately predict CO binding energies [81]. Binding energies calculated with the alternative revised version of the PBE functional, RPBE [81], by Blaylock et al. [58] are closer to the experimental values. Both Blaylock et al. [58] and Zhou et al. [68] calculated a slightly higher adsorption energy on the Ni(111) surface than on Ni(100). However, the trends observed here are similar to those obtained by Hammer et al. [81]. The lowest energy adsorption site for CO on the Ni(110) surface was on the short bridge site which agrees with experimental observations by Zhao et al. [102]. They used low-energy electron diffraction (LEED) to measure a Ni-C distance of 1.85 Å and a C-O bond length of 1.15 Å for the adsorbed CO, which are in good agreement with our results, i.e., 1.87 Å and 1.18 Å, respectively (see Table S10). The highest adsorption energy on the Ni(111) surface is in the three fold coordinated hollow site, C, which is consistent with the surface-extended x-ray-absorption fine structure (SEXAFS) studies by Becker et al. [103]. They also reported a C-O bond length of 1.19 Å for the adsorbed carbon monoxide, which is the same as that calculated here (see Table S10).

11
Oxygen and hydrogen bind stronger to the Ni(100) surface than to the other surfaces. The trends obtained here are in agreement with previous calculations. In agreement with our results, Fajín et al. [52] reported a stronger adsorption of oxygen on the Ni(111) (−5.60 eV) than on the Ni(110) (−5.49 eV) surfaces. Similarly, Blaylock et al. [58] obtained adsorption energies of −4.81 and −5.46 eV for the Ni(111) and Ni(100) surfaces, respectively. The trends of oxygen adsorption energies are also similar to experimental adsorption energies reported by Hammer et al. [81], i.e., −4.84 and −5.41 eV for the Ni(111) and Ni(100) surfaces, respectively.
The adsorption energies for the H atom are similar to those reported previously, except for the values calculated by Kresse et al. [59] and Bhatia et al. [80] which are far lower. This is because they used half of the hydrogen molecule (H2) energy as the energy of the isolated adsorbate. Kresse et al. calculated adsorption energies of −0.60, −0.57 and −0.45 eV, and Bhatia et al. obtained −0.49, −0.55 and −0.37 eV for hydrogen atom adsorption on the Ni(111), Ni(100) and Ni(110) surfaces, respectively. Using the same method we obtain adsorption energies of –0.52, –0.57 and –0.37 eV for the Ni(111), Ni(100) and Ni(110) surfaces, respectively, which are similar to their energies. In this work, the energy calculated for isolated H2 is −6.76 eV and for atomic H it is −1.12 eV.
Christmann et al. [104] used low energy electron diffraction (LEED), thermal desorption spectroscopy (TDS) and work function measurements to study hydrogen atoms on the Ni(111) surface. They observed that H atoms occupy the three fold hollow site with a Ni-H bond length of 1.84 Å. This is in agreement with the value of 1.71 Å calculated here (see Table S10). The vibrational frequency obtained here for H at the three-fold site on the Ni(111) surface is 1159 cm−1, which is similar to the value of 1137 cm−1 obtained from neutron inelastic-scattering measurements [105]. Also, the calculated adsorption energy and Ni-H distance for the Ni(100) surface, i.e., 2.70 eV and 1.84 Å, agree well with previously reported experimental values of 2.80 eV and 1.82-1.84 Å [106].
3.2. Co-adsorption energies
The initial structures for the geometry optimizations of co-adsorbed species were obtained by placing the individual adsorbates in their minimum energy sites (shown in Figure 1). These structures were then geometry optimized, and the resulting structures with lowest energy were used to investigate the reaction mechanism. This method has been used successfully before [73, 74]. It may be noted that for some structures other co-adsorption sites were examined. However, in all cases, these structures yielded higher (less negative) total energies compared to that of the co-adsorbed species placed in their individual minimum energy sites.
The results are presented in Tables S1-S9 in the Supporting Information. Except for the oxygen on the Ni(110) surface, the co-adsorption sites are the same as those found for the isolated adsorbates. The adsorption energy for oxygen on the Ni(110) surface is the strongest at the long bridge site E, whereas the co-adsorbed O shifts from the E site to the G site for all combinations of co-adsorbed species that include an O atom.

12
3.3. Transition states and reaction energies
The activation and reaction energies of all the elementary steps (R1-R9) are summarized in Figure 3 and Table 2 together with the results from previous theoretical studies. Details of the structures of the reactants, products and transition states are given in the Supporting Information (Tables S1-S9 and Figures S1-S9).
Table 2. The activation and reaction energies (eV) and imaginary frequency (cm−1) for the elementary steps of the WGS reaction.a The data for R7 are taken from our previous study [73]. The activation and
reaction energies are for the forward reactions.
Reaction Surface Ea(eV) ∆E(eV) Freq.
R1: H2O ⇌ OH + H
Ni(111) This work 0.67 −0.20 899 Previous studies 0.90b, 0.79c, 0.71d, 0.92f −0.28b,−0.10f, −0.25e 989 c
Ni(100) This work 0.76 −0.63 459 Previous studies 0.40b, 0.74c −0.49b 1068c
Ni(110) This work 0.38 −0.56 1285 Previous studies 0.39d −0.52d 1273d
R2: OH ⇌ O + H
Ni(111) This work 0.79 −0.03 1199 Previous studies 0.85b, 1.09g, 0.85f −0.20b, 0.03g, −0.34f, −0.15e 1146e
Ni(100) This work 1.05 −0.45 1159 Previous studies 1.18b −0.31b
Ni(110) This work 0.61 0.14 493 Previous studies
R3: CO + O ⇌ CO2
Ni(111) This work 1.35 0.65* 428 Previous studies 1.53e, 1.40g, 1.54f 0.73 g, 0.28f, 0.96e 438e
Ni(100) This work 1.25 1.15 364 Previous studies
Ni(110) This work 1.57 0.72 418 Previous studies
R4: CO + OH ⇌ COOH
Ni(111) This work 1.30 0.99 286 Previous studies 1.22e, 1.45g, 1.15f 1.22g, 0.65f, 0.72e
Ni(100) This work 1.73 0.84 205 Previous studies
Ni(110) This work 1.44 1.18 290 Previous studies
R5: COOH ⇌ CO2 + H
Ni(111) This work 0.68 −0.02 1424 Previous studies 0.88e, 0.60g −0.52g, 0.08e
Ni(100) This work 1.21 0.18 1026 Previous studies
Ni(110) This work 1.07 −0.16 1656 Previous studies
R6: CO + H⇌ CHO
Ni(111) This work 1.53 1.38 290 Previous studies 1.35e, 1.47h, 1.55b, 1.40f 1.18h, 1.35b, 1.19f, 1.15e
Ni(100) This work 1.36 0.88 179 Previous studies 1.01b 0.80b
Ni(110) This work 1.29 1.13 313 Previous studies

13
R7: CHO +O ⇌ HCOO[73]
Ni(111) This work 0.67 −0.85 427 Previous studies 0.74e,0.94g −0.39g, −0.52e
Ni(100) This work 1.47 −0.10 501 Previous studies
Ni(110) This work 0.99 −0.72 431 Previous studies
R8: HCOO ⇌ CO2 + H
Ni(111) This work 2.74 0.35 1731 Previous studies 1.05e, 1.36g −0.06g, 0.34e
Ni(100) This work 2.76 0.21 1701 Previous studies
Ni(110) This work 1.07 0.43 647 Previous studies 0.95i
R9: H + H ⇌ H2
Ni(111) This work 0.81 0.84 635 Previous studies 1.19b, 1.37e, 1.18g 0.97b, 1.29e, 1.16g,
Ni(100) This work 0.88 0.90 384 Previous studies 1.19b 0.97b
Ni(110) This work 0.42 0.36 913 Previous studies
a The activation and reaction energies are ZPVE-corrected values. b Reference [58] (GGA-RPBE calculations using a 2×2 unit cell and three layer slab). c Reference [76] (GGA-RPBE calculations using a 2×2 unit cell and four layer slab). d Reference [52] (GGA-PW91 calculations using a 2×2 unit cell and four layer slab). e Reference [12] (GGA-PW91 calculations using a 2×2 unit cell and four layer slab). f Reference [26] (GGA-RPBE calculations using a 2×2 unit cell and three layer slab). g Reference [15] (GGA-PW91 calculations using a 4×4 unit cell and five slab). h Reference [91] (GGA-PBE calculations using a 2×2 unit cell and three layer slab). i Reference [20] (GGA-PBE calculations using a 3×2 unit cell and three-four layer slab). * This is the value without ZPVE corrections.
The WGS reaction starts by H2O splitting to OH and H since adsorbed carbon monoxide cannot react directly with H2O [15, 28]. The activation barrier of both water and OH splitting reactions decreases in the order Ni(100) > Ni(111) > Ni(110). The water splitting barriers are far larger than the adsorption energies for water on both the Ni(111) and Ni(100) surfaces. Therefore, even when considering the effect of dispersion forces (which are neglected in the present calculations) it is expected that most of the water molecules desorb without proceeding to OH + H species. This is consistent with experimental observations where heating a Ni(111) surface to 165 K leads to desorption of a water monolayer without formation of water splitting products [107, 108]. In contrast, the calculated binding energy is slightly higher than the splitting barrier on the Ni(110) surface. This is in agreement with experimental studies where the splitting product, OH, is observed at temperatures larger than 200 K [107]. The calculated barrier of water splitting (0.38 eV) is similar to the experimental value of 0.5 eV reported by Benndorf et al. [109] for HO-H bond breakage on the clean Ni(110) surface.
Carbon monoxide can react with the water splitting products (OH, O and H) via the direct, carboxyl and formate pathways.
In the direct (or redox) pathway (see Figure 3(a)) the CO species interacts with O to form CO2. This step is also considered as the key elementary step in the CO oxidation reaction [110-113]. The activation energies obtained for this step are 1.35 eV, 1.25 eV and 1.57 eV on the Ni(111), Ni(100) and Ni(110) surfaces, respectively. The reaction is endothermic on all surfaces. The results suggest that oxidation of CO is faster on the Ni(111) and Ni(100) surfaces compared to the Ni(110) surface.

14
Figure 3. Reaction profiles for the WGS reaction on Ni(111) (solid black line), Ni(100) (long-dashed blue line) and Ni(110) (short-dashed line) via (a) direct, (b) carboxyl and (c) formate pathways. The zero
energy reference is adsorbed water on the nickel surfaces.
In the carboxyl pathway (see Figure 3(b)), adsorbed carbon monoxide reacts with the OH species to form COOH that is bonded to the surface via its carbon atom. The calculated activation energies for this step are 1.30 eV, 1.73 eV and 1.44 eV on the Ni(111), Ni(100) and Ni(110) surfaces, respectively. The carboxyl intermediate subsequently dissociates to carbon dioxide and hydrogen with activation energies of 0.68 eV, 1.21 eV and 1.07 eV on the Ni(111), Ni(100) and Ni(110) surfaces, respectively. Both reactions are endothermic on all surfaces except COOH dissociation on the Ni(111) and the Ni(110) surfaces, which is slightly exothermic with an energy of −0.02 eV and −0.16 eV, respectively.
In the formate pathway (see Figure 3(c)) the adsorbed carbon monoxide endothermically reacts with an adsorbed hydrogen atom to produce formyl. The activation energies are 1.53 eV, 1.36 eV and 1.29 eV on the Ni(111), Ni(100) and Ni(110) surfaces, respectively. The trends presented here are the same as those reported in experimental studies, i.e., the activation energy obtained on

15
the Ni(111) surface is higher than that for the Ni(100) surface. The experimental values reported for CO hydrogenation on the Ni(111) and Ni(100) surfaces are 1.67 eV [114] and 1.07 eV [7], respectively. CHO subsequently oxidizes to formate (HCOO) with activation energies of 0.67 eV, 1.47 eV and 0.99 eV on the Ni(111), Ni(100) and Ni(110) surfaces, respectively. The reaction is exothermic on all surfaces. The formate then dissociates to CO2 and H. This step is endothermic on all surfaces with an activation barrier of 2.74 eV, 2.76 eV and 1.07 eV on the Ni(111), Ni(100) and Ni(110) surfaces, respectively. The endothermic formyl formation and its exothermic oxidation indicate that CHO is an unstable intermediate unlike HCOO, which has a high barrier for dissociation. This could be the reason that formate is the intermediate that is most frequently observed in WGS experiments [115-120].
The remaining elementary step of the WGS reaction is the formation of H2 from the adsorbed H atoms (with subsequent desorption of the H2 molecule).This step is endothermic on all surfaces and the calculated activation energies are 0.81 eV, 0.88 eV and 0.42 eV on the Ni(111), Ni(100) and Ni(110) surfaces, respectively. The calculated activation energies are slightly smaller than the reaction energies on Ni(111) and Ni(100) surfaces. However, this is within the statistical uncertainty of the method since DFT-GGA accuracy is about 0.1 eV [121]. The similarity of these energies indicates that the transition states are very late. This is in agreement with the data in Table S9 where it can be seen that the distances between the hydrogen atoms, which were initially more than 2.5 Å apart (2.5, 3.5 and 4.3 Å for the Ni(111), Ni(100) and Ni(110) surfaces, respectively) decrease to be within about 0.2 Å of the product H-H bond lengths. The similarity of Ea and ∆E has also been seen previously. Lin et al. [15] and Catapan et al. [12] found a difference of 0.03 eV and 0.08 eV between Ea and ∆E on the Ni(111) surface, respectively.
All of the imaginary vibrational frequencies obtained for the transition states are in good agreement with previously reported data, except for the water dissociation on the Ni(100) surface. Seenivasan et al. [76] reported a higher vibrational frequency compared to that obtained here. The reason for the discrepancy is not known.
The d-band centre describes the distribution of surface electronic energy levels [66, 122] and the ability to share electron density from the d-band of the metal to the adsorbate. This can explain differences in catalytic activity of the different surfaces, and it is believed that the surface is more reactive when the d-band centre is closer to the Fermi level [66, 122]. The calculated d-band centres are at –1.75, –1.98 and –2.08 eV for the Ni(110), Ni(100) and Ni(111) surfaces, respectively [72]. Therefore, the Ni(110) surface is expected to be the most reactive surface. This is the case for reactions R1, R2, R6, R8 and R9. However, for reactions R4, R5 and R7 the lowest barrier is obtained on the Ni(111) surface, and for R3 the lowest barrier is obtained on the Ni(100) surface.
It may be noted that, for any given metal, the adsorption energy of an atom is, in general, significantly dependent on the adsorption site [123]. Therefore the intensity of the occupied orbitals or the d-band center may be used to predict trends in the adsorption energy or the structure sensitivity if the adsorption site is identical on the metal surface.
3.4. Transition state scaling
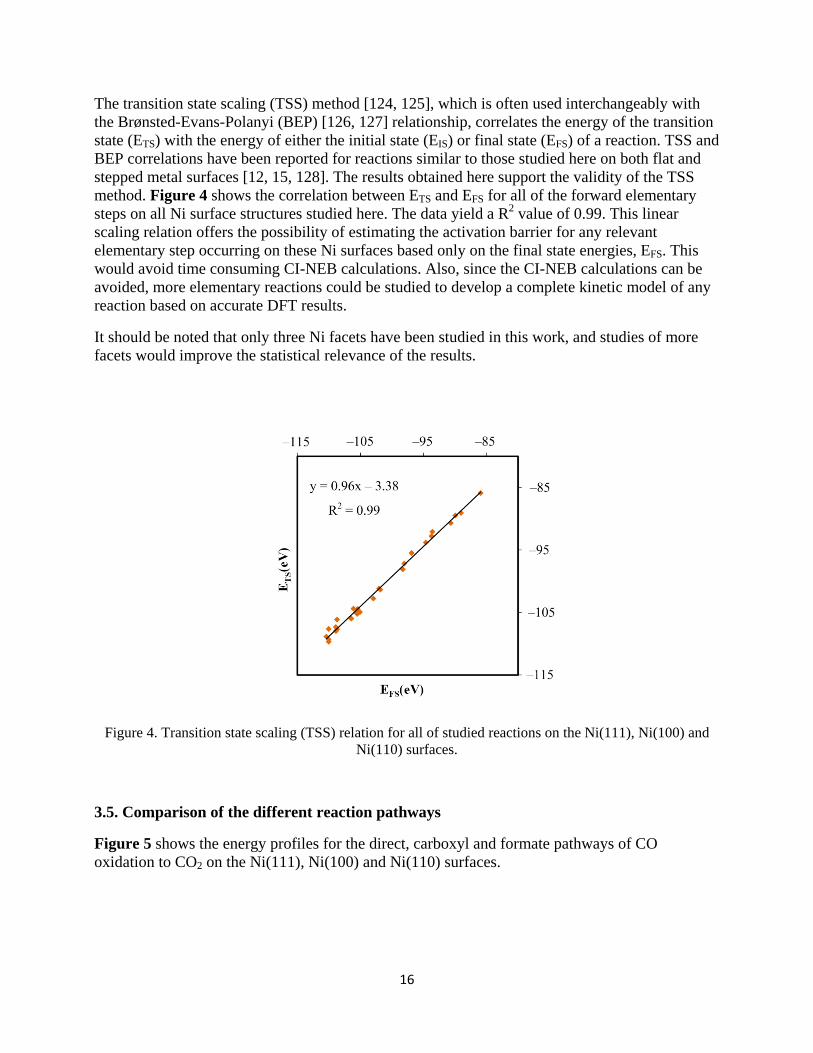
16
The transition state scaling (TSS) method [124, 125], which is often used interchangeably with the Brønsted-Evans-Polanyi (BEP) [126, 127] relationship, correlates the energy of the transition state (ETS) with the energy of either the initial state (EIS) or final state (EFS) of a reaction. TSS and BEP correlations have been reported for reactions similar to those studied here on both flat and stepped metal surfaces [12, 15, 128]. The results obtained here support the validity of the TSS method. Figure 4 shows the correlation between ETS and EFS for all of the forward elementary steps on all Ni surface structures studied here. The data yield a R2 value of 0.99. This linear scaling relation offers the possibility of estimating the activation barrier for any relevant elementary step occurring on these Ni surfaces based only on the final state energies, EFS. This would avoid time consuming CI-NEB calculations. Also, since the CI-NEB calculations can be avoided, more elementary reactions could be studied to develop a complete kinetic model of any reaction based on accurate DFT results.
It should be noted that only three Ni facets have been studied in this work, and studies of more facets would improve the statistical relevance of the results.
Figure 4. Transition state scaling (TSS) relation for all of studied reactions on the Ni(111), Ni(100) and Ni(110) surfaces.
3.5. Comparison of the different reaction pathways
Figure 5 shows the energy profiles for the direct, carboxyl and formate pathways of CO oxidation to CO2 on the Ni(111), Ni(100) and Ni(110) surfaces.

17
Figure 5. Reaction profiles for the WGS reaction on (a) Ni(111), (b) Ni(100) and (c) Ni(110) via direct (long-dashed purple line), carboxyl (short dashed green line) and formate pathways (solid orange line).
The solid black line represents the water dissociation reactions (R1 and R2). The zero energy reference is adsorbed water on the nickel surfaces.
The direct and the carboxyl pathways are preferred on the Ni(111) surface due to the lower barriers for consuming CO. Carbon dioxide is produced directly from CO via the direct pathway (R3), where the activation energy is 1.35 eV. There is a 1.30 eV barrier for producing COOH from CO and OH via the carboxyl pathway (R4), and this intermediate can then dissociate to CO2 and H (R5) with a barrier of 0.68 eV. However, the barrier for the reverse reaction of R4 is almost half of the R5 reaction barrier, i.e. 0.31 eV compared to 0.68 eV. Hence, compared to the direct pathway, the rate of formation of CO2 is lowered by the two activation barriers (R4 and R5) and the fact that the reverse of R4 (COOH → CO and OH) is faster than R5 (formation of CO2).
The barrier for CO hydrogenation (R6), which is part of the formate pathway, is about 0.2 eV higher compared to its oxidation (R3 in the direct pathway). In addition, the dissociation barrier of the produced CHO (via the reverse of reaction R6) is considerably lower than the activation

18
barrier of R7 (formate production). Also, the barrier of formate dissociation to CO2 and hydrogen is very large (2.74 eV) which makes reaction via the formate pathway very slow. Therefore, direct and carboxyl pathways are preferred and, since they have similar activation energies, are competing mechanisms. However, as described above, the direct pathway is favored and reaction R3 (CO + O → CO2) is the rate determining step on the Ni(111) surface.
The direct pathway is also preferred on the Ni(100) surface since the reaction barrier for carbon monoxide consumption in this pathway (R3: 1.25 eV) is smaller than in the formate pathway (R6: 1.36 eV) and in the carboxyl pathway (R4: 1.73 eV). The formyl produced via R6 is oxidized to HCOO (R7) which is a stable intermediate due to its high barrier for CO2 production (R8: 2.76 eV) and the large barrier for its dissociation to formyl and oxygen (reverse of R7, 1.47 eV). In addition, formyl can dissociate to CO and H (reverse of R6) instead of oxidizing to CO2 (R7), since the barrier of the dissociation (reverse of R6) is almost one third of the barrier for its oxidation (R7), i.e., 0.48 compared to 1.47 eV. Consequently, similarly to the Ni(111) surface, the direct pathway is the main route of the WGS reaction on the Ni(100) surface, and the rate limiting step is the oxidation of carbon dioxide, i.e., reaction R3.
A similar analysis for the Ni(110) surface shows that the hydrogenation of CO (R6), which occurs in the formate pathway, has a lower barrier (1.29 eV) than CO oxidation (R3, direct pathway, 1.57 eV) or CO reacting with OH (R4, carboxyl pathway, 1.44 eV). However, the CHO which is formed via reaction R6 has a large barrier (0.99 eV) to form formate via reaction R7. In addition, the barrier of the reverse of R6 (0.16 eV) is very low compared to R7 (0.99 eV) which further hinders the formation of formate via R7. This indicates that the formate pathway is not the main pathway for CO2 production.
A similar argument holds when comparing the direct and carboxyl pathways. The reaction involving CO via the carboxyl intermediate (R4) to form COOH has a barrier of 1.44 eV. An additional barrier of 1.07 eV needs to be surmounted for the COOH to form CO2. Also, the barrier for the reverse of R4 is far smaller than the barrier of R5, i.e., 0.26 eV compared to 1.07 eV. This further reduces the rate of CO2 production via the carboxyl pathway. Therefore, CO2 is primarily produced via the direct pathway, similarly to the other two surfaces, and R3 is the rate determining step.
Hence, the direct pathway is preferred on all three Ni surfaces. Also, the activation energies for this pathway decrease in the order Ni(110) (1.57 eV) > Ni(111) (1.35 eV) > Ni(100) (1.25 eV). Therefore, if O intermediates are present on the Ni surface the direct pathway on the Ni(100) will be the dominant mechanism. However, as discussed above, the barriers for H2O dissociation are larger than for H2O desorption on the Ni(111) and Ni(100) surfaces. Hence, at low H2O(g) pressures the direct pathway on the Ni(110) will dominate.
It may be noted that ideal nickel surfaces are investigated in the present study for the reasons given in Section 2.2. However, since the oxidation of CO (R3) is the rate limiting step, a buildup of oxygen atoms on the surface is expected which may lead to surface reconstruction. This needs to be studied in future work.
It also may be noted that it is difficult to determine the dominant pathway or the rate determining step based only on the DFT-calculated energetics since several pathways have been studied for the WGS reaction on these Ni surfaces. Therefore a kinetics analysis, which is about rates and not

19
only activation energies, is necessary to investigate such a complex reaction network and to find out which steps are irrelevant from a kinetics point of view. This also remains as future work.
The results obtained from the DFT calculations are consistent with those previously reported for the WGS reaction on nickel and other metal surfaces [10, 123, 129-133]. For example, Li et al. [131] measured steady state WGS kinetics from 250 to 300°C for a Ni-loaded cerium oxide catalyst. They found that the Ni-Ce(La)Ox catalyst is superior to the support itself, i.e., Ce(La)Ox. They proposed a direct reaction mechanism involving oxidation of adsorbed carbon monoxide by oxygen supplied to the metal interface by ceria. Hilaire et al. [133] studied the WGS reaction over ceria supported metallic catalysts including nickel. Their study showed that the mechanism for the reaction involves a direct pathway. Wang et al. [123] used DFT calculations to investigate the forward and reverse WGS reaction on Cu(111), Cu(100), and Cu(110) surfaces assuming the direct pathway. They also found that these reactions are sensitive to the surface structure and concluded that the difference in adsorption energy of atomic oxygen or other strongly adsorbed species in their transition state structure is important to account for the structure-sensitive reactions. Nakamura et al. [132] used LEED to investigate the kinetics and mechanisms of the WGS reaction on Cu(110) and Cu(111) surfaces. They suggested that adsorbed OH produces atomic oxygen which then reacts with CO to produce carbon dioxide via the direct mechanism. In contrast, based on their DFT results, Catapan et al. [12] suggested the carboxyl pathway as the favored route on the Ni(111) surface, since they found the lowest barrier for consuming CO is via this route. However, it is important to note that this result (the lowest barrier being in the carboxyl pathway) is also found in the present work. The difference is due to the interpretation of the results. In the present study, the reverse reaction (reverse of R4) was taken into the account which slows down the reaction via the carboxyl pathway, since it has a lower barrier compared to R5.
It can also be noted that formate is a stable intermediate on all surfaces due to its high dissociation barriers. There are two routes for formate dissociation. One is HCOO dissociation to CHO and O (reverse of R7) and the other one is dissociation to CO2 and H (R8). The barriers for both of these reactions are higher than 1 eV. The stability of HCOO on metal surfaces and its consequent role in WGS reaction is well known [18-20, 129, 130]. For instance, based on a microkinetic model of the low-temperature WGS reaction over Cu-based catalysts, Ovesen et al. [129] suggested that formate may be present on the surface, but it is a “dead end” in the WGS reaction and it is not a participating species in the conversion of CO to CO2. They suggest that its main effect is to block the active sites. This is consistent with the results reported here. Also, several spectroscopy studies report the presence of formate on Ni surfaces [17-21, 134].
In addition to the energetics, the main pathway of carbon dioxide formation is dependent on the coverage of the co-reactant, O, which favors the direct path, OH, which favors the carboxyl path, or H, which favors the formate path. Phatak et al. [135] investigated the O and OH coverage on metallic surfaces and found that OH dominates on Pt, Pd, Cu and Au, whereas both OH and O are dominant on Ni under low temperatures and high H2 partial pressures. This supports the suggestion that the energetics may be a proper indicator of the dominant pathway of the WGS reaction on Ni.
20
4. Conclusions
The effect of three different nickel surface structures on the mechanism and rate of the WGS reaction has been studied using DFT. The same models and methods were used for all surfaces to enable comparison of the effect of the surface on the reaction and activation energies. The adsorption energy for ten surface species involved in the WGS reaction were calculated together with activation barriers and reaction energies for the nine most important elementary steps.
The results indicate that the Ni(110) surface has the lowest barrier for water dissociation (reactions R1 and R2), formyl formation (R6), formate dissociation (R8) and H2 formation (R9), and that the lowest barrier for CO oxidation to CO2 (R3) is on the Ni(100) surface. Also, H2O, OH, HCOO, CO2 and H2 bind strongest to the Ni(110) surface while COOH, CHO, CO, O and H bind strongest to the Ni(100) surface. The co-adsorbed structures were also investigated. In all cases the co-adsorption sites are the same as those found for the individual adsorbates except for oxygen on the Ni(110) surface.
Analysis of energetics shows that the direct pathway is favored on all three surfaces via the reaction CO + O → CO2, which is therefore the rate limiting step. The barrier obtained for this elementary reaction decreases in the order Ni(110) > Ni(111) > Ni(100). Therefore, based on DFT calculations, if adsorbed oxygen atoms are present the Ni(100) surface is more active for the WGS reaction compared to the other surfaces. However, since the barriers for H2O dissociation are larger than for H2O desorption on the Ni(111) and Ni(100) surfaces, but not the Ni(110) surface, the direct pathway on the Ni(110) will dominate at low H2O(g) pressures.
BEP relationships are valid for these reactions on these surfaces, with an R2 value of 0.99.
The results also indicate that formate is a stable intermediate on all surfaces because of its high dissociation barriers. This could be the reason for the experimental observations of formate on Ni surfaces. Thus formate is not an active species in the conversion of CO to CO2 in the WGS reaction. The results presented here agree with data from previous studies when available.
Acknowledgments
This research is funded by Stiftelsen Föreningssparbanken Sjuhärad. The computations and simulations were performed on resources provided by the Swedish National Infrastructure for Computing (SNIC) at PDC Centre for High Performance Computing (PDC-HPC) and the Uppsala Multidisciplinary Centre for Advanced Computational Science (UPPMAX). We also acknowledge that the results of this research have been achieved using the PRACE-2IP project (FP7 RI-283493) resource Abel based in Norway at UiO.

21
References
[1] C. Higman, M. Van der Burgt, Gasification, Gulf professional publishing, Jordan Hill, Oxford, UK, 2011. [2] J. Yu, F.-J. Tian, M.C. Chow, L.J. McKenzie, C.-Z. Li, Effect of iron on the gasification of Victorian brown coal with steam: enhancement of hydrogen production, Fuel, 85 (2006) 127-133. [3] A.Y. Rozovskii, G.I. Lin, Fundamentals of methanol synthesis and decomposition, TOP CATAL, 22 (2003) 137-150. [4] S.H.D. Lee, D.V. Applegate, S. Ahmed, S.G. Calderone, T.L. Harvey, Hydrogen from natural gas: part I—autothermal reforming in an integrated fuel processor, INT J HYDROGEN ENERG, 30 (2005) 829-842. [5] D.S. Newsome, The water-gas shift reaction, Catal. Rev. - Sci. Eng., 21 (1980) 275-318. [6] J. Sehested, Four challenges for nickel steam-reforming catalysts, Catal. Today, 111 (2006) 103-110. [7] D.W. Goodman, R.D. Kelley, T.E. Madey, J.T. Yates Jr, Kinetics of the hydrogenation of CO over a single crystal nickel catalyst, J CATAL, 63 (1980) 226-234. [8] C.A. Callaghan, Kinetics and catalysis of the water-gas-shift reaction: A microkinetic and graph theoretic approach, in, Worcester Polytechnic Institute, 2006. [9] S.H. Kim, S.-W. Nam, T.-H. Lim, H.-I. Lee, Effect of pretreatment on the activity of Ni catalyst for CO removal reaction by water–gas shift and methanation, APPL CATAL B-ENVIRON, 81 (2008) 97-104. [10] Y. Li, Q. Fu, M. Flytzani-Stephanopoulos, Low-temperature water-gas shift reaction over Cu-and Ni-loaded cerium oxide catalysts, APPL CATAL B-ENVIRON, 27 (2000) 179-191. [11] K.-R. Hwang, C.-B. Lee, J.-S. Park, Advanced nickel metal catalyst for water–gas shift reaction, J POWER SOURCES, 196 (2011) 1349-1352. [12] R.C. Catapan, A.A. Oliveira, Y. Chen, D.G. Vlachos, DFT Study of the Water–Gas Shift Reaction and Coke Formation on Ni (111) and Ni (211) Surfaces, J. Phys. Chem. C, 116 (2012) 20281-20291. [13] G. Bond, Mechanisms of the gold-catalysed water-gas shift, GOLD BULL, 42 (2009) 337-342. [14] C. Ratnasamy, J.P. Wagner, Water Gas Shift Catalysis, Cat. Rev., 51 (2009) 325-440. [15] C.-H. Lin, C.-L. Chen, J.-H. Wang, Mechanistic Studies of Water–Gas-Shift Reaction on Transition Metals, J. Phys. Chem. C, 115 (2011) 18582-18588. [16] S. Hilaire, X. Wang, T. Luo, R.J. Gorte, J. Wagner, A comparative study of water-gas-shift reaction over ceria-supported metallic catalysts, Appl. Catal., A, 258 (2004) 271-276. [17] D.C. Grenoble, M.M. Estadt, D.F. Ollis, The chemistry and catalysis of the water gas shift reaction: 1. The kinetics over supported metal catalysts, J CATAL, 67 (1981) 90-102. [18] V. Sanchez-Escribano, M.A. Larrubia Vargas, E. Finocchio, G. Busca, On the mechanisms and the selectivity determining steps in syngas conversion over supported metal catalysts: An IR study, Appl. Catal., A, 316 (2007) 68-74. [19] G. Jacobs, E. Chenu, P.M. Patterson, L. Williams, D. Sparks, G. Thomas, B.H. Davis, Water-gas shift: comparative screening of metal promoters for metal/ceria systems and role of the metal, Appl. Catal., A, 258 (2004) 203-214. [20] E. Vesselli, L.D. Rogatis, X. Ding, A. Baraldi, L. Savio, L. Vattuone, M. Rocca, P. Fornasiero, M. Peressi, A. Baldereschi, R. Rosei, G. Comelli, Carbon Dioxide Hydrogenation on Ni(110), J. Am. Chem. Soc., 130 (2008) 11417-11422. [21] J. Wambach, G. Illing, H.J. Freund, CO2 activation and reaction with hydrogen on Ni(110): formate formation, CHEM PHYS LETT, 184 (1991) 239-244. [22] R.J. Madix, J.L. Gland, G.E. Mitchell, B.A. Sexton, Identification of the intermediates in the dehydration of formic acid on Ni(110) by high resolution electron energy loss vibrational spectroscopy, SURF SCI, 125 (1983) 481-489. [23] A. Yamakata, J. Kubota, J.N. Kondo, C. Hirose, K. Domen, F. Wakabayashi, In Situ Observation of the Dehydration of Formate on Ni(110), J. Phys. Chem. B, 101 (1997) 5177-5181. [24] I.N. Remediakis, F. Abild-Pedersen, J.K. Nørskov, DFT Study of Formaldehyde and Methanol Synthesis from CO and H2 on Ni(111), J. Phys. Chem. B, 108 (2004) 14535-14540. [25] H.S. Bengaard, J.K. Nørskov, J. Sehested, B.S. Clausen, L.P. Nielsen, A.M. Molenbroek, J.R. Rostrup-Nielsen, Steam Reforming and Graphite Formation on Ni Catalysts, J CATAL, 209 (2002) 365-384.

22
[26] D.W. Blaylock, T. Ogura, W.H. Green, G.J.O. Beran, Computational Investigation of Thermochemistry and Kinetics of Steam Methane Reforming on Ni(111) under Realistic Conditions, J. Phys. Chem. C, 113 (2009) 4898-4908. [27] Y.-A. Zhu, D. Chen, X.-G. Zhou, W.-K. Yuan, DFT studies of dry reforming of methane on Ni catalyst, Catal. Today, 148 (2009) 260-267. [28] S.-C. Huang, C.-H. Lin, J.H. Wang, Trends of Water Gas Shift Reaction on Close-Packed Transition Metal Surfaces, J. Phys. Chem. C, 114 (2010) 9826-9834. [29] N. Schumacher, A. Boisen, S. Dahl, A.A. Gokhale, S. Kandoi, L.C. Grabow, J.A. Dumesic, M. Mavrikakis, I. Chorkendorff, Trends in low-temperature water–gas shift reactivity on transition metals, J CATAL, 229 (2005) 265-275. [30] R.M. Watwe, H.S. Bengaard, J.R. Rostrup-Nielsen, J.A. Dumesic, J.K. Nørskov, Theoretical Studies of Stability and Reactivity of CHx Species on Ni(111), J CATAL, 189 (2000) 16-30. [31] J. Rostrup-Nielsen, J.K. Nørskov, Step sites in syngas catalysis, TOP CATAL, 40 (2006) 45-48. [32] F. Abild-Pedersen, O. Lytken, J. Engbæk, G. Nielsen, I. Chorkendorff, J.K. Nørskov, Methane activation on Ni(111): Effects of poisons and step defects, SURF SCI, 590 (2005) 127-137. [33] X.-Y. Pang, C. Wang, Y.-H. Zhou, J.-M. Zhao, G.-C. Wang, DFT study of the structure sensitivity for the adsorption of methyl, methoxy, and formate on Ni(111), Ni(100), and Ni(110) surfaces, J MOL STRUC-THEOCHEM, 948 (2010) 1-10. [34] D.-B. Cao, Y.-W. Li, J. Wang, H. Jiao, CO2 dissociation on Ni(211), SURF SCI, 603 (2009) 2991-2998. [35] G. Peng, S.J. Sibener, G.C. Schatz, S.T. Ceyer, M. Mavrikakis, CO2 Hydrogenation to Formic Acid on Ni(111), J. Phys. Chem. C, 116 (2011) 3001-3006. [36] T. Bunluesin, R.J. Gorte, G.W. Graham, Studies of the water-gas-shift reaction on ceria-supported Pt, Pd, and Rh: implications for oxygen-storage properties, APPL CATAL B-ENVIRON, 15 (1998) 107-114. [37] J.L. Fajín, M. Cordeiro, F. Illas, J.R. Gomes, Influence of step sites in the molecular mechanism of the water gas shift reaction catalyzed by copper, J CATAL, 268 (2009) 131-141. [38] J.H. Pazmiño, M. Shekhar, W.D. Williams, M.C. Akatay, J.T. Miller, W.N. Delgass, F.H. Ribeiro, Metallic Pt as active sites for the water–gas shift reaction on alkali-promoted supported catalysts, J CATAL, 286 (2012) 279-286. [39] L.C. Grabow, A.A. Gokhale, S.T. Evans, J.A. Dumesic, M. Mavrikakis, Mechanism of the Water Gas Shift Reaction on Pt: First Principles, Experiments, and Microkinetic Modeling, J. Phys. Chem. C, 112 (2008) 4608-4617. [40] J.L.C. Fajín, M.N.D.S. Cordeiro, F. Illas, J.R.B. Gomes, Influence of step sites in the molecular mechanism of the water gas shift reaction catalyzed by copper, J CATAL, 268 (2009) 131-141. [41] G. Kresse, J. Hafner, Ab initio molecular dynamics for liquid metals, PHYS REV B, 47 (1993) 558. [42] G. Kresse, J. Hafner, Ab initio molecular-dynamics simulation of the liquid-metal–amorphous-semiconductor transition in germanium, PHYS REV B, 49 (1994) 14251. [43] G. Kresse, J. Furthmüller, Efficiency of ab-initio total energy calculations for metals and semiconductors using a plane-wave basis set, COMP MATER SCI, 6 (1996) 15-50. [44] G. Kresse, J. Furthmüller, Efficient iterative schemes for ab initio total-energy calculations using a plane-wave basis set, PHYS REV B, 54 (1996) 11169. [45] J.P. Perdew, K. Burke, M. Ernzerhof, Generalized gradient approximation made simple, PHYS REV LETT, 77 (1996) 3865. [46] Y. Pan, H. Zhang, D. Shi, J. Sun, S. Du, F. Liu, H.j. Gao, Highly Ordered, Millimeter-Scale, Continuous, Single-Crystalline Graphene Monolayer Formed on Ru (0001), ADV MATER, 21 (2009) 2777-2780. [47] P.E. Blöchl, Projector augmented-wave method, PHYS REV B, 50 (1994) 17953. [48] H.J. Monkhorst, J.D. Pack, Special points for Brillouin-zone integrations, PHYS REV B, 13 (1976) 5188-5192. [49] G. Henkelman, B.P. Uberuaga, H. Jónsson, A climbing image nudged elastic band method for finding saddle points and minimum energy paths, J CHEM PHYS, 113 (2000) 9901. [50] G. Henkelman, H. Jónsson, Improved tangent estimate in the nudged elastic band method for finding minimum energy paths and saddle points, J CHEM PHYS, 113 (2000) 9978. [51] G. Henkelman, H. Jónsson, A dimer method for finding saddle points on high dimensional potential surfaces using only first derivatives, J CHEM PHYS, 111 (1999) 7010-7022. [52] J.L. Fajín, M. Cordeiro, F. Illas, J.R. Gomes, Descriptors controlling the catalytic activity of metallic surfaces toward water splitting, J CATAL, 276 (2010) 92-100.

23
[53] J.L. Fajín, M. Cordeiro, F. Illas, J.R. Gomes, Generalized Brønsted–Evans–Polanyi relationships and descriptors for O–H bond cleavage of organic molecules on transition metal surfaces, J CATAL, 313 (2014) 24-33. [54] K. Shojaee, A. Montoya, B.S. Haynes, Insight into oxygen stability and vacancy formation on Co3O4 model slabs, COMP MATER SCI, 72 (2013) 15-25. [55] S.-G. Wang, D.-B. Cao, Y.-W. Li, J. Wang, H. Jiao, Chemisorption of CO2 on nickel surfaces, J. Phys. Chem. B, 109 (2005) 18956-18963. [56] I. Ciobica, F. Frechard, R. Van Santen, A. Kleyn, J. Hafner, A DFT study of transition states for CH activation on the Ru (0001) surface, J. Phys. Chem. B, 104 (2000) 3364-3369. [57] V. Ledentu, W. Dong, P. Sautet, Heterogeneous catalysis through subsurface sites, J. Am. Chem. Soc., 122 (2000) 1796-1801. [58] D.W. Blaylock, Y.-A. Zhu, W.H. Green, Computational Investigation of the Thermochemistry and Kinetics of Steam Methane Reforming Over a Multi-Faceted Nickel Catalyst, TOP CATAL, 54 (2011) 828-844. [59] G. Kresse, J. Hafner, First-principles study of the adsorption of atomic H on Ni (111),(100) and (110), SURF SCI, 459 (2000) 287-302. [60] A. Mohsenzadeh, A. Borjesson, J.-H. Wang, T. Richards, K. Bolton, The Effect of Carbon Monoxide Co-Adsorption on Ni-Catalysed Water Dissociation, INT J MOL SCI, 14 (2013) 23301-23314. [61] C. Klink, L. Olesen, F. Besenbacher, I. Stensgaard, E. Laegsgaard, N.D. Lang, Interaction of C with Ni(100): Atom-resolved studies of the ``clock'' reconstruction, PHYS REV LETT, 71 (1993) 4350-4353. [62] W. Daum, S. Lehwald, H. Ibach, Surface phonon dispersion and adsorbate induced reconstruction of Ni(100), SURF SCI, 178 (1986) 528-536. [63] J.H. Onuferko, D.P. Woodruff, B.W. Holland, Leed structure analysis of the Ni{100} (2 × 2)C (p4g) structure; A case of adsorbate-induced substrate distortion, SURF SCI, 87 (1979) 357-374. [64] K.F. Peters, C.J. Walker, P. Steadman, O. Robach, H. Isern, S. Ferrer, Adsorption of carbon monoxide on Ni (110) above atmospheric pressure investigated with surface X-ray diffraction, PHYS REV LETT, 86 (2001) 5325. [65] R. Terborg, J.T. Hoeft, M. Polcik, R. Lindsay, O. Schaff, A.M. Bradshaw, R.L. Toomes, N.A. Booth, D.P. Woodruff, E. Rotenberg, J. Denlinger, The coverage dependence of the local structure of C on Ni(100): a structural precursor to adsorbate-induced reconstruction, SURF SCI, 446 (2000) 301-313. [66] J. Li, E. Croiset, L. Ricardez-Sandoval, Methane dissociation on Ni (100), Ni (111), and Ni (553): A comparative density functional theory study, J MOL CATAL A-CHEM, 365 (2012) 103-114. [67] D.C. Sorescu, J. Lee, W.A. Al-Saidi, K.D. Jordan, Coadsorption properties of CO2 and H2O on TiO2 rutile (110): A dispersion-corrected DFT study, J CHEM PHYS, 137 (2012) -. [68] Y.-H. Zhou, P.-H. Lv, G.-C. Wang, DFT studies of methanol decomposition on Ni (100) surface: Compared with Ni (111) surface, J MOL CATAL A-CHEM, 258 (2006) 203-215. [69] F. Delbecq, P. Sautet, Low-temperature adsorption of formaldehyde on a platinum (111) surface. A theoretical study, Langmuir, 9 (1993) 197-207. [70] R. Smoluchowski, Anisotropy of the electronic work function of metals, Phys. Rev., 60 (1941) 661. [71] X.-Y. Pang, C. Wang, Y.-H. Zhou, J.-M. Zhao, G.-C. Wang, DFT study of the structure sensitivity for the adsorption of methyl, methoxy, and formate on Ni (111), Ni (100), and Ni (110) surfaces, J MOL STRUC-THEOCHEM, 948 (2010) 1-10. [72] A. Mohsenzadeh, K. Bolton, T. Richards, DFT study of the adsorption and dissociation of water on Ni (111), Ni (110) and Ni (100) surfaces, SURF SCI, (2014). [73] A. Mohsenzadeh, K. Bolton, T. Richards, Oxidation and dissociation of formyl on Ni(111), Ni(110) and Ni(100) surfaces: A comparative density functional theory study, TOP CATAL, (in press). [74] A. Mohsenzadeh, T. Richards, K. Bolton, A density functional theory study of hydrocarbon combustion and synthesis on Ni surfaces, J MOL MODEL, 21 (2015) 1-11. [75] M. Pozzo, G. Carlini, R. Rosei, D. Alfè, Comparative study of water dissociation on Rh (111) and Ni (111) studied with first principles calculations, J CHEM PHYS, 126 (2007) 164706. [76] H. Seenivasan, A.K. Tiwari, Water dissociation on Ni (100) and Ni (111): Effect of surface temperature on reactivity, J CHEM PHYS, 139 (2013) 174707-174707. [77] S.-G. Wang, D.-B. Cao, Y.-W. Li, J. Wang, H. Jiao, CH4 dissociation on Ni surfaces: Density functional theory study, SURF SCI, 600 (2006) 3226-3234. [78] Q. Ge, S.J. Jenkins, D.A. King, Localisation of adsorbate-induced demagnetisation: CO chemisorbed on Ni{110}, CHEM PHYS LETT, 327 (2000) 125-130.
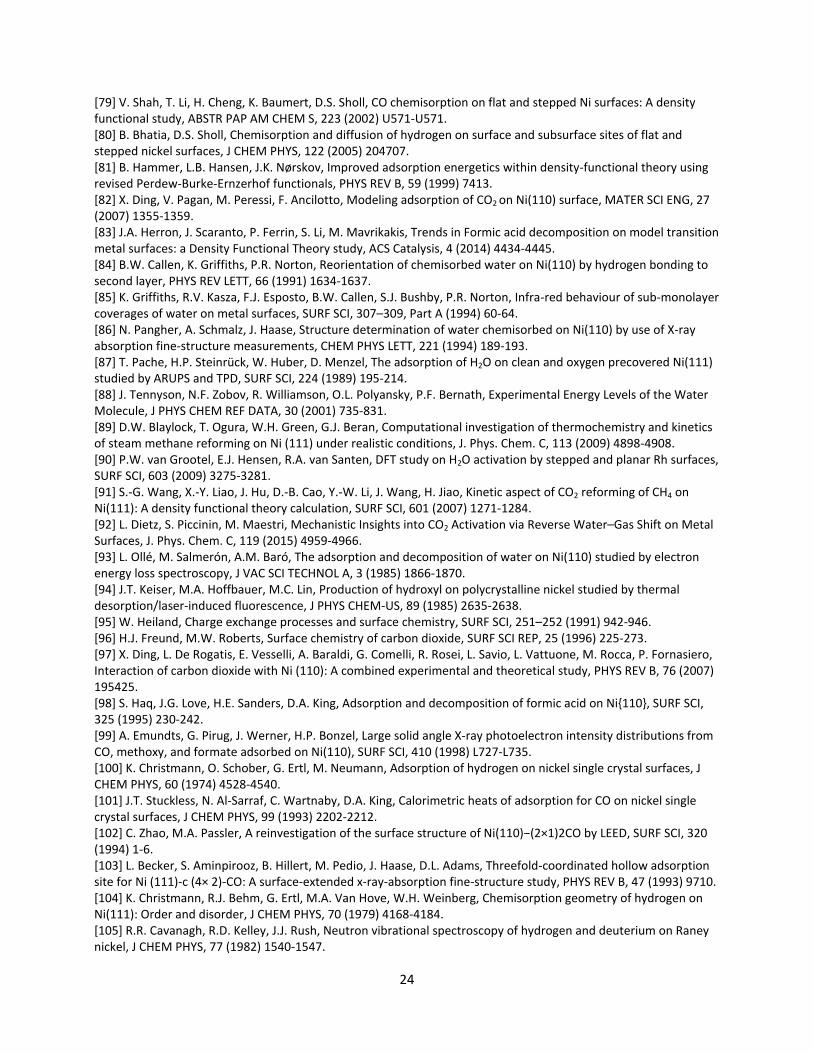
24
[79] V. Shah, T. Li, H. Cheng, K. Baumert, D.S. Sholl, CO chemisorption on flat and stepped Ni surfaces: A density functional study, ABSTR PAP AM CHEM S, 223 (2002) U571-U571. [80] B. Bhatia, D.S. Sholl, Chemisorption and diffusion of hydrogen on surface and subsurface sites of flat and stepped nickel surfaces, J CHEM PHYS, 122 (2005) 204707. [81] B. Hammer, L.B. Hansen, J.K. Nørskov, Improved adsorption energetics within density-functional theory using revised Perdew-Burke-Ernzerhof functionals, PHYS REV B, 59 (1999) 7413. [82] X. Ding, V. Pagan, M. Peressi, F. Ancilotto, Modeling adsorption of CO2 on Ni(110) surface, MATER SCI ENG, 27 (2007) 1355-1359. [83] J.A. Herron, J. Scaranto, P. Ferrin, S. Li, M. Mavrikakis, Trends in Formic acid decomposition on model transition metal surfaces: a Density Functional Theory study, ACS Catalysis, 4 (2014) 4434-4445. [84] B.W. Callen, K. Griffiths, P.R. Norton, Reorientation of chemisorbed water on Ni(110) by hydrogen bonding to second layer, PHYS REV LETT, 66 (1991) 1634-1637. [85] K. Griffiths, R.V. Kasza, F.J. Esposto, B.W. Callen, S.J. Bushby, P.R. Norton, Infra-red behaviour of sub-monolayer coverages of water on metal surfaces, SURF SCI, 307–309, Part A (1994) 60-64. [86] N. Pangher, A. Schmalz, J. Haase, Structure determination of water chemisorbed on Ni(110) by use of X-ray absorption fine-structure measurements, CHEM PHYS LETT, 221 (1994) 189-193. [87] T. Pache, H.P. Steinrück, W. Huber, D. Menzel, The adsorption of H2O on clean and oxygen precovered Ni(111) studied by ARUPS and TPD, SURF SCI, 224 (1989) 195-214. [88] J. Tennyson, N.F. Zobov, R. Williamson, O.L. Polyansky, P.F. Bernath, Experimental Energy Levels of the Water Molecule, J PHYS CHEM REF DATA, 30 (2001) 735-831. [89] D.W. Blaylock, T. Ogura, W.H. Green, G.J. Beran, Computational investigation of thermochemistry and kinetics of steam methane reforming on Ni (111) under realistic conditions, J. Phys. Chem. C, 113 (2009) 4898-4908. [90] P.W. van Grootel, E.J. Hensen, R.A. van Santen, DFT study on H2O activation by stepped and planar Rh surfaces, SURF SCI, 603 (2009) 3275-3281. [91] S.-G. Wang, X.-Y. Liao, J. Hu, D.-B. Cao, Y.-W. Li, J. Wang, H. Jiao, Kinetic aspect of CO2 reforming of CH4 on Ni(111): A density functional theory calculation, SURF SCI, 601 (2007) 1271-1284. [92] L. Dietz, S. Piccinin, M. Maestri, Mechanistic Insights into CO2 Activation via Reverse Water–Gas Shift on Metal Surfaces, J. Phys. Chem. C, 119 (2015) 4959-4966. [93] L. Ollé, M. Salmerón, A.M. Baró, The adsorption and decomposition of water on Ni(110) studied by electron energy loss spectroscopy, J VAC SCI TECHNOL A, 3 (1985) 1866-1870. [94] J.T. Keiser, M.A. Hoffbauer, M.C. Lin, Production of hydroxyl on polycrystalline nickel studied by thermal desorption/laser-induced fluorescence, J PHYS CHEM-US, 89 (1985) 2635-2638. [95] W. Heiland, Charge exchange processes and surface chemistry, SURF SCI, 251–252 (1991) 942-946. [96] H.J. Freund, M.W. Roberts, Surface chemistry of carbon dioxide, SURF SCI REP, 25 (1996) 225-273. [97] X. Ding, L. De Rogatis, E. Vesselli, A. Baraldi, G. Comelli, R. Rosei, L. Savio, L. Vattuone, M. Rocca, P. Fornasiero, Interaction of carbon dioxide with Ni (110): A combined experimental and theoretical study, PHYS REV B, 76 (2007) 195425. [98] S. Haq, J.G. Love, H.E. Sanders, D.A. King, Adsorption and decomposition of formic acid on Ni{110}, SURF SCI, 325 (1995) 230-242. [99] A. Emundts, G. Pirug, J. Werner, H.P. Bonzel, Large solid angle X-ray photoelectron intensity distributions from CO, methoxy, and formate adsorbed on Ni(110), SURF SCI, 410 (1998) L727-L735. [100] K. Christmann, O. Schober, G. Ertl, M. Neumann, Adsorption of hydrogen on nickel single crystal surfaces, J CHEM PHYS, 60 (1974) 4528-4540. [101] J.T. Stuckless, N. Al-Sarraf, C. Wartnaby, D.A. King, Calorimetric heats of adsorption for CO on nickel single crystal surfaces, J CHEM PHYS, 99 (1993) 2202-2212. [102] C. Zhao, M.A. Passler, A reinvestigation of the surface structure of Ni(110)−(2×1)2CO by LEED, SURF SCI, 320 (1994) 1-6. [103] L. Becker, S. Aminpirooz, B. Hillert, M. Pedio, J. Haase, D.L. Adams, Threefold-coordinated hollow adsorption site for Ni (111)-c (4× 2)-CO: A surface-extended x-ray-absorption fine-structure study, PHYS REV B, 47 (1993) 9710. [104] K. Christmann, R.J. Behm, G. Ertl, M.A. Van Hove, W.H. Weinberg, Chemisorption geometry of hydrogen on Ni(111): Order and disorder, J CHEM PHYS, 70 (1979) 4168-4184. [105] R.R. Cavanagh, R.D. Kelley, J.J. Rush, Neutron vibrational spectroscopy of hydrogen and deuterium on Raney nickel, J CHEM PHYS, 77 (1982) 1540-1547.

25
[106] S.E. Wonchoba, W.-P. Hu, D.G. Truhlar, Surface diffusion of H on Ni (100): Interpretation of the transition temperature, PHYS REV B, 51 (1995) 9985. [107] A. Hodgson, S. Haq, Water adsorption and the wetting of metal surfaces, SURF SCI REP, 64 (2009) 381-451. [108] T. Pache, H.-P. Steinrück, W. Huber, D. Menzel, The adsorption of H2O on clean and oxygen precovered Ni (111) studied by ARUPS and TPD, SURF SCI, 224 (1989) 195-214. [109] C. Benndorf, T.E. Madey, Adsorption of H2O on clean and oxygen-preposed Ni (110), SURF SCI, 194 (1988) 63-91. [110] J. Gong, C.B. Mullins, Surface Science Investigations of Oxidative Chemistry on Gold, ACCOUNTS CHEM RES, 42 (2009) 1063-1073. [111] M.F. Camellone, S. Fabris, Reaction Mechanisms for the CO Oxidation on Au/CeO2 Catalysts: Activity of Substitutional Au3
+/Au+ Cations and Deactivation of Supported Au+ Adatoms, J. Am. Chem. Soc., 131 (2009) 10473-10483. [112] J.-P. Chou, W.W. Pai, C.-C. Kuo, J.D. Lee, C.H. Lin, C.-M. Wei, Promotion of CO Oxidation on Bimetallic Au−Ag(110) Surfaces: A Combined Microscopic and Theoretical Study, J. Phys. Chem. C, 113 (2009) 13151-13159. [113] F. Wang, D. Zhang, X. Xu, Y. Ding, Theoretical Study of the CO Oxidation Mediated by Au3
+, Au3, and Au3−:
Mechanism and Charge State Effect of Gold on Its Catalytic Activity, J. Phys. Chem. C, 113 (2009) 18032-18039. [114] C.-C. Kao, S.-C. Tsai, Y.-W. Chung, Surface electronic properties and CO hydrogenation activity of nickel deposited on rutile TiO 2 (100) as a model supported catalyst, J CATAL, 73 (1982) 136-146. [115] G. Jacobs, U.M. Graham, E. Chenu, P.M. Patterson, A. Dozier, B.H. Davis, Low-temperature water–gas shift: impact of Pt promoter loading on the partial reduction of ceria and consequences for catalyst design, J CATAL, 229 (2005) 499-512. [116] G. Jacobs, S. Ricote, U.M. Graham, P.M. Patterson, B.H. Davis, Low temperature water gas shift: Type and loading of metal impacts forward decomposition of pseudo-stabilized formate over metal/ceria catalysts, Catal. Today, 106 (2005) 259-264. [117] K.G. Azzam, I.V. Babich, K. Seshan, L. Lefferts, Bifunctional catalysts for single-stage water–gas shift reaction in fuel cell applications.: Part 1. Effect of the support on the reaction sequence, J CATAL, 251 (2007) 153-162. [118] C.H. Kim, L.T. Thompson, Deactivation of Au/CeOx water gas shift catalysts, J CATAL, 230 (2005) 66-74. [119] F.C. Meunier, D. Reid, A. Goguet, S. Shekhtman, C. Hardacre, R. Burch, W. Deng, M. Flytzani-Stephanopoulos, Quantitative analysis of the reactivity of formate species seen by DRIFTS over a Au/Ce(La)O2 water–gas shift catalyst: First unambiguous evidence of the minority role of formates as reaction intermediates, J CATAL, 247 (2007) 277-287. [120] C.M. Kalamaras, P. Panagiotopoulou, D.I. Kondarides, A.M. Efstathiou, Kinetic and mechanistic studies of the water–gas shift reaction on Pt/TiO2 catalyst, J CATAL, 264 (2009) 117-129. [121] A. Grob, Theoretical surface science: a microscopic perspective, Springer New York, 2003. [122] S.D. Miller, J.R. Kitchin, Relating the coverage dependence of oxygen adsorption on Au and Pt fcc (111) surfaces through adsorbate-induced surface electronic structure effects, SURF SCI, 603 (2009) 794-801. [123] G.-C. Wang, J. Nakamura, Structure Sensitivity for Forward and Reverse Water-Gas Shift Reactions on Copper Surfaces: A DFT Study, The Journal of Physical Chemistry Letters, 1 (2010) 3053-3057. [124] J.K. Nørskov, T. Bligaard, A. Logadottir, S. Bahn, L.B. Hansen, M. Bollinger, H. Bengaard, B. Hammer, Z. Sljivancanin, M. Mavrikakis, Y. Xu, S. Dahl, C.J.H. Jacobsen, Universality in Heterogeneous Catalysis, J CATAL, 209 (2002) 275-278. [125] S. Wang, B. Temel, J. Shen, G. Jones, L. Grabow, F. Studt, T. Bligaard, F. Abild-Pedersen, C. Christensen, J. Nørskov, Universal Brønsted-Evans-Polanyi Relations for C–C, C–O, C–N, N–O, N–N, and O–O Dissociation Reactions, CATAL LETT, 141 (2011) 370-373. [126] J.N. Bronsted, Acid and Basic Catalysis, CHEM REV, 5 (1928) 231-338. [127] M.G. Evans, M. Polanyi, Inertia and driving force of chemical reactions, T FARADAY SOC, 34 (1938) 11-24. [128] T. Jiang, D.J. Mowbray, S. Dobrin, H. Falsig, B. Hvolbæk, T. Bligaard, J.K. Nørskov, Trends in CO Oxidation Rates for Metal Nanoparticles and Close-Packed, Stepped, and Kinked Surfaces, J. Phys. Chem. C, 113 (2009) 10548-10553. [129] C.V. Ovesen, B.S. Clausen, B.S. Hammershøi, G. Steffensen, T. Askgaard, I. Chorkendorff, J.K. Nørskov, P.B. Rasmussen, P. Stoltze, P. Taylor, A Microkinetic Analysis of the Water–Gas Shift Reaction under Industrial Conditions, J CATAL, 158 (1996) 170-180.

26
[130] C.V. Ovesen, P. Stoltze, J.K. Nørskov, C.T. Campbell, A kinetic model of the water gas shift reaction, J CATAL, 134 (1992) 445-468. [131] Y. Li, Q. Fu, M. Flytzani-Stephanopoulos, Low-temperature water-gas shift reaction over Cu- and Ni-loaded cerium oxide catalysts, APPL CATAL B-ENVIRON, 27 (2000) 179-191. [132] J. Nakamura, J.M. Campbell, C.T. Campbell, Kinetics and mechanism of the water-gas shift reaction catalysed by the clean and Cs-promoted Cu (110) surface: A comparison with Cu (111), J. Chem. Soc., Faraday Trans., 86 (1990) 2725-2734. [133] S. Hilaire, X. Wang, T. Luo, R.J. Gorte, J. Wagner, A comparative study of water-gas-shift reaction over ceria supported metallic catalysts, Appl. Catal., A, 215 (2001) 271-278. [134] R.J. Madix, J.L. Gland, G.E. Mitchell, B.A. Sexton, Identification of the intermediates in the dehydration of formic acid on Ni (110) by high resolution electron energy loss vibrational spectroscopy, SURF SCI, 125 (1983) 481-489. [135] A.A. Phatak, W.N. Delgass, F.H. Ribeiro, W.F. Schneider, Density functional theory comparison of water dissociation steps on Cu, Au, Ni, Pd, and Pt, J. Phys. Chem. C, 113 (2009) 7269-7276.

Supporting Information
DFT study of water gas shift reaction on Ni(111), Ni(100) and Ni(110) surfaces
Abas Mohsenzadeh a.*, Tobias Richards a, Kim Bolton a
a Swedish Centre for Resource Recovery, University of Borås, SE 501-90 Borås, Sweden
E-Mail Addresses: [email protected] (A. Mohsenzadeh); [email protected] (K. Bolton); [email protected] (T. Richards)
* Corresponding author: E-Mail: [email protected] (A. Mohsenzadeh); Tel.: +46-33-4354487; Fax: +46-33-4354008; Address: University of Borås, SE 501-90 Borås, Sweden

1
Table S1. Adsorption energies (eV) and structural parameters (Å and degrees) of the chemical species involved in the H2O ⇌ OH + H elementary reaction. The adsorption energies are ZPVE-corrected values. dsurf-O and dsurf-H are the
shortest distances between oxygen and hydrogen atoms of the adsorbate and any metal atom on the surface. dO-H is the bond distance between O and H. The bond which is broken during the reaction is marked by (b).
Species Surface Site Eads dsurf-O dsurf-H dO-H θH-O-H
H2O
Ni(111) O: A −0.19 2.239 --- 0.982
0.981(b) 104.6
Ni(100) O: A −0.27 2.154 --- 0.982
0.983(b) 104.8
Ni(110) O: G −0.40 2.119 --- 0.979
0.990(b) 105.0
TS
Ni(111) O: A H: C′
--- 1.937 1.764 0.982
1.538(b) 104.7
Ni(100) O: A H: B
--- 1.909 1.662 0.981 1.584(b) 100.9
Ni(110) O: G H: D
--- 2.016 1.940 0.982
1.334(b) 121.0
OH + H
Ni(111) O: C′ H: C′
−5.42 1.975 1.661 0.973 ---
Ni(100) O: D′ H: D′
−5.94 2.109 1.845 0.978 ---
Ni(110) O: F H: G
−6.00 1.917 1.681 0.978 ---
Table S2. Adsorption energies (eV) and structural parameters (Å) of the chemical species involved in the OH ⇌ O + H elementary reaction. The adsorption energies are ZPVE-corrected values. dsurf-O and dsurf-H are the shortest distances
between oxygen and hydrogen atoms of the adsorbate and any metal atom on the surface. dO-H is the bond distance between O and H.
Species Surface Site Eads dsurf-O dsurf-H dO-H
OH
Ni(111) O: A −3.10 1.977 --- 0.974
Ni(100) O: D′ −3.30 2.102 --- 0.978
Ni(110) O: F −3.48 1.918 --- 0.978
TS
Ni(111) O: C′ H: C
--- 1.930 1.777 1.340
Ni(100) O: D′ H: A
--- 1.993 1.526 1.456
Ni(110) O: F H: E
--- 1.759 1.614 2.627
O + H
Ni(111) O: C′ H: C′
−7.62 1.835 1.660 ---
Ni(100) O: D′ H: D′
−8.24 1.939 1.805 ---
Ni(110) O: G H: G
−7.84 1.818 1.673 ---

2
Table S3. Adsorption energies (eV) and structural parameters (Å and degrees) of the chemical species involved in the CO + O ⇌ CO2 elementary reaction. The adsorption energies are ZPVE-corrected values. dsurf-C and dsurf-O are the shortest distances between carbon and oxygen atoms of the two different adsorbates and any metal atom on the
surface. dC-O is the bond distance between C and O. The bond which is broken during the (reverse) reaction is marked by (b).
Species Surface Site Eads dsurf-C dsurf-O dC-O θO-C-O
CO + O
Ni(111) C: C O: C′
−6.94 1.913 1.815 1.185 ---
Ni(100) C: D′ O: D′
−7.32 2.023 1.931 1.212 ---
Ni(110) C: F O: G
−7.09 1.875 1.822 1.179 ---
TS
Ni(111) C: B O: C′ --- 1.957 1.877
1.190 1.646(b) 118.2
Ni(100) C: B O: B --- 1.957 1.821
1.183 1.858(b) 110.9
Ni(110) C: G O: E --- 1.902 1.867
1.189 1.768(b) 113.4
CO2
Ni(111) C: A −0.03 4.449 --- 1.176
1.176(b) 180.0
Ni(100) C: A −0.06 1.850 --- 1.253
1.253(b) 135.4
Ni(110) C: F −0.25 2.044 --- 1.240
1.240(b) 141.9
Table S4. Adsorption energies (eV) and structural parameters (Å and degree) of the chemical species involved in the CO + OH ⇌ COOH elementary reaction. The adsorption energies are ZPVE-corrected values. dsurf-C and dsurf-O are the
shortest distances between carbon and oxygen atoms of the two different adsorbates and any metal atom on the surface. dC-O and dO-H is the bond distance between C and O, and O and H. The bond which is broken during the
(reverse) reaction is marked by (b).
Species Surface Site Eads dsurf-C dsurf-O dC-O dO-H θO-C-O
CO + OH
Ni(111) C: C
O2: C′ −4.84 1.897 1.948 1.201 0.975 ---
Ni(100) C: D′ O2: D′
−5.22 2.046 2.109 1.217 0.980 ---
Ni(110) C: F O2: F
−5.42 1.866 1.905 1.187 0.979 ---
TS
Ni(111) C: A O2: B
--- 1.833 1.959 C-O1: 1.182
C-O2: 1.804(b) 0.987 112.7
Ni(100) C: B O2: B
--- 1.897 2.097 C-O1: 1.218
C-O2: 1.506(b) 0.985 117.8
Ni(110) C: E O2: E
--- 1.856 1.951 C-O1: 1.190
C-O2: 1.717(b) 0.984 109.8
COOH
Ni(111) C: A −2.17 1.858 --- C-O1: 1.270
C-O2: 1.344(b) 0.988 117.9
Ni(100) C:B −2.70 1.961 --- C-O1: 1.344
C-O2: 1.358(b) 0.986 112.9
Ni(110) C: E −2.55 1.873 --- C-O1: 1.274
C-O2: 1.353(b) 0.988 115.4
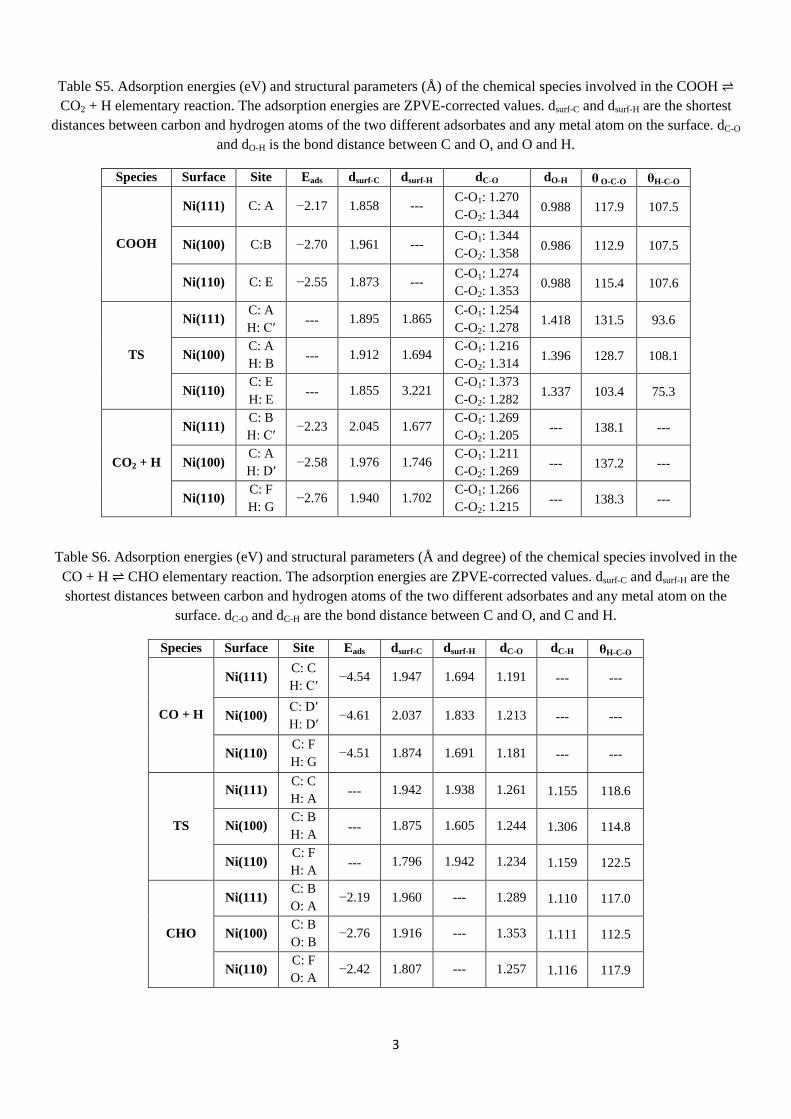
3
Table S5. Adsorption energies (eV) and structural parameters (Å) of the chemical species involved in the COOH ⇌ CO2 + H elementary reaction. The adsorption energies are ZPVE-corrected values. dsurf-C and dsurf-H are the shortest
distances between carbon and hydrogen atoms of the two different adsorbates and any metal atom on the surface. dC-O and dO-H is the bond distance between C and O, and O and H.
Species Surface Site Eads dsurf-C dsurf-H dC-O dO-H θ O-C-O θH-C-O
COOH
Ni(111) C: A −2.17 1.858 --- C-O1: 1.270 C-O2: 1.344 0.988 117.9 107.5
Ni(100) C:B −2.70 1.961 --- C-O1: 1.344 C-O2: 1.358 0.986 112.9 107.5
Ni(110) C: E −2.55 1.873 --- C-O1: 1.274 C-O2: 1.353 0.988 115.4 107.6
TS
Ni(111) C: A H: C′ --- 1.895 1.865
C-O1: 1.254 C-O2: 1.278 1.418 131.5 93.6
Ni(100) C: A H: B --- 1.912 1.694
C-O1: 1.216 C-O2: 1.314 1.396 128.7 108.1
Ni(110) C: E H: E --- 1.855 3.221
C-O1: 1.373 C-O2: 1.282 1.337 103.4 75.3
CO2 + H
Ni(111) C: B H: C′
−2.23 2.045 1.677 C-O1: 1.269 C-O2: 1.205 --- 138.1 ---
Ni(100) C: A H: D′
−2.58 1.976 1.746 C-O1: 1.211 C-O2: 1.269 --- 137.2 ---
Ni(110) C: F H: G
−2.76 1.940 1.702 C-O1: 1.266 C-O2: 1.215 --- 138.3 ---
Table S6. Adsorption energies (eV) and structural parameters (Å and degree) of the chemical species involved in the CO + H ⇌ CHO elementary reaction. The adsorption energies are ZPVE-corrected values. dsurf-C and dsurf-H are the shortest distances between carbon and hydrogen atoms of the two different adsorbates and any metal atom on the
surface. dC-O and dC-H are the bond distance between C and O, and C and H.
Species Surface Site Eads dsurf-C dsurf-H dC-O dC-H θH-C-O
CO + H
Ni(111) C: C H: C′
−4.54 1.947 1.694 1.191 --- ---
Ni(100) C: D′ H: D′
−4.61 2.037 1.833 1.213 --- ---
Ni(110) C: F H: G
−4.51 1.874 1.691 1.181 --- ---
TS
Ni(111) C: C H: A --- 1.942 1.938 1.261 1.155 118.6
Ni(100) C: B H: A --- 1.875 1.605 1.244 1.306 114.8
Ni(110) C: F H: A --- 1.796 1.942 1.234 1.159 122.5
CHO
Ni(111) C: B O: A
−2.19 1.960 --- 1.289 1.110 117.0
Ni(100) C: B O: B
−2.76 1.916 --- 1.353 1.111 112.5
Ni(110) C: F O: A
−2.42 1.807 --- 1.257 1.116 117.9

4
Table S7. Adsorption energies (eV) and structural parameters (Å and degree) of the chemical species involved in the CHO + O ⇌ HCOO elementary reaction. The adsorption energies are ZPVE-corrected values. dsurf-C and dsurf-O are the
shortest distances between carbon and oxygen atoms of the two different adsorbates and any metal atom on the surface. dC-O and dC-H is the bond distance between C and O, and C and H. The bond which is broken during the
reaction is marked by (b).
Species Surface Site Eads dsurf-C dsurf-O dC-O dC-H θ
CHO + O
Ni(111) C: B
O1,CHO: A O2: C′
−6.90 1.974 O1: 2.001
O2: 1.745(b) C-O1: 1.260 1.108 O1-C-H: 119.8
Ni(100) C: B
O1,CHO: B O2: D′
−7.84 1.921 O1: 2.058
O2: 1.944(b) C-O1: 1.312 1.115 O1-C-H: 115.3
Ni(110) C: F
O1,CHO: A O2: G
−7.63 1.809 O1: 1.977
O2: 1.818(b) C-O1: 1.252 1.117 O1-C-H: 118.9
TS
Ni(111) C: B
O1,CHO: B O2: B
--- 1.920 O1: 2.103
O2: 1.889(b) C-O1: 1.256
C-O2: 1.860(b) 1.103 O1-C-H: 122.4
O2-C-H: 95.0(b) O-C-O: 116.6
Ni(100) C: B
O1,CHO: D′ O2: B
--- 1.914 O1: 2.001
O2: 1.840(b) C-O1: 1.312
C-O2: 1.823(b) 1.101 O1-C-H: 117.9
O2-C-H: 96.4(b) O-C-O: 112.3
Ni(110) C: G
O1,CHO: G O2: G
--- 1.863 O1: 2.006
O2: 1.840(b) C-O1: 1.275
C-O2: 1.828(b) 1.103 O1-C-H: 120.1
O2-C-H: 95.0(b) O-C-O: 118.4
HCOO
Ni(111) O1: A O2: A
−2.69 --- O1: 1.961
O2: 1.963(b) C-O1: 1.272
C-O2: 1.271(b) 1.106 O1-C-H: 116.4
O2-C-H: 116.4(b) O-C-O: 127.2
Ni(100) O1: B O2: A
−2.88 --- O1: 2.028
O2: 1.963(b) C-O1: 1.294
C-O2: 1.259(b) 1.105 O1-C-H: 115.8
O2-C-H: 118.0(b) O-C-O: 126.2
Ni(110) O1: A O2: A
−3.29 --- O1: 1.921
O2: 1.921(b) C-O1: 1.272
C-O2: 1.272(b) 1.109 O1-C-H: 115.1
O2-C-H: 115.1(b) O-C-O: 129.8

5
Table S8. Adsorption energies (eV) and structural parameters (Å and degree) of the chemical species involved in the HCOO ⇌ CO2 + H elementary reaction. The adsorption energies are ZPVE-corrected values. dsurf-C, dsurf-O and dsurf-H are the shortest distances between carbon, oxygen and hydrogen atoms of the adsorbate and any metal atom on the
surface. dC-O and dC-H is the bond distance between C and O, and C and H.
Species Surface Site Eads dsurf-C dsurf-O dsurf-H dC-O dC-H θ
HCOO
Ni(111) O1: A O2: A
−2.69 --- O1: 1.961 O2: 1.963 ---
C-O1: 1.272 C-O2: 1.271 1.106
O1-C-H: 116.4 O2-C-H: 116.4 O-C-O: 127.2
Ni(100) O1: B O2: A
−2.88 --- O1: 2.028 O2: 1.963 ---
C-O1: 1.294 C-O2: 1.259 1.105
O1-C-H: 115.8 O2-C-H: 118.0 O-C-O: 126.2
Ni(110) O1: A O2: A
−3.29 --- O1: 1.921 O2: 1.921 ---
C-O1: 1.272 C-O2: 1.272 1.109
O1-C-H: 115.1 O2-C-H: 115.1 O-C-O: 129.8
TS
Ni(111) C: B O1: A O2: A
--- 2.855 O1: 2.030 O2: 2.052 3.193
C-O1: 1.236 C-O2: 1.361 1.349
O1-C-H: 170.3 O2-C-H: 52.2 O-C-O: 122.7
Ni(100) C: D′ O1: B O2: A
--- 2.872 O2: 2.011 O1: 2.140 3.158
C-O1: 1.414 C-O2: 1.231 1.354
O1-C-H: 168.2 O2-C-H: 51.2 O-C-O: 120.4
Ni(110) C: A O1: A O2: A
--- 2.116 O1: 2.985 O1: 1.916 1.566
C-O1: 1.283 C-O2: 1.210 1.499
O1-C-H: 111.0 O2-C-H: 110.4 O-C-O: 134.0
CO2 + H
Ni(111) C: B H: C′
−2.23 2.045 --- 1.667 C-O1: 1.269 C-O2: 1.205 --- O-C-O: 138.1
Ni(100) C: A H: D′
−2.58 1.976 --- 1.746 C-O1: 1.211 C-O2: 1.269 --- O-C-O: 137.2
Ni(110) C: F H: G
−2.76 1.940 --- 1.702 C-O1: 1.266 C-O2: 1.215 --- O-C-O: 138.3
Table S9. Adsorption energies (eV) and structural parameters (Å) of the chemical species involved in the H2 ⇌ H + H elementary reaction. The adsorption energies are ZPVE-corrected values. dsurf-H is the shortest distances between
hydrogen atoms any metal atom on the surface. dH-H is the bond distance between hydrogen atoms.
Species Surface Site Eads dsurf-H dH-H
H + H
Ni(111) H1: C′ H2: C′
−5.27 1.678 1.678
---
Ni(100) H1: D′ H2: D′
−5.39 1.831 1.831
---
Ni(110) H1: F H2: F
−4.96 1.617 1.617
---
TS13
Ni(111) H1: A H2: A
--- 1.508 1.556
1.103
Ni(100) H1: A H2: A
--- 1.559 1.561
0.991
Ni(110) H1: A H2: A
--- 1.488 1.523
1.282
H2
Ni(111) H1: A H2: A
−0.17 1.593 1.593
0.889
Ni(100) H1: A H2: A
−0.22 1.599 1.599
0.881
Ni(110) H1: A H2: A
−0.33 1.611 1.611
0.872

6
Table S10. Adsorption energies (eV) and structural parameters (Å) of CO, O and H. The adsorption energies are ZPVE-corrected values. dsurf-adsorbate is the shortest distance between carbon, oxygen and hydrogen atoms and any metal
atom on the surface. dC-O is the bond distance between C and O.
Species Surface Site Eads dsurf-adsorbate dC-O
CO Ni(111) C −1.89 1.984 1.193 Ni(100) D′ −1.96 2.039 2.039 Ni(110) D −1.89 1.875 1.183
O Ni(111) C′ −5.30 1.839 --- Ni(100) D′ −5.62 1.951 --- Ni(110) E −4.97 1.898 ---
H Ni(111) C′ −2.65 1.707 --- Ni(100) D′ −2.70 1.839 --- Ni(110) G −2.51 1.700 ---
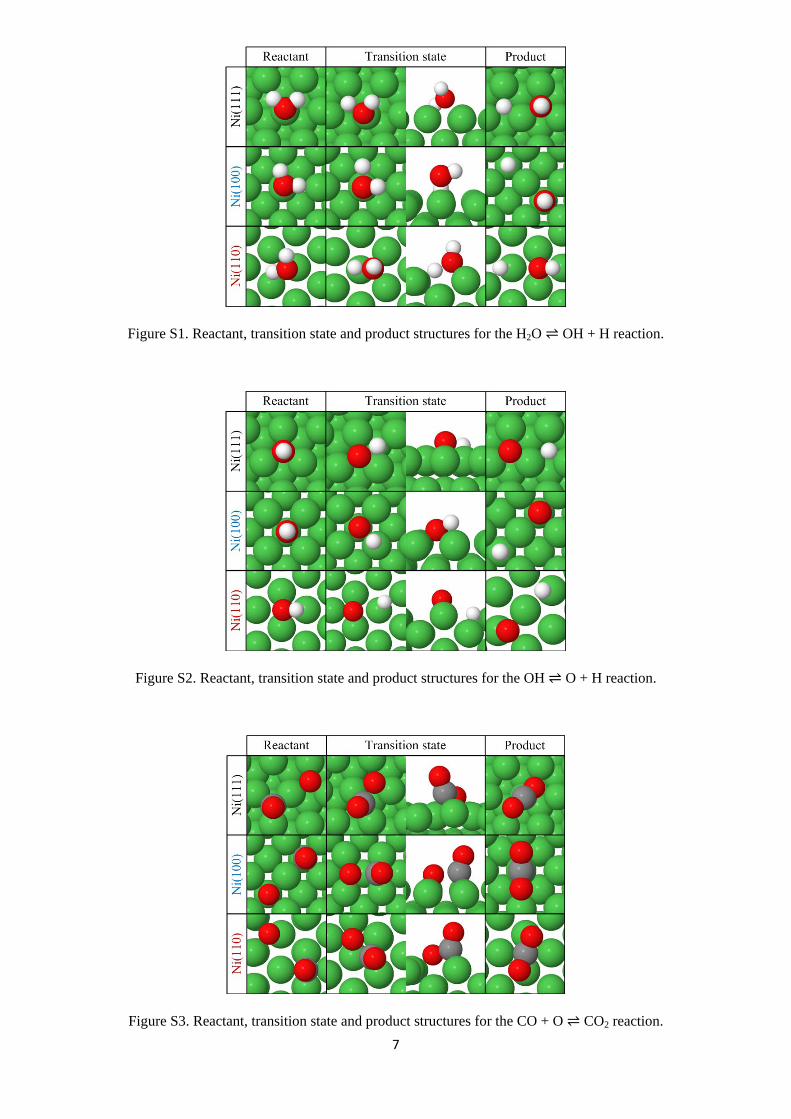
7
Figure S1. Reactant, transition state and product structures for the H2O ⇌ OH + H reaction.
Figure S2. Reactant, transition state and product structures for the OH ⇌ O + H reaction.
Figure S3. Reactant, transition state and product structures for the CO + O ⇌ CO2 reaction.

8
Figure S4. Reactant, transition state and product structures for the CO + OH ⇌ COOH reaction.
Figure S5. Reactant, transition state and product structures for the COOH ⇌ CO2 + H reaction.
Figure S6. Reactant, transition state and product structures for the CO + H ⇌ CHO reaction.

9
Figure S7. Reactant, transition state and product structures for the CHO + O ⇌ HCOO reaction.
Figure S8. Reactant, transition state and product structures for the HCOO ⇌ CO2 + H reaction.
Figure S9. Reactant, transition state and product structures for the H + H ⇌ H2 reaction.