Embed Size (px)
Citation preview
Methods 72 (2015) 86–94
Contents lists available at ScienceDirect
Methods
journal homepage: www.elsevier .com/locate /ymeth
Computational schemes for the prediction and annotation of enhancersfrom epigenomic assays
http://dx.doi.org/10.1016/j.ymeth.2014.10.0081046-2023/� 2014 Elsevier Inc. All rights reserved.
⇑ Corresponding author at: Department of Chemistry and Biochemistry, Depart-ment of Molecular and Cellular Medicine, University of California, San Diego, LaJolla, CA 92093-0359, United States.
E-mail address: [email protected] (W. Wang).1 Current address: Research & Development IT, Janssen Pharmaceutical of Johnson
& Johnson, San Diego, CA, United States.2 Contribute equally.
John W. Whitaker 1,2, Tung T. Nguyen 2, Yun Zhu 2, Andre Wildberg 2, Wei Wang ⇑Department of Chemistry and Biochemistry, University of California, San Diego, La Jolla, CA 92093-0359, United StatesDepartment of Cellular and Molecular Medicine, University of California, San Diego, La Jolla, CA 92093-0359, United States
a r t i c l e i n f o
Article history:Received 9 April 2014Received in revised form 14 September2014Accepted 8 October 2014Available online 15 October 2014
Keywords:Enhancer predictionEpigenomicsEnhancer–gene linkingEnhancer activityEpigenetics
a b s t r a c t
Identifying and annotating distal regulatory enhancers is critical to understand the mechanisms thatcontrol gene expression and cell-type-specific activities. Next-generation sequencing techniques haveprovided us an exciting toolkit of genome-wide assays that can be used to predict and annotate enhanc-ers. However, each assay comes with its own specific set of analytical needs if enhancer prediction is to beoptimal. Furthermore, integration of multiple genome-wide assays allows for different genomic featuresto be combined, and can improve predictive performance. Herein, we review the genome-wide assaysand analysis schemes that are used to predict and annotate enhancers. In particular, we focus on threekey computational topics: predicting enhancer locations, determining the cell-type-specific activity ofenhancers, and linking enhancers to their target genes.
� 2014 Elsevier Inc. All rights reserved.
1. Introduction
During animal development, a single cell divides many times togive rise to a great variety of cell-types and tissues. Each of an indi-vidual’s cell-types has its own specific set of characteristics, yetthey are all constructed from the same ‘‘blueprints,’’ as they pos-sess the same genome sequence. The genome defines all the genesthat are expressed in an individual; however, only a specific subsetof genes is expressed in any given cell-type. Thus, cell-type-specificgene expression must be tightly controlled throughout develop-ment. Furthermore, incorrect patterns of gene expression canresult in diseases, such as cancers.
The expression of genes is controlled by RNA polymerase II(RNA Pol II), which transcribes DNA into RNA. The initiation oftranscription occurs at the transcription start site (TSS). Adjacentto the TSS is the gene promoter, which contains cis-regulatory ele-ments that are bound by transcription factors (TFs) and regulategene expression. Enhancers, which are distal regulatory sitesbound by TFs, interact with promoters through DNA looping and
further tune gene expression [1,2]. The looping increases the localconcentration of TFs that recruits RNA Pol II to initiate the tran-scriptional process [3,4]. While gene-coding regions and promotershave been well annotated, identification of enhancers remains agreat challenge, as they can be located hundreds of kilobases (kb)to millions of bases from their interacting genes and function inde-pendently of their location and/or orientation relative to the TSS[4,5].
Initial genome-wide enhancer identification strategies relied onproperties of the DNA sequence, such as clusters of TF binding sites[6,7] and highly conserved genomic regions [8–11]. However, theseapproaches may not be accurate enough and lack informationabout the cell-type specificity of the identified enhancers. Morerecently, next-generation sequencing technologies have given riseto numerous genome-wide assays that allow the cell-type-specificmeasurement of genomic properties. These approaches havestarted to be applied en masse, especially by projects like ENCODE[12] and the Roadmap Epigenomics Project [13]. Herein, we reviewthe use of genome-wide assays, particularly computational strate-gies to identify enhancers on a genome-wide level and to linkenhancers to their target genes.
2. Identifying the location of enhancers
In this section we discuss approaches that use epigenomic datato predict the genomic positions of enhancers. Important assays
J.W. Whitaker et al. / Methods 72 (2015) 86–94 87
and predictive features they provide are discussed and broughtinto context, such as enhancer sequence patterns, ChIP-seq, chro-matin signatures, and DNA methylation.
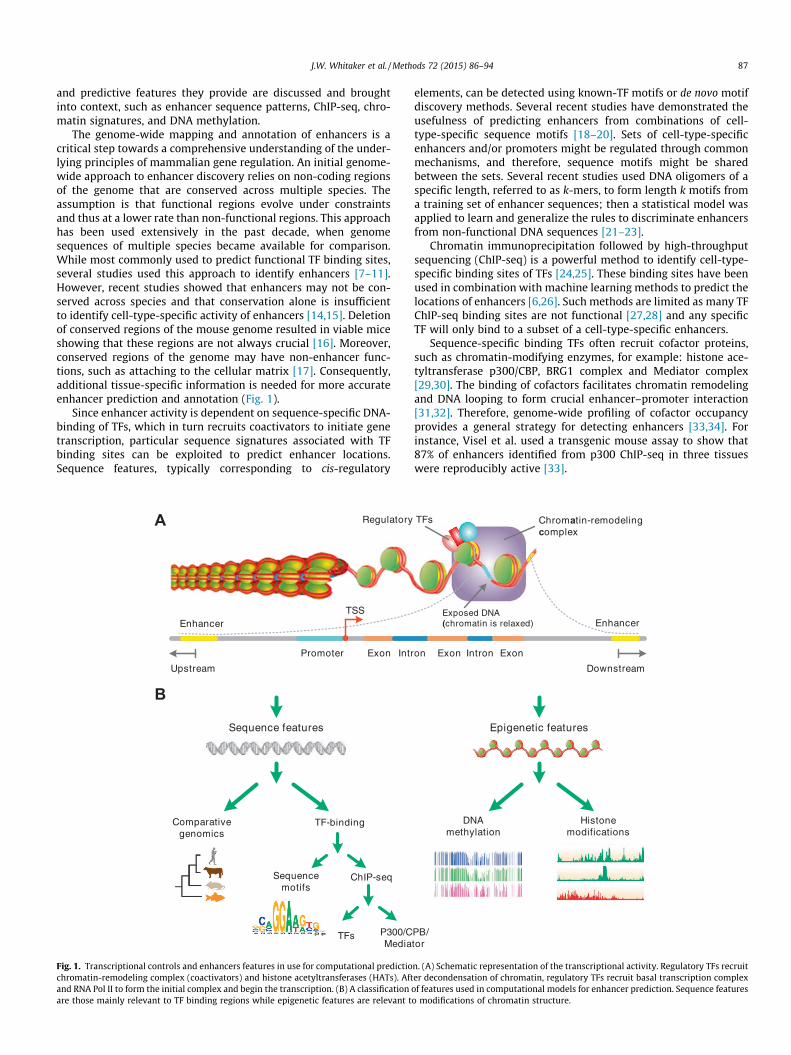
The genome-wide mapping and annotation of enhancers is acritical step towards a comprehensive understanding of the under-lying principles of mammalian gene regulation. An initial genome-wide approach to enhancer discovery relies on non-coding regionsof the genome that are conserved across multiple species. Theassumption is that functional regions evolve under constraintsand thus at a lower rate than non-functional regions. This approachhas been used extensively in the past decade, when genomesequences of multiple species became available for comparison.While most commonly used to predict functional TF binding sites,several studies used this approach to identify enhancers [7–11].However, recent studies showed that enhancers may not be con-served across species and that conservation alone is insufficientto identify cell-type-specific activity of enhancers [14,15]. Deletionof conserved regions of the mouse genome resulted in viable miceshowing that these regions are not always crucial [16]. Moreover,conserved regions of the genome may have non-enhancer func-tions, such as attaching to the cellular matrix [17]. Consequently,additional tissue-specific information is needed for more accurateenhancer prediction and annotation (Fig. 1).
Since enhancer activity is dependent on sequence-specific DNA-binding of TFs, which in turn recruits coactivators to initiate genetranscription, particular sequence signatures associated with TFbinding sites can be exploited to predict enhancer locations.Sequence features, typically corresponding to cis-regulatory
IntrExonPromoter
Regulatory
Upstream
EnhancerTSS
A
B
Sequence features
Comparativegenomics
TF-binding
Sequencemotifs
ChIP-seq
TFs P300/CMedia
Fig. 1. Transcriptional controls and enhancers features in use for computational predictiochromatin-remodeling complex (coactivators) and histone acetyltransferases (HATs). Aftand RNA Pol II to form the initial complex and begin the transcription. (B) A classificationare those mainly relevant to TF binding regions while epigenetic features are relevant t
elements, can be detected using known-TF motifs or de novo motifdiscovery methods. Several recent studies have demonstrated theusefulness of predicting enhancers from combinations of cell-type-specific sequence motifs [18–20]. Sets of cell-type-specificenhancers and/or promoters might be regulated through commonmechanisms, and therefore, sequence motifs might be sharedbetween the sets. Several recent studies used DNA oligomers of aspecific length, referred to as k-mers, to form length k motifs froma training set of enhancer sequences; then a statistical model wasapplied to learn and generalize the rules to discriminate enhancersfrom non-functional DNA sequences [21–23].
Chromatin immunoprecipitation followed by high-throughputsequencing (ChIP-seq) is a powerful method to identify cell-type-specific binding sites of TFs [24,25]. These binding sites have beenused in combination with machine learning methods to predict thelocations of enhancers [6,26]. Such methods are limited as many TFChIP-seq binding sites are not functional [27,28] and any specificTF will only bind to a subset of a cell-type-specific enhancers.
Sequence-specific binding TFs often recruit cofactor proteins,such as chromatin-modifying enzymes, for example: histone ace-tyltransferase p300/CBP, BRG1 complex and Mediator complex[29,30]. The binding of cofactors facilitates chromatin remodelingand DNA looping to form crucial enhancer–promoter interaction[31,32]. Therefore, genome-wide profiling of cofactor occupancyprovides a general strategy for detecting enhancers [33,34]. Forinstance, Visel et al. used a transgenic mouse assay to show that87% of enhancers identified from p300 ChIP-seq in three tissueswere reproducibly active [33].
Chromatin-remodelingcomplex
on
TFs
Downstream
Enhancer
IntronExon Exon
Epigenetic features
DNAmethylation
Histonemodifications
PB/tor
Exposed DNA(chromatin is relaxed)
n. (A) Schematic representation of the transcriptional activity. Regulatory TFs recruiter decondensation of chromatin, regulatory TFs recruit basal transcription complexof features used in computational models for enhancer prediction. Sequence featureso modifications of chromatin structure.
88 J.W. Whitaker et al. / Methods 72 (2015) 86–94
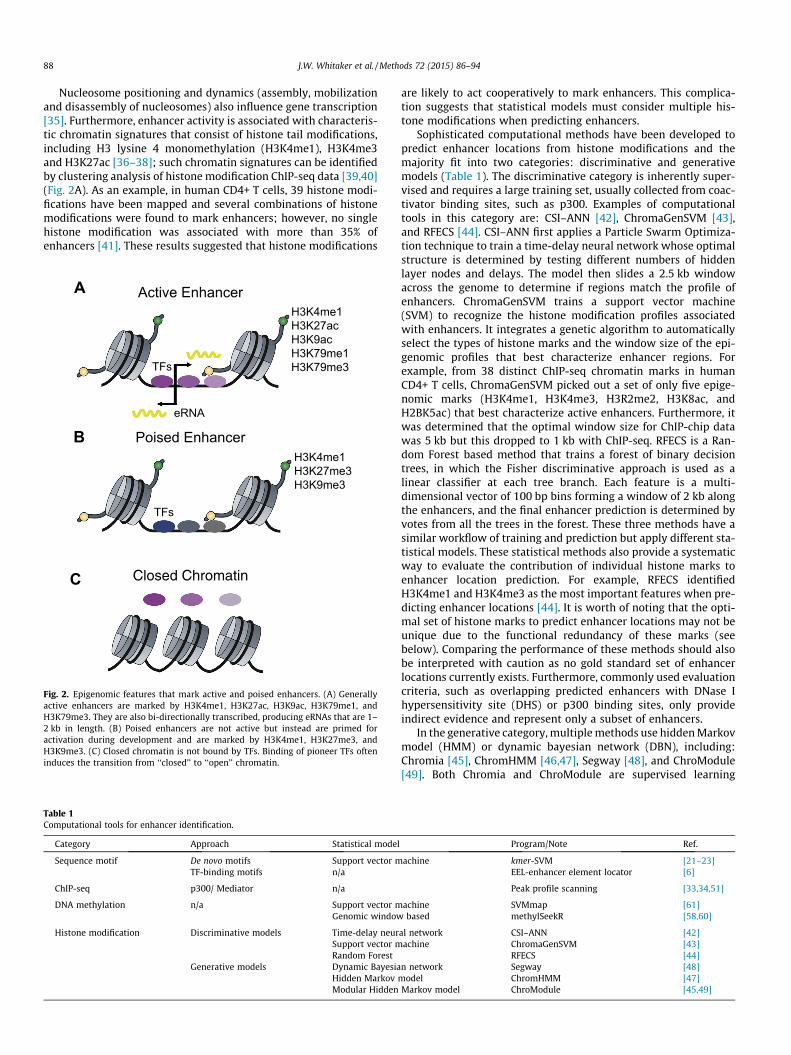
Nucleosome positioning and dynamics (assembly, mobilizationand disassembly of nucleosomes) also influence gene transcription[35]. Furthermore, enhancer activity is associated with characteris-tic chromatin signatures that consist of histone tail modifications,including H3 lysine 4 monomethylation (H3K4me1), H3K4me3and H3K27ac [36–38]; such chromatin signatures can be identifiedby clustering analysis of histone modification ChIP-seq data [39,40](Fig. 2A). As an example, in human CD4+ T cells, 39 histone modi-fications have been mapped and several combinations of histonemodifications were found to mark enhancers; however, no singlehistone modification was associated with more than 35% ofenhancers [41]. These results suggested that histone modifications
Active EnhancerH3K4me1H3K27acH3K9acH3K79me1H3K79me3
eRNA
TFs
Poised EnhancerH3K4me1H3K27me3H3K9me3
Closed Chromatin
A
B
C
TFs
Fig. 2. Epigenomic features that mark active and poised enhancers. (A) Generallyactive enhancers are marked by H3K4me1, H3K27ac, H3K9ac, H3K79me1, andH3K79me3. They are also bi-directionally transcribed, producing eRNAs that are 1–2 kb in length. (B) Poised enhancers are not active but instead are primed foractivation during development and are marked by H3K4me1, H3K27me3, andH3K9me3. (C) Closed chromatin is not bound by TFs. Binding of pioneer TFs ofteninduces the transition from ‘‘closed’’ to ‘‘open’’ chromatin.
Table 1Computational tools for enhancer identification.
Category Approach Statistical model
Sequence motif De novo motifs Support vector mTF-binding motifs n/a
ChIP-seq p300/ Mediator n/a
DNA methylation n/a Support vector mGenomic window
Histone modification Discriminative models Time-delay neurSupport vector mRandom Forest
Generative models Dynamic BayesiaHidden MarkovModular Hidden
are likely to act cooperatively to mark enhancers. This complica-tion suggests that statistical models must consider multiple his-tone modifications when predicting enhancers.
Sophisticated computational methods have been developed topredict enhancer locations from histone modifications and themajority fit into two categories: discriminative and generativemodels (Table 1). The discriminative category is inherently super-vised and requires a large training set, usually collected from coac-tivator binding sites, such as p300. Examples of computationaltools in this category are: CSI–ANN [42], ChromaGenSVM [43],and RFECS [44]. CSI–ANN first applies a Particle Swarm Optimiza-tion technique to train a time-delay neural network whose optimalstructure is determined by testing different numbers of hiddenlayer nodes and delays. The model then slides a 2.5 kb windowacross the genome to determine if regions match the profile ofenhancers. ChromaGenSVM trains a support vector machine(SVM) to recognize the histone modification profiles associatedwith enhancers. It integrates a genetic algorithm to automaticallyselect the types of histone marks and the window size of the epi-genomic profiles that best characterize enhancer regions. Forexample, from 38 distinct ChIP-seq chromatin marks in humanCD4+ T cells, ChromaGenSVM picked out a set of only five epige-nomic marks (H3K4me1, H3K4me3, H3R2me2, H3K8ac, andH2BK5ac) that best characterize active enhancers. Furthermore, itwas determined that the optimal window size for ChIP-chip datawas 5 kb but this dropped to 1 kb with ChIP-seq. RFECS is a Ran-dom Forest based method that trains a forest of binary decisiontrees, in which the Fisher discriminative approach is used as alinear classifier at each tree branch. Each feature is a multi-dimensional vector of 100 bp bins forming a window of 2 kb alongthe enhancers, and the final enhancer prediction is determined byvotes from all the trees in the forest. These three methods have asimilar workflow of training and prediction but apply different sta-tistical models. These statistical methods also provide a systematicway to evaluate the contribution of individual histone marks toenhancer location prediction. For example, RFECS identifiedH3K4me1 and H3K4me3 as the most important features when pre-dicting enhancer locations [44]. It is worth of noting that the opti-mal set of histone marks to predict enhancer locations may not beunique due to the functional redundancy of these marks (seebelow). Comparing the performance of these methods should alsobe interpreted with caution as no gold standard set of enhancerlocations currently exists. Furthermore, commonly used evaluationcriteria, such as overlapping predicted enhancers with DNase Ihypersensitivity site (DHS) or p300 binding sites, only provideindirect evidence and represent only a subset of enhancers.
In the generative category, multiple methods use hidden Markovmodel (HMM) or dynamic bayesian network (DBN), including:Chromia [45], ChromHMM [46,47], Segway [48], and ChroModule[49]. Both Chromia and ChroModule are supervised learning
Program/Note Ref.
achine kmer-SVM [21–23]EEL-enhancer element locator [6]
Peak profile scanning [33,34,51]
achine SVMmap [61]based methylSeekR [58,60]
al network CSI–ANN [42]achine ChromaGenSVM [43]
RFECS [44]n network Segway [48]
model ChromHMM [47]Markov model ChroModule [45,49]
J.W. Whitaker et al. / Methods 72 (2015) 86–94 89
HMMs; Chromia focuses on predicting promoters and enhancerswhile ChroModule uses a modular HMM to segment the entire gen-ome into five categories: promoters, enhancers, transcribed,repressed and background. Chromatin modifications surroundingregulatory elements often form characteristic shapes, such as bimo-dal H3K4me3 peaks at active promoters [36,39,40,50,51]. Robustmethods are needed to represent these profiles as they vary interms of length, magnitude and pattern of epigenomic modifica-tion. Both Chromia and ChroModule use a mixture of Gaussians toflexibly represent the diverse signal patterns associated with regu-latory elements and capture the signature patterns. For example,the enhancer module in ChroModule can model enhancers eitherwith or without a nucleosome free region using a Gaussian mixturemodel. Therefore, ChroModule can capture novel signal patternsand combination of epigenomic modifications associated with reg-ulatory elements. Alternatively, ChromHMM puts read counts into200 bp bins that are discretized [52]. In order to associate the geno-mic locations with HMM states, a posterior probability distributionover the state of each interval (bin) is computed. Segway exploits aDBN model that works with the full data matrix at 1 bp genomicresolution [48]. An advantage of the DBN framework is that it canhandle heterogeneous missing data. The method uses a singleGaussian distribution to represent the sequencing signals. Whenapplying ChromHMM and Segway, a critical step is to select theoptimal number of states that best fits the data, which is normallyachieved by testing a range of states and picking the best perform-ing one. The unsupervised learning strategy in ChromHMM andSegway allows these methods to learn unknown combination ofchromatin signatures, which may correspond to novel biology. Inorder to interpret the segmentation results of these methods andannotate each state, additional information such as TSS and p300binding sites are needed to associate the identified chromatin statesto functional elements like promoters and enhancers.
Methods in the discriminative category aim to predict enhanc-ers while generative methods segment the epigenome and enhanc-ers are annotated as a part of segmentation. Choice of methoddepends on the purpose of the analysis and the availability of data,as illustrated by a comparison between ChromHMM and Segwayannotations [47].
Besides histone modification, DNA methylation – the additionof a methyl group to the nucleotide cytosine – is another epige-nomic feature that can predict enhancer locations. Different cell-types and tissues display distinct patterns of DNA methylation[53–55] and specific changes in DNA methylation are associatedwith development of cancers and autoimmune diseases, such asrheumatoid arthritis [56,57]. Enhancers have methylation levelsbetween 10 and 50% while promoters have methylation levelsbetween 0 and 10% and the rest of the genome is marked by higherlevels of DNA methylation (hypermethylation) [58]. In the Stadleret al. study, the characteristic DNA methylation levels are modeledby a three-state HMM model to compartmentalize the genome intocell-type-specific enhancer and promoter regions [58]. Similar tosegmentation of chromatin modification data, HMM models havebeen developed to segment methylomes to systematically uncoverthe regulatory regions associated with characteristic DNA methyl-ation levels [59,60]. Additionally, these methods can also revealregions with consecutive DNA methylation levels; such as partiallymethylated domains (PMD), which are broad and inactive regionsof the genome. Furthermore, changes in DNA methylation atenhancers correlate with changes in the expression of distal genesthat may be regulated by the enhancers. Therefore, given the geneexpression levels and DNA methylation profiles in different tissuesit is possible to simultaneously identify enhancers and link them totheir target genes (see below) [61]. For example, Aran et al. firstidentified differentially expressed genes across 58 human cell-types. To train a statistical model they created two sets of genomic
regions that represent positive and negative examples. The positiveset was the correlation between CpG methylation in the promotersand the expression levels of their corresponding genes, these weretaken as the positive examples. The background consisted of ran-domly selected CpG-gene pairs that are located in different chro-mosomes. Then they trained a support vector machine (SVM),known as SVMmap (Table 1), to identify CpG-gene pairs within aset of genomic window. These distal methylation site and genepairs were found to be enriched with enhancer-associated histonemodifications and significantly overlapped those detected using 5C(see below).
In summary, various genomic and epigenomic properties havebeen exploited to predict genome-wide enhancer positions. Owingto the complex nature of development and cell-type-specificity,any single modification or factor used in isolation is often not thebest predictor of enhancer locations. Instead the integration ofmultiple layers of genomic/epigenomic information is more pow-erful for producing a comprehensive annotation and understand-ing of enhancers. Following this trend, several recent studieshave started to explore integrative models to identify potentialenhancers [62,63]. Furthermore, there are recent advances inhigh-throughput enhancer identification assays (e.g. STARR-seq[64] or using bidirectional expression of short transcripts mea-sured by GRO-seq [65]). These techniques should become evenmore powerful once they are combined with computational meth-odologies. When a complete set of enhancers are cataloged, muchwork will be required to examine spatiotemporal activity ofenhancers in a high-throughput, unbiased, and dynamic way, espe-cially in the context of multiple developmental stages.
2.1. Predicting the cell-type-specific activity of enhancers
Since the activity signatures of enhancers are diverse and com-plex, it is important to chart their developmental and cell-typespecificity. We discuss the techniques that are available and howthey can be used to determine enhancer activity on a spatiotempo-ral level (location and developmental stage specificity).
As discussed above, enrichment of H3K4me1 [36], hypersensi-tivity to nuclease digestion [66], and sequence conservationbetween species [8,9,67] have been exploited to identify enhancers(Fig. 2A). However, not all enhancers exhibiting these properties arefunctionally active in a specific cell-type (Fig. 2B and C). The histoneacetyltransferase p300 was initially used to measure enhanceractivity [33] but follow-up studies showed that only a fraction ofenhancers bound by p300 modulate transcription in a given cell-type [37,38]. H3K4me1, by itself, is not sufficient to distinguishactive enhancers from inactive ones [37,38], while H3K27ac, incombination with H3K4me1, were shown to be a more robust indi-cator of enhancer activity [37,38]. For example, genome-wide anal-ysis in mouse embryonic stem cells (ESCs) and four other cell-typesdemonstrated that enhancers marked by H3K27ac are associatedwith genes with higher levels of expression [37]. In addition toH3K27ac, several other epigenomic signatures have also been asso-ciated with enhancer activity: H3K4me3, which is enriched in activepromoters, was found to reflect enhancer activity in T cells [68];H3K79me3 and RNA Pol II are also significantly enriched for activeenhancers in Drosophila melanogaster embryos [69]. Together, theseresults suggest that there is not just one epigenomic modificationassociated with enhancer activity [69]. Indeed, enhancers markedby H3K4me1 but not by H3K27ac in human ESCs were shown tobe active in other tissues [37]. This suggests that these enhancers,termed poised enhancers, are in a primed state and become activeupon differentiation or stimuli. Furthermore, poised enhancers areassociated with enrichment of H3K27me3 [38] and H3K9me3 [70].
A more direct measure of enhancer activity is the transcriptionof RNAs at the enhancer site. While transcription at enhancers
90 J.W. Whitaker et al. / Methods 72 (2015) 86–94
was first observed more than 20 years ago [71], only recently hasevidence been found that enhancer transcription is genome-wideand indicative of enhancer activity. Kim et al. identified a largenumber of short (<2 kb), bi-directionally transcribed, and non-poly-adenylated RNA transcripts at enhancer sites [72]. These RNA tran-scripts are termed as enhancer RNAs (eRNAs). Interestingly, eRNAtranscription levels were found to be correlated with the expressionlevels of their target genes. Moreover, eRNAs are produced only inthe presence of functional target promoters. These findings suggestthat eRNA transcription is associated with enhancer activity [72].Wang et al. further confirmed that eRNA transcription is a robustindicator of enhancer activity [73]. Computational methods havebeen developed to predict enhancer activity from eRNA transcrip-tion levels measured by global nuclear run-on sequencing (GRO-seq) [65]. For example, Melgar et al. extracted GRO-seq signals atenhancers and in nearby windows, then used a Bayesian model topredict enhancer activity [65]. Furthermore, knockdown experi-ments showed that eRNAs are functional consequence of enhanc-ers, rather than by-products of gene transcription [74].
Although eRNA transcription is a direct indicator of enhanceractivity, its abundance is low and its accurate measurementrequires higher sequencing depth than mRNA. Thus, integrationof chromatin signatures and eRNA transcription becomes a prom-ising approach to predict enhancer activity. Zhu et al. used a logis-tic regression model to learn the relationship between chromatinsignatures and eRNA production [75]. They demonstrated that fourhistone modification marks are sufficiently accurate to predicteRNA transcription. Interestingly, many combinations of four mod-ifications can achieve superior predictions, which is consistentwith other studies showing that histone marks redundantly markenhancers. They then used the luciferase reporter assay to confirmthat their model predicted enhancer activity more accurately thanusing H3K27ac in isolation.
Both chromatin modifications and eRNAs exhibit high cell-typespecificity during development, differentiation and homeostasis,indicating enhancers have a crucial role in the fine tuning cell-type-specific gene expression. In vivo mapping of p300 binding sitesin mouse embryonic forebrain, midbrain, limb, and heart identifiedenhancers that recapitulate tissue-specific gene expression intransgenic mouse assays [33]. H3K4me1-defined enhancers arealso cell type-specific and are correlated with gene expression pat-terns [36]. H3K27ac and eRNA production are even more dynamicthan the universal mark H3K4me1 [37,38,70]. Genome-wide map-ping of H3K27ac and eRNA production reveals highly dynamicenhancer activity during embryogenesis [76], embryonic limbdevelopment [77] and at estrogen receptor binding sites [78]. Inter-estingly, a significant portion of H3K4me1-defined enhancers arenot enriched with H3K27ac and do not produce bidirectional eRNAtranscripts. These poised enhancers are likely not regulatory activebut may become active in other cell-types, especially those in thesame developmental lineage, or following stimulation [37].
A recent study used CAGE sequencing to identify active enhanc-ers via eRNA identification [79]. However, only 43,011 activeenhancers were identified in 808 human cell-types and tissues,suggesting that eRNA alone is still limited to predict enhancersdue to the low eRNA abundance that makes detection difficult. Thisrecent observation further highlights the importance of overcom-ing this hurdle by training computational models to capture thecharacteristic patterns of multiple chromatin modifications basedon the top active enhancers with the most abundant eRNAs tomore exhaustively identify enhancers.
2.2. Linking enhancers with their target genes
Once a putative enhancer is identified it is important to confi-dently identify the genes it is regulating. In this section we will
discuss methods that can be used to link enhancers and genes. Inparticular, methods used to analyze chromosome conformationcapture methods, such as Hi-C and ChIA-PET.
To determine the regulatory functions of enhancers they mustbe linked to the genes whose expression they control. This task isvery important, as enhancer activity is critical in controlling cell-type-specific patterns of gene expression. Knowing enhancer–geneinteractions permits the identification of the regulatory targets ofnon-promoter TF binding sites; such as those identified withChIP-seq or using DNA-binding motifs. Furthermore, these interac-tions can be identified en masse allowing transcriptional regulatorynetwork to be constructed [46,80]. However, linking enhancers totheir target genes is very challenging since enhancers and targetgenes: (i) may be very distant [81], (ii) may be located on differentchromosomes [82], (iii) may have many-to-many relationships[83], and (iv) have cell-type-specific interactions [51]. Thus, toaccurately link enhancers to their target genes a method must beable to evaluate a huge number of potential enhancer–gene combi-nations in a cell-type-specific manner.
The simplest method is to assign enhancers to the closest TSS.However, this method can generate many false positives and a5C (see below) study has shown as little as 7% of enhancer interac-tions are with the closest TSS [84]. An advancement on the closestTSS approach is to take into account of genomic domains createdby the insulator protein, CTCF [85], which is assumed to block pro-moter-enhancer interactions [51,80]. However, the assignment ofpromoter-enhancer pairs by either of these two methods has beenshown to be only slightly better than the random control [86].Comparing promoter and enhancer activity between differentcell-types can achieve more accurate assignment of promoter-enhancer pairs. The idea is that interacting enhancers and promot-ers display similar patterns of activity across cell-types. A logisticregression classifier coupled with transcription factor (TF) motifsand expression levels was used to assign promoter-enhancer inter-actions and classify TFs into activators or repressors [46]. However,this approach is based on modeling one-to-one promoter-enhancerrelationships and is biased towards the closest TSS. To bettermodel the many-to-many interaction relationship that existsbetween promoters and enhancers, the genome can be divided intodomains of co-regulated promoters and enhancers, called enhancerpromoter units (EPUs) [86]. Chromatin modification data from 19mouse tissues/cell-types was used to define EPUs; there were anaverage of 5.67 enhancers per TSS and the domains are highly cor-related with 3D chromatin domains identified using a techniquecalled Hi-C (see below).
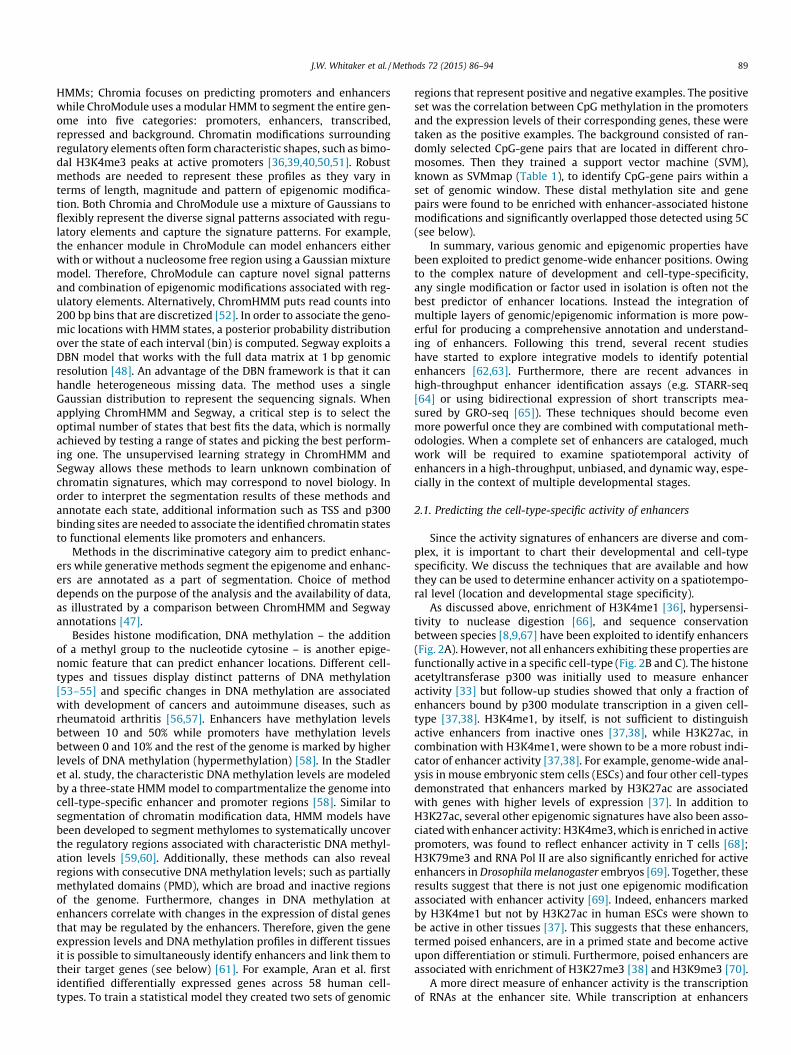
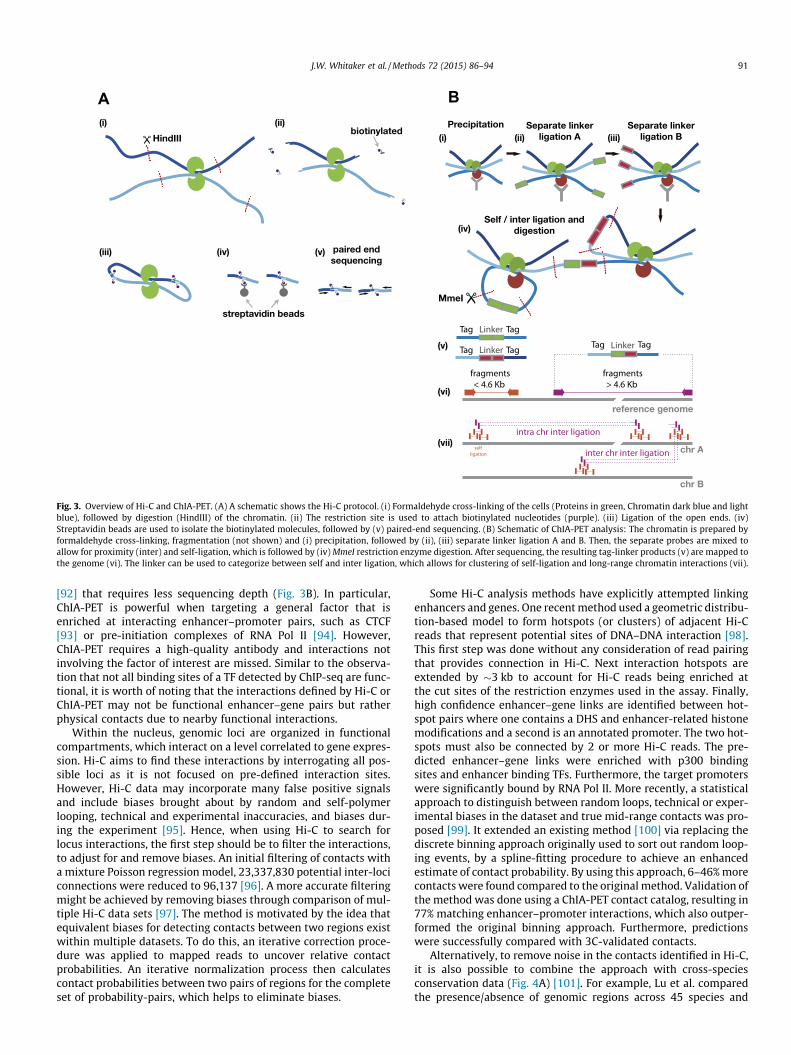
There are a number of experimental techniques that use vari-ants of chromosome conformation capture (3C) [87] to identifyinteractions between enhancers and their target genes. In 3Cexperiments, regions of genomic DNA are cross-linked using form-aldehyde, forming stable complexes between regions of the gen-ome that are nearby and potentially interacting. These DNAregion complexes can be measured using PCR primers that aredesigned to measure the level of interaction between two regionsof interest, such as a gene and an enhancer [88]. Other variantsof 3C, such as 4C and 5C [84,89], increase the throughput andreduce biases by allowing interactions between multiple regionsto be tested at one time. These techniques are more powerful whencoupled with Hi-C and high-throughput sequencing, allowing forgenome-wide maps of interacting regions [90] (Fig. 3A). Recently,Hi-C was used to uncover over one million long-range chromatininteractions at 5–10 kb resolution [91]; however, this study used3.4 billion uniquely mapped reads making it very costly to exper-imentally determine high-resolution enhancer–gene interactionsin other cell-types or under other conditions. An alternative tech-nology, chromatin interaction analysis by paired-end tag sequenc-ing (ChIA-PET), measures interactions at a specific factor of interest
A
(iv)
B
HindIII
reference genome
Precipitation Separate linkerligation A
Separate linkerligation B
MmeI
Self / inter ligation anddigestion
(i) (ii)
(iii)
chr A
chr B
(v)
biotinylated
streptavidin beads
paired endsequencing
(i) (ii) (iii)
(iv)
(v)
(vi)
(vii)
Fig. 3. Overview of Hi-C and ChIA-PET. (A) A schematic shows the Hi-C protocol. (i) Formaldehyde cross-linking of the cells (Proteins in green, Chromatin dark blue and lightblue), followed by digestion (HindIII) of the chromatin. (ii) The restriction site is used to attach biotinylated nucleotides (purple). (iii) Ligation of the open ends. (iv)Streptavidin beads are used to isolate the biotinylated molecules, followed by (v) paired-end sequencing. (B) Schematic of ChIA-PET analysis: The chromatin is prepared byformaldehyde cross-linking, fragmentation (not shown) and (i) precipitation, followed by (ii), (iii) separate linker ligation A and B. Then, the separate probes are mixed toallow for proximity (inter) and self-ligation, which is followed by (iv) MmeI restriction enzyme digestion. After sequencing, the resulting tag-linker products (v) are mapped tothe genome (vi). The linker can be used to categorize between self and inter ligation, which allows for clustering of self-ligation and long-range chromatin interactions (vii).
J.W. Whitaker et al. / Methods 72 (2015) 86–94 91
[92] that requires less sequencing depth (Fig. 3B). In particular,ChIA-PET is powerful when targeting a general factor that isenriched at interacting enhancer–promoter pairs, such as CTCF[93] or pre-initiation complexes of RNA Pol II [94]. However,ChIA-PET requires a high-quality antibody and interactions notinvolving the factor of interest are missed. Similar to the observa-tion that not all binding sites of a TF detected by ChIP-seq are func-tional, it is worth of noting that the interactions defined by Hi-C orChIA-PET may not be functional enhancer–gene pairs but ratherphysical contacts due to nearby functional interactions.
Within the nucleus, genomic loci are organized in functionalcompartments, which interact on a level correlated to gene expres-sion. Hi-C aims to find these interactions by interrogating all pos-sible loci as it is not focused on pre-defined interaction sites.However, Hi-C data may incorporate many false positive signalsand include biases brought about by random and self-polymerlooping, technical and experimental inaccuracies, and biases dur-ing the experiment [95]. Hence, when using Hi-C to search forlocus interactions, the first step should be to filter the interactions,to adjust for and remove biases. An initial filtering of contacts witha mixture Poisson regression model, 23,337,830 potential inter-lociconnections were reduced to 96,137 [96]. A more accurate filteringmight be achieved by removing biases through comparison of mul-tiple Hi-C data sets [97]. The method is motivated by the idea thatequivalent biases for detecting contacts between two regions existwithin multiple datasets. To do this, an iterative correction proce-dure was applied to mapped reads to uncover relative contactprobabilities. An iterative normalization process then calculatescontact probabilities between two pairs of regions for the completeset of probability-pairs, which helps to eliminate biases.
Some Hi-C analysis methods have explicitly attempted linkingenhancers and genes. One recent method used a geometric distribu-tion-based model to form hotspots (or clusters) of adjacent Hi-Creads that represent potential sites of DNA–DNA interaction [98].This first step was done without any consideration of read pairingthat provides connection in Hi-C. Next interaction hotspots areextended by �3 kb to account for Hi-C reads being enriched atthe cut sites of the restriction enzymes used in the assay. Finally,high confidence enhancer–gene links are identified between hot-spot pairs where one contains a DHS and enhancer-related histonemodifications and a second is an annotated promoter. The two hot-spots must also be connected by 2 or more Hi-C reads. The pre-dicted enhancer–gene links were enriched with p300 bindingsites and enhancer binding TFs. Furthermore, the target promoterswere significantly bound by RNA Pol II. More recently, a statisticalapproach to distinguish between random loops, technical or exper-imental biases in the dataset and true mid-range contacts was pro-posed [99]. It extended an existing method [100] via replacing thediscrete binning approach originally used to sort out random loop-ing events, by a spline-fitting procedure to achieve an enhancedestimate of contact probability. By using this approach, 6–46% morecontacts were found compared to the original method. Validation ofthe method was done using a ChIA-PET contact catalog, resulting in77% matching enhancer–promoter interactions, which also outper-formed the original binning approach. Furthermore, predictionswere successfully compared with 3C-validated contacts.
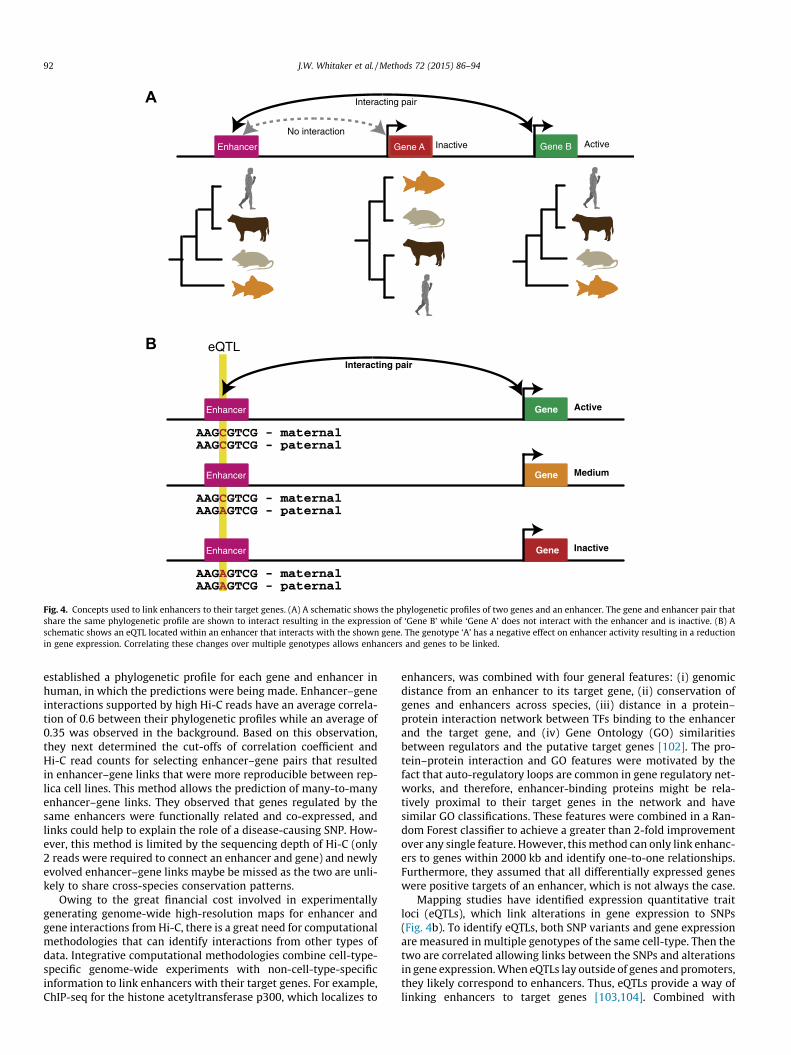
Alternatively, to remove noise in the contacts identified in Hi-C,it is also possible to combine the approach with cross-speciesconservation data (Fig. 4A) [101]. For example, Lu et al. comparedthe presence/absence of genomic regions across 45 species and
Enhancer
Interacting pair
No interaction
Gene A Gene B Active Inactive
Enhancer
Interacting pair
Gene Active
AAGCGTCG - maternalAAGCGTCG - paternal
Enhancer Gene Medium
AAGCGTCG - maternalAAGAGTCG - paternal
Enhancer Gene Inactive
AAGAGTCG - maternalAAGAGTCG - paternal
eQTL
A
B
Fig. 4. Concepts used to link enhancers to their target genes. (A) A schematic shows the phylogenetic profiles of two genes and an enhancer. The gene and enhancer pair thatshare the same phylogenetic profile are shown to interact resulting in the expression of ‘Gene B’ while ‘Gene A’ does not interact with the enhancer and is inactive. (B) Aschematic shows an eQTL located within an enhancer that interacts with the shown gene. The genotype ‘A’ has a negative effect on enhancer activity resulting in a reductionin gene expression. Correlating these changes over multiple genotypes allows enhancers and genes to be linked.
92 J.W. Whitaker et al. / Methods 72 (2015) 86–94
established a phylogenetic profile for each gene and enhancer inhuman, in which the predictions were being made. Enhancer–geneinteractions supported by high Hi-C reads have an average correla-tion of 0.6 between their phylogenetic profiles while an average of0.35 was observed in the background. Based on this observation,they next determined the cut-offs of correlation coefficient andHi-C read counts for selecting enhancer–gene pairs that resultedin enhancer–gene links that were more reproducible between rep-lica cell lines. This method allows the prediction of many-to-manyenhancer–gene links. They observed that genes regulated by thesame enhancers were functionally related and co-expressed, andlinks could help to explain the role of a disease-causing SNP. How-ever, this method is limited by the sequencing depth of Hi-C (only2 reads were required to connect an enhancer and gene) and newlyevolved enhancer–gene links maybe be missed as the two are unli-kely to share cross-species conservation patterns.
Owing to the great financial cost involved in experimentallygenerating genome-wide high-resolution maps for enhancer andgene interactions from Hi-C, there is a great need for computationalmethodologies that can identify interactions from other types ofdata. Integrative computational methodologies combine cell-type-specific genome-wide experiments with non-cell-type-specificinformation to link enhancers with their target genes. For example,ChIP-seq for the histone acetyltransferase p300, which localizes to
enhancers, was combined with four general features: (i) genomicdistance from an enhancer to its target gene, (ii) conservation ofgenes and enhancers across species, (iii) distance in a protein–protein interaction network between TFs binding to the enhancerand the target gene, and (iv) Gene Ontology (GO) similaritiesbetween regulators and the putative target genes [102]. The pro-tein–protein interaction and GO features were motivated by thefact that auto-regulatory loops are common in gene regulatory net-works, and therefore, enhancer-binding proteins might be rela-tively proximal to their target genes in the network and havesimilar GO classifications. These features were combined in a Ran-dom Forest classifier to achieve a greater than 2-fold improvementover any single feature. However, this method can only link enhanc-ers to genes within 2000 kb and identify one-to-one relationships.Furthermore, they assumed that all differentially expressed geneswere positive targets of an enhancer, which is not always the case.
Mapping studies have identified expression quantitative traitloci (eQTLs), which link alterations in gene expression to SNPs(Fig. 4b). To identify eQTLs, both SNP variants and gene expressionare measured in multiple genotypes of the same cell-type. Then thetwo are correlated allowing links between the SNPs and alterationsin gene expression. When eQTLs lay outside of genes and promoters,they likely correspond to enhancers. Thus, eQTLs provide a way oflinking enhancers to target genes [103,104]. Combined with
J.W. Whitaker et al. / Methods 72 (2015) 86–94 93
enhancer predictions made from epigenomic data, eQTLs can beused to computationally predict enhancer–gene links; such as anintegrative Random Forest model that used the following features:(i) genomic distance, (ii) co-occurrence of TF ChIP-seq peaks atenhancers and promoters, (iii) co-expression of target gene andTFs with ChIP-seq peaks at the promoter, (iv) DHS at the enhancer,(v) similarity in the GO-terms of the target gene and TFs with ChIP-seq peaks at the promoter, (iv) the strength of any CTCF peakslocated between the enhancer and target gene [105]. Using all thefeatures the method achieved a great improvement in performance,an area under the receiver operator curve (AUC) of 0.9 compared to0.75 when only a single feature was used. Furthermore, whenenhancers and genes are separated by >150 kb, the genomic dis-tance feature becomes uninformative while the other featuresremain good predictors and the overall model performance onlydecreases slightly.
3. Conclusions
The advent of next-generation sequencing has brought with it aplethora of genome-wide assays that have revolutionized our abil-ity to interrogate the genome. Owing to projects like ENCODE[106], Roadmap Epigenomics Project [13] and BLUEPRINT [107],the catalogue of human enhancers and its annotation has risen rap-idly in recent years. To accompany these advances there have beenmany sophisticated enhancer prediction and annotation methodsdeveloped. In particular, integrative analysis strategies that usemultiple genome-wide assays are becoming powerful; continuousdevelopment on the experimental and computational technologiesis likely to further improve the prediction accuracy of enhancersand enhancer-target gene linkage.
There are still many challenges ahead. Firstly, large sets of func-tionally confirmed enhancers in different cell-types, at variousdevelopmental stages and under diverse cellular conditions areneeded for developing novel computational methods and furtherinterrogating genome-wide measurements. Secondly, betterunderstanding of the mechanistic relationship between epigenom-ic modifications, eRNA transcription, and enhancer activity is crit-ical for advancing prediction and annotation of enhancers in thehuman genome. Thirdly, an emerging need is to develop computa-tional methods that can model and infer the dynamics of enhanceractivity and enhancer–gene interactions in a biological context-dependent manner. With the fast advancement of genomic andcomputational technologies, overcoming these hurdles may comemuch sooner than expected.
References
[1] C.T. Ong, V.G. Corces, Nat. Rev. Genet. 12 (2011) 283–293.[2] E. Smith, A. Shilatifard, Nat. Struct. Mol. Biol. 21 (2014) 210–219.[3] I. Krivega, A. Dean, Curr. Opin. Genet. Dev. 22 (2012) 79–85.[4] M. Bulger, M. Groudine, Cell 144 (2011) 327–339.[5] E. Calo, J. Wysocka, Mol. Cell 49 (2013) 825–837.[6] O. Hallikas, K. Palin, N. Sinjushina, R. Rautiainen, J. Partanen, E. Ukkonen, J.
Taipale, Cell 124 (2006) 47–59.[7] M. Blanchette, A.R. Bataille, X. Chen, C. Poitras, J. Laganiere, C. Lefebvre, G.
Deblois, V. Giguere, V. Ferretti, D. Bergeron, B. Coulombe, F. Robert, GenomeRes. 16 (2006) 656–668.
[8] A. Visel, S. Prabhakar, J.A. Akiyama, M. Shoukry, K.D. Lewis, A. Holt, I. Plajzer-Frick, V. Afzal, E.M. Rubin, L.A. Pennacchio, Nat. Genet. 40 (2008) 158–160.
[9] L.A. Pennacchio, N. Ahituv, A.M. Moses, S. Prabhakar, M.A. Nobrega, M.Shoukry, S. Minovitsky, I. Dubchak, A. Holt, K.D. Lewis, I. Plajzer-Frick, J.Akiyama, S. De Val, V. Afzal, B.L. Black, O. Couronne, M.B. Eisen, A. Visel, E.M.Rubin, Nature 444 (2006) 499–502.
[10] M.L. Allende, M. Manzanares, J.J. Tena, C.G. Feijoo, J.L. Gomez-Skarmeta,Methods 39 (2006) 212–219.
[11] F. Poulin, M.A. Nobrega, I. Plajzer-Frick, A. Holt, V. Afzal, E.M. Rubin, L.A.Pennacchio, Genomics 85 (2005) 774–781.
[12] ENCODE Project Consortium, PLoS Biol. 9 (2011) e1001046.[13] A. Kundaje, W. Meuleman, J. Ernst, M. Bilenky, A. Yen, J. Wang, L. Ward, A.
Sarkar, G. Quon, P. Kheradpour, A. Heravi-Moussavi, C. Coarfa, A.R. Harris, M.
Ziller, M. Schultz, M. Eaton, A. Pfenning, X. Wang, P. Polak, R. Karlic, V. Amin,Y.-C. Wu, R.S. Sandstrom, J.W. Whitaker, G. Elliott, R. Lowdon, Arthur E.Beaudet, Laurie Boyer, P. Farnham, S. Fisher, D. Haussler, S. Jones, W. Li, M.Marra, S. Sunyaev, J.A. Thomson, T.D. Tlsty, L.-H. Tsai, W. Wang, R.A.Waterland, M. Zhang, B.E. Bernstein, J.F. Costello, J.R. Ecker, M. Hirst, A.Meissner, A. Milosalvjevic, B. Ren, J.A. Stamatoyannopoulos, T. Wang, M.Kellis, Nature (2014). submitted for publication.
[14] M.J. Blow, D.J. McCulley, Z. Li, T. Zhang, J.A. Akiyama, A. Holt, I. Plajzer-Frick,M. Shoukry, C. Wright, F. Chen, V. Afzal, J. Bristow, B. Ren, B.L. Black, E.M.Rubin, A. Visel, L.A. Pennacchio, Nat. Genet. 42 (2010) 806–810.
[15] A.C. Meireles-Filho, A. Stark, Curr. Opin. Genet. Dev. 19 (2009) 565–570.[16] N. Ahituv, Y. Zhu, A. Visel, A. Holt, V. Afzal, L.A. Pennacchio, E.M. Rubin, PLoS
Biol. 5 (2007) e234.[17] G.V. Glazko, E.V. Koonin, I.B. Rogozin, S.A. Shabalina, Trends Genet. 19 (2003)
119–124.[18] L. Narlikar, N.J. Sakabe, A.A. Blanski, F.E. Arimura, J.M. Westlund, M.A.
Nobrega, I. Ovcharenko, Genome Res. 20 (2010) 381–392.[19] L. Taher, R.P. Smith, M.J. Kim, N. Ahituv, I. Ovcharenko, Genome Biol. 14
(2013) R117.[20] J.W. Whitaker, Z. Chen, W. Wang, Nat. Methods, In press. http://dx.doi.org/
10.1038/nmeth.3065, http://www.nature.om/nmeth/journal/vaop/ncurrent/abs/nmeth.3065.html.
[21] C. Fletez-Brant, D. Lee, A.S. McCallion, M.A. Beer, Nucleic Acids Res. 41 (2013)W544–556.
[22] D.U. Gorkin, D. Lee, X. Reed, C. Fletez-Brant, S.L. Bessling, S.K. Loftus, M.A.Beer, W.J. Pavan, A.S. McCallion, Genome Res. 22 (2012) 2290–2301.
[23] D. Lee, R. Karchin, M.A. Beer, Genome Res. 21 (2011) 2167–2180.[24] D.S. Johnson, A. Mortazavi, R.M. Myers, B. Wold, Science 316 (2007) 1497–
1502.[25] P.J. Farnham, Nat. Rev. Genet. 10 (2009) 605–616.[26] K.Y. Yip, C. Cheng, N. Bhardwaj, J.B. Brown, J. Leng, A. Kundaje, J. Rozowsky, E.
Birney, P. Bickel, M. Snyder, M. Gerstein, Genome Biol. 13 (2012) R48.[27] W.W. Fisher, J.J. Li, A.S. Hammonds, J.B. Brown, B.D. Pfeiffer, R. Weiszmann,
S. MacArthur, S. Thomas, J.A. Stamatoyannopoulos, M.B. Eisen, P.J. Bickel,M.D. Biggin, S.E. Celniker, Proc. Natl. Acad. Sci. U. S. A. 109 (2012) 21330–21335.
[28] X.Y. Li, S. MacArthur, R. Bourgon, D. Nix, D.A. Pollard, V.N. Iyer, A. Hechmer, L.Simirenko, M. Stapleton, C.L. Luengo, PLoS Biol. 6 (2008) e27.
[29] T. Borggrefe, X. Yue, Semin. Cell Dev. Biol. 22 (2011) 759–768.[30] R.G. Roeder, FEBS Lett. 579 (2005) 909–915.[31] R.C. Conaway, J.W. Conaway, Curr. Opin. Genet. Dev. 21 (2011) 225–230.[32] M.H. Kagey, J.J. Newman, S. Bilodeau, Y. Zhan, D.A. Orlando, N.L. van Berkum,
C.C. Ebmeier, J. Goossens, P.B. Rahl, S.S. Levine, D.J. Taatjes, J. Dekker, R.A.Young, Nature 467 (2010) 430–435.
[33] A. Visel, M.J. Blow, Z. Li, T. Zhang, J.A. Akiyama, A. Holt, I. Plajzer-Frick, M.Shoukry, C. Wright, F. Chen, V. Afzal, B. Ren, E.M. Rubin, L.A. Pennacchio,Nature 457 (2009) 854–858.
[34] D. May, M.J. Blow, T. Kaplan, D.J. McCulley, B.C. Jensen, J.A. Akiyama, A. Holt, I.Plajzer-Frick, M. Shoukry, C. Wright, V. Afzal, P.C. Simpson, E.M. Rubin, B.L.Black, J. Bristow, L.A. Pennacchio, A. Visel, Nat. Genet. 44 (2012) 89–93.
[35] S. Henikoff, Nat. Rev. Genet. 9 (2008) 15–26.[36] N.D. Heintzman, R.K. Stuart, G. Hon, Y. Fu, C.W. Ching, R.D. Hawkins, L.O.
Barrera, S. Van Calcar, C. Qu, K.A. Ching, W. Wang, Z. Weng, R.D. Green, G.E.Crawford, B. Ren, Nat. Genet. 39 (2007) 311–318.
[37] M.P. Creyghton, A.W. Cheng, G.G. Welstead, T. Kooistra, B.W. Carey, E.J. Steine,J. Hanna, M.A. Lodato, G.M. Frampton, P.A. Sharp, L.A. Boyer, R.A. Young, R.Jaenisch, Proc. Natl. Acad. Sci. U. S. A. 107 (2010) 21931–21936.
[38] A. Rada-Iglesias, R. Bajpai, T. Swigut, S.A. Brugmann, R.A. Flynn, J. Wysocka,Nature 470 (2011) 279–283.
[39] G. Hon, B. Ren, W. Wang, PLoS Comput. Biol. 4 (2008) e1000201.[40] G. Hon, W. Wang, B. Ren, PLoS Comput. Biol. 5 (2009) e1000566.[41] Z. Wang, C. Zang, J.A. Rosenfeld, D.E. Schones, A. Barski, S. Cuddapah, K. Cui,
T.Y. Roh, W. Peng, M.Q. Zhang, K. Zhao, Nat. Genet. 40 (2008) 897–903.[42] H.A. Firpi, D. Ucar, K. Tan, Bioinformatics 26 (2010) 1579–1586.[43] M. Fernandez, D. Miranda-Saavedra, Nucleic Acids Res. 40 (2012) e77.[44] N. Rajagopal, W. Xie, Y. Li, U. Wagner, W. Wang, J. Stamatoyannopoulos, J.
Ernst, M. Kellis, B. Ren, PLoS Comput. Biol. 9 (2013) e1002968.[45] K.J. Won, I. Chepelev, B. Ren, W. Wang, BMC Bioinf. 9 (2008) 547.[46] J. Ernst, P. Kheradpour, T.S. Mikkelsen, N. Shoresh, L.D. Ward, C.B. Epstein, X.
Zhang, L. Wang, R. Issner, M. Coyne, M. Ku, T. Durham, M. Kellis, B.E.Bernstein, Nature 473 (2011) 43–49.
[47] M.M. Hoffman, J. Ernst, S.P. Wilder, A. Kundaje, R.S. Harris, M. Libbrecht, B.Giardine, P.M. Ellenbogen, J.A. Bilmes, E. Birney, R.C. Hardison, I. Dunham, M.Kellis, W.S. Noble, Nucleic Acids Res. 41 (2012) 827–841.
[48] M.M. Hoffman, O.J. Buske, J. Wang, Z. Weng, J.A. Bilmes, W.S. Noble, Nat.Methods 9 (2012) 473–476.
[49] K.J. Won, X. Zhang, T. Wang, B. Ding, D. Raha, M. Snyder, B. Ren, W. Wang,Nucleic Acids Res. 41 (2013) 4423–4432.
[50] H.H. He, C.A. Meyer, H. Shin, S.T. Bailey, G. Wei, Q. Wang, Y. Zhang, K. Xu, M.Ni, M. Lupien, P. Mieczkowski, J.D. Lieb, K. Zhao, M. Brown, X.S. Liu, Nat.Genet. 42 (2010) 343–347.
[51] N.D. Heintzman, G.C. Hon, R.D. Hawkins, P. Kheradpour, A. Stark, L.F. Harp, Z.Ye, L.K. Lee, R.K. Stuart, C.W. Ching, K.A. Ching, J.E. Antosiewicz-Bourget, H.Liu, X. Zhang, R.D. Green, V.V. Lobanenkov, R. Stewart, J.A. Thomson, G.E.Crawford, M. Kellis, B. Ren, Nature 459 (2009) 108–112.
[52] J. Ernst, M. Kellis, Nat. Methods 9 (2012) 215–216.
94 J.W. Whitaker et al. / Methods 72 (2015) 86–94
[53] G.C. Hon, N. Rajagopal, Y. Shen, D.F. McCleary, F. Yue, M.D. Dang, B. Ren, Nat.Genet. 45 (2013) 1198–1206.
[54] W. Xie, M.D. Schultz, R. Lister, Z. Hou, N. Rajagopal, P. Ray, J.W. Whitaker, S.Tian, R.D. Hawkins, D. Leung, H. Yang, T. Wang, A.Y. Lee, S.A. Swanson, J.Zhang, Y. Zhu, A. Kim, J.R. Nery, M.A. Urich, S. Kuan, C.A. Yen, S. Klugman, P.Yu, K. Suknuntha, N.E. Propson, H. Chen, L.E. Edsall, U. Wagner, Y. Li, Z. Ye, A.Kulkarni, Z. Xuan, W.Y. Chung, N.C. Chi, J.E. Antosiewicz-Bourget, I. Slukvin, R.Stewart, M.Q. Zhang, W. Wang, J.A. Thomson, J.R. Ecker, B. Ren, Cell 153(2013) 1134–1148.
[55] M.J. Ziller, H. Gu, F. Muller, J. Donaghey, L.T. Tsai, O. Kohlbacher, P.L. De Jager,E.D. Rosen, D.A. Bennett, B.E. Bernstein, A. Gnirke, A. Meissner, Nature 500(2013) 477–481.
[56] K. Nakano, J.W. Whitaker, D.L. Boyle, W. Wang, G.S. Firestein, Ann. Rheum.Dis. 72 (2013) 110–117.
[57] J.W. Whitaker, R. Shoemaker, D.L. Boyle, J. Hillman, D. Anderson, W. Wang,G.S. Firestein, Genome Med. 5 (2013) 40.
[58] M.B. Stadler, R. Murr, L. Burger, R. Ivanek, F. Lienert, A. Scholer, E. vanNimwegen, C. Wirbelauer, E.J. Oakeley, D. Gaidatzis, V.K. Tiwari, D. Schubeler,Nature 480 (2011) 490–495.
[59] D.I. Schroeder, P. Lott, I. Korf, J.M. LaSalle, Genome Res. 21 (2011) 1583–1591.[60] L. Burger, D. Gaidatzis, D. Schubeler, M.B. Stadler, Nucleic Acids Res. 41 (2013)
e155.[61] D. Aran, S. Sabato, A. Hellman, Genome Biol. 14 (2013) R21.[62] C.Y. Chen, Q. Morris, J.A. Mitchell, BMC Genomics 13 (2012) 152.[63] A. Podsiadło, M. Wrzesien, W. Paja, W. Rudnicki, B. Wilczynski, BMC Syst. Biol.
7 (2013) S16.[64] C.D. Arnold, D. Gerlach, C. Stelzer, L.M. Boryn, M. Rath, A. Stark, Science 339
(2013) 1074–1077.[65] M.F. Melgar, F.S. Collins, P. Sethupathy, Genome Biol. 12 (2011) R113.[66] A.P. Boyle, S. Davis, H.P. Shulha, P. Meltzer, E.H. Margulies, Z. Weng, T.S. Furey,
G.E. Crawford, Cell 132 (2008) 311–322.[67] M.A. Nobrega, I. Ovcharenko, V. Afzal, E.M. Rubin, Science 302 (2003) 413.[68] A. Pekowska, T. Benoukraf, J. Zacarias-Cabeza, M. Belhocine, F. Koch, H. Holota,
J. Imbert, J.C. Andrau, P. Ferrier, S. Spicuglia, EMBO J. 30 (2011) 4198–4210.[69] S. Bonn, R.P. Zinzen, C. Girardot, E.H. Gustafson, A. Perez-Gonzalez, N.
Delhomme, Y. Ghavi-Helm, B. Wilczynski, A. Riddell, E.E. Furlong, Nat. Genet.44 (2012) 148–156.
[70] G.E. Zentner, P.J. Tesar, P.C. Scacheri, Genome Res. 21 (2011) 1273–1283.[71] D. Tuan, S. Kong, K. Hu, Proc. Natl. Acad. Sci. U. S. A. 89 (1992) 11219–11223.[72] T.K. Kim, M. Hemberg, J.M. Gray, A.M. Costa, D.M. Bear, J. Wu, D.A. Harmin, M.
Laptewicz, K. Barbara-Haley, S. Kuersten, E. Markenscoff-Papadimitriou, D.Kuhl, H. Bito, P.F. Worley, G. Kreiman, M.E. Greenberg, Nature 465 (2010)182–187.
[73] D. Wang, I. Garcia-Bassets, C. Benner, W. Li, X. Su, Y. Zhou, J. Qiu, W. Liu, M.U.Kaikkonen, K.A. Ohgi, C.K. Glass, M.G. Rosenfeld, X.D. Fu, Nature 474 (2011)390–394.
[74] W. Li, D. Notani, Q. Ma, B. Tanasa, E. Nunez, A.Y. Chen, D. Merkurjev, J. Zhang,K. Ohgi, X. Song, S. Oh, H.S. Kim, C.K. Glass, M.G. Rosenfeld, Nature 498 (2013)516–520.
[75] Y. Zhu, L. Sun, Z. Chen, J.W. Whitaker, T. Wang, W. Wang, Nucleic Acids Res.41 (2013) 10032–10043.
[76] O. Bogdanovic, A. Fernandez-Minan, J.J. Tena, E. de la Calle-Mustienes, C.Hidalgo, I. van Kruysbergen, S.J. van Heeringen, G.J. Veenstra, J.L. Gomez-Skarmeta, Genome Res. 22 (2012) 2043–2053.
[77] J. Cotney, J. Leng, S. Oh, L.E. DeMare, S.K. Reilly, M.B. Gerstein, J.P. Noonan,Genome Res. 22 (2012) 1069–1080.
[78] N. Hah, S. Murakami, A. Nagari, C.G. Danko, W.L. Kraus, Genome Res. 23(2013) 1210–1223.
[79] R. Andersson, C. Gebhard, I. Miguel-Escalada, I. Hoof, J. Bornholdt, M. Boyd, Y.Chen, X. Zhao, C. Schmidl, T. Suzuki, E. Ntini, E. Arner, E. Valen, K. Li, L.Schwarzfischer, D. Glatz, J. Raithel, B. Lilje, N. Rapin, F.O. Bagger, M. Jorgensen,P.R. Andersen, N. Bertin, O. Rackham, A.M. Burroughs, J.K. Baillie, Y. Ishizu, Y.Shimizu, E. Furuhata, S. Maeda, Y. Negishi, C.J. Mungall, T.F. Meehan, T.Lassmann, M. Itoh, H. Kawaji, N. Kondo, J. Kawai, A. Lennartsson, C.O. Daub, P.Heutink, D.A. Hume, T.H. Jensen, H. Suzuki, Y. Hayashizaki, F. Muller, A.R.Forrest, P. Carninci, M. Rehli, A. Sandelin, M.J. de Hoon, V. Haberle, I.V.Kulakovskiy, M. Lizio, S. Schmeier, E. Dimont, C. Schmid, U. Schaefer, Y.A.Medvedeva, C. Plessy, M. Vitezic, J. Severin, C.A. Semple, R.S. Young, M.Francescatto, I. Alam, D. Albanese, G.M. Altschuler, T. Arakawa, J.A. Archer, P.Arner, M. Babina, S. Rennie, P.J. Balwierz, A.G. Beckhouse, S. Pradhan-Bhatt,J.A. Blake, A. Blumenthal, B. Bodega, A. Bonetti, J. Briggs, F. Brombacher, A.Califano, C.V. Cannistraci, D. Carbajo, M. Chierici, Y. Ciani, H.C. Clevers, E.Dalla, C.A. Davis, M. Detmar, A.D. Diehl, T. Dohi, F. Drablos, A.S. Edge, M.Edinger, K. Ekwall, M. Endoh, H. Enomoto, M. Fagiolini, L. Fairbairn, H. Fang,M.C. Farach-Carson, G.J. Faulkner, A.V. Favorov, M.E. Fisher, M.C. Frith, R.Fujita, S. Fukuda, C. Furlanello, M. Furuno, J. Furusawa, T.B. Geijtenbeek, A.P.Gibson, T. Gingeras, D. Goldowitz, J. Gough, S. Guhl, R. Guler, S. Gustincich, T.J.Ha, M. Hamaguchi, M. Hara, M. Harbers, J. Harshbarger, A. Hasegawa, Y.Hasegawa, T. Hashimoto, M. Herlyn, K.J. Hitchens, S.J. Ho Sui, O.M. Hofmann,F. Hori, L. Huminiecki, K. Iida, T. Ikawa, B.R. Jankovic, H. Jia, A. Joshi, G. Jurman,B. Kaczkowski, C. Kai, K. Kaida, A. Kaiho, K. Kajiyama, M. Kanamori-Katayama,A.S. Kasianov, T. Kasukawa, S. Katayama, S. Kato, S. Kawaguchi, H. Kawamoto,Y.I. Kawamura, T. Kawashima, J.S. Kempfle, T.J. Kenna, J. Kere, L.M.Khachigian, T. Kitamura, S.P. Klinken, A.J. Knox, M. Kojima, S. Kojima, H.Koseki, S. Koyasu, S. Krampitz, A. Kubosaki, A.T. Kwon, J.F. Laros, W. Lee, L.Lipovich, A. Mackay-sim, R. Manabe, J.C. Mar, B. Marchand, A. Mathelier, N.
Mejhert, A. Meynert, Y. Mizuno, D.A. de Lima Morais, H. Morikawa, M.Morimoto, K. Moro, E. Motakis, H. Motohashi, C.L. Mummery, M. Murata, S.Nagao-Sato, Y. Nakachi, F. Nakahara, T. Nakamura, Y. Nakamura, K. Nakazato,E. van Nimwegen, N. Ninomiya, H. Nishiyori, S. Noma, T. Nozaki, S. Ogishima,N. Ohkura, H. Ohmiya, H. Ohno, M. Ohshima, M. Okada-Hatakeyama, Y.Okazaki, V. Orlando, D.A. Ovchinnikov, A. Pain, R. Passier, M. Patrikakis, H.Persson, S. Piazza, J.G. Prendergast, O.J. Rackham, J.A. Ramilowski, M. Rashid,T. Ravasi, P. Rizzu, M. Roncador, S. Roy, M.B. Rye, E. Saijyo, A. Sajantila, A. Saka,S. Sakaguchi, M. Sakai, H. Sato, H. Satoh, S. Savvi, A. Saxena, C. Schneider, E.A.Schultes, G.G. Schulze-Tanzil, A. Schwegmann, T. Sengstag, G. Sheng, H.Shimoji, Y. Shimoni, J.W. Shin, C. Simon, D. Sugiyama, T. Sugiyama, M. Suzuki,N. Suzuki, R.K. Swoboda, P.A. t Hoen, M. Tagami, N. Takahashi, J. Takai, H.Tanaka, H. Tatsukawa, Z. Tatum, M. Thompson, H. Toyoda, T. Toyoda, M. vande Wetering, L.M. van den Berg, R. Verardo, D. Vijayan, I.E. Vorontsov, W.W.Wasserman, S. Watanabe, C.A. Wells, L.N. Winteringham, E. Wolvetang, E.J.Wood, Y. Yamaguchi, M. Yamamoto, M. Yoneda, Y. Yonekura, S. Yoshida, S.E.Zabierowski, P.G. Zhang, S. Zucchelli, K.M. Summers, W. Hide, T.C. Freeman, B.Lenhard, V.B. Bajic, M.S. Taylor, V.J. Makeev, Nature 507 (2014) 455–461.
[80] K.J. Won, Z. Xu, X. Zhang, J.W. Whitaker, R. Shoemaker, B. Ren, Y. Xu, W.Wang, Nucleic Acids Res. 40 (2012) 8199–8209.
[81] S.A. Vokes, H. Ji, W.H. Wong, A.P. McMahon, Genes Dev. 22 (2008) 2651–2663.
[82] D. Dorsett, Curr. Opin. Genet. Dev. 9 (1999) 505–514.[83] E. Ferretti, F. Cambronero, S. Tumpel, E. Longobardi, L.M. Wiedemann, F. Blasi,
R. Krumlauf, Mol. Cell. Biol. 25 (2005) 8541–8552.[84] A. Sanyal, B.R. Lajoie, G. Jain, J. Dekker, Nature 489 (2012) 109–113.[85] J.E. Phillips, V.G. Corces, Cell 137 (2009) 1194–1211.[86] Y. Shen, F. Yue, D.F. McCleary, Z. Ye, L. Edsall, S. Kuan, U. Wagner, J. Dixon, L.
Lee, V.V. Lobanenkov, B. Ren, Nature 488 (2012) 116–120.[87] J. Dekker, K. Rippe, M. Dekker, N. Kleckner, Science 295 (2002) 1306–1311.[88] M.N. Weedon, I. Cebola, A.M. Patch, S.E. Flanagan, E. De Franco, R. Caswell, S.A.
Rodriguez-Segui, C. Shaw-Smith, C.H. Cho, H. Lango, Nat. Genet. 46 (2014)61–64.
[89] J. Dostie, T.A. Richmond, R.A. Arnaout, R.R. Selzer, W.L. Lee, T.A. Honan, E.D.Rubio, A. Krumm, J. Lamb, C. Nusbaum, R.D. Green, J. Dekker, Genome Res. 16(2006) 1299–1309.
[90] E. Lieberman-Aiden, N.L. van Berkum, L. Williams, M. Imakaev, T. Ragoczy, A.Telling, I. Amit, B.R. Lajoie, P.J. Sabo, M.O. Dorschner, R. Sandstrom, B.Bernstein, M.A. Bender, M. Groudine, A. Gnirke, J. Stamatoyannopoulos, L.A.Mirny, E.S. Lander, J. Dekker, Science 326 (2009) 289–293.
[91] F. Jin, Y. Li, J.R. Dixon, S. Selvaraj, Z. Ye, A.Y. Lee, C.A. Yen, A.D. Schmitt, C.A.Espinoza, B. Ren, Nature 503 (2013) 290–294.
[92] M.J. Fullwood, M.H. Liu, Y.F. Pan, J. Liu, H. Xu, Y.B. Mohamed, Y.L. Orlov, S.Velkov, A. Ho, P.H. Mei, E.G. Chew, P.Y. Huang, W.J. Welboren, Y. Han, H.S. Ooi,P.N. Ariyaratne, V.B. Vega, Y. Luo, P.Y. Tan, P.Y. Choy, K.D. Wansa, B. Zhao, K.S.Lim, S.C. Leow, J.S. Yow, R. Joseph, H. Li, K.V. Desai, J.S. Thomsen, Y.K. Lee, R.K.Karuturi, T. Herve, G. Bourque, H.G. Stunnenberg, X. Ruan, V. Cacheux-Rataboul, W.K. Sung, E.T. Liu, C.L. Wei, E. Cheung, Y. Ruan, Nature 462 (2009)58–64.
[93] L. Handoko, H. Xu, G. Li, C.Y. Ngan, E. Chew, M. Schnapp, C.W. Lee, C. Ye, J.L.Ping, F. Mulawadi, E. Wong, J. Sheng, Y. Zhang, T. Poh, C.S. Chan, G. Kunarso, A.Shahab, G. Bourque, V. Cacheux-Rataboul, W.K. Sung, Y. Ruan, C.L. Wei, Nat.Genet. 43 (2011) 630–638.
[94] Y. Zhang, C.H. Wong, R.Y. Birnbaum, G. Li, R. Favaro, C.Y. Ngan, J. Lim, E. Tai,H.M. Poh, E. Wong, F.H. Mulawadi, W.K. Sung, S. Nicolis, N. Ahituv, Y. Ruan,C.L. Wei, Nature 504 (2013) 306–310.
[95] J. Dekker, M.A. Marti-Renom, L.A. Mirny, Nat. Rev. Genet. 14 (2013) 390–403.[96] X. Lan, H. Witt, K. Katsumura, Z. Ye, Q. Wang, E.H. Bresnick, P.J. Farnham, V.X.
Jin, Nucleic Acids Res. 40 (2012) 7690–7704.[97] M. Imakaev, G. Fudenberg, R.P. McCord, N. Naumova, A. Goloborodko, B.R.
Lajoie, J. Dekker, L.A. Mirny, Nat. Methods 9 (2012) 999–1003.[98] Y.C. Hwang, Q. Zheng, B.D. Gregory, L.S. Wang, Nucleic Acids Res. 41 (2013)
4835–4846.[99] F. Ay, T.L. Bailey, W.S. Noble, Genome Res. 24 (2014) 999–1011.
[100] Z. Duan, M. Andronescu, K. Schutz, S. McIlwain, Y.J. Kim, C. Lee, J. Shendure, S.Fields, C.A. Blau, W.S. Noble, Nature 465 (2010) 363–367.
[101] Y. Lu, Y. Zhou, W. Tian, Nucleic Acids Res. 41 (2013) 10391–10402.[102] C. Rodelsperger, G. Guo, M. Kolanczyk, A. Pletschacher, S. Kohler, S. Bauer,
M.H. Schulz, P.N. Robinson, Nucleic Acids Res. 39 (2011) 2492–2502.[103] A.S. Dimas, S. Deutsch, B.E. Stranger, S.B. Montgomery, C. Borel, H. Attar-
Cohen, C. Ingle, C. Beazley, M. Gutierrez, Science 325 (2009) 1246–1250.[104] S.B. Montgomery, M. Sammeth, M. Gutierrez-Arcelus, R.P. Lach, C. Ingle, J.
Nisbett, R. Guigo, E.T. Dermitzakis, Nature 464 (2010) 773–777.[105] D. Wang, A. Rendon, L. Wernisch, Nucleic Acids Res. 41 (2013) 1450–1463.[106] B.E. Bernstein, E. Birney, I. Dunham, E.D. Green, C. Gunter, M. Snyder, Nature
489 (2012) 57–74.[107] D. Adams, L. Altucci, S.E. Antonarakis, J. Ballesteros, S. Beck, A. Bird, C. Bock, B.
Boehm, E. Campo, A. Caricasole, F. Dahl, E.T. Dermitzakis, T. Enver, M. Esteller,X. Estivill, A. Ferguson-Smith, J. Fitzgibbon, P. Flicek, C. Giehl, T. Graf, F.Grosveld, R. Guigo, I. Gut, K. Helin, J. Jarvius, R. Kuppers, H. Lehrach, T.Lengauer, A. Lernmark, D. Leslie, M. Loeffler, E. Macintyre, A. Mai, J.H.Martens, S. Minucci, W.H. Ouwehand, P.G. Pelicci, H. Pendeville, B. Porse, V.Rakyan, W. Reik, M. Schrappe, D. Schubeler, M. Seifert, R. Siebert, D. Simmons,N. Soranzo, S. Spicuglia, M. Stratton, H.G. Stunnenberg, A. Tanay, D. Torrents,A. Valencia, E. Vellenga, M. Vingron, J. Walter, S. Willcocks, Nat. Biotechnol.30 (2012) 224–226.