Embed Size (px)
Citation preview
Computational Modeling of Plasmon-Enhanced Light Absorption ina Multicomponent Dye Sensitized Solar CellHanning Chen, Martin G. Blaber, Stacey D. Standridge, Erica J. DeMarco, Joseph T. Hupp,Mark A. Ratner, and George C. Schatz*
Argonne-Northwestern Solar Energy Research Center Department of Chemistry, Northwestern University, 2145 Sheridan Road,Evanston, Illinois 60208, United States
*S Supporting Information
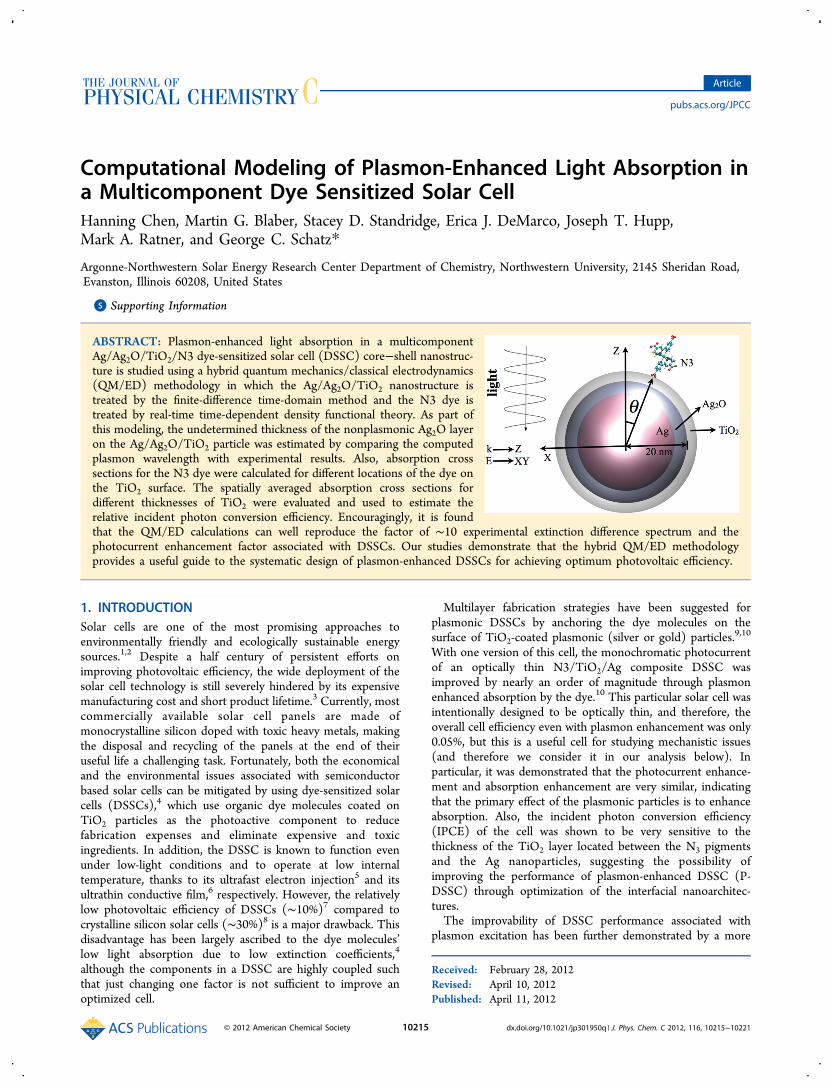
ABSTRACT: Plasmon-enhanced light absorption in a multicomponentAg/Ag2O/TiO2/N3 dye-sensitized solar cell (DSSC) core−shell nanostruc-ture is studied using a hybrid quantum mechanics/classical electrodynamics(QM/ED) methodology in which the Ag/Ag2O/TiO2 nanostructure istreated by the finite-difference time-domain method and the N3 dye istreated by real-time time-dependent density functional theory. As part ofthis modeling, the undetermined thickness of the nonplasmonic Ag2O layeron the Ag/Ag2O/TiO2 particle was estimated by comparing the computedplasmon wavelength with experimental results. Also, absorption crosssections for the N3 dye were calculated for different locations of the dye onthe TiO2 surface. The spatially averaged absorption cross sections fordifferent thicknesses of TiO2 were evaluated and used to estimate therelative incident photon conversion efficiency. Encouragingly, it is foundthat the QM/ED calculations can well reproduce the factor of ∼10 experimental extinction difference spectrum and thephotocurrent enhancement factor associated with DSSCs. Our studies demonstrate that the hybrid QM/ED methodologyprovides a useful guide to the systematic design of plasmon-enhanced DSSCs for achieving optimum photovoltaic efficiency.
1. INTRODUCTIONSolar cells are one of the most promising approaches toenvironmentally friendly and ecologically sustainable energysources.1,2 Despite a half century of persistent efforts onimproving photovoltaic efficiency, the wide deployment of thesolar cell technology is still severely hindered by its expensivemanufacturing cost and short product lifetime.3 Currently, mostcommercially available solar cell panels are made ofmonocrystalline silicon doped with toxic heavy metals, makingthe disposal and recycling of the panels at the end of theiruseful life a challenging task. Fortunately, both the economicaland the environmental issues associated with semiconductorbased solar cells can be mitigated by using dye-sensitized solarcells (DSSCs),4 which use organic dye molecules coated onTiO2 particles as the photoactive component to reducefabrication expenses and eliminate expensive and toxicingredients. In addition, the DSSC is known to function evenunder low-light conditions and to operate at low internaltemperature, thanks to its ultrafast electron injection5 and itsultrathin conductive film,6 respectively. However, the relativelylow photovoltaic efficiency of DSSCs (∼10%)7 compared tocrystalline silicon solar cells (∼30%)8 is a major drawback. Thisdisadvantage has been largely ascribed to the dye molecules’low light absorption due to low extinction coefficients,4
although the components in a DSSC are highly coupled suchthat just changing one factor is not sufficient to improve anoptimized cell.
Multilayer fabrication strategies have been suggested forplasmonic DSSCs by anchoring the dye molecules on thesurface of TiO2-coated plasmonic (silver or gold) particles.9,10
With one version of this cell, the monochromatic photocurrentof an optically thin N3/TiO2/Ag composite DSSC wasimproved by nearly an order of magnitude through plasmonenhanced absorption by the dye.10 This particular solar cell wasintentionally designed to be optically thin, and therefore, theoverall cell efficiency even with plasmon enhancement was only0.05%, but this is a useful cell for studying mechanistic issues(and therefore we consider it in our analysis below). Inparticular, it was demonstrated that the photocurrent enhance-ment and absorption enhancement are very similar, indicatingthat the primary effect of the plasmonic particles is to enhanceabsorption. Also, the incident photon conversion efficiency(IPCE) of the cell was shown to be very sensitive to thethickness of the TiO2 layer located between the N3 pigmentsand the Ag nanoparticles, suggesting the possibility ofimproving the performance of plasmon-enhanced DSSC (P-DSSC) through optimization of the interfacial nanoarchitec-tures.The improvability of DSSC performance associated with
plasmon excitation has been further demonstrated by a more
Received: February 28, 2012Revised: April 10, 2012Published: April 11, 2012
Article
pubs.acs.org/JPCC
© 2012 American Chemical Society 10215 dx.doi.org/10.1021/jp301950q | J. Phys. Chem. C 2012, 116, 10215−10221
recent study that exhibits a perfect match at 525 nm betweenthe absorption maxima of the Z907 dye and the plasmonwavelength of SiO2-coated Au nanoparticles when both of themare integrated into mesoporous TiO2.
11 Although a shorterexcited-state lifetime is usually observed when a dye moleculeinteracts with a plasmonic resonance,12 the overall rate ofelectron transfer is still faster. Presumably, this is due toplasmon-enhanced light absorption, which arises from thelocally amplified field at the position of the dye molecules.13
In another recent study, Jeong et al.14 demonstrated a 25%improvement in efficiency with plasmon-enhancement for a P-DSSC solar cell that has an overall efficiency of 8.9%. Relatedresults have been reported in other papers.15,16 These show thatplasmon enhancement effects can be important even for cellsthat have high efficiency.In order to understand fully the mechanism for plasmon-
enhanced light absorption by dye molecules on thin-filmelectrodes and to aid in the systematic design of P-DSSCs toachieve maximum IPCE results, a general theoretical modelwould be very useful. Such a model needs to describe thequantum characteristics of individual electronic transitions ofthe dye molecules; it also needs to describe the optical responseof the coated metallic nanoparticles. Since the latter is mainlyinduced by the large collective motions of the conductionelectrons, a classical electrodynamics mean-field approachshould be sufficient. It has been shown that accuratesimulations of the optical response of small particles andnanostructures with gaps on the order of 1 nm requires theinclusion of quantum effects in the electrodynamics.17,18 Here,the particles have diameters >10 nm, and as such, a classicalelectrodynamics mean-field approach should be adequate.Although quantum effects can be neglected from the electro-dynamics of the nanoparticle, a unified theoretical framework isstill required, balancing the accuracy of quantum theory for themolecule and the efficiency of classical electrodynamics for theparticle. To meet these challenges, a hybrid quantummechanics/classical electrodynamics (QM/ED) method19 wasrecently developed. This method dynamically incorporatespolarization associated with the nanostructure into an opticalproperty calculation for nearby dye molecules. Our version ofQM/ED is done in the time-domain, which means that thedipole coupling Hamiltonian is added to the dye molecule’stime-dependent quantum Hamiltonian to determine theinduced polarization in the molecule, from which the opticalbehavior is determined. The time-dependent electric field inthis dipole Hamiltonian is described by classical electro-dynamics associated with light interacting with the nanoparticle,and in this case, we obtain the time-dependent field using thefinite-difference time-domain (FDTD) method. The hybridQM/ED approach is particularly suitable for our N3/TiO2/Agcomposite model system, as only a modest number of CPUcycles are needed to treat the N3 dye optical response using thereal-time time-dependent density functional theory (RT-TDDFT)20 while the FDTD calculation21 uses even fewerresources to describe the optical properties of the TiO2/Ag2O/Ag substrate.The N3 dye is one of the most popular light harvesters in
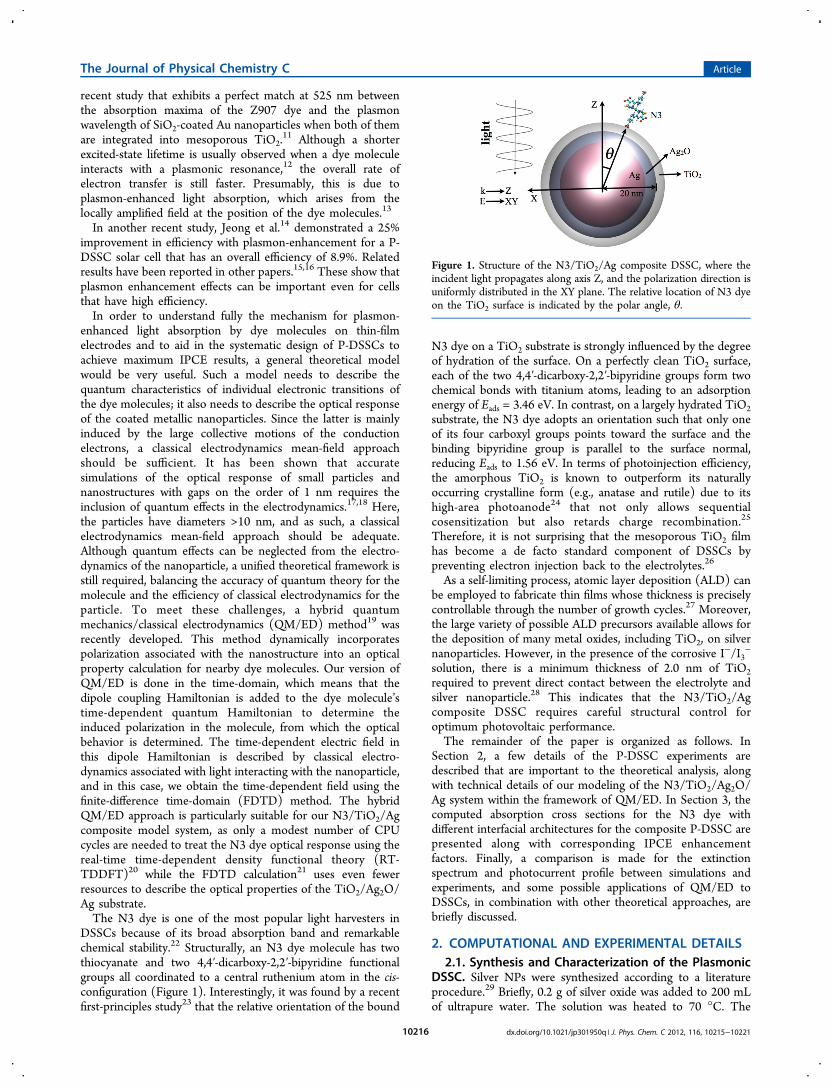
DSSCs because of its broad absorption band and remarkablechemical stability.22 Structurally, an N3 dye molecule has twothiocyanate and two 4,4′-dicarboxy-2,2′-bipyridine functionalgroups all coordinated to a central ruthenium atom in the cis-configuration (Figure 1). Interestingly, it was found by a recentfirst-principles study23 that the relative orientation of the bound
N3 dye on a TiO2 substrate is strongly influenced by the degreeof hydration of the surface. On a perfectly clean TiO2 surface,each of the two 4,4′-dicarboxy-2,2′-bipyridine groups form twochemical bonds with titanium atoms, leading to an adsorptionenergy of Eads = 3.46 eV. In contrast, on a largely hydrated TiO2substrate, the N3 dye adopts an orientation such that only oneof its four carboxyl groups points toward the surface and thebinding bipyridine group is parallel to the surface normal,reducing Eads to 1.56 eV. In terms of photoinjection efficiency,the amorphous TiO2 is known to outperform its naturallyoccurring crystalline form (e.g., anatase and rutile) due to itshigh-area photoanode24 that not only allows sequentialcosensitization but also retards charge recombination.25
Therefore, it is not surprising that the mesoporous TiO2 filmhas become a de facto standard component of DSSCs bypreventing electron injection back to the electrolytes.26
As a self-limiting process, atomic layer deposition (ALD) canbe employed to fabricate thin films whose thickness is preciselycontrollable through the number of growth cycles.27 Moreover,the large variety of possible ALD precursors available allows forthe deposition of many metal oxides, including TiO2, on silvernanoparticles. However, in the presence of the corrosive I−/I3
−
solution, there is a minimum thickness of 2.0 nm of TiO2required to prevent direct contact between the electrolyte andsilver nanoparticle.28 This indicates that the N3/TiO2/Agcomposite DSSC requires careful structural control foroptimum photovoltaic performance.The remainder of the paper is organized as follows. In
Section 2, a few details of the P-DSSC experiments aredescribed that are important to the theoretical analysis, alongwith technical details of our modeling of the N3/TiO2/Ag2O/Ag system within the framework of QM/ED. In Section 3, thecomputed absorption cross sections for the N3 dye withdifferent interfacial architectures for the composite P-DSSC arepresented along with corresponding IPCE enhancementfactors. Finally, a comparison is made for the extinctionspectrum and photocurrent profile between simulations andexperiments, and some possible applications of QM/ED toDSSCs, in combination with other theoretical approaches, arebriefly discussed.
2. COMPUTATIONAL AND EXPERIMENTAL DETAILS2.1. Synthesis and Characterization of the Plasmonic
DSSC. Silver NPs were synthesized according to a literatureprocedure.29 Briefly, 0.2 g of silver oxide was added to 200 mLof ultrapure water. The solution was heated to 70 °C. The
Figure 1. Structure of the N3/TiO2/Ag composite DSSC, where theincident light propagates along axis Z, and the polarization direction isuniformly distributed in the XY plane. The relative location of N3 dyeon the TiO2 surface is indicated by the polar angle, θ.
The Journal of Physical Chemistry C Article
dx.doi.org/10.1021/jp301950q | J. Phys. Chem. C 2012, 116, 10215−1022110216
reaction proceeded for 4 h under a hydrogen atmosphere.Fluorine-doped tin oxide (FTO) was sonicated for 10 min eachin soapy water, ethanol, and acetone. The slides were rinsedwith isopropanol and dried under flowing nitrogen. The slideswere soaked for 3 h in a 2 wt % solution of 4-(polyvinyl)-pyridine (2 wt %) in ethanol. The slides were heated for 1 h at110 °C and then were soaked in the colloidal silver solution for24 h.Amorphous TiO2 was deposited from a titanium isoprop-
oxide (TIP) precursor using a Cambridge Nanotech Savannah100 ALD system. The chamber temperature and the TIPprecursor were held at 200 and 80 °C, respectively. The waterwas at room temperature, and the N2 flow rate was 20 sccm.The precursors were pulsed for 0.1 s each and held in thechamber for 1 s followed by a 12 s pump. Clean silicon chipswere coated concurrently with the samples to monitor TiO2film growth. Slides were soaked in a 0.5 mM solution of N3 dyein ethanol for 24 h.The thicknesses were measured with a J.A. Woolam Co.
M2000 variable angle spectroscopic ellipsometer. All thick-nesses were relative to an uncoated wafer. The extinctionspectra of the samples were measured with a Cary 5000 UV−vis-NIR spectrometer. A Hitachi S-4800 SEM was used with a10.0 kV accelerating voltage to obtain micrographs for Ag NPsize characterization.2.2. Architecture of the N3/TiO2/Ag Composite DSSC.
The solar cell consists of core−shell nanoparticles (schemati-cally pictured in Figure 1) that are deposited in anelectrochemical cell with FTO electrodes and an I−/I3
−
electrolyte as previously described by Standridge et al.10 Sinceneither the I−/I3
− electrolyte solution nor the workingelectrode is photoactive, they are not included in our theoreticalmodeling. As shown in Figure 1, the N3 dye is adsorbed on thesurface of the TiO2 layer. Between TiO2 and the Agnanoparticle core, there is an intermediate layer of Ag2O.
30
This Ag2O layer is an oxidation byproduct of ALD underambient conditions and can be diminished by high-vacuumsputtering.27 Although the diameter of the oxidized Ag core wasdetermined to be 36 ± 3 nm by scanning electron microscopy(SEM)10 as shown in the Supporting Information, the thicknessof the Ag2O layer, DAg2O, is not yet known and will be estimatedby our FDTD calculations.Given the typical 1 nm uncertainty in SEM measurements,
RAg + DAg2O is taken to be 20 nm as an upper limit to theoxidized Ag particle size, where RAg is the radius of the pure Agcore. At the same time, the thickness of the TiO2 layer, DTiO2
,has been accurately measured by variable angle spectroscopicellipsometer relative to an uncoated silicon wafer. In thepresent study, three values of DTiO2
were investigated: 2.0, 4.2,and 8.3 nm.In the absence of experimental evidence for preferred
binding sites of the N3 dye on the surface, the N3 is assumedto be homogeneously distributed on the TiO2 surface with apolar angle θ (see Figure 1) that is equally spaced by 15° fromθ = 0° to θ = 180°. Also, the N3 is assumed bound through onecarboxylate group, and azumuthal effects are dealt with bypolarization averaging. To mimic direct solar radiationperpendicular to the irradiated surface, the incident light istaken to propagate along the Z axis in Figure 1 with itspolarization direction equally distributed in the XY plane.Please note that there is only one N3 molecule in our model
system, given its low surface concentration on the easilyhydrated TiO2 surface.
23,31
2.3. Estimation of the Thickness of Ag2O, DAg2O. Unlikethe Ag core, the intermediate Ag2O layer is a semiconductingmaterial that does not exhibit any plasmonic features. However,its presence and thickness influences the magnitude of thesurface electric fields, which in turn determine the IPCE of theDSSC. Although DAg2O for a Ag/Ag2O layered system can beconveniently measured by the angle-resolved reflectivity for s-wave and p-wave polarization,32 its reliability in the range 0 nm< DAg2O < 5 nm is uncertain due to a sharp red shift of theplasmon resonance for small oxide layer thicknesses. Therefore,for our Ag/Ag2O/TiO2 nanoparticle structures with a very thinAg2O layer, the angle-resolved reflectivity would not be useful.An alternative protocol to estimate DAg2O is to compare theexperimentally obtained plasmon wavelength for the Ag/Ag2O/TiO2 nanoparticle with the simulated extinction profilemaximum; optical theory has been very successful atinterpreting and predicting such plasmonic phenomena forstructures like this.33 The MEEP FDTD simulation package34
was used to calculate the transmission loss of a delayedGaussian electric pulse after it had passed through thecomposite DSSC. In our FDTD calculations, the delay timeand the peak width of the electric pulse were carefully chosento centralize the optical response within the visible region ofinterest. In addition, DTiO2
was fixed at 2.0 nm, and DAg2O wasvaried from 1.0 to 9.0 nm to examine the red shift of plasmonexcitation. The dielectric functions, ε, for Ag and Ag2O weretaken from Johnson and Christy35 and Garcia-Macedo,36
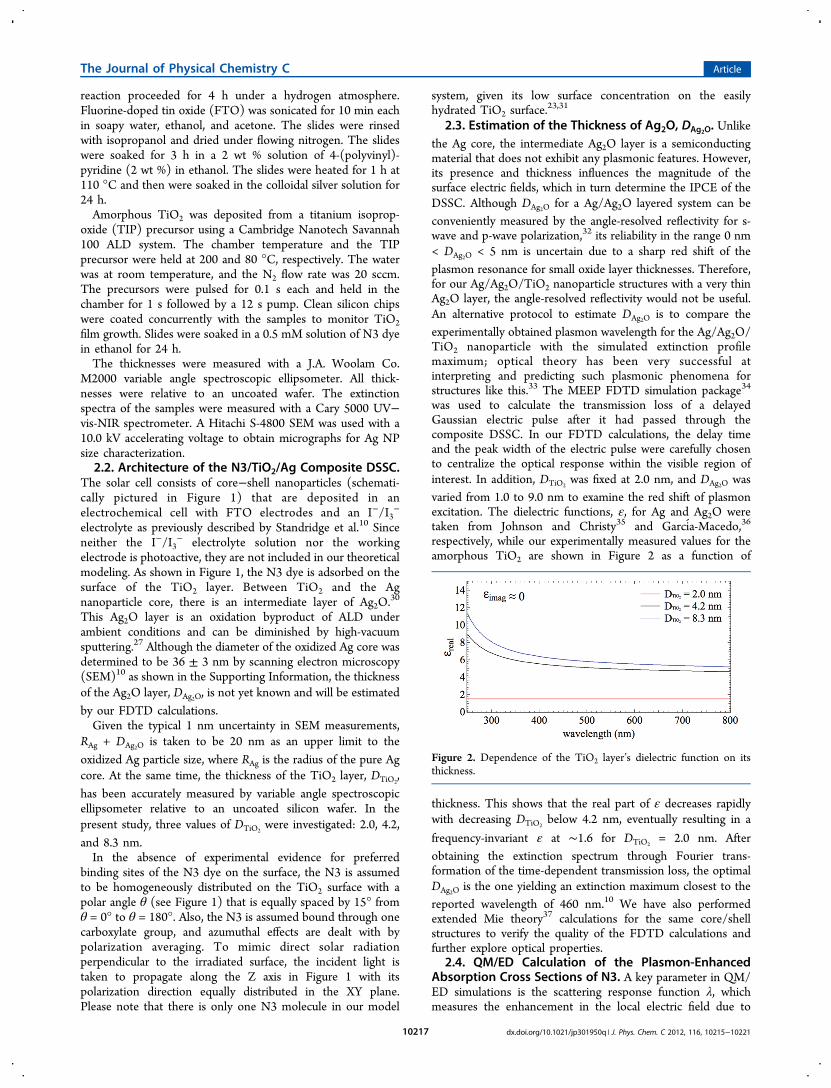
respectively, while our experimentally measured values for theamorphous TiO2 are shown in Figure 2 as a function of
thickness. This shows that the real part of ε decreases rapidlywith decreasing DTiO2
below 4.2 nm, eventually resulting in a
frequency-invariant ε at ∼1.6 for DTiO2= 2.0 nm. After
obtaining the extinction spectrum through Fourier trans-formation of the time-dependent transmission loss, the optimalDAg2O is the one yielding an extinction maximum closest to thereported wavelength of 460 nm.10 We have also performedextended Mie theory37 calculations for the same core/shellstructures to verify the quality of the FDTD calculations andfurther explore optical properties.
2.4. QM/ED Calculation of the Plasmon-EnhancedAbsorption Cross Sections of N3. A key parameter in QM/ED simulations is the scattering response function λ, whichmeasures the enhancement in the local electric field due to
Figure 2. Dependence of the TiO2 layer’s dielectric function on itsthickness.
The Journal of Physical Chemistry C Article
dx.doi.org/10.1021/jp301950q | J. Phys. Chem. C 2012, 116, 10215−1022110217
plasmon excitation.19 The λ value for a given binding site of theN3 dye, r, was evaluated from the ratio of the scattered electricfield Esca(r, ω) and the incident field E0(r, ω) using FDTDcalculations. Subsequently, the total electric field E0(r, ω) +Esca(r, ω) was added to the N3 dye Hamiltonian to drive thepropagation of its wave function according to the time-dependent Schrodinger equation.38 After Fourier transforma-tion of the induced dipole moment followed by normalizationby the incident field, the linear molecular polarizability, α(ω),over a wide frequency range is determined in a single RT-TDDFT simulation. To include for spatial averaging over theincident polarization directions, the absorption cross section,σabs(ω), for the bound N3 dye irradiated by light with a fixedpropagation direction is given by the following:
σ ω
α λ α λ α λ α λ
α λ α λ
= πω
+ * + + * + * +
* + * + *
c( )
4
12
( (1 ) (1 )
)
ii ii jj jj ij ij ji
ji ik ik jk jkimag
(1)
where ⟨ ⟩imag denotes the imaginary part and * indicates thecomplex conjugate operator. Please refer to the SupportingInformation for a detailed derivation of eq 1.The CP2K molecular simulation package39 was utilized to
perform the RT-TDDFT calculations with the Goedecker−Teter−Hutter (GTH) dual-space Gaussian pseudopotential,40
the Perdew−Burke−Ernzerhof (PBE) exchange-correlation-functional41 and the polarized valence-double-ζ (PVDZ) basisset.42 It is also found that a total simulation time of 50 fs issufficiently long to converge σ(ω) in the visible region if acommonly used value of 0.1 eV is chosen for the dampingfactor, Γ, to empirically reflect the effect of quantum dephasingand vibronic coupling.2.5. Spatial Averages of σ(ω) and the IPCE Enhance-
ment Factor, η. Under the assumption of a uniformdistribution of N3 dye locations on the TiO2 surface, thespatial average of its absorption cross section, σ(ω), is given bythe following:
∫σ ω θ σ ω θ θ=π
d( ) ( , ) sin0
/2
(2)
where sin θ is the usual polar angle weighting factor. Here, theupper limit of the integration in eq 2 is reduced from 180° to90° due to dipolar symmetry of the field for the small particlewe consider. Due to the weak solar radiation intensity, lightabsorption is usually considered as a significant limiting step fora photovoltaic device. Therefore, the IPCE is approximatelyproportional to σ(ω), which is further weighted from 280 to900 nm by the AM1.5G solar radiation spectrum as shown inthe Supporting Information,43 SRS(ω):
∫ ω σ ω ω∝ dIPCE SRS( ) ( )(3)
In the present study, the IPCE associated with bare N3 ischosen as our reference system. Accordingly, the IPCEenhancement factor, η, is defined as follows:
η = IPCEIPCE0 (4)
where IPCE0 is given by eq 3 but for bare N3 dye in vacuum.
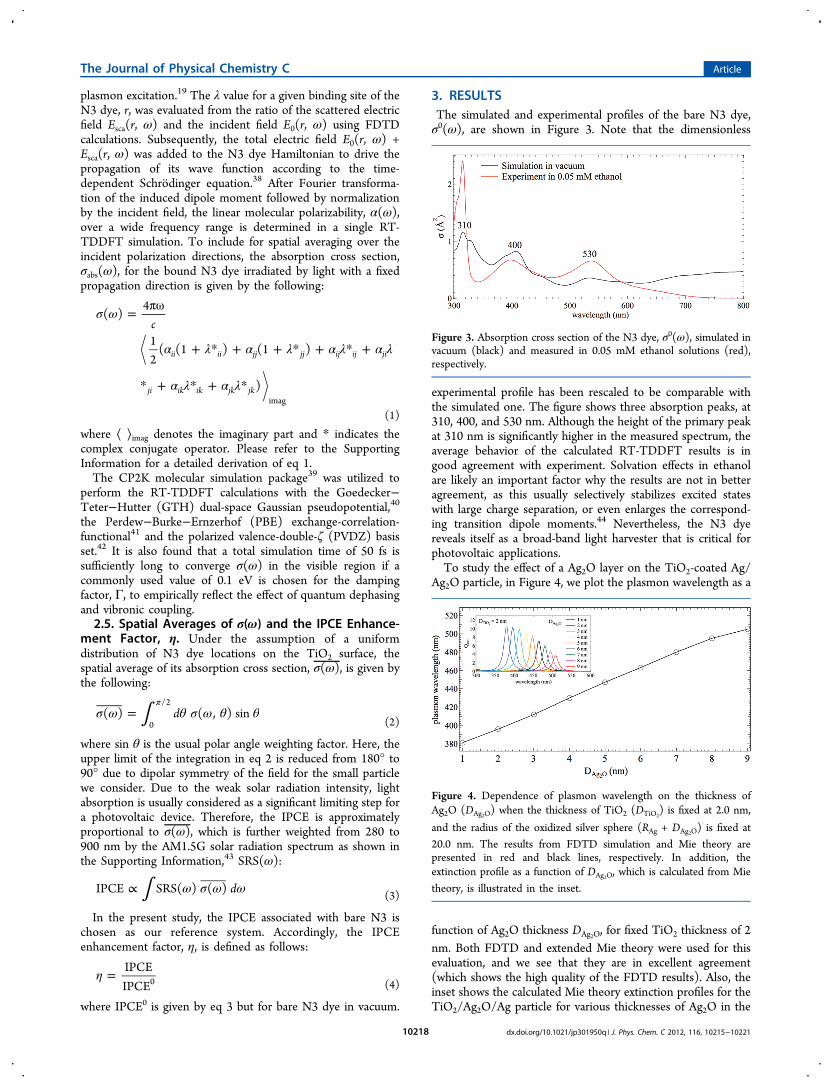
3. RESULTSThe simulated and experimental profiles of the bare N3 dye,σ0(ω), are shown in Figure 3. Note that the dimensionless
experimental profile has been rescaled to be comparable withthe simulated one. The figure shows three absorption peaks, at310, 400, and 530 nm. Although the height of the primary peakat 310 nm is significantly higher in the measured spectrum, theaverage behavior of the calculated RT-TDDFT results is ingood agreement with experiment. Solvation effects in ethanolare likely an important factor why the results are not in betteragreement, as this usually selectively stabilizes excited stateswith large charge separation, or even enlarges the correspond-ing transition dipole moments.44 Nevertheless, the N3 dyereveals itself as a broad-band light harvester that is critical forphotovoltaic applications.To study the effect of a Ag2O layer on the TiO2-coated Ag/
Ag2O particle, in Figure 4, we plot the plasmon wavelength as a
function of Ag2O thickness DAg2O, for fixed TiO2 thickness of 2nm. Both FDTD and extended Mie theory were used for thisevaluation, and we see that they are in excellent agreement(which shows the high quality of the FDTD results). Also, theinset shows the calculated Mie theory extinction profiles for theTiO2/Ag2O/Ag particle for various thicknesses of Ag2O in the
Figure 3. Absorption cross section of the N3 dye, σ0(ω), simulated invacuum (black) and measured in 0.05 mM ethanol solutions (red),respectively.
Figure 4. Dependence of plasmon wavelength on the thickness ofAg2O (DAg2O) when the thickness of TiO2 (DTiO2
) is fixed at 2.0 nm,
and the radius of the oxidized silver sphere (RAg + DAg2O) is fixed at20.0 nm. The results from FDTD simulation and Mie theory arepresented in red and black lines, respectively. In addition, theextinction profile as a function of DAg2O, which is calculated from Mie
theory, is illustrated in the inset.
The Journal of Physical Chemistry C Article
dx.doi.org/10.1021/jp301950q | J. Phys. Chem. C 2012, 116, 10215−1022110218
range 1−9 nm. Further technical details of the Mie theorycalculation are provided in the Supporting Information. Figure4 shows that the plasmon excitation red shifts and decreases inintensity with increasing layer thickness. The red shifting as theAg2O layer thickness increases is the expected result given thelarge real part of the Ag2O dielectric function. The damping isdue to absorption by the Ag2O and reflects the importance ofthe imaginary part of the dielectric constant. In comparison tothe experimental extinction profile,10 the computed result withDAg2O = 6 nm exhibits the most consistent plasmon wavelength.
Therefore, 6 nm is regarded as the correct value for DAg2O andwill be applied in the rest of our simulations.The angle-resolved σ(ω) shown in Figure 5a has been
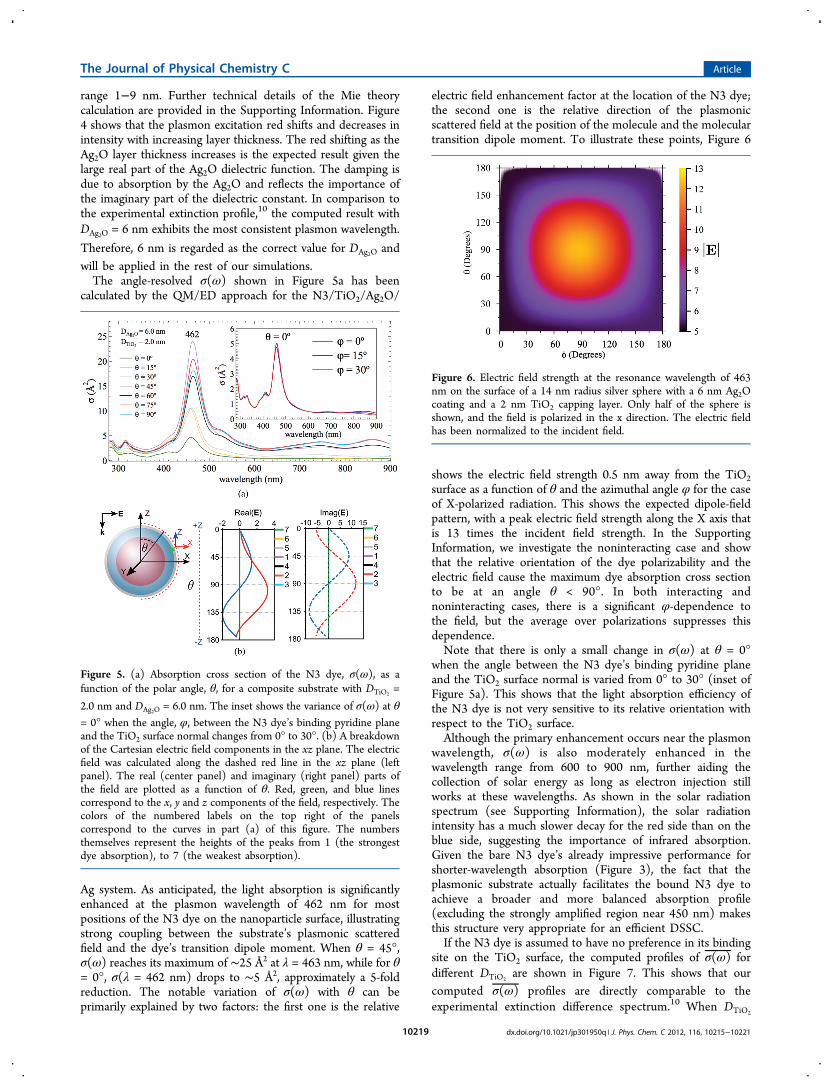
calculated by the QM/ED approach for the N3/TiO2/Ag2O/
Ag system. As anticipated, the light absorption is significantlyenhanced at the plasmon wavelength of 462 nm for mostpositions of the N3 dye on the nanoparticle surface, illustratingstrong coupling between the substrate’s plasmonic scatteredfield and the dye’s transition dipole moment. When θ = 45°,σ(ω) reaches its maximum of ∼25 Å2 at λ = 463 nm, while for θ= 0°, σ(λ = 462 nm) drops to ∼5 Å2, approximately a 5-foldreduction. The notable variation of σ(ω) with θ can beprimarily explained by two factors: the first one is the relative
electric field enhancement factor at the location of the N3 dye;the second one is the relative direction of the plasmonicscattered field at the position of the molecule and the moleculartransition dipole moment. To illustrate these points, Figure 6
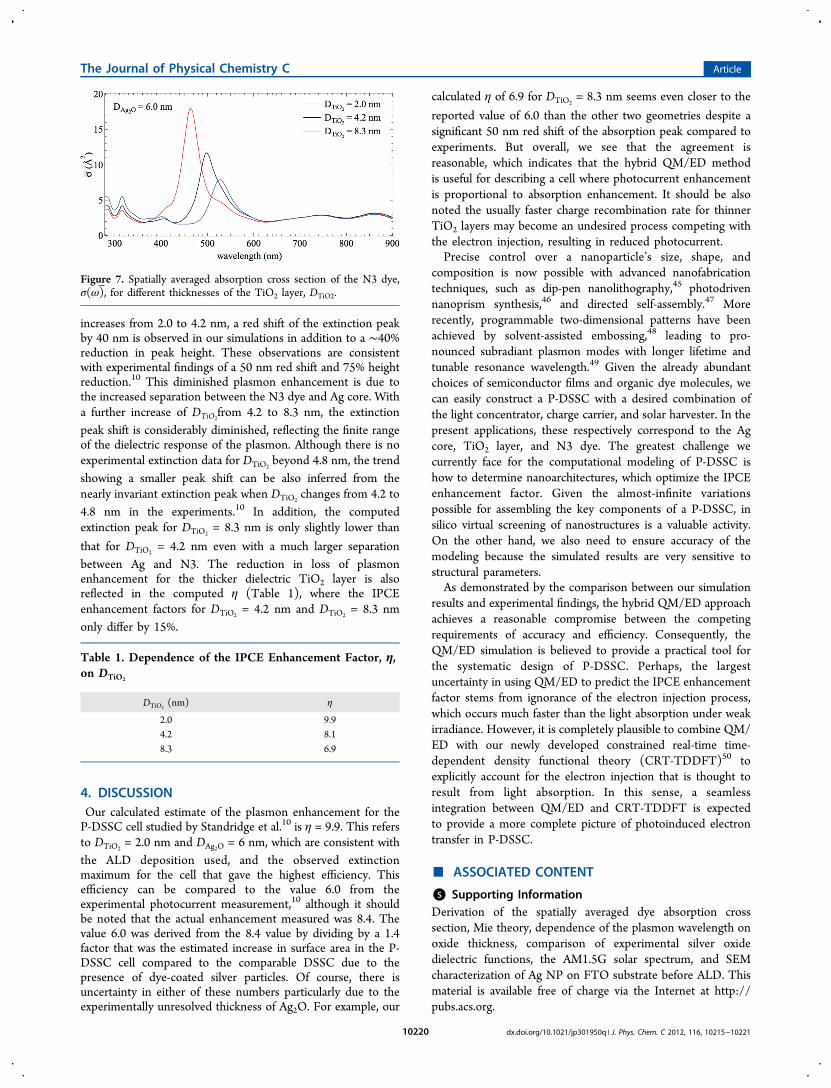
shows the electric field strength 0.5 nm away from the TiO2surface as a function of θ and the azimuthal angle φ for the caseof X-polarized radiation. This shows the expected dipole-fieldpattern, with a peak electric field strength along the X axis thatis 13 times the incident field strength. In the SupportingInformation, we investigate the noninteracting case and showthat the relative orientation of the dye polarizability and theelectric field cause the maximum dye absorption cross sectionto be at an angle θ < 90°. In both interacting andnoninteracting cases, there is a significant φ-dependence tothe field, but the average over polarizations suppresses thisdependence.Note that there is only a small change in σ(ω) at θ = 0°
when the angle between the N3 dye’s binding pyridine planeand the TiO2 surface normal is varied from 0° to 30° (inset ofFigure 5a). This shows that the light absorption efficiency ofthe N3 dye is not very sensitive to its relative orientation withrespect to the TiO2 surface.Although the primary enhancement occurs near the plasmon
wavelength, σ(ω) is also moderately enhanced in thewavelength range from 600 to 900 nm, further aiding thecollection of solar energy as long as electron injection stillworks at these wavelengths. As shown in the solar radiationspectrum (see Supporting Information), the solar radiationintensity has a much slower decay for the red side than on theblue side, suggesting the importance of infrared absorption.Given the bare N3 dye’s already impressive performance forshorter-wavelength absorption (Figure 3), the fact that theplasmonic substrate actually facilitates the bound N3 dye toachieve a broader and more balanced absorption profile(excluding the strongly amplified region near 450 nm) makesthis structure very appropriate for an efficient DSSC.If the N3 dye is assumed to have no preference in its binding
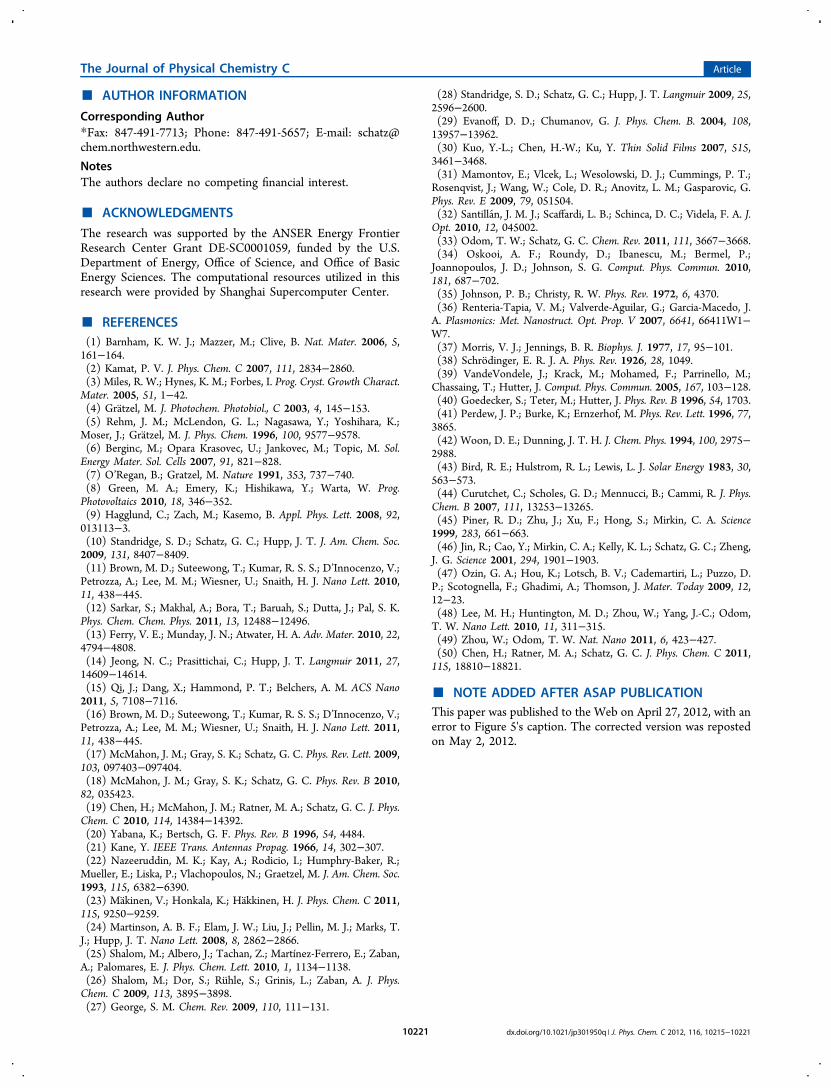
site on the TiO2 surface, the computed profiles of σ(ω) fordifferent DTiO2
are shown in Figure 7. This shows that ourcomputed σ(ω) profiles are directly comparable to theexperimental extinction difference spectrum.10 When DTiO2
Figure 5. (a) Absorption cross section of the N3 dye, σ(ω), as afunction of the polar angle, θ, for a composite substrate with DTiO2
=
2.0 nm and DAg2O = 6.0 nm. The inset shows the variance of σ(ω) at θ
= 0° when the angle, φ, between the N3 dye’s binding pyridine planeand the TiO2 surface normal changes from 0° to 30°. (b) A breakdownof the Cartesian electric field components in the xz plane. The electricfield was calculated along the dashed red line in the xz plane (leftpanel). The real (center panel) and imaginary (right panel) parts ofthe field are plotted as a function of θ. Red, green, and blue linescorrespond to the x, y and z components of the field, respectively. Thecolors of the numbered labels on the top right of the panelscorrespond to the curves in part (a) of this figure. The numbersthemselves represent the heights of the peaks from 1 (the strongestdye absorption), to 7 (the weakest absorption).
Figure 6. Electric field strength at the resonance wavelength of 463nm on the surface of a 14 nm radius silver sphere with a 6 nm Ag2Ocoating and a 2 nm TiO2 capping layer. Only half of the sphere isshown, and the field is polarized in the x direction. The electric fieldhas been normalized to the incident field.
The Journal of Physical Chemistry C Article
dx.doi.org/10.1021/jp301950q | J. Phys. Chem. C 2012, 116, 10215−1022110219
increases from 2.0 to 4.2 nm, a red shift of the extinction peakby 40 nm is observed in our simulations in addition to a ∼40%reduction in peak height. These observations are consistentwith experimental findings of a 50 nm red shift and 75% heightreduction.10 This diminished plasmon enhancement is due tothe increased separation between the N3 dye and Ag core. Witha further increase of DTiO2
from 4.2 to 8.3 nm, the extinctionpeak shift is considerably diminished, reflecting the finite rangeof the dielectric response of the plasmon. Although there is noexperimental extinction data for DTiO2
beyond 4.8 nm, the trendshowing a smaller peak shift can be also inferred from thenearly invariant extinction peak when DTiO2
changes from 4.2 to4.8 nm in the experiments.10 In addition, the computedextinction peak for DTiO2
= 8.3 nm is only slightly lower than
that for DTiO2= 4.2 nm even with a much larger separation
between Ag and N3. The reduction in loss of plasmonenhancement for the thicker dielectric TiO2 layer is alsoreflected in the computed η (Table 1), where the IPCEenhancement factors for DTiO2
= 4.2 nm and DTiO2= 8.3 nm
only differ by 15%.
4. DISCUSSIONOur calculated estimate of the plasmon enhancement for theP-DSSC cell studied by Standridge et al.10 is η = 9.9. This refersto DTiO2
= 2.0 nm and DAg2O = 6 nm, which are consistent withthe ALD deposition used, and the observed extinctionmaximum for the cell that gave the highest efficiency. Thisefficiency can be compared to the value 6.0 from theexperimental photocurrent measurement,10 although it shouldbe noted that the actual enhancement measured was 8.4. Thevalue 6.0 was derived from the 8.4 value by dividing by a 1.4factor that was the estimated increase in surface area in the P-DSSC cell compared to the comparable DSSC due to thepresence of dye-coated silver particles. Of course, there isuncertainty in either of these numbers particularly due to theexperimentally unresolved thickness of Ag2O. For example, our
calculated η of 6.9 for DTiO2= 8.3 nm seems even closer to the
reported value of 6.0 than the other two geometries despite asignificant 50 nm red shift of the absorption peak compared toexperiments. But overall, we see that the agreement isreasonable, which indicates that the hybrid QM/ED methodis useful for describing a cell where photocurrent enhancementis proportional to absorption enhancement. It should be alsonoted the usually faster charge recombination rate for thinnerTiO2 layers may become an undesired process competing withthe electron injection, resulting in reduced photocurrent.Precise control over a nanoparticle’s size, shape, and
composition is now possible with advanced nanofabricationtechniques, such as dip-pen nanolithography,45 photodrivennanoprism synthesis,46 and directed self-assembly.47 Morerecently, programmable two-dimensional patterns have beenachieved by solvent-assisted embossing,48 leading to pro-nounced subradiant plasmon modes with longer lifetime andtunable resonance wavelength.49 Given the already abundantchoices of semiconductor films and organic dye molecules, wecan easily construct a P-DSSC with a desired combination ofthe light concentrator, charge carrier, and solar harvester. In thepresent applications, these respectively correspond to the Agcore, TiO2 layer, and N3 dye. The greatest challenge wecurrently face for the computational modeling of P-DSSC ishow to determine nanoarchitectures, which optimize the IPCEenhancement factor. Given the almost-infinite variationspossible for assembling the key components of a P-DSSC, insilico virtual screening of nanostructures is a valuable activity.On the other hand, we also need to ensure accuracy of themodeling because the simulated results are very sensitive tostructural parameters.As demonstrated by the comparison between our simulation
results and experimental findings, the hybrid QM/ED approachachieves a reasonable compromise between the competingrequirements of accuracy and efficiency. Consequently, theQM/ED simulation is believed to provide a practical tool forthe systematic design of P-DSSC. Perhaps, the largestuncertainty in using QM/ED to predict the IPCE enhancementfactor stems from ignorance of the electron injection process,which occurs much faster than the light absorption under weakirradiance. However, it is completely plausible to combine QM/ED with our newly developed constrained real-time time-dependent density functional theory (CRT-TDDFT)50 toexplicitly account for the electron injection that is thought toresult from light absorption. In this sense, a seamlessintegration between QM/ED and CRT-TDDFT is expectedto provide a more complete picture of photoinduced electrontransfer in P-DSSC.
■ ASSOCIATED CONTENT
*S Supporting InformationDerivation of the spatially averaged dye absorption crosssection, Mie theory, dependence of the plasmon wavelength onoxide thickness, comparison of experimental silver oxidedielectric functions, the AM1.5G solar spectrum, and SEMcharacterization of Ag NP on FTO substrate before ALD. Thismaterial is available free of charge via the Internet at http://pubs.acs.org.
Figure 7. Spatially averaged absorption cross section of the N3 dye,σ(ω), for different thicknesses of the TiO2 layer, DTiO2.
Table 1. Dependence of the IPCE Enhancement Factor, η,on DTiO2
DTiO2(nm) η
2.0 9.94.2 8.18.3 6.9
The Journal of Physical Chemistry C Article
dx.doi.org/10.1021/jp301950q | J. Phys. Chem. C 2012, 116, 10215−1022110220
■ AUTHOR INFORMATION
Corresponding Author*Fax: 847-491-7713; Phone: 847-491-5657; E-mail: [email protected].
NotesThe authors declare no competing financial interest.
■ ACKNOWLEDGMENTS
The research was supported by the ANSER Energy FrontierResearch Center Grant DE-SC0001059, funded by the U.S.Department of Energy, Office of Science, and Office of BasicEnergy Sciences. The computational resources utilized in thisresearch were provided by Shanghai Supercomputer Center.
■ REFERENCES(1) Barnham, K. W. J.; Mazzer, M.; Clive, B. Nat. Mater. 2006, 5,161−164.(2) Kamat, P. V. J. Phys. Chem. C 2007, 111, 2834−2860.(3) Miles, R. W.; Hynes, K. M.; Forbes, I. Prog. Cryst. Growth Charact.Mater. 2005, 51, 1−42.(4) Gratzel, M. J. Photochem. Photobiol., C 2003, 4, 145−153.(5) Rehm, J. M.; McLendon, G. L.; Nagasawa, Y.; Yoshihara, K.;Moser, J.; Gratzel, M. J. Phys. Chem. 1996, 100, 9577−9578.(6) Berginc, M.; Opara Krasovec, U.; Jankovec, M.; Topic, M. Sol.Energy Mater. Sol. Cells 2007, 91, 821−828.(7) O’Regan, B.; Gratzel, M. Nature 1991, 353, 737−740.(8) Green, M. A.; Emery, K.; Hishikawa, Y.; Warta, W. Prog.Photovoltaics 2010, 18, 346−352.(9) Hagglund, C.; Zach, M.; Kasemo, B. Appl. Phys. Lett. 2008, 92,013113−3.(10) Standridge, S. D.; Schatz, G. C.; Hupp, J. T. J. Am. Chem. Soc.2009, 131, 8407−8409.(11) Brown, M. D.; Suteewong, T.; Kumar, R. S. S.; D’Innocenzo, V.;Petrozza, A.; Lee, M. M.; Wiesner, U.; Snaith, H. J. Nano Lett. 2010,11, 438−445.(12) Sarkar, S.; Makhal, A.; Bora, T.; Baruah, S.; Dutta, J.; Pal, S. K.Phys. Chem. Chem. Phys. 2011, 13, 12488−12496.(13) Ferry, V. E.; Munday, J. N.; Atwater, H. A. Adv. Mater. 2010, 22,4794−4808.(14) Jeong, N. C.; Prasittichai, C.; Hupp, J. T. Langmuir 2011, 27,14609−14614.(15) Qi, J.; Dang, X.; Hammond, P. T.; Belchers, A. M. ACS Nano2011, 5, 7108−7116.(16) Brown, M. D.; Suteewong, T.; Kumar, R. S. S.; D’Innocenzo, V.;Petrozza, A.; Lee, M. M.; Wiesner, U.; Snaith, H. J. Nano Lett. 2011,11, 438−445.(17) McMahon, J. M.; Gray, S. K.; Schatz, G. C. Phys. Rev. Lett. 2009,103, 097403−097404.(18) McMahon, J. M.; Gray, S. K.; Schatz, G. C. Phys. Rev. B 2010,82, 035423.(19) Chen, H.; McMahon, J. M.; Ratner, M. A.; Schatz, G. C. J. Phys.Chem. C 2010, 114, 14384−14392.(20) Yabana, K.; Bertsch, G. F. Phys. Rev. B 1996, 54, 4484.(21) Kane, Y. IEEE Trans. Antennas Propag. 1966, 14, 302−307.(22) Nazeeruddin, M. K.; Kay, A.; Rodicio, I.; Humphry-Baker, R.;Mueller, E.; Liska, P.; Vlachopoulos, N.; Graetzel, M. J. Am. Chem. Soc.1993, 115, 6382−6390.(23) Makinen, V.; Honkala, K.; Hakkinen, H. J. Phys. Chem. C 2011,115, 9250−9259.(24) Martinson, A. B. F.; Elam, J. W.; Liu, J.; Pellin, M. J.; Marks, T.J.; Hupp, J. T. Nano Lett. 2008, 8, 2862−2866.(25) Shalom, M.; Albero, J.; Tachan, Z.; Martínez-Ferrero, E.; Zaban,A.; Palomares, E. J. Phys. Chem. Lett. 2010, 1, 1134−1138.(26) Shalom, M.; Dor, S.; Ruhle, S.; Grinis, L.; Zaban, A. J. Phys.Chem. C 2009, 113, 3895−3898.(27) George, S. M. Chem. Rev. 2009, 110, 111−131.
(28) Standridge, S. D.; Schatz, G. C.; Hupp, J. T. Langmuir 2009, 25,2596−2600.(29) Evanoff, D. D.; Chumanov, G. J. Phys. Chem. B. 2004, 108,13957−13962.(30) Kuo, Y.-L.; Chen, H.-W.; Ku, Y. Thin Solid Films 2007, 515,3461−3468.(31) Mamontov, E.; Vlcek, L.; Wesolowski, D. J.; Cummings, P. T.;Rosenqvist, J.; Wang, W.; Cole, D. R.; Anovitz, L. M.; Gasparovic, G.Phys. Rev. E 2009, 79, 051504.(32) Santillan, J. M. J.; Scaffardi, L. B.; Schinca, D. C.; Videla, F. A. J.Opt. 2010, 12, 045002.(33) Odom, T. W.; Schatz, G. C. Chem. Rev. 2011, 111, 3667−3668.(34) Oskooi, A. F.; Roundy, D.; Ibanescu, M.; Bermel, P.;Joannopoulos, J. D.; Johnson, S. G. Comput. Phys. Commun. 2010,181, 687−702.(35) Johnson, P. B.; Christy, R. W. Phys. Rev. 1972, 6, 4370.(36) Renteria-Tapia, V. M.; Valverde-Aguilar, G.; Garcia-Macedo, J.A. Plasmonics: Met. Nanostruct. Opt. Prop. V 2007, 6641, 66411W1−W7.(37) Morris, V. J.; Jennings, B. R. Biophys. J. 1977, 17, 95−101.(38) Schrodinger, E. R. J. A. Phys. Rev. 1926, 28, 1049.(39) VandeVondele, J.; Krack, M.; Mohamed, F.; Parrinello, M.;Chassaing, T.; Hutter, J. Comput. Phys. Commun. 2005, 167, 103−128.(40) Goedecker, S.; Teter, M.; Hutter, J. Phys. Rev. B 1996, 54, 1703.(41) Perdew, J. P.; Burke, K.; Ernzerhof, M. Phys. Rev. Lett. 1996, 77,3865.(42) Woon, D. E.; Dunning, J. T. H. J. Chem. Phys. 1994, 100, 2975−2988.(43) Bird, R. E.; Hulstrom, R. L.; Lewis, L. J. Solar Energy 1983, 30,563−573.(44) Curutchet, C.; Scholes, G. D.; Mennucci, B.; Cammi, R. J. Phys.Chem. B 2007, 111, 13253−13265.(45) Piner, R. D.; Zhu, J.; Xu, F.; Hong, S.; Mirkin, C. A. Science1999, 283, 661−663.(46) Jin, R.; Cao, Y.; Mirkin, C. A.; Kelly, K. L.; Schatz, G. C.; Zheng,J. G. Science 2001, 294, 1901−1903.(47) Ozin, G. A.; Hou, K.; Lotsch, B. V.; Cademartiri, L.; Puzzo, D.P.; Scotognella, F.; Ghadimi, A.; Thomson, J. Mater. Today 2009, 12,12−23.(48) Lee, M. H.; Huntington, M. D.; Zhou, W.; Yang, J.-C.; Odom,T. W. Nano Lett. 2010, 11, 311−315.(49) Zhou, W.; Odom, T. W. Nat. Nano 2011, 6, 423−427.(50) Chen, H.; Ratner, M. A.; Schatz, G. C. J. Phys. Chem. C 2011,115, 18810−18821.
■ NOTE ADDED AFTER ASAP PUBLICATIONThis paper was published to the Web on April 27, 2012, with anerror to Figure 5's caption. The corrected version was repostedon May 2, 2012.
The Journal of Physical Chemistry C Article
dx.doi.org/10.1021/jp301950q | J. Phys. Chem. C 2012, 116, 10215−1022110221