Embed Size (px)
Citation preview
Computational Modeling for Scanning Tunneling Microscopy of Physisorbed Molecules viaAb Initio Quantum Chemistry
Joseph Crystal, Linda Yu Zhang,† Richard A. Friesner,* and George W. FlynnDepartment of Chemistry, Columbia UniVersity, New York, New York 10027
ReceiVed: July 10, 2001; In Final Form: NoVember 26, 2001
Scanning tunneling microscopy images of molecular adsorbates on a graphite surface are modeled using thetechniques of electron transfer theory. The results are compared with experimentally determined tunnelingprobabilities and are shown to be qualitatively (and to some extent quantitatively) in accord with theexperimental data. The results provide new insight into the various factors that contribute to the features inSTM images of molecular adsorbates.
I. Introduction
Over the past decade, scanning tunneling microscopy (STM)has rapidly become a powerful tool in the study of surfacesand their properties. More recently, STM has been utilized toinvestigate the self-assembly of molecules on surfaces, and theinformation obtained through these studies suggests that thistechnique will prove to be a useful resource in the developmentof electronic and optical devices on a molecular level. In lightof the prevalent use of STM at the forefront of current research,a theoretical understanding of the tunneling mechanism involvedhas become all the more important.
A number of theoretical approaches have been developed formodeling the STM tunneling mechanism. Tersoff and Hamannconcluded that STM provides a contour map of the local densityof states (LDOS) at the Fermi level of the surface at the positionof the tip.1,2 Lang and co-workers later suggested that thissurface image is modified in the presence of an adsorbate dueto the contribution of the adsorbate to the LDOS at the Fermilevel.3 A more sophisticated modification of the same basicapproach was later taken by Marcus et al. whereby some of theapproximations made in previous work were eliminated.4 Asimilar approach used by Whangbo et al. indicated the sensitivityof STM images to tip-surface interactions.5 Dabrowski et al.were able to ascertain the correct reconstruction on a siliconsurface using ab initio electronic structure calculations andmodeling the STM image using the approach of Tersoff andHamann.6 Goddard and co-workers have proposed a newperturbative approach, with some promising results, to modelthe tunneling mechanism.7 More recently, Corbel et al. combinedab initio calculations with a scattering formalism in order tomodel the STM images of pure copper surfaces.8
In the current study we make use of ab initio quantumchemical computational techniques, available for the calculationof electron-transfer matrix elements, to model the tunnelingcurrent in STM. A prior study by Coley et al.9 indicated thatquantum chemical techniques could be utilized to understandthe STM images of MoS2 and MoTe2. In the current study weexamine the feasibility of utilizing this technique for a graphitesurface in the presence of adsorbed molecules. The justificationfor the application of this technique to the modeling of STMimages is presented below.
Before discussing the computational methodology, severalpreliminary points need to be made. Our calculations involve
the computation of the transfer matrix element between anelectron localized on the tip in the ground state of the tip-sample complex and the ground state of the complex with theelectron localized on the sample. Although for the calculatedbias voltage there is most likely some contribution to the transfermatrix element from the excited states of the complex, no otherenergy states were included in the present study. The contribu-tion of the excited states to the transfer matrix element will beexamined in future studies.
A comparison of our results with experimental images showsthat this technique provides reasonable qualitative agreementwith experiment. Following the initial comparison a model isdeveloped that allows a more quantitative comparison betweenthe calculated matrix elements and the experimental images.The overall method offers new insight into the relationshipbetween the geometry and electronic structure of adsorbates andtheir corresponding STM images.
II. Methodology
A. Analysis of the Approximations Inherent in the Use ofa Localized Cluster Calculation to Model the TunnelingCurrent in an STM Experiment. The problem of computingthe tunneling current in an STM experiment is similar, but notidentical, to the calculation of the electron transfer rate betweena donor and acceptor molecule in a condensed phase, such asliquid solution. The principal difference between the twocalculations is the presence of electronic continua for both thetip and the sample in case of the STM; both systems also possessa continuum of vibrational states that must be taken into accountif the absolute value of the current or electron transfer rate is tobe computed. Our approach is based on an extension of thestandard Marcus theory of electron transfer between molecules,which in turn is based on the Golden Rule expression for thedynamics of electron transfer as obtained from time dependentperturbation theory. This extension becomes quite complicatedif absolute rate constants are desired, due to the necessity oftaking into account the effects of the electronic continua uponthe coupling matrix elements and the energy matching criteria.However, if one is only interested in the relative rates as afunction of the position of the donor molecule (the tip) relativeto the acceptor molecule (the surface-adsorbate), plausiblesimplifying approximations can be made which reduce theproblem to a cluster calculation of the coupling matrix elementbetween charge localized diabatic states. A derivation of thisapproximation is provided below. It should be noted that the
* Corresponding author.† Current Address: Chemistry Department, Rutgers University.
1802 J. Phys. Chem. A2002,106,1802-1814
10.1021/jp012629+ CCC: $22.00 © 2002 American Chemical SocietyPublished on Web 02/12/2002
approximations are heuristic in character and that a rigorousevaluation of their quantitative validity is not attempted in thispaper. Nevertheless, it will be explained why the approximationsare expected to be qualitatively reasonable in modeling STMimages.
In what follows, for the sake of simplicity, the analysis iscarried out using electrons in noninteracting single particleorbitals. The use of single particle eigenstates makes it possibleto decouple the dependence of the current on the relative positionof the tip and sample from the remainder of the expression forthe absolute rate of electron transfer. Our belief is that anyqualitative conclusions would be unchanged in a full many bodycontext. This is, however, a more complicated argument andwill be pursued in another publication.
We consider the platinum tip plus its originating electrodeas one subsystem, the donor, which we will refer to as the tip(t), and the adsorbed molecule plus the graphite electrode as asecond subsystem, the acceptor, which we refer to as the sample(s). We want to use time dependent perturbation theory tocompute the rate of transfer of an electron from the tip to thesample (or vice versa). A rigorous calculation along these lineswould involve integrating over all thermally occupied states ofthe tip (t) and over the corresponding target states of the sample(s) to yield the final result for the transition rate:
The states k and k′ represent one particle eigenstates on the tipand sample, respectively; the sum is over all occupied states ofthe tip and all unoccupied states of the sample.Tkk′ is thecoupling matrix element between the charge localized diabaticstates represented by k and k′ (i.e., the electron to be transportedis initially occupying k and is then transferred to k′). ThequantitiesFk(E) andFk′(E) are the density of vibrational stateson the tip and sample, respectively, and the factorgkk′(E) is thevibrational coupling of the two states at energyE. Thus weinclude not only the electronic continua on the tip and sample(represented by the sums over k and k′) but also the vibrationalcontinua associated with each electronic manifold. The variableE is taken to incorporate shifts in the relative energies of thetwo manifolds due to factors such as the biasing voltage; thedetails of these shifts are unimportant for our argument. Theprecise forms ofF and g will also not be important for thecomputation of relative transition rates as a function of tipposition, assuming that the only change upon displacement ofthe tip relative to the sample is in the electronic coupling matrixelementsa physically reasonable assumption. In principle onecould use eq 1 to evaluate the absolute value of the tunnelingcurrent. Because we will not be carrying out such an explicitevaluation, we define the quantity
in order to simplify the notation in what follows.A brute force evaluation of eq 1 would involve the determi-
nation of the eigenstates of the tip and sample as well as thecoupling matrix elements between these eigenstates. For verysimplified models of the electronic structure of the tip andsample, such a calculation is feasible, at least in principle.However, if one wants to use a more realistic representation ofthe electronic wave functions (and such a representation iscertainly necessary in the determination of contrast ratios thatare observed in experiments of the type we are considering inthis paper), enumeration of all of the relevant many particle
eigenstates of both systems, as well as their couplings, is outof the question. We would therefore like to develop a formalismutilizing a cluster representation of the interacting D-A system(which can be effectively treated by standard ab initio quantumchemical methods for determining electronic coupling matrixelements) in which the effects of embedding the cluster in thetwo continua associated with the solid electrodes is mademanifest.
To construct the desired model, we begin by imagining thatthe cluster calculations of the electronic structures of the tipand sample are carried out with boundary conditions thatreproduce exactly the effective potential of the solid. Formally,such a potential can be constructed using standard projectionoperator techniques; in practice, there has been a great deal ofeffort invested in developing approximate embedding methodsof varying rigor and quality. We will proceed with an analysisassuming that an exact embedding calculation has been per-formed, and then evaluate how closely our actual procedureconforms to what would be obtained in the ideal case. Thecomparison of our results with the ideal case is accomplishedby systematically increasing the size of the model system andobserving the effects on the computed coupling matrix elements.While rigorous convergence is difficult to demonstrate (par-ticularly for the platinum tip, where the geometry is not knownwith accuracy), examining the behavior of the relevant computedquantities as a function of cluster size provides a heuristicestimation of the uncertainty inherent in our protocol. Asillustrated in Tables 4 and 5, our results exhibit a significantdegree of convergence for the tip sizes used.
Consider first the electronic structure of the tip. The first stepis to compute the orbitals of the tip cluster with the exactembedding potential. This yields a set of one particle states,{Ψn
t }, which are filled up to the Fermi level of the cluster.Because the cluster is of finite size, its electronic structure doesnot form a continuum of states and there is a nontrivial spacingbetween the occupied orbitals of the cluster. For the purposesof our argument, what is specifically required is that there is asufficiently large spacing between the highest occupied orbitalwith nonnegligible overlap with the sample orbitals and the nextlowest orbital that has such a nonnegligible overlap. Orbitalsthat have effectively zero overlap with the sample are notrelevant to the calculation of the tunneling matrix element. Ifthere are two or more orbitals of the tip that overlap with theorbitals of the sample, are high enough in energy, and have anenergy splitting that is small (compared tokT), each orbital’scoupling with those of the sample must be explicitly calculated.The calculation then becomes rather complex. For the momentwe shall assume that only one orbital lies high enough in energyand overlaps with the orbitals of the sample. Later on, we willargue that unless the close lying orbitals have a differentorientation with regard to the sample orbitals, one can still useexcitation out of a single orbital to determine the relativetunneling current. While the aforementioned complications canbe avoided in most cases, it is important in establishing thevalidity of the cluster approach that it behave reasonably in thelimit of a very large cluster where such complications wouldmost likely occur.
We now construct approximate eigenstates of the full tipsystem as follows. First, we construct one particle orbitals forthe solid electrode with the cluster removed, again replacingthe tip cluster with an exact embedding potential. This leads toa set of states{Ψm
t }. The one particle orbitals of the entiresystem can then be written as a linear combination of the orbitalsfrom the two fragments, subject to renormalization. If one views
Ptfs )2π
η∑
k∑k′∫|Tkk′|2gkk′(E)Fk(E)Fk′(E) dE (1)
fkk′(E) ) gkk′(E)Fk(E)Fk′(E) (2)
STM of Physisorbed Molecules J. Phys. Chem. A, Vol. 106, No. 9, 20021803
the eigenstates of the solid electrode with the cluster removedand the tip cluster with the embedding boundary conditions asbasis functions, then the eigenstates of the entire tip would mostgenerally be represented by a linear combination of all of thefunctions from both regions. However, because the eigenstatesof the tip cluster are assumed to be well separated in energy,and are also assumed to be nearly identical to the eigenstatesof the tip calculated using the entire tip system (due to the useof an exact embedding potential) in that they do not stronglymix with other states in the solid electrode, we can, to a verygood approximation, represent all of the eigenstates of the entiretip as linear combinations of a single eigenstate of the solidelectrode and a single eigenstate of the tip cluster. Note thatthe least accurate aspect of this approximation, which is theuse of a single eigenstate of the electrode (due to the fact thatthese eigenstates have smaller energy gaps), is irrelevant to theargument that follows; we can instead imagine producing a newset of electrode functions such that only one of them is requiredto build a specified eigenstate of the full system. Formally thefull system eigenstates then have the form
A similar construction can be performed for the sample. Thisleads to a set of single particle orbitals for the sample of theform
We now evaluate eq 1 explicitly using the forms developed inequations 3 and 4. The resulting expression is
We now use the fact that we can neglect all orbitals of the tipthat have zero overlap with the sample, and all orbitals of thesample that have zero overlap with the tip. The overlap betweena tip and sample eigenfunction is then presumed to depend onlyupon the cluster part of the wave function. This is the centralphysical approximation, which presumably should becomerigorous in the limit that the size of the clusters is increased.Factoring out the cluster matrix element yields the result
In this expression, the dependence of the rate upon the positionof the tip relative to the sample has been reduced to preciselythe value of the cluster diabatic matrix element (in a noninter-acting single particle model) between charge localized stateson the tip and sample. The remaining multiplicative term, whichcertainly influences the absolute value of the current, is invariantwith respect to the tip position. Thus, if the approximations usedto arrive at eq 6 are valid, we can use ab initio quantum chemicalcluster calculations to model the contrast in STM images.
We now proceed to a more general argument in which theassumption of a single cluster orbital that has a large tip-sampleoverlap and is well separated in energy from other such orbitalsis relaxed. Consider first the tip. As the size of the cluster ofmetal atoms in the tip is increased, the single highest energystate in the small cluster dominating the tip-sample overlapwill be broadened into a manifold of levels. Each state in the
manifold will contain a (smaller) component of the overlap, andall states in the manifold will have slightly different energies.At first glance, it would seem that one would have to performcluster calculations of the diabatic matrix element for each statein this manifold, removing an electron from each in turn.However, as long as each orbital in the manifold interacts inthe same way with the sample (and this will be the case if thedominant contribution to the overlap still arises from thelocalized orbitals on the atoms of the tip closest to the sample),the relative value of the total matrix element will be properlyestimated from a single cluster calculation. That is, each orbitalin the manifold will be shifted in exactly the same way for anymovement of the tip. Thus, the relative change in the matrixelement for any given orbital in the manifold will be identicalwith the relative change in the value of the total matrix element.Formally we can then rewrite eq 5, wherefkk′(E) now includesall additional contributions from the remaining states of the tipmanifold, and where we have made explicit the assumption thatthat the dominant contribution in the manifold arises from asingle localized wave function. Again factoring out the overlapof this localized wave function with the sample, we obtain amodified form of eq 6. Similar arguments can be made for thesample, although here such arguments may not even benecessary if the orbitals of the adsorbed molecule are wellseparated from those of the graphite electrode.
B. Computation of the Tunneling Matrix Elements. Giventhe approximations outlined in the preceding section, thetunneling current is directly related to the degree of electroniccoupling between cluster representations of the tip and thesample. In an electron-transfer framework, this current isproportional to the square of the tunneling matrix element,9
which represents the coupling between the two distinct quantumstates, one with the electron localized on the tip and the otherwith the electron localized on the adsorbate-surface complex.The calculation of the tunneling matrix element is divided intotwo parts. In the first part, initial and final wave functions aregenerated. The initial wave function is composed of the wavefunction of the neutral adsorbate-surface complex combinedwith the wave function of the tip with an extra electron. Thefinal wave function is composed of the wave function of theadsorbate-surface complex with an extra electron combinedwith the wave function of the neutral tip. The wave functionsare generated by performing four SCF calculations in theabsence of any external field. Calculations that included theexternal field did not alter the relative contrast of the STMimages in the test cases studied. Two calculations are performedfor the tip, one for its neutral state and one for the state of thetip with the extra electron, and two calculations are performedfor the adsorbate-surface complex, one in its neutral state andone for the state of the complex with an extra electron.
The second part of the computation involves the calculationof the tunneling matrix element. The details of this calculationhave been described elsewhere and will only be summarizedhere.10 The difference between the calculations used here andstandard electron-transfer calculations is the introduction of anexternal voltage into the Hamiltonian, as explained below.
The tunneling matrix element is given by
where
Tif )Hfi - SifHii
1 - Sif2
(7)
Hfi ) ⟨Yf|H|Ψi⟩ (8)
Φkt ) Ck
nΨnt + Ck
mΨmt (3)
Φls ) Cl
nΨns + Cl
mΨms (4)
Ptfs )2π
η∑
k∑k′
∫|⟨akΦkt + bkΦk
s|H|ck′Φk′t +
dk′Φk′s ⟩|2fkk′(E) dE (5)
Ptfs )2π
η|⟨Ψn
t |H|Ψns⟩|2∑
k∑k′
∫|Ckt Ck′
s |2fkk′(E) dE (6)
1804 J. Phys. Chem. A, Vol. 106, No. 9, 2002 Crystal et al.
and
where h is the one electron Hamiltonian,J is the Coulomboperator andK is the exchange operator. The first part of theHamiltonian is composed of the Fock operator, which accountsfor the electron-electron repulsion and the electron-nuclearattraction. The final term accounts for the interaction of theelectrons with the external field, whereE is the external electricfield and r i is the position of the electrons in the field. Theexternal field is assumed to be constant and homogeneous withthe field lines oriented perpendicular to the surface. The voltageapplied across the tip-sample gap is 1-2 V, typical voltagesin STM experiments in which adsorbate layers are studied andconsistent with the experimental values to which the results arecompared. The calculations were performed for a positivesample bias, corresponding to the electron tunneling from thetip to the adsorbate-surface complex.
Basis Set Dependence.Computational constraints requiredthe use of the LAV3P basis set11,12for the Pt atoms, which usesan effective core potential to construct the basis functions ofinner shell electrons for the Pt atoms. The basis set dependenceof the tunneling matrix element was then evaluated by testingthe 6-31G, 6-31G*, cc-pVDZ(-d), and cc-pVTZ(-f) basis setsfor the remaining atoms. The matrix elements were obtainedby positioning a four-atom Pt tip above the Cl atom in achlorinated alkane, which lies above a single layer of graphite.(The choice of tip structure, surface structure, and tip-adsorbatespacing is discussed below.) The matrix element values, givenin Table 1, indicate that including polarization functions on thenon-hydrogen atoms has a negligible effect on the computedmatrix element. Using the double-ú and triple-ú basis sets,however, results in a significant change in the calculated valuesof the transfer matrix element. To ensure that the basis set isadequately converged it is therefore necessary to use the cc-pVTZ(-f) basis set. The use of larger basis sets is notcomputationally feasible at the present time.
To reduce the necessary computational effort, the use ofmixed basis sets was then investigated. The effects of using asmaller basis set for the underlying graphite surface and for thecarbons and hydrogens of the adsorbate are illustrated in Table2. The results show that the use of the cc-pVTZ(-f) basis setfor the adsorbate alone accurately reproduces the values obtainedwhen the cc-pVTZ(-f) basis set is used for all the atoms. Hence,all subsequent calculations utilize the cc-pVTZ(-f) basis for theadsorbate and the 6-31G basis set for all other atoms. As thecc-pVTZ(-f) basis set has not yet been incorporated in ourprogram for bromine and iodine atoms, brominated and iodi-nated alkanes used the LAV3P basis set for the bromine/iodineatoms while all other atoms were modeled using the 6-31G basisset.
The computations employed the JAGUAR suite of electronicstructure programs.13 The diabatic localized wave functions ofthe two diabatic states are evaluated directly, and the off-diagonal transfer matrix element of the Hamiltonian betweenthese wave functions is then calculated. The latter task is recastin the form of a Fock matrix assembly and a pseudodensitymatrix is then constructed. Utilizing a pseudospectral formula-tion of Hartree-Fock theory,14-17 JAGUAR is able to signifi-
cantly reduce the time required for the calculation of thecoupling matrix elements. Typical CPU times for SCF andmatrix element calculations are presented in Table 3. Therequired computational effort is estimated to be 1-2 orders ofmagnitude less than what would be required using conventionalab initio programs and methods for a system of this size.
Presentation of the Data.In presenting contrast images, thevariation of the square of the tunneling matrix element as thetip is translated over the atoms in the adsorbate is presented inthe plots that follow. The square of the matrix element is takento be a measure of the tunneling current. For convenience, thesquared matrix elements are scaled by the largest value occurringfor each type of molecule. However, this scaling is unique toeach terminal functional group. Thus, a valid comparison canbe made between the plots of the different conformations ofmolecules with the same terminal functional group only. Inmaking any other comparison, one must realize that the scalingchanges from one terminal functional group to the next. Theplots are meant only to illustrate the contrast variation that isapparent within an individual molecule and how the variationchanges in different conformations. The range of values for thematrix elements is inset in the upper right corner of each plotin order to facilitate any qualitative comparisons betweendifferent molecules. All plots are calculated at a bias voltageof 1.5 V unless otherwise indicated. The calculations of thematrix elements in this study were performed at constant height.The correlation between constant-height and constant-currentimages will be discussed in section V.
III. Physical Model of the STM Interface
For the purposes of evaluating the feasibility of the currenttheoretical approach, it is considered sufficient if the calculatedpoints accurately reproduce the most outstanding features ofthe experimental images. Thus, the calculated plots shouldreproduce the bright and dark extremes of the experimentalimages but need not reproduce the more subtle features. Inparticular, no differentiation between the carbons and hydrogensis noticeable in the calculated plots.
Tip Structure. The effect of the tip structure on the transfermatrix element was examined by calculating the matrix elementsfor an eight-carbon long thiol (C8H17SH) for various tipstructures. Sautet et al.18 previously studied the effects of varyingthe tip structure on the STM image of sulfur on Re, but theydid not reach any definitive conclusion as to the optimal tipstructure appropriate for the general case. In the current study,
TABLE 1: Basis Set Dependence of Calculated MatrixElements at 1 V Bias Voltage for CH3CH2CH2CH2ClAdsorbed on Graphite
basis set 6-31G 6-31G* cc-pVDZ(-d) cc-pVTZ(-f)
# basis functions 600 845 965 1563matrix element (cm-1) 3.49 4.17 9.21 16.61
TABLE 2: Dependence of Matrix Elements on the Size ofthe Basis Set
basis set(all other atoms use
6-31G basis.)cc-pVTZ(-f)
Cl onlycc-pVTZ(-f)
adsorbate onlycc-pVTZ(-f)
all atoms
# basis functions 625 877 1563matrix element (cm-1) 9.08 16.35 16.61
TABLE 3: Typical CPU Times
type of calc. # basis functions CPU time
SCF 801 9.96 h.matrix element 877 4.15 h.
Hii ) ⟨Yi|H|Ψi⟩ (9)
Sif ) ⟨Yi|Ψf⟩ (10)
H ) h + ∑b
Jb - ∑b
Kb - ∑i
E‚r i (11)
STM of Physisorbed Molecules J. Phys. Chem. A, Vol. 106, No. 9, 20021805
the tip is assumed to be composed of a cluster of Pt atoms. Thecluster sizes examined range from one Pt atom to five Pt atoms.The three-atom tip geometry is an isosceles triangle orientedparallel to the surface, and the four-atom tip is a tetrahedronwith the apex pointed toward the surface. The five-atom tiphas a trigonal bipyramidal structure. The calculations of thematrix elements were performed for two different tip heightsin order to determine if the Pt atoms above the first layer of thecluster were interacting with the surface. The lower tip heightof 7.4 Å corresponds to a Pt-S distance approximately equalto the sum of their respective covalent radii.
The matrix elements are presented in Tables 4 and 5. Acomparison of the matrix elements above the terminal CH2SHwith the matrix elements above the rest of the chain is used indetermining the relative contrast of the sulfur end of themolecule and the remainder of the carbon chain. At a tip heightof 7.4 Å, the one-atom, four-atom, and five-atom tip valuesindicate that the thiol end of the molecule has a higher averagematrix element than the rest of the chain. However, the ratio ofthe sulfur end of the molecule to the rest of the chain differssignificantly between the one and four-atom tips. The four- andfive-atom tips, however, yield similar values for the ratio ofthe sulfur end of the molecules to the rest of the chain. Similarly,the four- and five-atom tips show the same qualitative variationin the value of the matrix element along the carbon chain. Theone-atom tip does not show any such variation. The three-atomtip shows no significant difference between the two sides ofthe molecule. The discrepancy between the one-atom tip valueson one hand and the four and five-atom tip values on the otherhand indicates that the second layer of Pt atoms is interactingwith the molecule. A cursory glance at Table 5 indicates thatwhen the tip is retracted to a distance of 10.4 Å above thesurface, the qualitative discrepancy between the one-atom andthe four- and five-atom tip structures vanishes. At the highertip distance, the second layer of Pt atoms plays a far lesssignificant role in the calculation of the matrix elements.
To verify that the second layer of Pt atoms interacts with themolecule, the energy of interaction between the tip and theadsorbate is presented in Table 6 for various heights of the tipabove the sulfur atom. The results indicate that at a tip heightof 7.4 Å the one-atom tip is still in an attractive regime whilethe four-atom tip has already entered a repulsive regime. Thisrepulsive interaction is most likely responsible for reducing thevalue of the matrix elements when the four-atom tip is in thevicinity of the sulfur atom. Thus, the second layer of Pt atomsplays a significant role in determining the value of the matrixelement. Although the third layer of Pt atoms does influencethe values of the matrix elements, the ratio of the matrixelements above the functional group to those over the bulk ofthe chain does not vary significantly. Hence, a four-atom tipwas used in all subsequent calculations.
Surface Structure.The effect of the surface structure on thetransfer matrix elements was investigated by calculating thetransfer matrix elements for a four-atom Pt tip above a four-carbon long thiol with no surface, with a single layer of graphiteand with two layers of graphite. The results are presented inTable 7. The calculated values show a significant change inthe value of the matrix elements when the first layer of graphiteis introduced. When a second layer of graphite is introducedthe matrix elements obtained are of the same order of magnitudeas the one-layer results. However, the amplitudes of the matrixelements are modified; in particular, the one-layer calculationhas a larger amplitude on the terminal carbon atom and a smalleramplitude on the sulfur, than is obtained for the two layercalculation.
We interpret the larger amplitude on the terminal carbon atomas an artifact that is due to insufficient delocalization of chargein a one-layer model with a short carbon chain. This artifact isalso removed by employing a longer chain length, as is discussedin the subsection below. Because this problem disappears whena longer carbon chain is used, even in a single layer calculation,inclusion of a second layer to address this problem is notnecessary. The diminishment of the amplitude of the matrixelement when the tip is above the sulfur atom (although not forthe carbon adjacent to it) is more difficult to understandquantitatively. A possible explanation is that the terminal carbonatom on the short chain is drawing off charge from this atomas well. Again, it is shown below that this problem is lessprominent when a longer chain length is used.
TABLE 4: Average Matrix Elements (cm-1) for theMolecule CH3(CH2)7SH at a Tip Height of 7.4 Å above theSurface
functional group 1-atom tip 3-atom tip 4-atom tip 5-atom tip
SH 430.80 6.38 249.41 123.49CH2 339.70 12.67 139.71 67.97CH2 142.57 13.23 12.98 13.14CH2 122.69 6.56 167.21 111.72CH2 155.87 4.03 133.81 114.52CH2 111.93 6.47 31.72 12.95CH2 188.78 11.22 59.26 27.58CH2 120.85 11.74 221.73 118.60CH3 150.66 6.33 213.07 143.85
TABLE 5: Average Matrix Elements (cm-1) for theMolecule CH3(CH2)7SH at a Tip Height of 10.4 Å above theSurface
functional group 1-atom tip 3-atom tip 4-atom tip 5-atom tip
SH 53.17 0.35 33.23 19.92CH2 40.31 0.69 32.84 20.27CH2 13.04 0.59 13.25 8.10CH2 15.45 0.42 15.53 11.25CH2 9.38 0.27 5.81 6.07CH2 13.82 0.05 8.16 5.62CH2 19.86 0.48 11.82 7.13CH2 10.31 0.51 15.89 10.52CH3 31.40 0.19 7.30 5.78
TABLE 6: Energies of Interaction as a Function ofTip-adsorbate Distance and Tip Structure
atom-tip distance (Å) 1-atom tip (eV) 4-atom tip (eV)
14.4 -0.002 -0.0513.4 -0.002 -0.0512.4 -0.004 -0.0511.4 -0.007 -0.0610.4 -0.02 -0.079.4 -0.05 -0.118.4 -0.18 -0.287.4 -0.41 +0.07
TABLE 7: Average Matrix Elements (cm-1) for theMolecule CH3CH2CH2CH2SH as a Function of the Numberof Surface Layers
functional group no graphite 1 layer 2 layers
SH 313.69 1.68 6.88CH2 1943.35 3.90 9.54CH2 2771.23 2.51 4.13CH2 961.90 1.55 3.53CH3 755.47 6.44 2.23
1806 J. Phys. Chem. A, Vol. 106, No. 9, 2002 Crystal et al.
Ideally, we would utilize both a second layer of graphite anda longer chain length in our calculations. However, this modelis expensive computationally and also exhibited some conver-gence problems. In view of the fact that the single layer modelexhibited qualitatively correct results (as compared to experi-ment, and also in accordance with the two layer calculations),we choose in this paper to report single layer calculations only.In future work, we intend to address the convergence problemsand carry out quantitative benchmark computations with twolayers and a long carbon chain. We believe, however, that thecurrent results provide qualitatively reasonable estimations ofthe intensity ratios that can be profitably compared with theexperimental data.
Chain Length. A comparison of the matrix elements for theshort chain thiol with one layer of graphite, given in Table 7,with the matrix elements for the long chain thiol in Table 5(4-atom tip) indicates that the additional atoms change therelative contrast of the atoms in the molecule. The long chainthiol shows a pronounced peak in the vicinity of the terminalthiol group while the short chain thiol shows a substantiallyless pronounced peak. The relative contrast of the long chainthiol is similar to the contrast shown by the two layer shortchain thiol results presented in Table 7. However, the long chainthiol results show a more pronounced peak in the vicinity ofthe functional group. The use of a larger chain, and subsequentlya larger graphite layer, thereby produces an effect similar tothe use of a second layer of graphite with a short carbon chain.Hence, as was justified above, all subsequent calculationsutilized a long chain molecule adsorbed on a single graphitelayer.
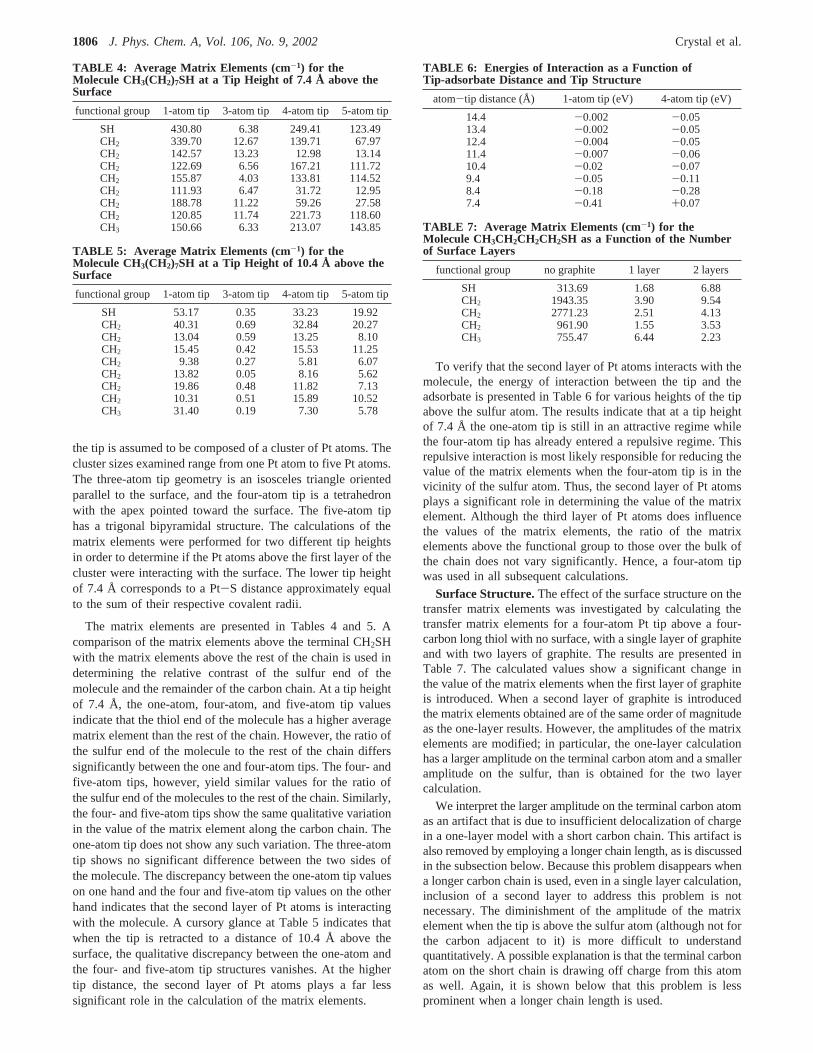
Resolution.To determine the number of points required toreproduce the most prominent features of the experimental STMimages, the following procedure was followed. A grid of points,with spacing of 0.2 Å between grid points, was used to generatethe image (Figure 1a) of a short chain brominated alkaneadsorbed on a single layer of graphite. The STM tip is composedof a tetrahedral cluster of Pt atoms and is at a bias voltage of2 V relative to the surface. The results were then comparedwith the plot generated by sampling only points directly aboveatoms in the adsorbate (Figure 1b). Both figures show anincreased brightness (increased tunneling probability) in thevicinity of the terminal CH2Br group as the most prominentfeature of the image. The comparison shows that sampling aboveatoms in the adsorbate adequately accounts for the mostprominent features of the image. Therefore, the matrix elementsfor all subsequent molecules were only calculated with the tipdirectly over the atoms of the adsorbate.
Summary of Convergence Studies of the Physical Modeland Connection with Embedding Analysis.In section II(A),our analysis assumed that we were calculating eigenstates ofthe tip and sample using embedding boundary conditions. Inactual fact, we have instead used finite clusters either cappedby hydrogens (sample) or simply terminated at a finite numberof atoms (tip). However, in section II(A), we argued that if thequantity of interest (the diabatic tunneling matrix element) couldbe shown to be more or less converged with respect to increasesin the size of the model, then the model was a satisfactoryreplacement for the use of embedding boundary conditions.Specifically, what such convergence demonstrates is preciselywhat was assumed in asserting the validity of eqs 3 and 4.Namely, as the cluster is increasingly coupled to the remainderof the system, the relevant frontier orbitals are not stronglymixed with other states of the tip and hence they do notqualitatively change the matrix element from what is being
estimated in the cluster calculation. For the tip, the closeagreement of the four- and five-atom tips provides evidencealong these lines. Note the inadequacy of the single-atom tip,which clearly does not represent a good approximation toembedding boundary conditions. Similarly, note that for thesample the isolated molecule is also a qualitatively inadequatemodel, while the use of a single graphite layer, although notfully converged, is judged to be adequate for our purposes inthis paper. Of course, these conclusions might be modified bymore careful studies of larger and more realistic representationsof either the tip or sample. On the other hand, the models weare using here are rather large when compared with other abinitio computations along these lines reported in the literature,and therefore constitute a reasonable starting point for asemiquantitative analysis, which is our goal in the present paper.
IV. Results
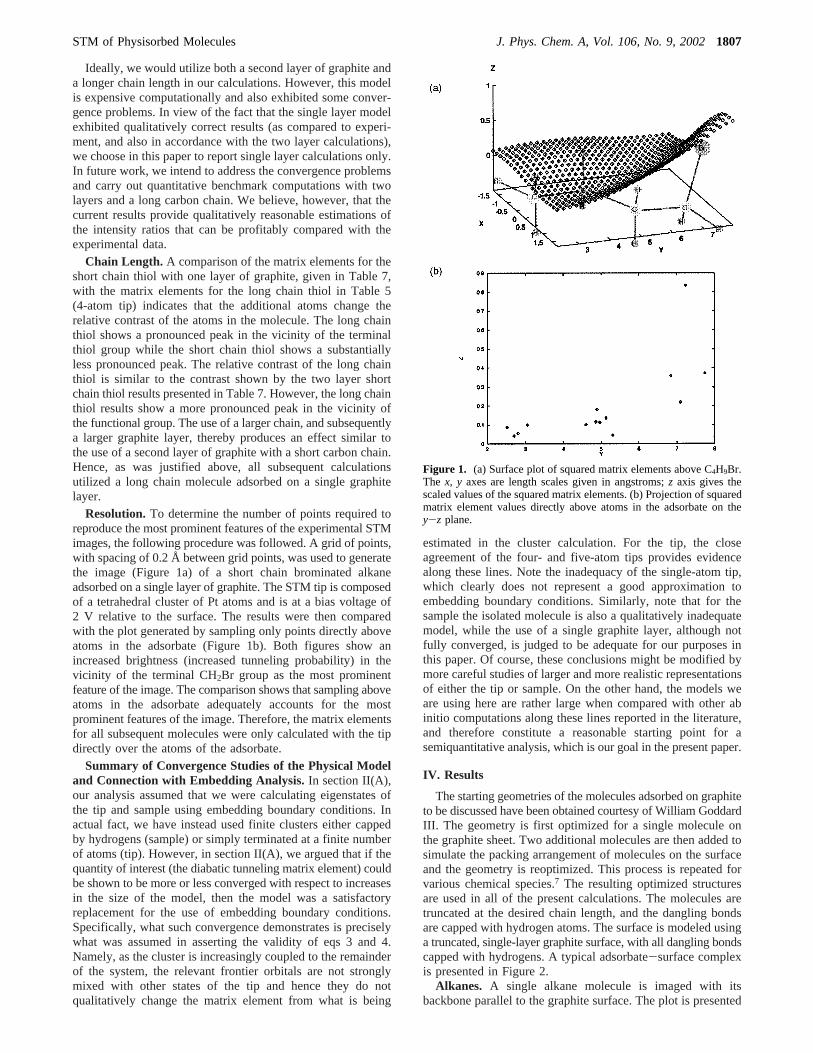
The starting geometries of the molecules adsorbed on graphiteto be discussed have been obtained courtesy of William GoddardIII. The geometry is first optimized for a single molecule onthe graphite sheet. Two additional molecules are then added tosimulate the packing arrangement of molecules on the surfaceand the geometry is reoptimized. This process is repeated forvarious chemical species.7 The resulting optimized structuresare used in all of the present calculations. The molecules aretruncated at the desired chain length, and the dangling bondsare capped with hydrogen atoms. The surface is modeled usinga truncated, single-layer graphite surface, with all dangling bondscapped with hydrogens. A typical adsorbate-surface complexis presented in Figure 2.
Alkanes. A single alkane molecule is imaged with itsbackbone parallel to the graphite surface. The plot is presented
Figure 1. (a) Surface plot of squared matrix elements above C4H9Br.The x, y axes are length scales given in angstroms;z axis gives thescaled values of the squared matrix elements. (b) Projection of squaredmatrix element values directly above atoms in the adsorbate on they-z plane.
STM of Physisorbed Molecules J. Phys. Chem. A, Vol. 106, No. 9, 20021807
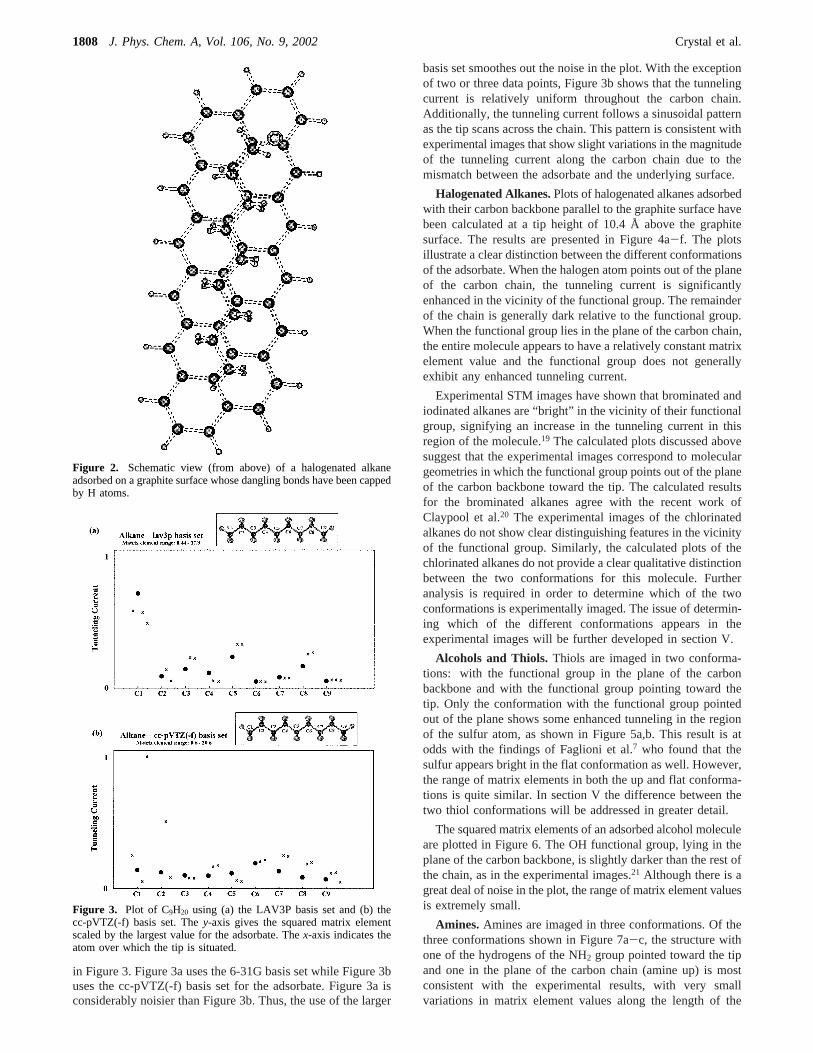
in Figure 3. Figure 3a uses the 6-31G basis set while Figure 3buses the cc-pVTZ(-f) basis set for the adsorbate. Figure 3a isconsiderably noisier than Figure 3b. Thus, the use of the larger
basis set smoothes out the noise in the plot. With the exceptionof two or three data points, Figure 3b shows that the tunnelingcurrent is relatively uniform throughout the carbon chain.Additionally, the tunneling current follows a sinusoidal patternas the tip scans across the chain. This pattern is consistent withexperimental images that show slight variations in the magnitudeof the tunneling current along the carbon chain due to themismatch between the adsorbate and the underlying surface.
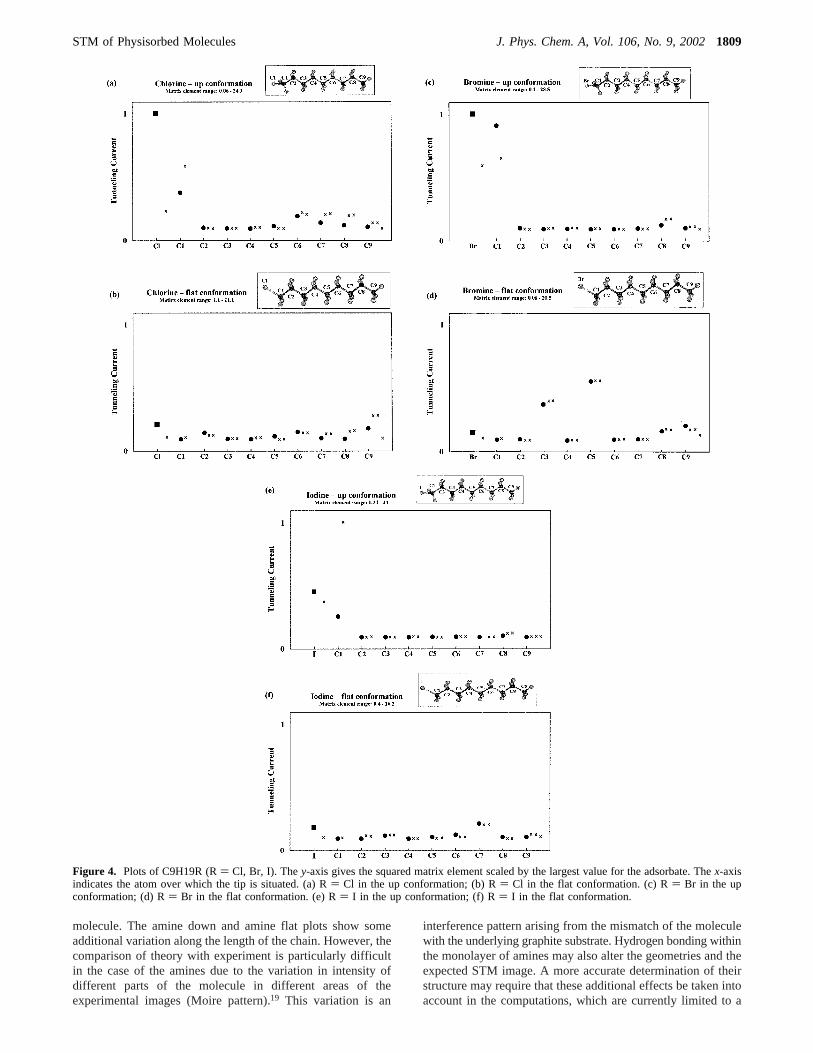
Halogenated Alkanes.Plots of halogenated alkanes adsorbedwith their carbon backbone parallel to the graphite surface havebeen calculated at a tip height of 10.4 Å above the graphitesurface. The results are presented in Figure 4a-f. The plotsillustrate a clear distinction between the different conformationsof the adsorbate. When the halogen atom points out of the planeof the carbon chain, the tunneling current is significantlyenhanced in the vicinity of the functional group. The remainderof the chain is generally dark relative to the functional group.When the functional group lies in the plane of the carbon chain,the entire molecule appears to have a relatively constant matrixelement value and the functional group does not generallyexhibit any enhanced tunneling current.
Experimental STM images have shown that brominated andiodinated alkanes are “bright” in the vicinity of their functionalgroup, signifying an increase in the tunneling current in thisregion of the molecule.19 The calculated plots discussed abovesuggest that the experimental images correspond to moleculargeometries in which the functional group points out of the planeof the carbon backbone toward the tip. The calculated resultsfor the brominated alkanes agree with the recent work ofClaypool et al.20 The experimental images of the chlorinatedalkanes do not show clear distinguishing features in the vicinityof the functional group. Similarly, the calculated plots of thechlorinated alkanes do not provide a clear qualitative distinctionbetween the two conformations for this molecule. Furtheranalysis is required in order to determine which of the twoconformations is experimentally imaged. The issue of determin-ing which of the different conformations appears in theexperimental images will be further developed in section V.
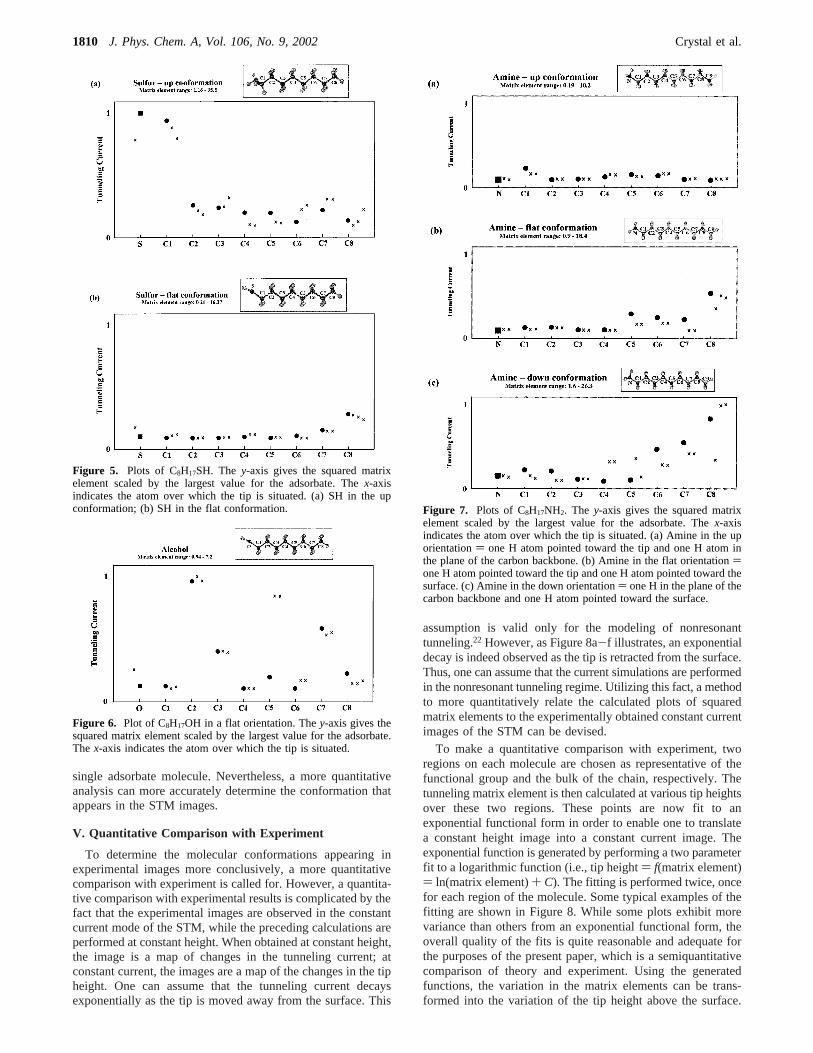
Alcohols and Thiols. Thiols are imaged in two conforma-tions: with the functional group in the plane of the carbonbackbone and with the functional group pointing toward thetip. Only the conformation with the functional group pointedout of the plane shows some enhanced tunneling in the regionof the sulfur atom, as shown in Figure 5a,b. This result is atodds with the findings of Faglioni et al.7 who found that thesulfur appears bright in the flat conformation as well. However,the range of matrix elements in both the up and flat conforma-tions is quite similar. In section V the difference between thetwo thiol conformations will be addressed in greater detail.
The squared matrix elements of an adsorbed alcohol moleculeare plotted in Figure 6. The OH functional group, lying in theplane of the carbon backbone, is slightly darker than the rest ofthe chain, as in the experimental images.21 Although there is agreat deal of noise in the plot, the range of matrix element valuesis extremely small.
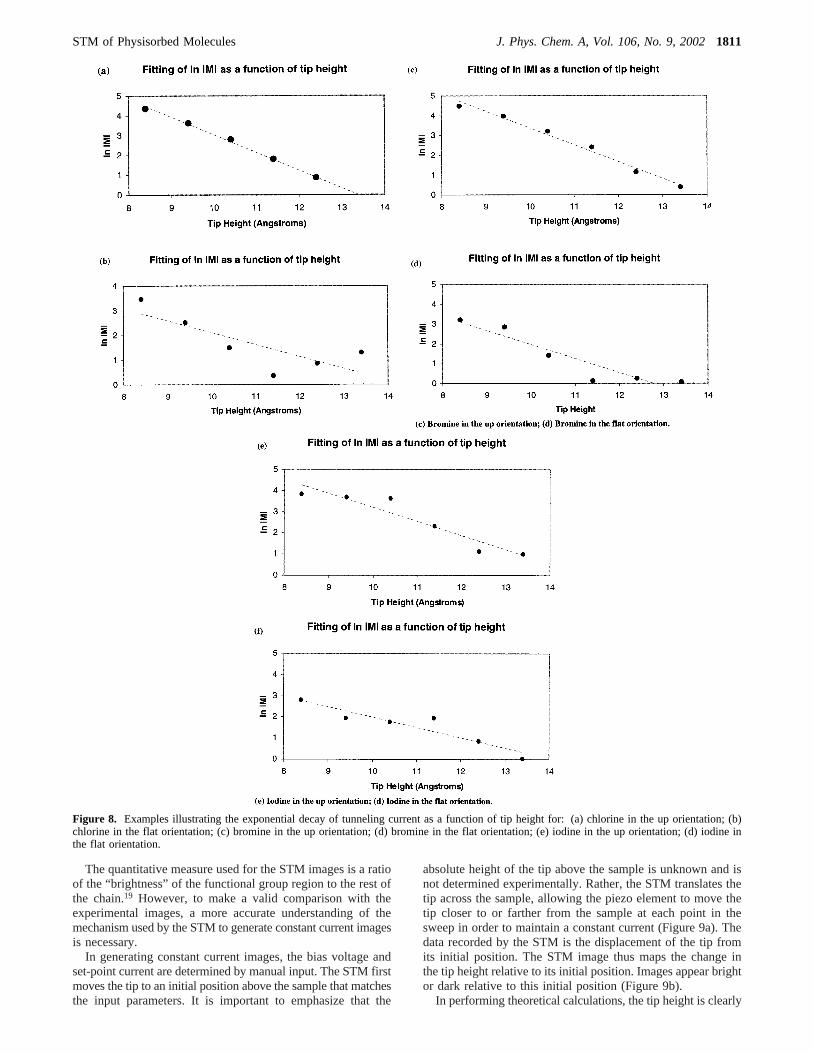
Amines. Amines are imaged in three conformations. Of thethree conformations shown in Figure 7a-c, the structure withone of the hydrogens of the NH2 group pointed toward the tipand one in the plane of the carbon chain (amine up) is mostconsistent with the experimental results, with very smallvariations in matrix element values along the length of the
Figure 2. Schematic view (from above) of a halogenated alkaneadsorbed on a graphite surface whose dangling bonds have been cappedby H atoms.
Figure 3. Plot of C9H20 using (a) the LAV3P basis set and (b) thecc-pVTZ(-f) basis set. They-axis gives the squared matrix elementscaled by the largest value for the adsorbate. Thex-axis indicates theatom over which the tip is situated.
1808 J. Phys. Chem. A, Vol. 106, No. 9, 2002 Crystal et al.
molecule. The amine down and amine flat plots show someadditional variation along the length of the chain. However, thecomparison of theory with experiment is particularly difficultin the case of the amines due to the variation in intensity ofdifferent parts of the molecule in different areas of theexperimental images (Moire pattern).19 This variation is an
interference pattern arising from the mismatch of the moleculewith the underlying graphite substrate. Hydrogen bonding withinthe monolayer of amines may also alter the geometries and theexpected STM image. A more accurate determination of theirstructure may require that these additional effects be taken intoaccount in the computations, which are currently limited to a
Figure 4. Plots of C9H19R (R) Cl, Br, I). They-axis gives the squared matrix element scaled by the largest value for the adsorbate. Thex-axisindicates the atom over which the tip is situated. (a) R) Cl in the up conformation; (b) R) Cl in the flat conformation. (c) R) Br in the upconformation; (d) R) Br in the flat conformation. (e) R) I in the up conformation; (f) R) I in the flat conformation.
STM of Physisorbed Molecules J. Phys. Chem. A, Vol. 106, No. 9, 20021809
single adsorbate molecule. Nevertheless, a more quantitativeanalysis can more accurately determine the conformation thatappears in the STM images.
V. Quantitative Comparison with Experiment
To determine the molecular conformations appearing inexperimental images more conclusively, a more quantitativecomparison with experiment is called for. However, a quantita-tive comparison with experimental results is complicated by thefact that the experimental images are observed in the constantcurrent mode of the STM, while the preceding calculations areperformed at constant height. When obtained at constant height,the image is a map of changes in the tunneling current; atconstant current, the images are a map of the changes in the tipheight. One can assume that the tunneling current decaysexponentially as the tip is moved away from the surface. This
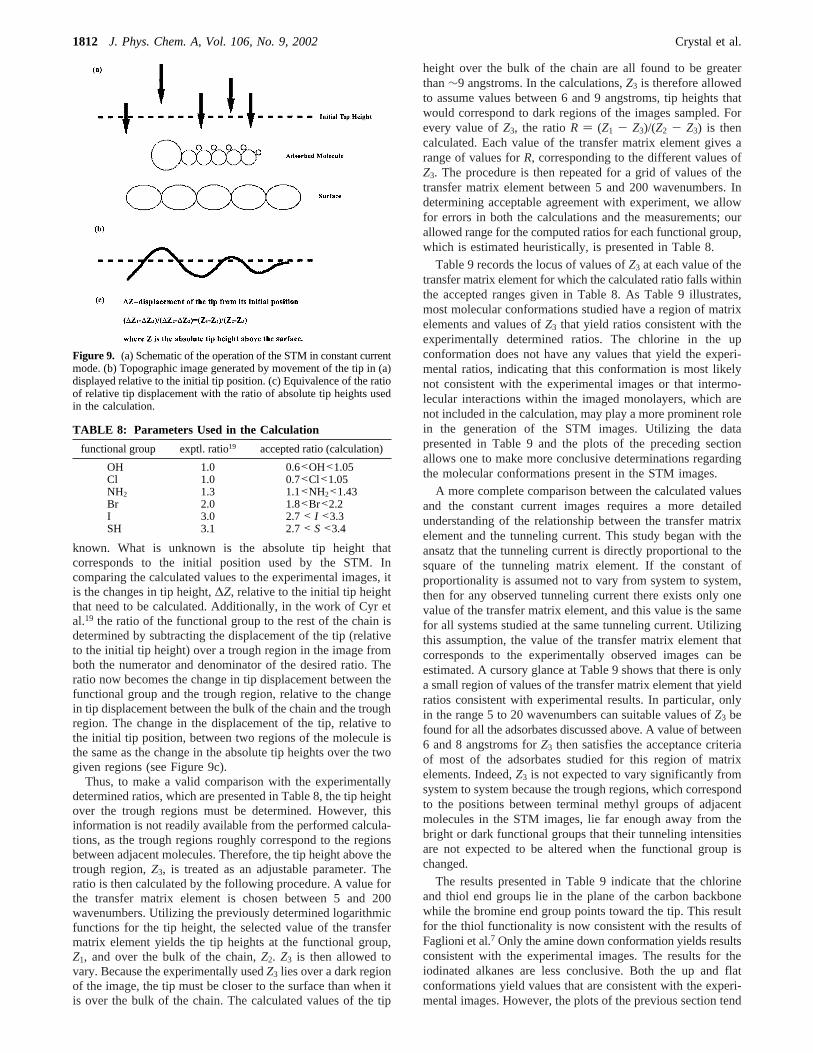
assumption is valid only for the modeling of nonresonanttunneling.22 However, as Figure 8a-f illustrates, an exponentialdecay is indeed observed as the tip is retracted from the surface.Thus, one can assume that the current simulations are performedin the nonresonant tunneling regime. Utilizing this fact, a methodto more quantitatively relate the calculated plots of squaredmatrix elements to the experimentally obtained constant currentimages of the STM can be devised.
To make a quantitative comparison with experiment, tworegions on each molecule are chosen as representative of thefunctional group and the bulk of the chain, respectively. Thetunneling matrix element is then calculated at various tip heightsover these two regions. These points are now fit to anexponential functional form in order to enable one to translatea constant height image into a constant current image. Theexponential function is generated by performing a two parameterfit to a logarithmic function (i.e., tip height) f(matrix element)) ln(matrix element)+ C). The fitting is performed twice, oncefor each region of the molecule. Some typical examples of thefitting are shown in Figure 8. While some plots exhibit morevariance than others from an exponential functional form, theoverall quality of the fits is quite reasonable and adequate forthe purposes of the present paper, which is a semiquantitativecomparison of theory and experiment. Using the generatedfunctions, the variation in the matrix elements can be trans-formed into the variation of the tip height above the surface.
Figure 5. Plots of C8H17SH. The y-axis gives the squared matrixelement scaled by the largest value for the adsorbate. Thex-axisindicates the atom over which the tip is situated. (a) SH in the upconformation; (b) SH in the flat conformation.
Figure 6. Plot of C8H17OH in a flat orientation. They-axis gives thesquared matrix element scaled by the largest value for the adsorbate.The x-axis indicates the atom over which the tip is situated.
Figure 7. Plots of C8H17NH2. The y-axis gives the squared matrixelement scaled by the largest value for the adsorbate. Thex-axisindicates the atom over which the tip is situated. (a) Amine in the uporientation) one H atom pointed toward the tip and one H atom inthe plane of the carbon backbone. (b) Amine in the flat orientation)one H atom pointed toward the tip and one H atom pointed toward thesurface. (c) Amine in the down orientation) one H in the plane of thecarbon backbone and one H atom pointed toward the surface.
1810 J. Phys. Chem. A, Vol. 106, No. 9, 2002 Crystal et al.
The quantitative measure used for the STM images is a ratioof the “brightness” of the functional group region to the rest ofthe chain.19 However, to make a valid comparison with theexperimental images, a more accurate understanding of themechanism used by the STM to generate constant current imagesis necessary.
In generating constant current images, the bias voltage andset-point current are determined by manual input. The STM firstmoves the tip to an initial position above the sample that matchesthe input parameters. It is important to emphasize that the
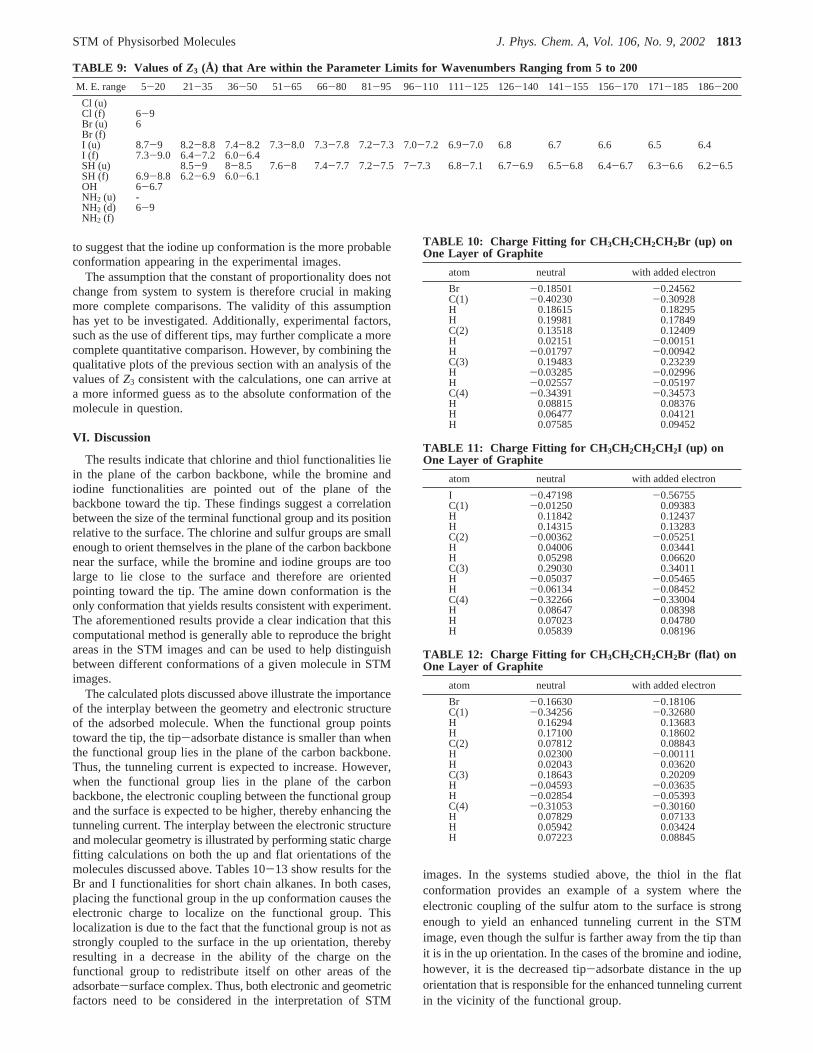
absolute height of the tip above the sample is unknown and isnot determined experimentally. Rather, the STM translates thetip across the sample, allowing the piezo element to move thetip closer to or farther from the sample at each point in thesweep in order to maintain a constant current (Figure 9a). Thedata recorded by the STM is the displacement of the tip fromits initial position. The STM image thus maps the change inthe tip height relative to its initial position. Images appear brightor dark relative to this initial position (Figure 9b).
In performing theoretical calculations, the tip height is clearly
Figure 8. Examples illustrating the exponential decay of tunneling current as a function of tip height for: (a) chlorine in the up orientation; (b)chlorine in the flat orientation; (c) bromine in the up orientation; (d) bromine in the flat orientation; (e) iodine in the up orientation; (d) iodine inthe flat orientation.
STM of Physisorbed Molecules J. Phys. Chem. A, Vol. 106, No. 9, 20021811
known. What is unknown is the absolute tip height thatcorresponds to the initial position used by the STM. Incomparing the calculated values to the experimental images, itis the changes in tip height,∆Z, relative to the initial tip heightthat need to be calculated. Additionally, in the work of Cyr etal.19 the ratio of the functional group to the rest of the chain isdetermined by subtracting the displacement of the tip (relativeto the initial tip height) over a trough region in the image fromboth the numerator and denominator of the desired ratio. Theratio now becomes the change in tip displacement between thefunctional group and the trough region, relative to the changein tip displacement between the bulk of the chain and the troughregion. The change in the displacement of the tip, relative tothe initial tip position, between two regions of the molecule isthe same as the change in the absolute tip heights over the twogiven regions (see Figure 9c).
Thus, to make a valid comparison with the experimentallydetermined ratios, which are presented in Table 8, the tip heightover the trough regions must be determined. However, thisinformation is not readily available from the performed calcula-tions, as the trough regions roughly correspond to the regionsbetween adjacent molecules. Therefore, the tip height above thetrough region,Z3, is treated as an adjustable parameter. Theratio is then calculated by the following procedure. A value forthe transfer matrix element is chosen between 5 and 200wavenumbers. Utilizing the previously determined logarithmicfunctions for the tip height, the selected value of the transfermatrix element yields the tip heights at the functional group,Z1, and over the bulk of the chain,Z2. Z3 is then allowed tovary. Because the experimentally usedZ3 lies over a dark regionof the image, the tip must be closer to the surface than when itis over the bulk of the chain. The calculated values of the tip
height over the bulk of the chain are all found to be greaterthan∼9 angstroms. In the calculations,Z3 is therefore allowedto assume values between 6 and 9 angstroms, tip heights thatwould correspond to dark regions of the images sampled. Forevery value ofZ3, the ratioR ) (Z1 - Z3)/(Z2 - Z3) is thencalculated. Each value of the transfer matrix element gives arange of values forR, corresponding to the different values ofZ3. The procedure is then repeated for a grid of values of thetransfer matrix element between 5 and 200 wavenumbers. Indetermining acceptable agreement with experiment, we allowfor errors in both the calculations and the measurements; ourallowed range for the computed ratios for each functional group,which is estimated heuristically, is presented in Table 8.
Table 9 records the locus of values ofZ3 at each value of thetransfer matrix element for which the calculated ratio falls withinthe accepted ranges given in Table 8. As Table 9 illustrates,most molecular conformations studied have a region of matrixelements and values ofZ3 that yield ratios consistent with theexperimentally determined ratios. The chlorine in the upconformation does not have any values that yield the experi-mental ratios, indicating that this conformation is most likelynot consistent with the experimental images or that intermo-lecular interactions within the imaged monolayers, which arenot included in the calculation, may play a more prominent rolein the generation of the STM images. Utilizing the datapresented in Table 9 and the plots of the preceding sectionallows one to make more conclusive determinations regardingthe molecular conformations present in the STM images.
A more complete comparison between the calculated valuesand the constant current images requires a more detailedunderstanding of the relationship between the transfer matrixelement and the tunneling current. This study began with theansatz that the tunneling current is directly proportional to thesquare of the tunneling matrix element. If the constant ofproportionality is assumed not to vary from system to system,then for any observed tunneling current there exists only onevalue of the transfer matrix element, and this value is the samefor all systems studied at the same tunneling current. Utilizingthis assumption, the value of the transfer matrix element thatcorresponds to the experimentally observed images can beestimated. A cursory glance at Table 9 shows that there is onlya small region of values of the transfer matrix element that yieldratios consistent with experimental results. In particular, onlyin the range 5 to 20 wavenumbers can suitable values ofZ3 befound for all the adsorbates discussed above. A value of between6 and 8 angstroms forZ3 then satisfies the acceptance criteriaof most of the adsorbates studied for this region of matrixelements. Indeed,Z3 is not expected to vary significantly fromsystem to system because the trough regions, which correspondto the positions between terminal methyl groups of adjacentmolecules in the STM images, lie far enough away from thebright or dark functional groups that their tunneling intensitiesare not expected to be altered when the functional group ischanged.
The results presented in Table 9 indicate that the chlorineand thiol end groups lie in the plane of the carbon backbonewhile the bromine end group points toward the tip. This resultfor the thiol functionality is now consistent with the results ofFaglioni et al.7 Only the amine down conformation yields resultsconsistent with the experimental images. The results for theiodinated alkanes are less conclusive. Both the up and flatconformations yield values that are consistent with the experi-mental images. However, the plots of the previous section tend
Figure 9. (a) Schematic of the operation of the STM in constant currentmode. (b) Topographic image generated by movement of the tip in (a)displayed relative to the initial tip position. (c) Equivalence of the ratioof relative tip displacement with the ratio of absolute tip heights usedin the calculation.
TABLE 8: Parameters Used in the Calculation
functional group exptl. ratio19 accepted ratio (calculation)
OH 1.0 0.6<OH<1.05Cl 1.0 0.7<Cl<1.05NH2 1.3 1.1<NH2<1.43Br 2.0 1.8<Br<2.2I 3.0 2.7< I <3.3SH 3.1 2.7< S<3.4
1812 J. Phys. Chem. A, Vol. 106, No. 9, 2002 Crystal et al.
to suggest that the iodine up conformation is the more probableconformation appearing in the experimental images.
The assumption that the constant of proportionality does notchange from system to system is therefore crucial in makingmore complete comparisons. The validity of this assumptionhas yet to be investigated. Additionally, experimental factors,such as the use of different tips, may further complicate a morecomplete quantitative comparison. However, by combining thequalitative plots of the previous section with an analysis of thevalues ofZ3 consistent with the calculations, one can arrive ata more informed guess as to the absolute conformation of themolecule in question.
VI. Discussion
The results indicate that chlorine and thiol functionalities liein the plane of the carbon backbone, while the bromine andiodine functionalities are pointed out of the plane of thebackbone toward the tip. These findings suggest a correlationbetween the size of the terminal functional group and its positionrelative to the surface. The chlorine and sulfur groups are smallenough to orient themselves in the plane of the carbon backbonenear the surface, while the bromine and iodine groups are toolarge to lie close to the surface and therefore are orientedpointing toward the tip. The amine down conformation is theonly conformation that yields results consistent with experiment.The aforementioned results provide a clear indication that thiscomputational method is generally able to reproduce the brightareas in the STM images and can be used to help distinguishbetween different conformations of a given molecule in STMimages.
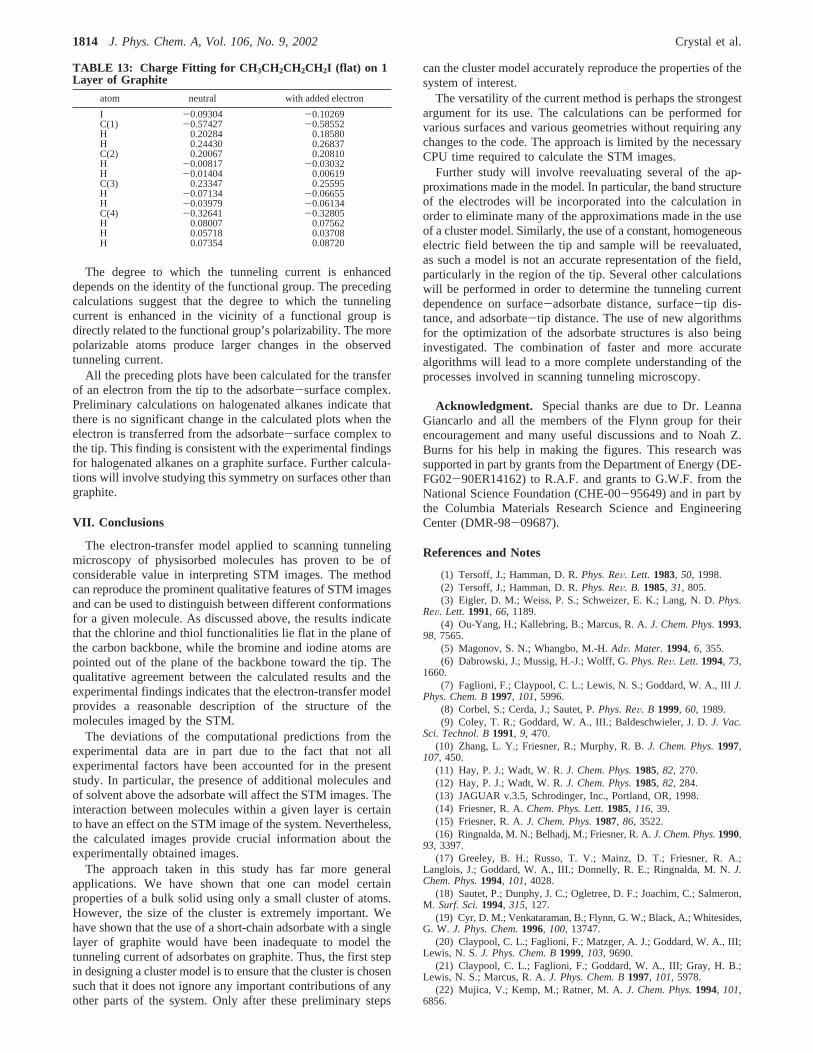
The calculated plots discussed above illustrate the importanceof the interplay between the geometry and electronic structureof the adsorbed molecule. When the functional group pointstoward the tip, the tip-adsorbate distance is smaller than whenthe functional group lies in the plane of the carbon backbone.Thus, the tunneling current is expected to increase. However,when the functional group lies in the plane of the carbonbackbone, the electronic coupling between the functional groupand the surface is expected to be higher, thereby enhancing thetunneling current. The interplay between the electronic structureand molecular geometry is illustrated by performing static chargefitting calculations on both the up and flat orientations of themolecules discussed above. Tables 10-13 show results for theBr and I functionalities for short chain alkanes. In both cases,placing the functional group in the up conformation causes theelectronic charge to localize on the functional group. Thislocalization is due to the fact that the functional group is not asstrongly coupled to the surface in the up orientation, therebyresulting in a decrease in the ability of the charge on thefunctional group to redistribute itself on other areas of theadsorbate-surface complex. Thus, both electronic and geometricfactors need to be considered in the interpretation of STM
images. In the systems studied above, the thiol in the flatconformation provides an example of a system where theelectronic coupling of the sulfur atom to the surface is strongenough to yield an enhanced tunneling current in the STMimage, even though the sulfur is farther away from the tip thanit is in the up orientation. In the cases of the bromine and iodine,however, it is the decreased tip-adsorbate distance in the uporientation that is responsible for the enhanced tunneling currentin the vicinity of the functional group.
TABLE 9: Values of Z3 (Å) that Are within the Parameter Limits for Wavenumbers Ranging from 5 to 200
M. E. range 5-20 21-35 36-50 51-65 66-80 81-95 96-110 111-125 126-140 141-155 156-170 171-185 186-200
Cl (u)Cl (f) 6-9Br (u) 6Br (f)I (u) 8.7-9 8.2-8.8 7.4-8.2 7.3-8.0 7.3-7.8 7.2-7.3 7.0-7.2 6.9-7.0 6.8 6.7 6.6 6.5 6.4I (f) 7.3-9.0 6.4-7.2 6.0-6.4SH (u) 8.5-9 8-8.5 7.6-8 7.4-7.7 7.2-7.5 7-7.3 6.8-7.1 6.7-6.9 6.5-6.8 6.4-6.7 6.3-6.6 6.2-6.5SH (f) 6.9-8.8 6.2-6.9 6.0-6.1OH 6-6.7NH2 (u) -NH2 (d) 6-9NH2 (f)
TABLE 10: Charge Fitting for CH 3CH2CH2CH2Br (up) onOne Layer of Graphite
atom neutral with added electron
Br -0.18501 -0.24562C(1) -0.40230 -0.30928H 0.18615 0.18295H 0.19981 0.17849C(2) 0.13518 0.12409H 0.02151 -0.00151H -0.01797 -0.00942C(3) 0.19483 0.23239H -0.03285 -0.02996H -0.02557 -0.05197C(4) -0.34391 -0.34573H 0.08815 0.08376H 0.06477 0.04121H 0.07585 0.09452
TABLE 11: Charge Fitting for CH 3CH2CH2CH2I (up) onOne Layer of Graphite
atom neutral with added electron
I -0.47198 -0.56755C(1) -0.01250 0.09383H 0.11842 0.12437H 0.14315 0.13283C(2) -0.00362 -0.05251H 0.04006 0.03441H 0.05298 0.06620C(3) 0.29030 0.34011H -0.05037 -0.05465H -0.06134 -0.08452C(4) -0.32266 -0.33004H 0.08647 0.08398H 0.07023 0.04780H 0.05839 0.08196
TABLE 12: Charge Fitting for CH 3CH2CH2CH2Br (flat) onOne Layer of Graphite
atom neutral with added electron
Br -0.16630 -0.18106C(1) -0.34256 -0.32680H 0.16294 0.13683H 0.17100 0.18602C(2) 0.07812 0.08843H 0.02300 -0.00111H 0.02043 0.03620C(3) 0.18643 0.20209H -0.04593 -0.03635H -0.02854 -0.05393C(4) -0.31053 -0.30160H 0.07829 0.07133H 0.05942 0.03424H 0.07223 0.08845
STM of Physisorbed Molecules J. Phys. Chem. A, Vol. 106, No. 9, 20021813
The degree to which the tunneling current is enhanceddepends on the identity of the functional group. The precedingcalculations suggest that the degree to which the tunnelingcurrent is enhanced in the vicinity of a functional group isdirectly related to the functional group’s polarizability. The morepolarizable atoms produce larger changes in the observedtunneling current.
All the preceding plots have been calculated for the transferof an electron from the tip to the adsorbate-surface complex.Preliminary calculations on halogenated alkanes indicate thatthere is no significant change in the calculated plots when theelectron is transferred from the adsorbate-surface complex tothe tip. This finding is consistent with the experimental findingsfor halogenated alkanes on a graphite surface. Further calcula-tions will involve studying this symmetry on surfaces other thangraphite.
VII. Conclusions
The electron-transfer model applied to scanning tunnelingmicroscopy of physisorbed molecules has proven to be ofconsiderable value in interpreting STM images. The methodcan reproduce the prominent qualitative features of STM imagesand can be used to distinguish between different conformationsfor a given molecule. As discussed above, the results indicatethat the chlorine and thiol functionalities lie flat in the plane ofthe carbon backbone, while the bromine and iodine atoms arepointed out of the plane of the backbone toward the tip. Thequalitative agreement between the calculated results and theexperimental findings indicates that the electron-transfer modelprovides a reasonable description of the structure of themolecules imaged by the STM.
The deviations of the computational predictions from theexperimental data are in part due to the fact that not allexperimental factors have been accounted for in the presentstudy. In particular, the presence of additional molecules andof solvent above the adsorbate will affect the STM images. Theinteraction between molecules within a given layer is certainto have an effect on the STM image of the system. Nevertheless,the calculated images provide crucial information about theexperimentally obtained images.
The approach taken in this study has far more generalapplications. We have shown that one can model certainproperties of a bulk solid using only a small cluster of atoms.However, the size of the cluster is extremely important. Wehave shown that the use of a short-chain adsorbate with a singlelayer of graphite would have been inadequate to model thetunneling current of adsorbates on graphite. Thus, the first stepin designing a cluster model is to ensure that the cluster is chosensuch that it does not ignore any important contributions of anyother parts of the system. Only after these preliminary steps
can the cluster model accurately reproduce the properties of thesystem of interest.
The versatility of the current method is perhaps the strongestargument for its use. The calculations can be performed forvarious surfaces and various geometries without requiring anychanges to the code. The approach is limited by the necessaryCPU time required to calculate the STM images.
Further study will involve reevaluating several of the ap-proximations made in the model. In particular, the band structureof the electrodes will be incorporated into the calculation inorder to eliminate many of the approximations made in the useof a cluster model. Similarly, the use of a constant, homogeneouselectric field between the tip and sample will be reevaluated,as such a model is not an accurate representation of the field,particularly in the region of the tip. Several other calculationswill be performed in order to determine the tunneling currentdependence on surface-adsorbate distance, surface-tip dis-tance, and adsorbate-tip distance. The use of new algorithmsfor the optimization of the adsorbate structures is also beinginvestigated. The combination of faster and more accuratealgorithms will lead to a more complete understanding of theprocesses involved in scanning tunneling microscopy.
Acknowledgment. Special thanks are due to Dr. LeannaGiancarlo and all the members of the Flynn group for theirencouragement and many useful discussions and to Noah Z.Burns for his help in making the figures. This research wassupported in part by grants from the Department of Energy (DE-FG02-90ER14162) to R.A.F. and grants to G.W.F. from theNational Science Foundation (CHE-00-95649) and in part bythe Columbia Materials Research Science and EngineeringCenter (DMR-98-09687).
References and Notes
(1) Tersoff, J.; Hamman, D. R.Phys. ReV. Lett. 1983, 50, 1998.(2) Tersoff, J.; Hamman, D. R.Phys. ReV. B. 1985, 31, 805.(3) Eigler, D. M.; Weiss, P. S.; Schweizer, E. K.; Lang, N. D.Phys.
ReV. Lett. 1991, 66, 1189.(4) Ou-Yang, H.; Kallebring, B.; Marcus, R. A.J. Chem. Phys.1993,
98, 7565.(5) Magonov, S. N.; Whangbo, M.-H.AdV. Mater. 1994, 6, 355.(6) Dabrowski, J.; Mussig, H.-J.; Wolff, G.Phys. ReV. Lett.1994, 73,
1660.(7) Faglioni, F.; Claypool, C. L.; Lewis, N. S.; Goddard, W. A., IIIJ.
Phys. Chem. B1997, 101, 5996.(8) Corbel, S.; Cerda, J.; Sautet, P.Phys. ReV. B 1999, 60, 1989.(9) Coley, T. R.; Goddard, W. A., III.; Baldeschwieler, J. D.J. Vac.
Sci. Technol. B1991, 9, 470.(10) Zhang, L. Y.; Friesner, R.; Murphy, R. B.J. Chem. Phys.1997,
107, 450.(11) Hay, P. J.; Wadt, W. R.J. Chem. Phys.1985, 82, 270.(12) Hay, P. J.; Wadt, W. R.J. Chem. Phys.1985, 82, 284.(13) JAGUAR v.3.5, Schrodinger, Inc., Portland, OR, 1998.(14) Friesner, R. A.Chem. Phys. Lett.1985, 116, 39.(15) Friesner, R. A.J. Chem. Phys.1987, 86, 3522.(16) Ringnalda, M. N.; Belhadj, M.; Friesner, R. A.J. Chem. Phys.1990,
93, 3397.(17) Greeley, B. H.; Russo, T. V.; Mainz, D. T.; Friesner, R. A.;
Langlois, J.; Goddard, W. A., III.; Donnelly, R. E.; Ringnalda, M. N.J.Chem. Phys.1994, 101, 4028.
(18) Sautet, P.; Dunphy, J. C.; Ogletree, D. F.; Joachim, C.; Salmeron,M. Surf. Sci.1994, 315, 127.
(19) Cyr, D. M.; Venkataraman, B.; Flynn, G. W.; Black, A.; Whitesides,G. W. J. Phys. Chem.1996, 100, 13747.
(20) Claypool, C. L.; Faglioni, F.; Matzger, A. J.; Goddard, W. A., III;Lewis, N. S.J. Phys. Chem. B1999, 103, 9690.
(21) Claypool, C. L.; Faglioni, F.; Goddard, W. A., III; Gray, H. B.;Lewis, N. S.; Marcus, R. A.J. Phys. Chem. B1997, 101, 5978.
(22) Mujica, V.; Kemp, M.; Ratner, M. A.J. Chem. Phys.1994, 101,6856.
TABLE 13: Charge Fitting for CH 3CH2CH2CH2I (flat) on 1Layer of Graphite
atom neutral with added electron
I -0.09304 -0.10269C(1) -0.57427 -0.58552H 0.20284 0.18580H 0.24430 0.26837C(2) 0.20067 0.20810H -0.00817 -0.03032H -0.01404 0.00619C(3) 0.23347 0.25595H -0.07134 -0.06655H -0.03979 -0.06134C(4) -0.32641 -0.32805H 0.08007 0.07562H 0.05718 0.03708H 0.07354 0.08720
1814 J. Phys. Chem. A, Vol. 106, No. 9, 2002 Crystal et al.