Embed Size (px)
Citation preview
Tel-Aviv University
The Raymond and Beverly Sackler Faculty of Exact Sciences
The Blavatnik School of Computer Science
Computational Metabolic Modeling of
Cellular Growth: From Bacteria to Cancer
This thesis is submitted in partial fulfillment of the
requirements towards the M.Sc. degree
Tel-Aviv University
The Blavatnik School of Computer Science
by
Tomer Benyamini
The research work in this thesis has been carried out
under the supervision of Prof. Eytan Ruppin and Prof. Roded Sharan
September, 2010

Acknowledgments
First and foremost I would like to thank my leading advisor, Prof. Eytan Ruppin for his
incredible support and patience. Very special thanks to Dr. Tomer Shlomi for his
overwhelming help and striving towards perfection. Also thanks to Prof. Roded Sharan, my
co-advisor, for his guidance and especially for introducing me to his original way of
thinking. I would also like to thank my lab members: Ori Folger, Livnat Jerby, Adi Shabi,
Keren Yizhak, and Hadas Zur for their advice and friendship.
Abstract
Constraint-based modeling (CBM) has been very commonly used for metabolic network
analysis, and currently, dozens of genome-scale models amenable for CBM analysis are
available for various multi-cellular and unicellular organisms. Cell division rate (growth
rate) is a widely used estimate of the fitness of unicellular organisms, and aiming to follow
this principle, the popular CBM method „flux balance analysis‟ (FBA), predicts metabolic
behavior of an organism by maximizing the growth-demand of a predefined set of essential
biomass precursors, allowing maximal growth rate. However, ignoring the growth demand
for the synthesis of intermediate metabolites required for balancing their dilution, leads
FBA to false predictions in some cases. In chapter 2 we present a new method to address
this problem, resulting in improved metabolic phenotype predictions.
Despite the fact that FBA is frequently used for unicellular organisms, it has been rarely
applied for multi-cellular ones, as single cells in a multi-cellular system cannot be
considered to maximize their own individual growth rates. Nevertheless, for some cell
types, and specifically for cancer cells, growth rate maximization can be a good proxy for
the single cell‟s objective and for identifying the cell‟s most likely metabolic rate. Recently,
it has been suggested that a classical hallmark of cancer metabolism, the Warburg effect, is
a consequence of the cell‟s adaptation to fast proliferation. In chapter 3 we rigorously study
this hypothesis and show that applying an FBA variant accounting for both stoichiometry
and enzyme kinetics on the human metabolic model, predicts that the Warburg effect is a
direct outcome of the metabolic adjustment of cancer cells to facilitate the uptake and
incorporation of nutrients into biomass.
4
Contents
1 Introduction ............................................................................................... 5
1.1 Modeling Cellular Metabolism ................................................................................ 5 1.2 Constraint-based Modeling ...................................................................................... 6 1.3 Modeling Cellular Growh ...................................................................................... 11 1.4 Modeling Human and Cancer Metabolism ............................................................ 12
2 Flux Balance Analysis Accounting for Metabolite Dilution ................ 16
2.1 Introduction ............................................................................................................ 16 2.2 Results .................................................................................................................... 22
2.2.1 MD-FBA: accounting for growth dilution of all intermediate metabolites .... 22 2.2.2 Applying MD-FBA to predict metabolic phenotypes in E. coli ..................... 23
2.3 Discussion .............................................................................................................. 29 2.4 Methods ................................................................................................................. 33
2.4.1 Metabolite dilution flux balance analysis ....................................................... 33
3 Understanding the Warburg Effect via Cellular Growth ................... 36
3.1 Introduction ............................................................................................................ 36
3.2 Results .................................................................................................................... 39 3.2.1 Studying the Vander Heiden et al. hypothesis ............................................... 39 3.2.2 Modeling biomass production in a stoichiometric Model .............................. 42
3.2.3 A stoichiometric-kinetic model predicts the Warburg effect ......................... 42 3.2.4 Explaining the shift in metabolic strategy ...................................................... 47
3.3 Discussion .............................................................................................................. 49 3.4 Methods ................................................................................................................. 51
4 Summary .................................................................................................. 56
5 Bibliography ............................................................................................. 58
6 Supplementary Material ......................................................................... 64
6.1 MD-FBA ................................................................................................................ 64 6.2 Warburg ................................................................................................................. 65
6.2.1 Robustness analysis of stoichiometric-kinetic model ..................................... 65 6.2.2 Accounting for glutamine as a carbon source ................................................ 67
6.2.3 Accounting for maintenance ATP production ................................................ 68 6.2.4 Supp. Datasets ................................................................................................ 71
5
1 Introduction
1.1 Modeling Cellular Metabolism
Cellular metabolism is the set of biochemical reactions needed by biological cells to
maintain life. These processes allow the cells to maintain their proper function, grow and
respond to changes in the environment. Metabolism is often altered in disease, leading to an
increased recognition of metabolic analysis in drug discovery and in understanding their
mechanisms and modes-of-action (Töpel, Hofestädt et al. 2006). Furthermore, metabolic
processes involve the production of industrially important nutrients, resulting in a growing
interest of metabolic biotechnological engineering applications (Durot, Bourguignon et al.
2009). In general, the extreme complexity of cellular metabolism, involving thousands of
cross-talking reactions, poses challenges for the field of metabolic modeling, requiring a
system-level approach (Price, Reed et al. 2004).
A metabolic network is defined as the set of biochemical reactions and the metabolites
involved. Most of the reactions require the presence of enzymes, which are proteins that are
used as the cellular reaction catalytic agents, while other reactions may take place
spontaneously. Traditional modeling techniques predict changes in the network‟s
metabolite concentrations as a function of time, relying on enzyme kinetic information (Fell
1996; Domach 2000). These models are defined as a set of differential equations that aim at
computing metabolite concentration time derivatives, depending on reactions rate
equations. A major limitation in kinetic modeling lies in the fact that the reaction rate
6
equations rely on many parameters, including enzyme kinetic constants which are unknown
for most of the reactions in the metabolic network. Therefore, to date, kinetic models are
usually applied to relative small-scale systems only, although recent efforts have been made
to reconstruct genome-scale kinetic models (Smallbone, Simeonidis et al. 2010). This
limitation has lead to the shift of efforts from kinetic modeling to an approached termed
constraint-based modeling.
1.2 Constraint-based Modeling
Cells operate under constraints that govern their behavior and limit their range of possible
functions (Price et al. 2004). Constraint-based modeling (CBM) imposes the set of
governing constraints on the space of possible metabolic behaviors and allows filtering out
behaviors that are not biologically feasible in a large-scale manner. With the availability of
annotated genome sequences, it has become possible to reconstruct genome-scale
biochemical reaction networks for various organisms, and apply the constraint-based
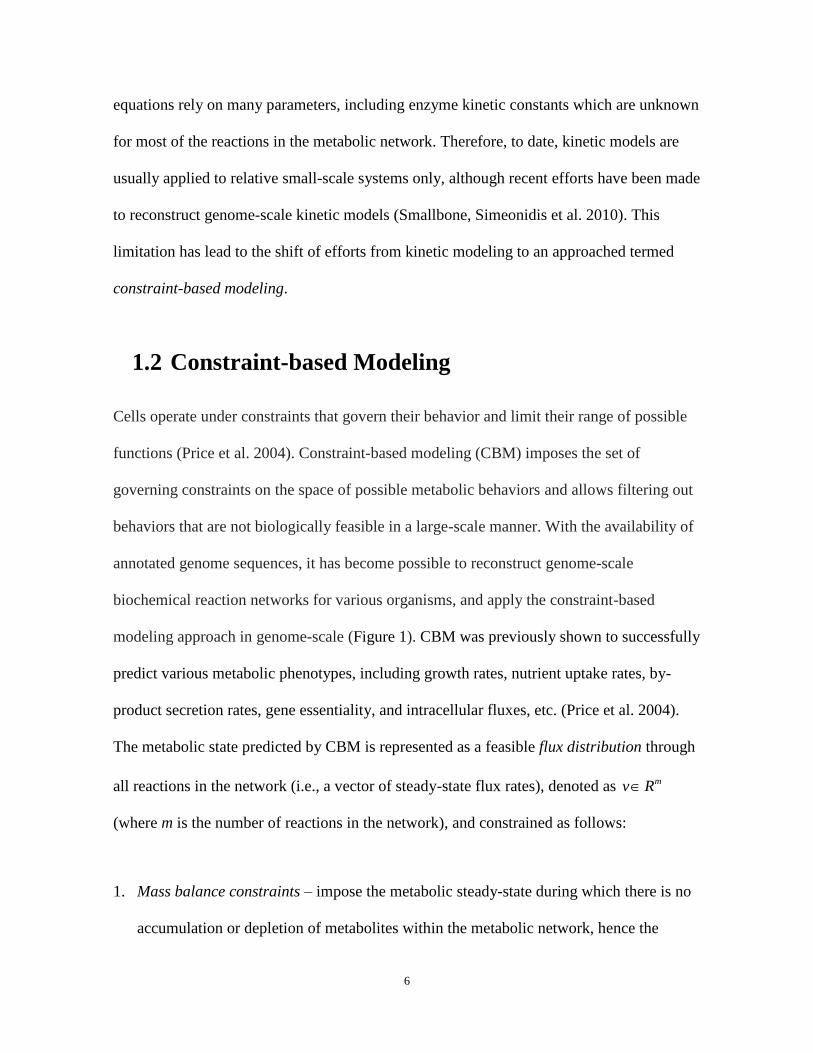
modeling approach in genome-scale (Figure 1). CBM was previously shown to successfully
predict various metabolic phenotypes, including growth rates, nutrient uptake rates, by-
product secretion rates, gene essentiality, and intracellular fluxes, etc. (Price et al. 2004).
The metabolic state predicted by CBM is represented as a feasible flux distribution through
all reactions in the network (i.e., a vector of steady-state flux rates), denoted as mv R
(where m is the number of reactions in the network), and constrained as follows:
1. Mass balance constraints – impose the metabolic steady-state during which there is no
accumulation or depletion of metabolites within the metabolic network, hence the
7
production rate of each metabolite should be equal to its consumption rate. This is
mathematically formulated by a stoichiometric matrix (denoted by n mS R ; n is the
number of metabolites; See Figure 1), which represents both the topology of the
metabolic network and the stoichiometry of the biochemical reactions (proportions of
substances involved in the reactions). Each row in this matrix represents a metabolite
and each column a reaction where ijS represents the stoichiometric coefficient of
metabolite i in reaction j. The mass balance constraint is therefore enforced by the
equation: 0S v .
2. Thermodynamic constraints – limit the directionality of many biochemical reactions
based on thermodynamic considerations, leading to non-negative fluxes for these
reactions (i.e. 0iv for each reaction i for which thermodynamic information is
available).
3. Nutrient availability constraints – allow the definition of different growth media by
imposing constraints on the maximal allowed uptake rates of the relevant nutrients.
These 3 constraint types define a feasible convex and linear flux distribution solution space,
which can be explored in two main ways:
1. Solution space characterization methods. One method allows the identifying the
solution space‟s extreme pathways, one can characterize the edges of a convex space
(Papin, Price et al. 2003). Any point inside the solution space can be represented as a
non-negative linear combination of extreme pathways. Alternatively, every flux
8
distribution can be characterized as a collection of elementary modes, which are
minimal sets of enzymes that can operate at steady state (Schuster, Fell et al. 2000).
Being convex and linear, the solution space can be explored by solving a linear
programming (LP) problem. Flux variability analysis (FVA) is used to determine the
feasible range of each reaction independently within the solution space by formulating
an LP problem to minimize or maximize the flux through the reaction of interest
(Mahadevan and Schilling 2003).
2. Optimization methods – are popular when an objective function can be defined on the
LP problem, therefore allow a solution space reduction to the optimal solution space
only. The most popular optimization method is Flux Balance Analysis (FBA; see
review by (Orth, Thiele et al. 2010)) which maximizes the biomass production rate in
microorganisms, and was shown to achieve highly accurate predictions (Feist and
Palsson 2008). Notably though, FBA does not account for the dilution of metabolites
during exponential cellular growth, leading us to develop „Metabolite Dilution FBA‟
(MD-FBA), an FBA variant aiming to allow only solutions that take care of the growth
associated demand for metabolite dilution (see chapter 2).
In addition to LP, other optimization methods such as Quadratic Programming (QP)
(Segre, Vitkup et al. 2002) and Mixed Integer Linear Programming (MILP) (Burgard
and Maranas 2003a; Burgard, Pharkya et al. 2003b) were previously used for CBM
analysis. Specifically, MILP was used to predict gene knockout sets that lead to
metabolite over-production (Burgard et al. 2003b) and to predict metabolic adaptation
following gene knockouts (Shlomi, Berkman et al. 2005) as well as to allow the
9
integration of gene expression data into metabolic models (Shlomi, Cabili et al. 2008).
In particular, MILP was used in order to formulate the MD-FBA problem, as described
in chapter 2.
The reconstruction of Genome-scale CBM models has developed rapidly over the past
decade, and today such models have already been constructed for more than 50 organisms
(Figure 1; (Oberhardt, Palsson et al. 2009)), including common model microorganisms
(Feist, Henry et al. 2007; Mo, Palsson et al. 2009), industrially relevant microbes
(Mahadevan, Bond et al. 2006; Durot, Le Fevre et al. 2008; Izallalen, Mahadevan et al.
2008; Ryan and Eleftherios 2008), various pathogens (Schilling, Covert et al. 2002; Becker
and Palsson 2005; Jamshidi and Palsson 2007; Kjeld Raunkjזr and Jens 2009), and recently
for human cellular metabolism (Duarte, Becker et al. 2007; Ma, Sorokin et al. 2007). The
construction of process is based on various biological data sources, including genomic,
biochemical, and physiological data. It involves a series of iterations in which the model is
used to derive experimentally testable hypotheses which are then used to improve it
(Oberhardt et al. 2009). In this thesis, the CBM model of the bacteria Escherichia coli
(Feist et al. 2007) as well as the human genome-scale metabolic model (Duarte et al. 2007)
were used in Chapters 2 and 3, respectively.
10
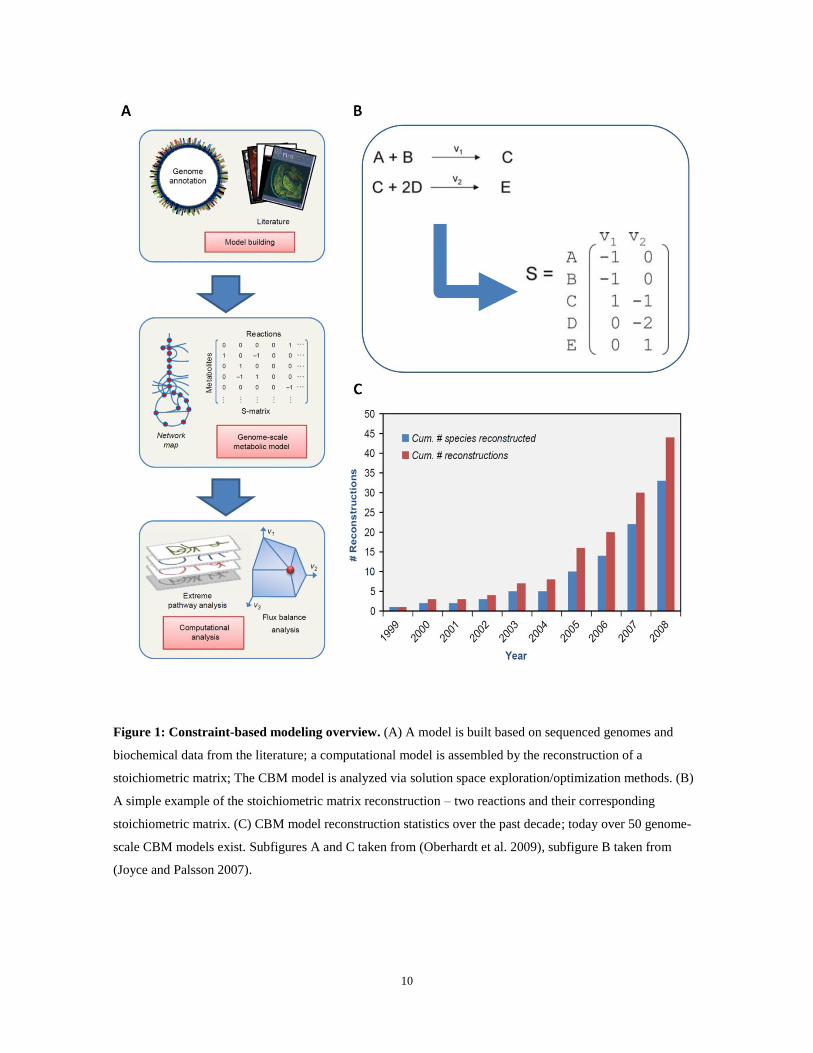
Figure 1: Constraint-based modeling overview. (A) A model is built based on sequenced genomes and
biochemical data from the literature; a computational model is assembled by the reconstruction of a
stoichiometric matrix; The CBM model is analyzed via solution space exploration/optimization methods. (B)
A simple example of the stoichiometric matrix reconstruction – two reactions and their corresponding
stoichiometric matrix. (C) CBM model reconstruction statistics over the past decade; today over 50 genome-
scale CBM models exist. Subfigures A and C taken from (Oberhardt et al. 2009), subfigure B taken from
(Joyce and Palsson 2007).
11
1.3 Modeling Cellular Growh
Rapid cell division is usually considered as an estimate of the fitness of unicellular
organisms (Ibarra, Edwards et al. 2002). Aiming to follow this principle, FBA maximizes
the production of the organism‟s biomass as a measure of its growth rate. This is done by
adding to the CBM model a pseudo reaction, called the biomass reaction, and maximizing
its flux subject to the aforementioned CBM constraints. The biomass reaction accounts for
the dry weight concentrations of few dozen essential biomass precursors like amino-acids,
nucleotides, lipids, cofactors and inorganic ions (Feist and Palsson 2010). Indeed, FBA has
been shown to successfully predict metabolic phenotypes, but, as mentioned before, its
biomass reaction accounts for the demand of metabolites for biomass production but not for
the metabolite dilution occurring during cellular growth. Therefore, FBA may predict
biologically infeasible solutions that include, for instance, the activation of catalytic cycles
(where cofactors are being used and recycled) without the de-novo synthesis the involved
cofactors. As elucidated in chapter 2, we have developed a method accounting for this
dilution, and demonstrated the performance improvement it entails FBA.
Despite the fact that cellular growth metabolic modeling is very widely used for
microorganisms, cellular growth occurring in multi-cellular organisms has been quite
neglected in this field, as indeed, it is far more complex: the multi-cellular organism
contains many different tissues and cell types, which all lie in different differentiation
levels, leading to different growth abilities. Furthermore, as multi-cellular organisms are
made of hundreds of billions of cells (1013
in the human body; (Savage 1977)) all
coordinated for the benefit of the entire organism, it is not clear that growth rate
12
maximization would be the ultimate objective of each individual cell. Nevertheless, some
cell types can be considered as „aiming to grow‟: undifferentiated embryonic cells (where
growth is controlled), and cancer cells (where growth is uncontrolled) (Vander Heiden,
Cantley et al. 2009). Subsection 1.4 describes how to model human metabolism in general
(in cases where a growth objective cannot be accounted for – i.e. for differentiated tissues)
and human cellular growth (in cancer/fast proliferating tissues).
1.4 Modeling Human and Cancer Metabolism
Interest into human and cancer metabolism has been rapidly increasing in the past few
years, climaxing in Science‟s declaration of cancer metabolism as one of the “areas to
watch” for 2010 (Watch 2009). This can be explained due to (i) the emergence of metabolic
diseases such as diabetes and obesity as major sources of morbidity and mortality (Lanpher,
Brunetti-Pierri et al. 2006; Muoio and Newgard 2006) with metabolic enzymes and their
regulators increasingly emerging as viable drug targets (Shi and Burn 2004); (ii) the
growing need to expand the search for new anti-cancer drugs and for novel drug targets
which also gave rise to the revival of the hypotheses claiming that metabolic modifications
play major role in carcinogenesis and malignancy (Vander Heiden et al. 2009).
Two first genome-scale human metabolic models were published in 2007 (Duarte et al.
2007; Ma et al. 2007). The potential clinical utility of the model was previously
demonstrated by its ability to identify functionally related sets of reactions that are causally
related to hemolytic anemia, and potential drug targets for treating hypercholesterolemia
(Duarte et al. 2007). In a recent study, the utility of this generic human metabolic model
13
was further demonstrated in predicting metabolic biomarkers whose concentration is altered
due to genomic mutations in in-born errors of metabolism (Shlomi, Cabili et al. 2009).
Addressing the challenge of utilizing a generic human model to predict tissue specific
metabolism, a computational method for integrating a generic model with tissue specific
gene and protein expression data was presented (Shlomi et al. 2008). This study
successfully predicted a variety of metabolic behaviors of different human tissues,
including the brain, liver, kidney and more. The predicted metabolic behavior characterizes,
for each tissue, a single, normal physiological condition under which the expression data
(used as input) was measured. In another progression, a novel algorithm for the rapid
reconstruction of tissue specific genome-scale models of human metabolism was presented,
starting from the generic human model and generating a reduced tissue-specific model by
integrating a variety of tissue-specific molecular data sources, including literature-based
knowledge, transcriptomic, proteomic, metabolomic and phenotypic data (Jerby, Shlomi et
al. 2010). Applying this algorithm, the first genome-scale stoichiometric model of hepatic
metabolism was constructed. The method allows the reconstruction of models that can later
be used to explore the metabolic state of a tissue under various genetic and physiological
conditions via standard CBM methods, without requiring additional context-specific
molecular data.
Recently, as part of the general growing interest in studying metabolic alterations in cancer
and their potential role as novel targets for therapy, the first genome-scale network model
of cancer metabolism was developed by our lab, using the method described in (Folger,
Jerby et al. 2010) via gene expression data from the NCI-60 cancer cell line collection (Lee,
14
Havaleshko et al. 2007). Folger et al. were able to run FBA optimization methods on the
model in order to simulate cellular growth (as cancer cells aim to grow). They validated the
model by correctly identifying genes essential for cellular proliferation in cancer cell-lines,
and further showed that the model was able to predict novel and known anticancer drug
targets whose inhibition selectively affects cancer cells.
Indeed, the model by Folger et al. is a major breakthrough in the field of modeling cancer
metabolism and predicting novel anti-cancer drug targets. Nevertheless, basic questions
regarding cancer development cannot be answered and explained using this model since it
was built in the purpose of simulating a fully developed cancer cell. One such riddle
regards a long-lasting enigma in cancer metabolism termed the Warburg effect, occurring
in most cancer and fast proliferating cells. These cells metabolize glucose by aerobic
glycolysis even in the presence of sufficient oxygen to support mitochondrial respiration,
showing an increased glycolysis with lactate production and decreased oxidative
phosphorylation. Despite the fact that this observation was originally reported in 1924
(Warburg, Posener et al. 1924), the mechanism by which cancer cells establish this altered
metabolic phenotype, and whether it is important for cancer, remains poorly understood.
Recently, a new hypothesis was raised by Vander Heiden et al., suggesting that the
metabolism of cancer cells, and indeed all proliferating cells, is adapted to facilitate the
uptake and incorporation of nutrients into the biomass (e.g., nucleotides, amino acids, and
lipids) needed to produce a new cell. They claim that in order to satisfy the requirements of
anabolic metabolism, nutrients generate the macromolecules carbon building blocks and the
biosynthesis reducing power in addition to the activation of ATP producing pathways,
leading to an altered metabolic phenotype. In chapter 3, we utilize the recent human

15
metabolic genome-scale reconstruction to rigorously study this hypothesis, and show that
the Warburg effect is a direct consequence of the cancer cell‟s adaptation to fast
proliferation while being constrained by known stoichiometry and kinetics of human
metabolic enzymes.
16
2 Flux Balance Analysis Accounting for
Metabolite Dilution
Based on “Flux balance analysis accounting for metabolite dilution”, Tomer Benyamini,
Ori Folger, Eytan Ruppin and Tomer Shlomi, Genome Biology, 2010 (Benyamini, Folger et
al.)
2.1 Introduction
Traditional metabolic modeling techniques are based on mathematical approaches that
require detailed and accurate information regarding reaction kinetics as well as enzyme and
metabolite concentrations. But, as previously discussed, the lack of sufficient data limits the
current applicability of such methods to small-scale systems. This hurdle is surpassed
through the use of flux balance analysis (FBA; (Fell 1996; Domach 2000)) in the
constraint-based modeling (CBM) framework, which is frequently used to successfully
predict various phenotypes of microorganisms, such as their growth rates, uptake rates, by-
product secretion, and knockout lethality (Feist et al. 2008).
Traditional kinetic models of cellular metabolism are formulated as a set of differential
equations that compute the time derivative of metabolite concentrations (denoted by x ) as
dependent on reaction rates (denoted by v ; which, in turn, depend on metabolic
concentration and kinetic constants, denoted by k ) and metabolite dilution due to cellular
17
growth (with denoting the growth rate) (Price et al. 2004; Feist, Herrgard et al. 2009;
Oberhardt et al. 2009):
xxkvSdt
xd ),(
Equation 1
where S is a nm stoichiometric matrix, m is the number of metabolites, n is the
number of reactions, and jiS represents the stoichiometric coefficient of metabolite i in
reaction j . A precise solution to Equation 1 requires determination of the kinetic parameters
k , which are generally unavailable, resulting in the development of the alternative CBM
approach. In CBM, an entire space of possible solutions for the flux distribution v is
postulated, considering that the metabolic system is constrained by physicochemical,
environmental and regulatory constraints. In FBA, this solution space is constrained by the
assumption of a quasi steady-state, under which stoichiometric mass-balance constraints
enforce constant concentrations of intermediate metabolites over time:
biomassrvS 0 Equation 2
The uptake and secretion of a pre-defined set of metabolites from and to the environment is
facilitated via the definition of exchange reactions in the stoichiometric matrix S (Visser,
Schmid et al. 2004). A pseudo growth reaction is defined to simulate the utilization of
metabolites during growth, consuming the most abundant biomass constituents based on
experimentally determined concentrations (that is, the j-th component in biomassr denotes the
steady-state concentration of metabolite j). The objective of FBA is to find a steady-state
18
flux distribution, v , satisfying Equation 2 alongside additional enzymatic directionality and
capacity constraints (Price et al. 2004), together permitting a maximal growth rate .
The employment of a pseudo growth reaction in FBA to represent the utilization of
metabolites as part of growth poses two fundamental problems. First, the metabolite
composition of cellular biomass significantly varies across different growth media, genetic
backgrounds and growth rates (Price et al. 2004). Indeed, previous work by Pramanik and
Keasling (Pramanik and Keasling 1997; Pramanik and Keasling 1998) has shown that using
the correct experimentally measured biomass composition of Escherichia coli under
different growth media and growth rates significantly improves FBA flux predictions.
However, as FBA is commonly applied to probe metabolic behavior under diverse genetic
and environmental conditions for which no metabolite concentration data are available, it
has become common practice to employ a constant biomass composition across all
conditions (Pramanik et al. 1997; Pramanik et al. 1998). Second, the growth reaction in
various CBM models commonly accounts for no more than a few dozen metabolites, for
which measured concentrations are available under a specific condition (Feist et al. 2008).
Ignoring the growth-associated dilution of the remaining metabolites (those not included in
the biomass composition in use; required by Equation 1) may result in the prediction of
biologically implausible flux distributions, leading to false predictions of gene essentiality
and growth rates, as shown in the Results. This problem has been recently addressed by
(Kruse and Ebenhöh 2008), who suggested a method that is based on network expansion to
compute the set of producible metabolites under a given growth medium. This method,
however, does not enable the prediction of feasible flux distributions that account for the
19
growth-associated dilution of all intermediate metabolites. Another approach, recently
suggested by (Martelli, De Martino et al. 2009), predicts metabolic fluxes based on Von
Neumann‟s model, which maximizes the growth rate in a metabolic network without
assuming mass-balance nor utilizing prior knowledge of a biomass composition. However,
similarly to FBA, flux distributions predicted by this method do not fully account for the
growth-associated dilution of all intermediate metabolites.
Here we describe a variant of FBA, metabolite dilution flux balance analysis (MD-FBA),
which aims to predict metabolic flux distributions by accounting for the dilution of all
intermediate metabolites that are synthesized under a given condition. As shown below,
accounting for growth dilution of intermediate metabolites is especially important for
metabolites that participate in catalytic cycles, many of them being metabolic co-factors.
Since CBM assumes a steady-state flux distribution and does not predict the actual
concentration of the intermediate metabolites, we consider a uniform minimal dilution rate
for all intermediate metabolites produced via a non-zero flux through some reaction
(assuming a uniform concentration for all intermediate metabolites, following (Covert,
Knight et al. 2004)).
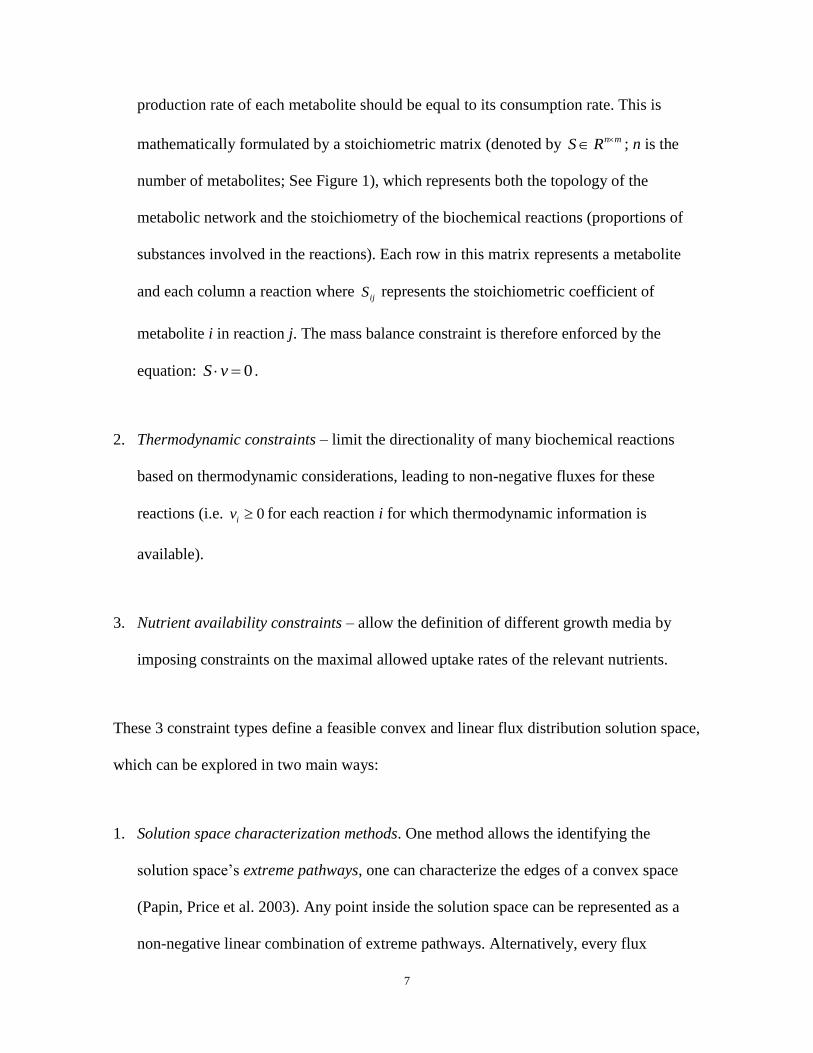
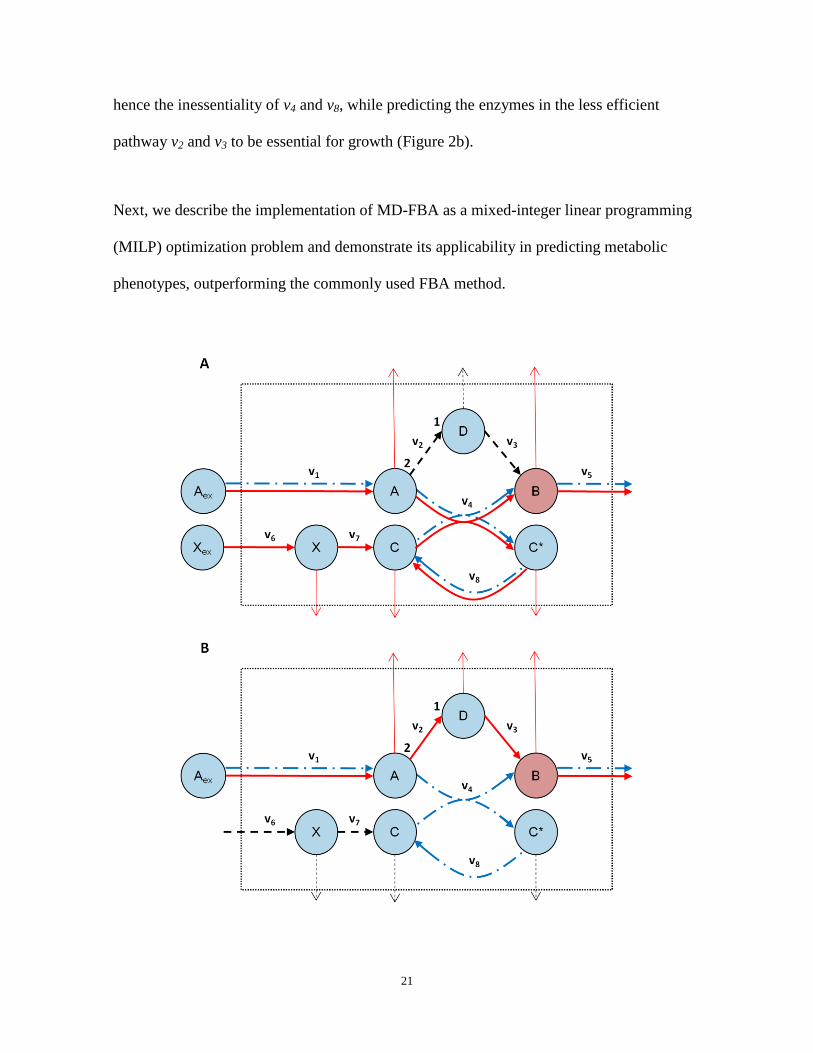
Figure 2 demonstrates an example network for which FBA and MD-FBA predict different
flux distributions, leading to different growth rate and gene essentiality predictions. The
biomass in this network is metabolite B, while the input metabolites available in the growth
medium are A and X in Figure 2a, and only A in Figure 2b. The synthesis of the biomass
precursor B is facilitated via two alternative pathways: through an efficient pathway via v4,
producing one molecule of B per molecule of A; or through an inefficient pathway via
20
reactions v2 and v3, producing one molecule of B per two molecules of A. Reaction v4
requires the presence of a co-factor metabolite C, which is recycled via reaction v8 and
synthesized via reactions v6 and v7. Thus, in MD-FBA, the activation of the efficient
pathway for synthesizing B via v4 enforces de novo synthesis of co-factor C via v6 and v7 to
balance the dilution of this co-factor (Figure 2a, red solid arrows). By contrast, since FBA
does not account for metabolite dilution, it would predict a biologically implausible flux
distribution in which the steady-state concentration of the co-factor C is maintained via
reaction v8, without predicting the growth-associated demand for de novo synthesis of this
co-factor (Figure 2a,b, blue dot-dash arrows). The different flux distributions predicted by
FBA and by MD-FBA under the two growth media yield different growth rate and enzyme
essentiality predictions. FBA predicts the activation of the efficient biosynthetic pathway
for synthesizing metabolite B under both growth media, resulting in the same growth rate
prediction under the two media. MD-FBA, on the other hand, predicts the activation of the
efficient biosynthetic pathway when metabolite X is present in the growth medium (with a
growth rate prediction similar to that of FBA; Figure 2a) and the activation of the
inefficient pathway when metabolite X is absent (resulting in a lower growth rate; Figure
2b). When metabolite X is present in the growth medium, MD-FBA, unlike FBA, predicts
that the biosynthetic pathway for the production of co-factor C is activated, with the
reactions v6 and v7 being essential for achieving maximal growth rate (Figure 2a). When X
is absent from the growth medium, FBA predicts the activity of the efficient pathway
through v4 and v8, with the corresponding enzymes essential for obtaining a maximal
growth rate. MD-FBA, however, predicts the inactivation of this efficient pathway and
21
hence the inessentiality of v4 and v8, while predicting the enzymes in the less efficient
pathway v2 and v3 to be essential for growth (Figure 2b).
Next, we describe the implementation of MD-FBA as a mixed-integer linear programming
(MILP) optimization problem and demonstrate its applicability in predicting metabolic
phenotypes, outperforming the commonly used FBA method.
22
Figure 2: An example network featuring the difference in predicted flux distributions between FBA
and MD-FBA. Thick arrows represent metabolic reactions and circular nodes represent metabolites. Narrow
arrows represent the growth-associated dilution of their attached metabolites. Note that the stoichiometric
coefficients for reaction v2 are two molecules of A per one molecule of D. v1 and v6 represent the uptake for
metabolites A and X, respectively. B is the sole metabolite within the biomass, and hence the flux through v5
represents the growth rate. Blue (dash-dot) and red (solid) arrows represent reactions predicted to be active by
MD-FBA and FBA, respectively, while black (dashed) arrows represent all other reactions. The figure
illustrates growth on two media: (A) growth on a medium in which both A and X are present; (B) growth on a
medium including only metabolite A. FBA predicts the same growth rate, which is equal to v1 under both
media, while MD-FBA predicts a growth rate equal to v1 when both A and X are present in the medium and a
growth rate equal to 0.5v1 when only A is included in the medium. The latter is due to the fact that when X is
absent from the growth medium, MD-FBA cannot activate reactions v4 and v8, since the dilution of
metabolites C and C* cannot be satisfied under this medium. The different flux distributions predicted by the
two methods lead to different predictions of enzyme essentiality, as detailed in the main text.
2.2 Results
2.2.1 MD-FBA: accounting for growth dilution of all intermediate metabolites
Our method, MD-FBA, aims to predict a feasible flux distribution through a metabolic
network under a given environmental and genetic condition, by maximizing the production
rate of the biomass (that is, the flux through the biomass reaction) while satisfying a
stoichiometric mass-balance constraint, accounting for the growth-associated dilution of all
produced intermediate metabolites, and satisfying enzymatic directionality and capacity
constraints embedded in the model (similarly to FBA). MD-FBA is formulated as a MILP
problem as defined in the Methods (section 2.4).
23
2.2.2 Applying MD-FBA to predict metabolic phenotypes in E. coli
As a benchmark for the prediction performance of MD-FBA, we applied it to the genome-
scale metabolic network model of E. coli (accounting for 1,260 metabolic genes, 2,382
reactions and 1,668 metabolites; (Feist et al. 2007)) to predict growth rates and gene
essentiality under a diverse set of growth media and gene knockouts.
As an initial validation, we applied both MD-FBA and FBA to predict E. coli‟s growth rate
for 91 gene knockout strains under 125 different media, yielding a total of 11,375 growth
conditions for which measured optical density (OD) data are available via a phenotypic
array in the ASAP database (Glasner 2003). Each medium included a fixed set of
metabolites (oxygen, phosphate, water, sulfate, carbon dioxide, hydrogen and metal ions)
and alternating carbon and nitrogen sources (the full list of growth conditions (media and
gene knockouts) as well as the experimental OD values are available in Supp. 1 and Supp.
2, respectively). Different gene knockouts were modeled by forcing a zero flux through the
corresponding enzyme-catalyzed reactions; different growth media were modeled by
changing the bounds on metabolite uptake from the environment based on specification of
the available metabolic nutrients in each medium (Covert et al. 2004). Both FBA and MD-
FBA predicted no growth for the wild-type strain under 13 growth media and hence these
media were removed from further analysis. In an additional 16 growth media the
correlation between the growth rates predicted by FBA and MD-FBA across all knockout
strains was significantly high (Spearman r >0.7) and hence these media were also removed
from further comparison of the two methods (the results presented below are insensitive to
specific choice of a Spearman correlation threshold). For each deletion strain, a Spearman
24
correlation was calculated between the predicted growth rates and the measured OD values
across the remaining 96 different growth media. For 10 of the 91 gene deletion strains, both
FBA and MD-FBA falsely predicted zero growth across all media and these strains were
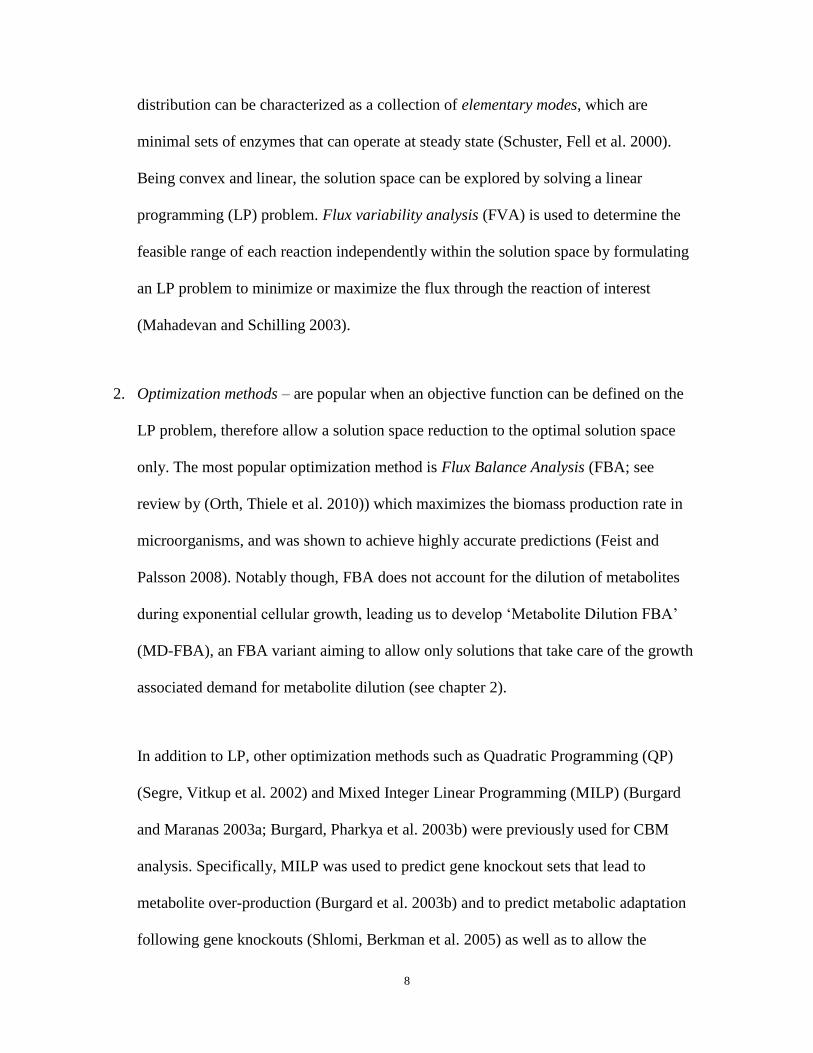
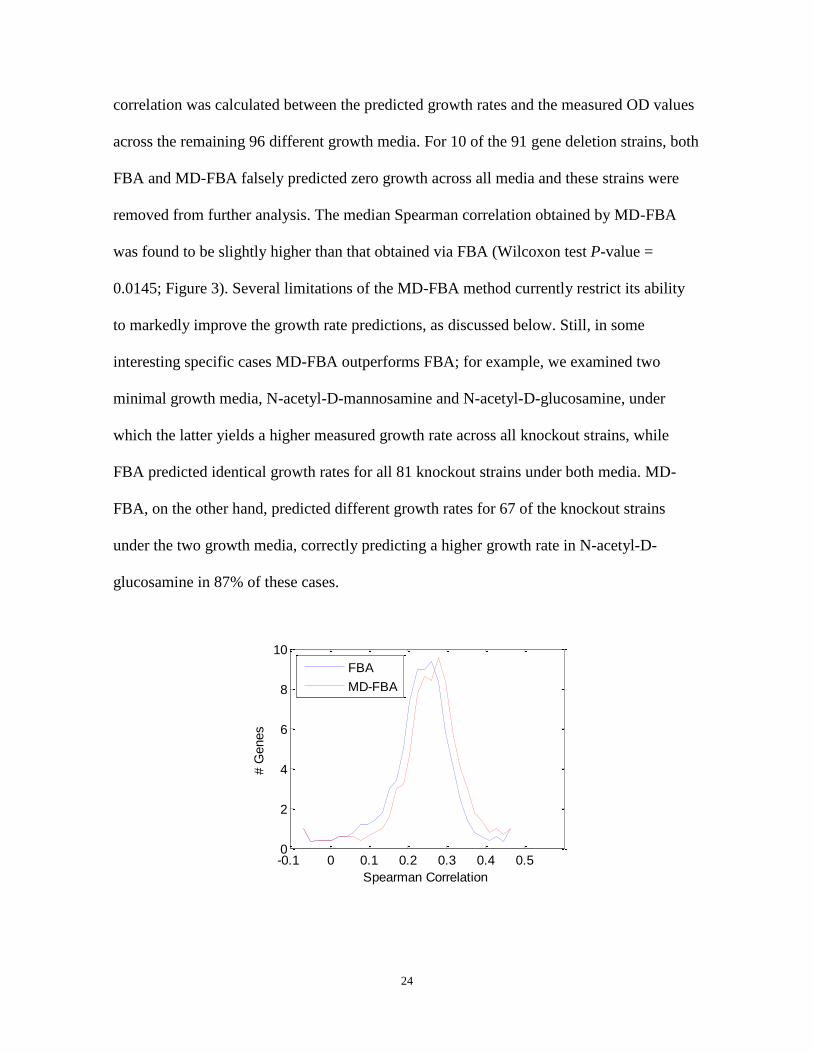
removed from further analysis. The median Spearman correlation obtained by MD-FBA
was found to be slightly higher than that obtained via FBA (Wilcoxon test P-value =
0.0145; Figure 3). Several limitations of the MD-FBA method currently restrict its ability
to markedly improve the growth rate predictions, as discussed below. Still, in some
interesting specific cases MD-FBA outperforms FBA; for example, we examined two
minimal growth media, N-acetyl-D-mannosamine and N-acetyl-D-glucosamine, under
which the latter yields a higher measured growth rate across all knockout strains, while
FBA predicted identical growth rates for all 81 knockout strains under both media. MD-
FBA, on the other hand, predicted different growth rates for 67 of the knockout strains
under the two growth media, correctly predicting a higher growth rate in N-acetyl-D-
glucosamine in 87% of these cases.
-0.1 0 0.1 0.2 0.3 0.4 0.50
2
4
6
8
10
Spearman Correlation
# G
enes
FBA
MD-FBA
25
Figure 3: Histograms of Spearman correlation values between measured and predicted growth rates.
The histograms show the accuracy of FBA (blue, dash-dot line) and MD-FBA growth rate predictions (red,
solid line) for 81 gene deletion strains across 96 growth media. The median Spearman correlation for MD-
FBA is significantly higher than that of FBA (Wilcoxon test P-value = 0.0145).
Extending the gene essentiality analysis under these media for other genes, not included in
the ASAP dataset, revealed several additional scenarios in which MD-FBA and FBA
predictions significantly differ. We found that, generally, MD-FBA predicts the activation
of reactions involved in co-factor biosynthesis that are not activated by FBA (the
distribution of reactions whose predicted activity pattern differ between MD-FBA and FBA
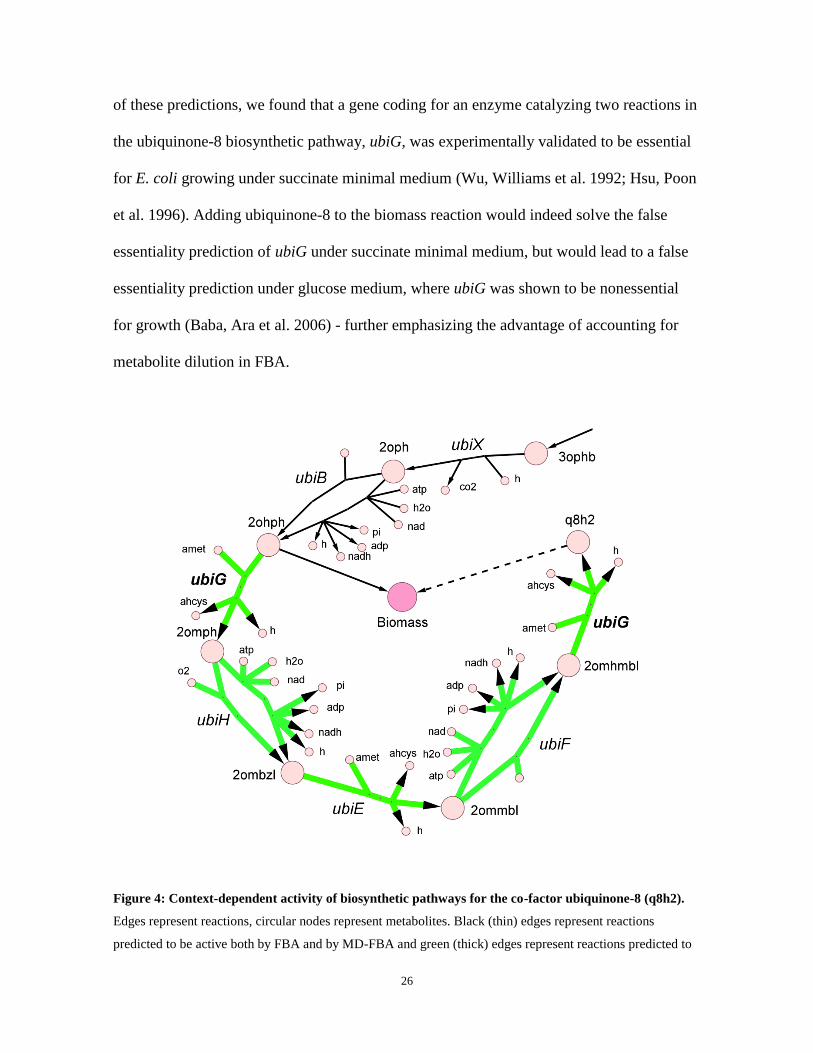
across various metabolic subsystems is shown in Supp. 3). For example, under succinate
minimal medium, MD-FBA predicts that genes in the ubiquinone-8 biosynthetic pathway
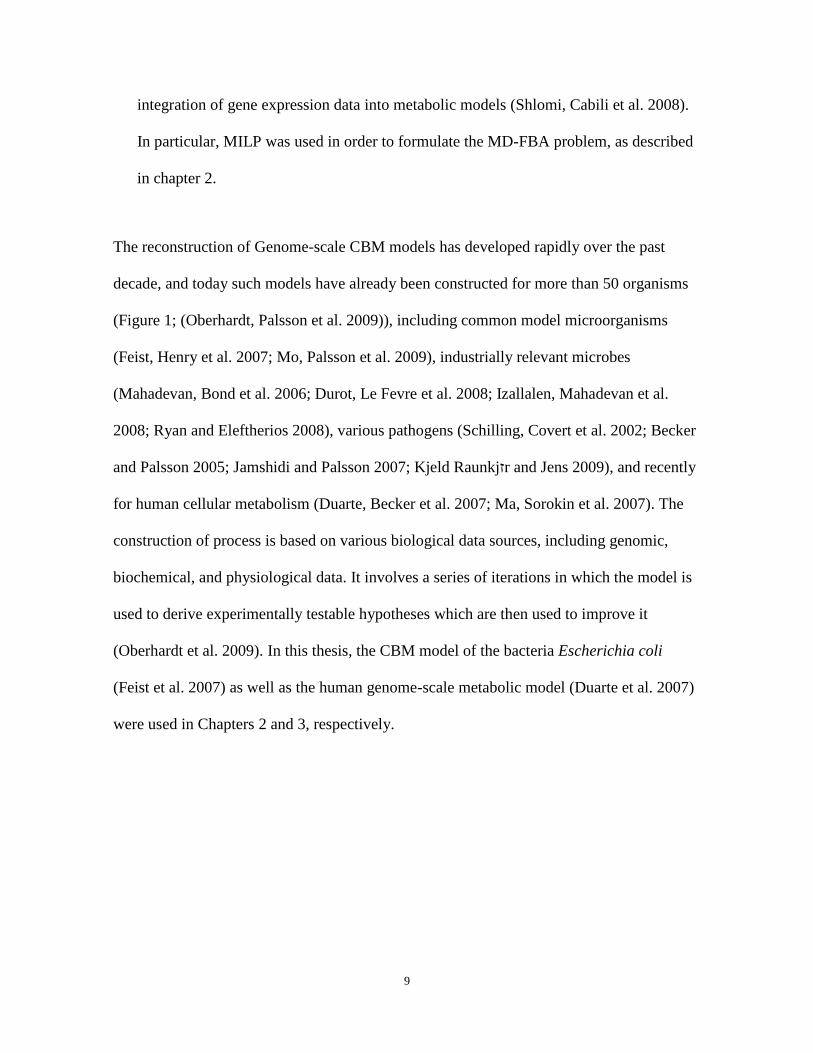
are essential for growth, whereas FBA predicts these genes to be nonessential (Figure 4).
Specifically, both methods predict that the first part of this pathway, leading to the
production of the biomass metabolite 2-octaprenyl-6-hydroxyphenol (black solid edges), is
essential under succinate minimal medium, while only MD-FBA predicts that the
remaining part of the pathway, leading to ubiquinone-8, is activated. Ubiquinone-8 is an
important redox co-factor in E. coli‟s aerobic respiration, switching between a reduced
(q8h2) state and an oxidized (q8) state. While both FBA and MD-FBA predict the cycling
of ubiquinone-8 between the reduced and oxidized states under succinate minimal medium
(as part of aerobic respiration), only MD-FBA predicts the corresponding requirement for
de novo synthesis of this metabolite to accommodate for its growth-associated dilution.
Notably, this scenario is similar to that described in the toy model in Figure 2a, where q8
and q8h2 correspond to co-factor metabolites C and C*. As a testimony to the correctness
26
of these predictions, we found that a gene coding for an enzyme catalyzing two reactions in
the ubiquinone-8 biosynthetic pathway, ubiG, was experimentally validated to be essential
for E. coli growing under succinate minimal medium (Wu, Williams et al. 1992; Hsu, Poon
et al. 1996). Adding ubiquinone-8 to the biomass reaction would indeed solve the false
essentiality prediction of ubiG under succinate minimal medium, but would lead to a false
essentiality prediction under glucose medium, where ubiG was shown to be nonessential
for growth (Baba, Ara et al. 2006) - further emphasizing the advantage of accounting for
metabolite dilution in FBA.
Figure 4: Context-dependent activity of biosynthetic pathways for the co-factor ubiquinone-8 (q8h2).
Edges represent reactions, circular nodes represent metabolites. Black (thin) edges represent reactions
predicted to be active both by FBA and by MD-FBA and green (thick) edges represent reactions predicted to
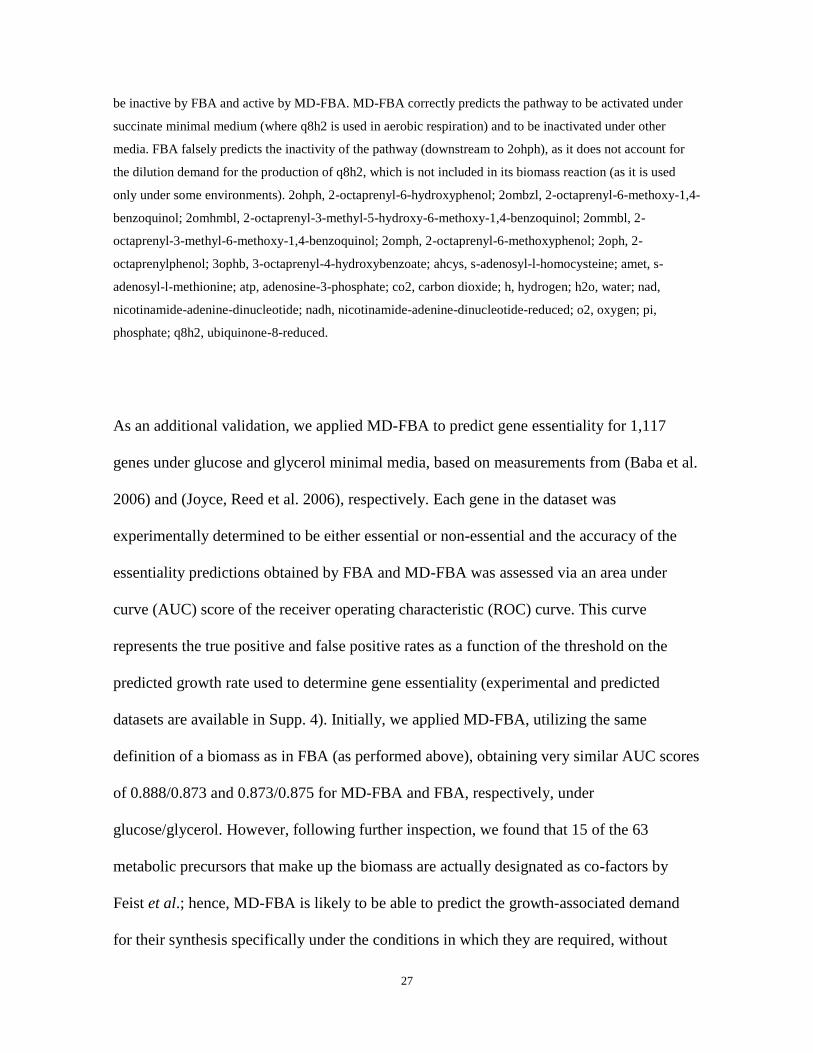
27
be inactive by FBA and active by MD-FBA. MD-FBA correctly predicts the pathway to be activated under
succinate minimal medium (where q8h2 is used in aerobic respiration) and to be inactivated under other
media. FBA falsely predicts the inactivity of the pathway (downstream to 2ohph), as it does not account for
the dilution demand for the production of q8h2, which is not included in its biomass reaction (as it is used
only under some environments). 2ohph, 2-octaprenyl-6-hydroxyphenol; 2ombzl, 2-octaprenyl-6-methoxy-1,4-
benzoquinol; 2omhmbl, 2-octaprenyl-3-methyl-5-hydroxy-6-methoxy-1,4-benzoquinol; 2ommbl, 2-
octaprenyl-3-methyl-6-methoxy-1,4-benzoquinol; 2omph, 2-octaprenyl-6-methoxyphenol; 2oph, 2-
octaprenylphenol; 3ophb, 3-octaprenyl-4-hydroxybenzoate; ahcys, s-adenosyl-l-homocysteine; amet, s-
adenosyl-l-methionine; atp, adenosine-3-phosphate; co2, carbon dioxide; h, hydrogen; h2o, water; nad,
nicotinamide-adenine-dinucleotide; nadh, nicotinamide-adenine-dinucleotide-reduced; o2, oxygen; pi,
phosphate; q8h2, ubiquinone-8-reduced.
As an additional validation, we applied MD-FBA to predict gene essentiality for 1,117
genes under glucose and glycerol minimal media, based on measurements from (Baba et al.
2006) and (Joyce, Reed et al. 2006), respectively. Each gene in the dataset was
experimentally determined to be either essential or non-essential and the accuracy of the
essentiality predictions obtained by FBA and MD-FBA was assessed via an area under
curve (AUC) score of the receiver operating characteristic (ROC) curve. This curve
represents the true positive and false positive rates as a function of the threshold on the
predicted growth rate used to determine gene essentiality (experimental and predicted
datasets are available in Supp. 4). Initially, we applied MD-FBA, utilizing the same
definition of a biomass as in FBA (as performed above), obtaining very similar AUC scores
of 0.888/0.873 and 0.873/0.875 for MD-FBA and FBA, respectively, under
glucose/glycerol. However, following further inspection, we found that 15 of the 63
metabolic precursors that make up the biomass are actually designated as co-factors by
Feist et al.; hence, MD-FBA is likely to be able to predict the growth-associated demand
for their synthesis specifically under the conditions in which they are required, without
28
accounting for them explicitly in the biomass definition. For example, in Figure 2, the
dilution of co-factor C is correctly predicted by MD-FBA in a context-dependent manner
only when metabolite X is present in the medium, as C is not fixed to be included in the
biomass. Falsely including metabolite C in the biomass, although it is required in only
some media, would lead to a false prediction of lethality when metabolite X is absent from
the growth medium. Given that such an inclusion of co-factors in the biomass may lead to
false gene essentiality predictions, their removal from the biomass is likely to improve
prediction performance. In order to remove these co-factors from the biomass, we
performed the following pre-processing step: in each growth condition examined, each co-
factor was in turn removed from the biomass and MD-FBA was then applied to test
whether a dilution is predicted for the co-factor under a subset of the gene knockout strains.
The analysis revealed three co-factors (10-formyltetrahydrofolate, 2-octaprenyl-6-
hydroxyphenol, flavin adenine dinucleotide oxidized (FAD)) whose dilution is dynamically
predicted by MD-FBA and they were subsequently removed from MD-FBA‟s biomass
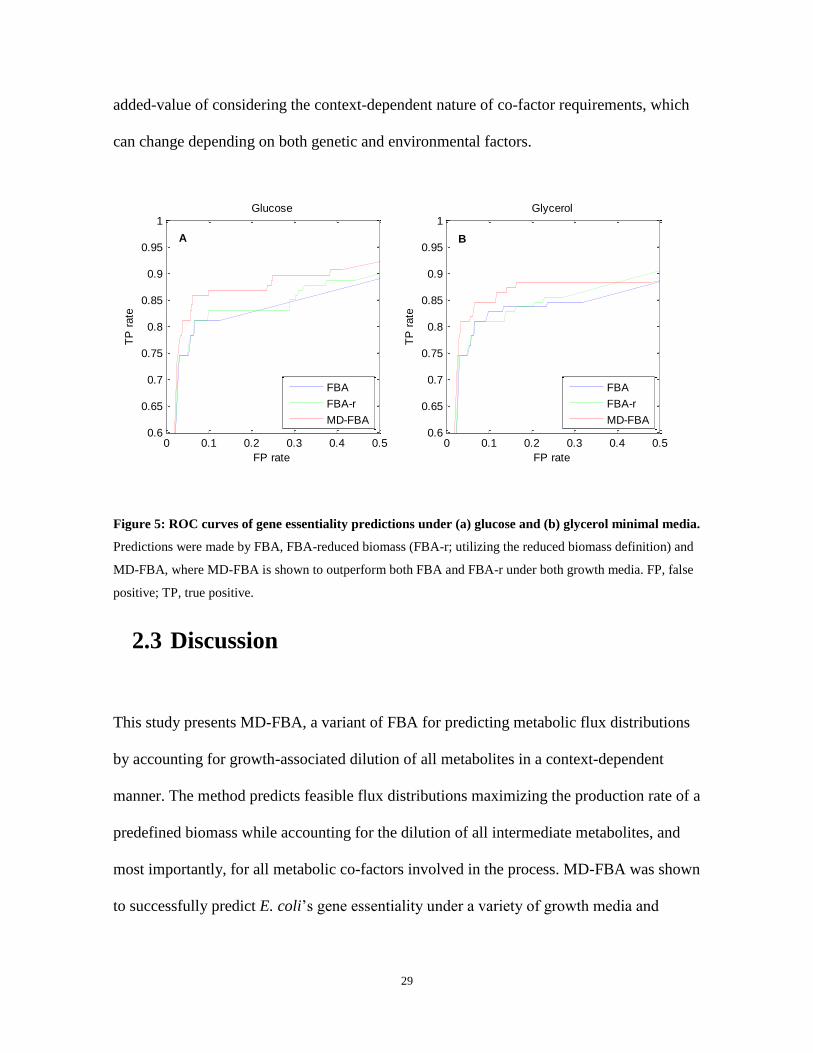
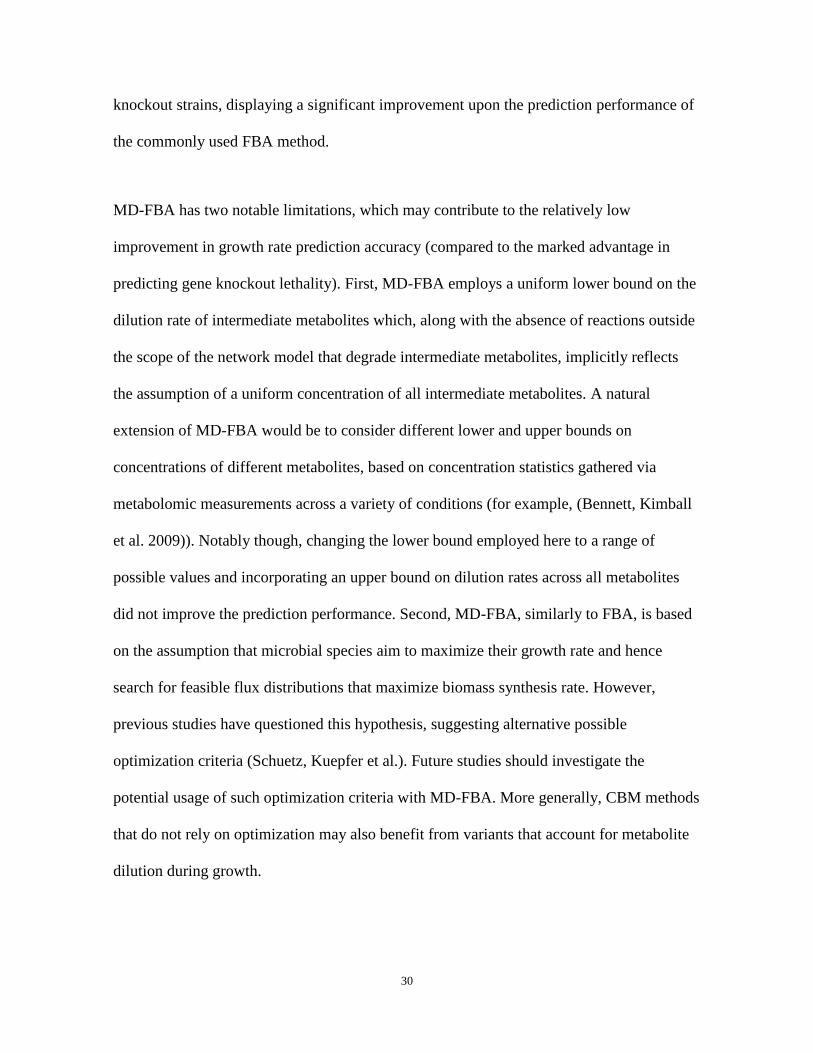
(dilution analysis results are available in Supp. 5). Repeating the gene essentiality analysis
with the reduced biomass considerably improved the prediction performance of MD-FBA
(Figure 5). Specifically, the AUC scores achieved by MD-FBA and FBA under glucose
medium are 0.910 and 0.873, respectively, and under glycerol medium are 0.893 and 0.875,
respectively. As further support for the assertion that the improved prediction performance
is not a mere consequence of removing unnecessary biomass precursors, we re-applied
FBA using the same reduced biomass (labeled FBA-r in Figure 5), which showed no
improvement over FBA‟s original performance. These results clearly demonstrate the
29
added-value of considering the context-dependent nature of co-factor requirements, which
can change depending on both genetic and environmental factors.
Figure 5: ROC curves of gene essentiality predictions under (a) glucose and (b) glycerol minimal media.
Predictions were made by FBA, FBA-reduced biomass (FBA-r; utilizing the reduced biomass definition) and
MD-FBA, where MD-FBA is shown to outperform both FBA and FBA-r under both growth media. FP, false
positive; TP, true positive.
2.3 Discussion
This study presents MD-FBA, a variant of FBA for predicting metabolic flux distributions
by accounting for growth-associated dilution of all metabolites in a context-dependent
manner. The method predicts feasible flux distributions maximizing the production rate of a
predefined biomass while accounting for the dilution of all intermediate metabolites, and
most importantly, for all metabolic co-factors involved in the process. MD-FBA was shown
to successfully predict E. coli‟s gene essentiality under a variety of growth media and
0 0.1 0.2 0.3 0.4 0.50.6
0.65
0.7
0.75
0.8
0.85
0.9
0.95
1Glucose
FP rate
TP
rate
0 0.1 0.2 0.3 0.4 0.50.6
0.65
0.7
0.75
0.8
0.85
0.9
0.95
1Glycerol
FP rate
TP
rate
FBA
FBA-r
MD-FBA
FBA
FBA-r
MD-FBA
A B
30
knockout strains, displaying a significant improvement upon the prediction performance of
the commonly used FBA method.
MD-FBA has two notable limitations, which may contribute to the relatively low
improvement in growth rate prediction accuracy (compared to the marked advantage in
predicting gene knockout lethality). First, MD-FBA employs a uniform lower bound on the
dilution rate of intermediate metabolites which, along with the absence of reactions outside
the scope of the network model that degrade intermediate metabolites, implicitly reflects
the assumption of a uniform concentration of all intermediate metabolites. A natural
extension of MD-FBA would be to consider different lower and upper bounds on
concentrations of different metabolites, based on concentration statistics gathered via
metabolomic measurements across a variety of conditions (for example, (Bennett, Kimball
et al. 2009)). Notably though, changing the lower bound employed here to a range of
possible values and incorporating an upper bound on dilution rates across all metabolites
did not improve the prediction performance. Second, MD-FBA, similarly to FBA, is based
on the assumption that microbial species aim to maximize their growth rate and hence
search for feasible flux distributions that maximize biomass synthesis rate. However,
previous studies have questioned this hypothesis, suggesting alternative possible
optimization criteria (Schuetz, Kuepfer et al.). Future studies should investigate the
potential usage of such optimization criteria with MD-FBA. More generally, CBM methods
that do not rely on optimization may also benefit from variants that account for metabolite
dilution during growth.
31
A marked disadvantage of MD-FBA is its dependence on MILP, which is computationally
more demanding than LP, utilized by FBA. To improve the run-time of MD-FBA, the
amount of integer variables in the MD-FBA formulation may be reduced by employing a
previous method to identify the metabolic „scope‟ of the medium nutrients. Specifically,
Handorf et al. (Handorf, Ebenhoh et al. 2005) investigated the capacity to produce
metabolites from available medium nutrients by applying FBA and a network expansion
algorithm, resulting in a production scope for each set of medium metabolites. A potential
improvement in run-time may be achieved by calculating the scope of the input growth
medium and assigning integer variables only for metabolites in that derived scope, as all the
other metabolites will never be able to satisfy their dilution demand. Speeding up the run-
time may be of importance when applying MD-FBA to larger networks, such as the
recently published human model (Duarte et al. 2007), or when probing the network under
multiple knockout configurations (Burgard et al. 2003a; Deutscher, Meilijson et al. 2006).
An interesting comparison can be made between MD-FBA and a method developed by
Price et al. (Price, Famili et al. 2002) for eliminating futile cycles via the identification of
type III extreme pathways (that is, a unique set of convex basis vectors of the flux
distribution solution space that do not include exchange reactions). While the extreme
pathways method enables the elimination of thermodynamically impossible loops, MD-
FBA removes infeasible solutions due to dilution demands. Notably, the latter method also
implicitly eliminates type III extreme pathways since these pathways do not satisfy dilution
demands of the participating metabolites. Additionally, MD-FBA eliminates solutions that
do not involve type III extreme pathways as demonstrated in Figure 2b: when metabolite X
is absent from the growth medium, the cycle involving reactions v4 and v8 cannot be
32
activated based on MD-FBA, since the dilution of co-factor C cannot be satisfied, although
this cycle is not part of a type III extreme pathway.
Another appealing application of MD-FBA could be the identification of missing reactions
in the model by comparing predicted phenotypes with measured ones, in line with previous
works using FBA for this purpose (Reed, Patel et al. 2006). For example, suppose that in
Figure 2a the biosynthetic pathway for metabolite C, through reactions v6 and v7, was not
included in the model. In this case, MD-FBA would predict metabolic flow through
reactions v2 and v3, such that the enzymes catalyzing these reactions are essential, contrary
to experimental essentiality data. Utilizing a method similar to that used by Reed et al.,
using MD-FBA can infer the missing reactions, v6 and v7. Employing FBA for this purpose
would not work since FBA predicts v2 and v3 to be non-essential, as the activity of reactions
v4 and v8 do not depend on the presence of reactions v6 and v7.
While this work applied MD-FBA to predict metabolic phenotypes in E. coli, for which a
comprehensive and accurate metabolic network model exists, the method can also be
applied to any one of a growing number of reconstructed network models (Feist et al.
2009). Importantly, the application of MD-FBA to other network models is straightforward
and requires no model-specific data curation. To facilitate simple usage of MD-FBA, we
provide an implementation of the method in the supplemental website
(http://www.cs.technion.ac.il/~tomersh/methods.html). A particularly interesting potential
application of MD-FBA would be for modeling malignant proliferating cells in human
cancer, potentially revealing the activity of biosynthetic pathways for various co-factors
required to balance their growth-associated dilution. The latter may utilize the recently
33
published model of human cellular metabolism (Duarte et al. 2007). Overall, we expect that
future use of MD-FBA will promote improved metabolic phenotypic predictions across a
variety of organisms, growth conditions and genetic alterations.
2.4 Methods
2.4.1 Metabolite dilution flux balance analysis
To formulate a mass-balance constraint while accounting for metabolite growth dilution,
we assume that each metabolite j that is produced by a certain reaction at a rate greater than
zero (referred to as an „active metabolite‟) has a non-zero concentration and should hence
be diluted with a rate greater than zero (denoted by jd ). To compute a feasible flux
distribution, v , and a corresponding vector of dilution rates, d , we employ the following
optimization problem:
dv,
max
s.t.
0 drvS biomass Equation 3
jdThenvSjactivemetaboliteIf )),,(_(
Equation 4
maxmin vvv Equation 5
0d
where a mass-balance constraint, accounting for the dilution of all active metabolites, is
formulated in Equation 3. Equation 4 assigns a positive dilution rate above a pre-defined
threshold (denoted by ) for active metabolites, produced in some non-zero rate in the flux
distribution v . In our application of the method for E. coli we set = 10-4
μmol/mg, which
34
represents a common concentration of intermediate metabolites (Feist et al. 2007). Notably,
the model‟s predictions were robust to different choices of values. Enzyme directionality
and capacity constraints are formulated in Equation 5 by imposing m inv and maxv as lower
and upper bounds on flux values.
The above optimization problem is solved by formulating it as a MILP problem, replacing
the Equation 4 constraint with the linear equations specified below: for each metabolite j in
the model, we define an integer variable jy that denotes whether the metabolite is active
(that is, being produced by some non-zero reaction in the model), via the following linear
constraints:
jiji Rivyv max, Equation 6
jiji Rivyv min, Equation 7
my }1,0{
where jR denotes the set of reactions in which metabolite j participates. Equation 6 is a
linear formulation of the statement ‘if iv then 1jy ’ and Equation 7 is the symmetric
for negative fluxes (that is, iv ). Given the y variables, Equation 4 can be formulated
via the following constraints:
yd Equation 8
which can be represented in linear form (since 1 ) as:
35
yd 1
A simplified formulation assuming a constant growth rate of 1 in Equation 8 (for
calculating the dilution rate of intermediate metabolites) gave qualitatively similar results to
the above linear formulation. The commercial solver CPLEX running on 64-bit Linux
machines was used for solving LP and MILP problems within a few dozens of seconds per
problem.
36
3 Understanding the Warburg Effect via
Cellular Growth
Based on “Metabolic modeling elucidates the role of proliferative adaptation in causing the
Warburg effect”, Tomer Shlomi*, Tomer Benyamini*, Eyal Gottlieb, Roded Sharan and
Eytan Ruppin, 2010, *Equal contribution (Shlomi, Benyamini et al. 2010)
3.1 Introduction
The Warburg effect, a phenomenon discovered by Otto Warburg in 1924, reflects a shift to
an inefficient metabolism in cancer cells, in which an increase in the inefficient production
of adenosine 5´-triphosphate (ATP) via glycolysis leads to the secretion of non-oxidized
carbons in the form of lactate, even in the presence of oxygen (termed aerobic glycolysis)
(Warburg et al. 1924; Warburg 1956a). Specifically, aerobic glycolysis allows the
production of only 4 ATP molecules per one glucose molecule, whereas oxidative
phosphorylation allows the generation of 36 ATP molecules per one molecule of glucose
(Vander Heiden et al. 2009). Over the years, several hypotheses were raised regarding the
potential cause of the Warburg effect (Vander Heiden et al. 2009): (i) Defective
mitochondrion hypothesis – suggesting that cancer cells have defective mitochondria and
hence rely on glycolysis (Warburg 1956b), however subsequent research revealed that
mitochondrial function is not impaired in most cancer cells (Funes, Quintero et al. 2007;
Mori, Chang et al. 2009). (ii) Hypoxia– suggesting that tumor hypoxia selects for cells
37
dependent on anaerobic metabolism (Gatenby and Gillies 2004), but previous studies have
shown that cancer cells already resort to aerobic glycolysis before exposure to hypoxic
conditions (Elstrom, Bauer et al. 2004; Gottschalk, Anderson et al. 2004). (iii) Avoiding
ROS-mediated DNA damage – it was suggested that reducing oxidative phosphorylation in
proliferating cells reduces ROS and hence protects cells from DNA damage and hence
apoptosis (Chiaradonna, Sacco et al. 2006).
More recently, a new hypothesis has been raised by Vander Heiden et al., suggesting that
metabolic adaptation to fast proliferation underlies the Warburg effect. Accordingly, it was
argued that as opposed to metabolism in differentiated cells that is geared towards efficient
ATP production, the aerobic glycolysis observed in cancer cells is adapted to facilitate
biomass accumulation and high proliferation. They claimed that in order to satisfy the
requirements of anabolic metabolism in addition to the production of ATP, nutrients must
be used to generate both the carbon building blocks of macromolecules and the reducing
power needed for biosynthesis (Vander Heiden et al. 2009). In support of their claim,
Vander Heiden et al. manually computed the metabolic requirements for producing one
essential biomass precursor, palmitate (a major constituent of cellular membranes)
considering the stoichiometry of a few central metabolic pathways. They found that aerobic
glycolysis enables maximal palmitate production yield due to specific reducing power
requirements. In another recent study, Vazquez et al. employed a schematic model of ATP
production in human cells (considering two lumped reactions representing aerobic
glycolysis and oxidative phosphorylation), elegantly showing that a switch to aerobic
glycolysis should result from cellular maximization of ATP production (Vazquez, Liu et al.
2010). Their schematic model accounts not only for the stoichiometry of glycolysis and
38
oxidative phosphyrylation but also for the kinetics and enzyme-volumetric costs of these
pathways (the latter bounded by the total cellular solvent capacity). A similar approach
was previously employed in the study of over-flow metabolism in E. coli (Vazquez, Beg et
al. 2008).
In this chapter, we study the causes of the Warburg effect by accounting for both energy
production and anabolism of essential biomass constituents, utilizing a genome-scale
stoichiometric network model (Duarte et al. 2007) as well as enzyme kinetics and solvent
capacity constraints. The usage of a large-scale metabolic network is essential if one aims
to account for the inter-connectivity of pathways that produce the various energy and
biomass precursors required for proliferation, rather than examining just single factors in
isolation, as has been previously performed. Towards this goal, we rely on a constraint-
based modeling (CBM) framework on the human model.
Here we utilize Flux Balance Analysis (FBA) that searches for a feasible metabolic state by
accounting for the biomass production rate, thus simulating the metabolic behavior of
proliferating cells. As a first step, following Vander Heiden et al., we analyze whether the
Warburg effect results from constraints imposed by the structure of the human metabolic
network and the stoichiometry of its reactions on cellular adaptation to high proliferation
rate. We demonstrate that stoichiometric considerations are insufficient for explaining the
Warburg effect on their own. Next, we extend our model by incorporating enzyme kinetics
and solvent capacity constraints, and show that our modeling approach successfully
predicts both the emergence of the Warburg effect, as well as an experimentally observed
metabolic trajectory that leads to it during oncogenic progression.
39
3.2 Results
3.2.1 Studying the Vander Heiden et al. hypothesis
We first follow Vander Heiden et al. and rigorously examine whether the structure of the
entire human metabolic network and the stoichiometry of its reactions directly lead to the
Warburg effect due to cellular proliferation, the latter represented by the demands for the
production of a single biomass constituent, palmitate. To recapitulate, Vander Heiden et al.
claimed that the high number of NADPH molecules required to synthesize palmitate
(compared to the very few ATP molecules required) would lead to a high uptake of glucose
(7 molecules of glucose per one molecule of palmitate), whose complete oxidation would
generate ATP in excess in the proliferating cell (Vander Heiden et al. 2009). Thus, as a
counteraction, the cells resort to enhanced glycolysis and lactate secretion (and manifest the
Warburg effect).
To reexamine this hypothesis while aiming to avoid potential biases due to the set of
analyzed reactions, we utilize a genome-scale human metabolic stoichiometric model that
accounts for 3,742 reactions (Duarte et al. 2007). In difference from Vander Heiden et al.
who manually inspected only several central pathways, we perform here a large scope
analysis of the human model. Maximizing the palmitate production yield using this model
reveals that all glucose carbon atoms can be either incorporated into palmitate or to be
completely oxidized to CO2 without any need to resort to lactate secretion: specifically, our
stoichiometric simulation shows that actually only 4.48 glucose molecules (26.88 carbons)
40
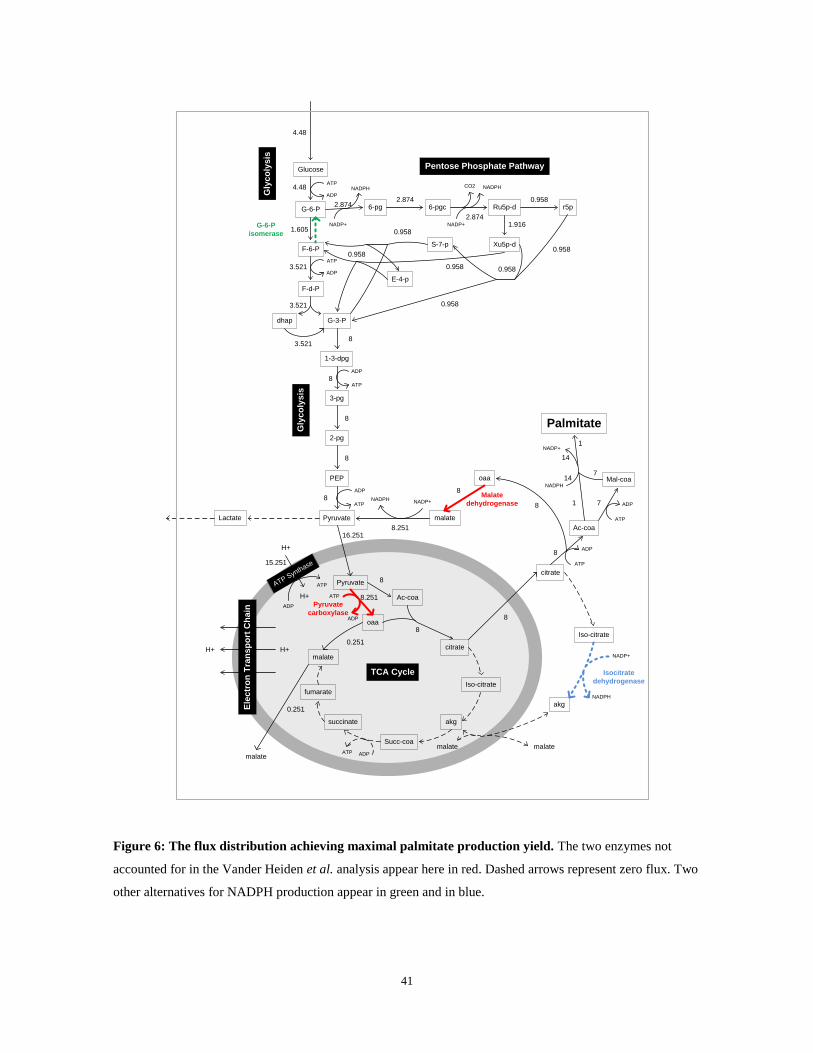
are needed for the production of 1 palmitate molecule (Figure 6), and that no lactate
production is required in the process. Analyzing the flux distribution in the model we find
that: (i) the palmitate carbon requirements are satisfied by 4 glucose molecules (24
carbons); (ii) the palmitate NADPH requirements (14 molecules) are satisfied by the malic
enzyme (which transforms cytosolic malate to pyruvate; 8.25 NADPH molecules) and by
the pentose phosphate pathway (5.75 NADPH molecules coupled with the secretion of 2.87
carbons via CO2). Notably, we found that Vander Heiden et al. did not account for two
additional important enzymes – cytosolic malate dehydrogenase and mitochondrial
pyruvate carboxylase (colored in red in Figure 6) which allow efficient NADPH production
via a cycle that utilizes the cytosolic malic enzyme. In addition, there are other efficient
NADPH production alternatives that were not accounted for by Vander Heiden et al.:(i)
through the pentose-phosphate pathway (using G-6-P isomerase in the backward direction;
colored in green in Figure 6) and (ii) using the cytosolic isocitrate dehydrogenase (colored
in blue in Figure 6), while recycling carbons via the malate-aspartate shuttle and the TCA
cycle. Both pathways allow high palmitate production yield without requiring lactate to be
secreted.
41
Glucose
G-6-P
F-6-P
F-d-P
G-3-Pdhap
1-3-dpg
3-pg
2-pg
PEP
PyruvateLactate
Pyruvate
ATP
ADP
ATP
ADP
ADP
ATP
ADP
ATP
6-pg 6-pgc
NADP+
NADPH
Ru5p-d
NADP+
NADPH
r5p
Xu5p-dS-7-p
E-4-p
CO2
Ac-coa
oaa
citrate
Iso-citrate
akg
Succ-coa
succinate
fumarate
malate
citrate
ATP
ADP
Ac-coa
Iso-citrate
Mal-coa
Palmitate
ATP
ADP
7
NADPH
NADP+
14
14
akg
malate
malate malate
oaa
ATP
ADP
Malate
dehydrogenase
ADPATP
Ele
ctr
on
Tra
ns
po
rt C
ha
in
H+H+
ATP Synthase
H+
H+
ADP
ATP
TCA Cycle
Pentose Phosphate Pathway
Gly
co
lys
is
Gly
co
lys
is
NADP+NADPH
NADP+
NADPH
4.48
4.48
2.8742.874
2.874
0.958
1.916
0.958
0.9580.958
0.958
0.958
0.958
1.605
3.521
3.521
3.5218
8
8
8
8
16.251
8
8.251
8
0.251
8
8
malate
0.251
8
8.251
8
1 7
1
Pyruvate
carboxylase
G-6-P
isomerase
Isocitrate
dehydrogenase
15.251
Figure 6: The flux distribution achieving maximal palmitate production yield. The two enzymes not
accounted for in the Vander Heiden et al. analysis appear here in red. Dashed arrows represent zero flux. Two
other alternatives for NADPH production appear in green and in blue.
42
3.2.2 Modeling biomass production in a stoichiometric Model
Next, going beyond palmitate production we extended the stoichiometric analysis to predict
flux rates that maximize the production yield of a pre-defined comprehensive set of
essential biomass precursors required for cellular proliferation (as conventionally done in
FBA). The biomass precursors include amino-acids, nucleotides, deoxy-nucleotides, ATP,
lipids, etc (based on prior knowledge of their relative concentrations; see Methods (section
3.4)). Using the genome scale human metabolic model while maximizing biomass
production rate we again find that under strictly stoichiometric constraints no lactate
production is observed. This suggests that stoichiometric considerations alone are
insufficient for explaining the Warburg effect and its relation to the metabolic requirements
of highly proliferating cells.
3.2.3 A stoichiometric-kinetic model predicts the Warburg effect
A strictly stoichiometric analysis, such as the one presented above (and also in (Vander
Heiden et al. 2009)), implicitly assumes that metabolic flux rates can be tuned to achieve
high biomass production yields, without considering constraints imposed by enzyme
concentrations and catalytic rates, which are the prime determinants of metabolic flux.
Specifically, while cancer cells might be free to regulate enzyme concentrations according
to metabolic demands (Vander Heiden et al. 2009), the total enzyme concentration in the
proliferating cells is bounded by the cell‟s solvent capacity, quantifying the maximum
amount of macromolecules that can occupy the intracellular space (Vazquez et al. 2008;
Vazquez et al. 2010). To account for the functional effects of this additional fundamental
43
constraint, we follow (Vazquez et al. 2010) and extend our stoichiometric genome-scale
CBM analysis to compute for each enzyme the concentration required to facilitate the
predicted flux, utilizing data on known human enzyme catalytic rates (taken from the
literature; see Methods (section 3.4)). This approach enables the prediction of metabolic
flux distributions that maximize growth rate (biomass production rate) and concomitantly
obey the kinetic constraints, while exploring possible variation in biomass production yield
under various growth rates.
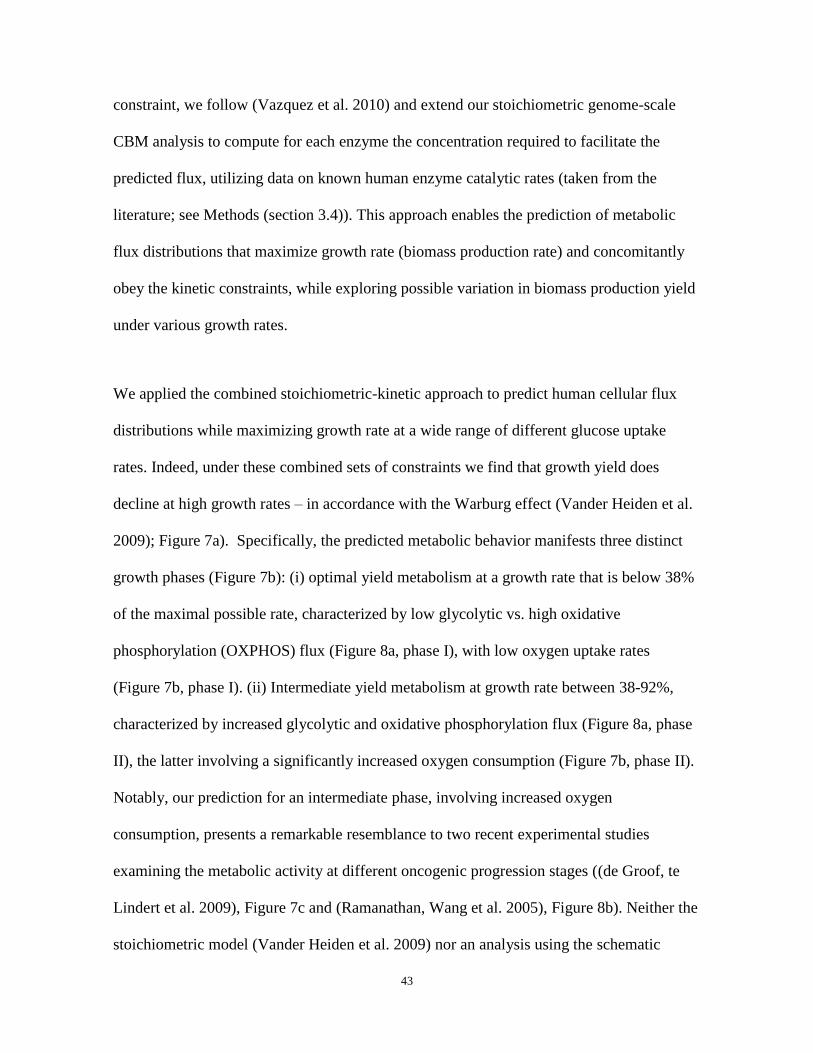
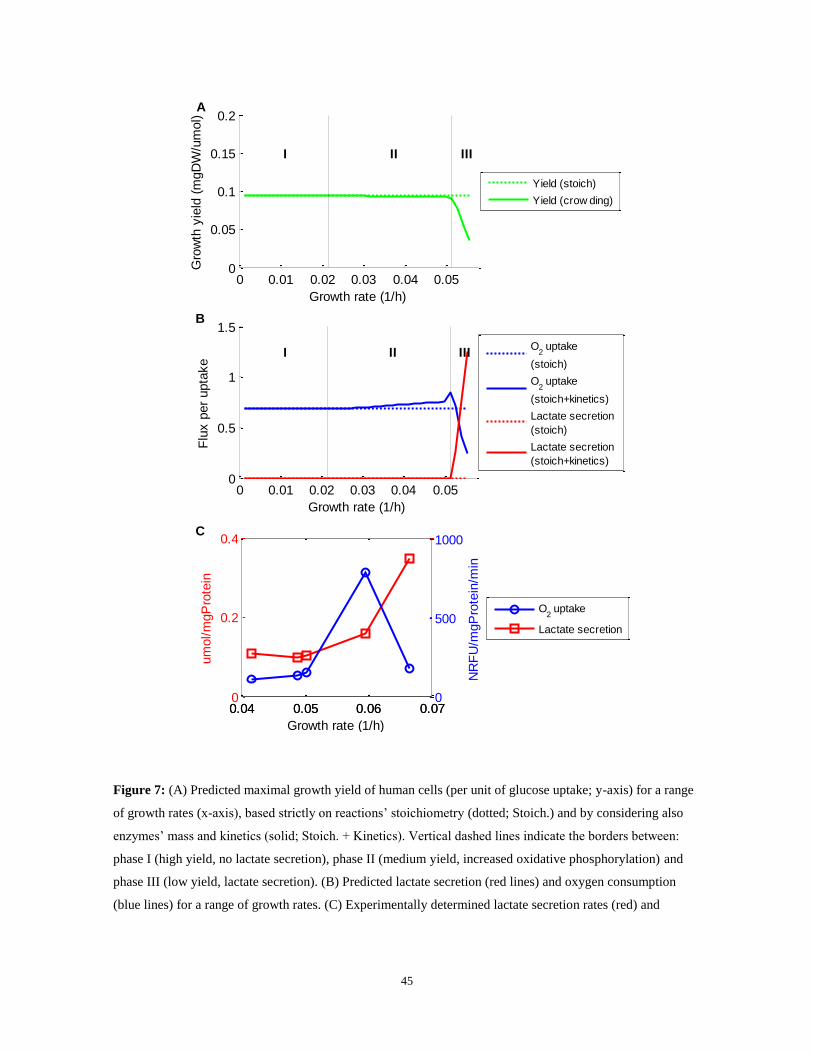
We applied the combined stoichiometric-kinetic approach to predict human cellular flux
distributions while maximizing growth rate at a wide range of different glucose uptake
rates. Indeed, under these combined sets of constraints we find that growth yield does
decline at high growth rates – in accordance with the Warburg effect (Vander Heiden et al.
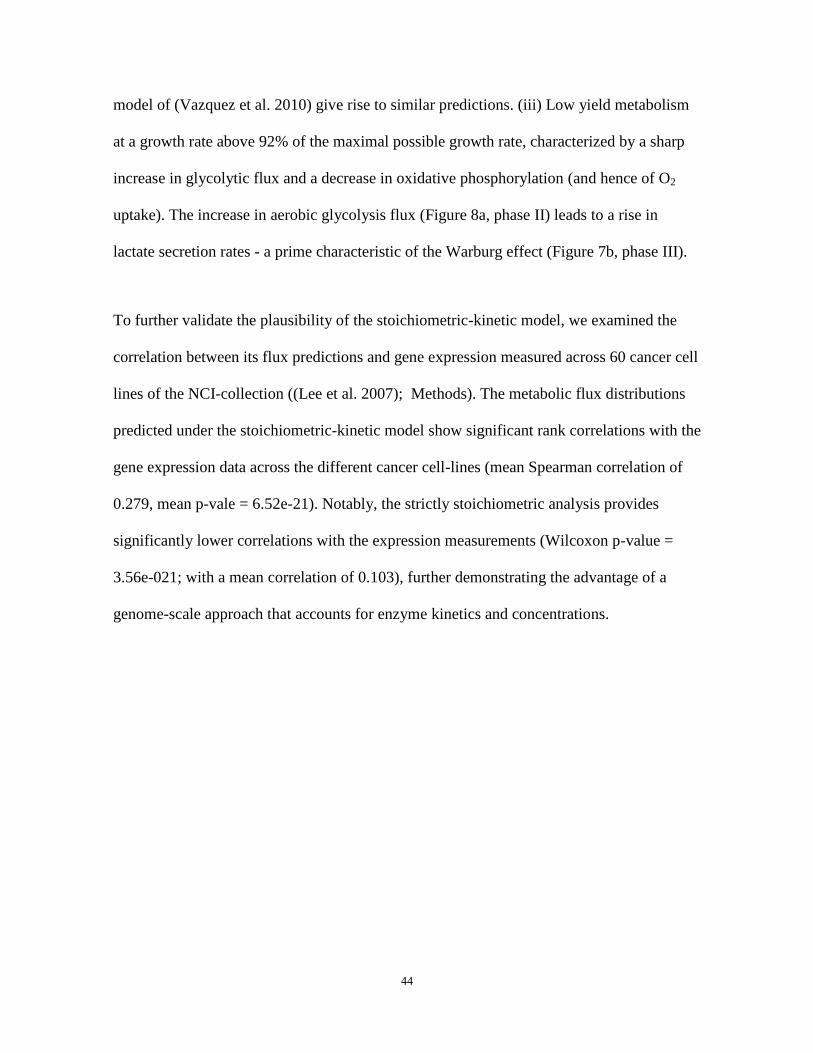
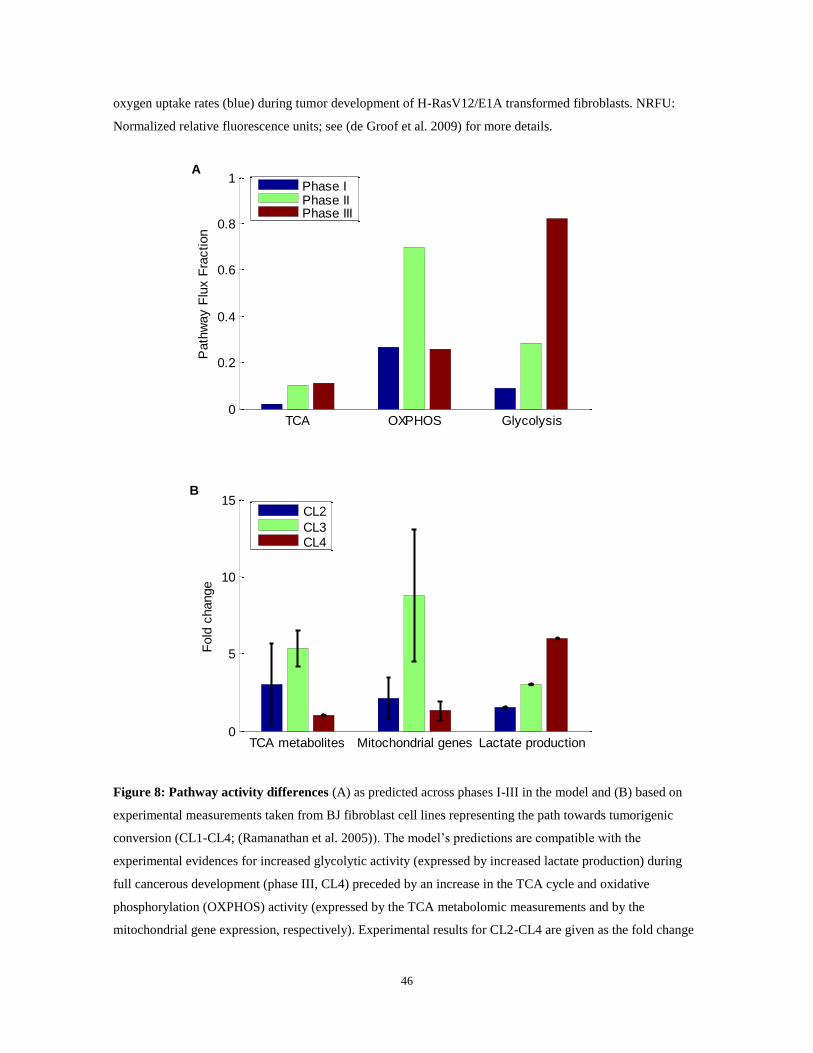
2009); Figure 7a). Specifically, the predicted metabolic behavior manifests three distinct
growth phases (Figure 7b): (i) optimal yield metabolism at a growth rate that is below 38%
of the maximal possible rate, characterized by low glycolytic vs. high oxidative
phosphorylation (OXPHOS) flux (Figure 8a, phase I), with low oxygen uptake rates
(Figure 7b, phase I). (ii) Intermediate yield metabolism at growth rate between 38-92%,
characterized by increased glycolytic and oxidative phosphorylation flux (Figure 8a, phase
II), the latter involving a significantly increased oxygen consumption (Figure 7b, phase II).
Notably, our prediction for an intermediate phase, involving increased oxygen
consumption, presents a remarkable resemblance to two recent experimental studies
examining the metabolic activity at different oncogenic progression stages ((de Groof, te
Lindert et al. 2009), Figure 7c and (Ramanathan, Wang et al. 2005), Figure 8b). Neither the
stoichiometric model (Vander Heiden et al. 2009) nor an analysis using the schematic
44
model of (Vazquez et al. 2010) give rise to similar predictions. (iii) Low yield metabolism
at a growth rate above 92% of the maximal possible growth rate, characterized by a sharp
increase in glycolytic flux and a decrease in oxidative phosphorylation (and hence of O2
uptake). The increase in aerobic glycolysis flux (Figure 8a, phase II) leads to a rise in
lactate secretion rates - a prime characteristic of the Warburg effect (Figure 7b, phase III).
To further validate the plausibility of the stoichiometric-kinetic model, we examined the
correlation between its flux predictions and gene expression measured across 60 cancer cell
lines of the NCI-collection ((Lee et al. 2007); Methods). The metabolic flux distributions
predicted under the stoichiometric-kinetic model show significant rank correlations with the
gene expression data across the different cancer cell-lines (mean Spearman correlation of
0.279, mean p-vale = 6.52e-21). Notably, the strictly stoichiometric analysis provides
significantly lower correlations with the expression measurements (Wilcoxon p-value =
3.56e-021; with a mean correlation of 0.103), further demonstrating the advantage of a
genome-scale approach that accounts for enzyme kinetics and concentrations.
45
Figure 7: (A) Predicted maximal growth yield of human cells (per unit of glucose uptake; y-axis) for a range
of growth rates (x-axis), based strictly on reactions‟ stoichiometry (dotted; Stoich.) and by considering also
enzymes‟ mass and kinetics (solid; Stoich. + Kinetics). Vertical dashed lines indicate the borders between:
phase I (high yield, no lactate secretion), phase II (medium yield, increased oxidative phosphorylation) and
phase III (low yield, lactate secretion). (B) Predicted lactate secretion (red lines) and oxygen consumption
(blue lines) for a range of growth rates. (C) Experimentally determined lactate secretion rates (red) and
0 0.01 0.02 0.03 0.04 0.050
0.05
0.1
0.15
0.2A
Growth rate (1/h)
Gro
wth
yie
ld (
mgD
W/u
mol)
I II III
Yield (stoich)
Yield (crow ding)
0 0.01 0.02 0.03 0.04 0.050
0.5
1
1.5B
Growth rate (1/h)
Flu
x p
er
upta
ke
I II IIIO
2 uptake
(stoich)
O2 uptake
(stoich+kinetics)
Lactate secretion
(stoich)
Lactate secretion
(stoich+kinetics)
0.04 0.05 0.06 0.070
0.2
0.4
um
ol/m
gP
rote
in
Growth rate (1/h)
C
0.04 0.05 0.06 0.070
500
1000
NR
FU
/mgP
rote
in/m
in
O2 uptake
Lactate secretion
46
oxygen uptake rates (blue) during tumor development of H-RasV12/E1A transformed fibroblasts. NRFU:
Normalized relative fluorescence units; see (de Groof et al. 2009) for more details.
Figure 8: Pathway activity differences (A) as predicted across phases I-III in the model and (B) based on
experimental measurements taken from BJ fibroblast cell lines representing the path towards tumorigenic
conversion (CL1-CL4; (Ramanathan et al. 2005)). The model‟s predictions are compatible with the
experimental evidences for increased glycolytic activity (expressed by increased lactate production) during
full cancerous development (phase III, CL4) preceded by an increase in the TCA cycle and oxidative
phosphorylation (OXPHOS) activity (expressed by the TCA metabolomic measurements and by the
mitochondrial gene expression, respectively). Experimental results for CL2-CL4 are given as the fold change
TCA OXPHOS Glycolysis0
0.2
0.4
0.6
0.8
1
Path
way F
lux F
raction
A
TCA metabolites Mitochondrial genes Lactate production0
5
10
15
Fold
change
B
CL2
CL3CL4
Phase IPhase IIPhase III
47
relative to the same measurement in the CL1 cell line. In (B), the bars represent the mean fold change for each
set of metabolites/genes and the error bars represent the standard deviation.
3.2.4 Explaining the shift in metabolic strategy
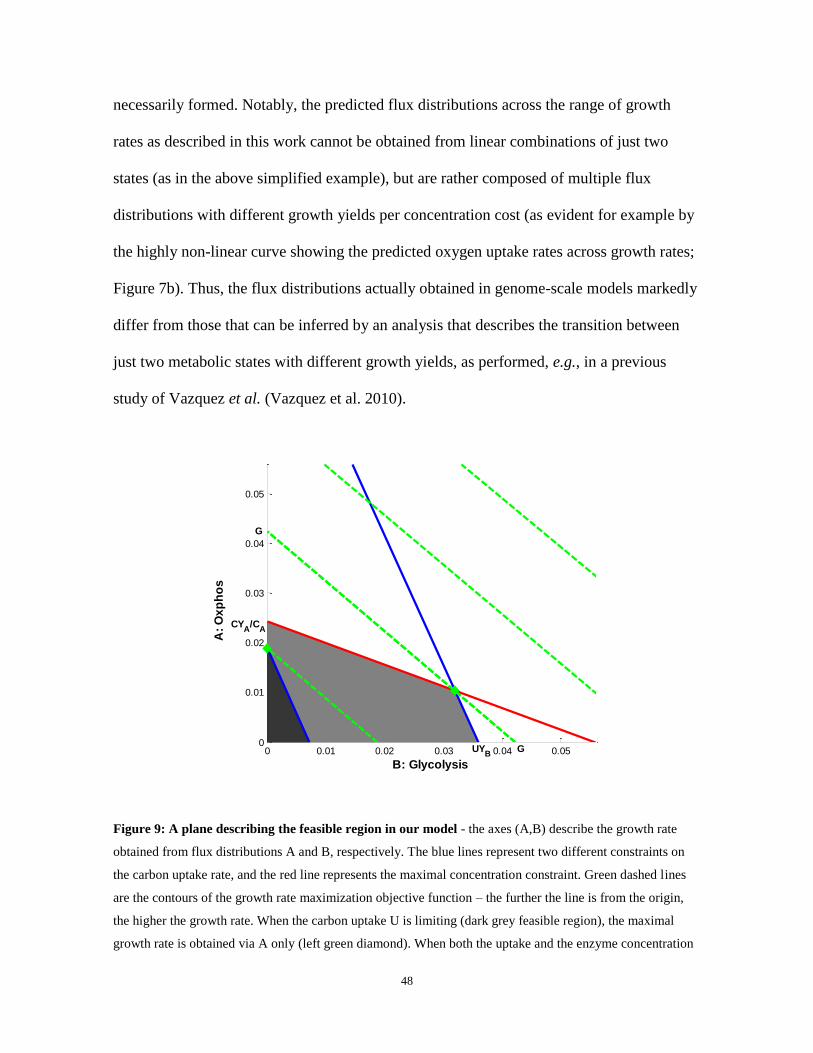
The shift towards low growth yield metabolic states at high growth rates can be intuitively
explained considering a flux distribution (denoted A) with a high growth yield (YA) and a
high „cost‟ in terms of the required enzyme concentration (CA), and a flux distribution
(denoted B), with a lower growth yield (YB) and lower cost (CB) (both flux distributions
normalized per unit of carbon uptake). Considering a bound on the total concentration cost
entails that when the carbon uptake is unlimited, flux distribution B will provide higher
growth rate if its growth yield normalized by its cost is higher than that of flux distribution
A (i.e.
; Figure 9). When carbon uptake rate is limited, maximal growth rate is
achieved solely via flux distribution A or by a combination of A and B.
Concretely, analyzing the results of our model, flux distribution A stands for a metabolic
state at phase I and is characterized by high mitochondrial oxidative phosphorylation (with
a high growth yield of 0.094, and a high cost of 0.302). Flux distribution B stands for a
metabolic state at phase III and involves a high rate of aerobic glycolysis (with a low
growth yield of 0.035, and a low cost of 0.050), giving rise to a higher growth yield per unit
of concentration cost of the enzymes participating in B. Figure 9 shows that indeed at low
growth rates, carbon uptake rate is the sole limiting factor and hence the high yield
oxidative phosphorylation route is taken; in contrast, at higher growth rates, the enzyme
concentration constraint takes effect, and mixed solutions involving lactate secretion are
48
necessarily formed. Notably, the predicted flux distributions across the range of growth
rates as described in this work cannot be obtained from linear combinations of just two
states (as in the above simplified example), but are rather composed of multiple flux
distributions with different growth yields per concentration cost (as evident for example by
the highly non-linear curve showing the predicted oxygen uptake rates across growth rates;
Figure 7b). Thus, the flux distributions actually obtained in genome-scale models markedly
differ from those that can be inferred by an analysis that describes the transition between
just two metabolic states with different growth yields, as performed, e.g., in a previous
study of Vazquez et al. (Vazquez et al. 2010).
Figure 9: A plane describing the feasible region in our model - the axes (A,B) describe the growth rate
obtained from flux distributions A and B, respectively. The blue lines represent two different constraints on
the carbon uptake rate, and the red line represents the maximal concentration constraint. Green dashed lines
are the contours of the growth rate maximization objective function – the further the line is from the origin,
the higher the growth rate. When the carbon uptake U is limiting (dark grey feasible region), the maximal
growth rate is obtained via A only (left green diamond). When both the uptake and the enzyme concentration
0 0.01 0.02 0.03 0.04 0.050
0.01
0.02
0.03
0.04
0.05
B: Glycolysis
A:
Ox
ph
os
G
GUYB
CYA
/CA
49
constraints are limiting (light grey feasible region), maximal growth rate (G) is obtained via a combination of
A and B (right green diamond), resulting in a shift to a less efficient metabolism and lactate secretion. This
can be explained by the fact that the slope of the growth-rate (middle green) line (-1) is larger than the slope
of the enzyme concentration limit (red) line (
), that is the yield-to-cost ratio of flux distribution B is
greater than that of flux distribution A (YA/ CA< YB/ CB).
3.3 Discussion
Metabolic adaptation to elevated growth requirements during cancer development has been
recently suggested as the possible cause of the Warburg effect, a long-lasting enigma in
cancer metabolism. In this work we rigorously study this hypothesis using a genome-scale
human metabolic model and demonstrate that stoichiometric considerations solely are
insufficient to explain the shift to inefficient metabolism, in difference from recent claims
(Vander Heiden et al. 2009). However, integrating these constraints in a genome-scale
model of human metabolism together with an account of enzyme kinetics under a
concentration limit, does lead to the emergence of the Warburg effect at high proliferation
rates. Furthermore, it accurately predicts a three phase metabolic behavior experimentally
observed during oncogenic progression.
The importance of stoichiometric-kinetic considerations in modeling cancer metabolism
has already been recognized in the earlier work of Vazquez et al. (Vazquez et al. 2010).
However, their study was limited to a very small and schematic model of ATP production
in central metabolism including just a handful of variables. Their model hence does not
account for the whole scope of genome scale requirements involving explicit production of
biomass precursors and of growth-associated and maintenance energy (Locasale and
50
Cantley 2010), a prerequisite for accurately capturing the global cellular metabolic
response. Despite the scores of many alternative biomass and energy production pathways
existing in the human network, our model successfully shows that highly proliferating cells
such as cancer cells are forced to display the Warburg related phenotypes at high growth
rates (phase III) and has additionally correctly predicted an experimentally observed
transitional phase (II). Reassuringly, on a mechanistic level, the genome-scale metabolic
description provided by our stoichiometric-kinetic model was also shown to be
significantly associated with the gene expression patterns across the wide array of NCI-60
cancer cell-lines (much stronger than the association displayed by the stoichiometric model
alone). As a further demonstration of the robustness of our results, we repeated the analyses
using a model accounting for glutamine as a carbon source secondary to glucose (Section
6.2.2) and by accounting for maintenance ATP production (Section 6.2.3).
While the data on reactions‟ stoichiometry is both accurate and comprehensive, enzyme
kinetic constant data are noisy and are currently available for only about 17% of the
reactions in the model. In the analysis presented here, we addressed this problem by
assigning enzymes with missing turnover rates with the median rate computed over the set
of known turnover rates. Notably, the model‟s main findings are robust to random sampling
of turnover rates from a distribution of known rates, as shown in Supp. 6. Future
measurements of additional enzyme turnover rates and improved methods for accurately
predicting these parameters (e.g. (Borger, Liebermeister et al. 2006)) would probably lead
to further refinement of the predictions of cancerous metabolic phenotypes using
stoichiometric-kinetic models.
51
The combined stoichiometric-kinetic approach is likely to contribute for more accurate
metabolic modeling of highly proliferating human cells in general (as it was already shown
on a genome-scale for microorganisms (Vazquez et al. 2008)). Thus, going beyond
understanding the Warburg effect, its utilization can lead to better models of cancer
metabolism. Those may be in turn utilized for anti-cancer drug target prediction and
specifically, for predicting drugs that work to annihilate the Warburg effect. While the
current analysis has relied on the available human generic model, future studies may
employ stoichiometric-kinetic modeling in cancer-specific metabolic models. These may be
generated by integrating cancer-signature expression data with the generic human model to
carve out different cancer types models (using methods such as those outlined in (Shlomi et
al. 2008) or (Jerby et al. 2010)), and thus further advance the development of anticancer
drugs specific to different cancers.
3.4 Methods
Modeling palmitate production. The Duarte et al. (Duarte et al. 2007) human genome-
scale metabolic model, accounting for 1,496 ORFs, 3,742 reactions and 2,766 metabolites,
was used. A palmitate production reaction was added to the model and its flux was defined
as the objective function of the CBM method Flux Balance Analysis (FBA; (Varma and
Palsson 1994; Varma and Palsson 1994)). FBA looks for a flux distribution that
maximizes the objective function (Equation 9) subject to steady-state, thermodynamic and
growth medium constraints:
52
Equation 9
Equation 10
Equation 11
Equation 10 imposes the steady state constraints on the system, assuming that the
metabolite concentrations remain constant in time. The thermodynamic constraints
determining the reaction directionalities are accounted for via the flux limits and
in Equation 11. The uptake and secretion of a pre-defined set of metabolites from and to the
environment is facilitated via the definition of exchange reactions in the stoichiometric
matrix. The growth medium is defined via an upper bound on the uptake exchange
reactions, and included glucose as a carbon source, oxygen, phosphate, bicarbonate,
sodium, water, and potassium. The FBA problem defines an optimal convex and linear
solution space which was explored by performing Flux Variability Analysis (FVA)
(Mahadevan et al. 2003), allowing us to set minimal and maximal flux bounds on all of the
model‟s reactions, including the lactate secretion reaction. FVA revealed that for palmitate
to be produced at maximal yield (i.e. subject to maximal palmitate production rate and
minimal glucose uptake rate), lactate cannot be secreted (i.e. its flux range is constant at 0).
Modeling biomass production. Biomass production was modeled by adding a growth
reaction to the human model. This reaction was compiled using the steady state
concentrations of 30 biomass compounds including amino acids (0.78 g/gDW; (Barle,
Ahlman et al. 1996; Triguero, Barber et al. 1997)), nucleotides (0.06 g/gDW; (Sheikh,
53
Forster et al. 2005)), lipids (0.16 g/gDW; (Rabinowitz, Baker et al. 1992)) as well as the
growth-associated energy requirement (24 mmol/gDW of ATP; (Kilburn, Lilly et al.
1969)). Essential amino acids were not accounted for since they were assumed not to take
active part in the metabolic model besides flowing directly into the biomass reaction. The
full list of biomass metabolites and their relative concentrations is available in Supp..
Maximal biomass production rate (i.e. the growth rate) was obtained via FBA simulating an
aerobic growth medium including glucose as a carbon source, as well as sodium,
potassium, calcium, iron, chlorine, phosphate, sulfate and ammonia. Growth yield (growth
rate divided by the carbon uptake rate), oxygen uptake and lactate secretion rates were
computed under a wide range of glucose uptake rates using FVA in order to monitor the
predicted Warburg effect phenotypes during cancer development.
Accounting for enzyme kinetics. A constraint on the total enzyme concentration was
added to the biomass production FBA model:
The enzyme mass (per mg dry weight (DW) of cells) required to maintain the flux in the i-
th reaction ( [mmol/(mgDW*h)]) is given by the product of and the enzyme‟s
molecular weight ( [mg/mmol]) divided by its turnover number ( [1/h]) (Vazquez
et al. 2008). The limit on the total metabolic enzyme mass ( = 0.07791 [mg/mgDW]) was
estimated based on dry cell weight protein biomass measurements (0.7791 [mg/mgDW];
(Davidson 1957)) multiplied by the fraction of metabolic genes out of the total cellular
protein mass, which was evaluated as the sum of metabolic gene expression readouts
divided by the total sum of gene expression readouts ((Lee et al. 2007); equal to 0.1). In
54
order to account for positive fluxes only, each bidirectional reaction was split into two
unidirectional reactions, resulting in a total of 4,894 reactions. Enzyme molecular weights
were obtained from the BRENDA database ((Schomburg, Chang et al. 2004); Supp.Error!
Reference source not found.) while turnover number data was taken from BRENDA and
from the SABIO-RK database ((Rojas, Golebiewski et al. 2007); Supp.), and assigned as
following: each reaction with known Enzyme Commission (EC) number was queried
against BRENDA for the maximal human wild-type value. In case a human was
not available, the maximal non-human wild-type turnover number was assigned. In case
BRENDA data was not available, the SABIO-RK database was used in a similar manner.
As a result, 729 reactions were assigned with values while the other 4,165 reactions
were assigned with the median value across the set of known ‟s (25 1/s).
Pathway activity analysis. Flux distributions were computed under maximal growth rates
in the three growth phases (phase I – 0.0214; phase II – 0.0515; phase III – 0.0557). For
each phase, the median flux distribution across 1000 different uniform samples was
calculated using ACHR sampling (Kaufman and Smith 1998). Mean pathway flux was
calculated as the mean flux across the reactions belonging to the pathway of interest. Data
on relative metabolomic measurements for TCA cycle metabolites (citrate, malate and
fumarate), for lactate, and on relative transcriptomic measurements for genes which are
important for mitochondrial biogenesis (PGC-1-α, NRF-1, TFAM and ATP5E) was taken
from (Ramanathan et al. 2005).
Correlation with gene expression data. Gene expression readouts for 1,269 metabolic
genes across 60 cell lines from the NCI-60 collection (Lee et al. 2007) were correlated with
flux distributions predicted by (i) a stoichiometric only model and by (ii) a model
55
accounting also for enzyme kinetics. Reaction fluxes were converted into enzyme
concentrations by multiplying each reaction flux with the molecular weight of the enzyme
catalyzing this reaction, and dividing it by the corresponding turnover number. Total
enzyme concentrations (per gene) were calculated by summing for each gene the enzyme
concentrations across all of the reactions catalyzed by the enzymes this gene encodes.
Spearman correlation was calculated for the two models and for each of the 60 cell lines.
The robustness of the results was validated against 1,000 uniformly sampled flux
distributions from the solution spaces of the two models using ACHR sampling (Kaufman
et al. 1998).
56
4 Summary
This thesis presents two constraint-based modeling approaches aiming to model cellular
growth both in bacteria as well as in cancer, in a genome-scale manner. In chapter 2 we
describe „metabolite dilution FBA‟ (MD-FBA), which improves the commonly used FBA
method by accounting for the metabolite dilution occurring during exponential growth.
Applying MD-FBA on the genome-scale metabolic network of E. coli showed a significant
improvement in gene-essentiality/growth rate predictions. Applying another FBA variant
on the genome-scale human model (as described in chapter 3) taking into account both
reaction stoichiometry and enzyme kinetics, was able to explain the Warburg effect – a
long standing enigma in the field of cancer metabolism.
Despite the relative success of the FBA variants described above, major limitations still
exist and more work should be done towards and more accurate phenotypic predictions that
would eventually lead to a better understating of cellular metabolism. One explanation to
false predictions lies in the fact that the models are incomplete or contain some errors. For
example, the two existing models of human metabolism (by (Duarte et al. 2007; Ma et al.
2007)) differ significantly from each other (i.e. they contain many non intersecting
reactions). Nevertheless, efforts are being made to improve the quality of existing models
and to generate new models using advanced gap filling procedures and reconstruction
algorithms, respectively (Henry, DeJongh et al. 2010). Another limitation in the CBM
methods is the large solution space which often does not allow us to understand the
complete metabolic state of the network, as many alternatives exist. Adding accurate and
57
comprehensive kinetic constraints (as partly done in our Warburg work), regulatory
constraints and thermodynamic constraints accounting for Gibbs free energy, may
significantly reduce the solution space and allow us to focus only on the biologically and
physically feasible solutions, as for example, demonstrated by our stoichiometric-kinetic
human model. A further notable limitation in the FBA-based methods is the use of the
biomass production maximization as the only objective function of the organism / cell of
interest. Fine tuning of both the biomass composition as well as applying other objectives
may allow more accurate predictions. This can be done by either refining the biomass
composition (as qualitatively done in MD-FBA, but a more quantitative work is needed), or
by considering other objectives, as reviewed in (Schuetz et al. 2007). One interesting
approach may consider models of more than one organism using a joint optimization
criterion which can often be considered in natural habitats.
One appealing application integrating both methods developed as part of this thesis would
involve applying MD-FBA on the human metabolic model while accounting for enzyme
kinetics. This may allow more accurate and possibly novel cancer-related phenotypic
predictions, including specific gene knockout effects resulting in novel drug target
candidates. Overall, we have shown here that FBA-based methods allow accurate modeling
of both bacterial metabolism and the metabolic alterations occurring during cancer
development. With the growing number of published metabolic models and the increasing
availability of novel high value genome-scale data sources, the field would continue to
develop and contribute to biological as well as to medical research in the future.
58
5 Bibliography
Baba, T., T. Ara, M. Hasegawa, Y. Takai, Y. Okumura, M. Baba, K. A. Datsenko, M. Tomita, B. L. Wanner
and H. Mori (2006). "Construction of Escherichia coli K-12 in-frame, single-gene knockout mutants:
the Keio collection." Mol Syst Biol 2.
Barle, H., B. Ahlman, B. Nyberg, K. Andersson, P. Essen and J. Wernerman (1996). "The concentrations of
free amino acids in human liver tissue obtained during laparoscopic surgery." Clin Physiol 16(3):
217-227.
Becker, S. and B. Palsson (2005). "Genome-scale reconstruction of the metabolic network in Staphylococcus
aureus N315: an initial draft to the two-dimensional annotation." BMC Microbiology 5(1): 8.
Bennett, B. D., E. H. Kimball, M. Gao, R. Osterhout, S. J. Van Dien and J. D. Rabinowitz (2009). "Absolute
metabolite concentrations and implied enzyme active site occupancy in Escherichia coli." Nat Chem
Biol 5(8): 593-599.
Benyamini, T., O. Folger, E. Ruppin and T. Shlomi (2010). "Flux balance analysis accounting for metabolite
dilution." Genome Biol 11(4): R43.
Borger, S., W. Liebermeister and E. Klipp (2006). "Prediction of enzyme kinetic parameters based on
statistical learning." Genome Inform 17(1): 80-87.
Burgard, A. and C. Maranas (2003a). "Optimization-based framework for inferring and testing hypothesized
metabolic objective functions." Biotechnol Bioeng 82: 670-677.
Burgard, A. P., P. Pharkya and C. D. Maranas (2003b). "Optknock: a bilevel programming framework for
identifying gene knockout strategies for microbial strain optimization." Biotechnol Bioeng 84: 647 -
657.
Chiaradonna, F., E. Sacco, R. Manzoni, M. Giorgio, M. Vanoni and L. Alberghina (2006). "Ras-dependent
carbon metabolism and transformation in mouse fibroblasts." Oncogene 25(39): 5391-5404.
Covert, M. W., E. M. Knight, J. L. Reed, M. J. Herrgard and B. O. Palsson (2004). "Integrating high-
throughput and computational data elucidates bacterial networks." Nature 429(6987): 92-96.
Davidson, J. N. (1957). "Chemistry of the liver cell." Br Med Bull 13(2): 77-81.
de Groof, A. J., M. M. te Lindert, M. M. van Dommelen, M. Wu, M. Willemse, A. L. Smift, M. Winer, F.
Oerlemans, H. Pluk, J. A. Fransen and B. Wieringa (2009). "Increased OXPHOS activity precedes
rise in glycolytic rate in H-RasV12/E1A transformed fibroblasts that develop a Warburg phenotype."
Mol Cancer 8: 54.
DeBerardinis, R. J., A. Mancuso, E. Daikhin, I. Nissim, M. Yudkoff, S. Wehrli and C. B. Thompson (2007).
"Beyond aerobic glycolysis: transformed cells can engage in glutamine metabolism that exceeds the
requirement for protein and nucleotide synthesis." Proc Natl Acad Sci U S A 104(49): 19345-19350.
59
Deutscher, D., I. Meilijson, M. Kupiec and E. Ruppin (2006). "Multiple knockout analysis of genetic
robustness in the yeast metabolic network." Nat Genet 38(9): 993-998.
Domach, M. M., Leung, S.K., Cahn, R.E., Cocks, G.G. & Shuler, M.L. (2000). "Computer model for glucose-
limited growth of a single cell of Escherichia coli B/r-A." Biotechnol Bioeng 67: 827-840.
Duarte, N. C., S. A. Becker, N. Jamshidi, I. Thiele, M. L. Mo, T. D. Vo, R. Srivas and B. O. Palsson (2007).
"Global reconstruction of the human metabolic network based on genomic and bibliomic data." Proc
Natl Acad Sci USA 104(6): 1777 - 1782.
Durot, M., P. Y. Bourguignon and V. Schachter (2009). "Genome-scale models of bacterial metabolism:
reconstruction and applications." FEMS Microbiol Rev 33(1): 164-190.
Durot, M., F. Le Fevre, V. de Berardinis, A. Kreimeyer, D. Vallenet, C. Combe, S. Smidtas, M. Salanoubat, J.
Weissenbach and V. Schachter (2008). "Iterative reconstruction of a global metabolic model of
Acinetobacter baylyi ADP1 using high-throughput growth phenotype and gene essentiality data."
BMC Systems Biology 2(1): 85.
Elstrom, R. L., D. E. Bauer, M. Buzzai, R. Karnauskas, M. H. Harris, D. R. Plas, H. Zhuang, R. M. Cinalli, A.
Alavi, C. M. Rudin and C. B. Thompson (2004). "Akt stimulates aerobic glycolysis in cancer cells."
Cancer Res 64(11): 3892-3899.
Feist, A. M., C. S. Henry, J. L. Reed, M. Krummenacker, A. R. Joyce, P. D. Karp, L. J. Broadbelt, V.
Hatzimanikatis and B. O. Palsson (2007). "A genome-scale metabolic reconstruction for Escherichia
coli K-12 MG1655 that accounts for 1260 ORFs and thermodynamic information." Mol Syst Biol
3(121).
Feist, A. M., M. J. Herrgard, I. Thiele, J. L. Reed and B. O. Palsson (2009). "Reconstruction of biochemical
networks in microorganisms." Nat Rev Micro 7(2): 129-143.
Feist, A. M. and B. O. Palsson (2008). "The growing scope of applications of genome-scale metabolic
reconstructions using Escherichia coli." Nat Biotech 26(6): 659-667.
Feist, A. M. and B. O. Palsson (2010). "The biomass objective function." Curr Opin Microbiol 13(3): 344-
349.
Fell, D. A. (1996). Understanding the control of metabolism. London, Portland Press.
Folger, O., L. Jerby, C. Frezza, E. Gottlieb, E. Ruppin and T. Shlomi (2010). "Predicting Selective Drug
Targets in Cancer through Metabolic Networks." Nature Biotechnology Submitted.
Funes, J. M., M. Quintero, S. Henderson, D. Martinez, U. Qureshi, C. Westwood, M. O. Clements, D.
Bourboulia, R. B. Pedley, S. Moncada and C. Boshoff (2007). "Transformation of human
mesenchymal stem cells increases their dependency on oxidative phosphorylation for energy
production." Proc Natl Acad Sci U S A 104(15): 6223-6228.
Gatenby, R. A. and R. J. Gillies (2004). "Why do cancers have high aerobic glycolysis?" Nat Rev Cancer
4(11): 891-899.
Glasner, J. e. a. (2003). "ASAP, a systematic annotation package for community analysis of genomes."
Nucleic Acids Res 31: 147-151.
60
Gottschalk, S., N. Anderson, C. Hainz, S. G. Eckhardt and N. J. Serkova (2004). "Imatinib (STI571)-mediated
changes in glucose metabolism in human leukemia BCR-ABL-positive cells." Clin Cancer Res
10(19): 6661-6668.
Handorf, T., O. Ebenhoh and R. Heinrich (2005). "Expanding metabolic networks: scopes of compounds,
robustness, and evolution." J Mol Evol 61(4): 498-512.
Henry, C. S., M. DeJongh, A. A. Best, P. M. Frybarger and R. L. Stevens (2010). "High-throughput
generation and optimization of genome-scale metabolic models." Nat Biotech To appear.
Hsu, A. Y., W. W. Poon, J. A. Shepherd, D. C. Myles and C. F. Clarke (1996). "Complementation of coq3
Mutant Yeast by Mitochondrial Targeting of the Escherichia coli UbiG Polypeptide: Evidence That
UbiG Catalyzes Both O-Methylation Steps in Ubiquinone Biosynthesis." Biochemistry 35(30):
9797-9806.
Ibarra, R. U., J. S. Edwards and B. O. Palsson (2002). "Escherichia coli K-12 undergoes adaptive evolution to
achieve in silico predicted optimal growth." Nature 420(6912): 186 - 189.
Izallalen, M., R. Mahadevan, A. Burgard, B. Postier, R. Didonato, J. Sun, C. H. Schilling and D. R. Lovley
(2008). "Geobacter sulfurreducens strain engineered for increased rates of respiration." Metab Eng
10: 267 - 275.
Jamshidi, N. and B. Palsson (2007). "Investigating the metabolic capabilities of Mycobacterium tuberculosis
H37Rv using the in silico strain iNJ661 and proposing alternative drug targets." BMC Systems
Biology 1(1): 26.
Jerby, L., T. Shlomi and E. Ruppin (2010). "Computational reconstruction of tissue-specific metabolic
models: Application to human liver metabolism " Mol Syst Biol To appear.
Joyce, A., J. Reed, A. White, R. Edwards, A. Osterman, T. Baba, H. Mori, S. Lesely, B. Palsson and S.
Agarwalla (2006). "Experimental and computational assessment of conditionally essential genes in
Escherichia coli." J Bacteriol 188: 8259-8271.
Joyce, A. R. and B. O. Palsson (2007). "Toward whole cell modeling and simulation: comprehensive
functional genomics through the constraint-based approach." Prog Drug Res 64: 265, 267-309.
Kaufman, D. E. and R. L. Smith (1998). "Direction Choice for Accelerated Convergence in Hit-and-Run
Sampling." OPERATIONS RESEARCH 46(1): 84-95.
Kilburn, D. G., M. D. Lilly and F. C. Webb (1969). "The energetics of mammalian cell growth." J Cell Sci
4(3): 645-654.
Kjeld Raunkjזr, K. and N. Jens (2009). "In silico genome-scale reconstruction and validation of the
Corynebacterium glutamicum metabolic network." Biotechnology and Bioengineering 102(2): 583-
597.
Kruse, K. and O. Ebenhöh (2008). "Comparing Flux Balance Analysis to Network Expansion: Producibility,
Sustainability and the Scope of Compounds." Genome Informatics 20: 91-101.
Lanpher, B., N. Brunetti-Pierri and B. Lee (2006). "Inborn errors of metabolism: the flux from Mendelian to
complex diseases." Nature Reviews Genetics 7: 449-460.
61
Lee, J. K., D. M. Havaleshko, H. Cho, J. N. Weinstein, E. P. Kaldjian, J. Karpovich, A. Grimshaw and D.
Theodorescu (2007). "A strategy for predicting the chemosensitivity of human cancers and its
application to drug discovery." Proc Natl Acad Sci U S A 104(32): 13086-13091.
Locasale, J. W. and L. C. Cantley (2010). "Altered metabolism in cancer." BMC Biol 8: 88.
Ma, H., A. Sorokin, A. Mazein, A. Selkov, E. Selkov, O. Demin and I. Goryanin (2007). "The Edinburgh
human metabolic network reconstruction and its functional analysis." Mol Syst Biol 3(135).
Mahadevan, R., D. R. Bond, J. E. Butler, A. Esteve-Nunez, M. V. Coppi, B. O. Palsson, C. H. Schilling and
D. R. Lovley (2006). "Characterization of Metabolism in the Fe(III)-Reducing Organism Geobacter
sulfurreducens by Constraint-Based Modeling." Appl. Environ. Microbiol. 72(2): 1558-1568.
Mahadevan, R. and C. H. Schilling (2003). "The effects of alternate optimal solutions in constraint-based
genome-scale metabolic models." Metab Eng 5(4): 264-276.
Martelli, C., A. De Martino, E. Marinaric, M. Marsili and I. Castilloe (2009). "Identifying essential genes in
Escherichia coli from a metabolic optimization principle." Proc Natl Acad Sci USA 106(8): 2607-
2611.
Mo, M., B. Palsson and M. Herrgard (2009). "Connecting extracellular metabolomic measurements to
intracellular flux states in yeast." BMC Systems Biology 3(1): 37.
Mori, S., J. T. Chang, E. R. Andrechek, N. Matsumura, T. Baba, G. Yao, J. W. Kim, M. Gatza, S. Murphy
and J. R. Nevins (2009). "Anchorage-independent cell growth signature identifies tumors with
metastatic potential." Oncogene 28(31): 2796-2805.
Muoio, D. M. and C. B. Newgard (2006). "Obesity-related derangements in metabolic regulation." Annu Rev
Biochem 75: 367-401.
Oberhardt, M. A., B. O. Palsson and J. A. Papin (2009). "Applications of genome-scale metabolic
reconstructions." Mol Syst Biol 5.
Orth, J. D., I. Thiele and B. O. Palsson (2010). "What is flux balance analysis?" Nat Biotechnol 28(3): 245-
248.
Papin, J. A., N. D. Price, S. J. Wiback, D. A. Fell and B. O. Palsson (2003). "Metabolic pathways in the post-
genome era." Trends Biochem Sci 28(5): 250-258.
Pramanik, J. and J. D. Keasling (1997). "Stoichiometric Model of Escherichia coli Metabolism: Incorporation
of Growth-Rate Dependent Biomass Composition and Mechanistic Energy Requirements."
Biotechnol Bioeng 56(4): 398-421.
Pramanik, J. and J. D. Keasling (1998). "Effect of Escherichia coli Biomass Composition on Central
Metabolic Fluxes Predicted by a Stoichiometric Model." Biotechnol Bioeng 60(2): 230-238.
Price, N. D., I. Famili, D. A. Beard and B. Palsson (2002). "Extreme Pathways and Kirchhoff's Second Law."
Biophysical Journal 83(5): 2879-2882.
Price, N. D., J. L. Reed and B. O. Palsson (2004). "Genome-scale models of microbial cells: evaluating the
consequences of constraints." Nat Rev Microbiol 2(11): 886-897.
62
Rabinowitz, J. L., D. G. Baker, T. G. Villanueva, A. P. Asanza and D. M. Capuzzi (1992). "Liver lipid
profiles of adults taking therapeutic doses of aspirin." Lipids 27(4): 311-314.
Ramanathan, A., C. Wang and S. L. Schreiber (2005). "Perturbational profiling of a cell-line model of
tumorigenesis by using metabolic measurements." Proc Natl Acad Sci U S A 102(17): 5992-5997.
Reed, J. L., T. R. Patel, K. H. Chen, A. R. Joyce, M. K. Applebee, C. D. Herring, O. T. Bui, E. M. Knight, S.
S. Fong and B. O. Palsson (2006). "Systems approach to refining genome annotation." Proc Natl
Acad Sci USA 103: 17480 - 17484.
Rojas, I., M. Golebiewski, R. Kania, O. Krebs, S. Mir, A. Weidemann and U. Wittig (2007). "Storing and
annotating of kinetic data." In Silico Biol 7(2 Suppl): S37-44.
Ryan, S. S. and T. P. Eleftherios (2008). "Genome-scale model for Clostridium acetobutylicum: Part I.
Metabolic network resolution and analysis." Biotechnology and Bioengineering 101(5): 1036-1052.
Savage, D. C. (1977). "Microbial ecology of the gastrointestinal tract." Annu Rev Microbiol 31: 107-133.
Schilling, C., M. Covert, I. Famili, G. Church, J. Edwards and B. Palsson (2002). "Genome-scale metabolic
model of Helicobacter pylori 26695." J Bacteriol 184: 4582– 4593.
Schomburg, I., A. Chang, C. Ebeling, M. Gremse, C. Heldt, G. Huhn and D. Schomburg (2004). "BRENDA,
the enzyme database: updates and major new developments." Nucl. Acids Res. 32(suppl_1): D431-
433.
Schuetz, R., L. Kuepfer and U. Sauer (2007). "Systematic evaluation of objective functions for predicting
intracellular fluxes in Escherichia coli." Mol Syst Biol 3: 119.
Schuster, S., D. A. Fell and T. Dandekar (2000). "A general definition of metabolic pathways useful for
systematic organization and analysis of complex metabolic networks." Nat Biotechnol 18(3): 326-
332.
Segre, D., D. Vitkup and G. M. Church (2002). "Analysis of optimality in natural and perturbed metabolic
networks." Proc Natl Acad Sci U S A 99: 15112 - 15117.
Sheikh, K., J. Forster and L. K. Nielsen (2005). "Modeling hybridoma cell metabolism using a generic
genome-scale metabolic model of Mus musculus." Biotechnol. Prog. 21: 112-121.
Shi, Y. and P. Burn (2004). "Lipid metabolic enzymes: emerging drug targets for the treatment of obesity."
Nat Rev Drug Discov 3(8): 695-710.
Shlomi, T., T. Benyamini, E. Gottlieb, R. Sharan and E. Ruppin (2010). "Metabolic modeling elucidates the
role of proliferative adaptation in causing the Warburg effect."
Shlomi, T., O. Berkman and E. Ruppin (2005). "Regulatory on/off minimization of metabolic flux changes
after genetic perturbations." Proc Natl Acad Sci U S A 102(21): 7695-7700.
Shlomi, T., M. N. Cabili, M. J. Herrgard, B. O. Palsson and E. Ruppin (2008). "Network-based prediction of
human tissue-specific metabolism." Nat Biotechnol 26(9): 1003-1010.
Shlomi, T., M. N. Cabili and E. Ruppin (2009). "Predicting metabolic biomarkers of human inborn errors of
metabolism." Mol Syst Biol 5: 263.
63
Smallbone, K., E. Simeonidis, N. Swainston and P. Mendes (2010). "Towards a genome-scale kinetic model
of cellular metabolism." BMC Syst Biol 4: 6.
Töpel, T., R. Hofestädt, D. Scheible and F. Trefz (2006). "RAMEDIS: the rare metabolic diseases database."
Applied Bioinformatics 5(2): 115-118.
Triguero, A., T. Barber, C. Garcia, I. R. Puertes, J. Sastre and J. R. Vina (1997). "Liver intracellular L-
cysteine concentration is maintained after inhibition of the trans-sulfuration pathway by
propargylglycine in rats." Br J Nutr 78(5): 823-831.
Vander Heiden, M. G., L. C. Cantley and C. B. Thompson (2009). "Understanding the Warburg Effect: The
Metabolic Requirements of Cell Proliferation." Science 324(5930): 1029-1033.
Varma, A. and B. O. Palsson (1994). "Metabolic Flux Balancing: Basic concepts, Scientific and Practical
Use." Nat Biotechnol 12: 994 - 998.
Varma , A. and B. O. Palsson (1994). "Metabolic flux balancing: Basic concepts, scientific and practical use."
Bio. Technology 12: 994-998.
Vazquez, A., Q. K. Beg, M. A. Demenezes, J. Ernst, Z. Bar-Joseph, A. L. Barabasi, L. G. Boros and Z. N.
Oltvai (2008). "Impact of the solvent capacity constraint on E. coli metabolism." BMC Syst Biol 2:
7.
Vazquez, A., J. Liu, Y. Zhou and Z. Oltvai (2010). "Catabolic efficiency of aerobic glycolysis: The Warburg
effect revisited." BMC Syst Biol 4(1): 58.
Visser, D., J. W. Schmid, K. Mauch, M. Reuss and J. J. Heijnen (2004). "Optimal re-design of primary
metabolism in Escherichia coli using linlog kinetics." Metabolic Engineering 6(4): 378-390.
Warburg, O. (1956a). "On respiratory impairment in cancer cells." Science 124(3215): 269-270.
Warburg, O. (1956b). "On the Origin of Cancer Cells." Science 123(3191).
Warburg, O., K. Posener and E. Negelein (1924). "ber den Stoffwechsel der Carcinomzelle." Biochemische
Zeitschrift 152: 309.
Watch, A. (2009). "Areas to Watch." Science 326(5960): 1606-.
Wu, G., H. D. Williams, M. Zamanian, F. Gibson and R. K. Poole (1992). "Isolation and characterization of
Escherichia coli mutants affected in aerobic respiration: the cloning and nucleotide sequence of
ubiG: Identification of an S-adenosylmethionine-binding motif in protein, RNA, and small-molecule
methyltransferases." J Gen Microbiol 138(10): 2101-2112.
64
6 Supplementary Material
6.1 MD-FBA
Supp. 1 – supp1-ASAP_growth_conditions.xlsx : The ASAP growth conditions Excel file
including the growth conditions used to model the ASAP experiments used both by FBA
and by MD-FBA.
Supp. 2 – supp2-ASAP_OD_values.xlsx: The ASAP experimental OD values.
Excel file including the experimentally measured OD values taken from the ASAP
database.
Supp. 3 – supp3-subsystem_activity_diff.xlsx: Reaction activity difference across
subsystems. Figure showing the mean reaction activity difference between FBA and MD-
FBA across the different metabolic subsystems available in the model.
Supp. 4 – supp4-essentiality_results.xlsx: Gene essentiality analysis results
Excel file containing the gene essentiality predictions by FBA and by MD-FBA as well as
the experimental gene essentiality data.
Supp. 5 – supp5-cofactor_activity.xlsx: Cofactor dilution related demand activity
predictions. Excel file containing MD-FBA‟s predictions for the dilution related growth-
demand synthesis of the 3 cofactors: 10fthf, 2ohph and fad across different gene knockouts.
65
6.2 Warburg
6.2.1 Robustness analysis of stoichiometric-kinetic model
The stoichiometric-kinetic model requires prior knowledge regarding the turnover rates of
all enzymes in the human metabolic network model. Since turnover rates were found for
only 729 reactions in the network (extracted from the BRENDA (Schomburg et al. 2004)
database and from the SABIO-RK database (Rojas et al. 2007)), the remaining 4165
reactions were assigned with the median value of the known turnover rates (in the analysis
described in the main text). To investigate the robustness of the stoichiometric-kinetic
model to the uncertainty in the kinetic parameters we performed 1,000 random samplings
of kinetic parameters for the 4165 reactions with unknown turnover rates, and repeated the
prediction of Warburg effect characteristics with each sampled parameter set (Supp. 6). The
samples were taken from a log-normal distribution whose mean and standard deviation
were determined from the distribution of known turnover rates for the remaining 729
reactions (Vazquez et al. 2008). The resulting metabolic predictions show similar trends to
the ones obtained with the median turnover rate, as presented in the main text.
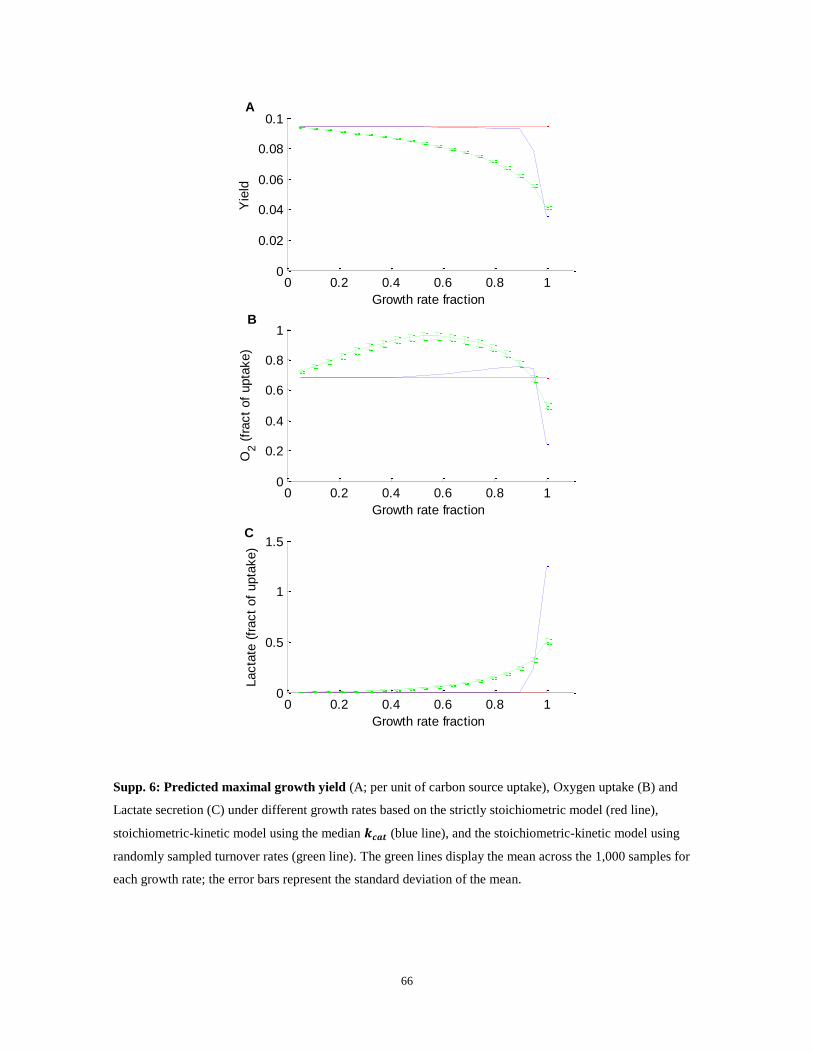
66
Supp. 6: Predicted maximal growth yield (A; per unit of carbon source uptake), Oxygen uptake (B) and
Lactate secretion (C) under different growth rates based on the strictly stoichiometric model (red line),
stoichiometric-kinetic model using the median (blue line), and the stoichiometric-kinetic model using
randomly sampled turnover rates (green line). The green lines display the mean across the 1,000 samples for
each growth rate; the error bars represent the standard deviation of the mean.
0 0.2 0.4 0.6 0.8 10
0.02
0.04
0.06
0.08
0.1
Growth rate fraction
Yie
ld
0 0.2 0.4 0.6 0.8 10
0.2
0.4
0.6
0.8
1
Growth rate fraction
O2 (
fract
of
upta
ke)
0 0.2 0.4 0.6 0.8 10
0.5
1
1.5
Growth rate fraction
Lacta
te (
fract
of
upta
ke)
A
B
C
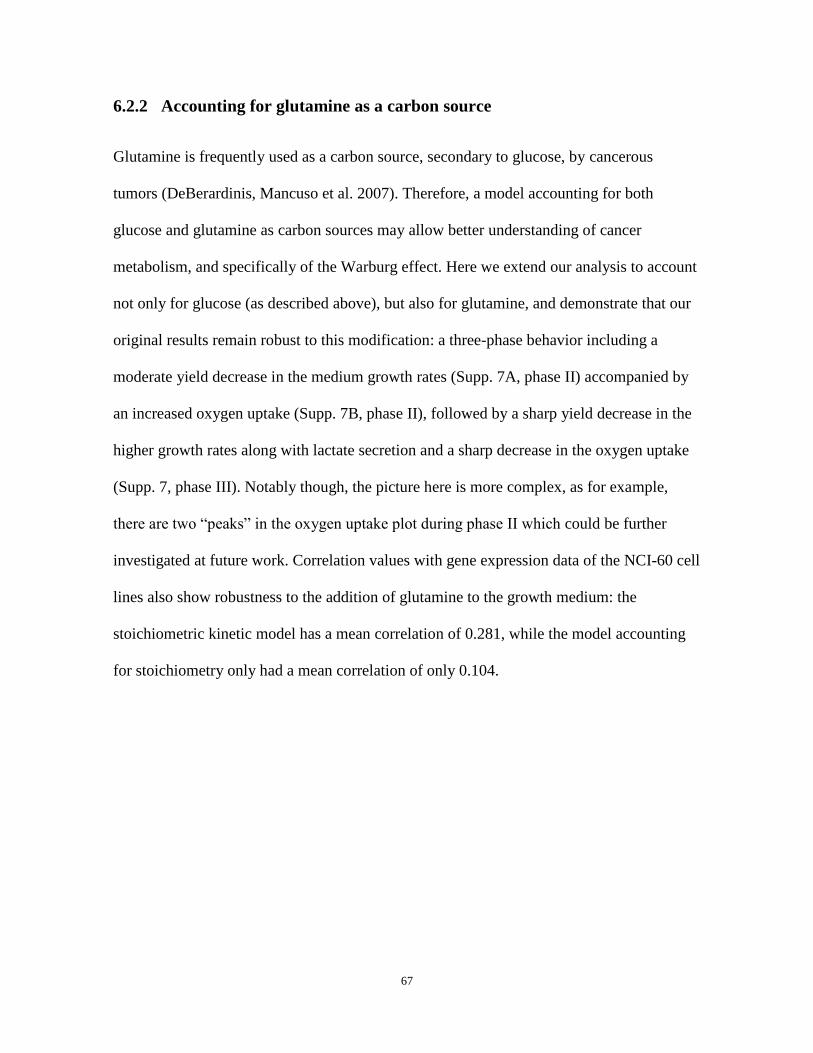
67
6.2.2 Accounting for glutamine as a carbon source
Glutamine is frequently used as a carbon source, secondary to glucose, by cancerous
tumors (DeBerardinis, Mancuso et al. 2007). Therefore, a model accounting for both
glucose and glutamine as carbon sources may allow better understanding of cancer
metabolism, and specifically of the Warburg effect. Here we extend our analysis to account
not only for glucose (as described above), but also for glutamine, and demonstrate that our
original results remain robust to this modification: a three-phase behavior including a
moderate yield decrease in the medium growth rates (Supp. 7A, phase II) accompanied by
an increased oxygen uptake (Supp. 7B, phase II), followed by a sharp yield decrease in the
higher growth rates along with lactate secretion and a sharp decrease in the oxygen uptake
(Supp. 7, phase III). Notably though, the picture here is more complex, as for example,
there are two “peaks” in the oxygen uptake plot during phase II which could be further
investigated at future work. Correlation values with gene expression data of the NCI-60 cell
lines also show robustness to the addition of glutamine to the growth medium: the
stoichiometric kinetic model has a mean correlation of 0.281, while the model accounting
for stoichiometry only had a mean correlation of only 0.104.
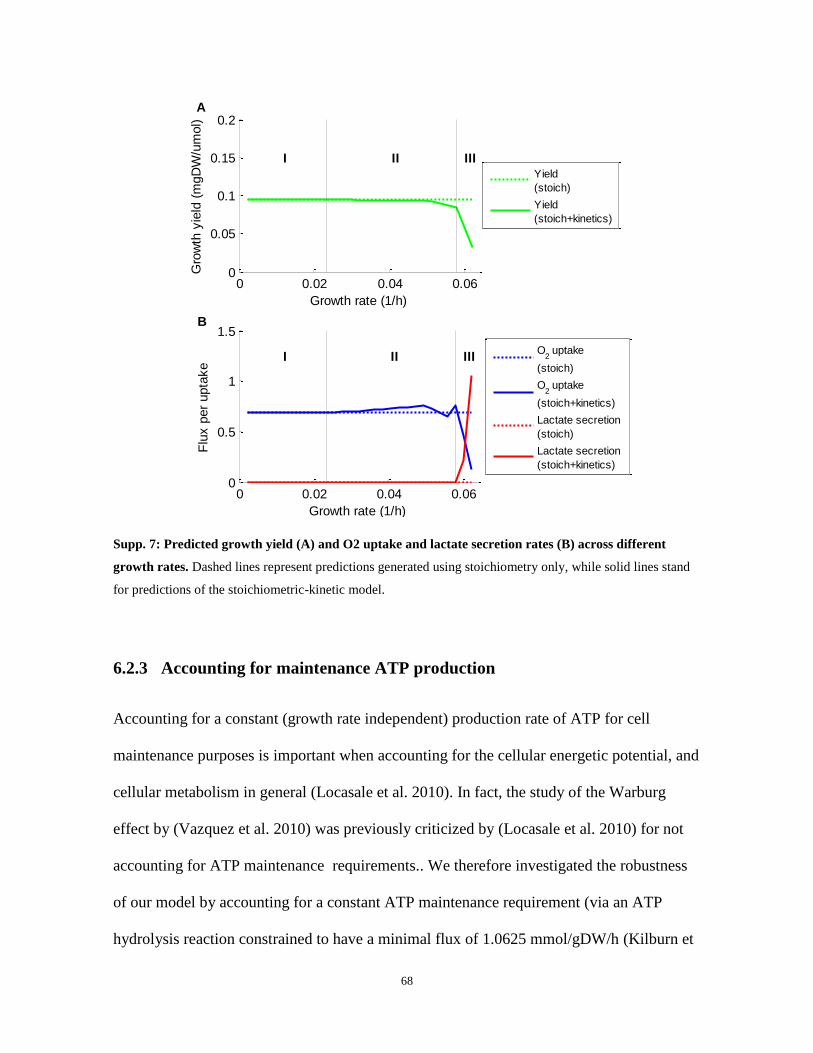
68
Supp. 7: Predicted growth yield (A) and O2 uptake and lactate secretion rates (B) across different
growth rates. Dashed lines represent predictions generated using stoichiometry only, while solid lines stand
for predictions of the stoichiometric-kinetic model.
6.2.3 Accounting for maintenance ATP production
Accounting for a constant (growth rate independent) production rate of ATP for cell
maintenance purposes is important when accounting for the cellular energetic potential, and
cellular metabolism in general (Locasale et al. 2010). In fact, the study of the Warburg
effect by (Vazquez et al. 2010) was previously criticized by (Locasale et al. 2010) for not
accounting for ATP maintenance requirements.. We therefore investigated the robustness
of our model by accounting for a constant ATP maintenance requirement (via an ATP
hydrolysis reaction constrained to have a minimal flux of 1.0625 mmol/gDW/h (Kilburn et
0 0.02 0.04 0.060
0.05
0.1
0.15
0.2A
Growth rate (1/h)
Gro
wth
yie
ld (
mgD
W/u
mol)
I II IIIYield
(stoich)
Yield
(stoich+kinetics)
0 0.02 0.04 0.060
0.5
1
1.5B
Growth rate (1/h)
Flu
x p
er
upta
ke
I II IIIO
2 uptake
(stoich)
O2 uptake
(stoich+kinetics)
Lactate secretion
(stoich)
Lactate secretion
(stoich+kinetics)
0.04 0.045 0.05 0.055 0.06 0.065 0.070
0.2
0.4
um
ol/m
gP
rote
in
Growth rate (1/h)
C
0.04 0.05 0.06 0.070
500
1000
NR
FU
/mgP
rote
in/m
in
O2 uptake
Lactate secretion
69
al. 1969)). A non-constant growth yield is observed even when using the stoichiometric
model alone – since a constant amount of carbon uptake is needed to satisfy the
maintenance ATP production, independently of the growth rate (the yield is calculated as
the growth rate divided by the carbon uptake rate; Supp. 8A). Nevertheless, using the
stoichiometric-kinetic model, we witness a behavior very similar to what we got when
maintenance ATP were not accounted for: a yield decrease at the higher growth rates
accompanied by an increased oxygen uptake (corresponding to Phase II, Supp. 8, Supp. 9),
followed by a shaper decrease, accompanied by lactate secretion and decreased oxygen
uptake (Phase III, Supp. 8, Supp. 9). Furthermore, repeating the correlation with NCI-60
expression data analysis, the significant advantage of the stoichiometric-kinetic approach
over the stoichiometric-only one, retains (stoichiometric model: mean correlation = 0.101,
mean p-value = 5.47e-4; stoichiometric-kinetic model: mean correlation = 0.281, mean p-
value = 8.69e-22; Wilcoxon test p-value = 3.56e-21).
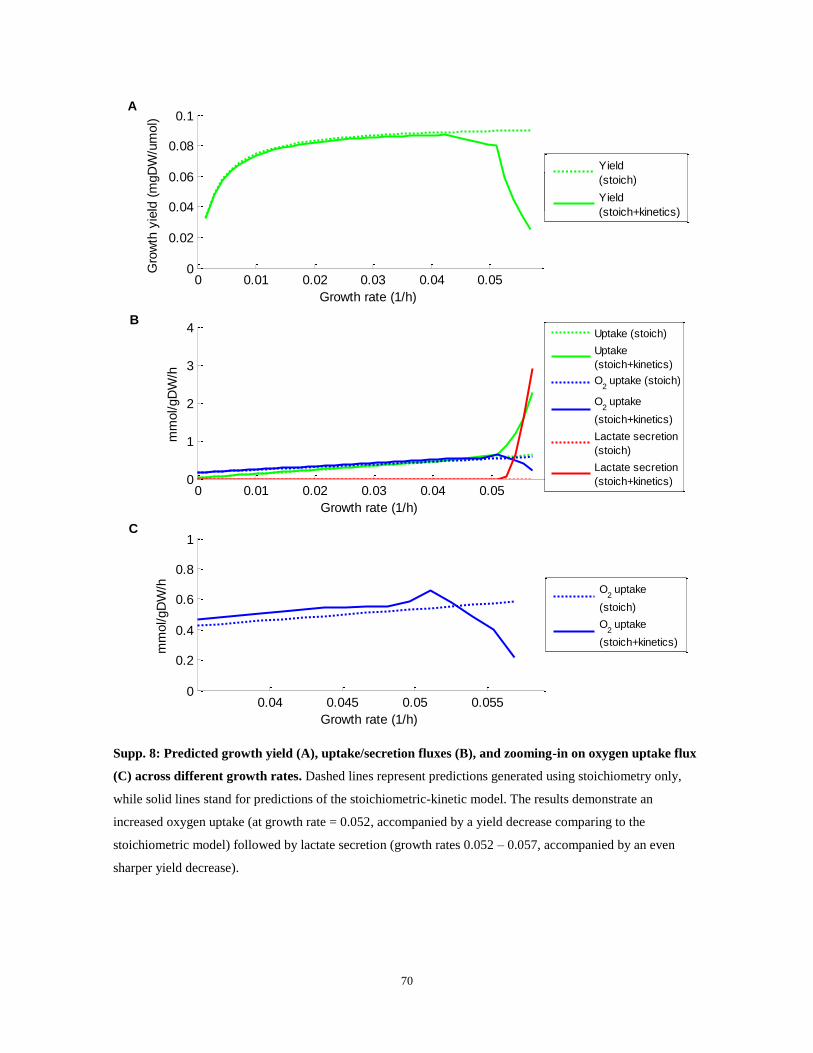
70
Supp. 8: Predicted growth yield (A), uptake/secretion fluxes (B), and zooming-in on oxygen uptake flux
(C) across different growth rates. Dashed lines represent predictions generated using stoichiometry only,
while solid lines stand for predictions of the stoichiometric-kinetic model. The results demonstrate an
increased oxygen uptake (at growth rate = 0.052, accompanied by a yield decrease comparing to the
stoichiometric model) followed by lactate secretion (growth rates 0.052 – 0.057, accompanied by an even
sharper yield decrease).
0 0.01 0.02 0.03 0.04 0.050
0.02
0.04
0.06
0.08
0.1A
Growth rate (1/h)
Gro
wth
yie
ld (
mgD
W/u
mol)
C
B
Yield (stoich)
Yield (crow ding)
0 0.01 0.02 0.03 0.04 0.050
1
2
3
4B
Growth rate (1/h)
mm
ol/gD
W/h
Uptake (stoich)
Uptake
(stoich+kinetics)
O2 uptake (stoich)
O2 uptake
(stoich+kinetics)
Lactate secretion
(stoich)
Lactate secretion
(stoich+kinetics)
0.04 0.045 0.05 0.0550
0.2
0.4
0.6
0.8
1C
Growth rate (1/h)
mm
ol/gD
W/h O
2 uptake
(stoich)
O2 uptake
(stoich+kinetics)
0 0.02 0.04 0.060
0.05
0.1
0.15
0.2A
Growth rate (1/h)
Gro
wth
yie
ld (
mgD
W/u
mol)
I II IIIYield
(stoich)
Yield
(stoich+kinetics)
0 0.02 0.04 0.060
0.5
1
1.5B
Growth rate (1/h)
Flu
x p
er
upta
ke
I II IIIO
2 uptake
(stoich)
O2 uptake
(stoich+kinetics)
Lactate secretion
(stoich)
Lactate secretion
(stoich+kinetics)
0.04 0.045 0.05 0.055 0.06 0.065 0.070
0.2
0.4
um
ol/m
gP
rote
in
Growth rate (1/h)
C
0.04 0.05 0.06 0.070
500
1000
NR
FU
/mgP
rote
in/m
in
O2 uptake
Lactate secretion
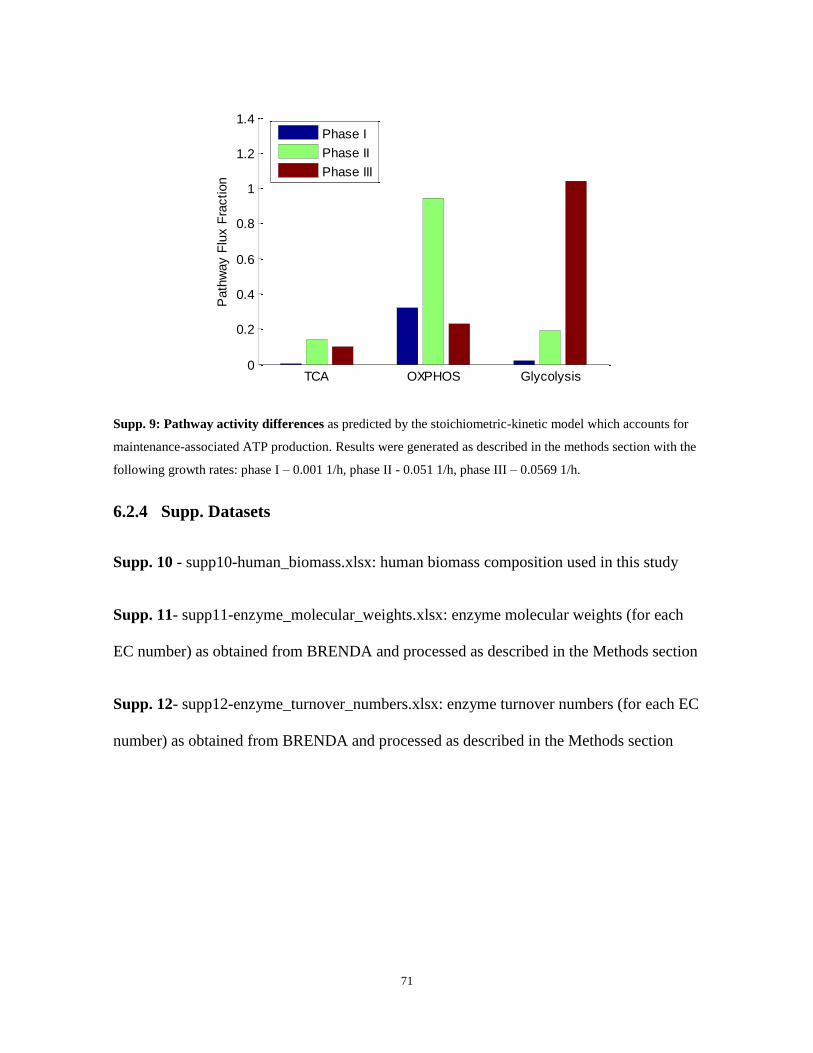
71
Supp. 9: Pathway activity differences as predicted by the stoichiometric-kinetic model which accounts for
maintenance-associated ATP production. Results were generated as described in the methods section with the
following growth rates: phase I – 0.001 1/h, phase II - 0.051 1/h, phase III – 0.0569 1/h.
6.2.4 Supp. Datasets
Supp. 10 - supp10-human_biomass.xlsx: human biomass composition used in this study
Supp. 11- supp11-enzyme_molecular_weights.xlsx: enzyme molecular weights (for each
EC number) as obtained from BRENDA and processed as described in the Methods section
Supp. 12- supp12-enzyme_turnover_numbers.xlsx: enzyme turnover numbers (for each EC
number) as obtained from BRENDA and processed as described in the Methods section
TCA OXPHOS Glycolysis0
0.2
0.4
0.6
0.8
1
1.2
1.4
Path
way F
lux F
raction
Phase I
Phase II
Phase III

72
תקציר
נמצא בשימוש נרחב לצורך אנליזה של (constraint based modeling, א"ממ)מידול מבוסס אילוצים
גם עבור , א"וכרגע קיימים עשרות מודלים בקנה מידה גנומי שיכולים לשמש לאנליזת ממ, רשתות מטבוליות
נמצא ( שמתאר את קצב הגידול)קצב חלוקת התא . אורגניזמים רב תאיים וגם עבור אורגניזמים חד תאיים
העונה , א הפופולרית ביותר"ושיטת הממ, אורגניזמים חד תאייםשל ( fitness)בשימוש נרחב כמדד לכשירות
משתמשת בעובדה זו וחוזה התנהגות מטבולית של ( flux balance analysis, ש"אא)' אנליזת איזון שטף'לשם
אורגניזמים באמצעות התחשבות בייצור מקסימלי של קבוצת חומרים מוגדרת מראש הדרושים ליצירת הביומסה
(biomass )ש לא לוקחת "אא, יחד עם זאת. אשר מאפשרים קצב גידול מקסימלי, האורגניזם הנבדק של
דבר , בחשבון את הדרישה לייצור חומרי ביניים ברשת המטבולית על מנת לאזן את דילולם שקורה בעת הגידול
ומראים אנו מציעים שיטה שתוקפת את הבעיה הזו 2בפרק . שיכול להוביל לתחזיות שגויות במקרים מסוימים
.שהיא משפרת תחזיות פנוטיפים מטבוליים
היא כמעט לא יושמה עבור אורגניזמים רב , תאיים-ש נמצאת בשימוש נרחב עבור אורגניזמים חד"למרות שאא
תאית לא יכולים להיחשב כממקסמים את קצב הגידול האינדיבידואלי -משום שתאים בודדים במערכת רב, תאיים
פונקציה של מקסום קצב הגידול , ובפרט עבור תאים סרטניים, וגי תאים מסוימיםעבור ס, יחד עם זאת. שלהם
the)אפקט וורבורג , ולאחרונה אפילו הוצע שתופעה מרכזית במטבוליזם של סרטן, יכולה להיחשב כמטרה
Warburg effect) ,אנחנו לומדים בצורה 3בפרק . הוא תוצאה של אדפטציה של תאים סרטניים לגידול מוגבר
stoichiometric)ש בשילוב אילוצים סטויכיומטריים "מדויקת את ההיפותזה הזו ומראים שיישום של אא
constraints ) וקינטיקה של אנזימים(enzyme kinetics )חוזה שאפקט וורבורג , על המודל המטבולי האנושי
.סההוא תוצאה ישירה של ההתאמה של תאים סרטניים להמרת חומרים לצורך יצירת ביומ

73
אוניברסיטת תל אביב
ש ריימונד ובברלי סאקלר"ע הפקולטה למדעים מדויקים
ס בלבטניק למדעי המחשב"ביה
: מטבולי של גידול תאי-מידול חישובי
מחיידקים ועד סרטן
חיבור זה הוגש כחלק מהדרישות לקבלת התואר
אביב-באוניברסיטת תל .M.Sc -" מוסמך אוניברסיטה"
למדעי המחשבבלבטניק ס "ביה
על ידי
תומר בנימיני
עבודת המחקר בוצעה בהדרכתם של פרופסור איתן רופין ופרופסור רודד שרן
א"תשע, תשרי


![[Bernhard Ø. Palsson] Systems Biology Simulation](https://img.pdfslide.us/doc/110x75/577c7ebf1a28abe054a24a97/bernhard-o-palsson-systems-biology-simulation.jpg)


![Welltest Jamshidi [Www.nafti.ir]](https://img.pdfslide.us/doc/110x75/55cf941b550346f57b9faad8/welltest-jamshidi-wwwnaftiir.jpg)