Embed Size (px)
Citation preview

COMPUTATIONAL HEMODYNAMIC ANALYSIS OF STENOSED
CORONARY ARTERY
SARFARAZ KAMANGAR
FACULTY OF ENGINEERING
UNIVERSITY OF MALAYA
KUALA LUMPUR
2016
Univers
ity of
Mala
ya
COMPUTATIONAL HEMODYNAMIC ANALYSIS OF
STENOSED CORONARY ARTERY
SARFARAZ KAMANGAR
THESIS SUBMITTED IN FULFILMENT OF THE
REQUIREMENTS FOR THE DEGREE OF DOCTOR OF
PHILOSOPHY
FACULTY OF ENGINEERING
UNIVERSITY OF MALAYA
KUALA LUMPUR
2016
Univers
ity of
Mala
ya
ii
Sarfaraz Kamangar
KHA130108
Ph.D Engineering
COMPUTATIONAL HEMODYNAMIC ANALYSIS OF STENOSED
CORONARY ARTERY
Heat Transfer
Univers
ity of
Mala
ya
iii
ABSTRACT
The coronary artery disease is a leading cause of death all over the world. The
primary cause of coronary artery disease is the arthrosclerosis. There are various causes
of stenosis formation primarily linked to food habits. There has been continuously
growing interest to understand the blood flow behaviour in Atherosclerosis condition
due to its serious impact on human life. It is believed that hemodynamic plays an
important role in further progression of these coronary artery diseases. In this study, an
investigation of variation in hemodynamic and diagnostic parameters in the left
coronary artery was carried out based on idealistic and realistic patient specific models
of left coronary arteries in diseased and normal condition during hyperthermia. The CT
scan images of suspected patients of coronary artery disease were acquired to
reconstruct the 3D models of realistic left coronary models. Computational fluid
dynamics is used to reflect the in vivo cardiac hemodynamic. The wall pressure,
velocity flow pattern, and wall shear stress were calculated during the cardiac cycle. To
investigate the effect of shapes of stenosis on hemodynamic and diagnostic parameters,
three different shapes of stenosis models (elliptical, trapezoidal and triangular) are
studied. The highest level of pressure drop was observed for trapezoidal shape of
stenosis followed by elliptical and then by triangular shaped stenosis. The increase in
percentage area stenosis, increases the velocity profile inside the blockage region. The
variation in FFR in the region of 76.5-82.7% AS could lead to the misdiagnosis of
intermediate stenosis to decide upon coronary intervention around the clinically used
cut-off value of 0.75. The influence of angle of curvature of artery i.e. 300, 60
0, 90
0 and
1200 on hemodynamic parameters was investigated. It is found that the blood flow
Univers
ityof
Malaya

iv
behaviour is substantially affected by the combined effect of stenosis and the curvature
of artery. The presence of curvature provides low blood flow region at the lower wall of
artery creating a potential stenotic region. The effect of different degree of stenosis on
various locations in patient’s specific left coronary artery on hemodynamic parameters
have been studied by using CT scan images during hyperemic conditions. The decrease
in pressure was found downstream to the stenosis as compared to the coronary artery
without stenosis. The velocity increases with the increase in the percentage area
stenosis. The result also shows that the re-circulation zone was observed immediate to
the stenosis and highest wall shear stress was observed across the stenosis. The
maximum pressure drop was found for the models having stenosis of 70% and 90% at
the left main stem and left circumflex branch respectively. Thus it can be conveniently
said that the case of 70% AS located at left main stem and 90% AS at left circumflex is
the most severe condition among 10 models being investigated.
Univers
ity of
Mala
ya
v
ABSTRAK
penyakit arteri koronari adalah penyebab utama kematian di seluruh dunia.
Punca utama penyakit arteri koronari adalah arthrosclerosis itu. Terdapat pelbagai sebab
pembentukan stenosis terutamanya dikaitkan dengan tabiat makanan. Terdapat minat
terus berkembang untuk memahami tingkah laku aliran darah dalam keadaan
Aterosklerosis disebabkan kesan yang serius terhadap kehidupan manusia. Adalah
dipercayai bahawa hemodynamic memainkan peranan yang penting dalam
perkembangan selanjutnya penyakit-penyakit arteri koronari. Dalam kajian ini, siasatan
variasi parameter hemodynamic dan diagnostik dalam arteri koronari kiri telah
dijalankan berdasarkan model tertentu pesakit idealistik dan realistik arteri koronari kiri
dalam keadaan berpenyakit dan biasa pada hyperthermia. CT imej scan pesakit yang
disyaki penyakit arteri koronari telah dibeli untuk membina semula model 3D realistik
model koronari kiri. Pengiraan dinamik bendalir digunakan untuk mencerminkan in
vivo hemodynamics jantung. Tekanan dinding, corak aliran halaju, dan tekanan dinding
ricih dikira semasa kitaran jantung. Untuk mengkaji kesan bentuk stenosis pada
parameter hemodynamic dan diagnostik, tiga bentuk yang berbeza daripada model
stenosis (elips, trapezoid dan segi tiga) sedang dikaji. Tahap tertinggi kejatuhan tekanan
diperhatikan untuk bentuk trapezoid stenosis diikuti oleh elips dan kemudian oleh
stenosis berbentuk segi tiga. Peningkatan kawasan peratusan stenosis, meningkatkan
profil halaju di dalam rantau yang tersumbat. Perubahan dalam FFR di kawasan 76.5-
82.7% AS boleh membawa kepada misdiagnosis stenosis perantaraan untuk membuat
keputusan ke atas campur tangan koronari sekitar nilai cut-off secara klinikal digunakan
sebanyak 0.75. Pengaruh sudut kelengkungan iaitu 300, 60
0, 90
0 dan 120
0 pada
parameter hemodynamic disiasat. Ia didapati bahawa kelakuan aliran darah dengan
ketara terjejas oleh kesan gabungan stenosis dan kelengkungan arteri. Kehadiran
Univers
ity of
Mala
ya
vi
kelengkungan menyediakan kawasan aliran darah rendah pada dinding yang lebih
rendah daripada arteri mewujudkan rantau stenotic yang berpotensi. Kesan daripada
tahap yang berbeza stenosis di pelbagai lokasi di tertentu arteri koronari kiri pesakit
pada parameter hemodynamic telah dikaji dengan menggunakan CT imej imbasan
semasa keadaan hyperemic. Penurunan tekanan ditemui hiliran untuk stenosis
berbanding arteri koronari tanpa stenosis. halaju meningkat dengan peningkatan dalam
kawasan peratusan stenosis. Hasil kajian juga menunjukkan bahawa zon edaran semula
diperhatikan segera untuk stenosis dan paling tinggi tekanan dinding ricih diperhatikan
seluruh stenosis. Penurunan tekanan maksimum didapati untuk model masing-masing
mempunyai stenosis sebanyak 70% dan 90% pada batang utama kiri dan cawangan
sirkumfleks kiri. Oleh itu, ia boleh ditemui dengan mudah berkata, kes itu sebanyak
70% AS terletak di batang utama kiri dan 90% pada sirkumfleks kiri adalah keadaan
yang paling teruk di kalangan 10 model sedang disiasat.
Univers
ity of
Mala
ya

vii
ACKNOWLEDGEMENT
First of all, I would like to thank Almighty ALLAH Subhana Watalah for giving me
strength, determination and ability to complete this thesis. After that, I would like to
express my sincerest gratitude to my supervisors Associate Professor Dr. Irfan Anjum
Magami, Dr. Ahmad Badarudin Bin Mohamad Badry and Associate Professor Dr. Nik
Nazri Bin Nik Ghazali for their excellent guidance and constant encouragement
throughout this work.
Furthermore, I would like to express gratitude to my colleagues Dr. Govindaraju and
Dr. Salman Ahmed khan and for their assistance, suggestions and help during this
course.
I would also like to thank University of Malaya for the research funding support through
University Malaya research grant (UMRG) and Post graduate research grant (PPP).
Lastly, I would like to thank my parents and family for their affection and continuous
encouragement to accomplish this course.
Univers
ity of
Mala
ya
viii
TABLE OF CONTENTS
ABSTRACT ..................................................................................................................... iii
ABSTRAK ........................................................................................................................ v
ACKNOWLEDGEMENT .............................................................................................. vii
TABLE OF CONTENTS ............................................................................................... viii
LIST OF FIGURES ........................................................................................................ xii
LIST OF TABLES .......................................................................................................... xx
LIST OF ABBREVIATION AND SYMBOLS ............................................................. xxi
CHAPTER 1: INTRODUCTION ..................................................................................... 1
1.1 Background ................................................................................................................. 1
1.2 Coronary arteries ......................................................................................................... 2
1.3 Computational fluid dynamics for blood flow analysis .............................................. 8
1.4 Aims and Objectives ................................................................................................... 9
1.5 Scope of Study ............................................................................................................ 9
1.6 Organization of Thesis .............................................................................................. 10
CHAPTER 2: LITERATURE REVIEW ........................................................................ 12
2.1 Introduction ............................................................................................................... 12
2.2 Numerical methods of blood flow in arteries ............................................................ 14
2.2.1 Anatomy of arteries ........................................................................................ 15
2.2.2 Flow across Stenosis ....................................................................................... 21
2.3 Blood flow analysis in tapered arteries ..................................................................... 25
2.4 Blood flow analysis in curved arteries ...................................................................... 26
Univers
ity of
Mala
ya
ix
2.5 Blood flow analysis in bifurcation arteries ............................................................... 29
2.6 Experimental studies on blood flow in arteries ......................................................... 31
2.7 Diagnostic parameters and their effects on hemodynamic ....................................... 32
2.7.1 Fractional flow reserve (FFR)......................................................................... 32
2.7.2 Pressure drop coefficient (CDP) ..................................................................... 33
2.7.3 Lesion flow coefficient (LFC) ........................................................................ 33
2.8 Effect of guidewire on haemodynamic ..................................................................... 35
2.9 Effect of stenosis in realistic coronary arteries ......................................................... 36
2.10 Critical literature review ......................................................................................... 37
CHAPTER 3: METHODOLOGY .................................................................................. 39
3.1 Introduction ............................................................................................................... 39
3.2 Governing equations ................................................................................................. 39
3.3 Equation for computational blood flow model ......................................................... 40
3.4 Turbulence modelling ............................................................................................... 41
3.4.1 Standard (k-ω) model ...................................................................................... 42
3.4.2 Shear-Stress Transport (SST) k-ω (or k-ω-SST) model ................................. 43
3.5 3-Dimensional Computational models of ideal coronary artery ............................... 45
3.5.1 Modeling of different shapes of stenosis in coronary artery .......................... 45
3.5.2 Modeling of coronary artery with varying angle of curvature ........................ 47
3.5.3 Mesh generation for ideal coronary artery models ......................................... 48
3.6 Mesh independent study ............................................................................................ 49
3.7 Modeling of 3D realistic left coronary artery by using 2D CT scan images ............ 51
3.8 Generating 3D left coronary artery models and meshing using 3-matic software .... 55
Univers
ity of
Mala
ya
x
3.9 Validation of simulation results with published results ............................................ 57
3.10 Simulation of guide wire measurement of stenosis severity in vitro experimental
setup ................................................................................................................................ 58
3.11 Pressure drop comparison ....................................................................................... 59
3.12 FFR and CDP comparison ...................................................................................... 60
CHAPTER 4: RESULTS AND DISCUSSION .............................................................. 62
4.1 Introduction ............................................................................................................... 62
4.2 Effect of shapes of stenosis on pressure and diagnostic parameters ......................... 62
4.3 Influence of shapes of stenosis on velocity parameters ............................................ 67
4.4 Influence of shapes of stenosis on pressure .............................................................. 76
4.5 Effect of shapes of stenosis on wall shear stress ....................................................... 80
4.6 Influence of angle of curvature on pressure .............................................................. 83
4.7 Influence of angle of curvature on velocity .............................................................. 86
4.8 Influence of angle of curvature on wall shear stress ................................................. 91
4.9 Effect of angle of downstream curvature on average pressure drop and diagnostic
parameters ....................................................................................................................... 94
4.10 Effect of angle of downstream curvature on fractional flow reserve (FFR) ........... 95
4.11 Influence of stenosis in realistic patient left coronary artery on hemodynamics .. 100
4.12 Influence of stenosis on pressure in various individual patients of coronary artery
disease ........................................................................................................................... 104
4.13 Influence of stenosis on velocity in various individual patients of coronary artery
disease ........................................................................................................................... 106
Univers
ity of
Mala
ya
xi
4.14 Influence of stenosis on wall shear stress in various individual patients of coronary
artery disease ................................................................................................................. 108
4.15 Effect of various degree of stenosis on hemodynamic parameters in normal and
stenosed left coronary artery ......................................................................................... 110
4.16 Effect of multi-stenosis in left coronary artery on the hemodynamic parameters
with different flow rates ................................................................................................ 117
4.16.1 Location of 70% AS at left main stem (LMS) and 80% AS at left circumflex
(LCX) branch ......................................................................................................... 118
4.16.2 Location of 70% AS at left main stem (LMS) and 90% AS at left circumflex
(LCX) branch ......................................................................................................... 122
4.16.3 Location of 70% AS at left anterior descending (LAD) and 90% AS at left
circumflex (LCX) branch....................................................................................... 126
4.16.4 Location of 90% AS at left anterior descending (LAD) and 70% AS at left
circumflex (LCX) branch....................................................................................... 131
4.16.5 Severity analysis of different stenosis size and location............................. 135
CHAPTER 5: CONCLUSION ...................................................................................... 144
5.1 Conclusions ............................................................................................................. 144
5.2 Recommendation for future research ...................................................................... 146
REFERENCES .............................................................................................................. 147
LIST OF PUBLICATION............................................................................................. 160
Univers
ity of
Mala
ya
xii
LIST OF FIGURES
Figure 1.1: Coronary arteries of heart ............................................................................... 3
Figure 1.2: Volume-rendered image of the left coronary artery (LCA) ........................... 4
Figure 1.3: Volume-rendered image of the right coronary artery (RCA) ......................... 4
Figure 1.4: Thickening of artery (http://cardiac.surgery.ucsf.edu/) .................................. 5
Figure 1.5: Leading causes of death (WHO) .................................................................... 8
Figure 2.1: Coronary arteries .......................................................................................... 13
Figure 2.2: Cross section of blood vessel wall (Ai & Vafai, 2006) ............................... 16
Figure 2.3: Collateral flow (Koerselman, van der Graaf, de Jaegere, & Grobbee,
2003) ............................................................................................................................... 17
Figure 2.4: Coronary angiography (http://coronary-angiography.purzuit.com/) ............ 19
Figure 2.5: Three dimensional and curved multi-planar reconstruction of the left
anterior descending artery (A, B). Vessel analysis using the plaque tool in a
longitudinal plane (C) and transverse sections (Kristensen et al., 2010) ........................ 20
Figure 2.6: Simplified schematic representation of stenosis geometry. Pa and Pd are
measured by guiding the catheter attached with a pressure sensor ................................. 33
Figure 3.1: Schematic diagram for elliptical, trapezium and triangular stenosis
geometry .......................................................................................................................... 46
Figure 3.2: Geometric representation of curved artery for 300 degree ........................... 49
Figure 3.3: Computational mesh used for numerical study in the elliptical model for
80%AS (a) side view b) front view ................................................................................. 49
Figure 3.4: Grid structure for the curved stenosis artery of 30 degree (a)
longitudinal section (b) cross section .............................................................................. 49
Univers
ity of
Mala
ya
xiii
Figure 3.5: Axial pressure drop along the length of the artery for elliptical model in
70% AS ........................................................................................................................... 50
Figure 3.6: Velocity profiles at a point mid of the stenosis for elliptical model in
70% AS ........................................................................................................................... 51
Figure 3.7: 2D CT scan images with 3D volume rendering image of normal left
coronary artery ................................................................................................................ 55
Figure 3.8: Normal left coronary artery with fine mesh using tetrahedral elements ...... 56
Figure 3.9: Physiological pressure (Konala et al., 2011; Tang et al., 2009) and
velocity applied at the inlet and outlet (Cho et al., 1983; Sinha Roy et al., 2006)
respectively. The peak velocity corresponds to a normalized velocity of 1.0, so
that the ratio of mean to peak velocity is 0.537 .............................................................. 57
Figure 3.10: Experimental setup of coronary artery model, Reprinted from (R. K.
Banerjee et al., 2014), Copyright (2015) with permission from Elsevier ....................... 59
Figure 3.11: Results of Experimental data (R. K. Banerjee et al., 2014) and
computational data of with and without guide wire ........................................................ 60
Figure 3.12: Compression of FFR for rigid plaque wall model reported by Konala
et al. (Konala et al., 2011) ............................................................................................... 61
Figure 3.13: Compression of CDP for rigid plaque wall model reported by Konala
et al.(Konala et al., 2011) ................................................................................................ 61
Figure 4.1: Bar graph showing variation of time averaged pressure drop across a
given area stenosis with different shape stenosis (triangular, elliptical and
trapezium) ....................................................................................................................... 63
Figure 4.2: Variation of FFR values with different shapes of stenosis (triangular,
elliptical and trapezium) .................................................................................................. 65
Univers
ity of
Mala
ya

xiv
Figure 4.3: Variation of CDP with %AS in various shapes of models (triangular,
elliptical and trapezium) .................................................................................................. 66
Figure 4.4: Variation of LFC with %AS in different shapes of models (triangular,
elliptical and trapezium) .................................................................................................. 67
Figure 4.5: Velocity profile at some locations along the stenosis at various times for
70%AS in elliptical model .............................................................................................. 68
Figure 4.6: Velocity profile at some locations along the stenosis at various times for
80%AS in elliptical model .............................................................................................. 69
Figure 4.7: Velocity profile at some locations along the stenosis at various times for
90% AS in elliptical model ............................................................................................. 70
Figure 4.8: Velocity profile at some locations along the stenosis at various times for
70%AS in trapezoidal model .......................................................................................... 71
Figure 4.9: Velocity profile at some locations along the stenosis at various times for
80%AS in trapezoidal model .......................................................................................... 72
Figure 4.10: Velocity profile at some locations along the stenosis at various times
for 90%AS in trapezoidal model ..................................................................................... 73
Figure 4.11: Velocity profile at some locations along the stenosis at various times
for 70%AS in triangular model ....................................................................................... 74
Figure 4.12: Velocity profile at some locations along the stenosis at various times
for 80%AS in triangular model ....................................................................................... 75
Figure 4.13: Velocity profile at some locations along the stenosis at various times
for 90%AS in triangular model ....................................................................................... 76
Figure 4.14: Axial pressure drop (P-Pe), along the stenosis at various time step for
Elliptical model a) 70%AS b) 80%AS c) 90%AS .......................................................... 77
Univers
ity of
Mala
ya
xv
Figure 4.15: Axial pressure drop (P-Pe), along the stenosis at various time step for
trapezoidal model a) 70%AS b) 80%AS c) 90%AS ....................................................... 78
Figure 4.16: Axial pressure drop (P-Pe), along the stenosis at various time step for
triangular model a) 70%AS b) 80%AS c) 90%AS ......................................................... 79
Figure 4.17: Wall shear stress along the artery at various time steps for elliptical
model during the cardiac cycle a) 70%AS b) 80%AS c) 90%AS................................... 80
Figure 4.18: Wall shear stress along the artery at various time steps for trapezoidal
model during the cardiac cycle a) 70%AS b) 80%AS c) 90%AS................................... 81
Figure 4.19: Wall shear stress along the artery at various time steps for triangular model
during the cardiac cycle a) 70%AS b) 80%AS c) 90%AS.............................................. 82
Figure 4.20: Overall pressure drop across the different shapes of stenosis (Trapezium,
Elliptical and Triangular) during the cardiac cycle at hyperemic flow in 80%AS ......... 83
Figure 4.21: Pressure drop along the axial length for various curvature of artery of
70%AS ............................................................................................................................ 84
Figure 4.22: Pressure drop along the axial length for various curvature of artery of
80%AS ............................................................................................................................ 85
Figure 4.23: Pressure drop along the axial length for various curvature of artery of
90%AS ............................................................................................................................ 89
Figure 4.24: Velocity contours for various curvature of artery with 70% area
stenosis during the peak systole of cardiac cycle a) 300 b) 60
0 c) 90
0 d) 120
0................ 87
Figure 4.25: Velocity contours for various curvature of artery with 80% area
stenosis during the peak systole of cardiac cycle a) 300 b) 60
0 c) 90
0 d) 120
0................ 88
Figure 4.26: Velocity contours for various curvature of artery with 90% area
stenosis during the peak systole of cardiac cycle a) 300 b) 60
0 c) 90
0 d) 120
0................ 89
Univers
ity of
Mala
ya
xvi
Figure 4.27: Axial velocity profile along the artery with different angle of
curvature for 80%AS....................................................................................................... 90
Figure 4.28: Axial velocity profile along the artery with different angle of
curvature for 90%AS....................................................................................................... 91
Figure 4.29: Wall shear stress contour for various angle of curvature during peak
systole in 70%AS ............................................................................................................ 92
Figure 4.30: Wall shear stress contour for various angle of curvature during peak
systole in 80%AS ............................................................................................................ 93
Figure 4.31: Wall shear stress contour for various angle of curvature during peak
systole in 90%AS ............................................................................................................ 94
Figure 4.32: Variation of time averaged pressure drop across the stenosis in 70%,
80% and 90% AS for various angle of curvature ............................................................ 95
Figure 4.33: Variation of FFR with the angle of curvature in 70%, 80% and 90%
AS models ....................................................................................................................... 97
Figure 4.34: Variation of FFR value for straight and 120 degree models ...................... 98
Figure 4.35: Variation of CDP with angle of curvature in 70%, 80% and 90% AS
models ............................................................................................................................. 99
Figure 4.36: Variation of LFC with angle of curvature in 70%, 80% and 90% AS
models ............................................................................................................................. 99
Figure 4.37: Pressure contour with and without stenosis coronary artery for the time
a) and c) systole b) and d) diastole ................................................................................ 101
Figure 4.38: velocity contour with and without stenosis coronary artery for the time
a) and c) systole b) and d) diastole ................................................................................ 102
Univers
ity of
Mala
ya
xvii
Figure 4.39: Wall shear stress contour with and without stenosis coronary artery for
the time a) and c) systole b) and d) diastole .................................................................. 104
Figure 4.40: Visualization of pressure distribution of four patient in the left
coronary artery for time step 1.2s ................................................................................. 106
Figure 4.41: Visualization of velocity pattern of four patient in the left coronary
artery for time step 1.2s ................................................................................................. 108
Figure 4.42: Wall shear stress distribution of four patient in the left coronary artery
for time step 1.2s ........................................................................................................... 110
Figure 4.43: Pressure distribution in left coronary artery for 1.2s during the cardiac
cycle a) Normal b) 70% AS c) 80% AS d) 90% AS ..................................................... 112
Figure 4.44: Cross sectional plane for 70%AS, 80%AS, and 90%AS at a) before
stenosis b) mid stenosis and c) after stenosis ................................................................ 113
Figure 4.45: velocity distribution in left coronary artery during peak systole
a)Normal b) 70% AS c) 80% AS d) 90% AS ............................................................... 115
Figure 4.46: wall shear stress distribution in left coronary artery during cardiac
cycle a) Normal b)70% AS c)80% AS d)90% AS ........................................................ 116
Figure 4.47: Pressure distribution in left coronary artery of 70% and 80%AS
located at LMS and LCX respectively for 1.2s during the cardiac cycle for various
flow rate a) 100ml/min b) 125ml/min c) 150ml/min d) 175ml/min ............................. 119
Figure 4.48: Velocity distribution in left coronary artery of 70% and 80%AS
located at LMS and LCX respectively for 1.2s during the cardiac cycle for various
flow rate a) 100ml/min b) 125ml/min c) 150ml/min d) 175ml/min ............................. 120
Figure 4.49: Wall shear stress in left coronary artery of 70% and 80%AS located at
LMS and LCX respectively for 1.2s during the cardiac cycle for various flow rate
a) 100ml/min b) 125ml/min c) 150ml/min d) 175ml/min ............................................. 122
Univers
ity of
Mala
ya
xviii
Figure 4.50: Pressure distribution in left coronary artery of 70% and 90%AS
located at LMS and LCX respectively for 1.2s during the cardiac cycle for various
flow rate a) 100ml/min b) 125ml/min c) 150ml/min d) 175ml/min ............................. 123
Figure 4.51: Velocity distribution in in left coronary artery of 70% and 90%AS
located at LMS and LCX respectively for 1.2s during the cardiac cycle for various
flow rate a) 100ml/min b) 125ml/min c) 150ml/min d) 175ml/min ............................. 125
Figure 4.52: Wall shear stress in in left coronary artery of 70% and 90%AS located
at LMS and LCX respectively for 1.2s during the cardiac cycle for various flow rate
a) 100ml/min b) 125ml/min c) 150ml/min d) 175ml/min ............................................. 126
Figure 4.53: Pressure distribution in left coronary artery of 70% and 90%AS
located at LAD and LCX respectively for 1.2s during the cardiac cycle for various
flow rate a) 100ml/min b) 125ml/min c) 150ml/min d) 175ml/min ............................. 128
Figure 4.54: Velocity distribution in left coronary artery of 70% and 90%AS
located at LAD and LCX respectively for 1.2s during the cardiac cycle for various
flow rate a) 100ml/min b) 125ml/min c) 150ml/min d) 175ml/min ............................. 129
Figure 4.55: Wall shear stress in left coronary artery of 70% and 90%AS located at
LAD and LCX respectively for 1.2s during the cardiac cycle for various flow rate
a) 100ml/min b) 125ml/min c) 150ml/min d) 175ml/min ............................................. 130
Figure 4.56: Pressure distribution in left coronary artery of 90% and 70%AS
located at LAD and LCX respectively for 1.2s during the cardiac cycle for various
flow rate a) 100ml/min b) 125ml/min c) 150ml/min d) 175ml/min ............................. 132
Figure 4.57: Velocity distribution in left coronary artery of 90% and 70%AS
located at LAD and LCX respectively 1.2s during the cardiac cycle for various flow
rate a) 100ml/min b) 125ml/min c) 150ml/min d) 175ml/min ...................................... 133
Univers
ity of
Mala
ya
xix
Figure 4.58: Wall shear stress in left coronary artery of 90% and 70%AS located at
LAD and LCX respectively for 1.2s during the cardiac cycle for various flow rate
a) 100ml/min b) 125ml/min c) 150ml/min d) 175ml/min ............................................. 134
Figure 4.59: Various stenosis positions ........................................................................ 136
Figure 4.60: Velocity profile for model 1 at point 1 and point 2 for various flow
rate ................................................................................................................................. 140
Figure 4.61: Velocity profile for model 2 at point 1 and point 2 for various flow
rate ................................................................................................................................. 140
Figure 4.62: Velocity profile for model 3 at point 1 and point 2 for various flow
rate ................................................................................................................................. 140
Figure 4.63: Velocity profile for model 4 at point 1 and point 2 for various flow
rate ................................................................................................................................. 141
Figure 4.64: Velocity profile for model 5 at point 1 and point 2 for various flow
rate ................................................................................................................................. 141
Figure 4.65: Velocity profile for model 6 at point 1 and point 2 for various flow
rate ................................................................................................................................. 141
Figure 4.66: Velocity profile for model 7 at point 1 and point 2 for various flow
rate ................................................................................................................................. 142
Figure 4.67: Velocity profile for model 8 at point 1 and point 2 for various flow
rate ................................................................................................................................. 142
Figure 4.68: Velocity profile for model 9 at point 1 and point 2 for various flow
rate ................................................................................................................................. 142
Figure 4.69: Velocity profile for model 10 at point 1 and point 2 for various flow
rate ................................................................................................................................. 143
Univers
ity of
Mala
ya

xx
LIST OF TABLES
Table 3.1: Dimensions of different stenosis shapes (All the dimension are in mm) ...... 47
Table 3.2: Dimensions of different degree of stenosis in the models (All dimension
are in mm) (Konala et al., 2011) ..................................................................................... 49
Table 3.3: Mesh independent study ................................................................................ 51
Table 3.4: Patient’s details of suspect’s coronary artery disease .................................... 52
Table 4.1: Results calculated from the computational simulation for 70%AS,
80%AS, 90% AS ........................................................................................................... 117
Table 4.2: Size and location of stenosis in various models studies .............................. 137
Table 4.3: Severity ranking of different models ........................................................... 137
Table 4.4: Severity rating based on wall shear stress ……………………………….. 138
Univers
ity of
Mala
ya
xxi
LIST OF ABBREVIATION AND SYMBOLS
LCA Left Coronary Artery
RCA Right Coronary Artery
LAD Left Anterior Descending
LCX Left circumflex
CAD Coronary artery disease
CCTA Coronary computed tomographic angiogram
IVUS Intravascular ultrasound
CFD Computational Fluid Dynamic
FFR Fractional Flow Reserve
MRI Magnetic resonance imaging
SST Shear Stress Transport
AS Area Stenosis
DICOM Digital Imaging and Communications in Medicine
CT Computed Tomography
HU Hounsfield Units
CDP Pressure Drop Coefficient
LFC Lesion Flow Coefficient
LMS Left Main Stem
LDL Low-density Lipoproteins
NURD Non-uniform rotational distortion
WPSG Wall pressure stress gradient
IEL Internal elastic lamina
MI Myocardial infarction
Univers
ity of
Mala
ya

xxii
3D Three Dimensional
2D Two Dimensional
m/s Meter per Second
Pa Pascal
ml/min Milliliters Per Second
Kg/m3
Kilogram per cubic meter
ρ Density
v Three dimensional velocity
p Pressure
Stress tensor
µ Blood viscosity
0 Low shear viscosity
High shear viscosity
Time constant
t Time
Turbulence Reynolds number
k Turbulence kinetic energy
Turbulent frequency
ε Turbulence eddy dissipation
Time average pressure drop
Re Reynolds number
TRe
p~Univers
ity of
Mala
ya
1
CHAPTER 1: INTRODUCTION
1.1 Background
Human knowledge has been progressing since centuries but last few decades
have seen an explosion of knowledge in almost every aspect of life. In-spite of such an
advancement of knowledge, there are few fields which are still as new as it could have
been to the stone-age people. One such field of study is the human body which is such a
complex and fascinating system to study. There are many individual subsystems in
human body which collectively work together as one organic entity. There are various
important organs in the human body among which the heart can be argued to be the
most important organ because of its function of circulating blood to all body parts.
Typically human heart weighs about is 250 - 350 gm though diseased heart can have
much higher weight. The dimension of an adult heart could be 12cm x8cm x6cm. Heart
is primarily comprised of 4 chambers namely left atrium, left ventricle, right atrium and
right ventricle. The left side chambers handle the oxygenated blood whereas the right
side chambers processes deoxygenated blood. The deoxygenated blood from right side
of the heart flows to lungs, where it is loaded with oxygen and returns to the left side of
the heart. The oxygenated blood from the left side of the heart flows to all tissues of the
body (with the exception of the heart and lungs). Some of the facts of heart are truly
mind boggling. For instance, it is estimated that the heart beats about 2.65 billion times
and pumps about 194 million liters of blood in 70 years of life span.
This is similar to an amount of blood contained in a swimming pool of
dimension 1km long, 100m wide and 2m depth. Supply of blood to body parts is such a
crucial requirement for nourishment and functioning of that particular part. Like all
other organs which require blood supply for function, heart itself needs adequate
Univers
ity of
Mala
ya
2
oxygen and nourishment supplied through blood circulation to heart muscles for
keeping itself in active state of pumping.
1.2 Coronary arteries
It is estimated that 4-6% of total blood supplied by heart is fed to heart muscles
(Myer, 2003) through coronary arteries that are responsible to channel the blood to heart
tissues. The main function of the coronary arteries is to supply the oxygenated blood
and nutrient to the cardiac muscle. The coronary arteries are small arteries of diameter
about 3 to 5mm originating from top of the aorta. There are two main coronary arteries
called Left coronary artery (LCA) and Right coronary artery (RCA) that further
subdivide into branches as depicted in figure 1.1. The initial segment of the left
coronary artery (LCA) branches into two smaller arteries namely (Figure 1.2) left
anterior descending artery (LAD) and left circumflex coronary artery (LCX) (Waite &
Fine, 2007).
• Left Circumflex artery (LCX) that supplies blood to the left atrium, side and
back of the left ventricle
• Left Anterior Descending artery (LAD) that supplies the front and bottom of the
left ventricle and the front of the septum
The right coronary artery branches into
• Right marginal artery
• Posterior descending artery
The right side of human heart is smaller than left side. The right side of heart receives
blood from right coronary artery which is active in pumping the blood to lungs for
oxygenation, which pumps blood to the lungs. The rest of the right coronary artery and
its main branch, the posterior descending artery, together with the branches of the
Univers
ity of
Mala
ya
3
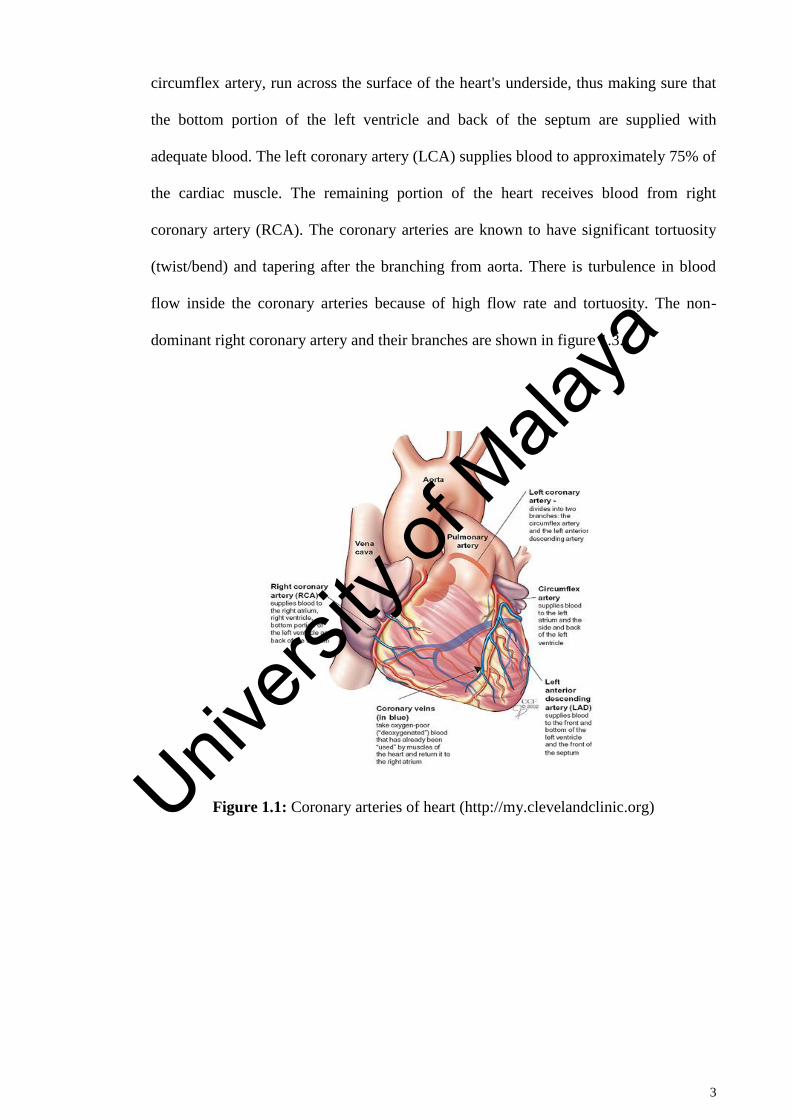
circumflex artery, run across the surface of the heart's underside, thus making sure that
the bottom portion of the left ventricle and back of the septum are supplied with
adequate blood. The left coronary artery (LCA) supplies blood to approximately 75% of
the cardiac muscle. The remaining portion of the heart receives blood from right
coronary artery (RCA). The coronary arteries are known to have significant tortuosity
(twist/bend) and tapering after the branching from aorta. There is turbulence in blood
flow inside the coronary arteries because of high flow rate and tortuosity. The non-
dominant right coronary artery and their branches are shown in figure 1.3.
Figure 1.1: Coronary arteries of heart (http://my.clevelandclinic.org)
Univers
ity of
Mala
ya

4
Figure 1.2: Volume-rendered image of the left coronary artery (LCA)
Figure 1.3: Volume-rendered image of the right coronary artery (RCA)
The supply of blood to the heart muscles can get hindered leading to very serious
diseases such as atherosclerosis. The atherosclerosis is characterized by thickening of
Univers
ity of
Mala
ya
5
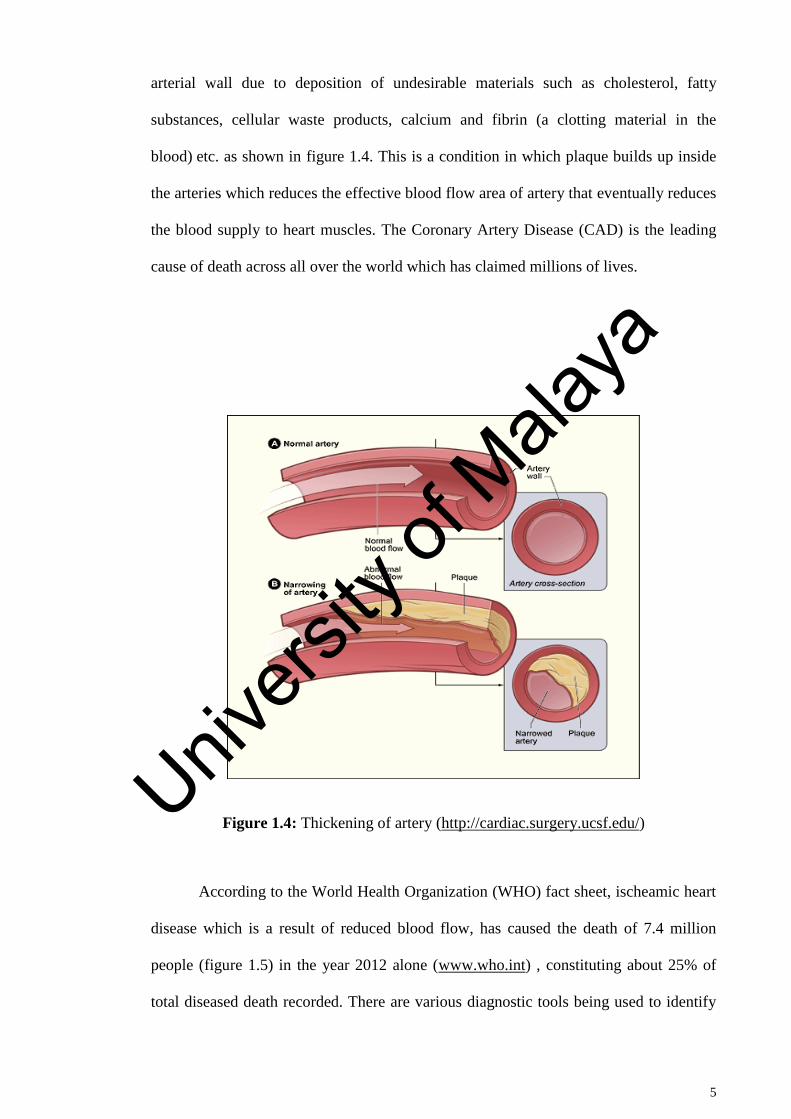
arterial wall due to deposition of undesirable materials such as cholesterol, fatty
substances, cellular waste products, calcium and fibrin (a clotting material in the
blood) etc. as shown in figure 1.4. This is a condition in which plaque builds up inside
the arteries which reduces the effective blood flow area of artery that eventually reduces
the blood supply to heart muscles. The Coronary Artery Disease (CAD) is the leading
cause of death across all over the world which has claimed millions of lives.
Figure 1.4: Thickening of artery (http://cardiac.surgery.ucsf.edu/)
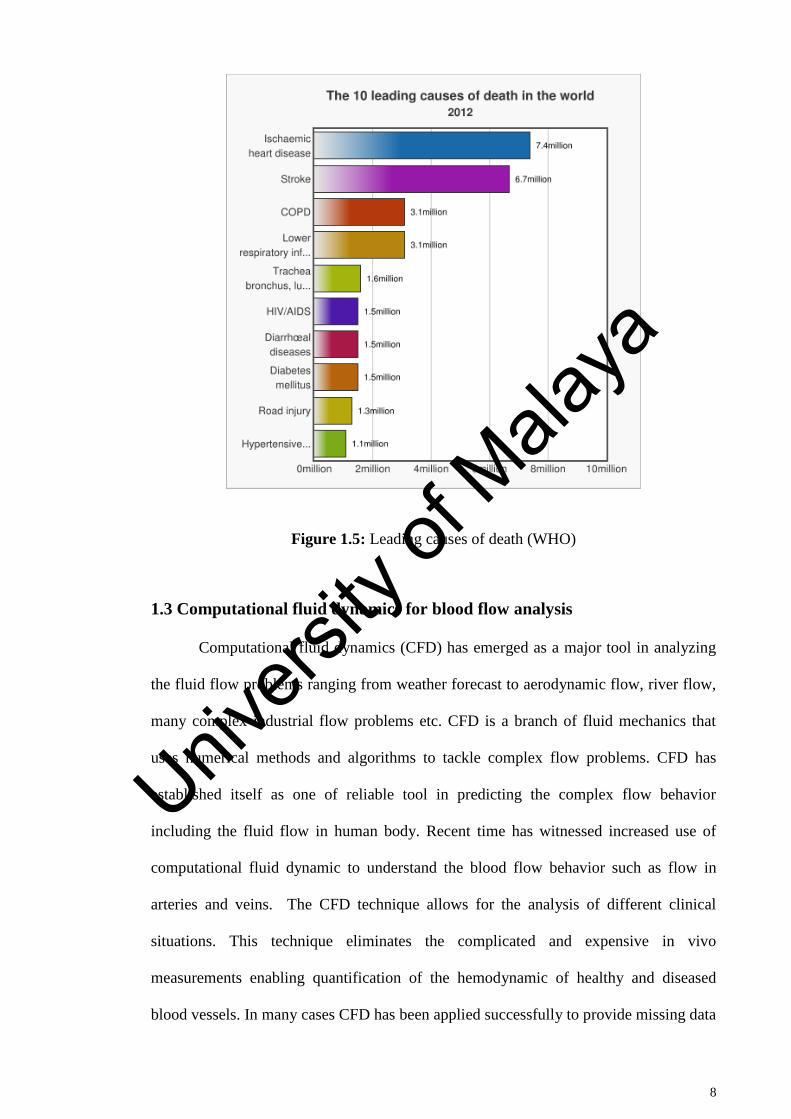
According to the World Health Organization (WHO) fact sheet, ischeamic heart
disease which is a result of reduced blood flow, has caused the death of 7.4 million
people (figure 1.5) in the year 2012 alone (www.who.int) , constituting about 25% of
total diseased death recorded. There are various diagnostic tools being used to identify
Univers
ity of
Mala
ya
6
the narrowing of arteries due to plaques which includes the coronary angiography,
Coronary computed tomographic angiogram (CCTA), intravascular ultrasound (IVUS)
etc. These techniques are handy in identifying the anatomical significance of stenosis
but do not provide any idea about functional significance of the stenosis. Thus a
technique based on fluid dynamics analysis namely Computational Fluid Dynamic
(CFD) is gaining popularity in assessing the flow dynamics of blood inside the arteries
which is proving to be a useful tool in clinical decision making.
For instance, the fractional flow reserve (FFR) is one of the important parameter
in assessing the functional severity of stenosis which is nothing but the ratio of
maximum myocardial flow in artery having stenosis to the maximum myocardial flow
had the stenosis been absent. This flow ratio is also expressed as the ratio of the distal
coronary pressure to the aortic pressure (N. H. Pijls et al., 1995; N. H. J. Pijls & Sels,
2012). Thus FFR has a value of 1 for normal person without stenosis. The measurement
of FFR in a clinical setting is carried out by inserting a guide wire in the vicinity of
stenotic area. However, it influences the measured value due to resistance offered by
guide wire. Here comes the advantage of using computational fluid dynamics that can
assess the required FFR without affecting the blood flow behavior.
It is believed that the blood flow behavior has more to offer in terms of
understanding of further thickening of stenosis and to indicate the vulnerable areas for
the formation of fresh stenosis which is difficult to assess with direct measurement
techniques. The detailed study of the gradual narrowing or bulging of the artery will
help in understanding the underlying mechanisms for such unusual behavior (Fung,
1984; Nichols, 1998). It has been found that the fluid mechanical forces due to the
interaction of the blood flow and the arterial wall have a strong influence on the
initiation and progression of narrowing or bulging of the artery (Alberto Figueroa C.,
2006). Clinical observations assisted by imaging techniques such as angiography,
Univers
ity of
Mala
ya
7
computed tomographic angiogram (CTA), Magnetic resonance angiography (MRA) or
duplex scanning does not provide sufficient and elaborated detailed insight into the
mechanisms of formation and development of stenosis (Bernsdorf & Wang, 2009). The
available imaging techniques today have their own limitations though they are useful for
primary investigation.
These techniques are very useful in understanding the anatomy of various
abnormalities taken place on arteries but fail to give realistic blood flow behavior
specially in terms of secondary variables such as shear stress, gradients and also in
identifying the fluid circulation regions that are crucial to predict the futuristic
development of such abnormalities or in predicting the functional severity of those
abnormalities. Thus an alternate route that of computational fluid dynamics is followed
by many researchers to study the hemodynamic (blood dynamics) characteristics under
various conditions. It is important to note that the CFD is completely noninvasive
technique that can answer many questions related to hemodynamic behavior. The
beauty of CFD lies in answering many what if scenarios arising from questions related
to geometric changes in abnormalities (such as stenosis) or the physical condition that
the patient may come across during the lifetime. It provides a clear picture of
hemodynamic that in conjunction with the imaging techniques can prove to be a great
asset in diagnosis and treatment of coronary artery or any other artery disease. It is
observed from current state of literature in the field of hemodynamic of coronary artery
that there is not enough information available pertaining to specific area stenosis size
such as 70%, 80% and 90%. These area stenosis sizes can be fatal to patients and poses
huge dilemma to clinicians to decide about the treatment process to be adopted.
Univers
ity of
Mala
ya
8
Figure 1.5: Leading causes of death (WHO)
1.3 Computational fluid dynamics for blood flow analysis
Computational fluid dynamics (CFD) has emerged as a major tool in analyzing
the fluid flow problems ranging from weather forecast to aerodynamic flow, river flow,
many complex industrial flow problems etc. CFD is a branch of fluid mechanics that
uses numerical methods and algorithms to tackle complex flow problems. CFD has
established itself as one of reliable tool in predicting the complex flow behavior
including the fluid flow in human body. Recent time has witnessed increased use of
computational fluid dynamic to understand the blood flow behavior such as flow in
arteries and veins. The CFD technique allows for the analysis of different clinical
situations. This technique eliminates the complicated and expensive in vivo
measurements enabling quantification of the hemodynamic of healthy and diseased
blood vessels. In many cases CFD has been applied successfully to provide missing data
Univers
ity of
Mala
ya

9
that cannot be obtained by experimental means such as Wall Shear Stress (WSS)
distribution and many other hemodynamic parameters that has led to improved clinical
decision-making
1.4 Aims and Objectives
In the light of available literature explained in chapter 2, the following
objectives are set to investigate the hemodynamic of coronary artery disease.
1. To investigate the effect of different geometrical shapes of stenosis in
coronary artery on the hemodynamics and diagnostic parameters.
2. To study the influence of angle of curvature in coronary artery on the
hemodynamic parameters such as wall pressure, pressure gradient, velocity
and wall shear stress.
3. To study the effect of stenosis in a realistic patient left coronary artery on the
blood flow behavior.
4. To investigate the effect of different degree of stenosis on hemodynamic
parameters in left coronary artery.
5. To study the influence of multi stenosis on the hemodynamic parameters in
realistic left coronary artery.
1.5 Scope of Study
The current work is focused to investigate the hemodynamic characteristics of
blood flow in a diseased left coronary artery (LCA) using computational fluid
dynamics. The present research work initially started with an idealized computer aided
Univers
ity of
Mala
ya
10
design model of 3D coronary artery which was subjected to various shapes of stenosis
(Elleptical, Trapezoidal and triangular), as well as the curvature angles (300
600
, 900 and
1200
). Further, the research continues to evaluate the hemodynamic behavior as well as
diagnostic parameters of blood inside a patient specific realistic artery subjected to
various higher degrees of stenosis i.e. 70%, 80% and 90% area stenosis, created in the
main left coronary artery. Further investigation is carried out to judge the effect of
multiple stenosis in various degrees along the sub branches of left coronary artery. A
total of 10 models of multi-stenosis are investigated. The scope of study is limited to
higher degree of area stenosis i.e. 70%, 80% and 90% subjected to hyperemic condition.
1.6 Organization of Thesis
This thesis has been presented in 5 chapters that systematically explain the
objectives of this thesis research. The description of each chapter is as follows:
The first chapter describes a comprehensive background about the physiological
functions, anatomy and diseases of coronary artery. The objectives and scope are also
presented in the introduction chapter.
Chapter 2 provides an extensive background of this study with reviewing
literature of most relevant literature in this field.
In the third chapter governing equation of blood flow in left coronary artery,
with the modeling of realistic coronary artery model by CT scan data and solution
methodology obtained in detail.
Chapter 4 is important part of this thesis describes the detailed investigation of
blood flow in coronary artery with different shapes of stenosis, varying the angle of
Univers
ity of
Mala
ya

11
curvature, and various degrees of stenosis were presented. Chapters 5, provides the
conclusion and recommendations for the future works.
Univers
ity of
Mala
ya
12
CHAPTER 2: LITERATURE REVIEW
2.1 Introduction
The immense research in the field of hemodynamic during the last few decades
shows its importance as evident by extensive amount of research carried out by eminent
researchers. The purpose of this chapter is to provide some of the related information
regarding the research being carried out pertaining to blood flow analysis in various
arteries by different researchers across the world.
Human heart is extremely important organ in the human body that supplies the
blood throughout the body that in turn carries the oxygen and other nutrition vital for
the development and sustenance of human body. Heart is typically made up of four
chambers such as right atrium, left atrium, right ventricle and left ventricle (Myer,
2003).
There are two distinct mode of heart pumping namely systole and diastole. The systole
and diastole takes place with perfect synchronisation for a normal heart. Contraction of
the ventricular myocardium ejects blood into the aorta and pulmonary arteries. The
heart has many valves that regulate the flow in one direction from one chamber to
another and between chambers and arteries. In diastole phase, the arterial contracts that
results into blood being pumped from left and right atrium to the left and right ventricles
whereas in the systolic phase, ventricles contract causing the blood to be pumped from
right ventricle to lungs through pulmonary artery and left ventricle to aorta. During
systole, the blood flows to different organs through aorta. However, flow to coronary
arteries is blocked by aortic valve during systole thus flow to these arties is achieved
during diastole phase of cardiac cycle. The heart itself is comprised of tissues like other
body parts and it too requires blood supply to keep functioning. The interruption of
blood supply to the heart leads to serious consequences leading to death of the person in
Univers
ity of
Mala
ya
13
most of the cases. Myocardial infarction which is known as heart failure in layman
terminology is caused by blockages in the coronary arteries and this is major fatal
disease in the world.
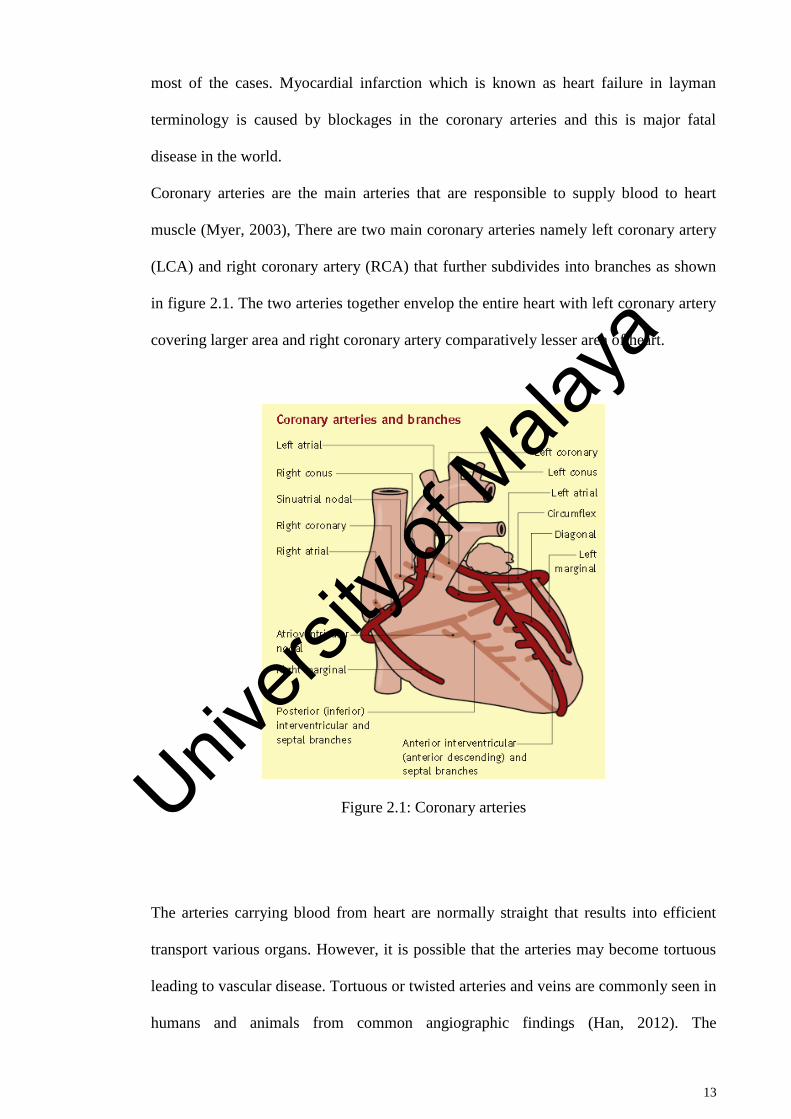
Coronary arteries are the main arteries that are responsible to supply blood to heart
muscle (Myer, 2003), There are two main coronary arteries namely left coronary artery
(LCA) and right coronary artery (RCA) that further subdivides into branches as shown
in figure 2.1. The two arteries together envelop the entire heart with left coronary artery
covering larger area and right coronary artery comparatively lesser area of heart.
Figure 2.1: Coronary arteries
The arteries carrying blood from heart are normally straight that results into efficient
transport various organs. However, it is possible that the arteries may become tortuous
leading to vascular disease. Tortuous or twisted arteries and veins are commonly seen in
humans and animals from common angiographic findings (Han, 2012). The
Univers
ity of
Mala
ya
14
hemodynamic analysis of flow in the arteries has been a quite involved task due to such
a complex geometry and flow mechanism of heart. There are many Computational fluid
dynamics models being developed over the years to deal with hemodynamic of arteries.
Several finite-element structural models were also developed in order to address the
nonlinearities arising due to material and geometry of valves etc, (D Bluestein & Einav,
1993; Danny Bluestein, Einav, & Hwang, 1994). The following sections further
elaborate the research being dedicated to study the hemodynamic of heart.
2.2 Numerical methods of blood flow in arteries
Numerical study has become an essential part of any research activity covering a
wide range of human knowledge. This is particularly true for the case of scientific
studies that are plagued by too much complexity in geometry involved or the difficult
boundary conditions of complex problems. Hemodynamic is one such field that has
been immensely benefitted by employing the techniques originating from numerical
mathematics. Numerical Study is extensively used in biomechanics in recent years to
have a better understanding of blood flow in the human body due to the intricacy
involved in the vessel geometry as well as the complex hemodynamic mechanism
(Botar et al., 2009; Brosig et al., 2014; Byun & Rhee, 2004; Jhunjhunwala, et al, 2015;
Jung & Hassanein, 2008; Leuprecht, et al. 2002; Lorenzini & Casalena, 2008). Among
the numerical techniques, finite volume method is most popular and adopted technique
for hemodynamic study. These techniques deal with the governing Navier Stokes
equations which are too difficult to solve thus most of the numerical studies being
carried out revolve around the sophisticated software that has helped immensely in
tackling such complex phenomenon. These techniques essentially require that the actual
domain be divided into a number of smaller segments generally known as elements. The
governing equations are applied to these small segment of the whole domain and the
Univers
ity of
Mala
ya
15
continuous solution is obtained over entire set of elements that provide continuity at the
nodal points. These numerical techniques are well coded into a number of software
tools. Among the available software, it can be concluded that the most popular are
ANSYS CFX (Alishahi, et al. 2011; Chaichana, et al., 2011, 2013a, 2014; George et al.,
2008; Toloui, et al. 2012) and Fluent (Andersson, et al., 2000; Botar et al., 2009; Byun
& Rhee, 2004; Keshavarz-Motamed & Kadem, 2011; Li, Beech-Brandt, et al., 2007;
Paul & Larman, 2009; Sinha Roy, et al., 2006; Soulis, et al., 2006; Su et al., 2014;
Zhang et al., 2012). Apart from the CFX and Fluent, there are other codes such as
Comsol Multi-physics (Lorenzini & Casalena, 2008). Few researchers have developed
simplified mathematical models to address a specific issue of blood flow in the artery.
For instance a mathematical model is developed by Ai and Vafai (Ai & Vafai, 2006)
that low-density lipoproteins (LDL), in the blood stream and in the arterial walls by
making use of coupled analysis of the transport of macromolecules, This was made
possible by using the advection–diffusion equations of porous media to model the
species field in the arterial wall layers. The model is used to simulate the LDL transport
in a stenosed artery with various area reductions and stenosis numbers. It is claimed that
the above model has advantage of reliable results. There are other efforts also to
evaluate the blood flow in artery such as that of Ikbal (Ikbal, 2012) to develop a two-
dimensional mathematical model of viscoelastic fluid characterised by generalised
Oldroyd-B fluid. Mustapha et al. (Mustapha, Mandal, Johnston, & Amin, 2010)
developed a mathematical model of blood flow through an arterial segment with a
couple of stenosis having surface irregularities. The governing equations of motion were
solved by MAC (Marker and Cell) method.
2.2.1 Anatomy of arteries
The human vessels are too complex when it comes to analysing the geometrical
aspect. Though the vessels are nearly cylindrical in geometry but, processes a huge web
Univers
ity of
Mala
ya
16
of tiny cylindrical passages that allows the blood to flow efficiently to all required
regions. In general, the main coronary arteries of heart have a diameter of roughly 1.5 to
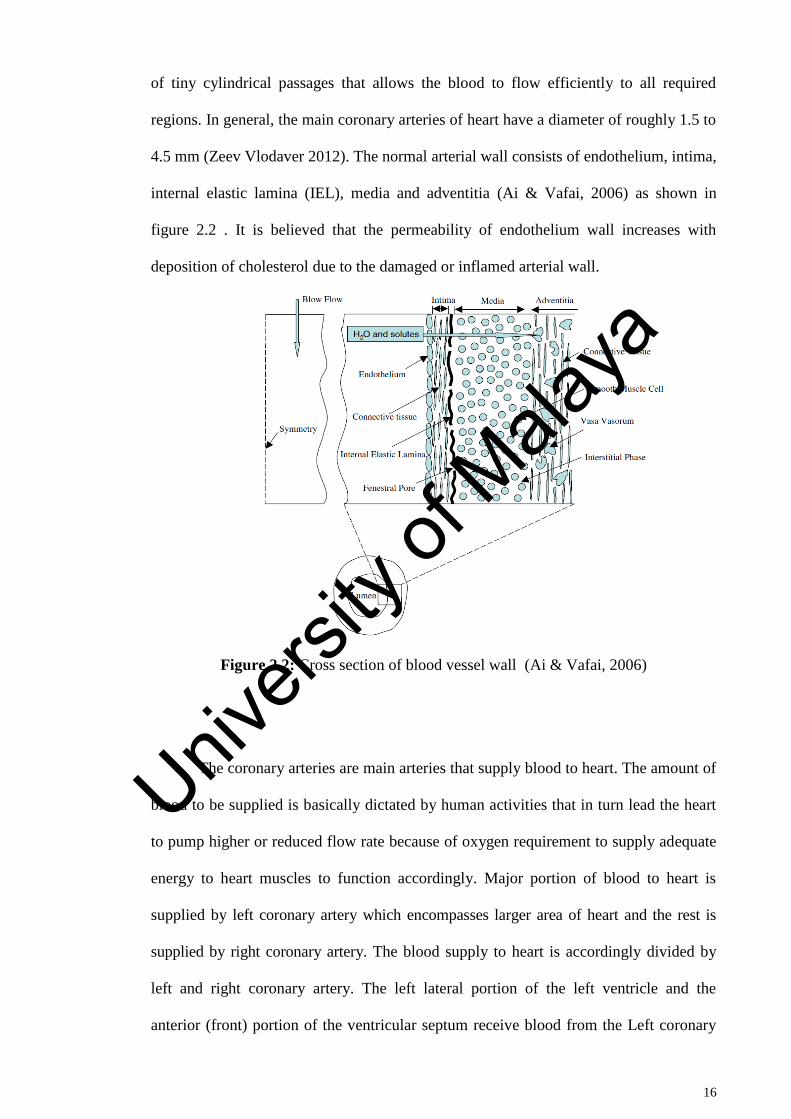
4.5 mm (Zeev Vlodaver 2012). The normal arterial wall consists of endothelium, intima,
internal elastic lamina (IEL), media and adventitia (Ai & Vafai, 2006) as shown in
figure 2.2 . It is believed that the permeability of endothelium wall increases with
deposition of cholesterol due to the damaged or inflamed arterial wall.
Figure 2.2: Cross section of blood vessel wall (Ai & Vafai, 2006)
The coronary arteries are main arteries that supply blood to heart. The amount of
blood to be supplied is basically dictated by human activities that in turn lead the heart
to pump higher or reduced flow rate because of oxygen requirement to supply adequate
energy to heart muscles to function accordingly. Major portion of blood to heart is
supplied by left coronary artery which encompasses larger area of heart and the rest is
supplied by right coronary artery. The blood supply to heart is accordingly divided by
left and right coronary artery. The left lateral portion of the left ventricle and the
anterior (front) portion of the ventricular septum receive blood from the Left coronary
Univers
ity of
Mala
ya
17
artery. Whereas the right ventricle, the posterior wall of the left ventricle and posterior
third of the septum is supplied by right coronary artery (Ramanathan & Skinner, 2005).
The blood flow to heart muscles get hindered due to reducing of artery flow area caused
by deposition of undesirable material thus forming a block or stenosis (Ahmed, 1998;
Chaichana, et al., 2012; Chaichana et al., 2013a, 2014; Chakravarty & Mandal, 2000; Liu,
2007; Long, Xu, et al., 2001; Melih Guleren, 2013; Mustapha et al., 2010; Zeev Vlodaver
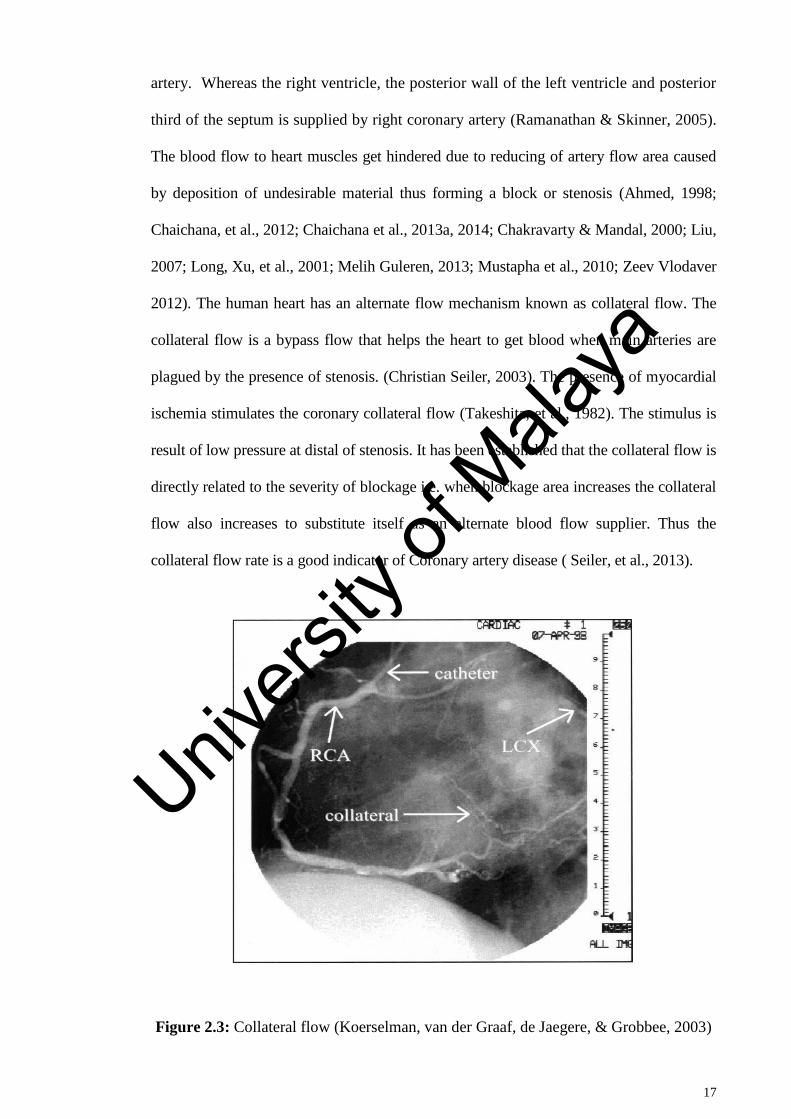
2012). The human heart has an alternate flow mechanism known as collateral flow. The
collateral flow is a bypass flow that helps the heart to get blood when main arteries are
plagued by the presence of stenosis. (Christian Seiler, 2003). The presence of myocardial
ischemia stimulates the coronary collateral flow (Takeshita, et al., 1982). The stimulus is
result of low pressure at distal of stenosis. It has been established that the collateral flow is
directly related to the severity of blockage i.e. when blockage area increases the collateral
flow also increases to substitute itself as an alternate blood flow supplier. Thus the
collateral flow rate is a good indicator of Coronary artery disease ( Seiler, et al., 2013).
Figure 2.3: Collateral flow (Koerselman, van der Graaf, de Jaegere, & Grobbee, 2003)
Univers
ity of
Mala
ya
18
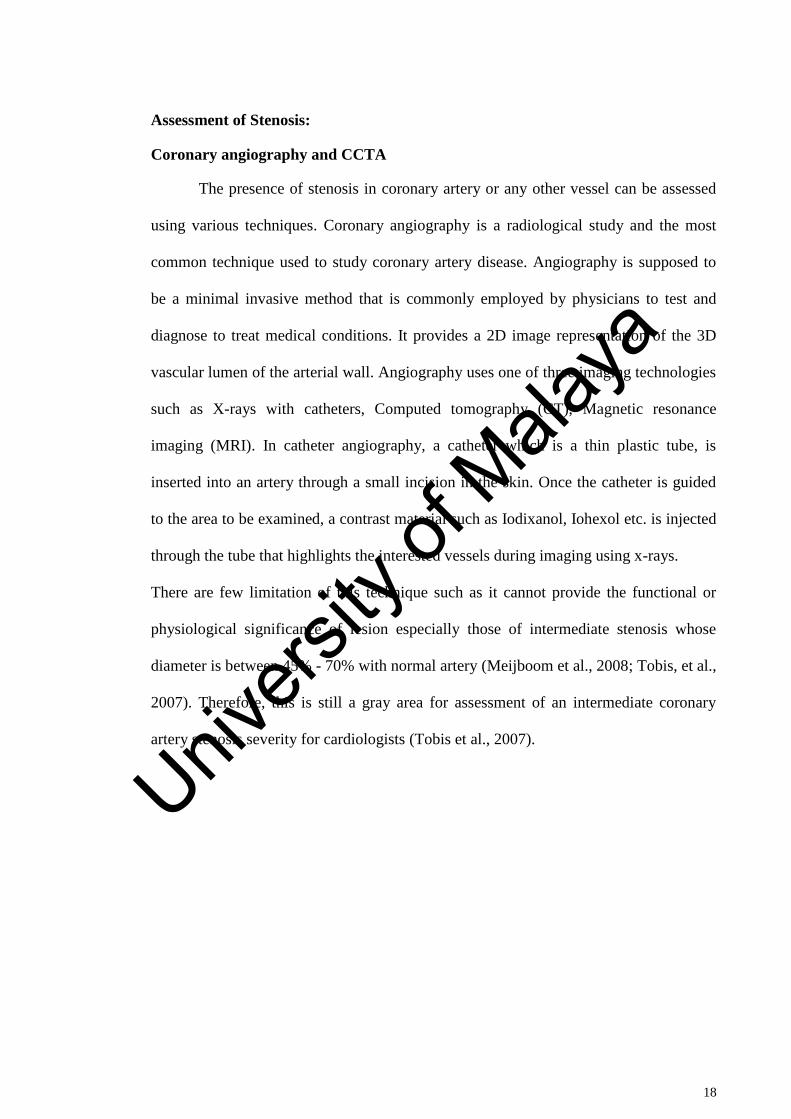
Assessment of Stenosis:
Coronary angiography and CCTA
The presence of stenosis in coronary artery or any other vessel can be assessed
using various techniques. Coronary angiography is a radiological study and the most
common technique used to study coronary artery disease. Angiography is supposed to
be a minimal invasive method that is commonly employed by physicians to test and
diagnose to treat medical conditions. It provides a 2D image representation of the 3D
vascular lumen of the arterial wall. Angiography uses one of three imaging technologies
such as X-rays with catheters, Computed tomography (CT), Magnetic resonance
imaging (MRI). In catheter angiography, a catheter which is a thin plastic tube, is
inserted into an artery through a small incision in the skin. Once the catheter is guided
to the area to be examined, a contrast material such as Iodixanol, Iohexol etc. is injected
through the tube that highlights the interested vessels during imaging using x-rays.
There are few limitation of this technique such as it cannot provide the functional or
physiological significance of lesion especially those of intermediate stenosis whose
diameter is between 45% - 70% with normal artery (Meijboom et al., 2008; Tobis, et al.,
2007). Therefore, this is still a gray area for assessment of an intermediate coronary
artery stenosis severity for cardiologists (Tobis et al., 2007).
Univers
ity of
Mala
ya
19
Figure 2.4: Coronary angiography (http://coronary-angiography.purzuit.com/)
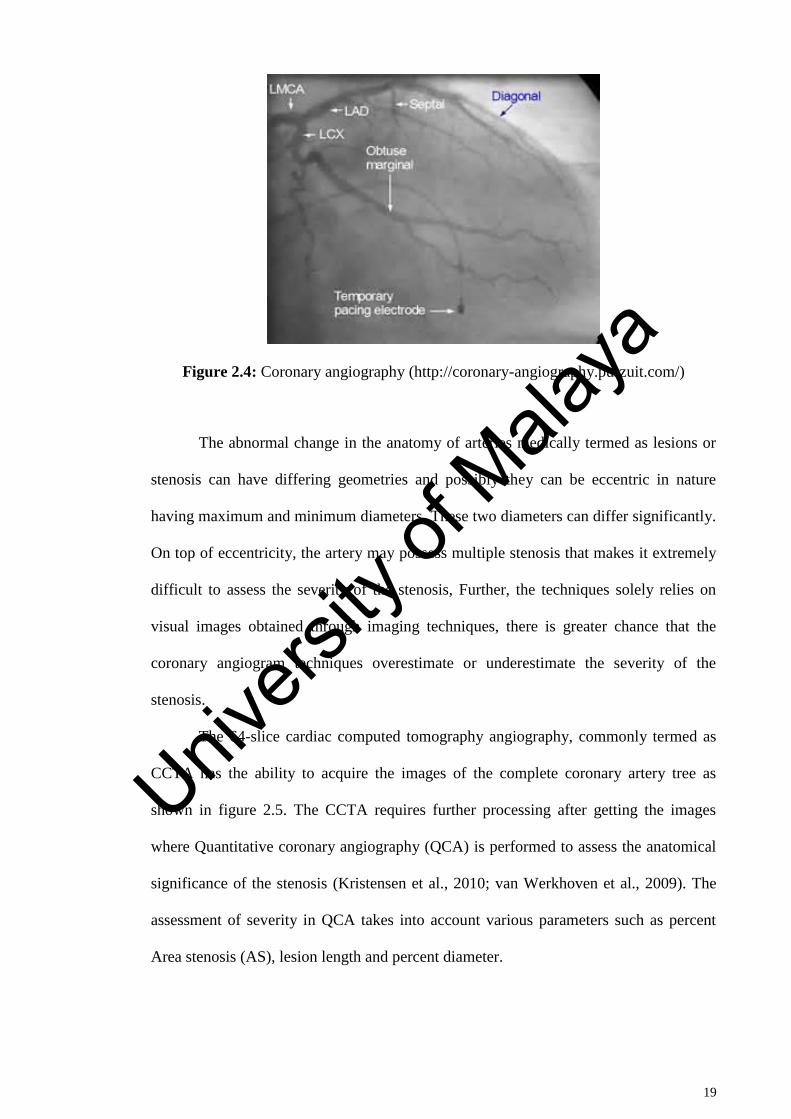
The abnormal change in the anatomy of arteries medically termed as lesions or
stenosis can have differing geometries and possibly they can be eccentric in nature
having maximum and minimum diameters. These two diameters can differ significantly.
On top of eccentricity, the artery may possess multiple stenosis that makes it extremely
difficult to assess the severity of the stenosis, Further, the techniques solely relies on
visual images obtained through imaging techniques, there is greater chance that the
coronary angiogram techniques overestimate or underestimate the severity of the
stenosis.
The 64-slice cardiac computed tomography angiography, commonly termed as
CCTA has the ability to acquire the images of the complete coronary artery tree as
shown in figure 2.5. The CCTA requires further processing after getting the images
where Quantitative coronary angiography (QCA) is performed to assess the anatomical
significance of the stenosis (Kristensen et al., 2010; van Werkhoven et al., 2009). The
assessment of severity in QCA takes into account various parameters such as percent
Area stenosis (AS), lesion length and percent diameter.
Univers
ity of
Mala
ya
20
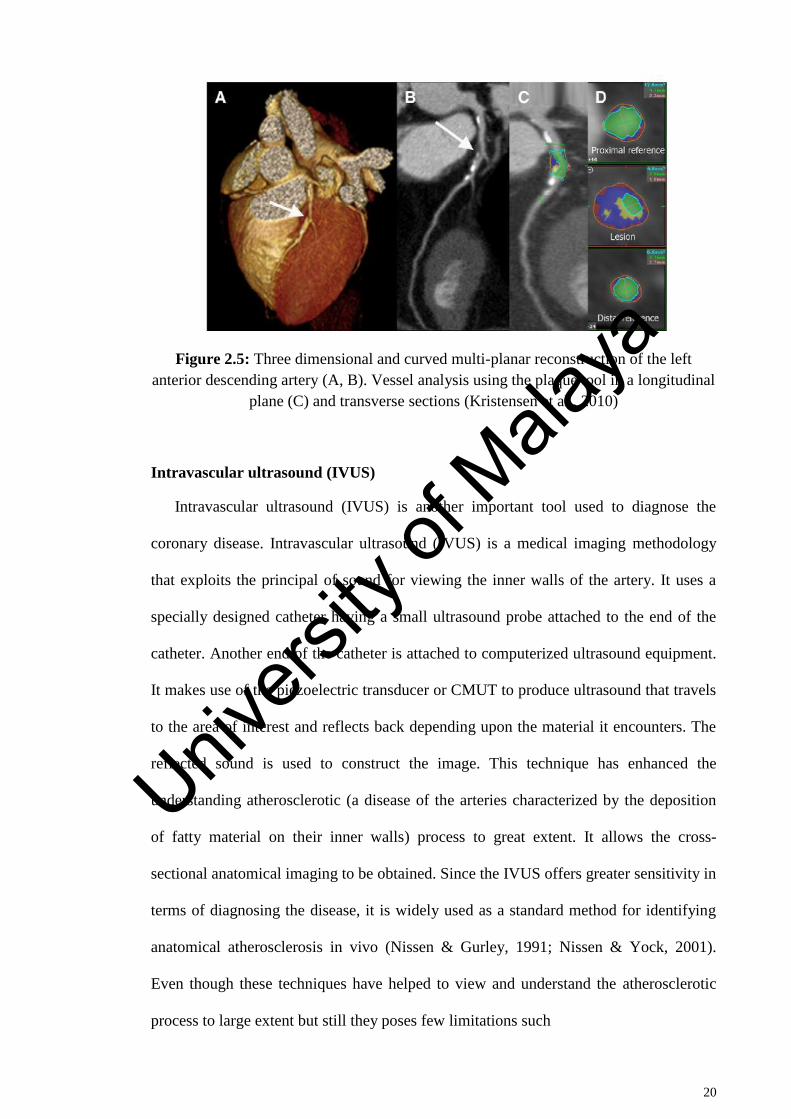
Figure 2.5: Three dimensional and curved multi-planar reconstruction of the left
anterior descending artery (A, B). Vessel analysis using the plaque tool in a longitudinal
plane (C) and transverse sections (Kristensen et al., 2010)
Intravascular ultrasound (IVUS)
Intravascular ultrasound (IVUS) is another important tool used to diagnose the
coronary disease. Intravascular ultrasound (IVUS) is a medical imaging methodology
that exploits the principal of sound for viewing the inner walls of the artery. It uses a
specially designed catheter having a small ultrasound probe attached to the end of the
catheter. Another end of the catheter is attached to computerized ultrasound equipment.
It makes use of the piezoelectric transducer or CMUT to produce ultrasound that travels
to the area of interest and reflects back depending upon the material it encounters. The
reflected sound is used to construct the image. This technique has enhanced the
understanding atherosclerotic (a disease of the arteries characterized by the deposition
of fatty material on their inner walls) process to great extent. It allows the cross-
sectional anatomical imaging to be obtained. Since the IVUS offers greater sensitivity in
terms of diagnosing the disease, it is widely used as a standard method for identifying
anatomical atherosclerosis in vivo (Nissen & Gurley, 1991; Nissen & Yock, 2001).
Even though these techniques have helped to view and understand the atherosclerotic
process to large extent but still they poses few limitations such
Univers
ity of
Mala
ya
21
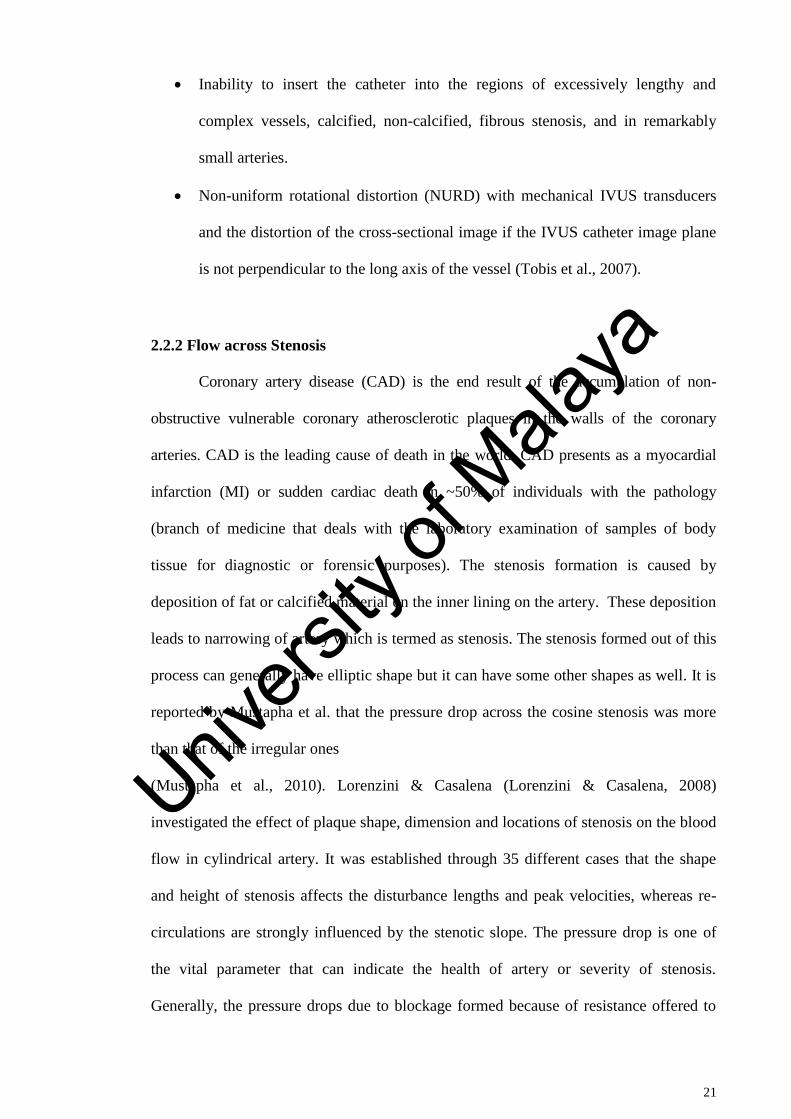
Inability to insert the catheter into the regions of excessively lengthy and
complex vessels, calcified, non-calcified, fibrous stenosis, and in remarkably
small arteries.
Non-uniform rotational distortion (NURD) with mechanical IVUS transducers
and the distortion of the cross-sectional image if the IVUS catheter image plane
is not perpendicular to the long axis of the vessel (Tobis et al., 2007).
2.2.2 Flow across Stenosis
Coronary artery disease (CAD) is the end result of the accumulation of non-
obstructive vulnerable coronary atherosclerotic plaques in the walls of the coronary
arteries. CAD is the leading cause of death in the world. CAD presents as a myocardial
infarction (MI) or sudden cardiac death in ~50% of individuals with the pathology
(branch of medicine that deals with the laboratory examination of samples of body
tissue for diagnostic or forensic purposes). The stenosis formation is caused by
deposition of fat or calcified material on the inner lining on the artery. These deposition
leads to narrowing of artery which is termed as stenosis. The stenosis formed out of this
process can generally have elliptic shape but it can have some other shapes as well. It is
reported by Mustapha et al. that the pressure drop across the cosine stenosis was more
than that of the irregular ones
(Mustapha et al., 2010). Lorenzini & Casalena (Lorenzini & Casalena, 2008)
investigated the effect of plaque shape, dimension and locations of stenosis on the blood
flow in cylindrical artery. It was established through 35 different cases that the shape
and height of stenosis affects the disturbance lengths and peak velocities, whereas re-
circulations are strongly influenced by the stenotic slope. The pressure drop is one of
the vital parameter that can indicate the health of artery or severity of stenosis.
Generally, the pressure drops due to blockage formed because of resistance offered to
Univers
ity of
Mala
ya
22
blood flow due to stenosis. This is true for all types of vessels whether coronary or any
other artery such as renel artery etc. ( Kagadis et al., 2008).
The pressure drop of eccentric stenosis could be higher than that of concentric
stenosis (Melih Guleren, 2013). According to Melih Guleren, the pressure drop for
eccentric was found to be 17% as opposed to 9% of concentric 75% occlusion (the
blockage or closing of a blood vessel). An asymmetric shape and surface could produce
different effect as compared to symmetric stenosis. It is seen that for stenosis in artery
of 40% area occlusion, at low Reynolds number the flow resistance is practically
unaffected by surface irregularities. Whereas an increase in pressure drop of 10% was
observed for smooth stenosis for higher Reynolds number (Andersson et al., 2000). The
shape of stenosis plays a vital role in determining the pressure and flow characteristics.
The disturbance in length and peak velocities is mainly affected by shape and height of
stenosis (Lorenzini & Casalena, 2008). It is also reported that the trapezium plaques
shape geometries are the most sever pathologies as they favour higher stain and further
more chances of depositions on the walls of artery.
Zhang et al. (Zhang et al., 2012) investigated the 3D sinusoidal pulsatile blood
flow through the models of internal carotid artery with different geometries by
computational simulation. They found low and high oscillatory wall shear stress in three
preferred areas in carotid artery. They concluded that the curvature and planarity of
blood vessel plays a significant role in the flow pattern in internal carotid artery siphon.
The rheological properties of blood also affect the flow pattern significantly (Tu &
Deville, 1996). It is believed that the pulsatile and harmonic flow produces similar flow
behaviour which was demonstrated by considering these two flow types for same
volume stroke (Zendehbudi & Moayeri, 1999) for stenosed artery of 61% area
reduction. The pulsatile blood flow in coronary arteries is reported by few other authors
as well using the non-Newtonian and Newtonian model (Johnston, et al., 2006). Their
Univers
ity of
Mala
ya
23
study showed that the non-Newtonian model is more appropriate than the Newtonian
model to study the blood flow in detail. The non-Newtonian flow model is quite
popular in studying the blood flow behaviour. The effect of non-Newtonian property of
blood flow through stenosed artery (Ishikawa, et al., 1998) revealed that at high Stokes
and Reynolds numbers, strength of vortex at downstream of stenosis was reduced by the
property of non-Newtonian blood provided that the flow is stagnant. Ikbal (Ikbal, 2012)
defined a mathematical model of Non-Newtonian blood flow through stenotic artery
under unsteady conditions. A numerical study of Newtonian and six non-Newtonian
viscosity models for 30% and 60% stenosis carotid artery (Razavi, et al., 2011) under
transient condition showed some variations in results. It was reported that the velocity
and wall shear stress for power-law model has more deviation than the other models.
The area reduction of stenosis is quite difficult to judge thus different authors have
considered even irregular area reduction. One such example is observed in the study of
Manimaran (Manimaran, 2011) who studied Non-Newtonian blood flow in arterial
stenosis of 48% area occlusion to investigate the surface irregularities of stenosis. It was
noticed that at low Reynolds number the pressure drop across the stenosis was
unaffected by surface irregularities. There have been efforts to develop an analytical
expression for skin-friction and flow resistance using a non-Newtonian blood flow
model through a stenosed artery (Misra & Shit, 2006). It is found that the maximum
value of skin friction and flow resistance was observed at the throat of the stenosis and
minimum at the end of the stenosis. It was also noticed that increase in the stenosis
height increases the skin friction and flow resistance. The heat and mass transfer along
with Sherwood number is also a function stenosis shape as suggested in a
non-Newtonian blood flow through different shapes of stenotic arteries (Chakravarty &
Mandal, 2009). It is found that the flow pattern, heat and mass transfer, wall shear stress
and Sherwood number strongly depends on the shape of stenosis. Maximum Sherwood
Univers
ity of
Mala
ya
24
number and the high shear stress was observed at the throat of the stenosis, and the
formation of several recirculation zones are observed that may further develop the
disease in the downstream vicinity from the stenosis. There are few other parameters
such as bifurcations in the artery, the curvature, magnetic field etc. which have profound
effect on flow characteristics. Across bifurcations in regions opposite the flow dividers,
a low wall shear stress was observed (Soulis et al., 2006). These sites are anatomically
predisposed for atherosclerotic development. A rang of 0.75 to 2.25 N/m2
low wall
shear stress was found on the left main coronary artery bifurcation opposite to the flow
divider. Three dimensional diseased and normal left anterior descending (LAD) arterial
tree of porcine was modelled by Su et al. (Su et al., 2014) to investigate the effect of
stenosis on the blood flow and haemodynamic parameters. The anatomical model was
extracted from computed topography of heart of the porcine. The results show that more
than 75% area reduction stenosis affect the pressure drop and total flow rate in
bifurcation and branched arteries.
The flow pattern gets modified by the presence of magnetic field and increases
the heat transfer rate as seen in a mathematical model of multi stenosis subjected to
static magnetic field (Tashtoush & Magableh, 2008). It’s further revealed that thermal
boundary layer thickness and temperature gradient was increased by magnetic field
torque. The secondary flow pattern gets significantly affected by the presence of non-
uniform magnetic field (Kenjereš, 2008). The flow separation zone occurs mostly
towards the downstream of the irregular shape multi-stenosis subjected to magnetic
field (Mustapha, et al., 2009).
The spiral flows too have influence on flow characteristics. The effect of spiral
blood flow in a 3 dimensional stenosed artery model with 75% area reduction was
Univers
ity of
Mala
ya
25
investigated by Paul & Larman (Paul & Larman, 2009). They found that an increase in
both the total pressure and velocity of the blood due to spiral flow for Re=500. A
significant difference was also observed between the wall shear stress of spiral and non-
spiral flows downstream of stenosis. The most effect of spiral flow was on the
tangential component of the velocity which increases with the increase in spiral flow
speed.
A numerical study was conducted to study the effect of rotation on blood flow with
different angular velocities by Sung et al. (Sung, Ro, & Ryou, 2009). The Non-
Newtonian Carreau model was used to represent the flow of blood, and pulsatile
velocity profile was employed at the inlet. The results show that flow recirculation zone
contracts and its duration was decreased as compared to the no rotation case. And also
wall shear stress of no rotation case was twice smaller for the than that of rotation case.
2.3 Blood flow analysis in tapered arteries
Some of the arteries could be considered as tapered in geometry that further
complicates the blood flow behaviour. It is observed that the velocities through the
converging tapered artery are less than those in the non-tapered artery under stenotic
conditions and the diverging tapered artery (Nadeem, et al., 2011). It is further noticed
that with an increase in the height and shape of stenosis velocity decreases while
increases with increases in tapering. A mathematical model of non-Newtonian blood
flow in tapered artery was developed by Ismail et al. (Ismail, et al., 2008) The effect of
tapering due to pulsatile nature of blood was studied by using the generalised power law
model. The governing equation of motion was solved by the finite difference scheme.
They found a lower values for the axial velocity profile, flow rate and wall shear stress
for tapering of artery while higher value for resistive impedances than Newtonian
Univers
ity of
Mala
ya
26
model. Similarly, Chakravarty & Mandal (Chakravarty & Mandal, 2000) developed a
two dimensional mathematical model of blood flow in presence of overlapping stenosis
in tapered arteries. The nonlinear term such as tapering angle was accounted in the
Navier-Stokes governing equation of blood flow. Their analytical model calculated the
axial and radial velocity profile with a low computational complexity. The irregular
stenosis of arterial segment was analytically studied by Chakravarty & Mandal
(Chakravarty & Mandal, 2005) and Kumar Mandal (Kumar et al., 2007) in other
studies. The results obtained for smooth shape stenosis and cosine shape stenosis
models shows well agreement with the existing literature. The Non-Newtonian blood
flow through tapered arteries with stenosis was numerically studied by Mandal (Mandal,
2005). The flow of blood was characterised by generalised power law model. The
Unsteady non-linear governing Navier-Stokes equation for flow was solved by finite
difference scheme. The analytical model evaluated the rate of flow, resistance
impedance and wall shear stress. The model is also employed to investigate the effect of
tapering and wall deformation, severity of stenosis with fixed length.
2.4 Blood flow analysis in curved arteries
It is well known that the flow through curve sections offers more resistance to
flow than the straight flow sections. The artery wall curvature substantiates the flow
resistance in that complicates the flow behaviour already affected by stenotic blockage.
The radius of curvature at a given point defines the degree to which the vessel deviates
from being straight. Thus, vessels with smaller radius of curvature (or larger curvature)
bend more sharply. It is noted that the blood while flowing across curved section forms
low velocity zones due to obstructions offered by curvature. Thus these areas are more
prone to formation of additional thrombus, stenosis and aneurysm, atherosclerosis as
well as other vascular diseases in curved arteries such as aortic arch, coronary artery and
Univers
ity of
Mala
ya
27
cerebral artery, though, from a macroscopic perspective, these vessels differ from each
other in dimension and shape (Calfon, et al., 2010; Huang, et al., 2010; Jou, et al., 2010;
Naruse & Tanishita, 1996; Shipkowitz, et al., 2000; Stroud, et al., 2000).The curvature
further decreases the pressure at the site of stenosis for a given stenosis severity. Hence
it is highly desirable to study the influence of artery wall curvature on the coronary
diagnostic parameter FFR, and CDP and LFC for a given stenosis severity from straight
artery to curved artery and identify a region of misdiagnosis when assessing the
anatomical significance of stenosis severity using FFR as a standard parameter. There is
some notable work in the area of artery curve such as Liu (Liu, 2007) who studied the
pulsatile blood flow pattern in the curved artery with stenosis by computational
simulation. The effect of stenosis on the haemodynamic parameters, such as flow
separation, wall shear stress and pressure drop was calculated. He found drastic changes
in the flow pattern of downstream region as the severity of stenosis reaches to a certain
level. He also reported the flow separation area and also observed area of low and
oscillating wall shear stress and blood pressure at the outer wall in downstream of the
artery. Leguy et al. (Leguy, et al., 2009) investigated the influence of curvature on the
velocity profile by computational fluid dynamics. Poiseuille, Womersley and cosine 𝜃
model was used to compare and calculate the blood volume flow. They found that for
radius of curvature of 50 and 100mm the time average blood volume flow was under
estimated by maximally 10.4% and 7.8% respectively for Poisuille and Womersley.
They concluded that velocity wave form at the position of the maximum rather than the
centre stream velocity wave form combined with the Womersley method should be
chosen.
The presence of catheter in curved artery seems to introduce additional errors in the
estimation of functional severity of stenosis. Krams et al. (Krams et al., 1999) carried
Univers
ity of
Mala
ya
28
out computational fluid dynamic study in a curved tube resembling coronary artery to
analyse the influence of the catheter placement inside a tube on the 3D velocity profile
by. They observed a redistribution of 3D axial velocity field away from the catheter and
also found increase in peak axial velocity, shear stress, and axial pressure drop, decrease
in peak secondary velocities. They concluded the presence of catheter in curved tube
significantly changes the velocity field and reduces the secondary patterns.
Keshavarz-Motamed & Kadem (Keshavarz-Motamed & Kadem, 2011)
developed a simplified model of aortic stenosis with coexisting coarctation of the aorta
to investigate the pulsatile blood flow. The model consisted of three severities of aortic
stenosis. The results demonstrated that a significant impact on the flow in curved pipe in
terms of secondary flow pattern, wall shear stress and pressure drop due to the
coexistence of both the pathological conditions and also appeared that presence of aortic
stenosis can lead to the overestimation of the severity of coarctation of the aorta. Wang
& Li (Wang & Li, 2011) presented a biomechanical behaviour of curved artery with
flexible wall was subjected to physiological conditions. They studied the effect of artery
curvature, flexibility on peak wall Von Mises stress, and distribution pattern in detailed.
They concluded from the findings that may provide the important individualized
treatment for patient with cardiovascular disease. Qiao et al. (Qiao, et al., 2004)
numerical studied the pulsatile blood flow in a S-shaped curved arteries with different
diameter. The finite element method was used to analyse the haemodynamic parameters
such as secondary flow, wall shear stress and pressure in the arteries. The results
represented more complex secondary flow in the large S-shaped curved artery than that
of the small diameter artery. They also observed the haemodynamic variables causes
most important effects on the arterial endothelium in the region, which leads to the
development of the cardiovascular diseases such as atherosclerosis.
Univers
ity of
Mala
ya
29
2.5 Blood flow analysis in bifurcation arteries
The arteries are designed so elegantly that they make branches at various
locations to move into various sections of the body in order to supply the blood. The
bifurcation of artery is other important geometrical parameter that has influence on the
blood flow behavior. A bifurcation lesion is a coronary artery narrowing that may occur
adjacent to, and/or involving the origin of a significant side branch. There are studies
that have established a correlation between plaque formation and the angulation of
coronary bifurcation (Sun & Cao, 2011). There are many procedures that are followed
to treat bifurcation lesions (Lefèvre et al., 2000; Yamashita et al., 2000), however no
clear information about which side branch lesion to be treated first after stenting the
main branch lesion. It is believed that the angiographic evaluation of the functional
significance of the stenosis severity in side branch lesions overestimate the functional
significance of the lesion and FFR may be useful in treating bifurcation lesions and it
is both safe and feasible (Koo et al., 2005). Different aspects of blood using various
models have been reported. For instance, a 3 dimensional rigid wall and deformable-
wall models are developed to simulate the arterial rigidity on wall shear stress by Toloui
et al. (Toloui et al., 2012). They studied the influence of blood on two different
rheological models (Newtonian and Carreau–Yasuda). They concluded that wall shear
stress distribution was greatly affected by the blood rheological model. Chen & Lu
(Chen & Lu, 2004) demonstrated the influence of Non- Newtonian property and plane
curvature in non-planar daughter vessel on the wall shear stress and flow phenomena.
The finite element method was used to solve the Navier-Stokes flow equations in three
dimensions. They observed the skewing of velocity profile towards outer wall creating
the low wall shear stress at the inner wall and found that the velocity profile shifts
Univers
ity of
Mala
ya
30
towards the flow divider in the downstream of bifurcation. In a further study by Chen &
Lu (Chen & Lu, 2006), the pulsatile nature of blood was accounted to investigate the
effect of Non- Newtonian property and plane curvature in non-planar daughter vessel in
bifurcating model. Their result shows a flattened velocity profile due to shear thinning
behaviour because of the Non Newtonian property of the fluid. Also found significant
differences between Newtonian and Non-Newtonian flow during the cycle.
Chaichana et al. (Chaichana et al., 2011) investigated the influence of angulation
of left coronary artery on the hemodynamic based on the simulated and realistic arteries
models. They developed twelve models consisting eight simulated and four realistic
models of coronary having left anterior descending and left circumflex branches. They
evaluated wall shear stress, velocity and wall pressure in simulated and realistic models.
Their results show the disturbed flow pattern in the models with the wider angulation
during the cardiac cycle. In the left bifurcation with wide angle low wall shear stress
gradient was observed. Similarly, the influence of blood viscosity in a small calibre
bifurcated artery on the hemodynamic parameters was numerically investigated by
Kanaris et al. (Kanaris, et al., 2012). The Casson model was used to calculate the
viscosity of blood. Their results demonstrated that as the viscosity increases the heart
also must increase the pumping power to keep output unchanged. The lower value of
wall shear stress was observed at the outer wall of the bifurcation.
The numerical investigation of blood flow dynamics through stenosed of subject
specified carotid bifurcation model was studied by Lee et al. (Lee, et al., 2008). The
spectral element method was used to simulate under the pulsatile inlet based on in-vivo
condition. Their results demonstrated the rapid fluctuation in the velocity and pressure
pattern in the transitional state in the post stenotic region of carotid artery. They also
Univers
ity of
Mala
ya
31
observed a high instantaneous wall shear stress within the stenosis during the systolic
compared to health carotid artery. They suggested that complex flow, turbulence and
biomechanical stresses could be predicted by this study. Alishahi et al. (Alishahi, M. et
al., 2011) developed a real model of stenosed abdominal aorta and iliac arteries to
evaluate the pulsatile flow and arterial wall behaviour. The models were developed by
extracting the data from CT scan images and simulated the flow and tissue interactions
are performed. Their results show maximum wall shear stress across the bifurcation
where the risk of particle deposition is more, also observed that pressure drop was lower
by 15% for the flexible model, as compared to rigid and complaint model.
2.6 Experimental studies on blood flow in arteries
There have been efforts to evaluate the blood flow behaviour using experimental
means to judge the functional significance of various flow characteristics. Some of the
studies that relied on experimental setup are those of (Ahmed, 1998; Ha & Lee, 2014; &
Schröder, et al. 2012) etc. An experimental study to investigate the blood flow
disturbance in downstream region of modelled stenosed rigid artery was conducted by
Ahmed (Ahmed, 1998). The velocity data for 25% 50% and 70% area reduction were
obtained from ensemble averaging techniques (phase-locked waveform). The results
indicated that the flow disturbances could be used as a powerful diagnosing tool in early
identify the cardio vascular diseases. Ha & Lee (Ha & Lee, 2014) investigated the effect
of spiral blood flow in axisymmetric stenosis model using particle image velocimetry
velocity field measurement technique and streak line flow visualization. The swirling
effect was achieved through two different helical pitches (10D and 10/3D) which have
been mounted before the stenosis. Their result shows that the length of recirculation
flow was reduced by spiral flow and also provokes the early break out of turbulent
intensity. They suggested that the effect of spiral flow would contribute to better
Univers
ity of
Mala
ya
32
understanding of the haemodynamic and diagnosis procedures for clinical treatments.
The effect of vessel elasticity on the flow was experimentally studied by Pielhop et al.
(Pielhop et al., 2012) using time-resolved image velocimetry combined with the
simultaneous evaluation of static pressure in elastic transparent vessel with the pulsatile
flow. They found an oscillation wall shear stress distribution in the region of plaque-
prone which induces the phenotype endothelial cells that supports the progression of
atherothrombotic lesion in downstream of the throat region.
The influence of downstream collaterals on the different diagnostic parameters
was experimentally studied by Peelukhana et al. (Peelukhana, Back, & Banerjee, 2009).
The FFR, CDP and LFC were evaluated for the different degree of stenosis and tested
for possible misinterpretation in the severity of stenosis for variable collateral flow.
Their result shows FFR and LFC increased from 0.74 to 0.77 and 0.58 to 0.62
respectively for the case of intermediate stenosis. CDP decreased from 47 to 42 for no
collateral to fully collateral flow. They suggested the variability in the diagnostic
parameters leads to the underestimation of stenosis severity.
2.7 Diagnostic parameters and their effects on hemodynamic
2.7.1 Fractional flow reserve (FFR)
The fractional flow reserve (FFR) is defined as the ratio of maximum blood flow
in a stenotic artery to maximum blood flow if the same artery was normal (Park et al.,
2012; N. H. Pijls et al., 1995).
va
vd
pp
ppFFR ~~
~~
(2.1)
where ap~ is the time averaged aortic pressure (mmHg), dp~ is the time averaged distal
Univers
ity of
Mala
ya
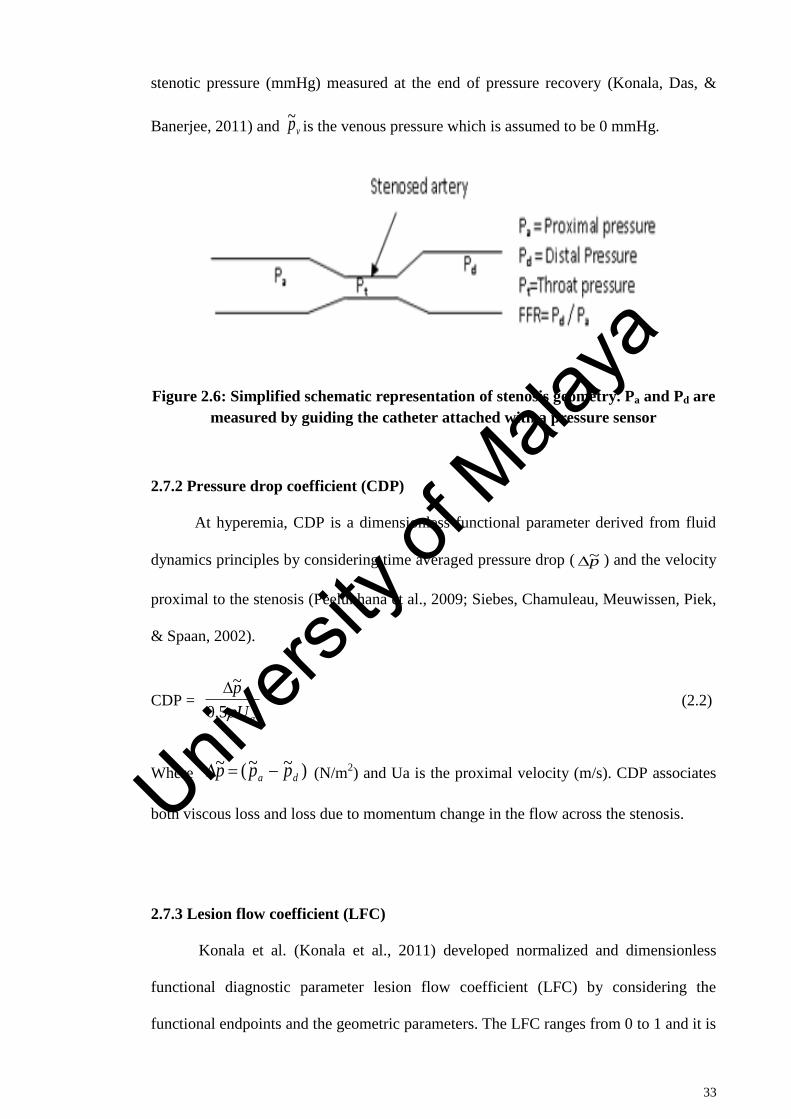
33
stenotic pressure (mmHg) measured at the end of pressure recovery (Konala, Das, &
Banerjee, 2011) and vp~ is the venous pressure which is assumed to be 0 mmHg.
Figure 2.6: Simplified schematic representation of stenosis geometry. Pa and Pd are
measured by guiding the catheter attached with a pressure sensor
2.7.2 Pressure drop coefficient (CDP)
At hyperemia, CDP is a dimensionless functional parameter derived from fluid
dynamics principles by considering time averaged pressure drop ( p~ ) and the velocity
proximal to the stenosis (Peelukhana et al., 2009; Siebes, Chamuleau, Meuwissen, Piek,
& Spaan, 2002).
CDP = 25.0
~
aU
p
(2.2)
Where )~~(~da ppp (N/m
2) and Ua is the proximal velocity (m/s). CDP associates
both viscous loss and loss due to momentum change in the flow across the stenosis.
2.7.3 Lesion flow coefficient (LFC)
Konala et al. (Konala et al., 2011) developed normalized and dimensionless
functional diagnostic parameter lesion flow coefficient (LFC) by considering the
functional endpoints and the geometric parameters. The LFC ranges from 0 to 1 and it is
Univers
ity of
Mala
ya
34
the ratio of percentage AS and the square root of CDP evaluated at the site of the
stenosis.
LFC = 2
)(5.0~haUp
ASpercentage
(2.3)
Where )( haU is the velocity at the site of the stenosis (m/s)
Many of the clinical studies show that a FFR value of ≤ 0.75 identifies ischemia-causing
coronary stenosis with an accuracy of 90% FFR is clinically well proven diagnostic
parameter (Pijls et al., 1995; Pijls & Sels, 2012). In the presence of stenosis, a cut-off
value of FFR <0.75 is almost able to induce myocardial ischemia, whereas FFR > 0.8
never associated with exercise-induced ischemia in a single vessel coronary artery
disease (CAD) as evident from the numerous clinical trials (De Bruyne et al., 2012; Pijls
et al., 1995; Pijls et al., 2010; Tonino et al., 2009) which indicates that the grey zone for
FFR is between 0.75 and 0.80 (Park et al., 2012) that falls under the intermediate area
stenosis.
The coronary diagnostic parameters FFR, CFR, and CDP were experimentally
investigated by Goswami et al. (Goswami, et al., 2013) for the variation with diameters
and vascular conditions with guide wire inserted into the coronary artery. The
diagnostic parameters calculated for mild (64% area reduction), intermediate (80% area
reduction) and sever (90% area reduction) for 2.5 mm and 3mm diameter arteries. They
observed that for the case of mild and intermediate stenosis arterial diameter does not
effect on FFR but varies for sever condition. And also found a variation in the CDP for
the various diameters of arteries. They suggested CDP holds good for functional
assessment of stenosis severity in clinical setting. The effect of lesion length on the
hemodynamics and the diagnostic parameters was presented by brosh et al. (Brosh, et
Univers
ity of
Mala
ya
35
al., 2005) for a given percentage area stenosis severity. They performed quantitative
coronary angiography in 63 patients having intermediate lesions by pressure guidewire.
The results demonstrated that the lesion length has significant impact on the
physiological significance of intermediate coronary lesions.
The influence of arterial wall –stenosis compliance had been studied in detail by
konala et al. (Konala et al., 2011). The blood was modelled as non-Newtonian fluid
using Carreau model. Their result showed that for a given stenosis geometry, the
hyperemic pressure drop across the stenosis decreases as the wall compliance increases
and hence the current clinical diagnostic parameter FFR increases. This increment in
FFR leads the clinician to misdiagnose the severity of the stenosis and postponement of
the coronary interventional procedure, especially for the intermediate stenosis severity.
The misdiagnose region was found between 78.7%- 82.7% AS. Further, the CDP and
LFC also affected which confirms that the arterial wall-stenosis compliance might lead
to misinterpretation of stenosis severity.
2.8 Effect of guidewire on haemodynamic
The investigation of effect of catheters of various diameters on the blood flow in
1800C curved artery was numerically simulated by Torri et al. (Torii et al., 2007). The
commercially available software CFX10 was used to simulate the blood flow. They
observed an increase in pressure by 1.3-4.3mmHg depending on the diameter of the
guide wire and causes reduced pressure-velocity phase lag. The under estimation of 15-
21% of velocity measurement was also observed due to the catheter depending on its
diameters. The investigation of effect of guide wire size and stenosis dimensions are
analytically presented by Rajabi-Jaghargh et al. (Rajabi-Jaghargh, et al., 2011). The
three percentage of area reduction corresponding to moderate (64%), intermediate
Univers
ity of
Mala
ya
36
(80%) and severe (90%) was considered to analyse the pressure drop. They observed
that increase in the throat length increases only the viscous loss for a given percentage
of area reduction. The increase in both loss momentum change and viscous loss was
found due to the increase in severity of stenosis and guide wire insertion.
A mathematical analysis was performed to investigate the effect of catheterized
curved artery with stenosis on the various physiological flow characteristics by Dash et
al. (Dash, et al., 1999) using double series of perturbation in small arteries with stenosis.
The results show that flow characteristics vary a markedly, and a considerable increase
in the magnitude of pressure drop, impedance and wall shear stress was observed due to
the increase in the catheter size. The combined effect of stenosis and curvature on the
flow characteristics are also performed and found that effect of stenosis is more severe
than that of the curvature of artery. The study of hemodynamic conditions due to
insertion of guide wire was investigated by Sinha Roy et al. (Sinha Roy et al., 2006) to
determine the mean pressure drop and distal mean coronary pressure which was used to
estimate the uncertainty in diagnosis of moderate lesion. They found mean pressure
drop 72mmHg as compared to 75mmHg under patho-physiological conditions without
guide wire during hyperemia. The guide wire surface shear stress was 35-50% as
compared to the value of wall shear stress for the transient and steady flow.
2.9 Effect of stenosis in realistic coronary arteries
The effect of plaques on hemodynamics in left coronary artery model is
simulated by Chaichana et al. (Chaichana et al., 2012). The simulation was carried out
to compare wall shear stress for Newtonian and non Newtonian fluid models. The
pressure gradient and flow velocity was calculated and compared in models with and
without stenosis. They found that high pressure gradient exists at the stenosis and low
Univers
ity of
Mala
ya

37
velocity at the post stenosis. They also observed that wall shear stress at the stenosis is
similar for the Newtonian and non Newtonian fluid models. In another study the authors
studied the hemodynamic effect of various types of plaque configuration in left
coronary artery (Chaichana et al., 2013a). They calculated velocity, wall shear stress
and pressure gradient for the plaque configurations. They found a highest velocity and
pressure gradient in a type of plaque configuration which involves the plaque position in
all the three left coronary branches. The authors further investigated the effect of
stenosis in four suspected coronary artery disease patients (Chaichana, Sun, & Jewkes,
2013b). They observed recirculation regions at post stenosis location and an increase in
wall shear stress at the stenosis for all the four patients. The investigation of plaque
located in left coronary artery and effect on wall shear stress (WSS) and wall pressure
stress gradient (WPSG) was simulated by computational fluid dynamics (Chaichana et
al., 2014). Their result demonstrates that the WSS decreases while the WPSG increases
due to presence of plaque in left coronary side branches.
2.10 Critical literature review
It is understood clearly from the literature that there is a substantial amount of
research work been carried out on hemodynamic by various researcher across the world.
The researchers have considered the idealistic models of coronary artery, as well as
geometrical models which have been extracted from the real image data. Many
researchers have considered the multi-physics fluid as well as wall deformation to
simulate the fluid structure interaction in different arterial models. It is noted that there
is not much of work particularly focusing on the shapes of stenosis in arteries since the
stenosis formed does not have particular shapes. Hence it is highly desirable to
investigate the effects of shapes of stenosis on hemodynamics and hence the diagnostic
parameters. There is not much investigation on the effect of angle of downstream
Univers
ity of
Mala
ya
38
curvatures in arteries which also influences the flow pattern, wall shear stress and
pressure drop in presence of stenosis. It is also observed that a limited amount of work
has been carried out on the realistic left coronary arties with the various degree of
stenosis in different position. Since it is imported to know the flow behaviour when the
stenosis present at different location. Hence it is highly desirable to investigate the
effect of different degree of stenosis on the hemodynamic, present at various locations.
It is noted that there is scarcity of literature on flow behaviour when multiple stenosis
exists on various locations across the coronary arteries. This particular issue need to be
addressed since it has been seen that multiple stenosis occurs in many patients. Thus,
current study is focussed on all those above mentioned areas to get to know the blood
flow behaviour to assist in diagnosis of patients suffering from coronary diseases.
Univers
ity of
Mala
ya
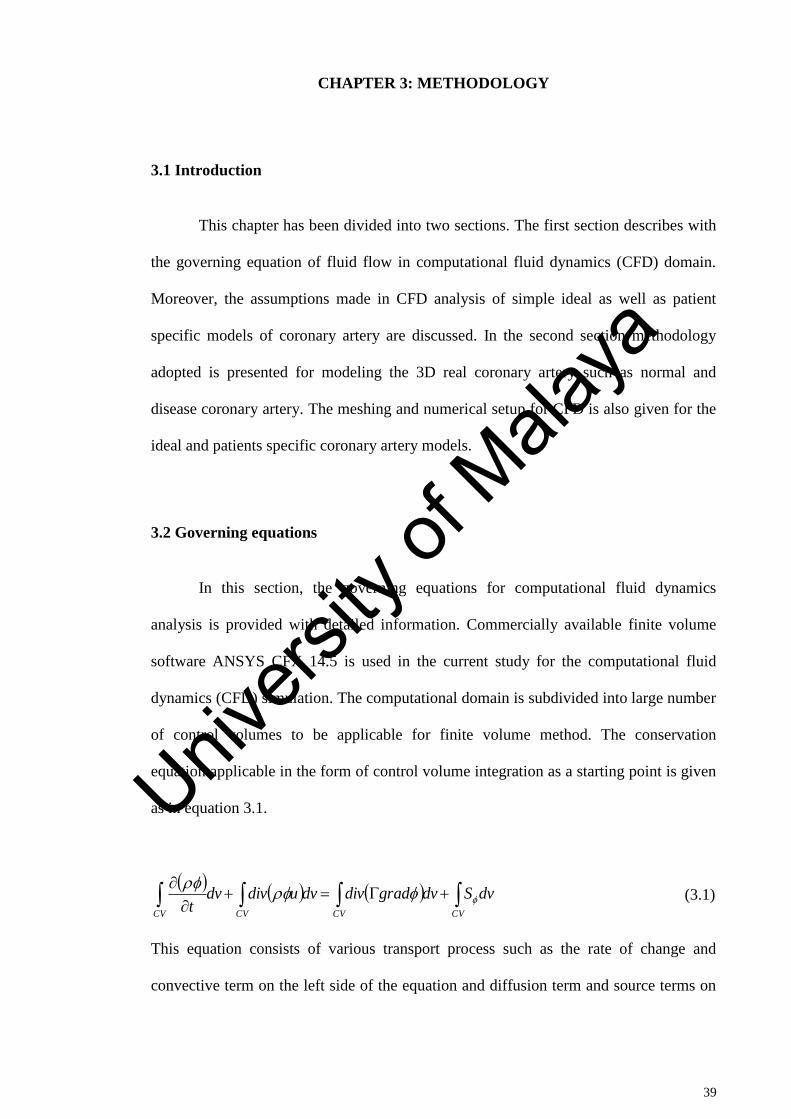
39
CHAPTER 3: METHODOLOGY
3.1 Introduction
This chapter has been divided into two sections. The first section describes with
the governing equation of fluid flow in computational fluid dynamics (CFD) domain.
Moreover, the assumptions made in CFD analysis of simple ideal as well as patient
specific models of coronary artery are discussed. In the second section methodology
adopted is presented for modeling the 3D real coronary artery such as normal and
disease coronary artery. The meshing and numerical setup for CFD is also given for the
ideal and patients specific coronary artery models.
3.2 Governing equations
In this section, the governing equations for computational fluid dynamics
analysis is provided with detailed information. Commercially available finite volume
software ANSYS CFX 14.5 is used in the current study for the computational fluid
dynamics (CFD) simulation. The computational domain is subdivided into large number
of control volumes to be applicable for finite volume method. The conservation
equation applicable in the form of control volume integration as a starting point is given
as in equation 3.1.
CVCVCVCV
dvSdvgraddivdvudivdvt
(3.1)
This equation consists of various transport process such as the rate of change and
convective term on the left side of the equation and diffusion term and source terms on
Univers
ity of
Mala
ya
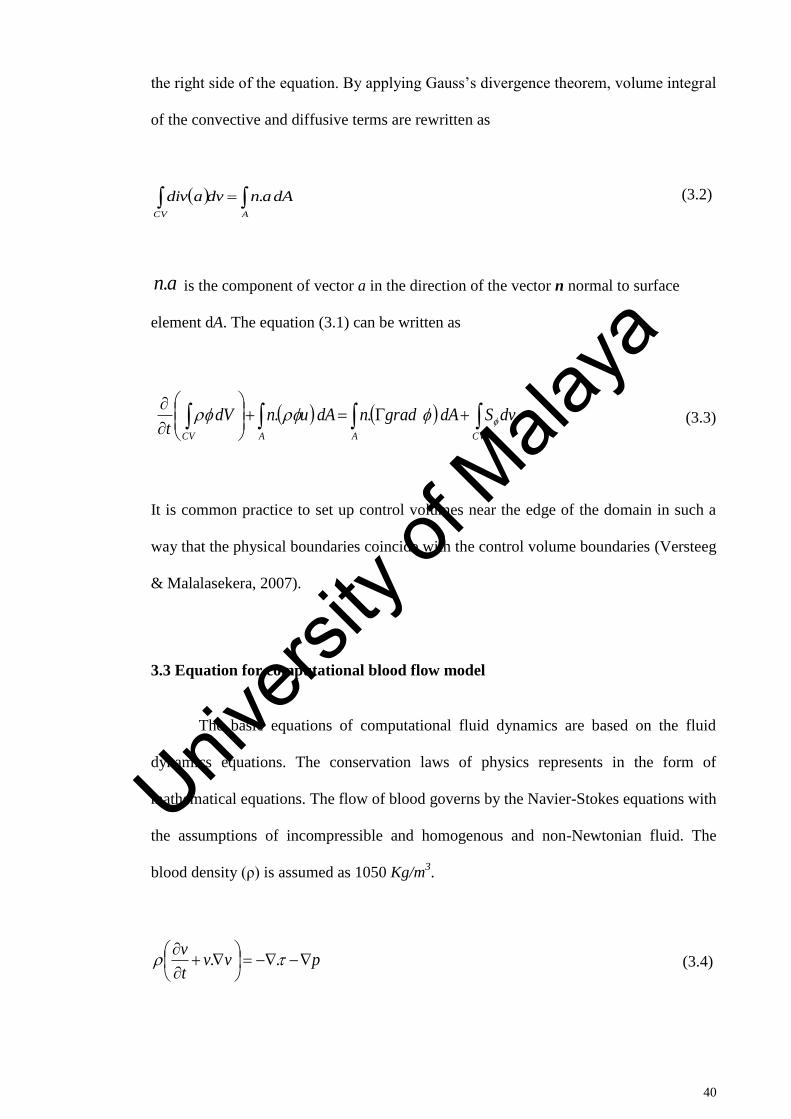
40
the right side of the equation. By applying Gauss’s divergence theorem, volume integral
of the convective and diffusive terms are rewritten as
ACV
dAandvadiv . (3.2)
an. is the component of vector a in the direction of the vector n normal to surface
element dA. The equation (3.1) can be written as
CVAACV
dvSdAgradndAundVt
.. (3.3)
It is common practice to set up control volumes near the edge of the domain in such a
way that the physical boundaries coincide with the control volume boundaries (Versteeg
& Malalasekera, 2007).
3.3 Equation for computational blood flow model
The basic equations of computational fluid dynamics are based on the fluid
dynamics equations. The conservation laws of physics represents in the form of
mathematical equations. The flow of blood governs by the Navier-Stokes equations with
the assumptions of incompressible and homogenous and non-Newtonian fluid. The
blood density (ρ) is assumed as 1050 Kg/m3.
pvvt
v
.. (3.4)
Univers
ity of
Mala
ya
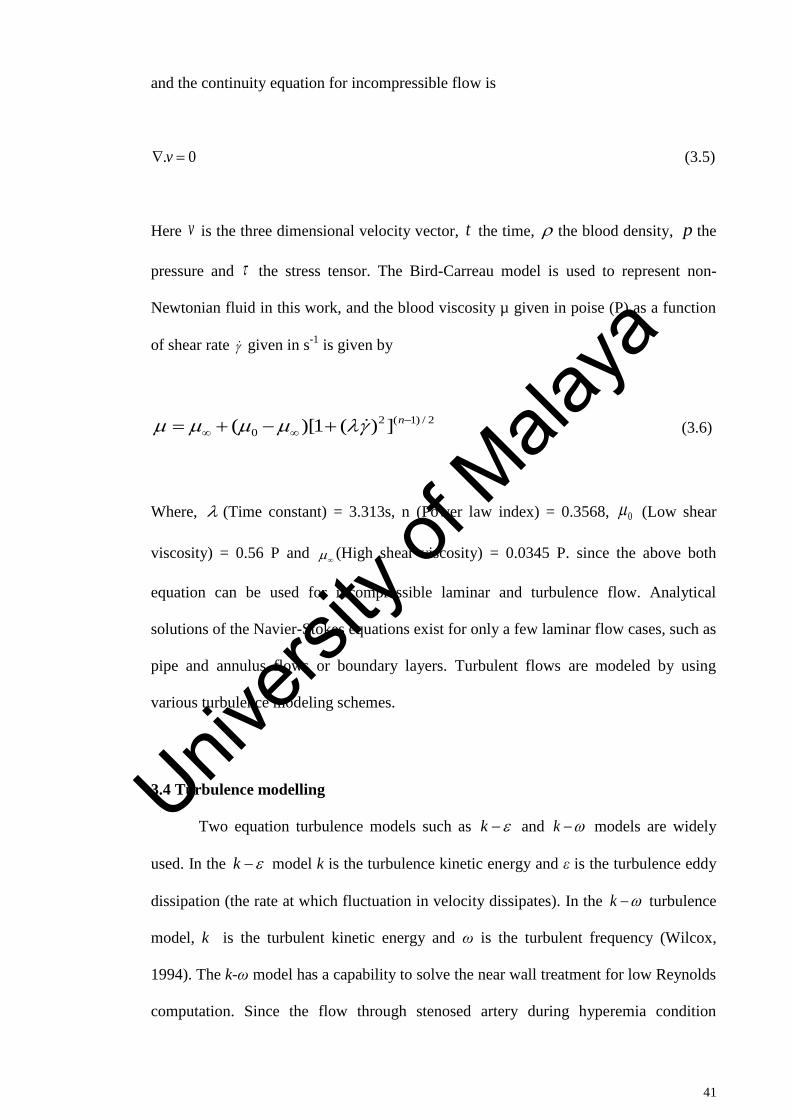
41
and the continuity equation for incompressible flow is
0. v (3.5)
Here v is the three dimensional velocity vector, t the time, the blood density, p the
pressure and the stress tensor. The Bird-Carreau model is used to represent non-
Newtonian fluid in this work, and the blood viscosity µ given in poise (P) as a function
of shear rate given in s-1
is given by
2/)1(2
0 ])(1)[(
n (3.6)
Where, (Time constant) = 3.313s, n (Power law index) = 0.3568, 0 (Low shear
viscosity) = 0.56 P and (High shear viscosity) = 0.0345 P. since the above both
equation can be used for incompressible laminar and turbulence flow. Analytical
solutions of the Navier-Stokes equations exist for only a few laminar flow cases, such as
pipe and annulus flows or boundary layers. Turbulent flows are modeled by using
various turbulence modeling schemes.
3.4 Turbulence modelling
Two equation turbulence models such as k and k models are widely
used. In the k model k is the turbulence kinetic energy and ε is the turbulence eddy
dissipation (the rate at which fluctuation in velocity dissipates). In the k turbulence
model, k is the turbulent kinetic energy and ω is the turbulent frequency (Wilcox,
1994). The k-ω model has a capability to solve the near wall treatment for low Reynolds
computation. Since the flow through stenosed artery during hyperemia condition
Univers
ity of
Mala
ya
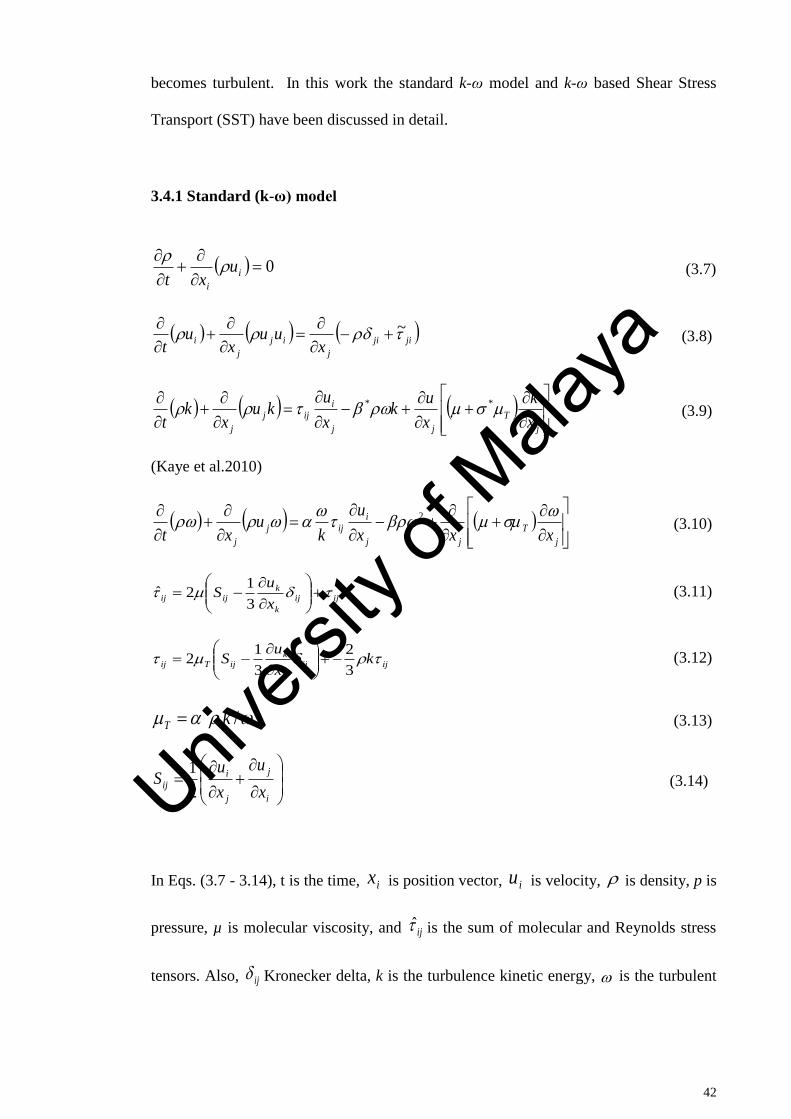
42
becomes turbulent. In this work the standard k-ω model and k-ω based Shear Stress
Transport (SST) have been discussed in detail.
3.4.1 Standard (k-ω) model
(3.7)
(3.8)
(3.9)
(Kaye et al.2010)
(3.10)
(3.11)
(3.12)
(3.13)
(3.14)
In Eqs. (3.7 - 3.14), t is the time, is position vector, is velocity, is density, p is
pressure, µ is molecular viscosity, and is the sum of molecular and Reynolds stress
tensors. Also, Kronecker delta, k is the turbulence kinetic energy, is the turbulent
0
i
i
uxt
jiji
j
ij
j
ix
uux
ut
~
j
T
jj
iijj
j x
k
x
uk
x
uku
xk
t **
j
T
jj
iijj
j xxx
u
ku
xt
2
ijij
k
k
ijijx
uS
3
12ˆ
ijij
k
k
ijTij kx
uS
3
2
3
12
/* kT
i
j
j
iij
x
u
x
uS
2
1
ix iu
ij
ij
Univers
ity of
Mala
ya
43
frequency is Reynolds stress tensor, and is eddy viscosity. The six parameters
and are closure coefficients whose values are given as:
(3.15)
(3.16)
(3.17)
, (3.18)
, (3.19)
, , (3.20)
Where is the turbulence Reynolds number defined by
(3.21)
3.4.2 Shear-Stress Transport (SST) k-ω (or k-ω-SST) model
The based SST model accounts for the transport of the turbulent shear
stress and gives highly accurate predictions of the onset and the amount of flow
separation under adverse pressure gradient (F. Menter, Kuntz, & Langtry, 2003; F. R.
Menter, 2009) .
ijT
*** ,,,,
kT
kT
R
R
Re1
Re*
0*
1*0
Re1
Re
9
5
R
R
T
T
4
4
*
Re1
Re18
5
100
9
R
R
T
T
40
3
21*
3*
0
10
10
8R 6kR 7.2R
TRe
kT Re
k
Univers
ity of
Mala
ya
44
(3.22)
+
(3.23)
The turbulent eddy viscosity is defined as
; (3.24)
(3.25)
(3.26)
Where and are blending function which are equal to zero away from the surface
and are defined by
(3.27)
(3.28)
(3.29)
Where, k is the turbulence kinetic energy, is the turbulence frequency, y is the
distance to the nearest wall, S is the strain rate, ρ is the density and is the flow
velocity. Constants are computed from the and the model through
i
tk
i
k
i
i
x
k
xkP
x
kU
t
k
*~)()(
i
t
i
k
ti
i
xxP
vx
U
t
2~1)()(
ii xx
kF
1)1(2 21
),max( 21
1
SFa
kavt
ijij SSS 2
i
j
j
i
j
itk
x
U
x
U
x
UP
kPP kk
*10,min~
1F 2F
4
2
2
2*1
4,
500,maxmintanh
yCD
k
y
v
y
kF
k
2
2*2
500,
2maxtanh
y
v
y
kF
10
2 10,1
2maxii
kxx
kCD
iU
k k
Univers
ity of
Mala
ya
45
The model constants are , ,
, , , , , , .
3.5 3-Dimensional Computational models of ideal coronary artery
The present section describes the 3-dimensional model generated using
computer aided design for an ideal coronary artery of human.
3.5.1 Modeling of different shapes of stenosis in coronary artery
First in the current study, an idealized coronary artery model with different
shapes of stenosis were created in ANSYS workbench. The model has 70% (moderate),
80% (intermediate) and 90% (severe) Area Stenosis (AS) with various shapes. Since
according to the clinical data stenosis does not have any particular shapes so in the
current study an attempt is made to create the different geometrical shapes of stenosis
(elliptical, trapezoidal and triangular) as shown in figure 3.1. The trapezium model has
converging (of length lc), throat (of radius rm and length lm), and diverging (of length lr)
sections, whereas triangular shape stenosis consists of converging (of length lc), and
diverging (of length lr) sections. Moreover, proximal and distal radius is assumed to be
identical (of length rd). The diameter of the artery is 3mm and the stenosis length has
been fixed to 10mm in all the model. Table 3.1 shows the dimensions used for the
triangle and trapezium to develop the models of stenosis considered in the current study.
The elliptical shape stenosis model was developed by using the following equation (
Dash, et al., 1999)
,~
sin1)~(~
L
dz
a
h
a
z
,~ Ldzd
(3.30)
Where, )~(~ z is the radius of stenosis, a, is the radius of an artery, z~ is along the axis of
the artery and h is the maximum projection of the stenosis into the lumen.
1211 1 FF 09.0* 951 4031
85.01 k 5.01 44.02 0828.02 12 k 856.02
Univers
ity of
Mala
ya
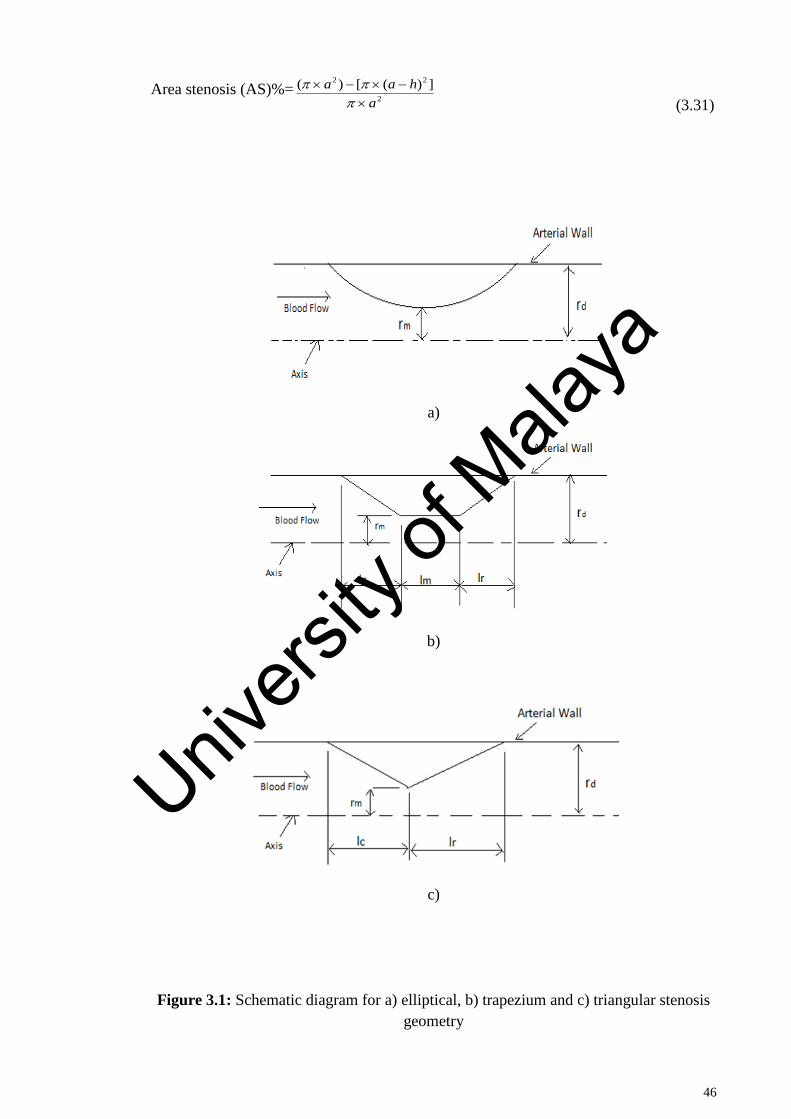
46
Area stenosis (AS)%=2
22 ])([)(
a
haa
(3.31)
a)
b)
c)
Figure 3.1: Schematic diagram for a) elliptical, b) trapezium and c) triangular stenosis
geometry
Univers
ity of
Mala
ya
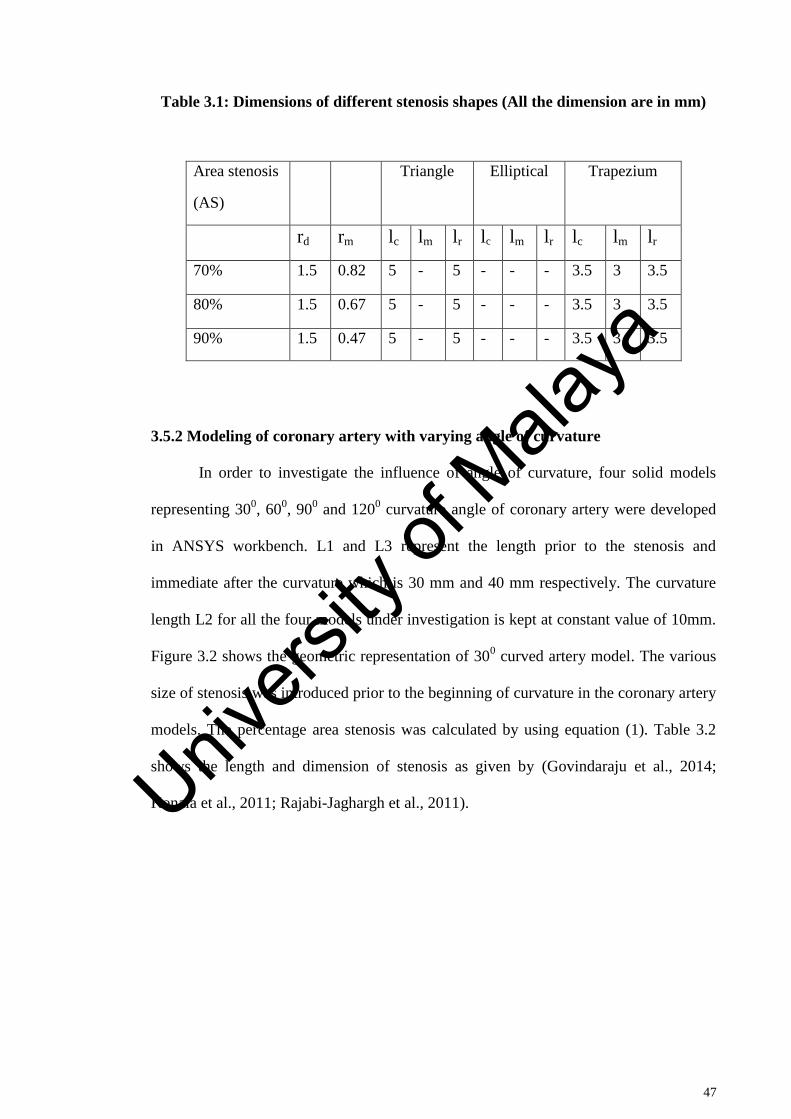
47
Table 3.1: Dimensions of different stenosis shapes (All the dimension are in mm)
Area stenosis
(AS)
Triangle Elliptical Trapezium
rd rm lc lm lr lc lm lr lc lm lr
70% 1.5 0.82 5 - 5 - - - 3.5 3 3.5
80% 1.5 0.67 5 - 5 - - - 3.5 3 3.5
90% 1.5 0.47 5 - 5 - - - 3.5 3 3.5
3.5.2 Modeling of coronary artery with varying angle of curvature
In order to investigate the influence of angle of curvature, four solid models
representing 300, 60
0, 90
0 and 120
0 curvature angle of coronary artery were developed
in ANSYS workbench. L1 and L3 represent the length prior to the stenosis and
immediate after the curvature which is 30 mm and 40 mm respectively. The curvature
length L2 for all the four models under investigation is kept at constant value of 10mm.
Figure 3.2 shows the geometric representation of 300 curved artery model. The various
size of stenosis was introduced prior to the beginning of curvature in the coronary artery
models. The percentage area stenosis was calculated by using equation (1). Table 3.2
shows the length and dimension of stenosis as given by (Govindaraju et al., 2014;
Konala et al., 2011; Rajabi-Jaghargh et al., 2011).
Univers
ity of
Mala
ya
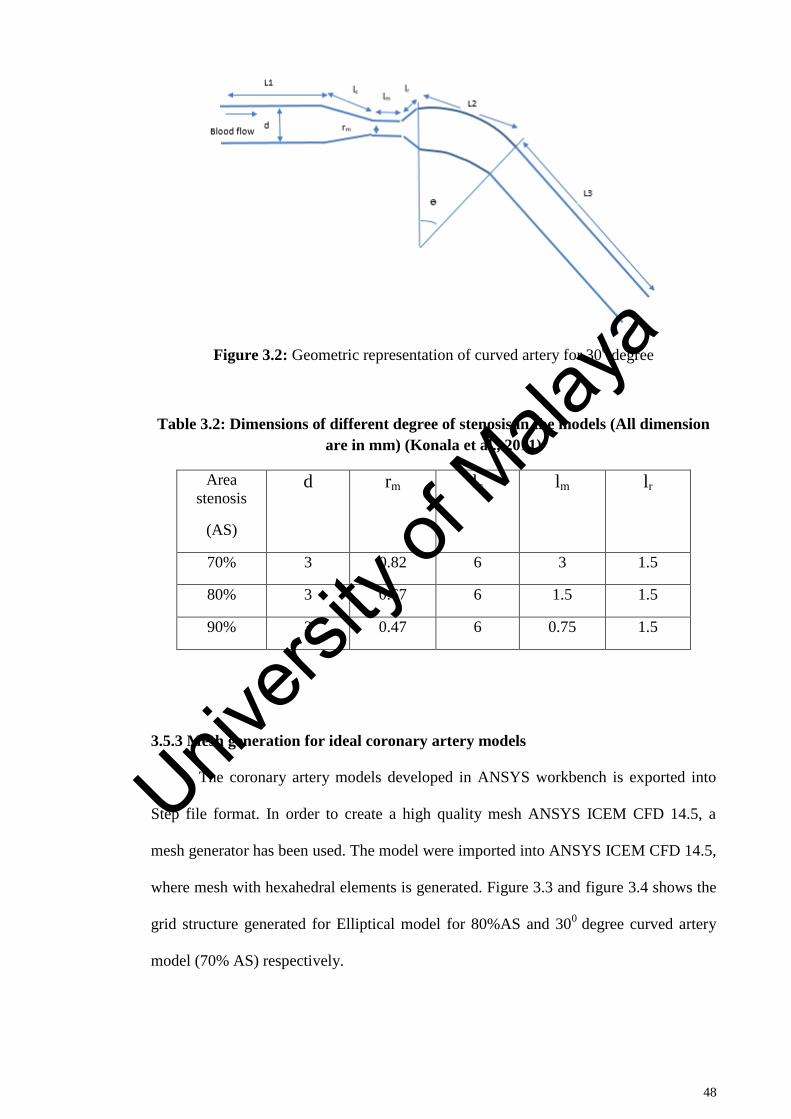
48
Figure 3.2: Geometric representation of curved artery for 300 degree
Table 3.2: Dimensions of different degree of stenosis in the models (All dimension
are in mm) (Konala et al., 2011)
Area
stenosis
(AS)
d rm lc lm lr
70% 3 0.82 6 3 1.5
80% 3 0.67 6 1.5 1.5
90% 3 0.47 6 0.75 1.5
3.5.3 Mesh generation for ideal coronary artery models
The coronary artery models developed in ANSYS workbench is exported into
Step file format. In order to create a high quality mesh ANSYS ICEM CFD 14.5, a
mesh generator has been used. The model were imported into ANSYS ICEM CFD 14.5,
where mesh with hexahedral elements is generated. Figure 3.3 and figure 3.4 shows the
grid structure generated for Elliptical model for 80%AS and 300
degree curved artery
model (70% AS) respectively.
Univers
ity of
Mala
ya
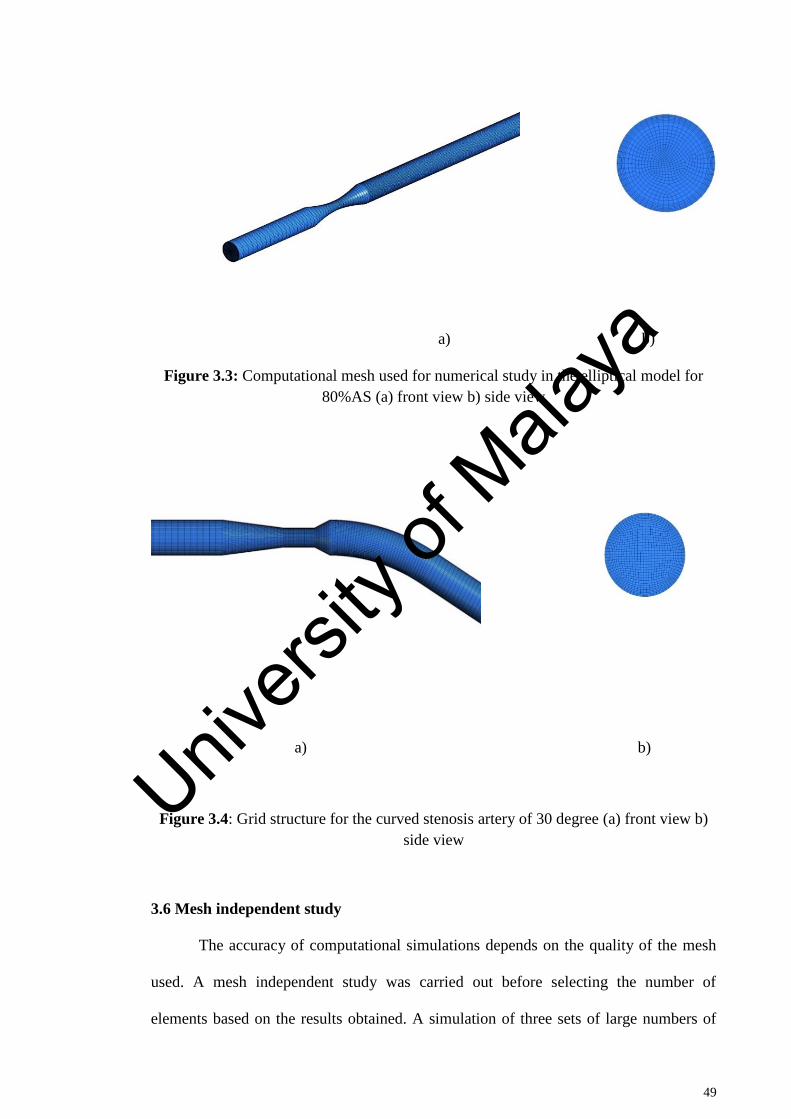
49
a) b)
Figure 3.3: Computational mesh used for numerical study in the elliptical model for
80%AS (a) front view b) side view
a) b)
Figure 3.4: Grid structure for the curved stenosis artery of 30 degree (a) front view b)
side view
3.6 Mesh independent study
The accuracy of computational simulations depends on the quality of the mesh
used. A mesh independent study was carried out before selecting the number of
elements based on the results obtained. A simulation of three sets of large numbers of
Univers
ity of
Mala
ya
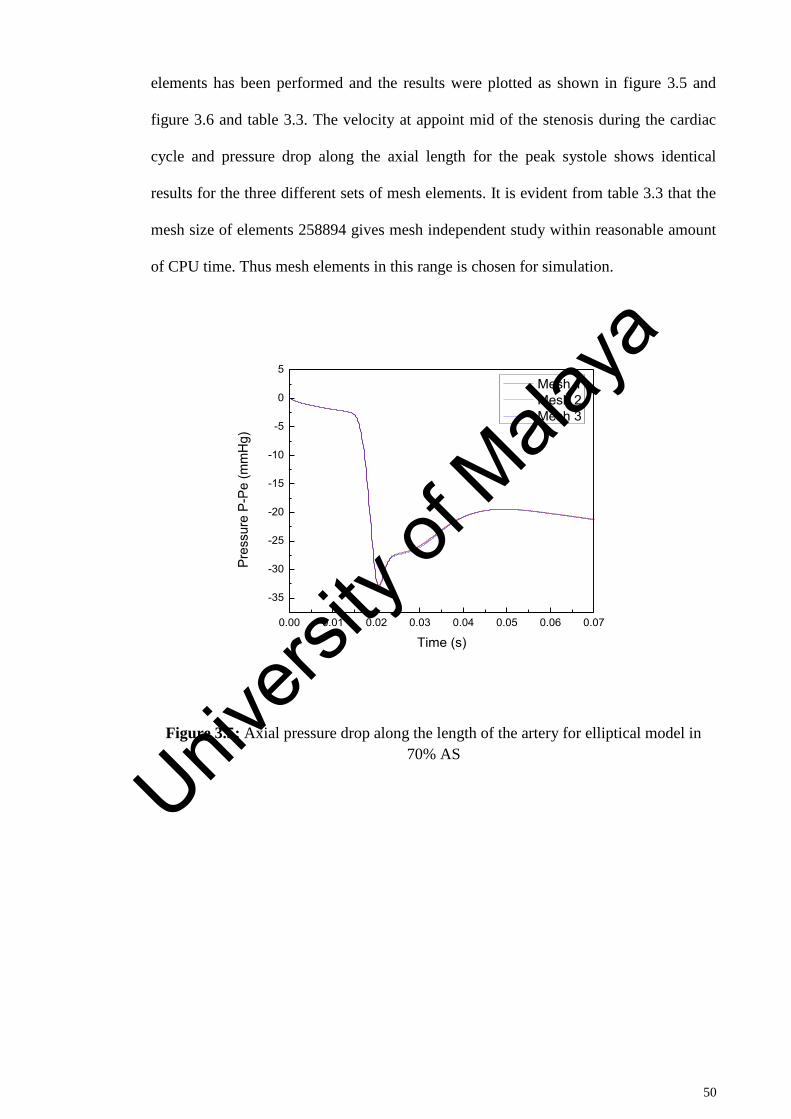
50
elements has been performed and the results were plotted as shown in figure 3.5 and
figure 3.6 and table 3.3. The velocity at appoint mid of the stenosis during the cardiac
cycle and pressure drop along the axial length for the peak systole shows identical
results for the three different sets of mesh elements. It is evident from table 3.3 that the
mesh size of elements 258894 gives mesh independent study within reasonable amount
of CPU time. Thus mesh elements in this range is chosen for simulation.
Figure 3.5: Axial pressure drop along the length of the artery for elliptical model in
70% AS
0.00 0.01 0.02 0.03 0.04 0.05 0.06 0.07
-35
-30
-25
-20
-15
-10
-5
0
5
Pres
sure
P-P
e (m
mH
g)
Time (s)
Mesh 1 Mesh 2 Mesh 3
Univers
ity of
Mala
ya
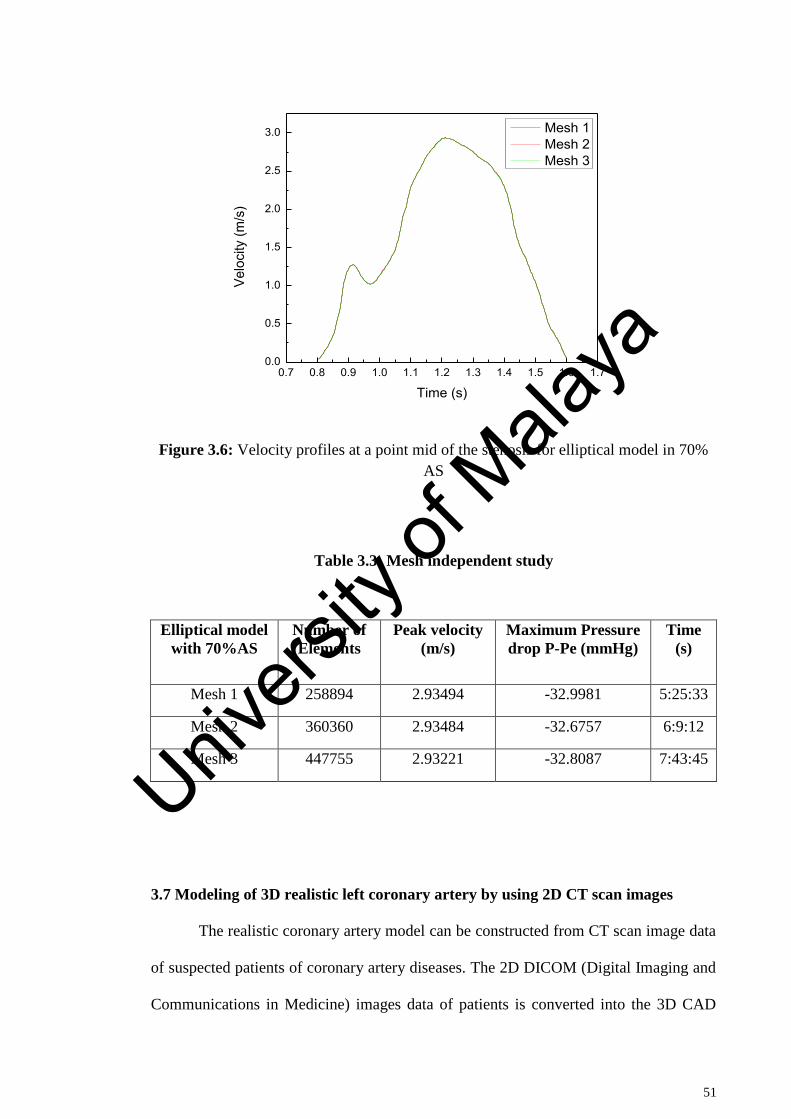
51
Figure 3.6: Velocity profiles at a point mid of the stenosis for elliptical model in 70%
AS
Table 3.3: Mesh independent study
Elliptical model
with 70%AS
Number of
Elements
Peak velocity
(m/s)
Maximum Pressure
drop P-Pe (mmHg)
Time
(s)
Mesh 1 258894 2.93494 -32.9981 5:25:33
Mesh 2 360360 2.93484 -32.6757 6:9:12
Mesh 3 447755 2.93221 -32.8087 7:43:45
3.7 Modeling of 3D realistic left coronary artery by using 2D CT scan images
The realistic coronary artery model can be constructed from CT scan image data
of suspected patients of coronary artery diseases. The 2D DICOM (Digital Imaging and
Communications in Medicine) images data of patients is converted into the 3D CAD
0.7 0.8 0.9 1.0 1.1 1.2 1.3 1.4 1.5 1.6 1.70.0
0.5
1.0
1.5
2.0
2.5
3.0
Velo
city
(m/s
)
Time (s)
Mesh 1 Mesh 2 Mesh 3
Univers
ity of
Mala
ya
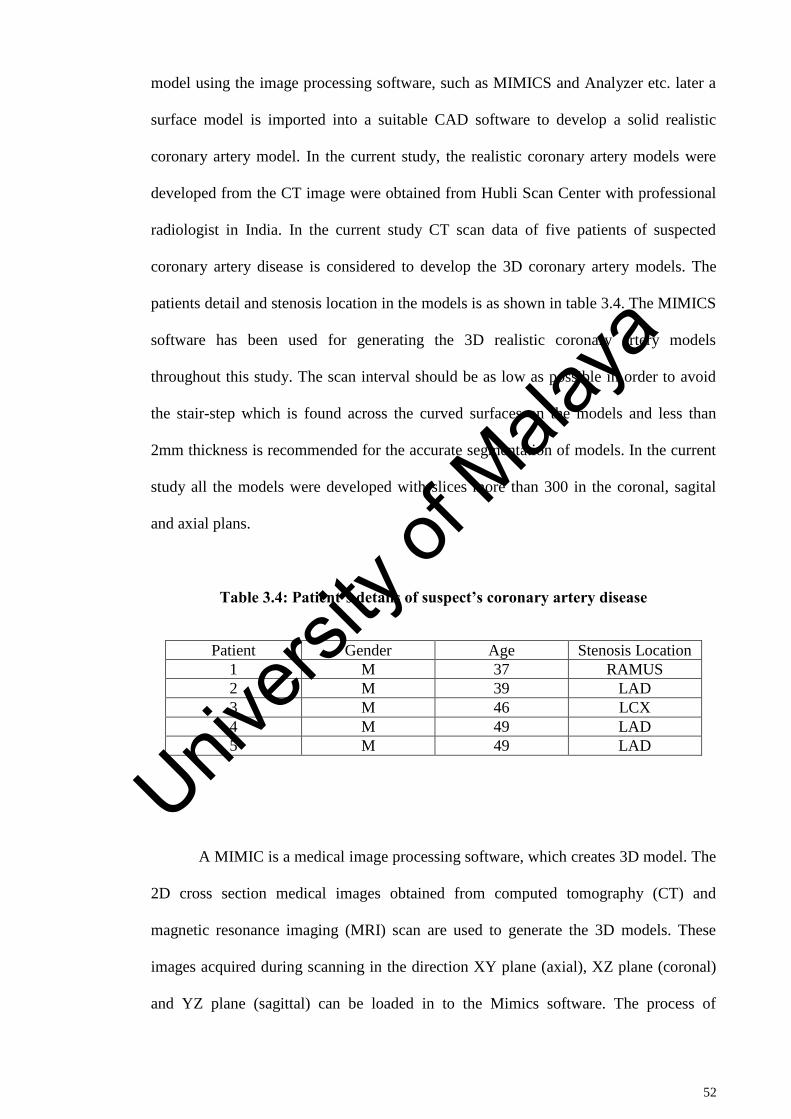
52
model using the image processing software, such as MIMICS and Analyzer etc. later a
surface model is imported into a suitable CAD software to develop a solid realistic
coronary artery model. In the current study, the realistic coronary artery models were
developed from the CT image were obtained from Hubli Scan Center with professional
radiologist in India. In the current study CT scan data of five patients of suspected
coronary artery disease is considered to develop the 3D coronary artery models. The
patients detail and stenosis location in the models is as shown in table 3.4. The MIMICS
software has been used for generating the 3D realistic coronary artery models
throughout this study. The scan interval should be as low as possible in order to avoid
the stair-step which is found across the curved surfaces on the models and less than
2mm thickness is recommended for the accurate segmentation of models. In the current
study all the models were developed with slices more than 300 in the coronal, sagital
and axial plans.
Table 3.4: Patient’s details of suspect’s coronary artery disease
Patient Gender Age Stenosis Location
1 M 37 RAMUS
2 M 39 LAD
3 M 46 LCX
4 M 49 LAD
5 M 49 LAD
A MIMIC is a medical image processing software, which creates 3D model. The
2D cross section medical images obtained from computed tomography (CT) and
magnetic resonance imaging (MRI) scan are used to generate the 3D models. These
images acquired during scanning in the direction XY plane (axial), XZ plane (coronal)
and YZ plane (sagittal) can be loaded in to the Mimics software. The process of
Univers
ity of
Mala
ya
53
converting these anatomical data from images into 3D model with measurement and
accuracy is called segmentation. Once the 3D model is segmented, it can be exported
into a different formats and engineering applications, such as FEA, surgical simulation,
design and additive manufacturing and more.
In this study the reconstruction of realistic left coronary arteries is performed by
importing the 2D CT scan images of suspected coronary artery disease patients in
DICOM (*.dcm) file format in to the MIMICS. The images were acquired in the 128
slicer scanner with the following specification: the Beam collimation 0.6, pitch, 1.4,
reconstruction interval of 0.6mm with the tube voltage of 100kVp current ranging from
300 to 650mAs. The slice thickness in the axial direction was 0.6mm with the 0.75mm
increment. These scan images in all the three direction (axial, sagittal and coronary) is
imported into MIMICS to create model. The images consist of grayscale information,
based on these gray values (Hounsfield Units) user generates models. These gray values
is associated with each image pixel which defines the shade (white, gray) of the pixel.
The density of the material and gray values assigned to each pixel is directly related.
Density of bones is higher than the soft tissues, which helps to differentiate the soft
tissues and bones. All the images is compressed and merges in MIMICS software to
generate a single volume file format MIMICS (*.mcs) according to the same pixel size
value. Later on the segmentation of left coronary artery is carried out by selecting an
appropriate thresholding values. A range of threshold values is defined to create the
segmented mask of left coronary artery. The value of thresholding for arteries is within
the range of soft tissue and it differs from patients to patients ranging from -150 to 450
HU (Hounsfield Units). Further an automatic region growing function is used to create
the left coronary artery model after the segmentation process. The 2D CT scan images
(coronal, sagittal and axial), 3D volume rendering of left and right coronary artery along
Univers
ity of
Mala
ya
54
with ascending aorta, heart after the segmented procedure as shown in figure 3.5. Later
the manual segmentation was performed to edit the mask in order to remove the floating
pixel and unconnected regions which do not constitutes the left coronary artery. The 3D
model of left coronary artery is visualized through the 3D rendering tool in MIMICS, as
shown in figure 3.7. To examine and ensuring the accuracy of anatomical model, 3D
rendering tool helps. Once the modeling of left coronary is confirmed as per the clinical
observation, it is converted into stereo-lithography (*.stl) file format and exported to 3-
matic for mesh generation.
Univers
ity of
Mala
ya
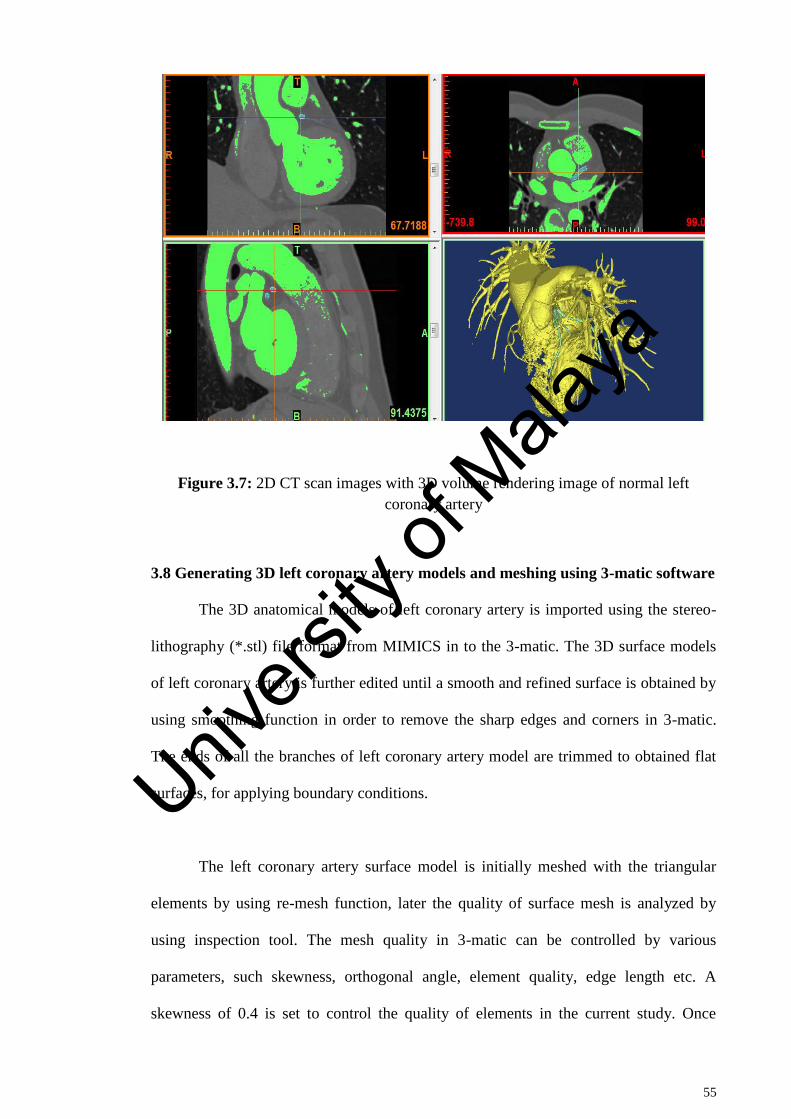
55
Figure 3.7: 2D CT scan images with 3D volume rendering image of normal left
coronary artery
3.8 Generating 3D left coronary artery models and meshing using 3-matic software
The 3D anatomical models of left coronary artery is imported using the stereo-
lithography (*.stl) file format from MIMICS in to the 3-matic. The 3D surface models
of left coronary artery is further edited until a smooth and refined surface is obtained by
using smoothing function in order to remove the sharp edges and corners in 3-matic.
The ends of all the branches of left coronary artery model are trimmed to obtained flat
surfaces, for applying boundary conditions.
The left coronary artery surface model is initially meshed with the triangular
elements by using re-mesh function, later the quality of surface mesh is analyzed by
using inspection tool. The mesh quality in 3-matic can be controlled by various
parameters, such skewness, orthogonal angle, element quality, edge length etc. A
skewness of 0.4 is set to control the quality of elements in the current study. Once
Univers
ity of
Mala
ya
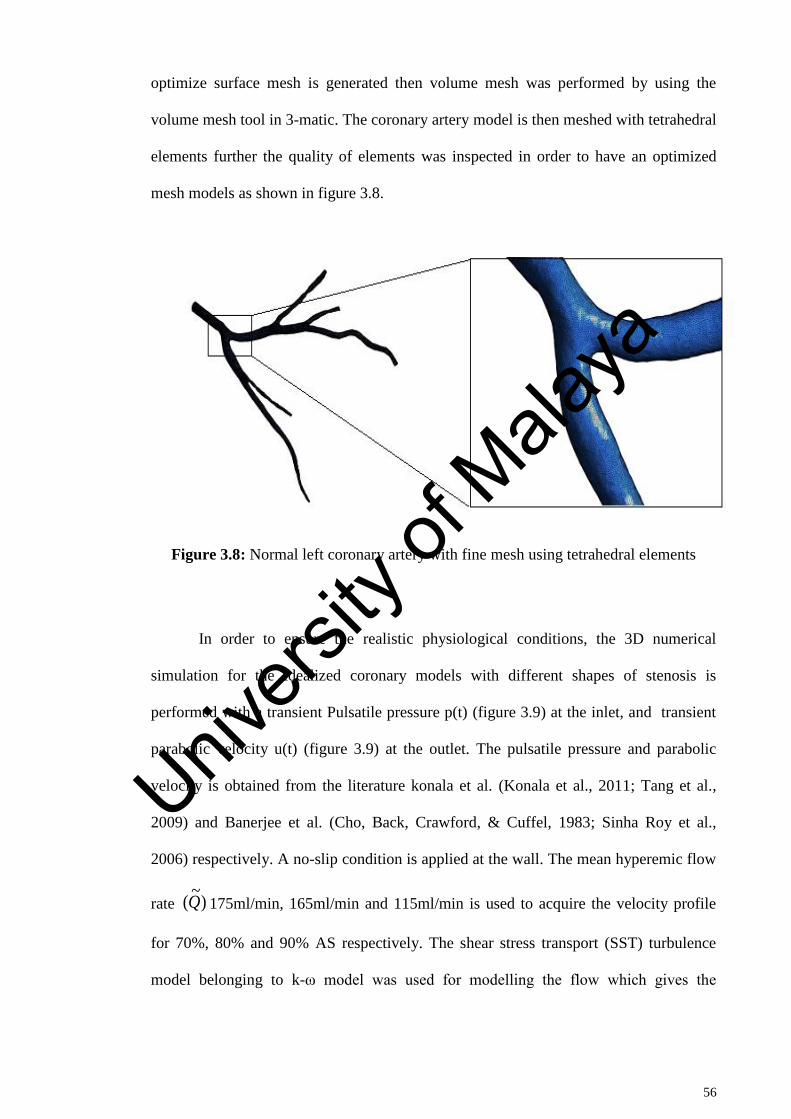
56
optimize surface mesh is generated then volume mesh was performed by using the
volume mesh tool in 3-matic. The coronary artery model is then meshed with tetrahedral
elements further the quality of elements was inspected in order to have an optimized
mesh models as shown in figure 3.8.
Figure 3.8: Normal left coronary artery with fine mesh using tetrahedral elements
In order to ensure the realistic physiological conditions, the 3D numerical
simulation for the idealized coronary models with different shapes of stenosis is
performed with a transient Pulsatile pressure p(t) (figure 3.9) at the inlet, and transient
parabolic velocity u(t) (figure 3.9) at the outlet. The pulsatile pressure and parabolic
velocity is obtained from the literature konala et al. (Konala et al., 2011; Tang et al.,
2009) and Banerjee et al. (Cho, Back, Crawford, & Cuffel, 1983; Sinha Roy et al.,
2006) respectively. A no-slip condition is applied at the wall. The mean hyperemic flow
rate )~
(Q 175ml/min, 165ml/min and 115ml/min is used to acquire the velocity profile
for 70%, 80% and 90% AS respectively. The shear stress transport (SST) turbulence
model belonging to k-ω model was used for modelling the flow which gives the
Univers
ity of
Mala
ya
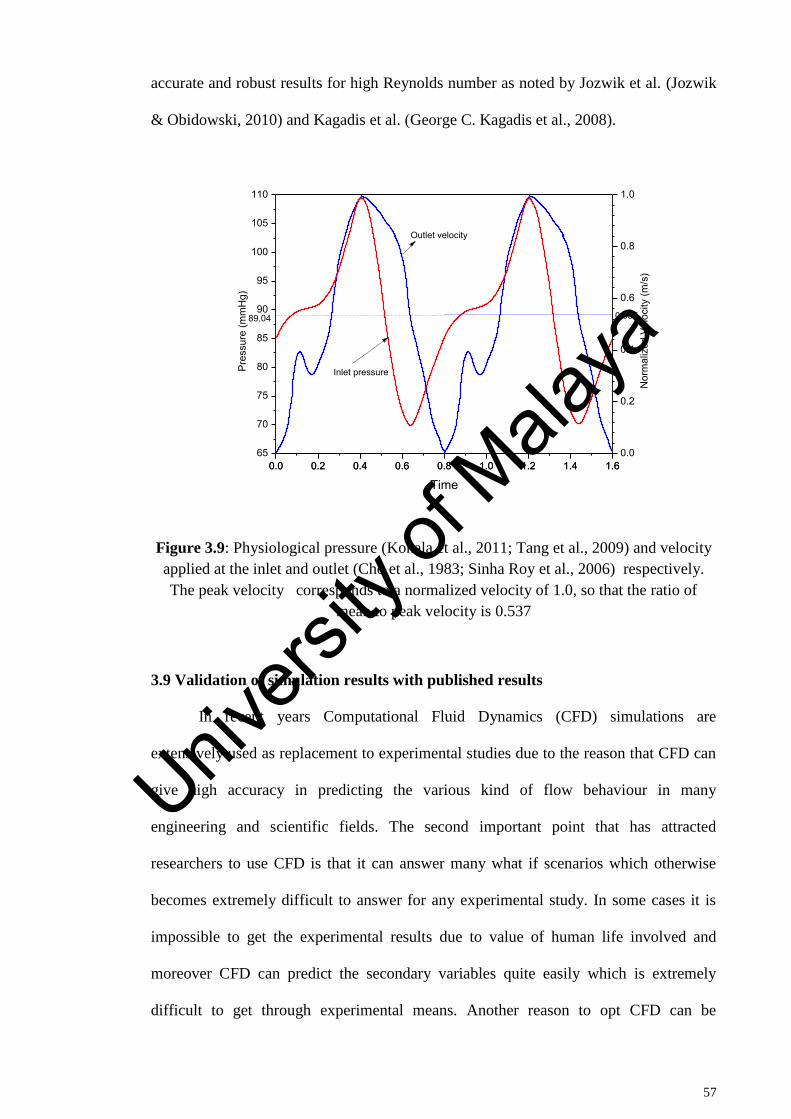
57
accurate and robust results for high Reynolds number as noted by Jozwik et al. (Jozwik
& Obidowski, 2010) and Kagadis et al. (George C. Kagadis et al., 2008).
0.0 0.2 0.4 0.6 0.8 1.0 1.2 1.4 1.60.0
0.2
0.4
0.6
0.8
1.0
0.0 0.2 0.4 0.6 0.8 1.0 1.2 1.4 1.665
70
75
80
85
90
95
100
105
110
Nor
mal
ized
Vel
ocity
(m/s
)
Time
Pres
sure
(mm
Hg)
Outlet velocity
Inlet pressure
89.04 0.537
Figure 3.9: Physiological pressure (Konala et al., 2011; Tang et al., 2009) and velocity
applied at the inlet and outlet (Cho et al., 1983; Sinha Roy et al., 2006) respectively.
The peak velocity corresponds to a normalized velocity of 1.0, so that the ratio of
mean to peak velocity is 0.537
3.9 Validation of simulation results with published results
In recent years Computational Fluid Dynamics (CFD) simulations are
extensively used as replacement to experimental studies due to the reason that CFD can
give high accuracy in predicting the various kind of flow behaviour in many
engineering and scientific fields. The second important point that has attracted
researchers to use CFD is that it can answer many what if scenarios which otherwise
becomes extremely difficult to answer for any experimental study. In some cases it is
impossible to get the experimental results due to value of human life involved and
moreover CFD can predict the secondary variables quite easily which is extremely
difficult to get through experimental means. Another reason to opt CFD can be
Univers
ity of
Mala
ya
58
attributed to the fact that, it gives results in very short time as compared to that of
experimental studies thus compressing the huge amount of time which helps researchers
to devote extra time on interpreting various kinds of scenarios. However, in order to
obtain accurate numerical simulation and results, it is necessary to validate the results
obtained from numerical simulations against the experimental data. For this reason, the
bench mark validation case has been done for guide wire flow obstruction effect on
pressure drop across the stenosis and hence the coronary diagnostic parameters in-vitro
experimental setup
3.10 Simulation of guide wire measurement of stenosis severity in vitro
experimental setup
In order to compare the present methodology, our model was reduced to the base
model for which the results are available in open literature. A 3-D model replicate of
coronary artery model with stenosis employed experimentally by Banerjee et al (R. K.
Banerjee, Peelukhana, & Goswami, 2014) to study the pressure drop across the stenosis
and hence the diagnostic parameter was considered for the benchmark validation. In this
experimental work, the coronary test section consists of converging, throat and
diverging part. The various geometrical dimensions involved for the coronary artery for
80% AS are given in Table 3.1. This geometry was well validated with clinical data in
several occasions (Ashtekar, Back, Khoury, & Banerjee, 2007; R. Banerjee et al., 2008).
In this benchmark validation, the CFD analysis was carried out with the coronary artery
model used by Banerjee et al (Banerjee et al., 2014) by assuming blood as non-
Newtonian fluid which follow Carreau model. Experiments of Banerjee et al. (Banerjee
et al., 2014) consists of a guide wire of diameter 0.014” to measure the pressure drop
across the stenosis having the pulsatile flow. The hyperemic flow rate was found from
the clinical data (Wilson et al., 1988) which was used in their experiment to evaluate
FFR and CDP. The experimental mean hyperemic flow rate was 135 ml/min in the case
Univers
ity of
Mala
ya
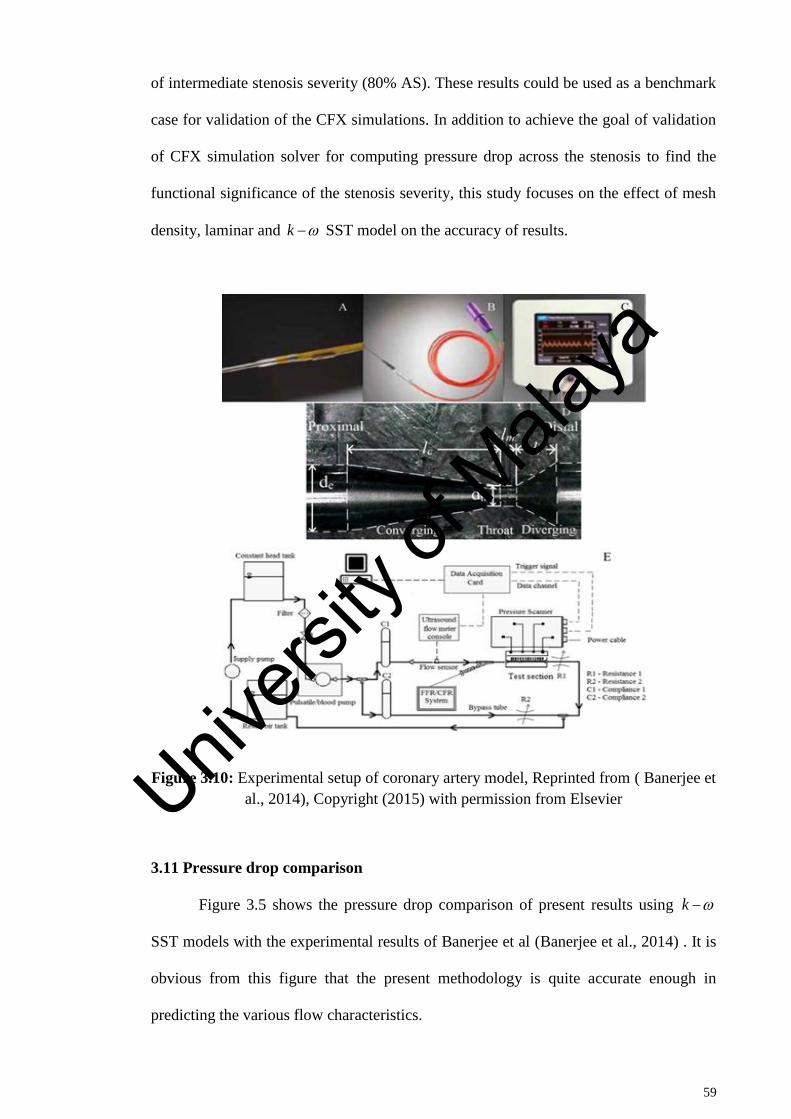
59
of intermediate stenosis severity (80% AS). These results could be used as a benchmark
case for validation of the CFX simulations. In addition to achieve the goal of validation
of CFX simulation solver for computing pressure drop across the stenosis to find the
functional significance of the stenosis severity, this study focuses on the effect of mesh
density, laminar and k SST model on the accuracy of results.
Figure 3.10: Experimental setup of coronary artery model, Reprinted from ( Banerjee et
al., 2014), Copyright (2015) with permission from Elsevier
3.11 Pressure drop comparison
Figure 3.5 shows the pressure drop comparison of present results using k
SST models with the experimental results of Banerjee et al (Banerjee et al., 2014) . It is
obvious from this figure that the present methodology is quite accurate enough in
predicting the various flow characteristics.
Univers
ity of
Mala
ya
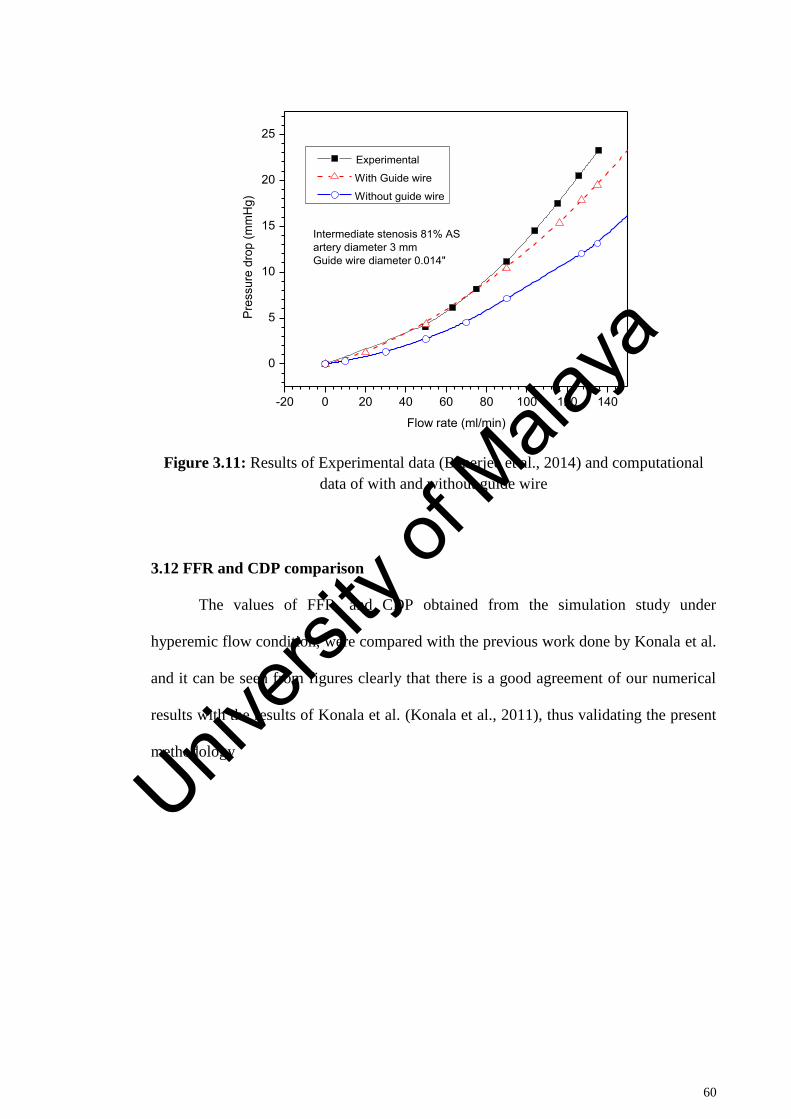
60
-20 0 20 40 60 80 100 120 140
0
5
10
15
20
25
Pres
sure
dro
p (m
mH
g)
Flow rate (ml/min)
Experimental
With Guide wire
Without guide wire
Intermediate stenosis 81% ASartery diameter 3 mmGuide wire diameter 0.014"
Figure 3.11: Results of Experimental data (Banerjee et al., 2014) and computational
data of with and without guide wire
3.12 FFR and CDP comparison
The values of FFR, and CDP obtained from the simulation study under
hyperemic flow condition, were compared with the previous work done by Konala et al.
and it can be seen from figures clearly that there is a good agreement of our numerical
results with the results of Konala et al. (Konala et al., 2011), thus validating the present
methodology
Univers
ity of
Mala
ya
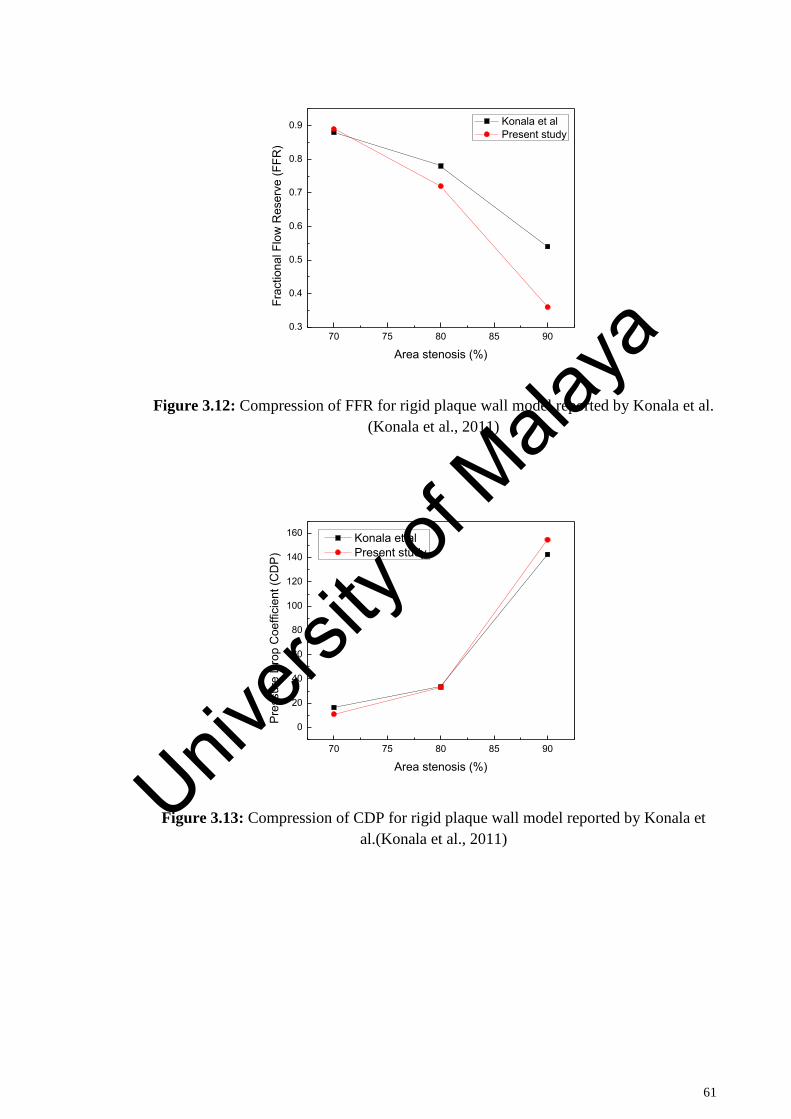
61
70 75 80 85 900.3
0.4
0.5
0.6
0.7
0.8
0.9 Konala et al Present study
Frac
tiona
l Flo
w R
eser
ve (F
FR)
Area stenosis (%)
Figure 3.12: Compression of FFR for rigid plaque wall model reported by Konala et al.
(Konala et al., 2011)
70 75 80 85 90
0
20
40
60
80
100
120
140
160
Pres
sure
Dro
p C
oeffi
cien
t (C
DP)
Area stenosis (%)
Konala et al Present study
Figure 3.13: Compression of CDP for rigid plaque wall model reported by Konala et
al.(Konala et al., 2011)
Univers
ity of
Mala
ya

62
CHAPTER 4: RESULTS AND DISCUSSION
4.1 Introduction
In this chapter, the detailed analysis has been carried out to investigate the blood
flow in a stenosed left coronary artery. The results obtained from the simulation of
ideal and realistic left coronary artery models were presented. The effect of different
shapes of stenosis, variation of angle of curvature, and influence of deferent degree of
stenosis in left coronary artery on the hemodynamic parameters such as, pressure,
velocity and wall shear stress were reported in detail, along with the diagnostic
parameters FFR, CDP and LFC.
4.2 Effect of shapes of stenosis on pressure and diagnostic parameters
Figure 4.1 Shows time average pressure drop in the triangular, elliptical and
trapezium models. The for trapezium shape stenosis was higher than the other two
models and is followed by the elliptical and triangular shapes of models for a fixed
stenosis severity. The increases in non-linear manner as percentage AS increases for
all the models. This could be characterized by the non-linear nature of momentum
changes on account of area constriction and vary with a second power of flow rate
(Konala et al., 2011). For triangular shape stenosis model, the pressure drop for 70% AS
was 4.89 mmHg, however as the percentage AS increased from 70% to 80%, the
pressure drop increased to 7.71 mmHg whereas from 80% to 90% AS, increased to
15.53 mmHg. In case of elliptical model, for 70% AS the drop in pressure was
6.17mmHg, but for 80% AS, it increased to 9.58mmHg whereas for 90% it further
increased to 16.78mmHg. Similarly for trapezium models pressure drop for 70%AS was
7.43mmHg, increased to 12.45mmHg as stenosis severity increased from 70% to 80%
AS and further increased to 24.85 mmHg as stenosis severity increased to 90%. The
p~
p~
Univers
ity of
Mala
ya
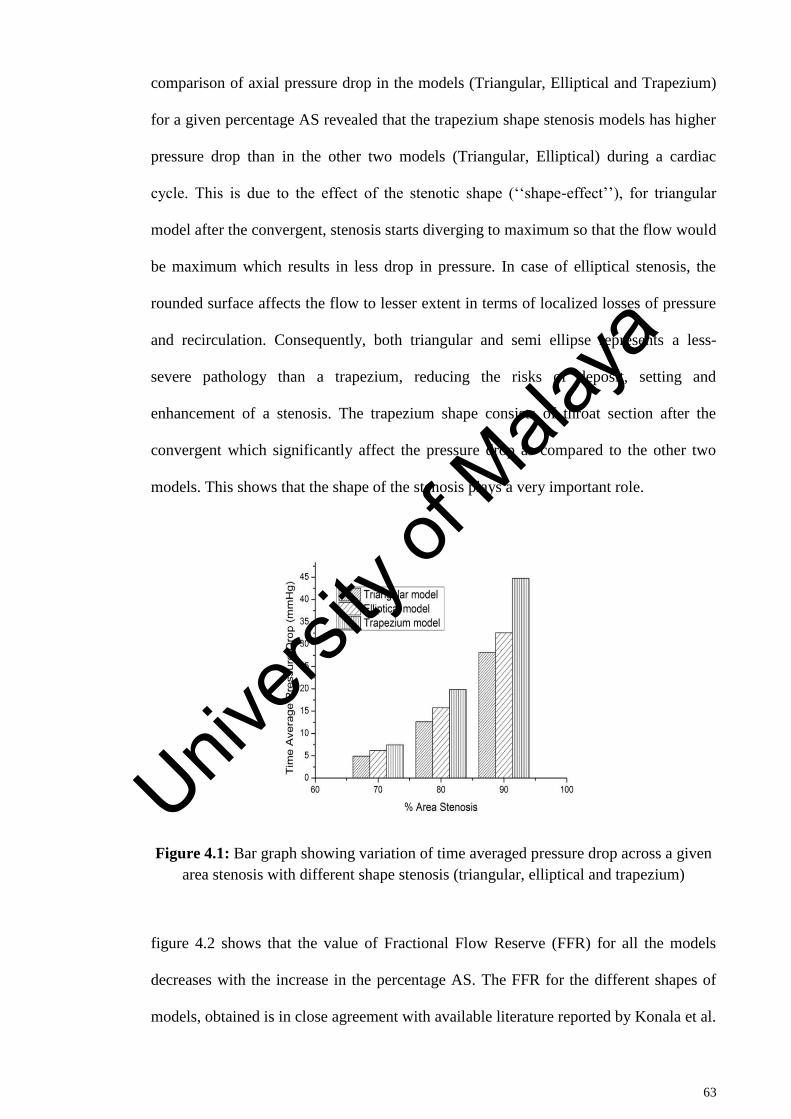
63
comparison of axial pressure drop in the models (Triangular, Elliptical and Trapezium)
for a given percentage AS revealed that the trapezium shape stenosis models has higher
pressure drop than in the other two models (Triangular, Elliptical) during a cardiac
cycle. This is due to the effect of the stenotic shape (‘‘shape-effect’’), for triangular
model after the convergent, stenosis starts diverging to maximum so that the flow would
be maximum which results in less drop in pressure. In case of elliptical stenosis, the
rounded surface affects the flow to lesser extent in terms of localized losses of pressure
and recirculation. Consequently, both triangular and semi ellipse represents a less-
severe pathology than a trapezium, reducing the risks of deposit, setting and
enhancement of a stenosis. The trapezium shape consists of throat section after the
convergent which significantly affect the pressure drop as compared to the other two
models. This shows that the shape of the stenosis plays a very important role.
Figure 4.1: Bar graph showing variation of time averaged pressure drop across a given
area stenosis with different shape stenosis (triangular, elliptical and trapezium)
figure 4.2 shows that the value of Fractional Flow Reserve (FFR) for all the models
decreases with the increase in the percentage AS. The FFR for the different shapes of
models, obtained is in close agreement with available literature reported by Konala et al.
Univers
ity of
Mala
ya
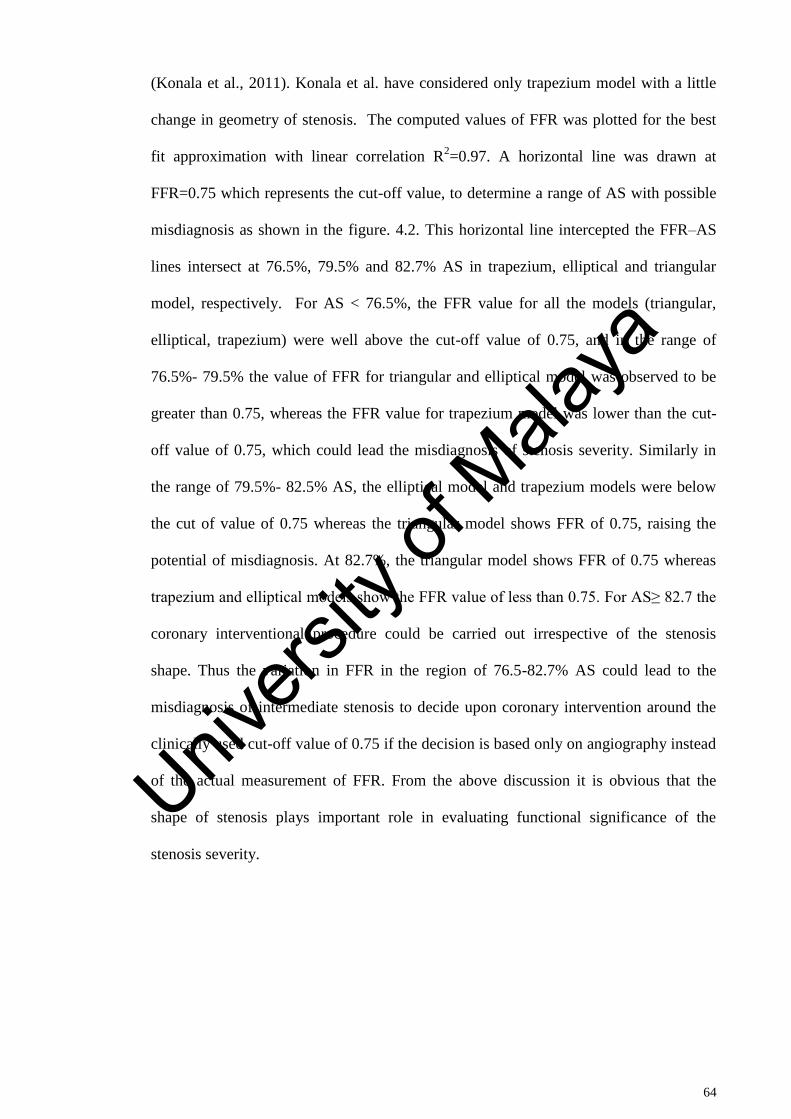
64
(Konala et al., 2011). Konala et al. have considered only trapezium model with a little
change in geometry of stenosis. The computed values of FFR was plotted for the best
fit approximation with linear correlation R2=0.97. A horizontal line was drawn at
FFR=0.75 which represents the cut-off value, to determine a range of AS with possible
misdiagnosis as shown in the figure. 4.2. This horizontal line intercepted the FFR–AS
lines intersect at 76.5%, 79.5% and 82.7% AS in trapezium, elliptical and triangular
model, respectively. For AS < 76.5%, the FFR value for all the models (triangular,
elliptical, trapezium) were well above the cut-off value of 0.75, and in the range of
76.5%- 79.5% the value of FFR for triangular and elliptical model was observed to be
greater than 0.75, whereas the FFR value for trapezium model was lower than the cut-
off value of 0.75, which could lead the misdiagnosis of stenosis severity. Similarly in
the range of 79.5%- 82.5% AS, the elliptical model and trapezium models were below
the cut of value of 0.75 whereas the triangular model shows FFR of 0.75, raising the
potential of misdiagnosis. At 82.7%, the triangular model shows FFR of 0.75 whereas
trapezium and elliptical models show the FFR value of less than 0.75. For AS≥ 82.7 the
coronary interventional procedure could be carried out irrespective of the stenosis
shape. Thus the variation in FFR in the region of 76.5-82.7% AS could lead to the
misdiagnosis of intermediate stenosis to decide upon coronary intervention around the
clinically used cut-off value of 0.75 if the decision is based only on angiography instead
of the actual measurement of FFR. From the above discussion it is obvious that the
shape of stenosis plays important role in evaluating functional significance of the
stenosis severity.
Univers
ity of
Mala
ya
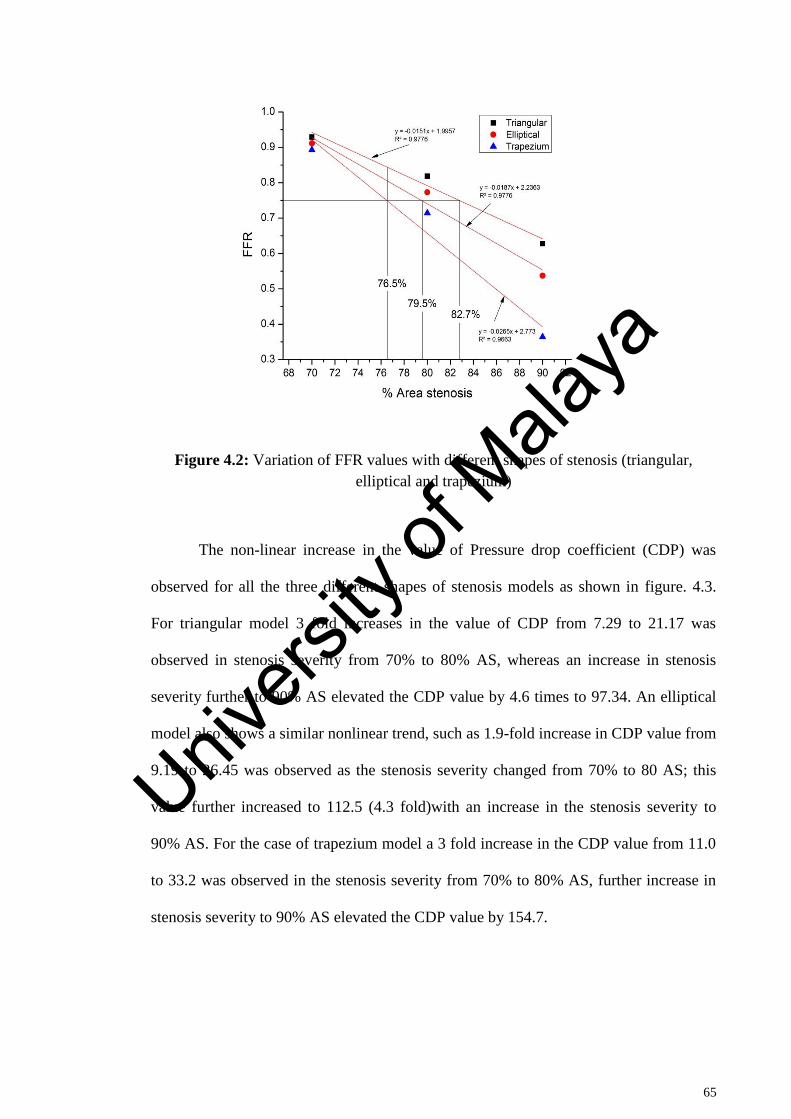
65
Figure 4.2: Variation of FFR values with different shapes of stenosis (triangular,
elliptical and trapezium)
The non-linear increase in the value of Pressure drop coefficient (CDP) was
observed for all the three different shapes of stenosis models as shown in figure. 4.3.
For triangular model 3 fold increases in the value of CDP from 7.29 to 21.17 was
observed in stenosis severity from 70% to 80% AS, whereas an increase in stenosis
severity further to 90% AS elevated the CDP value by 4.6 times to 97.34. An elliptical
model also shows a similar nonlinear trend, such as 1.9-fold increase in CDP value from
9.19 to 26.45 was observed as the stenosis severity changed from 70% to 80 AS; this
value further increased to 112.5 (4.3 fold)with an increase in the stenosis severity to
90% AS. For the case of trapezium model a 3 fold increase in the CDP value from 11.0
to 33.2 was observed in the stenosis severity from 70% to 80% AS, further increase in
stenosis severity to 90% AS elevated the CDP value by 154.7.
Univers
ity of
Mala
ya
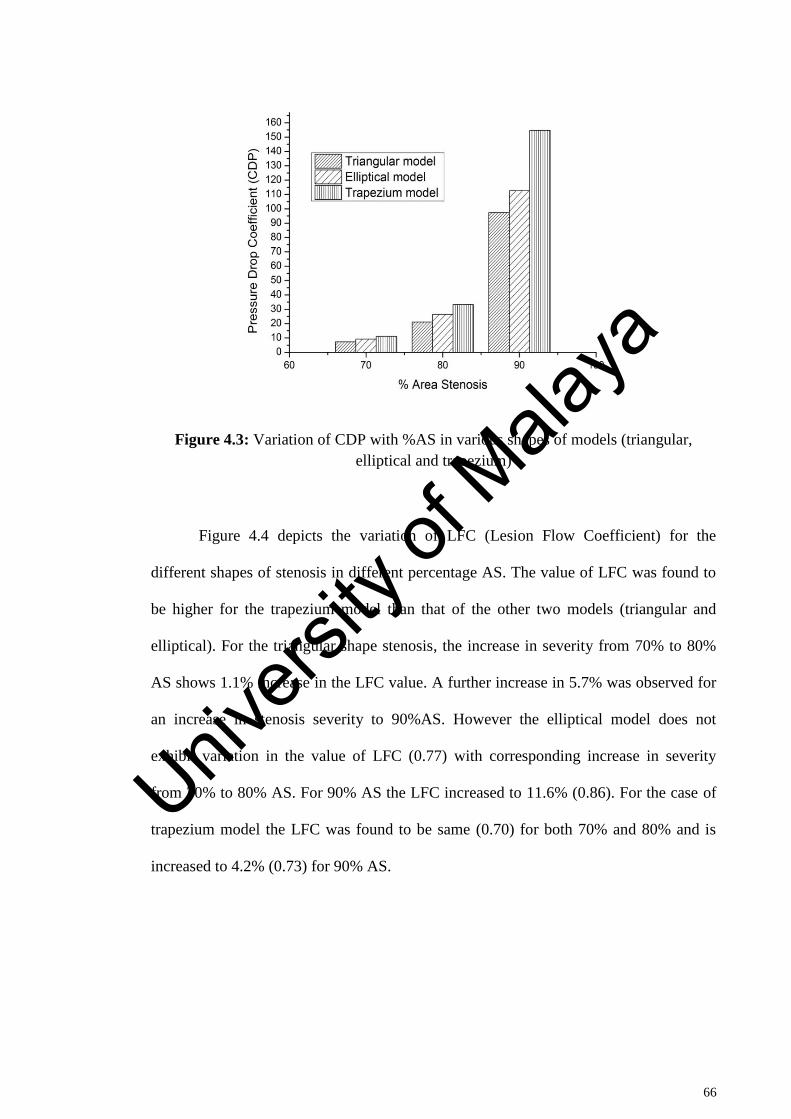
66
Figure 4.3: Variation of CDP with %AS in various shapes of models (triangular,
elliptical and trapezium)
Figure 4.4 depicts the variation of LFC (Lesion Flow Coefficient) for the
different shapes of stenosis in different percentage AS. The value of LFC was found to
be higher for the trapezium model than that of the other two models (triangular and
elliptical). For the triangular shape stenosis, the increase in severity from 70% to 80%
AS shows 1.1% increase in the LFC value. A further increase in 5.7% was observed for
an increase in stenosis severity to 90%AS. However the elliptical model does not
exhibit variation in the value of LFC (0.77) with corresponding increase in severity
from 70% to 80% AS. For 90% AS the LFC increased to 11.6% (0.86). For the case of
trapezium model the LFC was found to be same (0.70) for both 70% and 80% and is
increased to 4.2% (0.73) for 90% AS.
Univers
ity of
Mala
ya
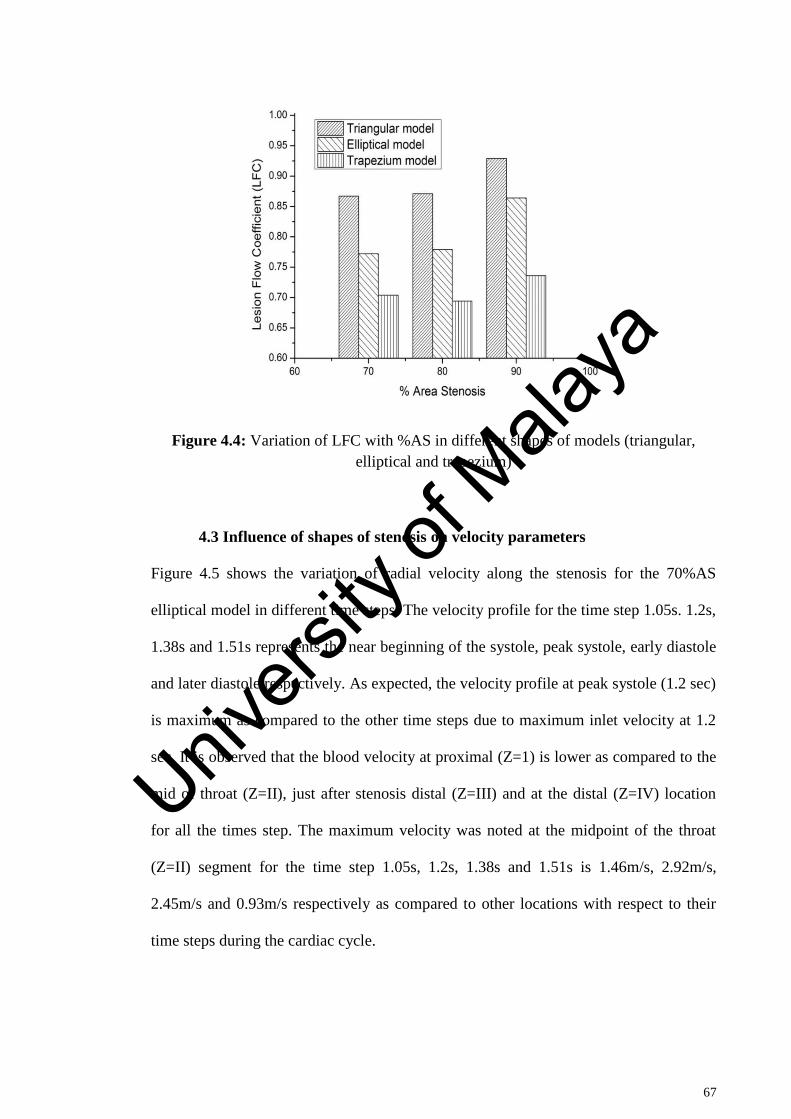
67
Figure 4.4: Variation of LFC with %AS in different shapes of models (triangular,
elliptical and trapezium)
4.3 Influence of shapes of stenosis on velocity parameters
Figure 4.5 shows the variation of radial velocity along the stenosis for the 70%AS
elliptical model in different time steps. The velocity profile for the time step 1.05s. 1.2s,
1.38s and 1.51s represents the near beginning of the systole, peak systole, early diastole
and later diastole respectively. As expected, the velocity profile at peak systole (1.2 sec)
is maximum as compared to the other time steps due to maximum inlet velocity at 1.2
sec. It is observed that the blood velocity at proximal (Z=1) is lower as compared to the
mid of throat (Z=II), just after stenosis distal (Z=III) and at the distal (Z=IV) location
for all the times step. The maximum velocity was noted at the midpoint of the throat
(Z=II) segment for the time step 1.05s, 1.2s, 1.38s and 1.51s is 1.46m/s, 2.92m/s,
2.45m/s and 0.93m/s respectively as compared to other locations with respect to their
time steps during the cardiac cycle.
Univers
ity of
Mala
ya
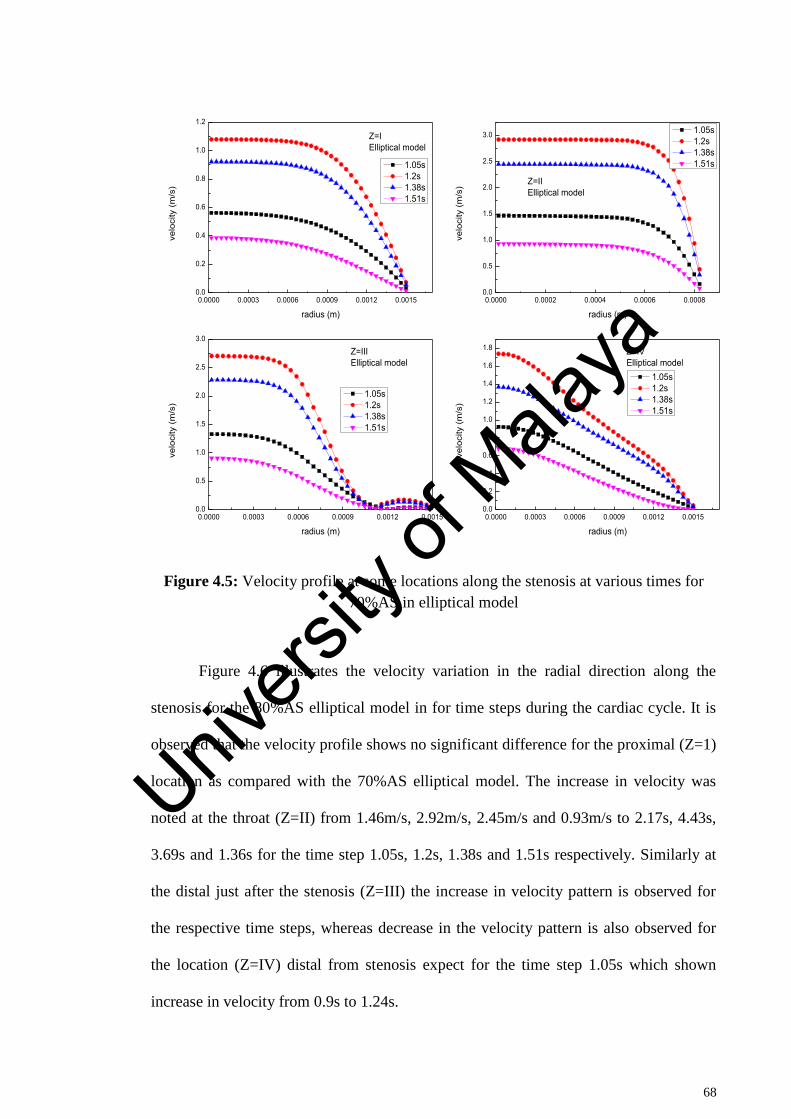
68
Figure 4.5: Velocity profile at some locations along the stenosis at various times for
70%AS in elliptical model
Figure 4.6 illustrates the velocity variation in the radial direction along the
stenosis for the 80%AS elliptical model in for time steps during the cardiac cycle. It is
observed that the velocity profile shows no significant difference for the proximal (Z=1)
location as compared with the 70%AS elliptical model. The increase in velocity was
noted at the throat (Z=II) from 1.46m/s, 2.92m/s, 2.45m/s and 0.93m/s to 2.17s, 4.43s,
3.69s and 1.36s for the time step 1.05s, 1.2s, 1.38s and 1.51s respectively. Similarly at
the distal just after the stenosis (Z=III) the increase in velocity pattern is observed for
the respective time steps, whereas decrease in the velocity pattern is also observed for
the location (Z=IV) distal from stenosis expect for the time step 1.05s which shown
increase in velocity from 0.9s to 1.24s.
0.0000 0.0003 0.0006 0.0009 0.0012 0.00150.0
0.2
0.4
0.6
0.8
1.0
1.2
0.0000 0.0002 0.0004 0.0006 0.00080.0
0.5
1.0
1.5
2.0
2.5
3.0
0.0000 0.0003 0.0006 0.0009 0.0012 0.00150.0
0.5
1.0
1.5
2.0
2.5
3.0
0.0000 0.0003 0.0006 0.0009 0.0012 0.00150.0
0.2
0.4
0.6
0.8
1.0
1.2
1.4
1.6
1.8
velo
city
(m/s
)
radius (m)
1.05s 1.2s 1.38s 1.51s
Z=IElliptical model
velo
city
(m/s
)
radius (m)
1.05s 1.2s 1.38s 1.51s
Z=IIElliptical model
velo
city
(m/s
)
radius (m)
1.05s 1.2s 1.38s 1.51s
Z=IIIElliptical model
velo
city
(m/s
)
radius (m)
1.05s 1.2s 1.38s 1.51s
Z=IVElliptical model
Univers
ity of
Mala
ya
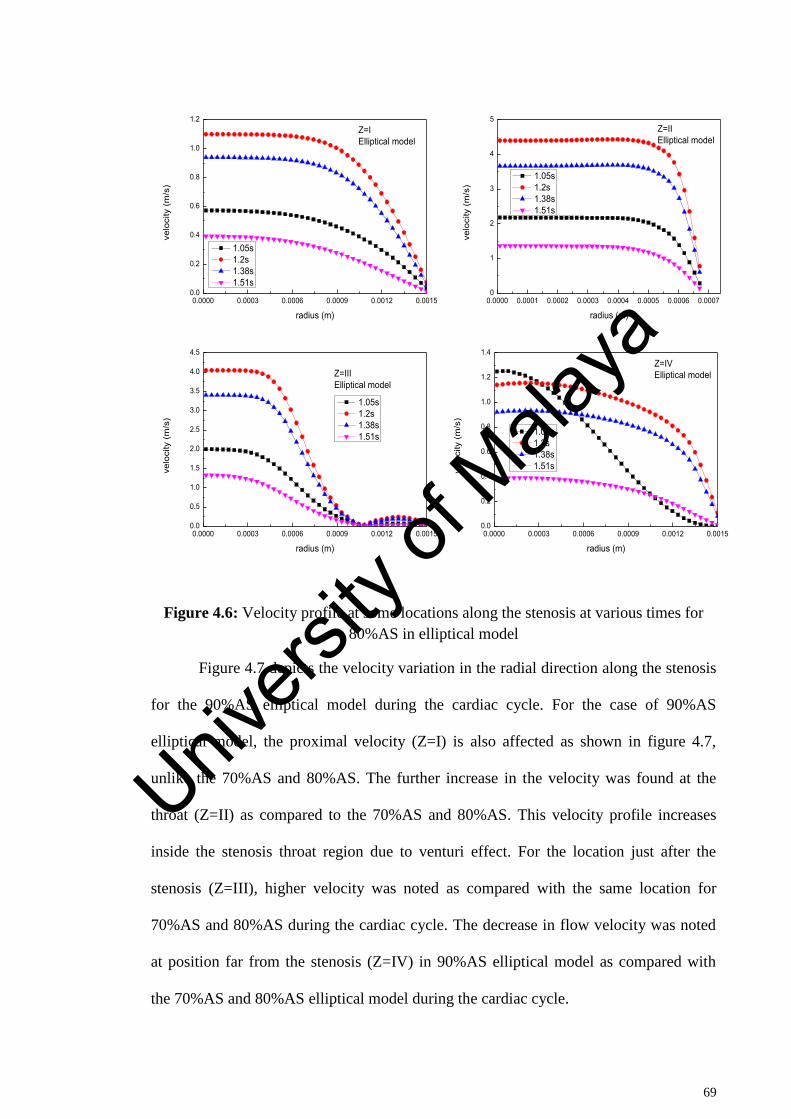
69
Figure 4.6: Velocity profile at some locations along the stenosis at various times for
80%AS in elliptical model
Figure 4.7 depicts the velocity variation in the radial direction along the stenosis
for the 90%AS elliptical model during the cardiac cycle. For the case of 90%AS
elliptical model, the proximal velocity (Z=I) is also affected as shown in figure 4.7,
unlike the 70%AS and 80%AS. The further increase in the velocity was found at the
throat (Z=II) as compared to the 70%AS and 80%AS. This velocity profile increases
inside the stenosis throat region due to venturi effect. For the location just after the
stenosis (Z=III), higher velocity was noted as compared with the same location for
70%AS and 80%AS during the cardiac cycle. The decrease in flow velocity was noted
at position far from the stenosis (Z=IV) in 90%AS elliptical model as compared with
the 70%AS and 80%AS elliptical model during the cardiac cycle.
0.0000 0.0003 0.0006 0.0009 0.0012 0.00150.0
0.2
0.4
0.6
0.8
1.0
1.2
0.0000 0.0001 0.0002 0.0003 0.0004 0.0005 0.0006 0.00070
1
2
3
4
5
0.0000 0.0003 0.0006 0.0009 0.0012 0.00150.0
0.5
1.0
1.5
2.0
2.5
3.0
3.5
4.0
4.5
0.0000 0.0003 0.0006 0.0009 0.0012 0.00150.0
0.2
0.4
0.6
0.8
1.0
1.2
1.4
velo
city
(m/s
)
radius (m)
1.05s 1.2s 1.38s 1.51s
Z=IElliptical model
velo
city
(m/s
)
radius (m)
1.05s 1.2s 1.38s 1.51s
Z=IIElliptical model
velo
city
(m/s
)
radius (m)
1.05s 1.2s 1.38s 1.51s
Z=IIIElliptical model
velo
city
(m/s
)
radius (m)
1.05s 1.2s 1.38s 1.51s
Z=IVElliptical model
Univers
ity of
Mala
ya
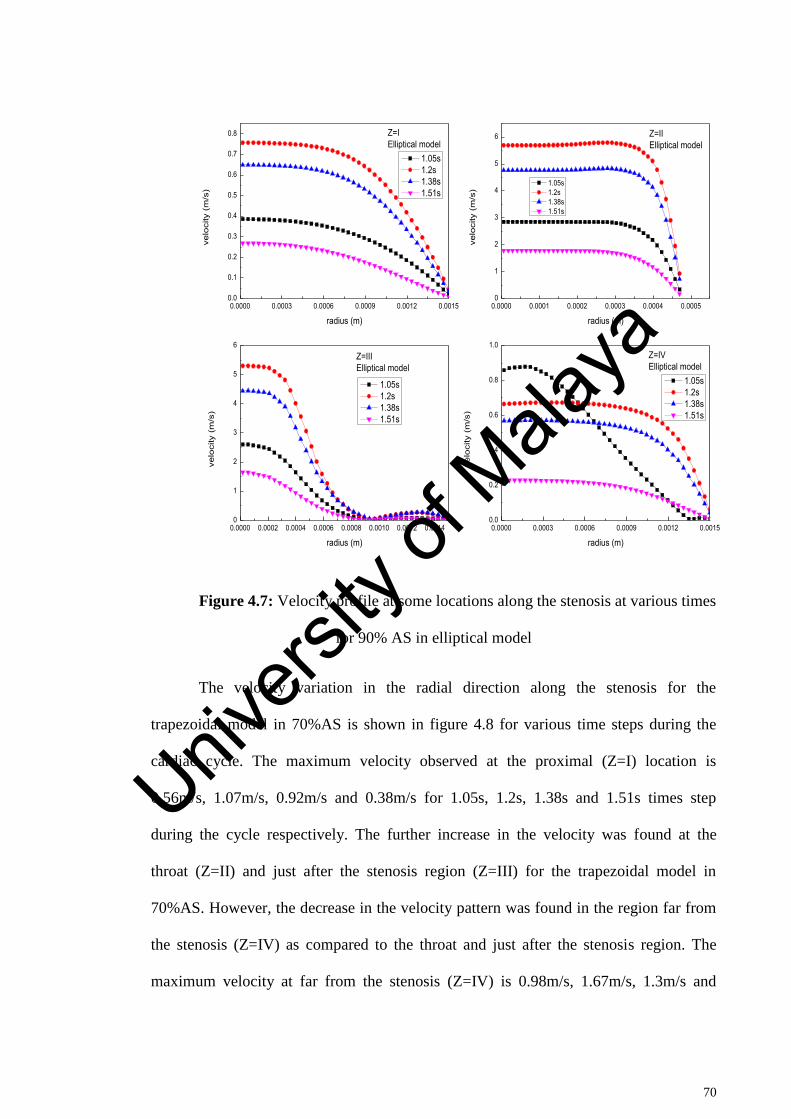
70
Figure 4.7: Velocity profile at some locations along the stenosis at various times
for 90% AS in elliptical model
The velocity variation in the radial direction along the stenosis for the
trapezoidal model in 70%AS is shown in figure 4.8 for various time steps during the
cardiac cycle. The maximum velocity observed at the proximal (Z=I) location is
0.56m/s, 1.07m/s, 0.92m/s and 0.38m/s for 1.05s, 1.2s, 1.38s and 1.51s times step
during the cycle respectively. The further increase in the velocity was found at the
throat (Z=II) and just after the stenosis region (Z=III) for the trapezoidal model in
70%AS. However, the decrease in the velocity pattern was found in the region far from
the stenosis (Z=IV) as compared to the throat and just after the stenosis region. The
maximum velocity at far from the stenosis (Z=IV) is 0.98m/s, 1.67m/s, 1.3m/s and
0.0000 0.0003 0.0006 0.0009 0.0012 0.00150.0
0.1
0.2
0.3
0.4
0.5
0.6
0.7
0.8
0.0000 0.0001 0.0002 0.0003 0.0004 0.00050
1
2
3
4
5
6
0.0000 0.0002 0.0004 0.0006 0.0008 0.0010 0.0012 0.00140
1
2
3
4
5
6
0.0000 0.0003 0.0006 0.0009 0.0012 0.00150.0
0.2
0.4
0.6
0.8
1.0
velo
city
(m
/s)
radius (m)
1.05s 1.2s 1.38s 1.51s
Z=IElliptical model
velo
city
(m
/s)
radius (m)
1.05s 1.2s 1.38s 1.51s
Z=IIElliptical model
velo
city
(m
/s)
radius (m)
1.05s 1.2s 1.38s 1.51s
Z=IIIElliptical model
velo
city
(m
/s)
radius (m)
1.05s 1.2s 1.38s 1.51s
Z=IVElliptical model
Univers
ity of
Mala
ya
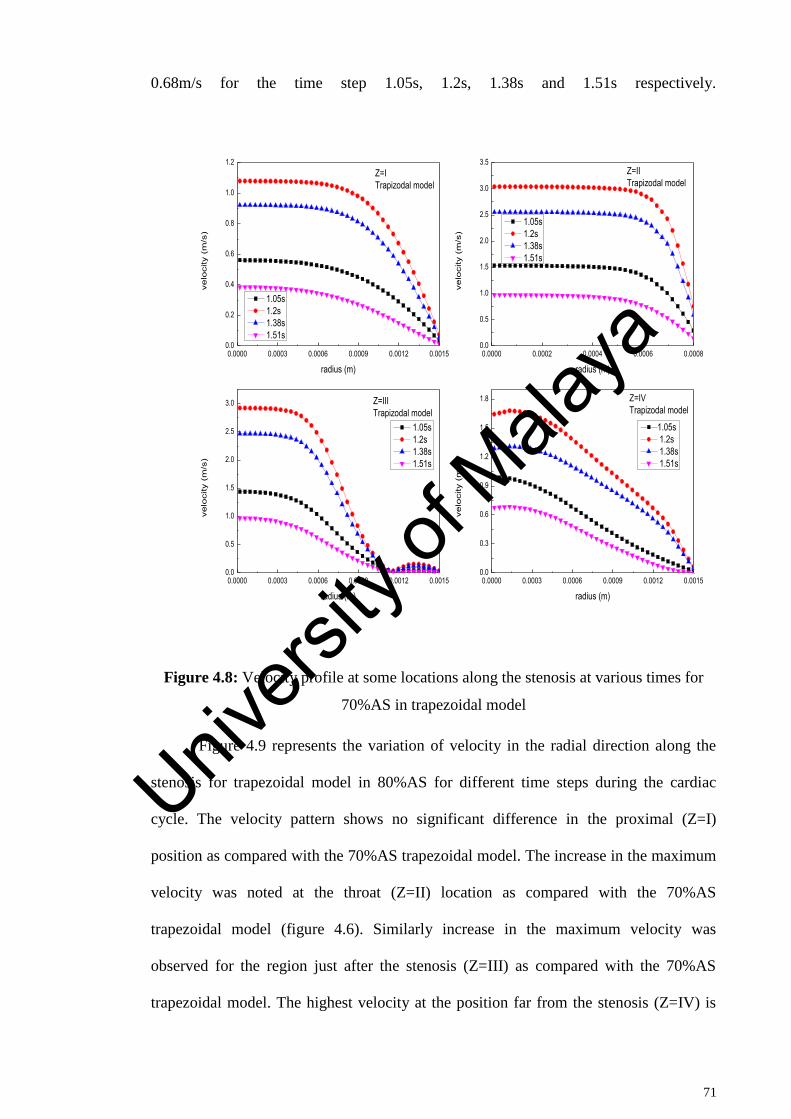
71
0.68m/s for the time step 1.05s, 1.2s, 1.38s and 1.51s respectively.
Figure 4.8: Velocity profile at some locations along the stenosis at various times for
70%AS in trapezoidal model
Figure 4.9 represents the variation of velocity in the radial direction along the
stenosis for trapezoidal model in 80%AS for different time steps during the cardiac
cycle. The velocity pattern shows no significant difference in the proximal (Z=I)
position as compared with the 70%AS trapezoidal model. The increase in the maximum
velocity was noted at the throat (Z=II) location as compared with the 70%AS
trapezoidal model (figure 4.6). Similarly increase in the maximum velocity was
observed for the region just after the stenosis (Z=III) as compared with the 70%AS
trapezoidal model. The highest velocity at the position far from the stenosis (Z=IV) is
0.0000 0.0003 0.0006 0.0009 0.0012 0.00150.0
0.2
0.4
0.6
0.8
1.0
1.2
0.0000 0.0002 0.0004 0.0006 0.00080.0
0.5
1.0
1.5
2.0
2.5
3.0
3.5
0.0000 0.0003 0.0006 0.0009 0.0012 0.00150.0
0.5
1.0
1.5
2.0
2.5
3.0
0.0000 0.0003 0.0006 0.0009 0.0012 0.00150.0
0.3
0.6
0.9
1.2
1.5
1.8
velo
city
(m
/s)
radius (m)
1.05s 1.2s 1.38s 1.51s
Z=ITrapizodal model
velo
city
(m
/s)
radius (m)
1.05s 1.2s 1.38s 1.51s
Z=IITrapizodal model
velo
city
(m
/s)
radius (m)
1.05s 1.2s 1.38s 1.51s
Z=IIITrapizodal model
velo
city
(m
/s)
radius (m)
1.05s 1.2s 1.38s 1.51s
Z=IVTrapizodal model
Univers
ity of
Mala
ya
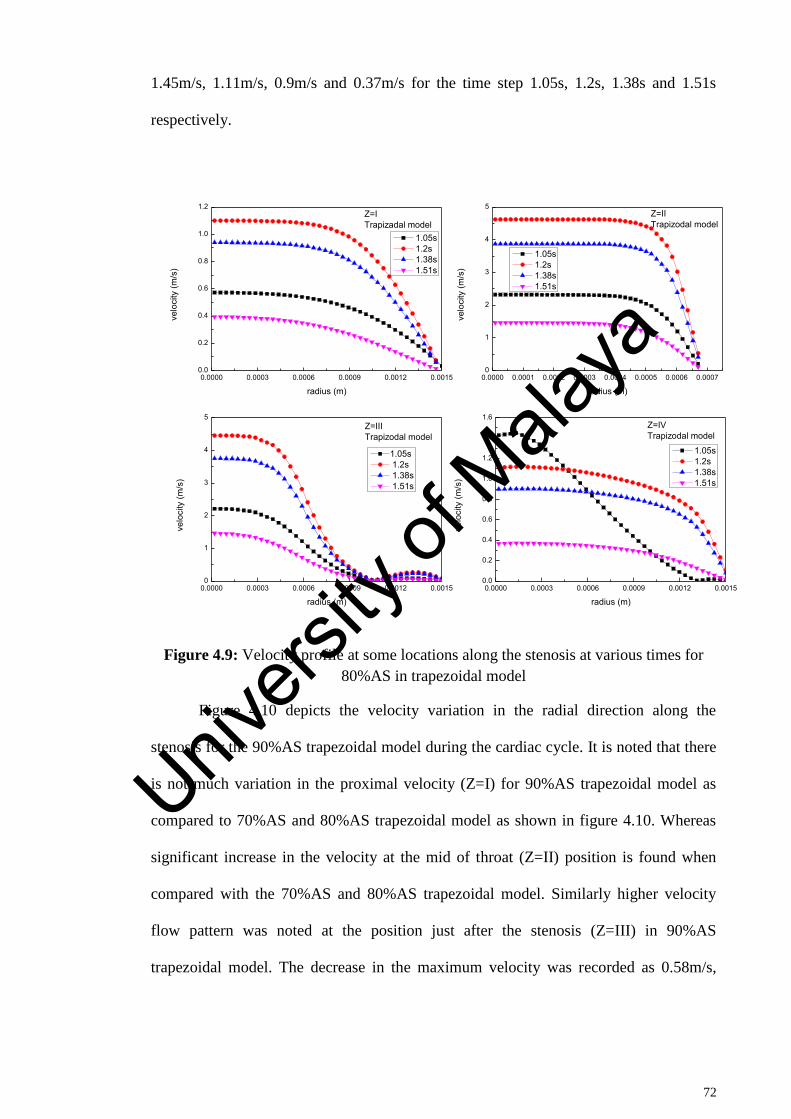
72
1.45m/s, 1.11m/s, 0.9m/s and 0.37m/s for the time step 1.05s, 1.2s, 1.38s and 1.51s
respectively.
Figure 4.9: Velocity profile at some locations along the stenosis at various times for
80%AS in trapezoidal model
Figure 4.10 depicts the velocity variation in the radial direction along the
stenosis for the 90%AS trapezoidal model during the cardiac cycle. It is noted that there
is not much variation in the proximal velocity (Z=I) for 90%AS trapezoidal model as
compared to 70%AS and 80%AS trapezoidal model as shown in figure 4.10. Whereas
significant increase in the velocity at the mid of throat (Z=II) position is found when
compared with the 70%AS and 80%AS trapezoidal model. Similarly higher velocity
flow pattern was noted at the position just after the stenosis (Z=III) in 90%AS
trapezoidal model. The decrease in the maximum velocity was recorded as 0.58m/s,
0.0000 0.0003 0.0006 0.0009 0.0012 0.00150.0
0.2
0.4
0.6
0.8
1.0
1.2
0.0000 0.0001 0.0002 0.0003 0.0004 0.0005 0.0006 0.00070
1
2
3
4
5
0.0000 0.0003 0.0006 0.0009 0.0012 0.00150
1
2
3
4
5
0.0000 0.0003 0.0006 0.0009 0.0012 0.00150.0
0.2
0.4
0.6
0.8
1.0
1.2
1.4
1.6
velo
city
(m/s
)
radius (m)
1.05s 1.2s 1.38s 1.51s
Z=ITrapizadal model
velo
city
(m/s
)
radius (m)
1.05s 1.2s 1.38s 1.51s
Z=IITrapizodal model
velo
city
(m/s
)
radius (m)
1.05s 1.2s 1.38s 1.51s
Z=IIITrapizodal model
velo
city
(m/s
)
radius (m)
1.05s 1.2s 1.38s 1.51s
Z=IVTrapizodal model
Univers
ity of
Mala
ya
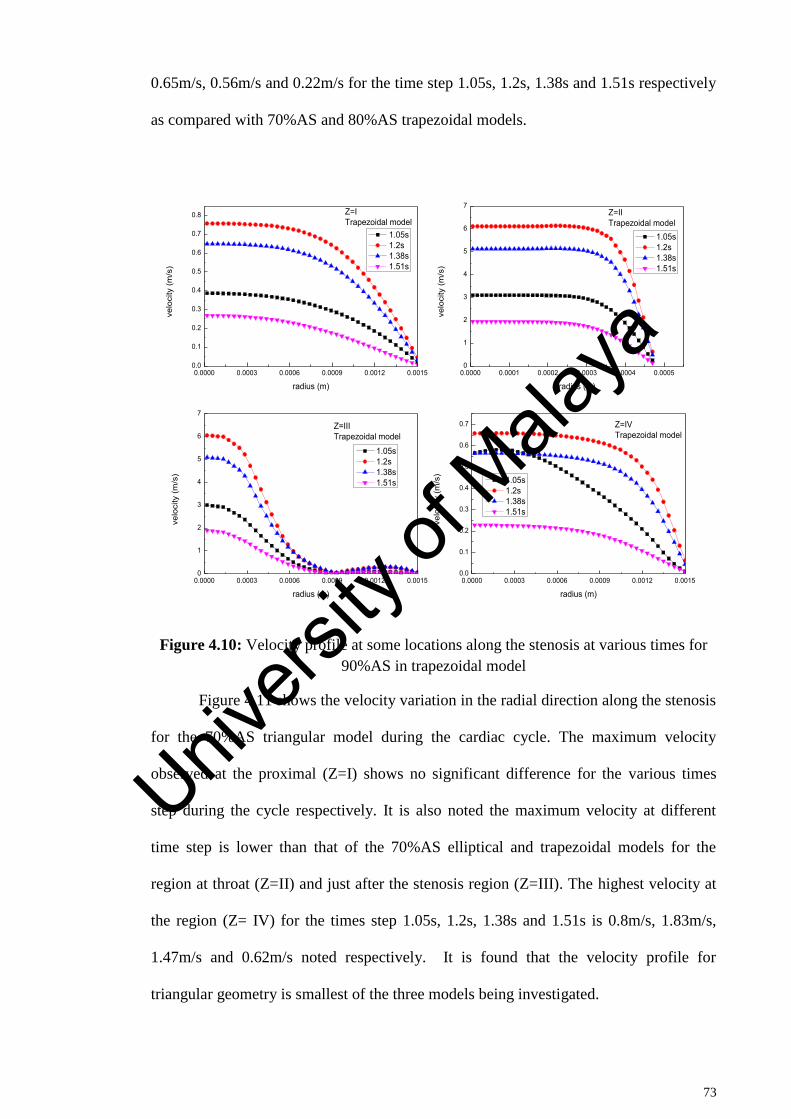
73
0.65m/s, 0.56m/s and 0.22m/s for the time step 1.05s, 1.2s, 1.38s and 1.51s respectively
as compared with 70%AS and 80%AS trapezoidal models.
Figure 4.10: Velocity profile at some locations along the stenosis at various times for
90%AS in trapezoidal model
Figure 4.11 shows the velocity variation in the radial direction along the stenosis
for the 70%AS triangular model during the cardiac cycle. The maximum velocity
observed at the proximal (Z=I) shows no significant difference for the various times
step during the cycle respectively. It is also noted the maximum velocity at different
time step is lower than that of the 70%AS elliptical and trapezoidal models for the
region at throat (Z=II) and just after the stenosis region (Z=III). The highest velocity at
the region (Z= IV) for the times step 1.05s, 1.2s, 1.38s and 1.51s is 0.8m/s, 1.83m/s,
1.47m/s and 0.62m/s noted respectively. It is found that the velocity profile for
triangular geometry is smallest of the three models being investigated.
0.0000 0.0003 0.0006 0.0009 0.0012 0.00150.0
0.1
0.2
0.3
0.4
0.5
0.6
0.7
0.8
0.0000 0.0001 0.0002 0.0003 0.0004 0.00050
1
2
3
4
5
6
7
0.0000 0.0003 0.0006 0.0009 0.0012 0.00150
1
2
3
4
5
6
7
0.0000 0.0003 0.0006 0.0009 0.0012 0.00150.0
0.1
0.2
0.3
0.4
0.5
0.6
0.7
velo
city
(m/s
)
radius (m)
1.05s 1.2s 1.38s 1.51s
Z=ITrapezoidal model
velo
city
(m/s
)
radius (m)
1.05s 1.2s 1.38s 1.51s
Z=IITrapezoidal model
velo
city
(m/s
)
radius (m)
1.05s 1.2s 1.38s 1.51s
Z=IIITrapezoidal model
velo
city
(m/s
)
radius (m)
1.05s 1.2s 1.38s 1.51s
Z=IVTrapezoidal model
Univers
ity of
Mala
ya
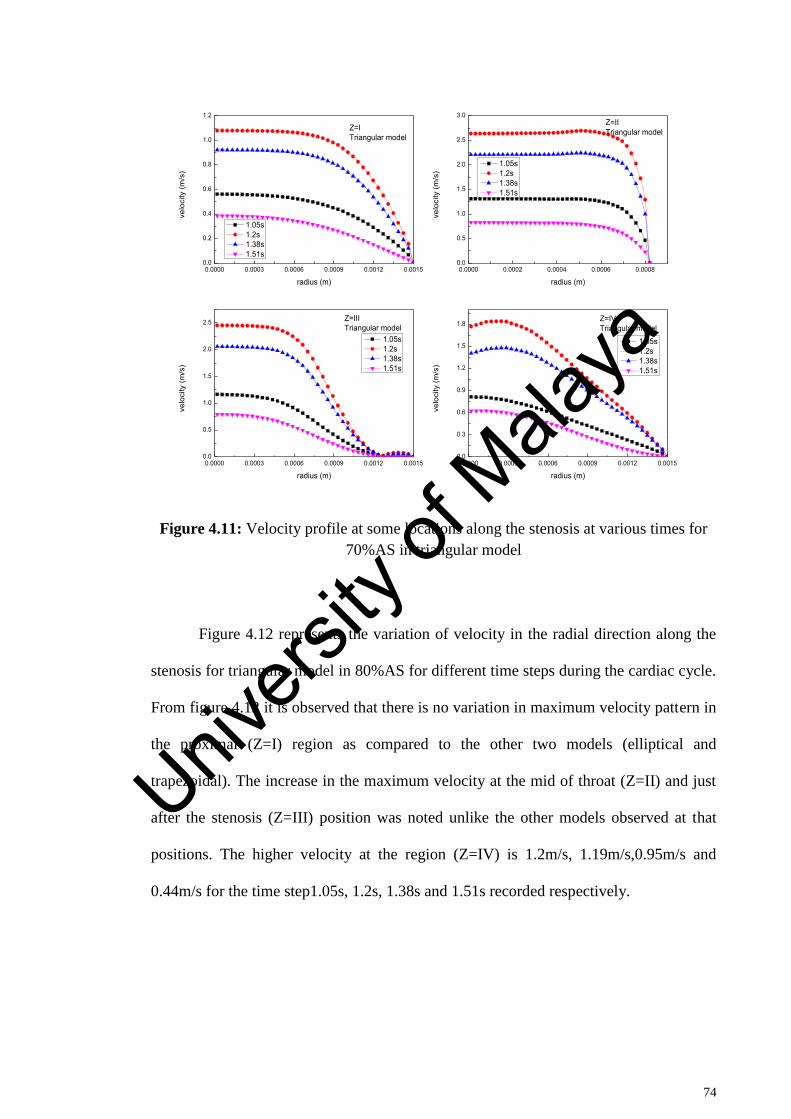
74
Figure 4.11: Velocity profile at some locations along the stenosis at various times for
70%AS in triangular model
Figure 4.12 represents the variation of velocity in the radial direction along the
stenosis for triangular model in 80%AS for different time steps during the cardiac cycle.
From figure 4.12 it is observed that there is no variation in maximum velocity pattern in
the proximal (Z=I) region as compared to the other two models (elliptical and
trapezoidal). The increase in the maximum velocity at the mid of throat (Z=II) and just
after the stenosis (Z=III) position was noted unlike the other models observed at that
positions. The higher velocity at the region (Z=IV) is 1.2m/s, 1.19m/s,0.95m/s and
0.44m/s for the time step1.05s, 1.2s, 1.38s and 1.51s recorded respectively.
0.0000 0.0003 0.0006 0.0009 0.0012 0.00150.0
0.2
0.4
0.6
0.8
1.0
1.2
0.0000 0.0002 0.0004 0.0006 0.00080.0
0.5
1.0
1.5
2.0
2.5
3.0
0.0000 0.0003 0.0006 0.0009 0.0012 0.00150.0
0.5
1.0
1.5
2.0
2.5
0.0000 0.0003 0.0006 0.0009 0.0012 0.00150.0
0.3
0.6
0.9
1.2
1.5
1.8
velo
city
(m/s
)
radius (m)
1.05s 1.2s 1.38s 1.51s
Z=ITriangular model
velo
city
(m/s
)
radius (m)
1.05s 1.2s 1.38s 1.51s
Z=IITriangular model
velo
city
(m/s
)
radius (m)
1.05s 1.2s 1.38s 1.51s
Z=IIITriangular model
velo
city
(m/s
)
radius (m)
1.05s 1.2s 1.38s 1.51s
Z=IVTriangular model
Univers
ity of
Mala
ya
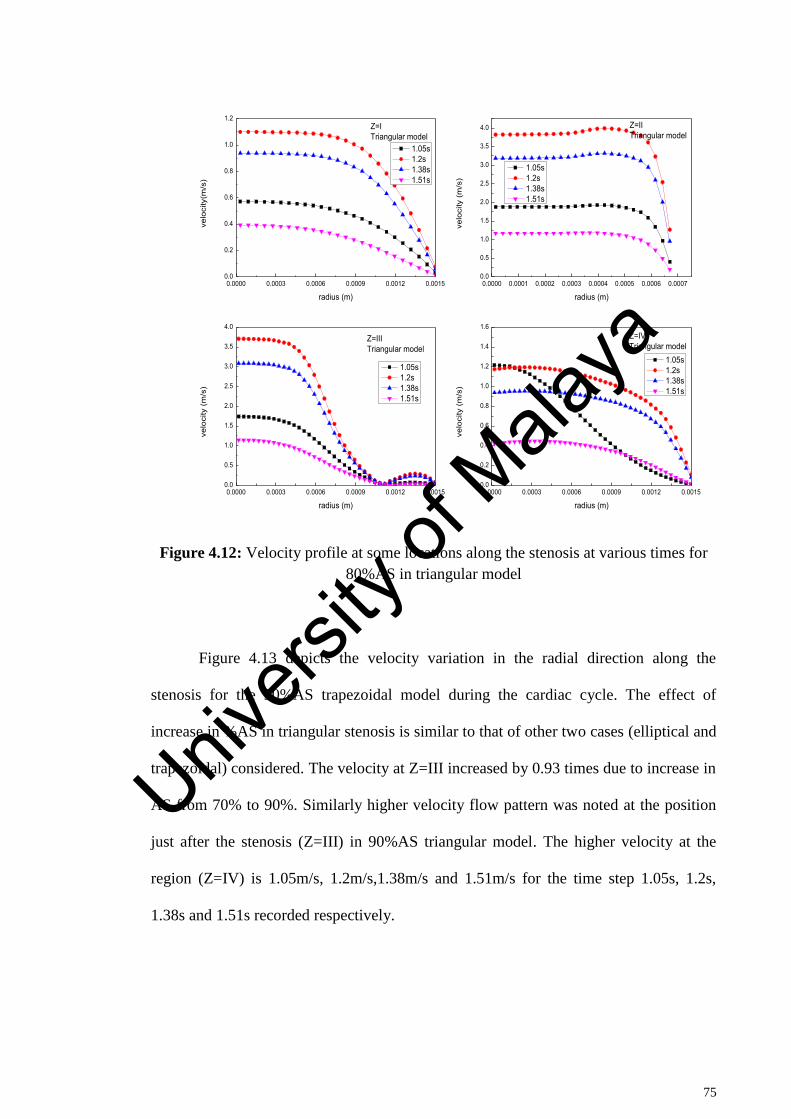
75
Figure 4.12: Velocity profile at some locations along the stenosis at various times for
80%AS in triangular model
Figure 4.13 depicts the velocity variation in the radial direction along the
stenosis for the 90%AS trapezoidal model during the cardiac cycle. The effect of
increase in %AS in triangular stenosis is similar to that of other two cases (elliptical and
trapezoidal) considered. The velocity at Z=III increased by 0.93 times due to increase in
AS from 70% to 90%. Similarly higher velocity flow pattern was noted at the position
just after the stenosis (Z=III) in 90%AS triangular model. The higher velocity at the
region (Z=IV) is 1.05m/s, 1.2m/s,1.38m/s and 1.51m/s for the time step 1.05s, 1.2s,
1.38s and 1.51s recorded respectively.
0.0000 0.0003 0.0006 0.0009 0.0012 0.00150.0
0.2
0.4
0.6
0.8
1.0
1.2
0.0000 0.0001 0.0002 0.0003 0.0004 0.0005 0.0006 0.00070.0
0.5
1.0
1.5
2.0
2.5
3.0
3.5
4.0
0.0000 0.0003 0.0006 0.0009 0.0012 0.00150.0
0.5
1.0
1.5
2.0
2.5
3.0
3.5
4.0
0.0000 0.0003 0.0006 0.0009 0.0012 0.00150.0
0.2
0.4
0.6
0.8
1.0
1.2
1.4
1.6
velo
city
(m/s
)
radius (m)
1.05s 1.2s 1.38s 1.51s
Z=ITriangular model
velo
city
(m
/s)
radius (m)
1.05s 1.2s 1.38s 1.51s
Z=IITriangular model
velo
city
(m
/s)
radius (m)
1.05s 1.2s 1.38s 1.51s
Z=IIITriangular model
velo
city
(m
/s)
radius (m)
1.05s 1.2s 1.38s 1.51s
Z=IVTriangular model
Univers
ity of
Mala
ya
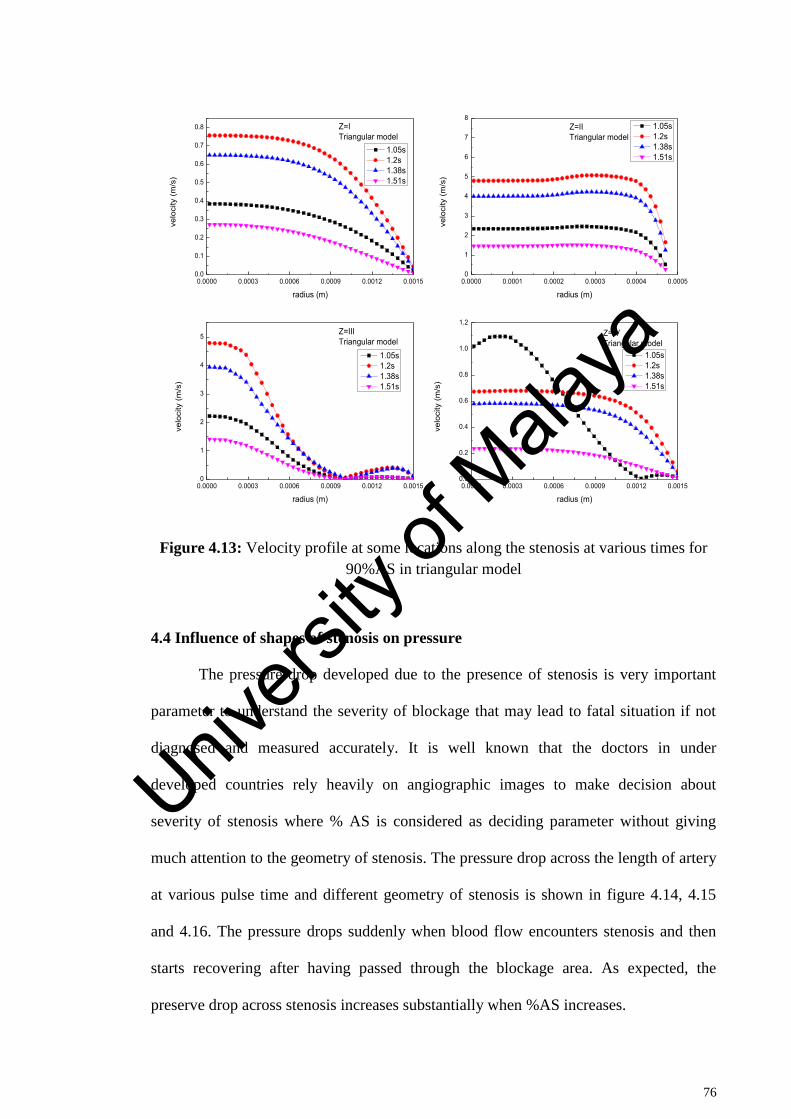
76
Figure 4.13: Velocity profile at some locations along the stenosis at various times for
90%AS in triangular model
4.4 Influence of shapes of stenosis on pressure
The pressure drop developed due to the presence of stenosis is very important
parameter to understand the severity of blockage that may lead to fatal situation if not
diagnosed and measured accurately. It is well known that the doctors in under
developed countries rely heavily on angiographic images to make decision about
severity of stenosis where % AS is considered as deciding parameter without giving
much attention to the geometry of stenosis. The pressure drop across the length of artery
at various pulse time and different geometry of stenosis is shown in figure 4.14, 4.15
and 4.16. The pressure drops suddenly when blood flow encounters stenosis and then
starts recovering after having passed through the blockage area. As expected, the
preserve drop across stenosis increases substantially when %AS increases.
0.0000 0.0003 0.0006 0.0009 0.0012 0.00150.0
0.1
0.2
0.3
0.4
0.5
0.6
0.7
0.8
0.0000 0.0001 0.0002 0.0003 0.0004 0.00050
1
2
3
4
5
6
7
8
0.0000 0.0003 0.0006 0.0009 0.0012 0.00150
1
2
3
4
5
0.0000 0.0003 0.0006 0.0009 0.0012 0.00150.0
0.2
0.4
0.6
0.8
1.0
1.2
velo
city
(m/s
)
radius (m)
1.05s 1.2s 1.38s 1.51s
Z=ITriangular model
velo
city
(m/s
)
radius (m)
1.05s 1.2s 1.38s 1.51s
Z=IITriangular model
velo
city
(m/s
)
radius (m)
1.05s 1.2s 1.38s 1.51s
Z=IIITriangular model
velo
city
(m/s
)
radius (m)
1.05s 1.2s 1.38s 1.51s
Z=IVTriangular model
Univers
ity of
Mala
ya
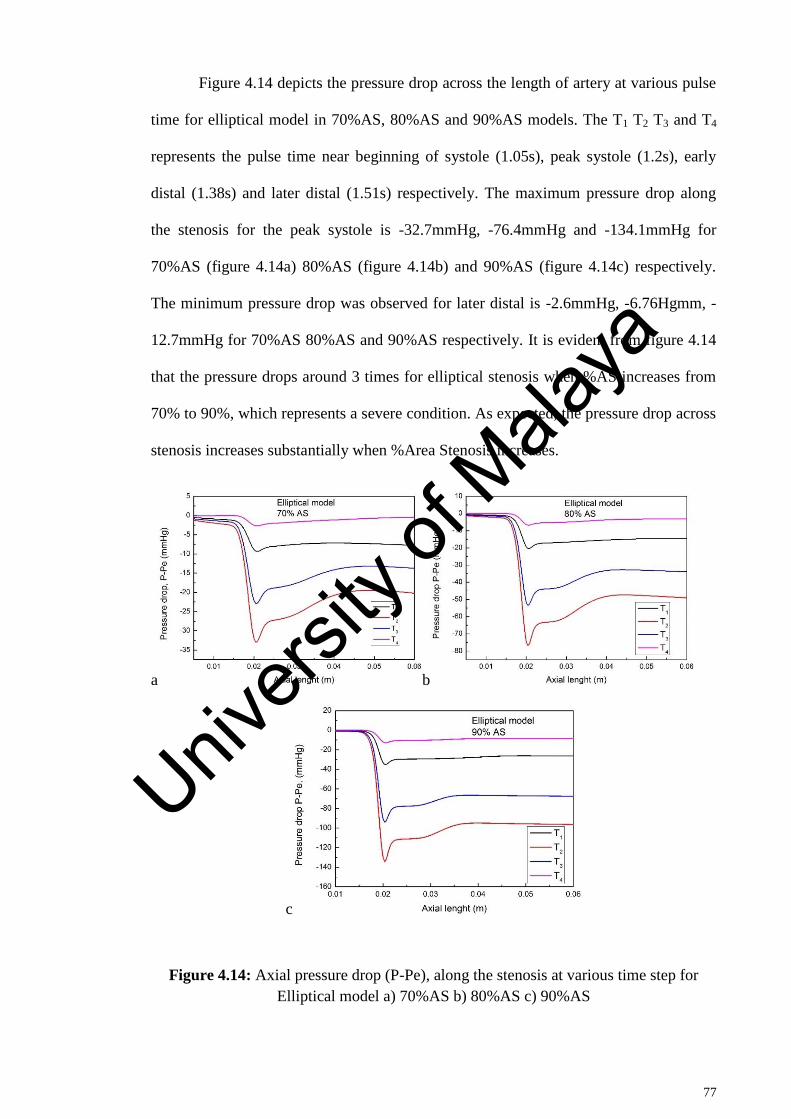
77
Figure 4.14 depicts the pressure drop across the length of artery at various pulse
time for elliptical model in 70%AS, 80%AS and 90%AS models. The T1 T2 T3 and T4
represents the pulse time near beginning of systole (1.05s), peak systole (1.2s), early
distal (1.38s) and later distal (1.51s) respectively. The maximum pressure drop along
the stenosis for the peak systole is -32.7mmHg, -76.4mmHg and -134.1mmHg for
70%AS (figure 4.14a) 80%AS (figure 4.14b) and 90%AS (figure 4.14c) respectively.
The minimum pressure drop was observed for later distal is -2.6mmHg, -6.76Hgmm, -
12.7mmHg for 70%AS 80%AS and 90%AS respectively. It is evident from figure 4.14
that the pressure drops around 3 times for elliptical stenosis when %AS increases from
70% to 90%, which represents a severe condition. As expected, the pressure drop across
stenosis increases substantially when %Area Stenosis increases.
a b
c
Figure 4.14: Axial pressure drop (P-Pe), along the stenosis at various time step for
Elliptical model a) 70%AS b) 80%AS c) 90%AS
Univers
ity of
Mala
ya

78
Figure 4.15 illustrates the pressure drop across the length of artery at various
pulse time for trapezoidal model in 70%AS, 80%AS and 90%AS. It is observed that the
maximum pressure drop during the peak systole are -36.5mmHg, -86.3mmHg and -
162.3mmHg for 70%AS (figure 4.15a), 80%AS (figure 4.15b) and 90%AS (figure
4.15c) respectively. Whereas the minimum pressure drop -3.03mmHg, -7.87mmHg and
-16.4mmHg for 70%AS, 80%AS and 90%AS was noted during the later distal
respectively. It is found from the figure 14.5 that the pressure drop is higher as
compared to that of the elliptical model during the entire cardiac cycle.
a b
c
Figure 4.15: Axial pressure drop (P-Pe), along the stenosis at various time step for
trapezoidal model a) 70%AS b) 80%AS c) 90%AS
The pressure drop across the length of artery at various pulse time for triangular
model in 70%AS, 80%AS and 90%AS was demonstrated in figure 4.16. It is found that
Univers
ity of
Mala
ya
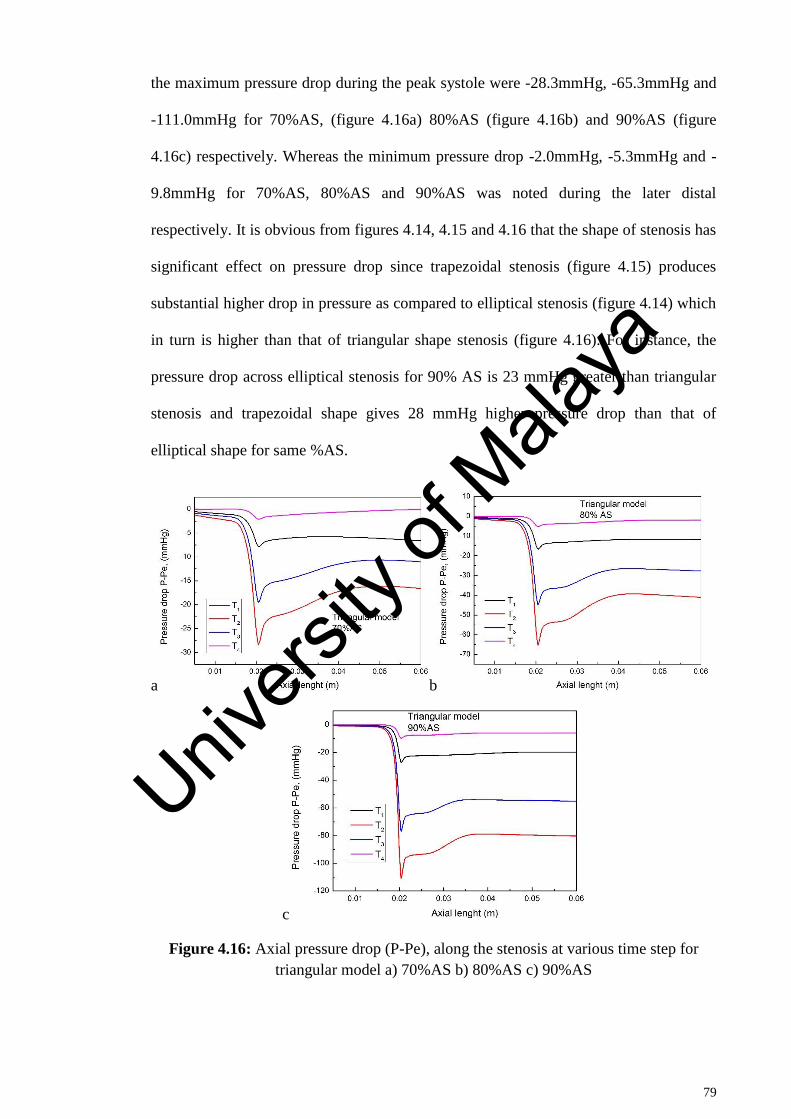
79
the maximum pressure drop during the peak systole were -28.3mmHg, -65.3mmHg and
-111.0mmHg for 70%AS, (figure 4.16a) 80%AS (figure 4.16b) and 90%AS (figure
4.16c) respectively. Whereas the minimum pressure drop -2.0mmHg, -5.3mmHg and -
9.8mmHg for 70%AS, 80%AS and 90%AS was noted during the later distal
respectively. It is obvious from figures 4.14, 4.15 and 4.16 that the shape of stenosis has
significant effect on pressure drop since trapezoidal stenosis (figure 4.15) produces
substantial higher drop in pressure as compared to elliptical stenosis (figure 4.14) which
in turn is higher than that of triangular shape stenosis (figure 4.16). For instance, the
pressure drop across elliptical stenosis for 90% AS is 23 mmHg greater than triangular
stenosis and trapezoidal shape gives 28 mmHg higher pressure drop than that of
elliptical shape for same %AS.
a b
c
Figure 4.16: Axial pressure drop (P-Pe), along the stenosis at various time step for
triangular model a) 70%AS b) 80%AS c) 90%AS
Univers
ity of
Mala
ya
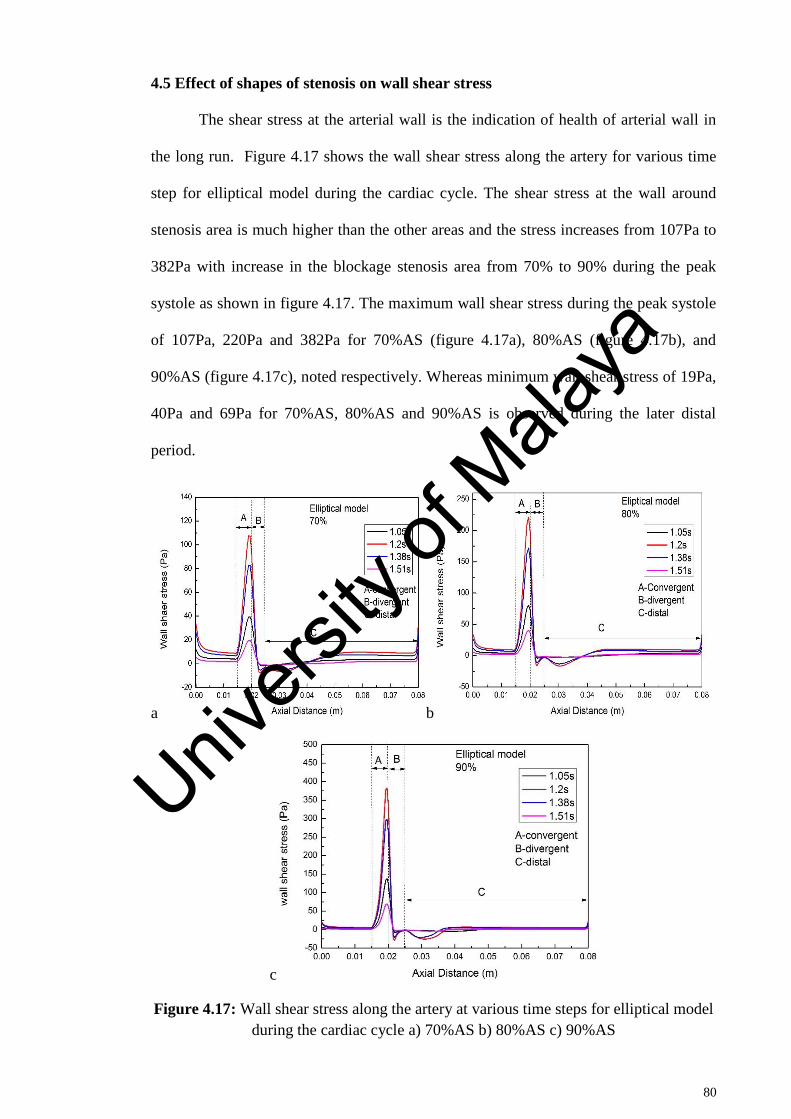
80
4.5 Effect of shapes of stenosis on wall shear stress
The shear stress at the arterial wall is the indication of health of arterial wall in
the long run. Figure 4.17 shows the wall shear stress along the artery for various time
step for elliptical model during the cardiac cycle. The shear stress at the wall around
stenosis area is much higher than the other areas and the stress increases from 107Pa to
382Pa with increase in the blockage stenosis area from 70% to 90% during the peak
systole as shown in figure 4.17. The maximum wall shear stress during the peak systole
of 107Pa, 220Pa and 382Pa for 70%AS (figure 4.17a), 80%AS (figure 4.17b), and
90%AS (figure 4.17c), noted respectively. Whereas minimum wall shear stress of 19Pa,
40Pa and 69Pa for 70%AS, 80%AS and 90%AS is observed during the later distal
period.
a b
c
Figure 4.17: Wall shear stress along the artery at various time steps for elliptical model
during the cardiac cycle a) 70%AS b) 80%AS c) 90%AS
Univers
ity of
Mala
ya
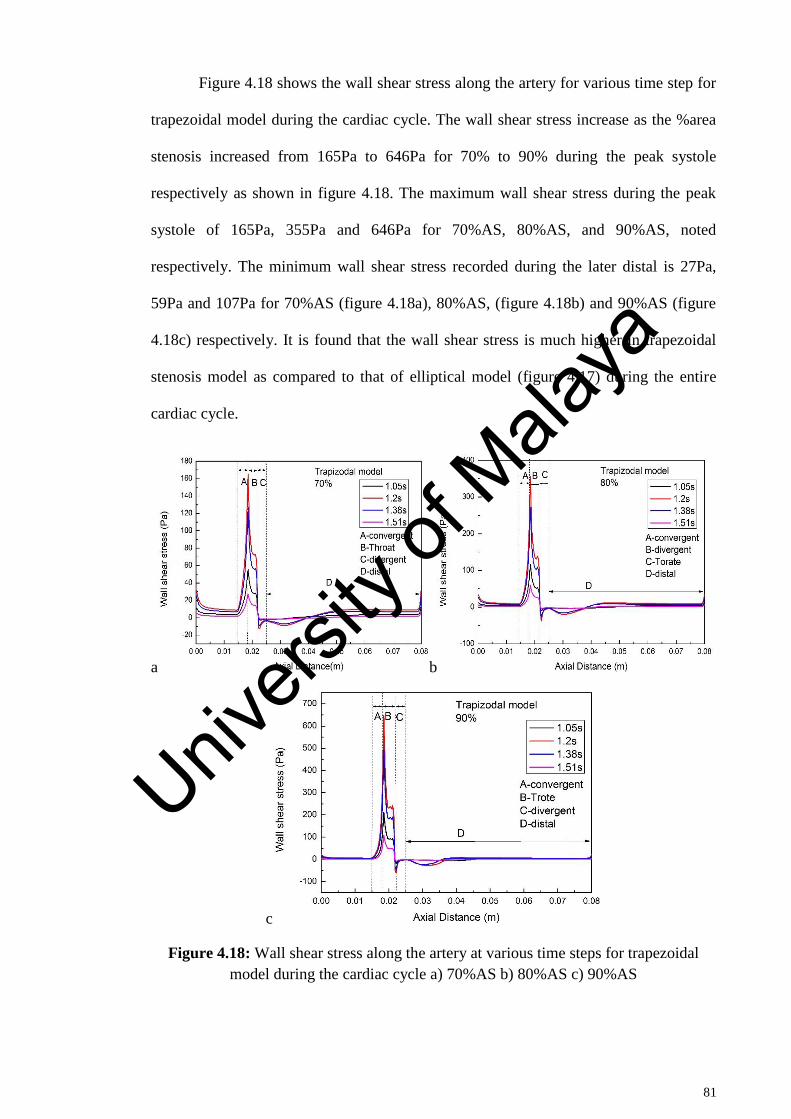
81
Figure 4.18 shows the wall shear stress along the artery for various time step for
trapezoidal model during the cardiac cycle. The wall shear stress increase as the %area
stenosis increased from 165Pa to 646Pa for 70% to 90% during the peak systole
respectively as shown in figure 4.18. The maximum wall shear stress during the peak
systole of 165Pa, 355Pa and 646Pa for 70%AS, 80%AS, and 90%AS, noted
respectively. The minimum wall shear stress recorded during the later distal is 27Pa,
59Pa and 107Pa for 70%AS (figure 4.18a), 80%AS, (figure 4.18b) and 90%AS (figure
4.18c) respectively. It is found that the wall shear stress is much higher in trapezoidal
stenosis model as compared to that of elliptical model (figure 4.17) during the entire
cardiac cycle.
a b
c
Figure 4.18: Wall shear stress along the artery at various time steps for trapezoidal
model during the cardiac cycle a) 70%AS b) 80%AS c) 90%AS
Univers
ity of
Mala
ya
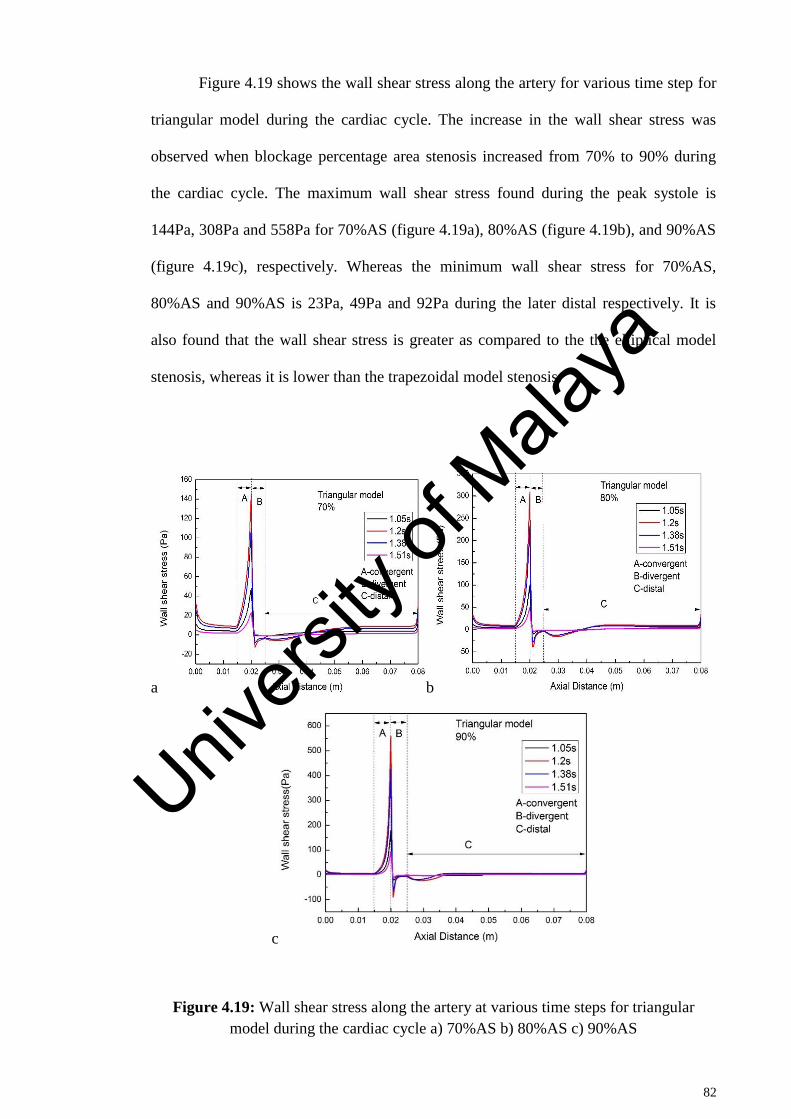
82
Figure 4.19 shows the wall shear stress along the artery for various time step for
triangular model during the cardiac cycle. The increase in the wall shear stress was
observed when blockage percentage area stenosis increased from 70% to 90% during
the cardiac cycle. The maximum wall shear stress found during the peak systole is
144Pa, 308Pa and 558Pa for 70%AS (figure 4.19a), 80%AS (figure 4.19b), and 90%AS
(figure 4.19c), respectively. Whereas the minimum wall shear stress for 70%AS,
80%AS and 90%AS is 23Pa, 49Pa and 92Pa during the later distal respectively. It is
also found that the wall shear stress is greater as compared to the the elliptical model
stenosis, whereas it is lower than the trapezoidal model stenosis.
a b
c
Figure 4.19: Wall shear stress along the artery at various time steps for triangular
model during the cardiac cycle a) 70%AS b) 80%AS c) 90%AS
Univers
ity of
Mala
ya
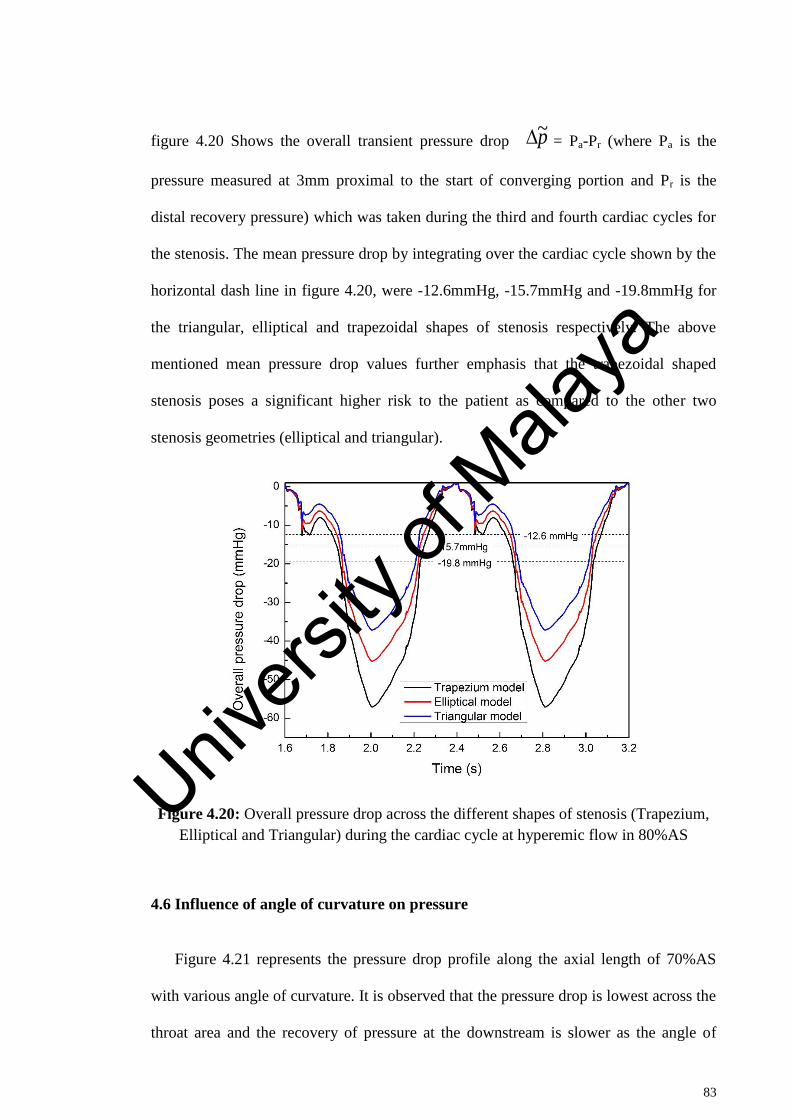
83
figure 4.20 Shows the overall transient pressure drop = Pa-Pr (where Pa is the
pressure measured at 3mm proximal to the start of converging portion and Pr is the
distal recovery pressure) which was taken during the third and fourth cardiac cycles for
the stenosis. The mean pressure drop by integrating over the cardiac cycle shown by the
horizontal dash line in figure 4.20, were -12.6mmHg, -15.7mmHg and -19.8mmHg for
the triangular, elliptical and trapezoidal shapes of stenosis respectively. The above
mentioned mean pressure drop values further emphasis that the trapezoidal shaped
stenosis poses a significant higher risk to the patient as compared to the other two
stenosis geometries (elliptical and triangular).
Figure 4.20: Overall pressure drop across the different shapes of stenosis (Trapezium,
Elliptical and Triangular) during the cardiac cycle at hyperemic flow in 80%AS
4.6 Influence of angle of curvature on pressure
Figure 4.21 represents the pressure drop profile along the axial length of 70%AS
with various angle of curvature. It is observed that the pressure drop is lowest across the
throat area and the recovery of pressure at the downstream is slower as the angle of
p~
Univers
ity of
Mala
ya
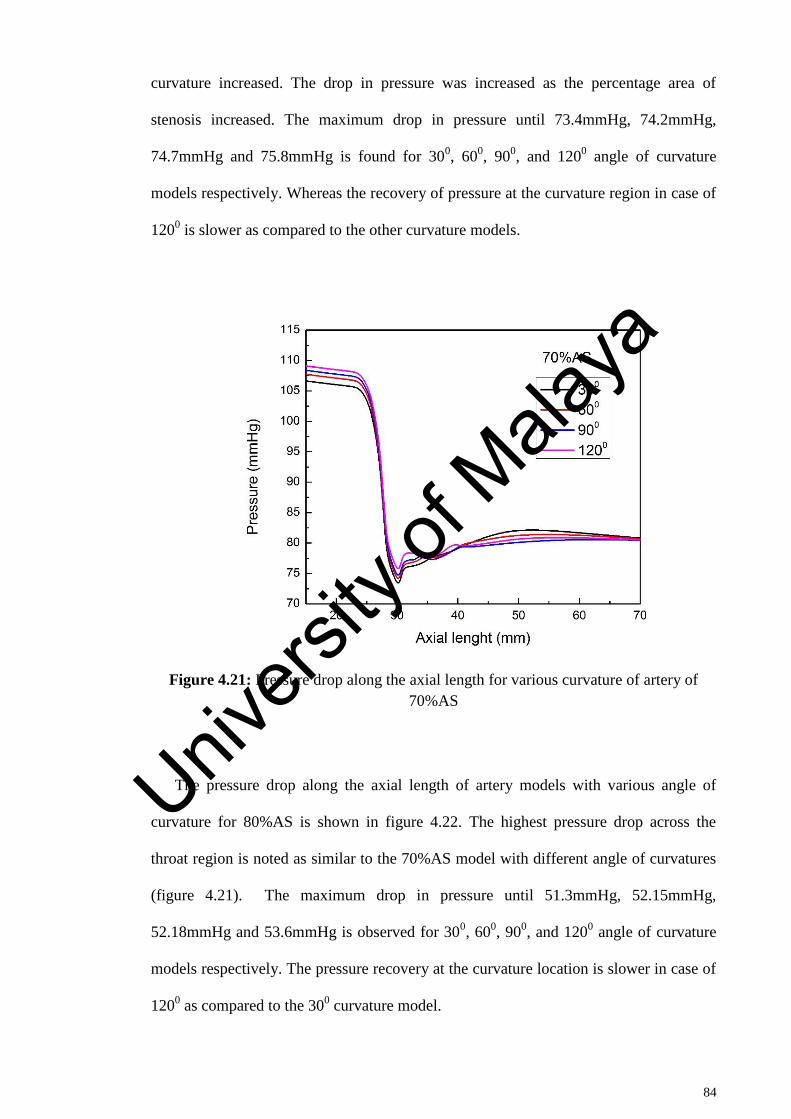
84
curvature increased. The drop in pressure was increased as the percentage area of
stenosis increased. The maximum drop in pressure until 73.4mmHg, 74.2mmHg,
74.7mmHg and 75.8mmHg is found for 300, 60
0, 90
0, and 120
0 angle of curvature
models respectively. Whereas the recovery of pressure at the curvature region in case of
1200 is slower as compared to the other curvature models.
Figure 4.21: Pressure drop along the axial length for various curvature of artery of
70%AS
The pressure drop along the axial length of artery models with various angle of
curvature for 80%AS is shown in figure 4.22. The highest pressure drop across the
throat region is noted as similar to the 70%AS model with different angle of curvatures
(figure 4.21). The maximum drop in pressure until 51.3mmHg, 52.15mmHg,
52.18mmHg and 53.6mmHg is observed for 300, 60
0, 90
0, and 120
0 angle of curvature
models respectively. The pressure recovery at the curvature location is slower in case of
1200 as compared to the 30
0 curvature model.
Univers
ity of
Mala
ya
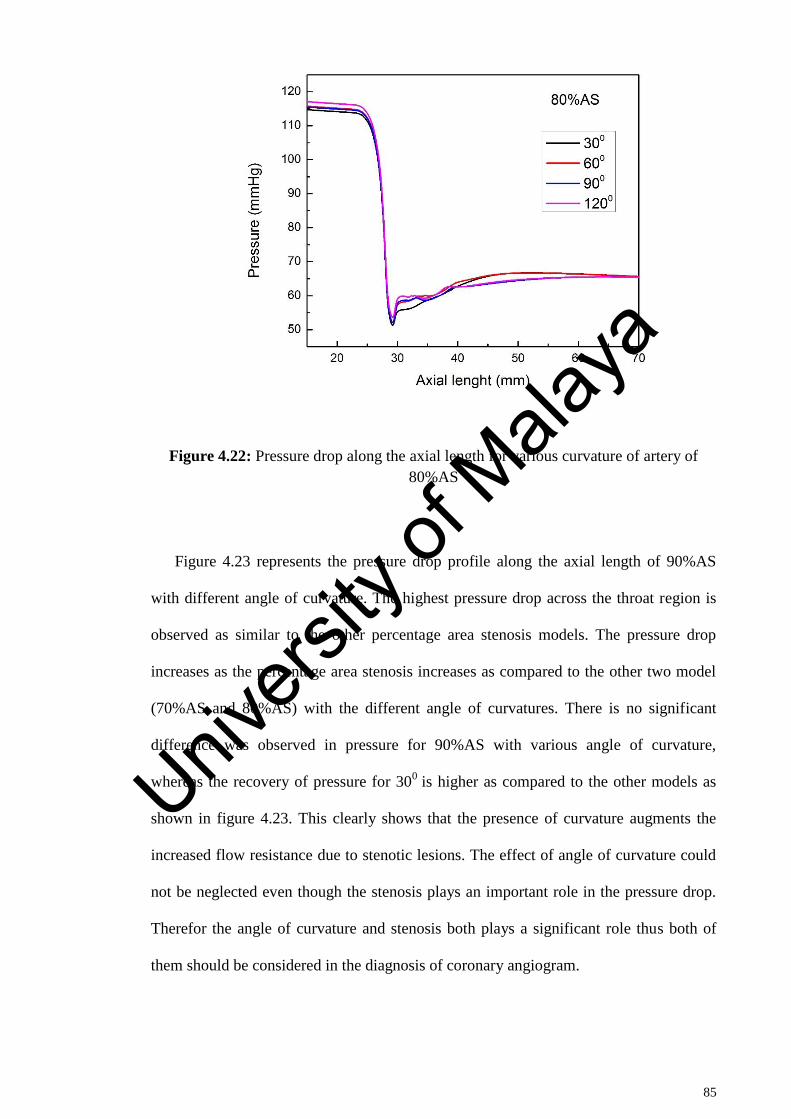
85
Figure 4.22: Pressure drop along the axial length for various curvature of artery of
80%AS
Figure 4.23 represents the pressure drop profile along the axial length of 90%AS
with different angle of curvature. The highest pressure drop across the throat region is
observed as similar to the other percentage area stenosis models. The pressure drop
increases as the percentage area stenosis increases as compared to the other two model
(70%AS and 80%AS) with the different angle of curvatures. There is no significant
difference was observed in pressure for 90%AS with various angle of curvature,
whereas the recovery of pressure for 300
is higher as compared to the other models as
shown in figure 4.23. This clearly shows that the presence of curvature augments the
increased flow resistance due to stenotic lesions. The effect of angle of curvature could
not be neglected even though the stenosis plays an important role in the pressure drop.
Therefor the angle of curvature and stenosis both plays a significant role thus both of
them should be considered in the diagnosis of coronary angiogram.
Univers
ity of
Mala
ya
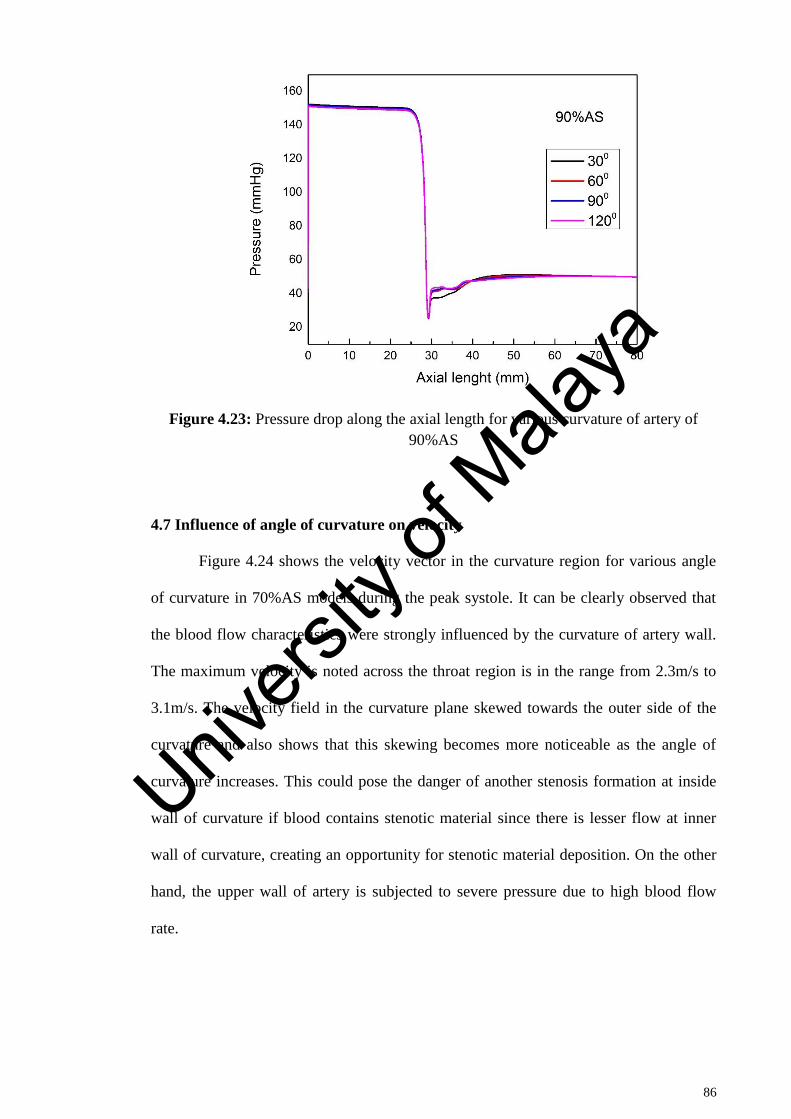
86
Figure 4.23: Pressure drop along the axial length for various curvature of artery of
90%AS
4.7 Influence of angle of curvature on velocity
Figure 4.24 shows the velocity vector in the curvature region for various angle
of curvature in 70%AS models during the peak systole. It can be clearly observed that
the blood flow characteristics were strongly influenced by the curvature of artery wall.
The maximum velocity is noted across the throat region is in the range from 2.3m/s to
3.1m/s. The velocity field in the curvature plane skewed towards the outer side of the
curvature and also shows that this skewing becomes more noticeable as the angle of
curvature increases. This could pose the danger of another stenosis formation at inside
wall of curvature if blood contains stenotic material since there is lesser flow at inner
wall of curvature, creating an opportunity for stenotic material deposition. On the other
hand, the upper wall of artery is subjected to severe pressure due to high blood flow
rate.
Univers
ity of
Mala
ya

87
a b
c d
Figure 4.24: Velocity contours for various curvature of artery with 70% area stenosis
during the peak systole of cardiac cycle a) 300 b) 60
0 c) 90
0 d) 120
0
Figure 4.25 depicts the velocity vector in the curvature region for various angle
of curvature in 80%AS models during the peak systole. It can be clearly seen that the
velocity increased across the throat region in the range from 3.1m/s to 4.1m/s as
compared to the 70% AS models with different angle of curvatures. A similar pattern of
velocity skewed towards the outer wall with the creation low flow region across the
inner wall as compared to the 70%AS model with various angle of curvature (figure
4.24). Figure 2.25 also shows that the skewing becomes more noticeable as the angle of
curvature increases.
Univers
ity of
Mala
ya
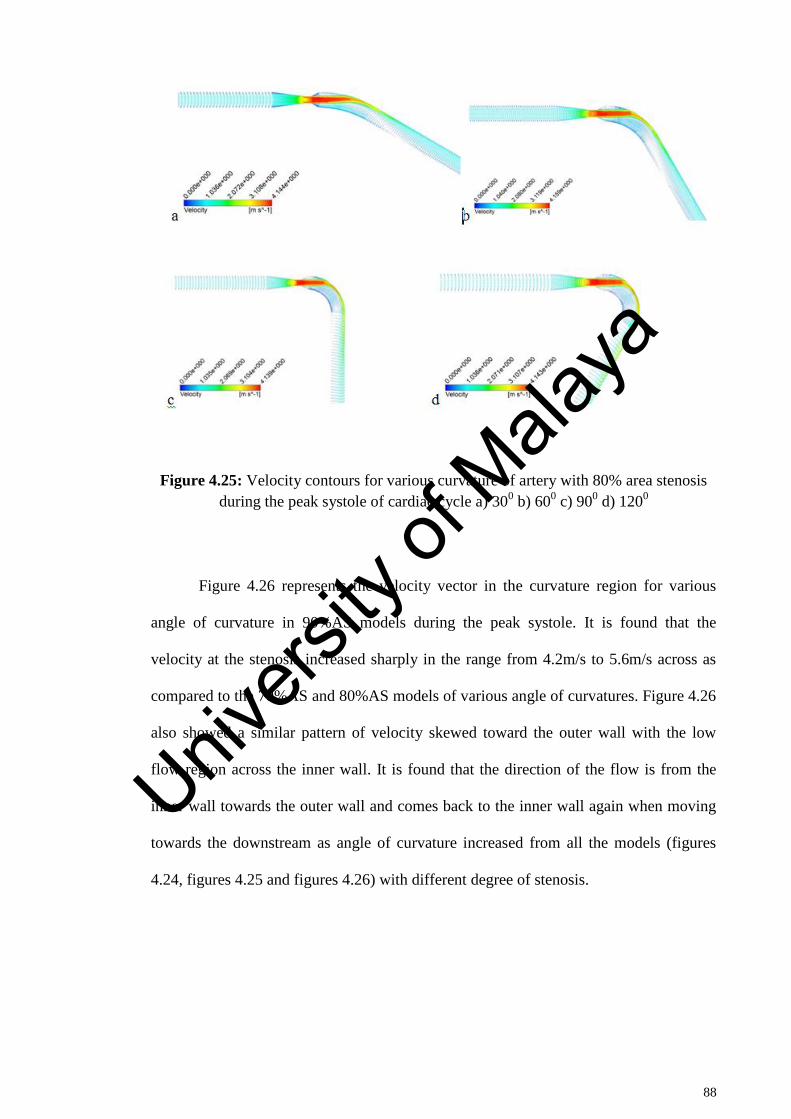
88
Figure 4.25: Velocity contours for various curvature of artery with 80% area stenosis
during the peak systole of cardiac cycle a) 300 b) 60
0 c) 90
0 d) 120
0
Figure 4.26 represents the velocity vector in the curvature region for various
angle of curvature in 90%AS models during the peak systole. It is found that the
velocity at the stenosis increased sharply in the range from 4.2m/s to 5.6m/s across as
compared to the 70%AS and 80%AS models of various angle of curvatures. Figure 4.26
also showed a similar pattern of velocity skewed toward the outer wall with the low
flow region across the inner wall. It is found that the direction of the flow is from the
inner wall towards the outer wall and comes back to the inner wall again when moving
towards the downstream as angle of curvature increased from all the models (figures
4.24, figures 4.25 and figures 4.26) with different degree of stenosis.
Univers
ity of
Mala
ya
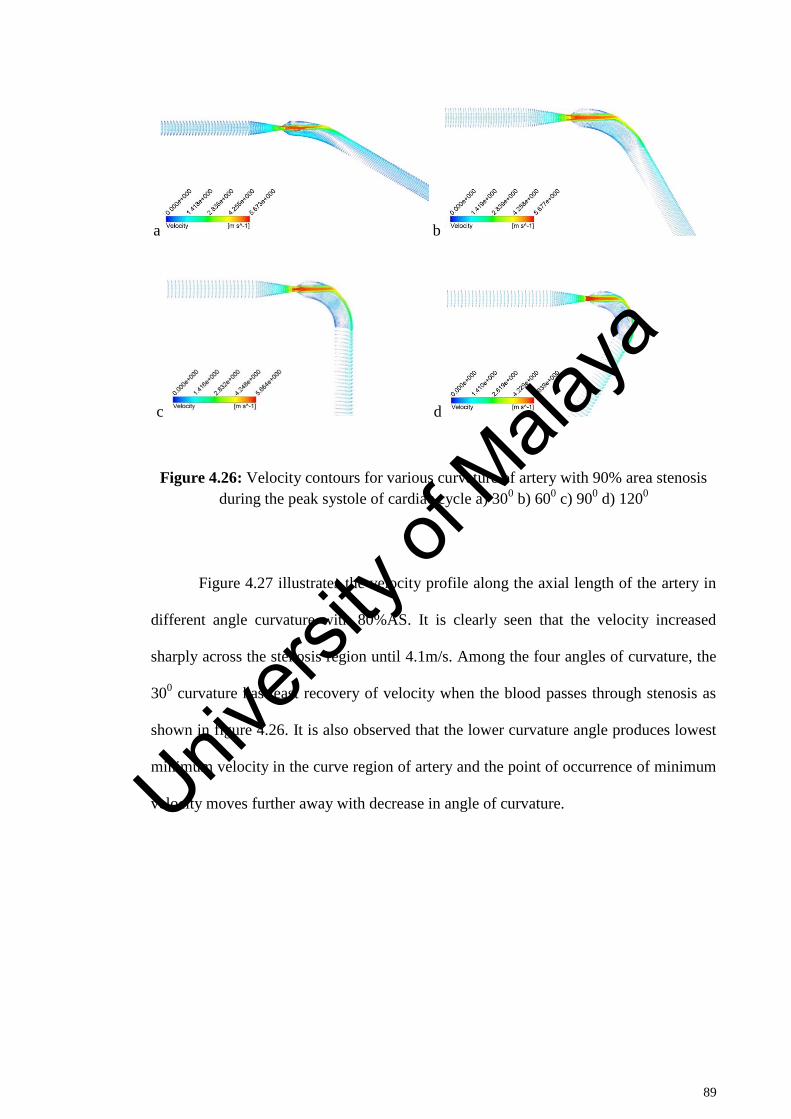
89
a b
c d
Figure 4.26: Velocity contours for various curvature of artery with 90% area stenosis
during the peak systole of cardiac cycle a) 300 b) 60
0 c) 90
0 d) 120
0
Figure 4.27 illustrates the velocity profile along the axial length of the artery in
different angle curvature with 80%AS. It is clearly seen that the velocity increased
sharply across the stenosis region until 4.1m/s. Among the four angles of curvature, the
300 curvature has least recovery of velocity when the blood passes through stenosis as
shown in figure 4.26. It is also observed that the lower curvature angle produces lowest
minimum velocity in the curve region of artery and the point of occurrence of minimum
velocity moves further away with decrease in angle of curvature.
Univers
ity of
Mala
ya
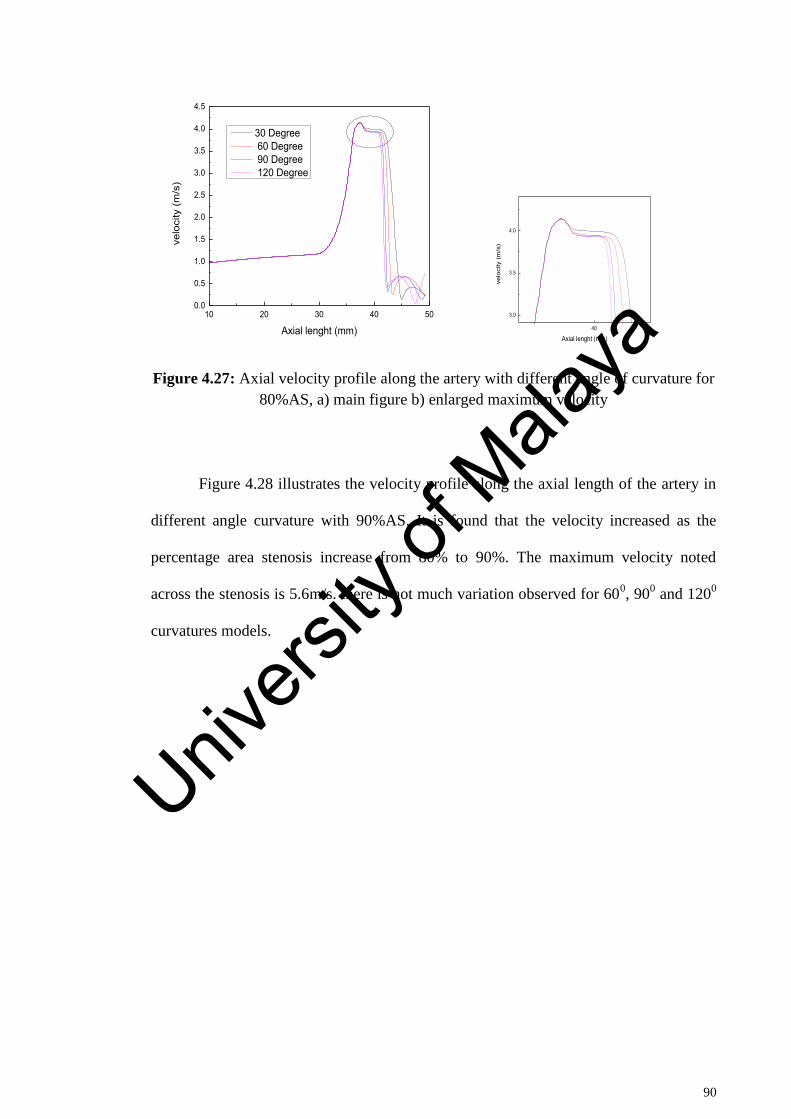
90
Figure 4.27: Axial velocity profile along the artery with different angle of curvature for
80%AS, a) main figure b) enlarged maximum velocity
Figure 4.28 illustrates the velocity profile along the axial length of the artery in
different angle curvature with 90%AS. It is found that the velocity increased as the
percentage area stenosis increase from 80% to 90%. The maximum velocity noted
across the stenosis is 5.6m/s. there is not much variation observed for 600, 90
0 and 120
0
curvatures models.
10 20 30 40 500.0
0.5
1.0
1.5
2.0
2.5
3.0
3.5
4.0
4.5
velo
city
(m/s
)
Axial lenght (mm)
30 Degree 60 Degree 90 Degree 120 Degree
40
3.0
3.5
4.0
velo
city
(m
/s)
Axial lenght (mm)
Univers
ity of
Mala
ya
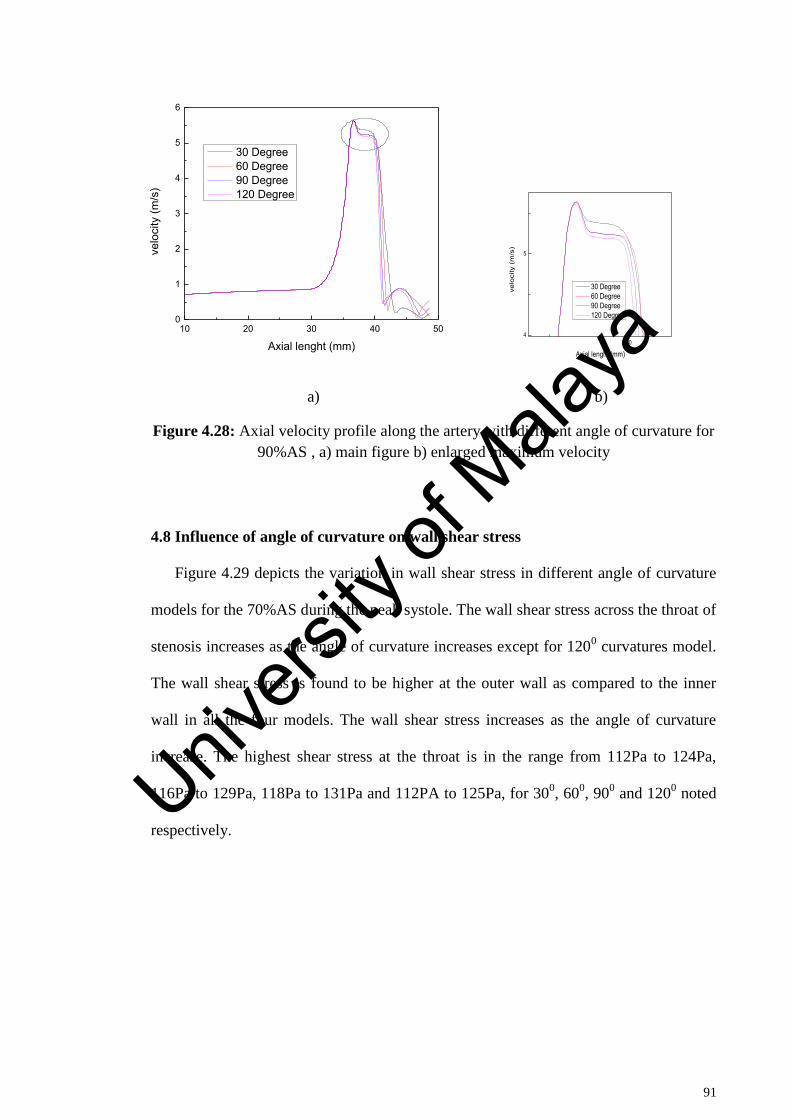
91
a) b)
Figure 4.28: Axial velocity profile along the artery with different angle of curvature for
90%AS , a) main figure b) enlarged maximum velocity
4.8 Influence of angle of curvature on wall shear stress
Figure 4.29 depicts the variation in wall shear stress in different angle of curvature
models for the 70%AS during the peak systole. The wall shear stress across the throat of
stenosis increases as the angle of curvature increases except for 1200 curvatures model.
The wall shear stress is found to be higher at the outer wall as compared to the inner
wall in all the four models. The wall shear stress increases as the angle of curvature
increase. The highest shear stress at the throat is in the range from 112Pa to 124Pa,
116Pa to 129Pa, 118Pa to 131Pa and 112PA to 125Pa, for 300, 60
0, 90
0 and 120
0 noted
respectively.
10 20 30 40 500
1
2
3
4
5
6
velo
city
(m/s
)
Axial lenght (mm)
30 Degree 60 Degree 90 Degree 120 Degree
404
5
velo
city
(m
/s)
Axial lenght (mm)
30 Degree 60 Degree 90 Degree 120 Degree
Univers
ity of
Mala
ya
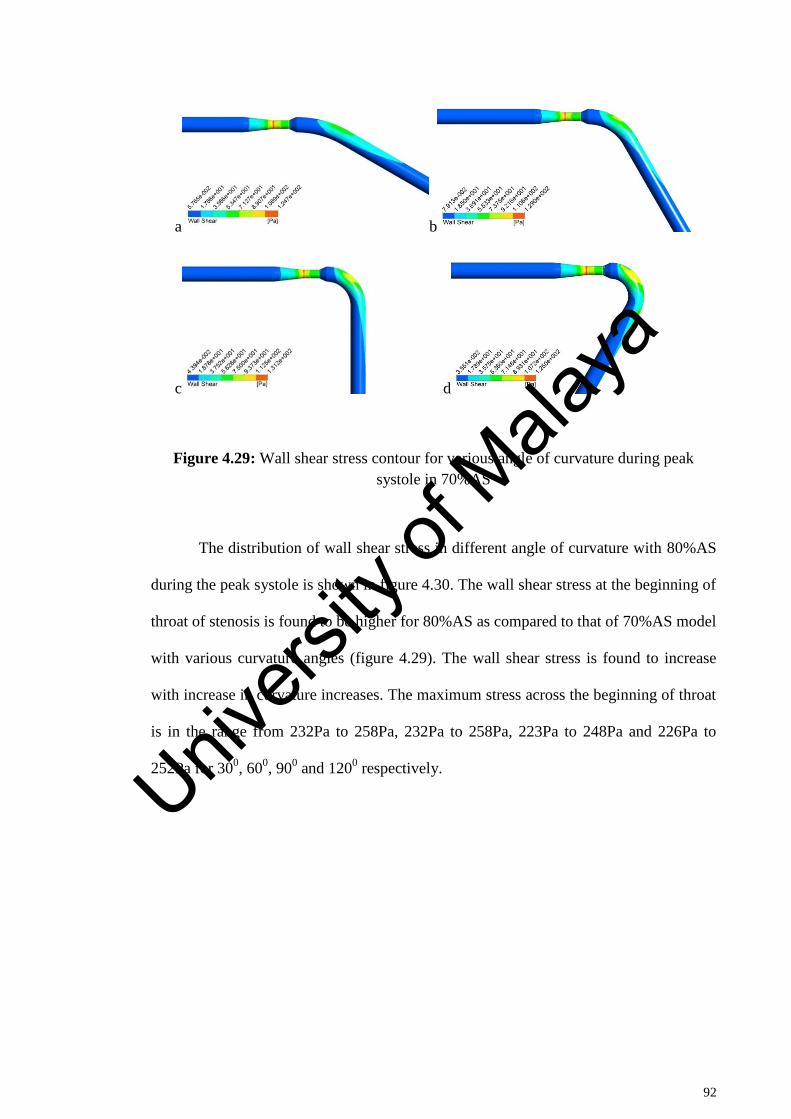
92
a b
c d
Figure 4.29: Wall shear stress contour for various angle of curvature during peak
systole in 70%AS
The distribution of wall shear stress in different angle of curvature with 80%AS
during the peak systole is shown in figure 4.30. The wall shear stress at the beginning of
throat of stenosis is found to be higher for 80%AS as compared to that of 70%AS model
with various curvature angles (figure 4.29). The wall shear stress is found to increase
with increase in curvature increases. The maximum stress across the beginning of throat
is in the range from 232Pa to 258Pa, 232Pa to 258Pa, 223Pa to 248Pa and 226Pa to
252Pa for 300, 60
0, 90
0 and 120
0 respectively.
Univers
ity of
Mala
ya
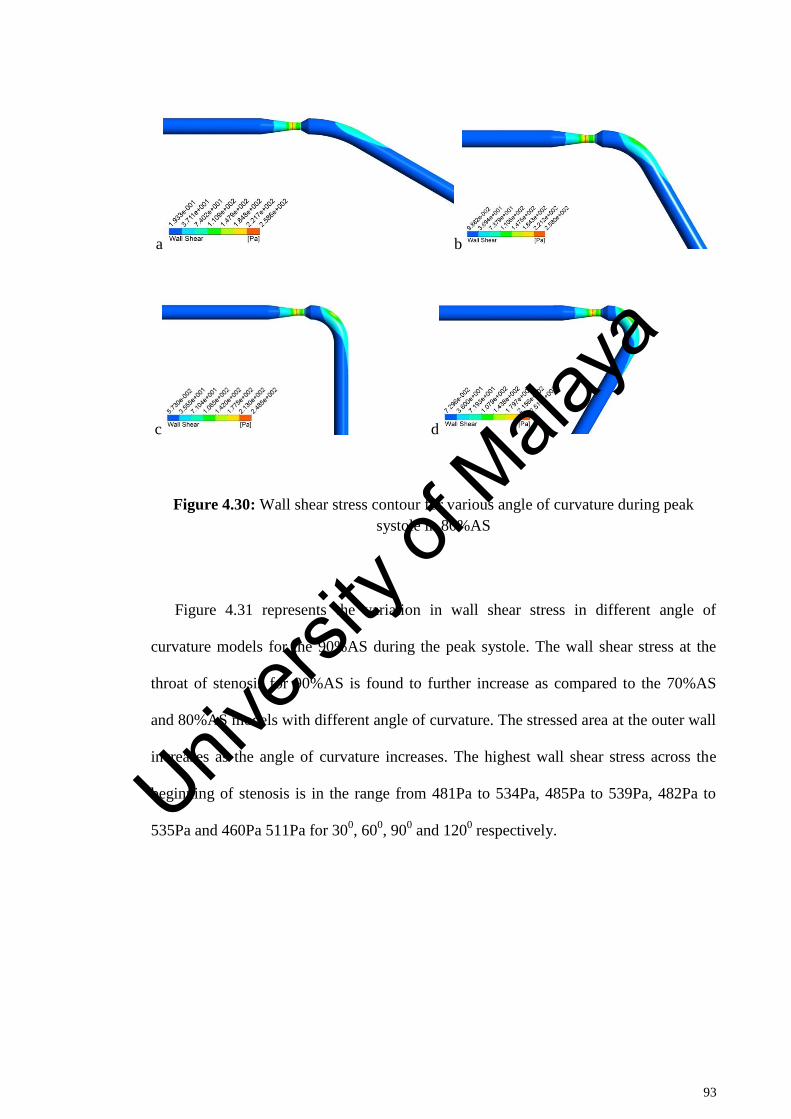
93
a b
c d
Figure 4.30: Wall shear stress contour for various angle of curvature during peak
systole in 80%AS
Figure 4.31 represents the variation in wall shear stress in different angle of
curvature models for the 90%AS during the peak systole. The wall shear stress at the
throat of stenosis for 90%AS is found to further increase as compared to the 70%AS
and 80%AS models with different angle of curvature. The stressed area at the outer wall
increases as the angle of curvature increases. The highest wall shear stress across the
beginning of stenosis is in the range from 481Pa to 534Pa, 485Pa to 539Pa, 482Pa to
535Pa and 460Pa 511Pa for 300, 60
0, 90
0 and 120
0 respectively.
Univers
ity of
Mala
ya
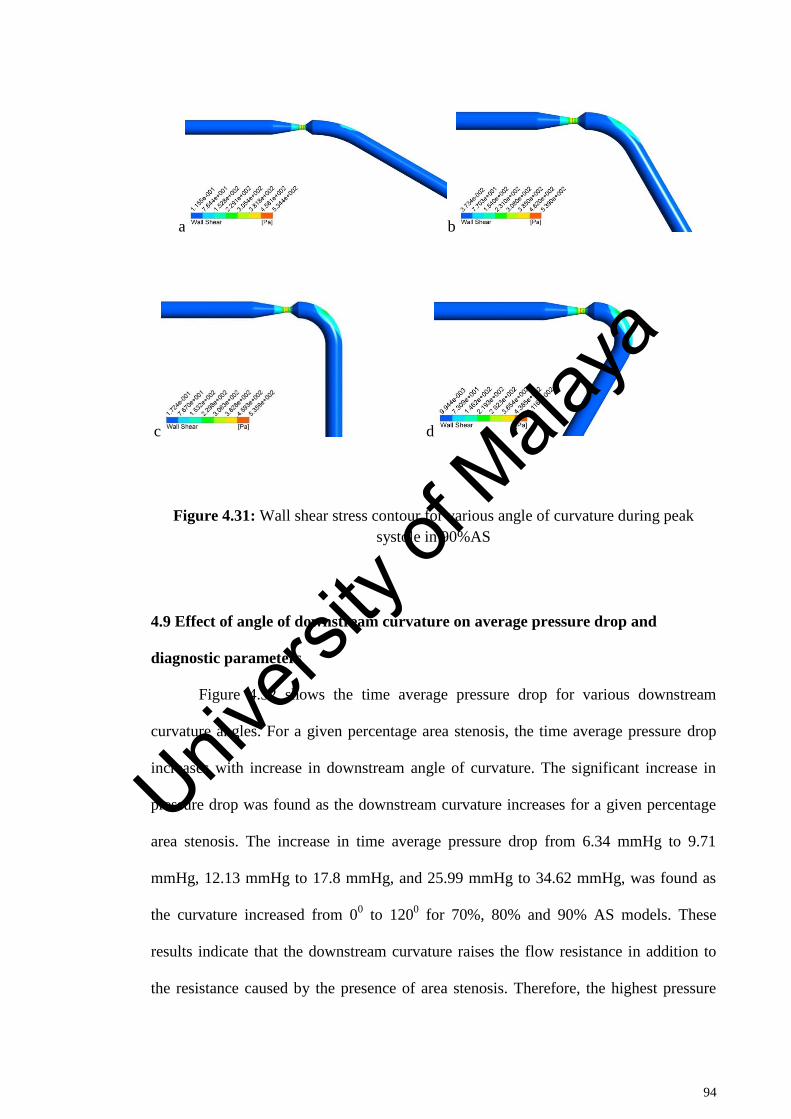
94
a b
c d
Figure 4.31: Wall shear stress contour for various angle of curvature during peak
systole in 90%AS
4.9 Effect of angle of downstream curvature on average pressure drop and
diagnostic parameters
Figure 4.32 shows the time average pressure drop for various downstream
curvature angles. For a given percentage area stenosis, the time average pressure drop
increases with increase in downstream angle of curvature. The significant increase in
pressure drop was found as the downstream curvature increases for a given percentage
area stenosis. The increase in time average pressure drop from 6.34 mmHg to 9.71
mmHg, 12.13 mmHg to 17.8 mmHg, and 25.99 mmHg to 34.62 mmHg, was found as
the curvature increased from 00 to 120
0 for 70%, 80% and 90% AS models. These
results indicate that the downstream curvature raises the flow resistance in addition to
the resistance caused by the presence of area stenosis. Therefore, the highest pressure
Univers
ity of
Mala
ya
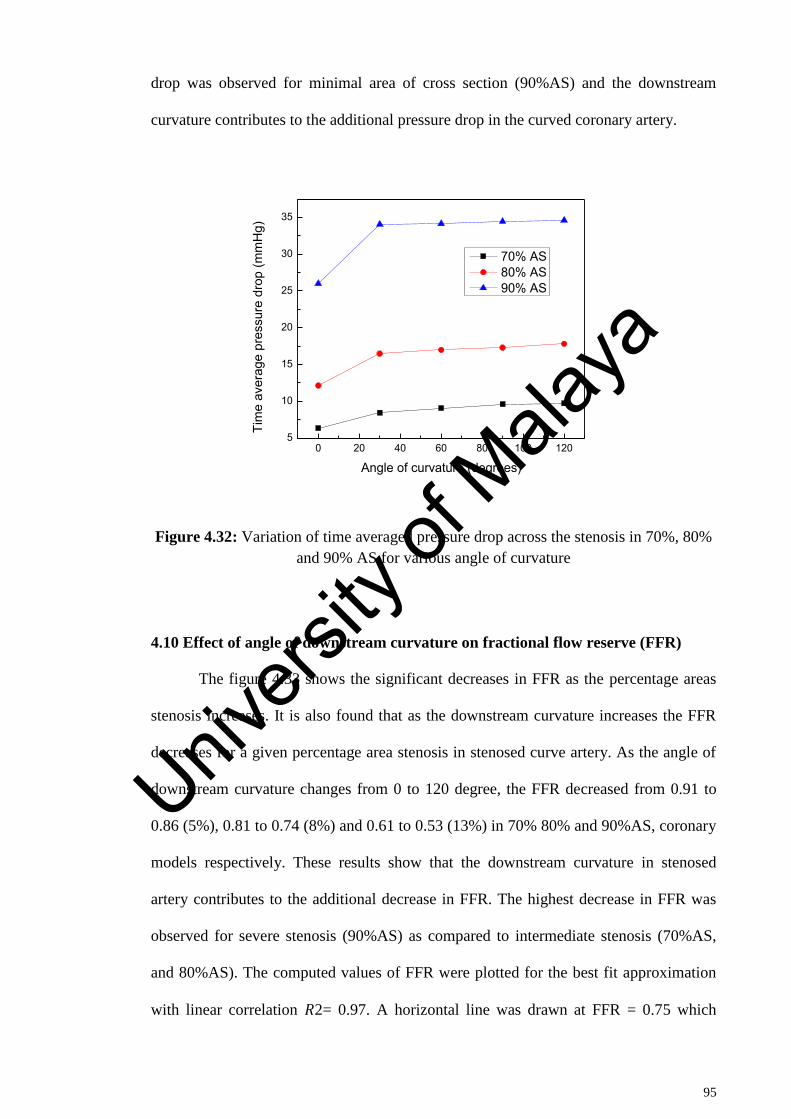
95
drop was observed for minimal area of cross section (90%AS) and the downstream
curvature contributes to the additional pressure drop in the curved coronary artery.
Figure 4.32: Variation of time averaged pressure drop across the stenosis in 70%, 80%
and 90% AS for various angle of curvature
4.10 Effect of angle of downstream curvature on fractional flow reserve (FFR)
The figure 4.33 shows the significant decreases in FFR as the percentage areas
stenosis increases. It is also found that as the downstream curvature increases the FFR
decreases for a given percentage area stenosis in stenosed curve artery. As the angle of
downstream curvature changes from 0 to 120 degree, the FFR decreased from 0.91 to
0.86 (5%), 0.81 to 0.74 (8%) and 0.61 to 0.53 (13%) in 70% 80% and 90%AS, coronary
models respectively. These results show that the downstream curvature in stenosed
artery contributes to the additional decrease in FFR. The highest decrease in FFR was
observed for severe stenosis (90%AS) as compared to intermediate stenosis (70%AS,
and 80%AS). The computed values of FFR were plotted for the best fit approximation
with linear correlation 𝑅2= 0.97. A horizontal line was drawn at FFR = 0.75 which
0 20 40 60 80 100 1205
10
15
20
25
30
35
Tim
e av
erag
e pr
essu
re d
rop
(mm
Hg)
Angle of curvature (degrees)
70% AS 80% AS 90% AS
Univers
ity of
Mala
ya
96
represents the cut-off value to determine a range of AS with possible misdiagnosis as
shown in figure 4.34 This horizontal line intercepted the FFR—AS lines intersect at
77.43% and 81.63% in straight and 120-degree curve artery. As the percentage area
stenosis increases the pressure drop increases across the stenosis and this is owing to the
momentum changes caused by the increase in flow velocity across the stenosis
configuration. The significant difference by statistical analysis was observed in pressure
drop for a fixed percentage area stenosis and pressure derived FFR between straight and
downstream curved arteries. The current results show that the value of FFR calculated
across the stenosis is significantly higher in 0-degree downstream curvature as
compared with the 120-degree downstream curvature stenotic model for a fixed
percentage area stenosis. The FFR derived from pressure drop across the stenosis
decreases with the increase in percentage area stenosis. Figure 4.35 shows a comparison
of FFR for straight stenosed artery models obtained in the present study with the
numerical results presented previously by Konala et al.(Konala et al., 2011) for 70%,
80% and 90% AS with rigid wall and rigid plaque models. The FFR value reflects the
functional severity of stenosis. It is noted that a FFR of less than 0.8 is functionally
significant. If FFR drops less than 0.75 then clinicians recommend an angioplasty or
coronary artery bypass graft (CABG). For the cases of FFR values mora than 0.8,
surgical procedure may not be required and the patient is advised to undergo a medical
therapy. Thus, FFR can guide the clinicians as what type of medical treatment to be
adopted. The FFR gray zone comprises a mere 5% difference (i.e., 0.75 to 0.80), which
falls under intermediate stenosis severity. The variation in downstream curvature of the
artery strongly affect the pressure drop across the stenosis and hence the FFR, for a
given percentage area stenosis as confirmed by the current study. For AS <77.43%, the
FFR values for both the models (0 and 120 degree) were well above the cut-off value of
0.75 and for AS < 81.63%, the FFR value for 120 degree curved model was observed
Univers
ity of
Mala
ya
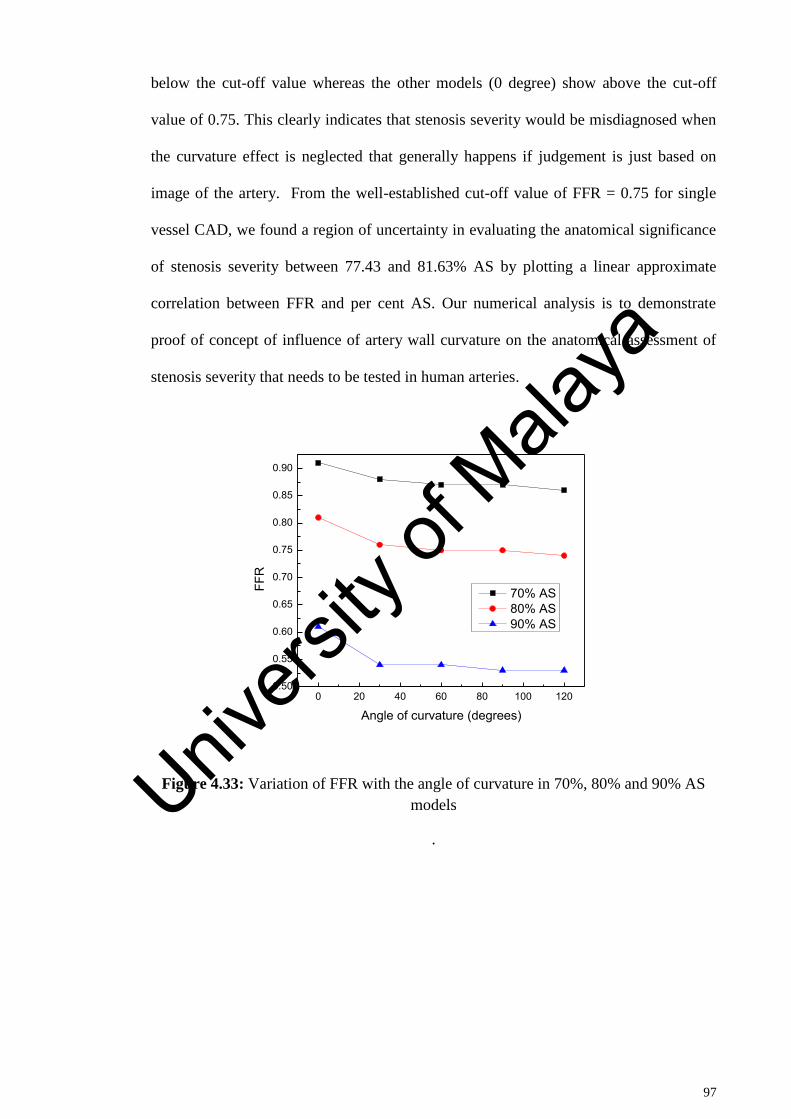
97
below the cut-off value whereas the other models (0 degree) show above the cut-off
value of 0.75. This clearly indicates that stenosis severity would be misdiagnosed when
the curvature effect is neglected that generally happens if judgement is just based on
image of the artery. From the well-established cut-off value of FFR = 0.75 for single
vessel CAD, we found a region of uncertainty in evaluating the anatomical significance
of stenosis severity between 77.43 and 81.63% AS by plotting a linear approximate
correlation between FFR and per cent AS. Our numerical analysis is to demonstrate
proof of concept of influence of artery wall curvature on the anatomical assessment of
stenosis severity that needs to be tested in human arteries.
Figure 4.33: Variation of FFR with the angle of curvature in 70%, 80% and 90% AS
models
.
0 20 40 60 80 100 1200.50
0.55
0.60
0.65
0.70
0.75
0.80
0.85
0.90
FFR
Angle of curvature (degrees)
70% AS 80% AS 90% AS
Univers
ity of
Mala
ya
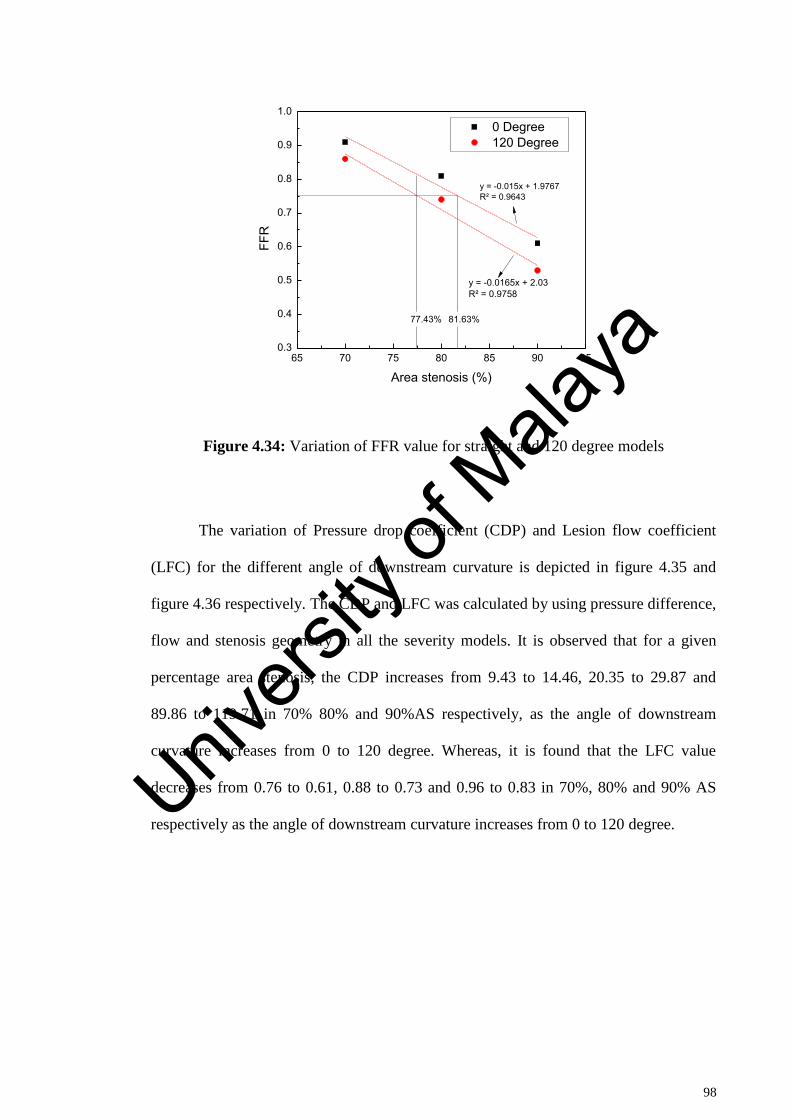
98
Figure 4.34: Variation of FFR value for straight and 120 degree models
The variation of Pressure drop coefficient (CDP) and Lesion flow coefficient
(LFC) for the different angle of downstream curvature is depicted in figure 4.35 and
figure 4.36 respectively. The CDP and LFC was calculated by using pressure difference,
flow and stenosis geometry in all the severity models. It is observed that for a given
percentage area stenosis, the CDP increases from 9.43 to 14.46, 20.35 to 29.87 and
89.86 to 119.71 in 70% 80% and 90%AS respectively, as the angle of downstream
curvature increases from 0 to 120 degree. Whereas, it is found that the LFC value
decreases from 0.76 to 0.61, 0.88 to 0.73 and 0.96 to 0.83 in 70%, 80% and 90% AS
respectively as the angle of downstream curvature increases from 0 to 120 degree.
65 70 75 80 85 90 950.3
0.4
0.5
0.6
0.7
0.8
0.9
1.0
FFR
Area stenosis (%)
0 Degree 120 Degree
y = -0.015x + 1.9767R² = 0.9643
y = -0.0165x + 2.03R² = 0.9758
77.43% 81.63%
Univers
ity of
Mala
ya
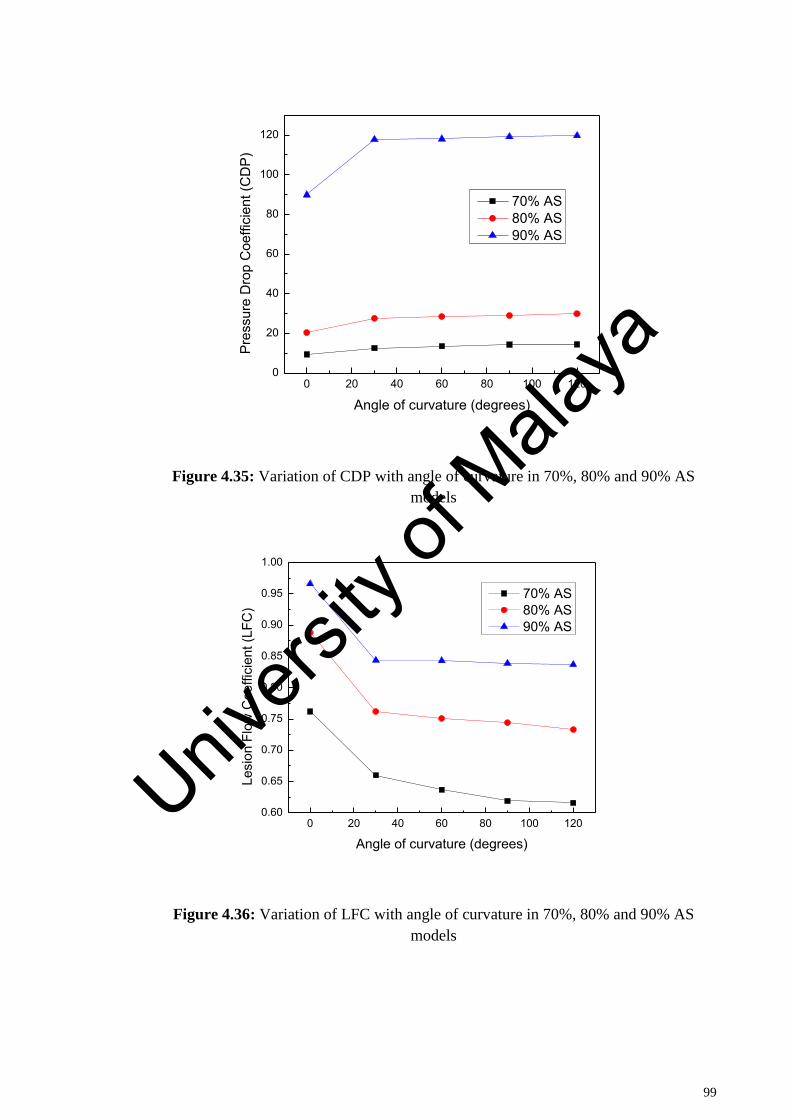
99
Figure 4.35: Variation of CDP with angle of curvature in 70%, 80% and 90% AS
models
Figure 4.36: Variation of LFC with angle of curvature in 70%, 80% and 90% AS
models
0 20 40 60 80 100 1200
20
40
60
80
100
120
Pres
sure
Dro
p C
oeffi
cien
t (C
DP)
Angle of curvature (degrees)
70% AS 80% AS 90% AS
0 20 40 60 80 100 1200.60
0.65
0.70
0.75
0.80
0.85
0.90
0.95
1.00
Lesi
on F
low
Coe
ffici
ent (
LFC
)
Angle of curvature (degrees)
70% AS 80% AS 90% AS
Univers
ity of
Mala
ya
100
4.11 Influence of stenosis in realistic patient left coronary artery on hemodynamics
The following section describes the blood flow analysis of realistic coronary
artery of 37 year old male patient suspected of coronary artery disease. A sample of
multi-slice CT scan image acquisition was performed with 128-multislice scanner. The
images were obtained by the producer described in detail as in section 3.7, of chapter
3. The DICOM images obtained from the patient was imported into the commercially
available software MIMICS. By using the thresholding function and creating a 3D mask
an optimized model of left coronary arteries with side branches were segmented. The
surface models with and without stenosis was modelled by removing the soft tissues and
saved in stereolithography (STL) for meshing. Further, the optimized meshed geometry
was imported in CFX to analyze the flow behavior. The pulsatile pressure is applied at
inlet and outflow boundary conditions was applied with the flow ratio through all the
side-branches, following the Murry law. Figure 4.37 demonstrates the pressure
variations in the normal and stenosed left coronary arterial segment during the systolic
and diastolic period. The pressure contour shows the pressure distribution in normal
coronary artery, ranging from 14630Pa to 13540Pa during the peak systole (1.2 s). A
pressure drop was observed immediate after the stenosis area from 14360Pa to 14270Pa
as compared with the normal coronary artery models during the peak systole. Similarly,
a drop in pressure was found from 9905Pa to 9816Pa for the diastole period (1.51 s)
during the cardiac cycle. Univers
ity of
Mala
ya
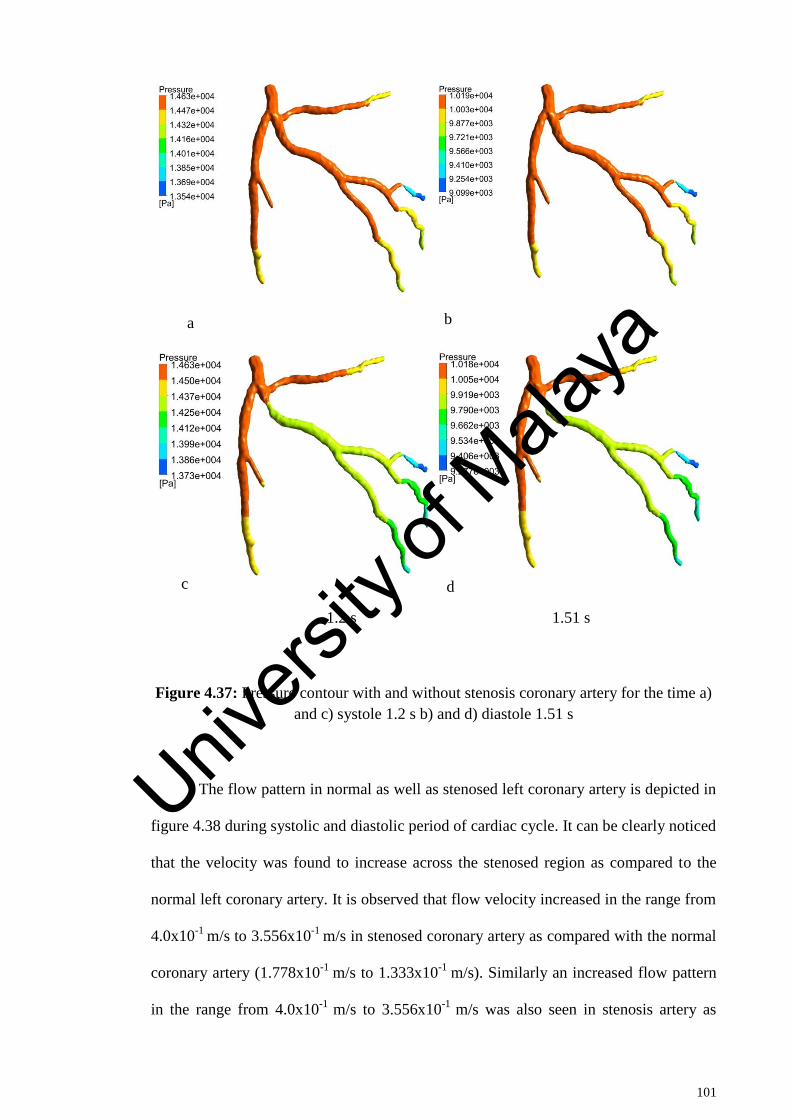
101
1.2 s 1.51 s
Figure 4.37: Pressure contour with and without stenosis coronary artery for the time a)
and c) systole 1.2 s b) and d) diastole 1.51 s
The flow pattern in normal as well as stenosed left coronary artery is depicted in
figure 4.38 during systolic and diastolic period of cardiac cycle. It can be clearly noticed
that the velocity was found to increase across the stenosed region as compared to the
normal left coronary artery. It is observed that flow velocity increased in the range from
4.0x10⁻¹
m/s to 3.556x10⁻¹
m/s in stenosed coronary artery as compared with the normal
coronary artery (1.778x10⁻¹
m/s to 1.333x10⁻¹
m/s). Similarly an increased flow pattern
in the range from 4.0x10⁻¹
m/s to 3.556x10⁻¹
m/s was also seen in stenosis artery as
a b
c d
Univers
ity of
Mala
ya
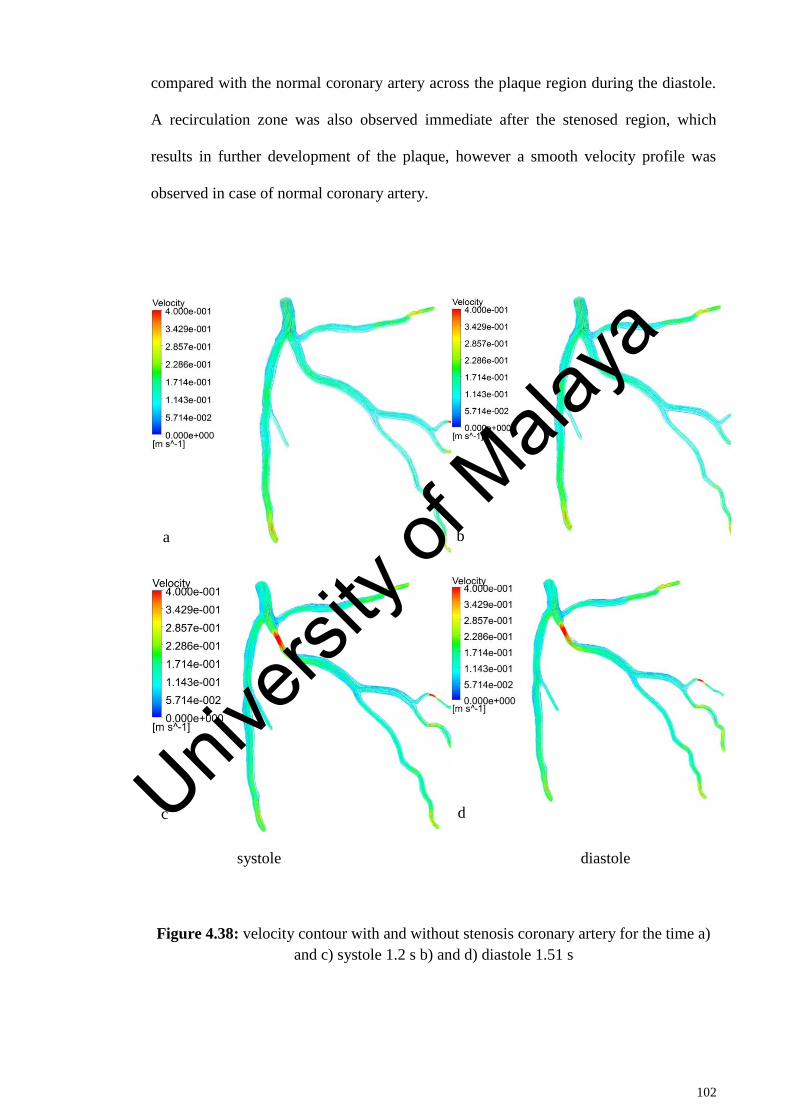
102
compared with the normal coronary artery across the plaque region during the diastole.
A recirculation zone was also observed immediate after the stenosed region, which
results in further development of the plaque, however a smooth velocity profile was
observed in case of normal coronary artery.
systole diastole
Figure 4.38: velocity contour with and without stenosis coronary artery for the time a)
and c) systole 1.2 s b) and d) diastole 1.51 s
a b
c d Univers
ity of
Mala
ya
103
The distribution of wall shear stress in normal and stenosed left coronary artery
models during the systolic and diastolic period is shown in figure 4.39. The wall shear
stress across the stenosis is found to be increased as compared with the normal left
coronary artery model. The wall shear stress in the normal artery is found to be within a
range from 0 Pa to 3.5 Pa. However, the same region with stenosis is found to have wall
shear stress in the range of 10.17 to 15.25 Pa. Similarly, for diastolic phase, the normal
coronary artery has wall shear stress in the range from 0 Pa to 3.5 Pa which increased to
the range from 10.17 Pa to 15.25 Pa for the stenosed artery. A high wall shear stress
across the stenosis was due to the increase in the velocity at the stenosis that could lead
to the aggravation of platelets activation, thinning of fibrous cap and the rupture of
coronary artery (Chaichana et al., 2013a, 2013b; Feng et al., 2012).
Univers
ity of
Mala
ya
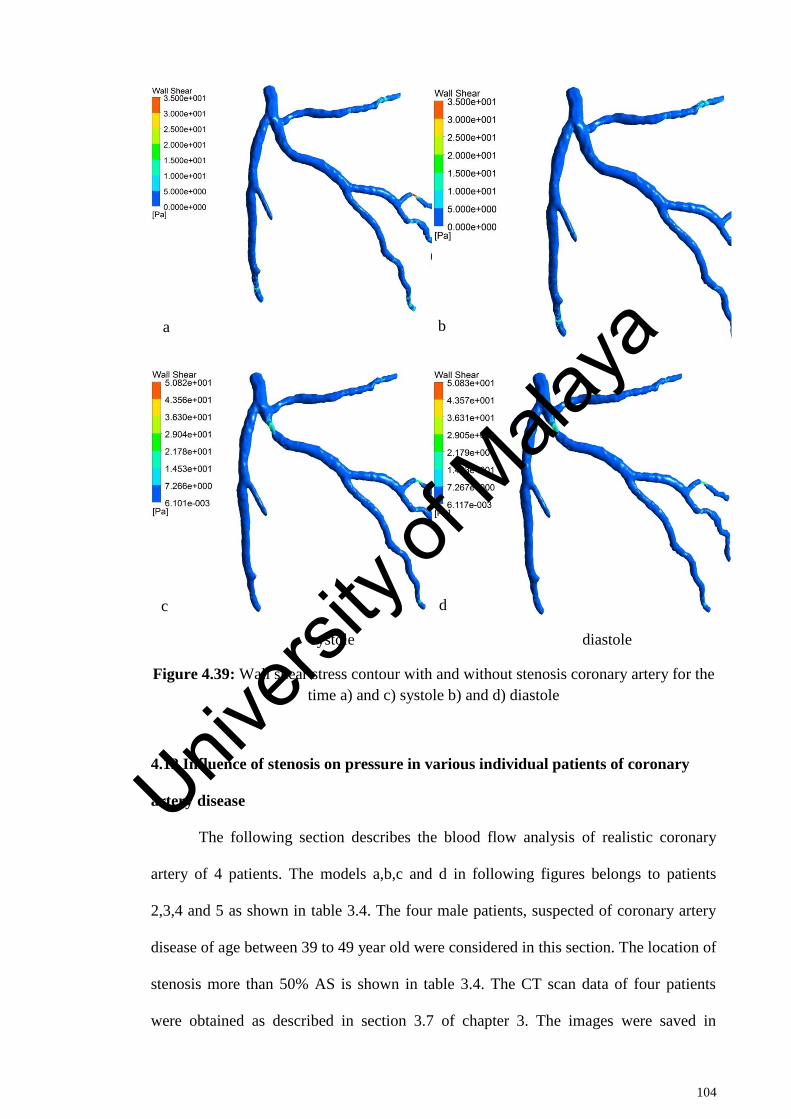
104
systole diastole
Figure 4.39: Wall shear stress contour with and without stenosis coronary artery for the
time a) and c) systole b) and d) diastole
4.12 Influence of stenosis on pressure in various individual patients of coronary
artery disease
The following section describes the blood flow analysis of realistic coronary
artery of 4 patients. The models a,b,c and d in following figures belongs to patients
2,3,4 and 5 as shown in table 3.4. The four male patients, suspected of coronary artery
disease of age between 39 to 49 year old were considered in this section. The location of
stenosis more than 50% AS is shown in table 3.4. The CT scan data of four patients
were obtained as described in section 3.7 of chapter 3. The images were saved in
a b
c d
Univers
ity of
Mala
ya
105
DICOM format, and later imported to commercially available software MIMICS to
study the blood flow behavior in these patients. Figure 4.40 illustrates the pressure
variation in the left coronary artery of all four patients due to the stenosed area in the
artery. It is evident from figure 4.40 that the pressure of the blood flow decreases in the
post stenosed area, which is common phenomenon due to obstruction presented by
presence of stenosis in the blood flow pathway. The stenotic resistance increases the
pressure due to blockage effect in the area before stenosis whereas the pressure drops
due to expansion after the stenosis. The pressure drop is one of the important parameter
in assessing the severity of stenosis. The fractional flow reserve (FFR) which is used as
judgment tool to assess the severity of blockage is based on pressure drop across the
stenotic region. Higher the pressure drops, sever is the condition of patient. The
variation of pressure depends on the blood flow rate dictated by various physiological
conditions. The pressure drop across the stenosis at LAD branch is found to be in the
range of 14300 Pa to 13670 Pa as shown in figure 4.40a. The pressure drop in figure
4.40b is in the range from 11490 Pa to 11230 Pa across the stenosis at LCX branch.
Similarly, the pressure drop is found to be in the range of 10540 Pa to 10300 Pa and
11000 Pa to 10780 Pa respectively for the stenosis located at LAD as seen in figure
4.40c and 4.40d respectively.
Univers
ity of
Mala
ya

106
Figure 4.40: Visualization of pressure distribution of four patient in the left coronary
artery for time step 1.2s
4.13 Influence of stenosis on velocity in various individual patients of coronary
artery disease
Figure 4.41 demonstrates the change in velocity due to the stenosed area in the
artery during the hyperemic conditions for 1.2s time step. It should be noted that the
results are presented at 1.2s which is peak velocity phase in the cardiac cycle. The
velocity increases at sharp rate at the stenosis region. This happens because of
conversion of pressure energy into kinetic energy due to pressure drop. The velocity is
Univers
ity of
Mala
ya
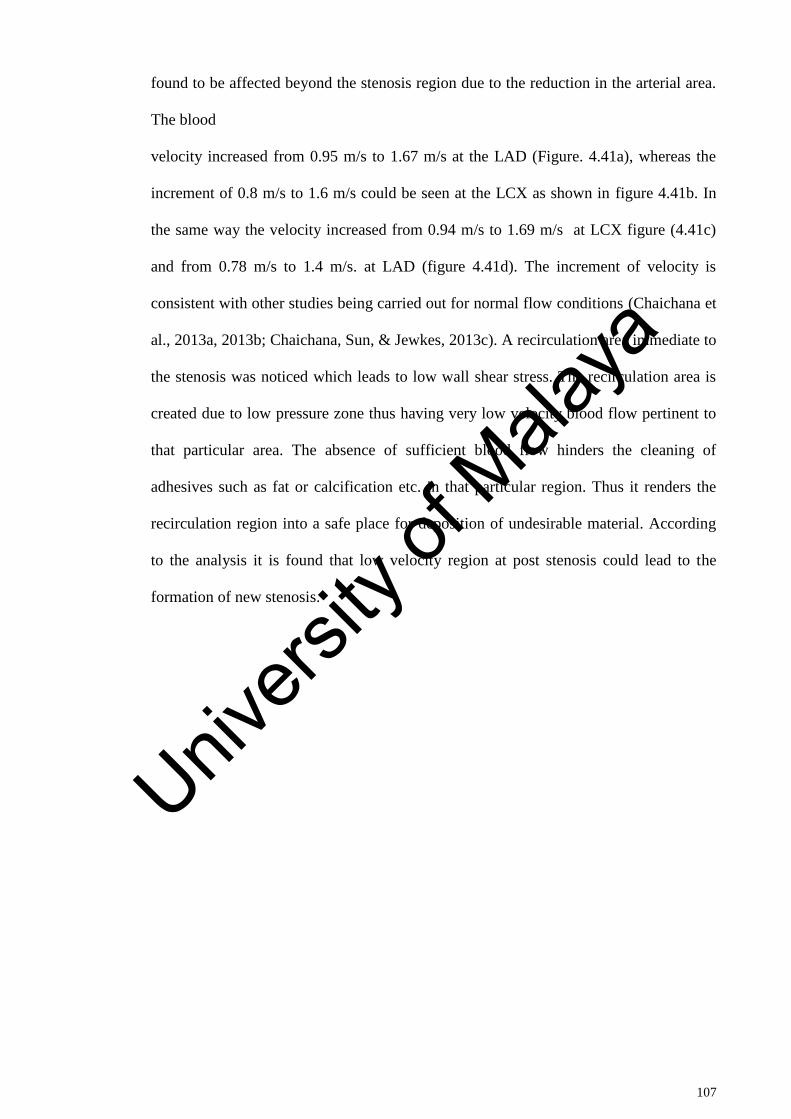
107
found to be affected beyond the stenosis region due to the reduction in the arterial area.
The blood
velocity increased from 0.95 m/s to 1.67 m/s at the LAD (Figure. 4.41a), whereas the
increment of 0.8 m/s to 1.6 m/s could be seen at the LCX as shown in figure 4.41b. In
the same way the velocity increased from 0.94 m/s to 1.69 m/s at LCX figure (4.41c)
and from 0.78 m/s to 1.4 m/s. at LAD (figure 4.41d). The increment of velocity is
consistent with other studies being carried out for normal flow conditions (Chaichana et
al., 2013a, 2013b; Chaichana, Sun, & Jewkes, 2013c). A recirculation area immediate to
the stenosis was noticed which leads to low wall shear stress. The recirculation area is
created due to low pressure zone thus having very low velocity blood flow pertinent to
that particular area. The absence of sufficient blood flow hinders the cleaning of
adhesives such as fat or calcification etc. in that particular region. Thus it renders the
recirculation region into a safe place for deposition of undesirable material. According
to the analysis it is found that low velocity region at post stenosis could lead to the
formation of new stenosis.
Univers
ity of
Mala
ya
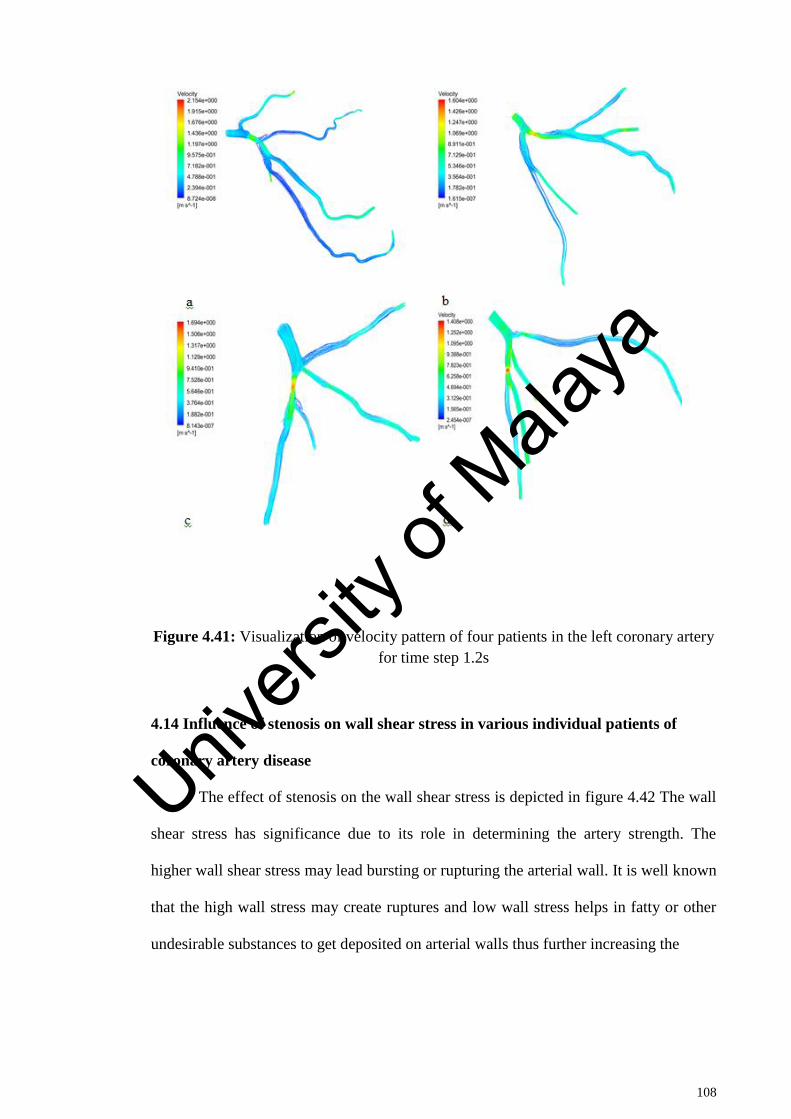
108
Figure 4.41: Visualization of velocity pattern of four patients in the left coronary artery
for time step 1.2s
4.14 Influence of stenosis on wall shear stress in various individual patients of
coronary artery disease
The effect of stenosis on the wall shear stress is depicted in figure 4.42 The wall
shear stress has significance due to its role in determining the artery strength. The
higher wall shear stress may lead bursting or rupturing the arterial wall. It is well known
that the high wall stress may create ruptures and low wall stress helps in fatty or other
undesirable substances to get deposited on arterial walls thus further increasing the
Univers
ity of
Mala
ya
109
stenosis region. It is also reported that the normal LAD has a wall shear stress value of
12 Pa (Su et al., 2014)(Su et al., 2014). It is noted that the wall shear stress is also
significantly increased across the stenosis at LAD and LCX branches. The maximum
significant wall shear stress for four patients is found to be 91 Pa, 50 Pa, 65 Pa and 51
Pa respectively as illustrated in figure 4.42a, 4.42b, 4.42c and 4.42d respectively. The
finding of this study could be useful in predicting the progression of atherosclerosis in
the coronary arteries. The previous studies reported that stenosis frequently occurred
near the bifurcation, due to the angulation between LAD and LCX and tortuosity which
could lead to low wall shear region at bifurcations. The highest wall shear stress to be
observed was that of 91 Pa at LAD model (figure 4.42a). This is very high value
compare to the normal condition of no stenosis.
Univers
ity of
Mala
ya
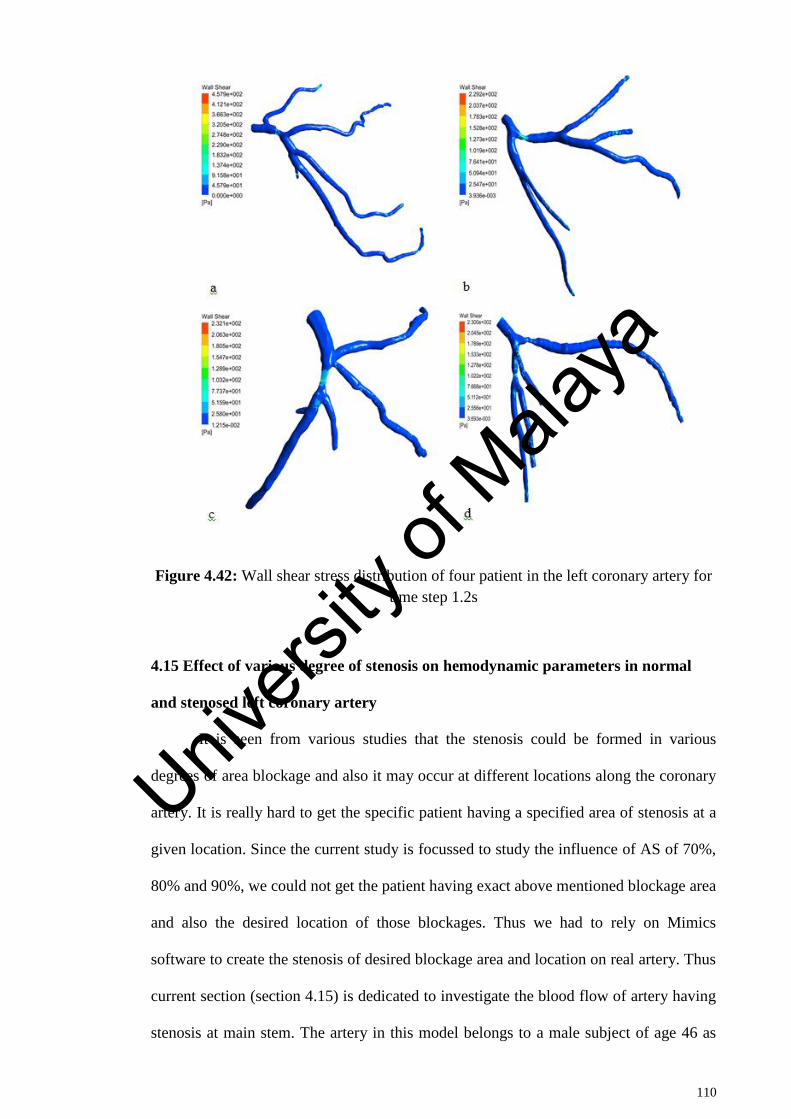
110
Figure 4.42: Wall shear stress distribution of four patient in the left coronary artery for
time step 1.2s
4.15 Effect of various degree of stenosis on hemodynamic parameters in normal
and stenosed left coronary artery
It is seen from various studies that the stenosis could be formed in various
degrees of area blockage and also it may occur at different locations along the coronary
artery. It is really hard to get the specific patient having a specified area of stenosis at a
given location. Since the current study is focussed to study the influence of AS of 70%,
80% and 90%, we could not get the patient having exact above mentioned blockage area
and also the desired location of those blockages. Thus we had to rely on Mimics
software to create the stenosis of desired blockage area and location on real artery. Thus
current section (section 4.15) is dedicated to investigate the blood flow of artery having
stenosis at main stem. The artery in this model belongs to a male subject of age 46 as
Univers
ity of
Mala
ya
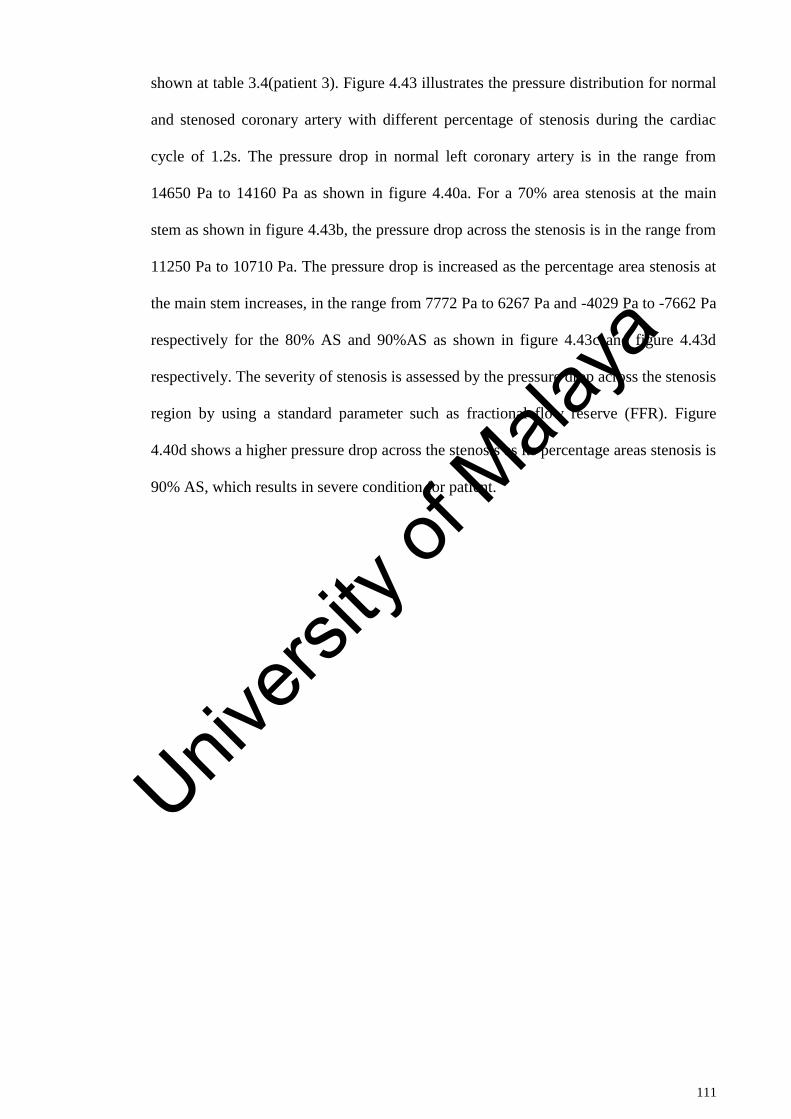
111
shown at table 3.4(patient 3). Figure 4.43 illustrates the pressure distribution for normal
and stenosed coronary artery with different percentage of stenosis during the cardiac
cycle of 1.2s. The pressure drop in normal left coronary artery is in the range from
14650 Pa to 14160 Pa as shown in figure 4.40a. For a 70% area stenosis at the main
stem as shown in figure 4.43b, the pressure drop across the stenosis is in the range from
11250 Pa to 10710 Pa. The pressure drop is increased as the percentage area stenosis at
the main stem increases, in the range from 7772 Pa to 6267 Pa and -4029 Pa to -7662 Pa
respectively for the 80% AS and 90%AS as shown in figure 4.43c and figure 4.43d
respectively. The severity of stenosis is assessed by the pressure drop across the stenosis
region by using a standard parameter such as fractional flow reserve (FFR). Figure
4.40d shows a higher pressure drop across the stenosis as its percentage areas stenosis is
90% AS, which results in severe condition for patient.
Univers
ity of
Mala
ya
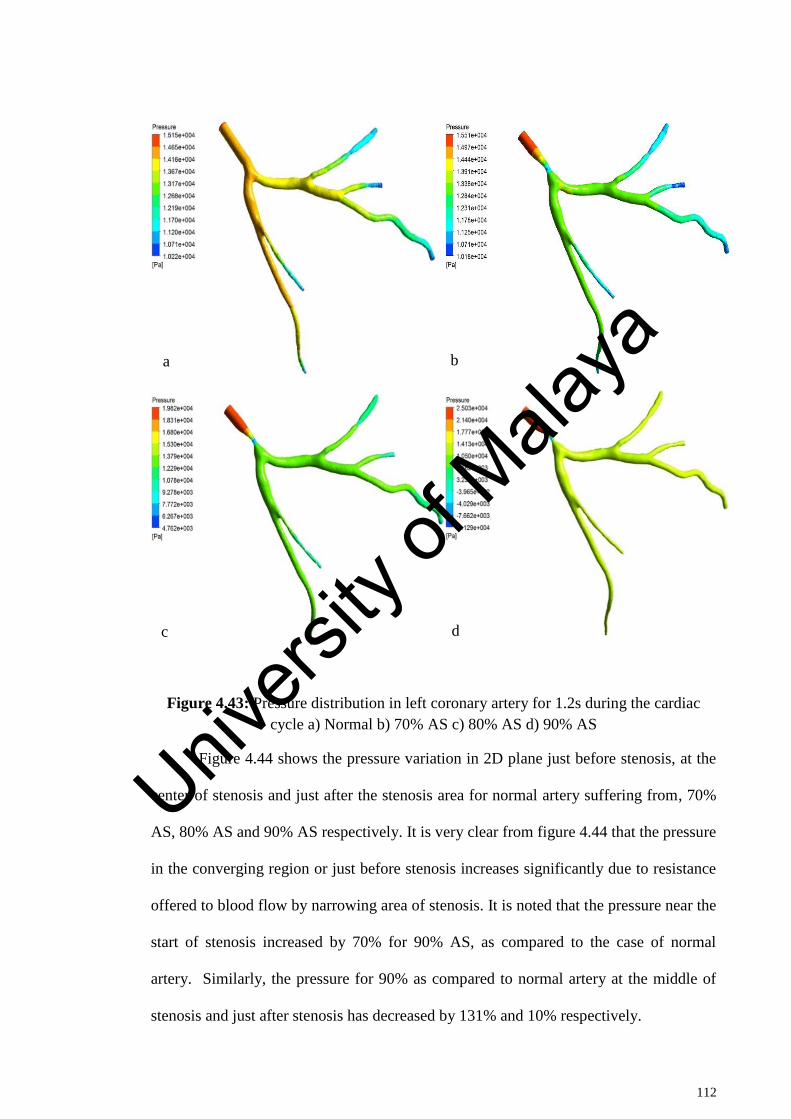
112
Figure 4.43: Pressure distribution in left coronary artery for 1.2s during the cardiac
cycle a) Normal b) 70% AS c) 80% AS d) 90% AS
Figure 4.44 shows the pressure variation in 2D plane just before stenosis, at the
center of stenosis and just after the stenosis area for normal artery suffering from, 70%
AS, 80% AS and 90% AS respectively. It is very clear from figure 4.44 that the pressure
in the converging region or just before stenosis increases significantly due to resistance
offered to blood flow by narrowing area of stenosis. It is noted that the pressure near the
start of stenosis increased by 70% for 90% AS, as compared to the case of normal
artery. Similarly, the pressure for 90% as compared to normal artery at the middle of
stenosis and just after stenosis has decreased by 131% and 10% respectively.
a b
c d
Univers
ity of
Mala
ya
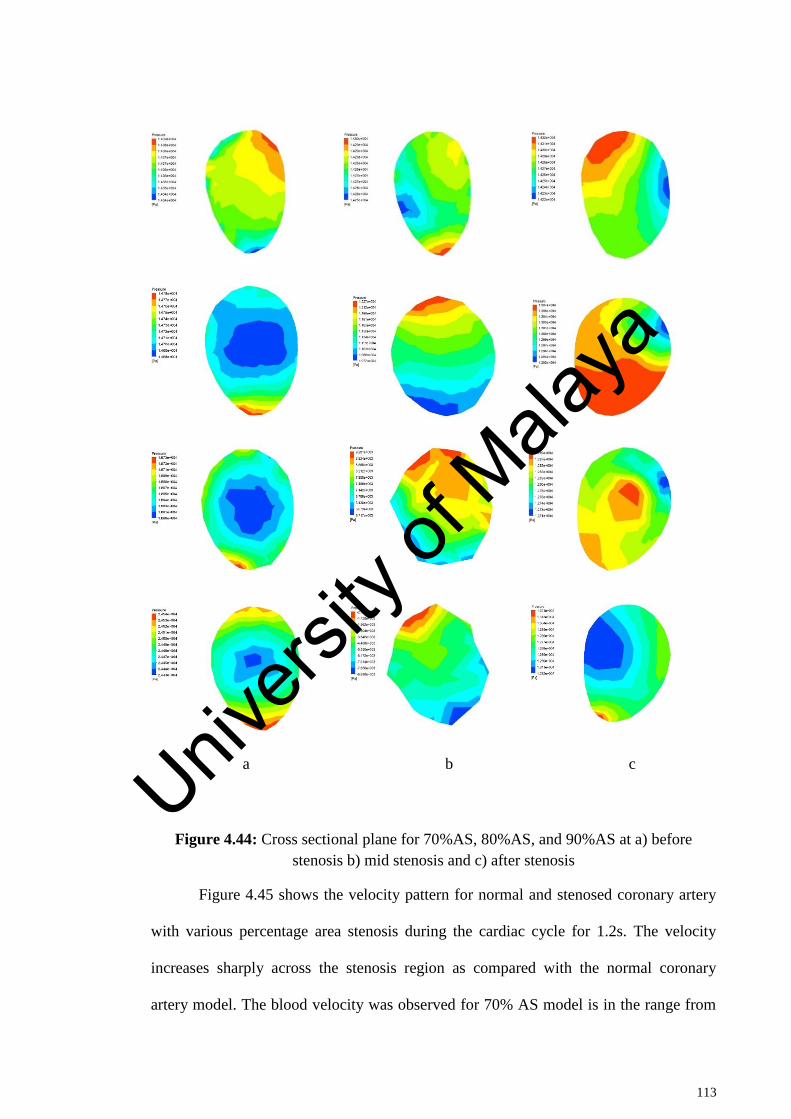
113
a b c
Figure 4.44: Cross sectional plane for 70%AS, 80%AS, and 90%AS at a) before
stenosis b) mid stenosis and c) after stenosis
Figure 4.45 shows the velocity pattern for normal and stenosed coronary artery
with various percentage area stenosis during the cardiac cycle for 1.2s. The velocity
increases sharply across the stenosis region as compared with the normal coronary
artery model. The blood velocity was observed for 70% AS model is in the range from
Univers
ity of
Mala
ya
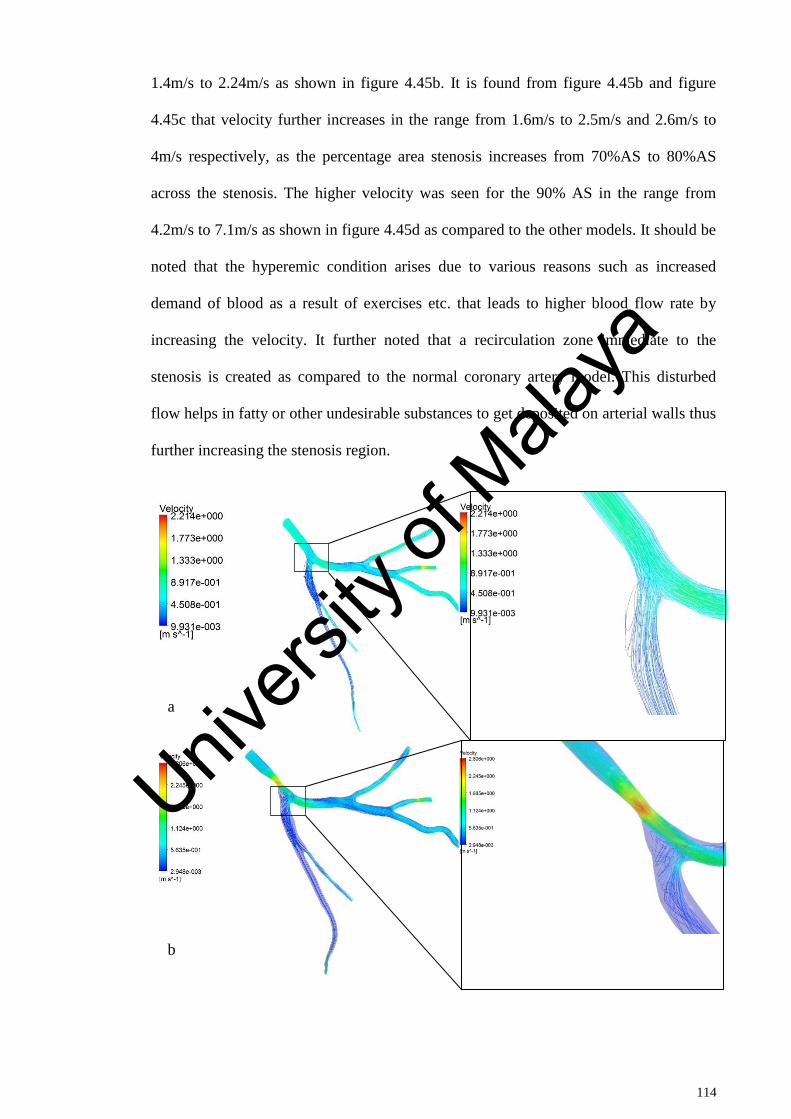
114
1.4m/s to 2.24m/s as shown in figure 4.45b. It is found from figure 4.45b and figure
4.45c that velocity further increases in the range from 1.6m/s to 2.5m/s and 2.6m/s to
4m/s respectively, as the percentage area stenosis increases from 70%AS to 80%AS
across the stenosis. The higher velocity was seen for the 90% AS in the range from
4.2m/s to 7.1m/s as shown in figure 4.45d as compared to the other models. It should be
noted that the hyperemic condition arises due to various reasons such as increased
demand of blood as a result of exercises etc. that leads to higher blood flow rate by
increasing the velocity. It further noted that a recirculation zone immediate to the
stenosis is created as compared to the normal coronary artery model. This disturbed
flow helps in fatty or other undesirable substances to get deposited on arterial walls thus
further increasing the stenosis region.
a
b
Univers
ity of
Mala
ya
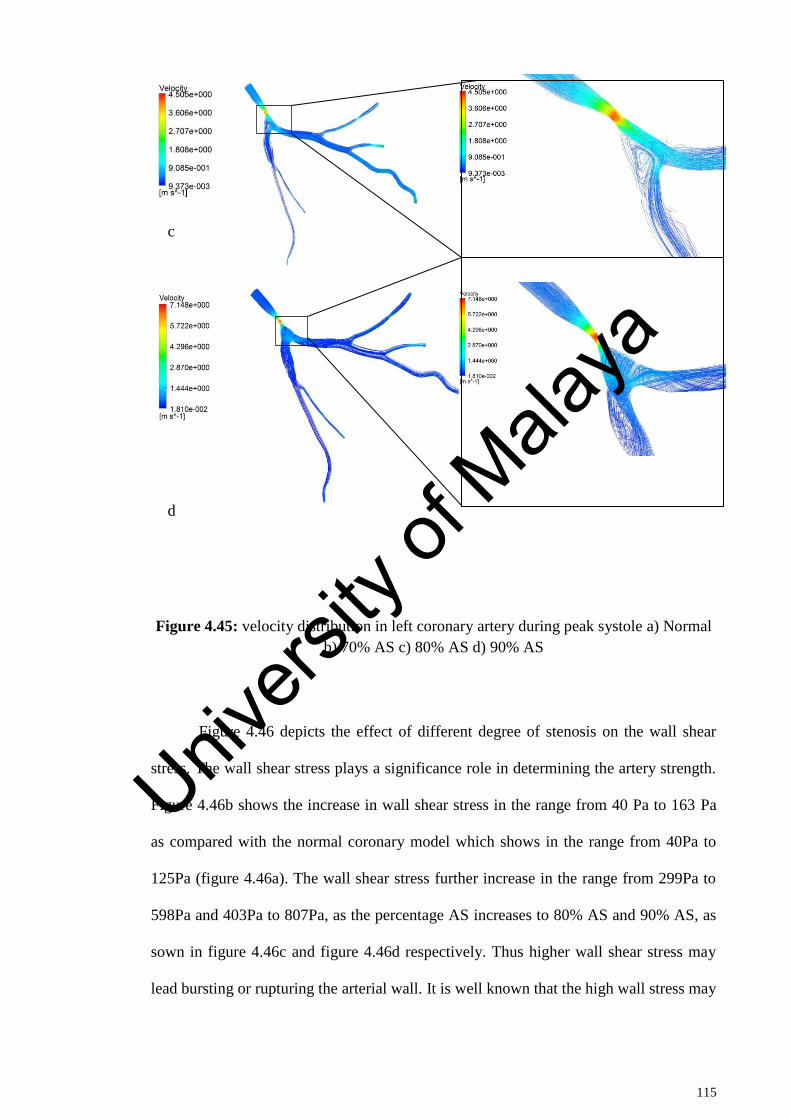
115
Figure 4.45: velocity distribution in left coronary artery during peak systole a) Normal
b) 70% AS c) 80% AS d) 90% AS
Figure 4.46 depicts the effect of different degree of stenosis on the wall shear
stress. The wall shear stress plays a significance role in determining the artery strength.
Figure 4.46b shows the increase in wall shear stress in the range from 40 Pa to 163 Pa
as compared with the normal coronary model which shows in the range from 40Pa to
125Pa (figure 4.46a). The wall shear stress further increase in the range from 299Pa to
598Pa and 403Pa to 807Pa, as the percentage AS increases to 80% AS and 90% AS, as
sown in figure 4.46c and figure 4.46d respectively. Thus higher wall shear stress may
lead bursting or rupturing the arterial wall. It is well known that the high wall stress may
c
d
Univers
ity of
Mala
ya
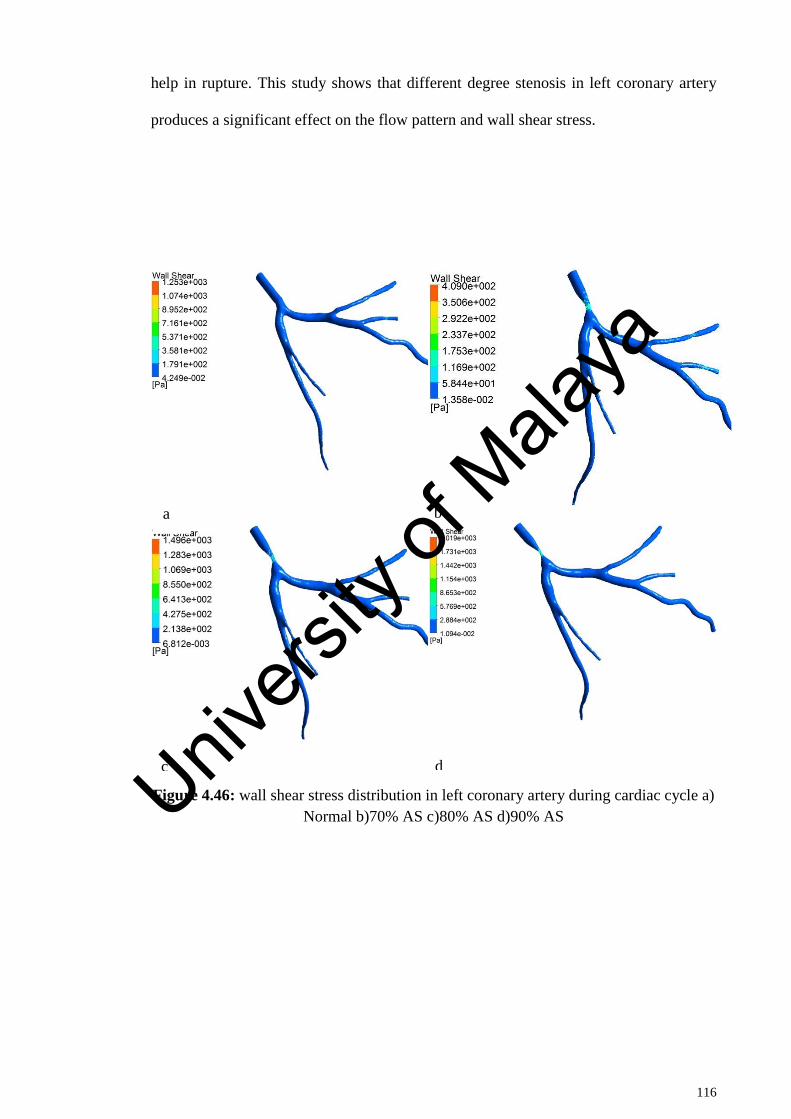
116
help in rupture. This study shows that different degree stenosis in left coronary artery
produces a significant effect on the flow pattern and wall shear stress.
Figure 4.46: wall shear stress distribution in left coronary artery during cardiac cycle a)
Normal b)70% AS c)80% AS d)90% AS
a b
c d Univers
ity of
Mala
ya
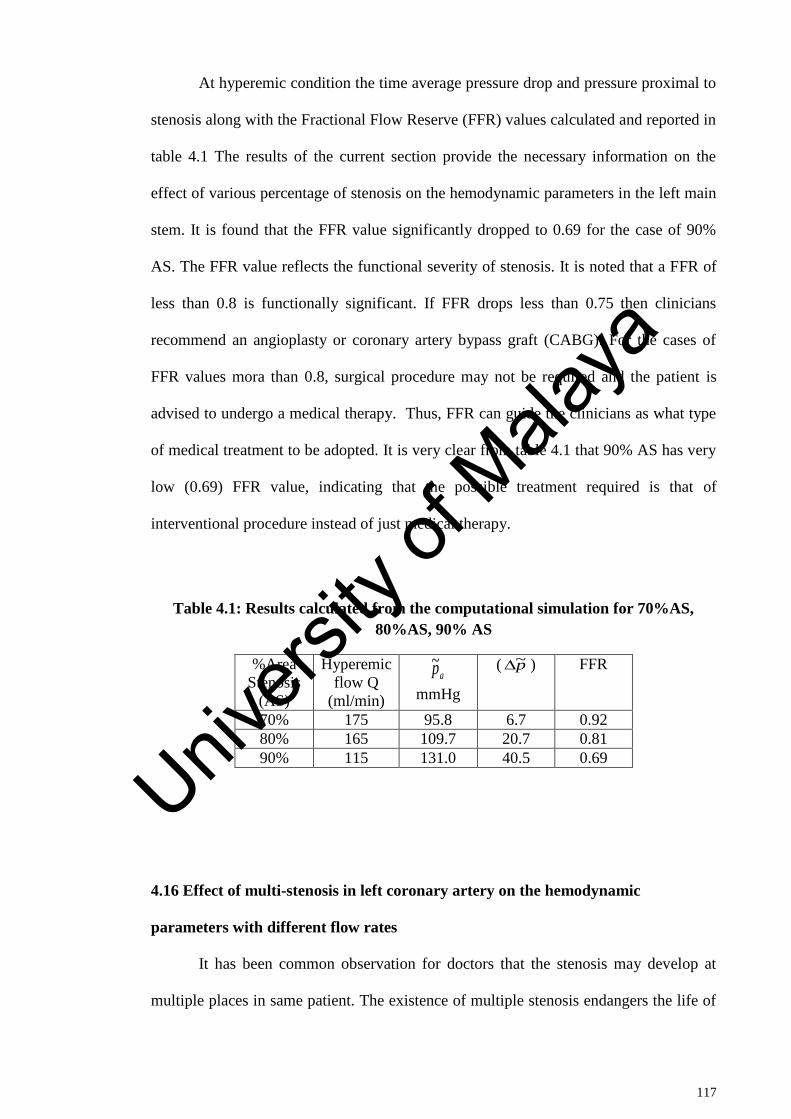
117
At hyperemic condition the time average pressure drop and pressure proximal to
stenosis along with the Fractional Flow Reserve (FFR) values calculated and reported in
table 4.1 The results of the current section provide the necessary information on the
effect of various percentage of stenosis on the hemodynamic parameters in the left main
stem. It is found that the FFR value significantly dropped to 0.69 for the case of 90%
AS. The FFR value reflects the functional severity of stenosis. It is noted that a FFR of
less than 0.8 is functionally significant. If FFR drops less than 0.75 then clinicians
recommend an angioplasty or coronary artery bypass graft (CABG). For the cases of
FFR values mora than 0.8, surgical procedure may not be required and the patient is
advised to undergo a medical therapy. Thus, FFR can guide the clinicians as what type
of medical treatment to be adopted. It is very clear from table 4.1 that 90% AS has very
low (0.69) FFR value, indicating that the possible treatment required is that of
interventional procedure instead of just medical therapy.
Table 4.1: Results calculated from the computational simulation for 70%AS,
80%AS, 90% AS
%Area
Stenosis
(AS)
Hyperemic
flow Q
(ml/min) mmHg
( ) FFR
70% 175 95.8 6.7 0.92
80% 165 109.7 20.7 0.81
90% 115 131.0 40.5 0.69
4.16 Effect of multi-stenosis in left coronary artery on the hemodynamic
parameters with different flow rates
It has been common observation for doctors that the stenosis may develop at
multiple places in same patient. The existence of multiple stenosis endangers the life of
ap~ p~
Univers
ity of
Mala
ya
118
patient and it could lead to more severity than single stenosis. Thus the current section is
aimed to study the presence of multiple blockages at various locations on coronary
artery. The coronary artery in present section (section 4.16) belongs to patient 3 of table
3.4 and the stenosis is introduced at various locations with the help of Mimics software.
In the case of multi stenosis left coronary artery different degree of multi-stenosis is
placed at various locations across the bifurcations to investigate the effect of those
stenosis on the hemodynamic parameters such as wall pressure, velocity and wall shear
stress for the maximum velocity at 1.2s during the cardiac cycle.
4.16.1 Location of 70% AS at left main stem (LMS) and 80% AS at left circumflex
(LCX) branch
Figure 4.47 illustrates the pressure distribution in a multi stenosed left coronary
artery for various flow rate at 1.2s during the cardiac cycle. In the figure, Left Main
Stem (LMS) of coronary artery has 70% AS and the Left Circumflex branch has 80%
AS. It is observed that the pressure drops across the stenosis. The maximum pressure
drop across the 70% AS at the LMS is in the range from 13300 Pa to 12730 Pa, 14250
Pa to 13460 Pa, 14280 Pa to 13250 Pa and 15140 Pa to 13840 Pa for 100, 125, 150 and
175ml/min respectively, whereas the pressure drop across the 80% area stenosis at the
Circumflex branch is in the range from 12150 Pa to 11580 Pa, 11890 Pa to 11100 Pa,
12210 Pa 11180 Pa and 11260 Pa to 9971 Pa for 100, 125, 150 and 175ml/min
respectively. As expected, the maximum pressure drops for the higher degree of
stenosis. It is also noted that the pressure drop increases with the increase in the blood
flow rate across the higher degree of stenosis. It should be noted that the presence of
secondary stenosis in the Circumflex branch has further complicated the flow behaviour
vindicated in terms of increased pressure drop at the main stem area. The pressure drop
in the main stem has increased by 34% due to secondary stenosis as compared to similar
Univers
ity of
Mala
ya
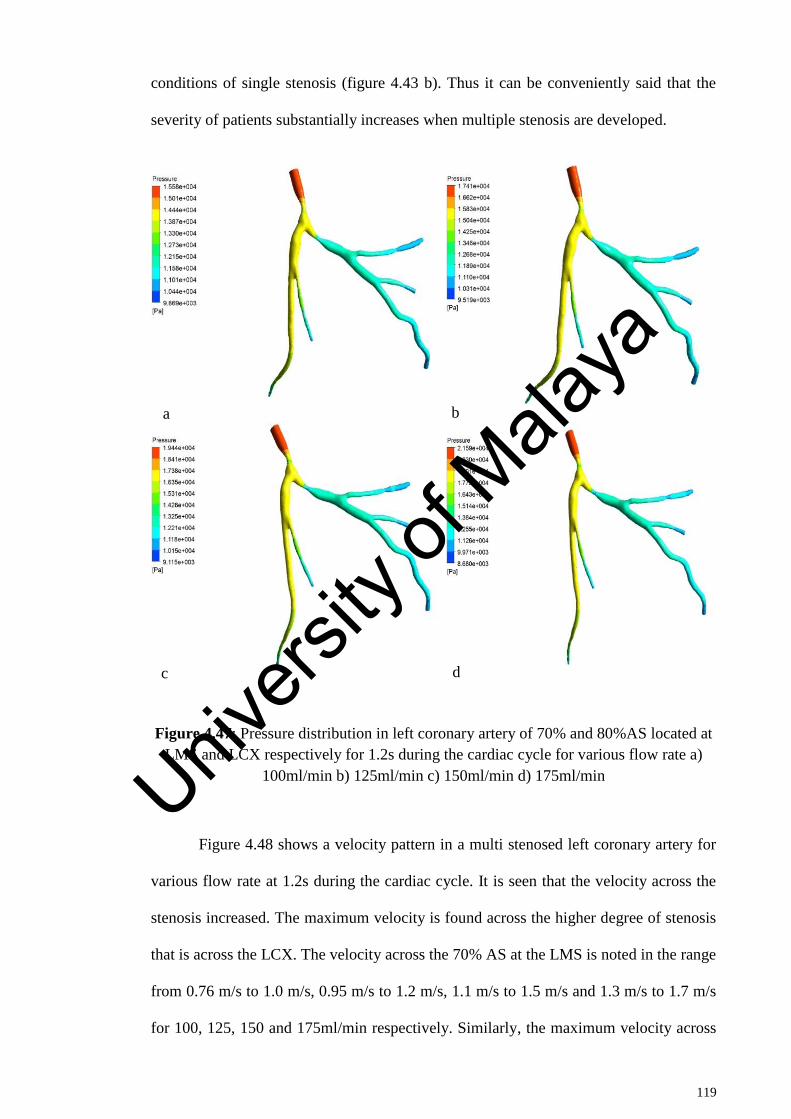
119
conditions of single stenosis (figure 4.43 b). Thus it can be conveniently said that the
severity of patients substantially increases when multiple stenosis are developed.
Figure 4.47: Pressure distribution in left coronary artery of 70% and 80%AS located at
LMS and LCX respectively for 1.2s during the cardiac cycle for various flow rate a)
100ml/min b) 125ml/min c) 150ml/min d) 175ml/min
Figure 4.48 shows a velocity pattern in a multi stenosed left coronary artery for
various flow rate at 1.2s during the cardiac cycle. It is seen that the velocity across the
stenosis increased. The maximum velocity is found across the higher degree of stenosis
that is across the LCX. The velocity across the 70% AS at the LMS is noted in the range
from 0.76 m/s to 1.0 m/s, 0.95 m/s to 1.2 m/s, 1.1 m/s to 1.5 m/s and 1.3 m/s to 1.7 m/s
for 100, 125, 150 and 175ml/min respectively. Similarly, the maximum velocity across
a b
c d
Univers
ity of
Mala
ya
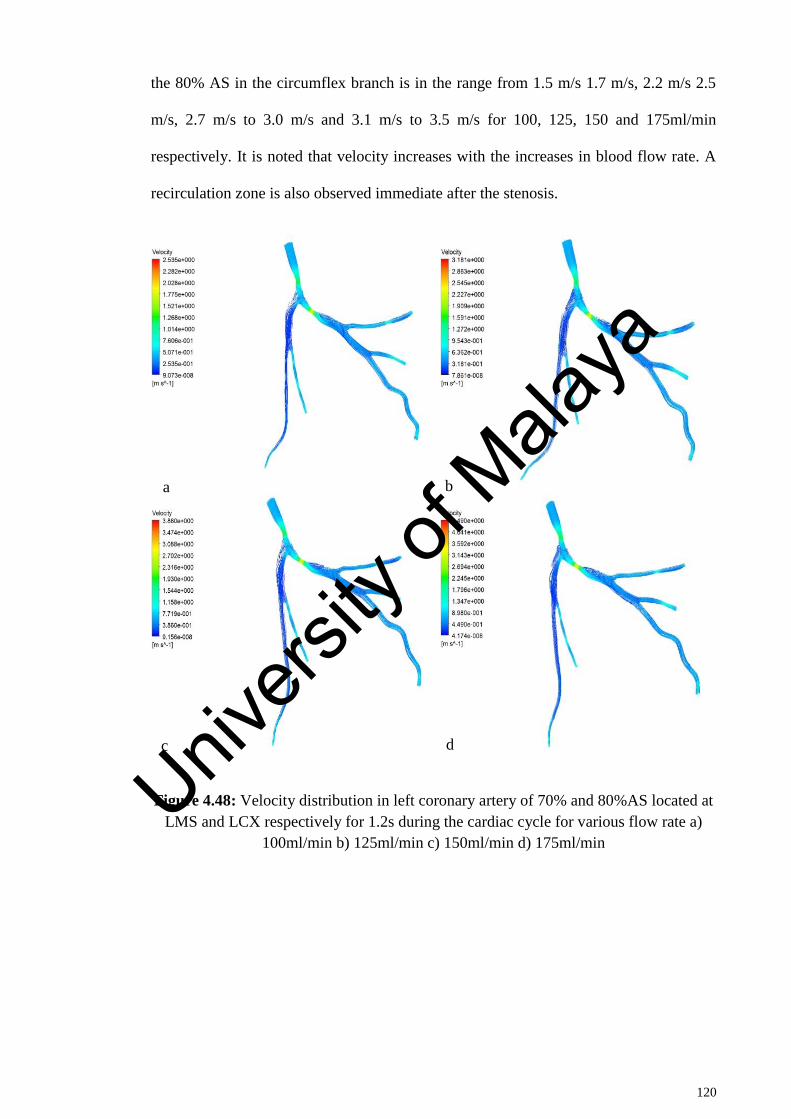
120
the 80% AS in the circumflex branch is in the range from 1.5 m/s 1.7 m/s, 2.2 m/s 2.5
m/s, 2.7 m/s to 3.0 m/s and 3.1 m/s to 3.5 m/s for 100, 125, 150 and 175ml/min
respectively. It is noted that velocity increases with the increases in blood flow rate. A
recirculation zone is also observed immediate after the stenosis.
Figure 4.48: Velocity distribution in left coronary artery of 70% and 80%AS located at
LMS and LCX respectively for 1.2s during the cardiac cycle for various flow rate a)
100ml/min b) 125ml/min c) 150ml/min d) 175ml/min
a b
c d
Univers
ity of
Mala
ya
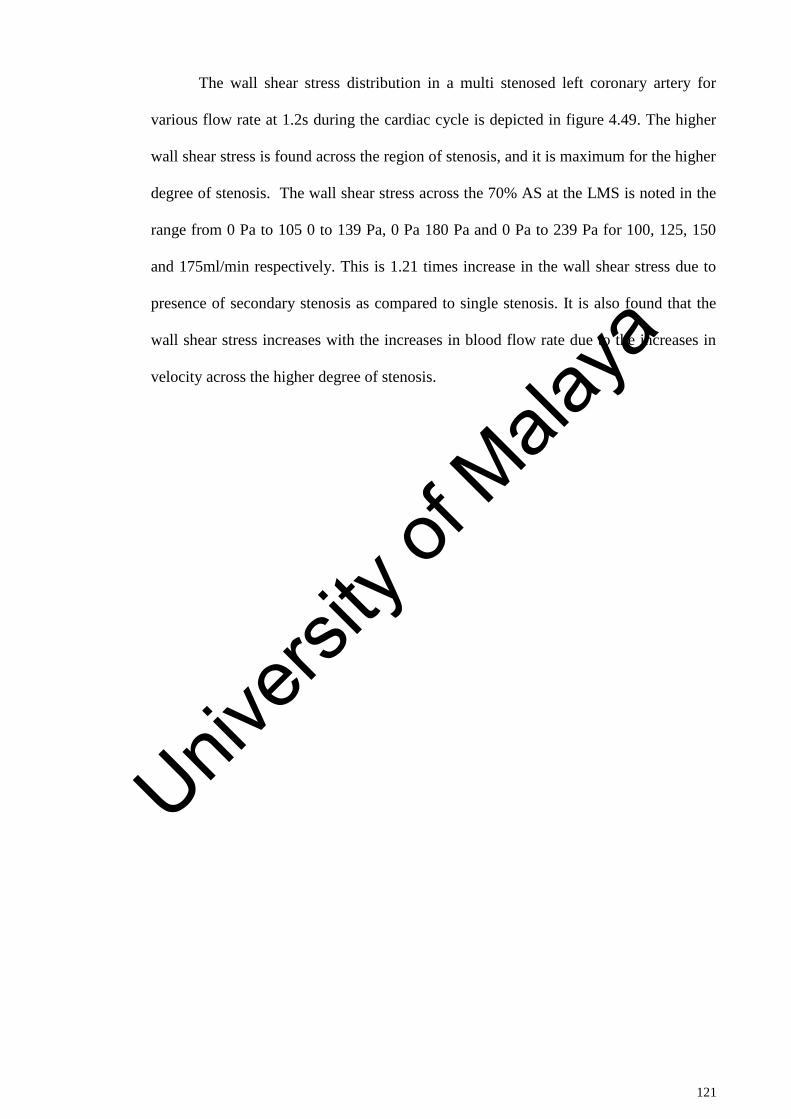
121
The wall shear stress distribution in a multi stenosed left coronary artery for
various flow rate at 1.2s during the cardiac cycle is depicted in figure 4.49. The higher
wall shear stress is found across the region of stenosis, and it is maximum for the higher
degree of stenosis. The wall shear stress across the 70% AS at the LMS is noted in the
range from 0 Pa to 105 0 to 139 Pa, 0 Pa 180 Pa and 0 Pa to 239 Pa for 100, 125, 150
and 175ml/min respectively. This is 1.21 times increase in the wall shear stress due to
presence of secondary stenosis as compared to single stenosis. It is also found that the
wall shear stress increases with the increases in blood flow rate due to the increases in
velocity across the higher degree of stenosis.
Univers
ity of
Mala
ya
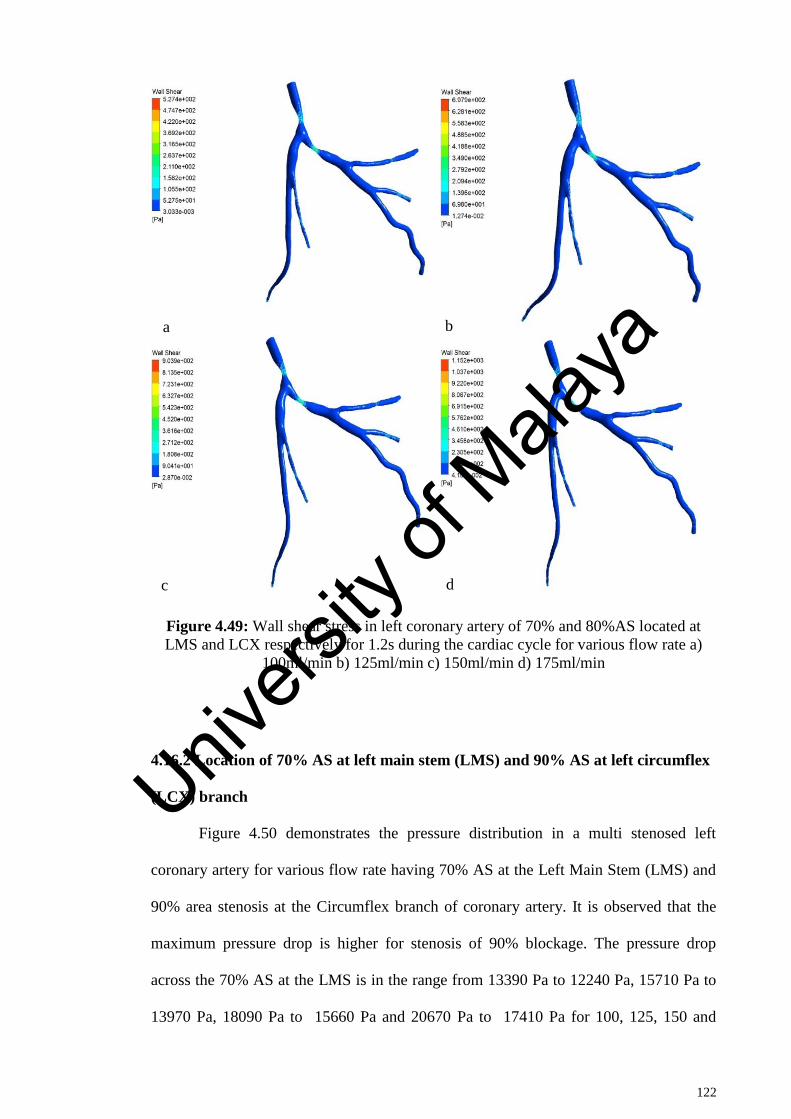
122
Figure 4.49: Wall shear stress in left coronary artery of 70% and 80%AS located at
LMS and LCX respectively for 1.2s during the cardiac cycle for various flow rate a)
100ml/min b) 125ml/min c) 150ml/min d) 175ml/min
4.16.2 Location of 70% AS at left main stem (LMS) and 90% AS at left circumflex
(LCX) branch
Figure 4.50 demonstrates the pressure distribution in a multi stenosed left
coronary artery for various flow rate having 70% AS at the Left Main Stem (LMS) and
90% area stenosis at the Circumflex branch of coronary artery. It is observed that the
maximum pressure drop is higher for stenosis of 90% blockage. The pressure drop
across the 70% AS at the LMS is in the range from 13390 Pa to 12240 Pa, 15710 Pa to
13970 Pa, 18090 Pa to 15660 Pa and 20670 Pa to 17410 Pa for 100, 125, 150 and
a b
c d
Univers
ity of
Mala
ya

123
175ml/min respectively, which is higher than that of secondary stenosis of 80%
blockage. The pressure drop across the 90% area stenosis at the Circumflex branch is in
the range from 5333 Pa to 4182 Pa, 3533 Pa to 1794 Pa, 1080 Pa -1350 Pa and -2127 Pa
to -5383 Pa for 100, 125, 150 and 175ml/min respectively.
Figure 4.50: Pressure distribution in left coronary artery of 70% and 90%AS located at
LMS and LCX respectively for 1.2s during the cardiac cycle for various flow rate a)
100ml/min b) 125ml/min c) 150ml/min d) 175ml/min
a b
c d Univers
ity of
Mala
ya
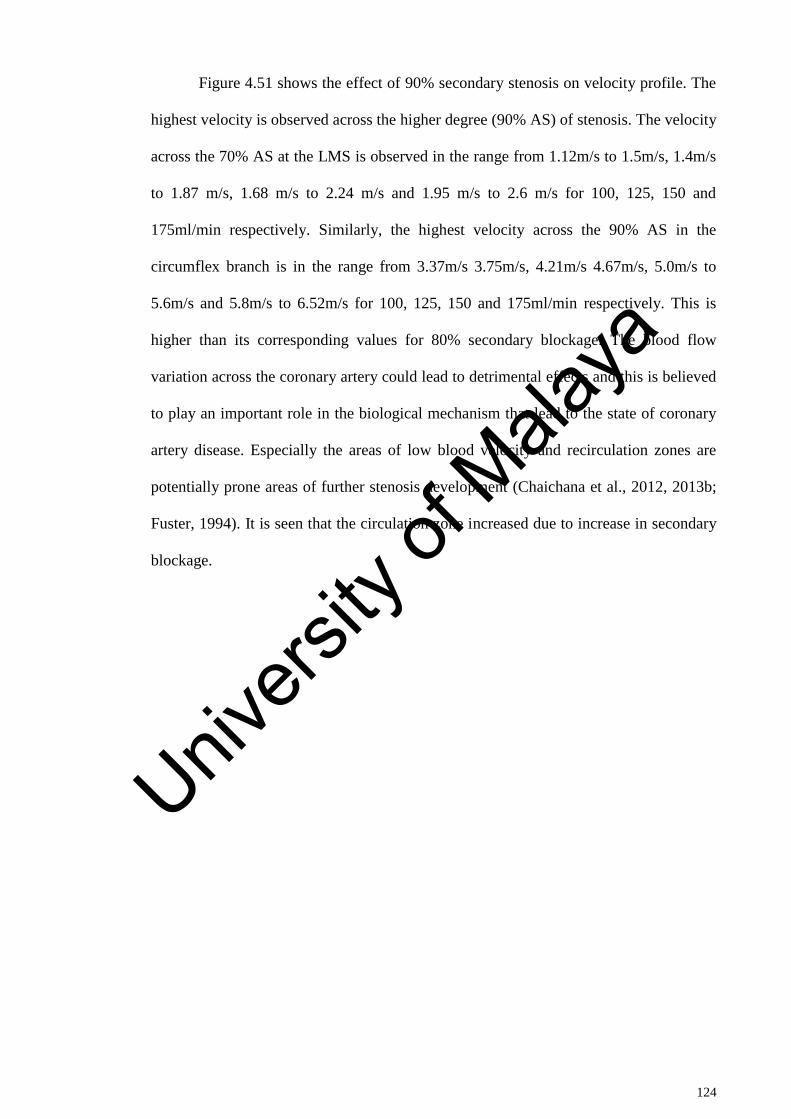
124
Figure 4.51 shows the effect of 90% secondary stenosis on velocity profile. The
highest velocity is observed across the higher degree (90% AS) of stenosis. The velocity
across the 70% AS at the LMS is observed in the range from 1.12m/s to 1.5m/s, 1.4m/s
to 1.87 m/s, 1.68 m/s to 2.24 m/s and 1.95 m/s to 2.6 m/s for 100, 125, 150 and
175ml/min respectively. Similarly, the highest velocity across the 90% AS in the
circumflex branch is in the range from 3.37m/s 3.75m/s, 4.21m/s 4.67m/s, 5.0m/s to
5.6m/s and 5.8m/s to 6.52m/s for 100, 125, 150 and 175ml/min respectively. This is
higher than its corresponding values for 80% secondary blockage. The blood flow
variation across the coronary artery could lead to detrimental effects and this is believed
to play an important role in the biological mechanism that lead to the state of coronary
artery disease. Especially the areas of low blood velocity and recirculation zones are
potentially prone areas of further stenosis development (Chaichana et al., 2012, 2013b;
Fuster, 1994). It is seen that the circulation zone increased due to increase in secondary
blockage.
Univers
ity of
Mala
ya
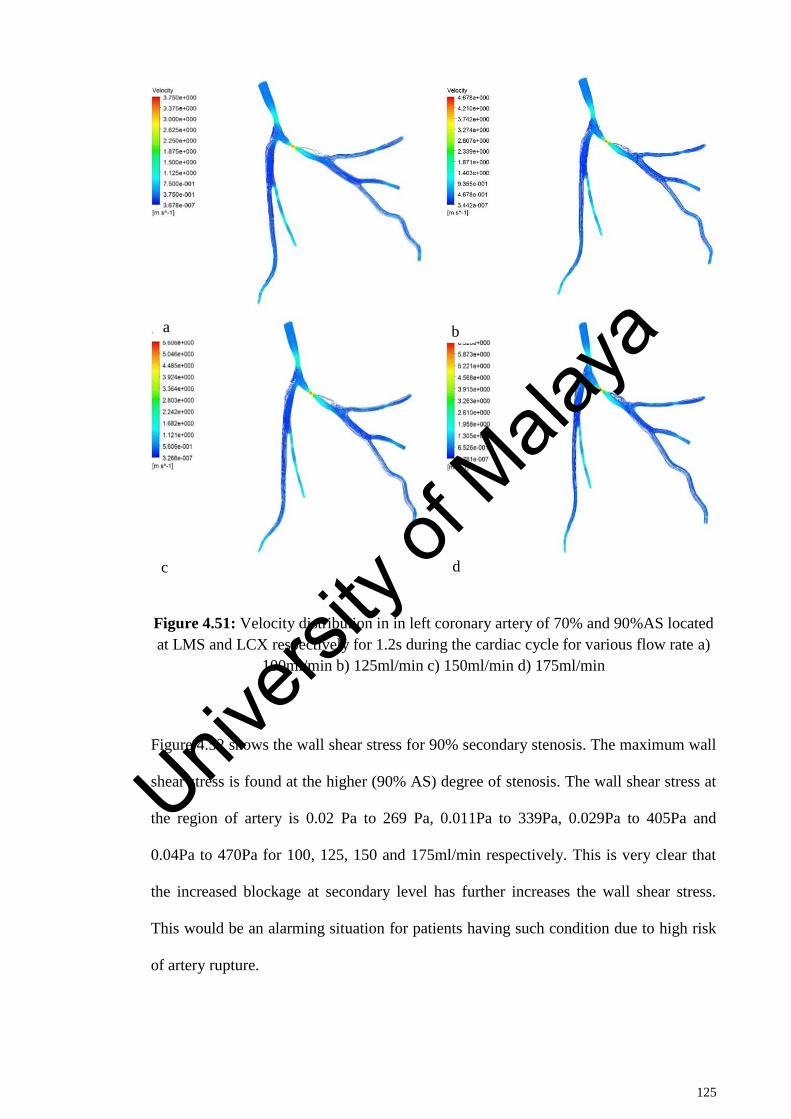
125
Figure 4.51: Velocity distribution in in left coronary artery of 70% and 90%AS located
at LMS and LCX respectively for 1.2s during the cardiac cycle for various flow rate a)
100ml/min b) 125ml/min c) 150ml/min d) 175ml/min
Figure 4.52 shows the wall shear stress for 90% secondary stenosis. The maximum wall
shear stress is found at the higher (90% AS) degree of stenosis. The wall shear stress at
the region of artery is 0.02 Pa to 269 Pa, 0.011Pa to 339Pa, 0.029Pa to 405Pa and
0.04Pa to 470Pa for 100, 125, 150 and 175ml/min respectively. This is very clear that
the increased blockage at secondary level has further increases the wall shear stress.
This would be an alarming situation for patients having such condition due to high risk
of artery rupture.
a b
c d
Univers
ity of
Mala
ya
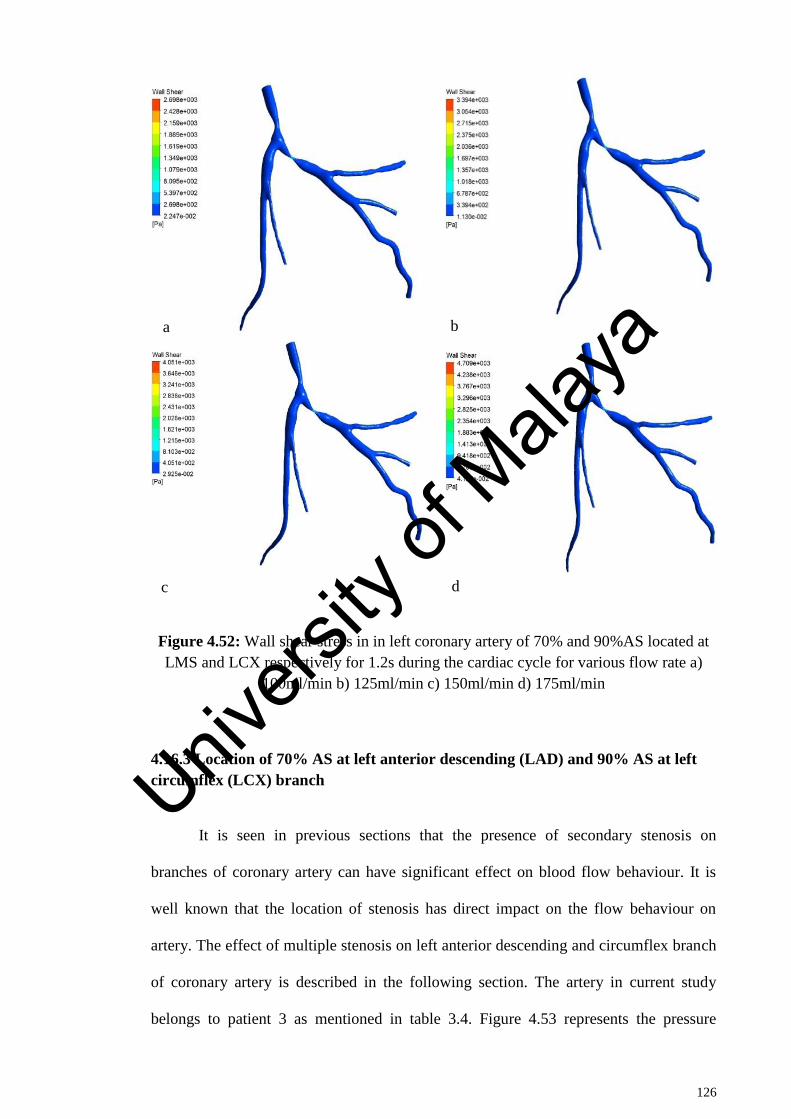
126
Figure 4.52: Wall shear stress in in left coronary artery of 70% and 90%AS located at
LMS and LCX respectively for 1.2s during the cardiac cycle for various flow rate a)
100ml/min b) 125ml/min c) 150ml/min d) 175ml/min
4.16.3 Location of 70% AS at left anterior descending (LAD) and 90% AS at left
circumflex (LCX) branch
It is seen in previous sections that the presence of secondary stenosis on
branches of coronary artery can have significant effect on blood flow behaviour. It is
well known that the location of stenosis has direct impact on the flow behaviour on
artery. The effect of multiple stenosis on left anterior descending and circumflex branch
of coronary artery is described in the following section. The artery in current study
belongs to patient 3 as mentioned in table 3.4. Figure 4.53 represents the pressure
a b
c d
Univers
ity of
Mala
ya
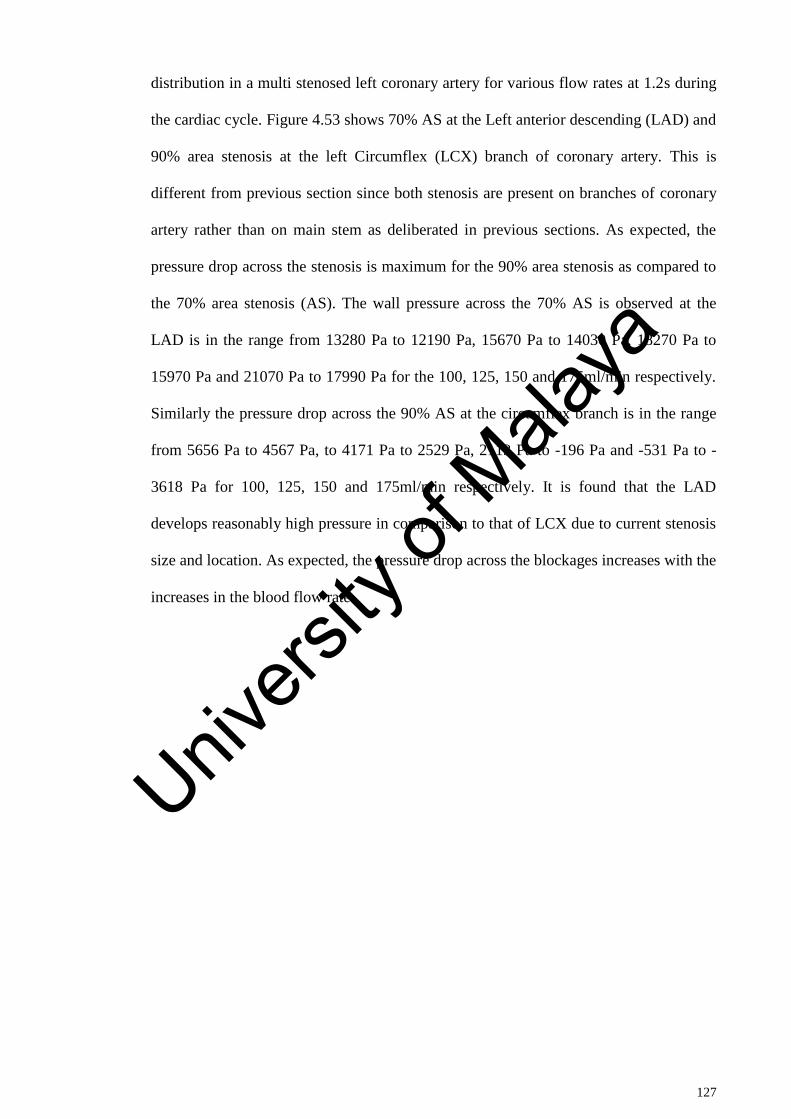
127
distribution in a multi stenosed left coronary artery for various flow rates at 1.2s during
the cardiac cycle. Figure 4.53 shows 70% AS at the Left anterior descending (LAD) and
90% area stenosis at the left Circumflex (LCX) branch of coronary artery. This is
different from previous section since both stenosis are present on branches of coronary
artery rather than on main stem as deliberated in previous sections. As expected, the
pressure drop across the stenosis is maximum for the 90% area stenosis as compared to
the 70% area stenosis (AS). The wall pressure across the 70% AS is observed at the
LAD is in the range from 13280 Pa to 12190 Pa, 15670 Pa to 14030 Pa, 18270 Pa to
15970 Pa and 21070 Pa to 17990 Pa for the 100, 125, 150 and 175ml/min respectively.
Similarly the pressure drop across the 90% AS at the circumflex branch is in the range
from 5656 Pa to 4567 Pa, to 4171 Pa to 2529 Pa, 2113 Pa to -196 Pa and -531 Pa to -
3618 Pa for 100, 125, 150 and 175ml/min respectively. It is found that the LAD
develops reasonably high pressure in comparison to that of LCX due to current stenosis
size and location. As expected, the pressure drop across the blockages increases with the
increases in the blood flow rate.
Univers
ity of
Mala
ya
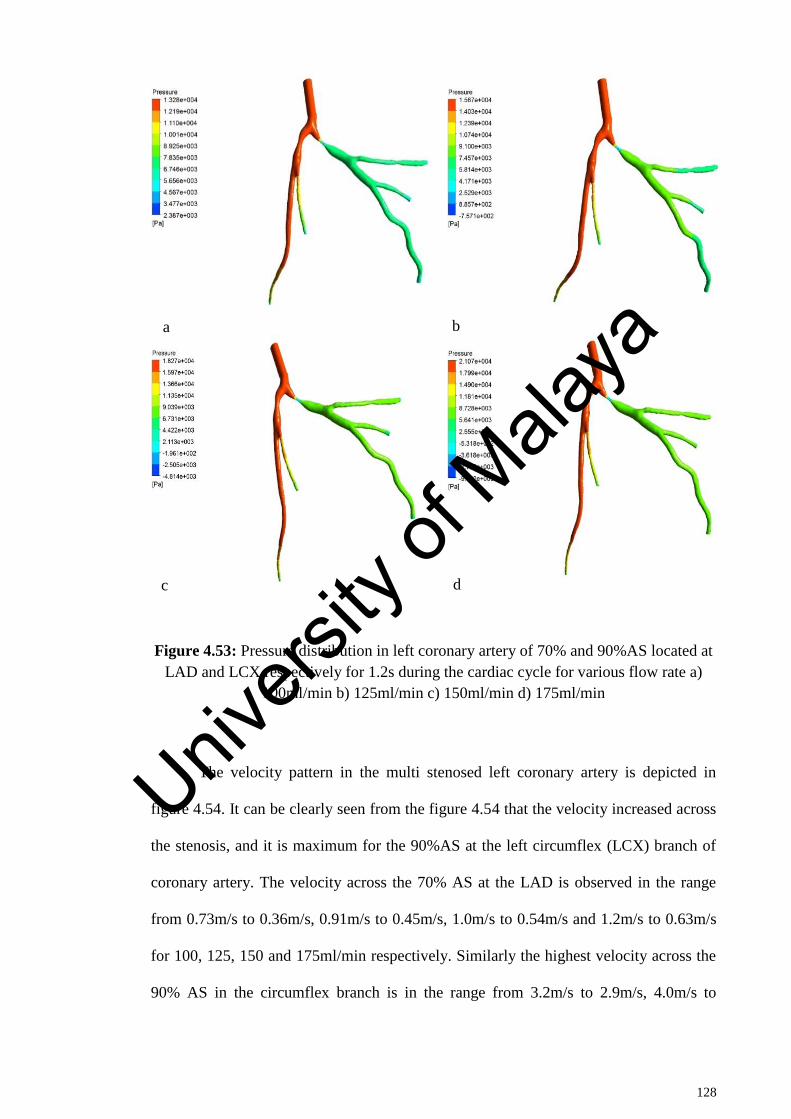
128
Figure 4.53: Pressure distribution in left coronary artery of 70% and 90%AS located at
LAD and LCX respectively for 1.2s during the cardiac cycle for various flow rate a)
100ml/min b) 125ml/min c) 150ml/min d) 175ml/min
The velocity pattern in the multi stenosed left coronary artery is depicted in
figure 4.54. It can be clearly seen from the figure 4.54 that the velocity increased across
the stenosis, and it is maximum for the 90%AS at the left circumflex (LCX) branch of
coronary artery. The velocity across the 70% AS at the LAD is observed in the range
from 0.73m/s to 0.36m/s, 0.91m/s to 0.45m/s, 1.0m/s to 0.54m/s and 1.2m/s to 0.63m/s
for 100, 125, 150 and 175ml/min respectively. Similarly the highest velocity across the
90% AS in the circumflex branch is in the range from 3.2m/s to 2.9m/s, 4.0m/s to
a b
c d
Univers
ity of
Mala
ya

129
3.6m/s, 4.9m/s to 4.3m/s and 5.7m/s to 5.0m/s for 100, 125, 150 and 175ml/min
respectively.
Figure 4.54: Velocity distribution in left coronary artery of 70% and 90%AS located at
LAD and LCX respectively for 1.2s during the cardiac cycle for various flow rate a)
100ml/min b) 125ml/min c) 150ml/min d) 175ml/min
a b
c d
Univers
ity of
Mala
ya
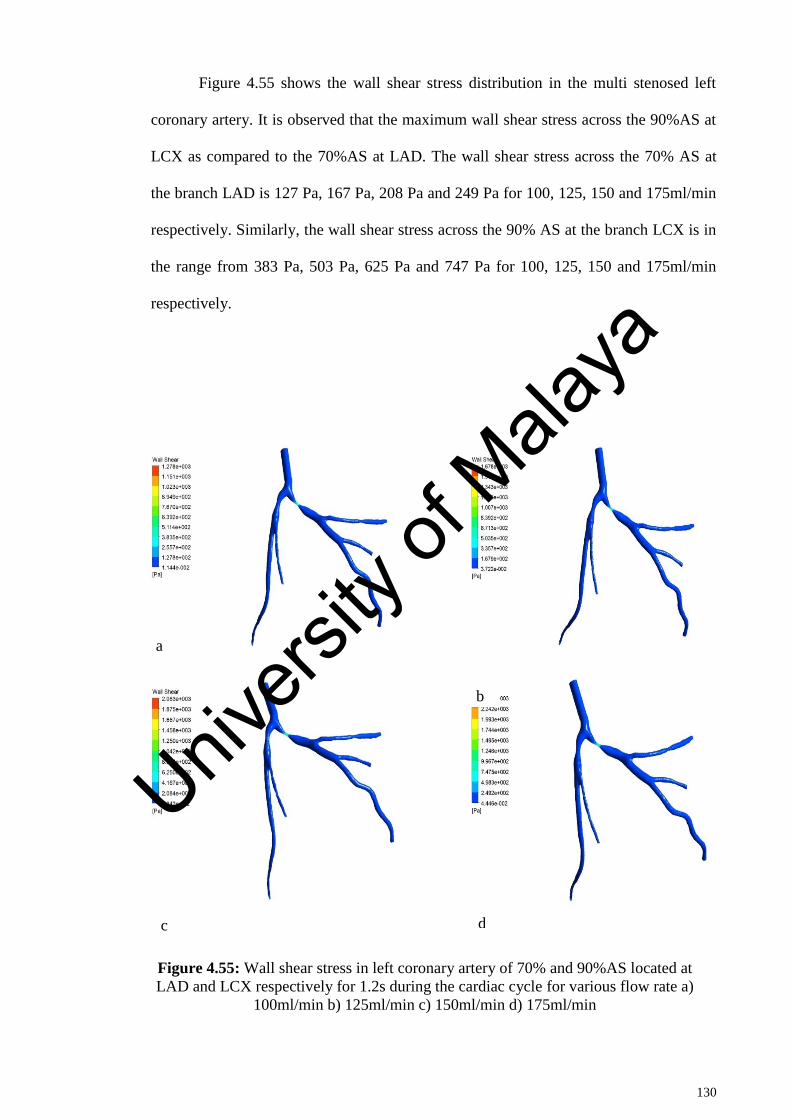
130
Figure 4.55 shows the wall shear stress distribution in the multi stenosed left
coronary artery. It is observed that the maximum wall shear stress across the 90%AS at
LCX as compared to the 70%AS at LAD. The wall shear stress across the 70% AS at
the branch LAD is 127 Pa, 167 Pa, 208 Pa and 249 Pa for 100, 125, 150 and 175ml/min
respectively. Similarly, the wall shear stress across the 90% AS at the branch LCX is in
the range from 383 Pa, 503 Pa, 625 Pa and 747 Pa for 100, 125, 150 and 175ml/min
respectively.
Figure 4.55: Wall shear stress in left coronary artery of 70% and 90%AS located at
LAD and LCX respectively for 1.2s during the cardiac cycle for various flow rate a)
100ml/min b) 125ml/min c) 150ml/min d) 175ml/min
a
b
c d
Univers
ity of
Mala
ya
131
4.16.4 Location of 90% AS at left anterior descending (LAD) and 70% AS at left
circumflex (LCX) branch
This section is aimed to investigate the effect of reversing the size of stenosis on
LAD and LCX as compared to previous section i.e. section 4.16.3. Figure 4.56 shows
the pressure distribution in a multi stenosis of left coronary artery located at LAD
(90%AS) and LCX (70%AS) for various flow rate at 1.2s during the cardiac cycle. As
expected, the pressure drops to greater extent at LAD than at the LCX. It should be
noted that the LAD had very little pressure variations for reverse order of stenosis size
on LAD and LCX (figure 4.53) as compared to present case (figure 4.55). This could be
explained in a way that the angle of branching of LCX is higher than that of LAD for
the artery being analysed. Thus the blood encounters relatively lesser resistance in LAD
than LCX in current model. Thus the pressure variations in LCX are noticeable for LCX
having 70% AS than LAD having 70% AS. It is observed that the angulation of
bifurcation has an impact on blood flow characteristics (Chaichana et al., 2011). It is
found that the pressure drop is higher for the 90%AS at the LAD branch as compared to
the 70%AS at the LCX branch.
Univers
ity of
Mala
ya
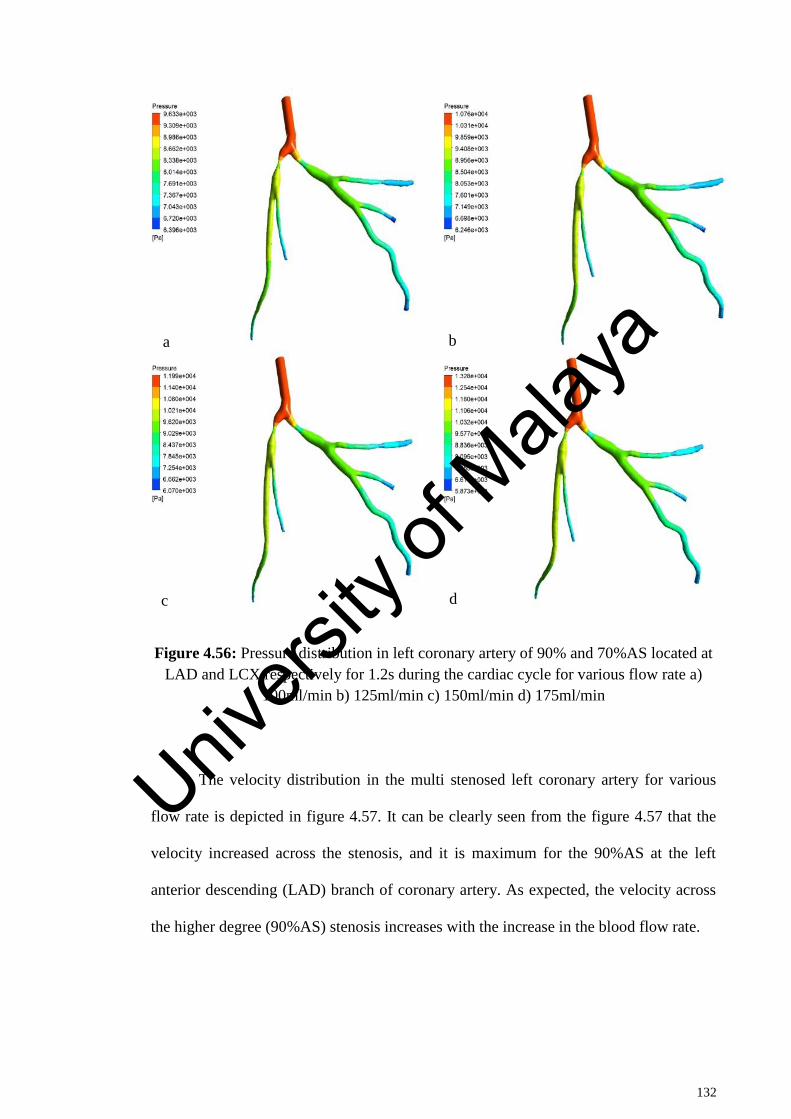
132
Figure 4.56: Pressure distribution in left coronary artery of 90% and 70%AS located at
LAD and LCX respectively for 1.2s during the cardiac cycle for various flow rate a)
100ml/min b) 125ml/min c) 150ml/min d) 175ml/min
The velocity distribution in the multi stenosed left coronary artery for various
flow rate is depicted in figure 4.57. It can be clearly seen from the figure 4.57 that the
velocity increased across the stenosis, and it is maximum for the 90%AS at the left
anterior descending (LAD) branch of coronary artery. As expected, the velocity across
the higher degree (90%AS) stenosis increases with the increase in the blood flow rate.
a b
c d
Univers
ity of
Mala
ya
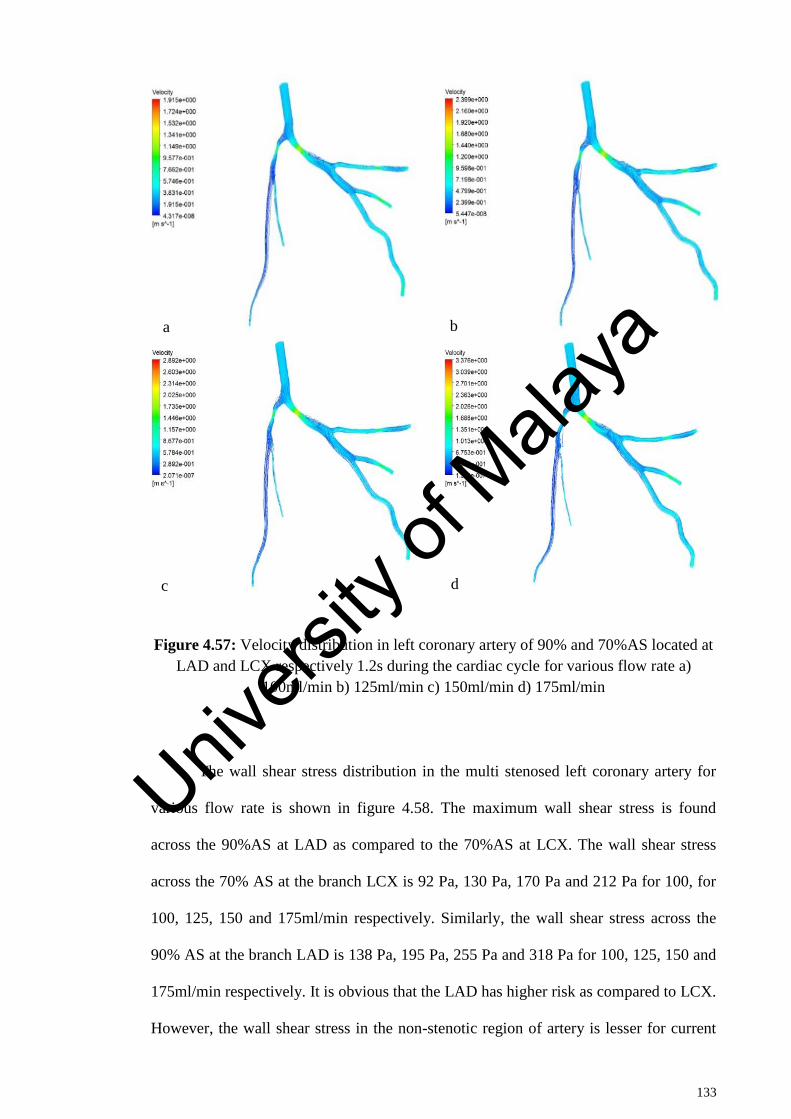
133
Figure 4.57: Velocity distribution in left coronary artery of 90% and 70%AS located at
LAD and LCX respectively 1.2s during the cardiac cycle for various flow rate a)
100ml/min b) 125ml/min c) 150ml/min d) 175ml/min
The wall shear stress distribution in the multi stenosed left coronary artery for
various flow rate is shown in figure 4.58. The maximum wall shear stress is found
across the 90%AS at LAD as compared to the 70%AS at LCX. The wall shear stress
across the 70% AS at the branch LCX is 92 Pa, 130 Pa, 170 Pa and 212 Pa for 100, for
100, 125, 150 and 175ml/min respectively. Similarly, the wall shear stress across the
90% AS at the branch LAD is 138 Pa, 195 Pa, 255 Pa and 318 Pa for 100, 125, 150 and
175ml/min respectively. It is obvious that the LAD has higher risk as compared to LCX.
However, the wall shear stress in the non-stenotic region of artery is lesser for current
a b
c d
Univers
ity of
Mala
ya
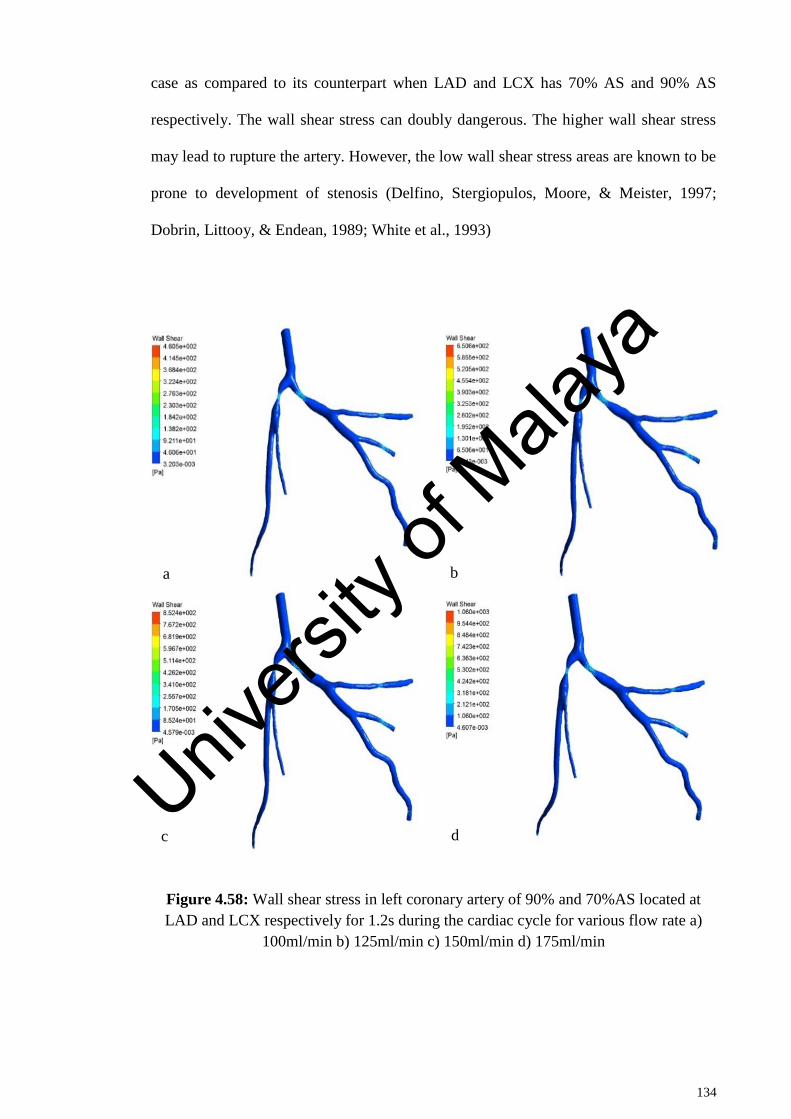
134
case as compared to its counterpart when LAD and LCX has 70% AS and 90% AS
respectively. The wall shear stress can doubly dangerous. The higher wall shear stress
may lead to rupture the artery. However, the low wall shear stress areas are known to be
prone to development of stenosis (Delfino, Stergiopulos, Moore, & Meister, 1997;
Dobrin, Littooy, & Endean, 1989; White et al., 1993)
Figure 4.58: Wall shear stress in left coronary artery of 90% and 70%AS located at
LAD and LCX respectively for 1.2s during the cardiac cycle for various flow rate a)
100ml/min b) 125ml/min c) 150ml/min d) 175ml/min
a b
c d Univ
ersity
of M
alaya
135
4.16.5 Severity analysis of different stenosis size and location
The previous sections have described the presence of two stenosis at various
locations along the coronary artery. The study is further explored by varying the
location of stenosis at branches and sub branches of left coronary artery. The current
study comprised of 10 models having varying size and location of two stenosis. Figure
4.59 shows the locations of those 10 models considered along with table 4.1 showing
the size and location of each model studied. It is known that the pressure drop in the
artery due to presence of blockage areas can be taken as an indicator of the health of
diseased artery. Thus the current study is focussed to assess the severity of artery based
on pressure drop across various models being analysed. The models are rated according
to the pressure drop with worse pressure drop getting the rank 1 in severity.
Table 4.2 shows the rating of 10 analysed models. The models were initially
numbered sequentially as per the stenosis position away from main stem and then
ranked according to the highest pressure drop. It is clear from table 4.2 that the model
having 70% and 90% stenosis at Left Main Stem and just after the branching into LCX
respectively is worst affected among all the models being investigated. This could be
attributed to 90% blockage in the LCX that hinders the flow by offering extensive
resistance. This is further vindicated by the fact that all the models that have 90%
blockage at position two are among the worst affected as compared to other model
being investigated. The change of blockage area from 90% to 80% has reduced the
rating to 5. The least affected model among all, is the one having 90% and 70% stenosis
at position 3 and 5 respectively which are located at LAD and sub branch of LCX. It is
obvious from table 4.2 that the stenosis in the LCX has larger pressure drop as
compared to stenosis at the LAD in the artery model belonging to patient 3. This could
be attributed to the fact that the bifurcation angle of LCX is higher than that of LAD of
coronary artery of patient 3. It is known that the atherosclerosis (a disease of the arteries
Univers
ity of
Mala
ya
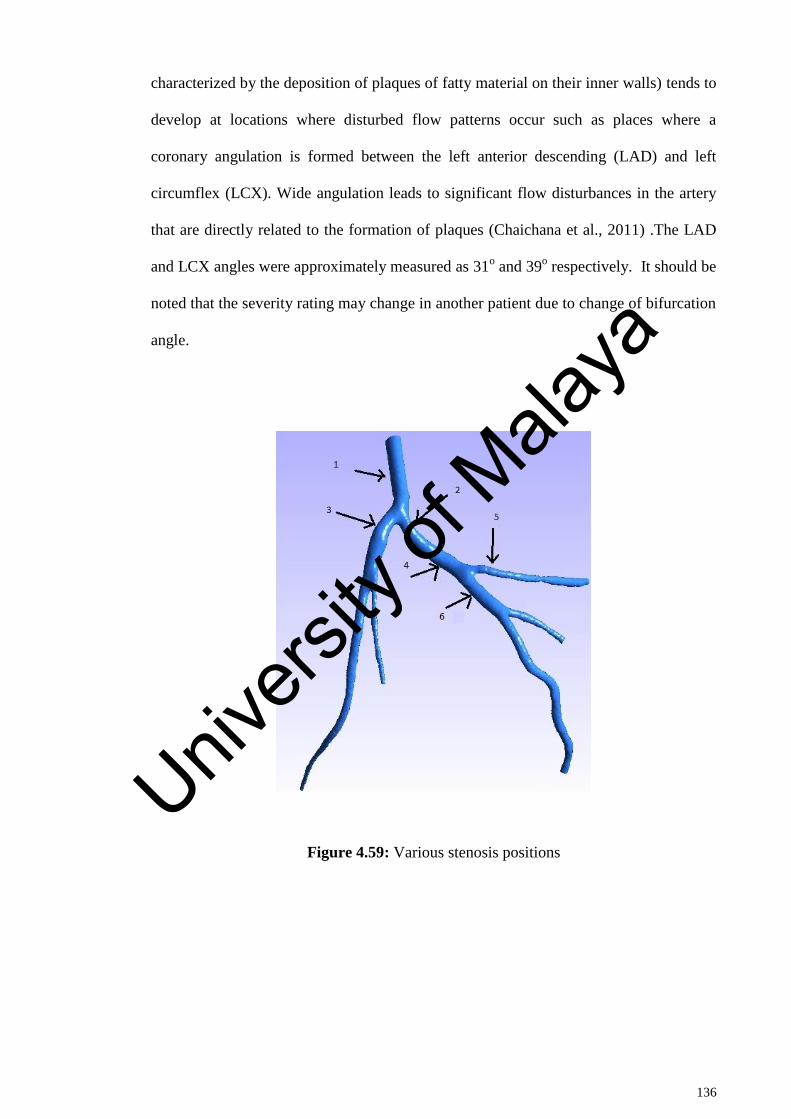
136
characterized by the deposition of plaques of fatty material on their inner walls) tends to
develop at locations where disturbed flow patterns occur such as places where a
coronary angulation is formed between the left anterior descending (LAD) and left
circumflex (LCX). Wide angulation leads to significant flow disturbances in the artery
that are directly related to the formation of plaques (Chaichana et al., 2011) .The LAD
and LCX angles were approximately measured as 31o and 39
o respectively. It should be
noted that the severity rating may change in another patient due to change of bifurcation
angle.
Figure 4.59: Various stenosis positions
Univers
ity of
Mala
ya
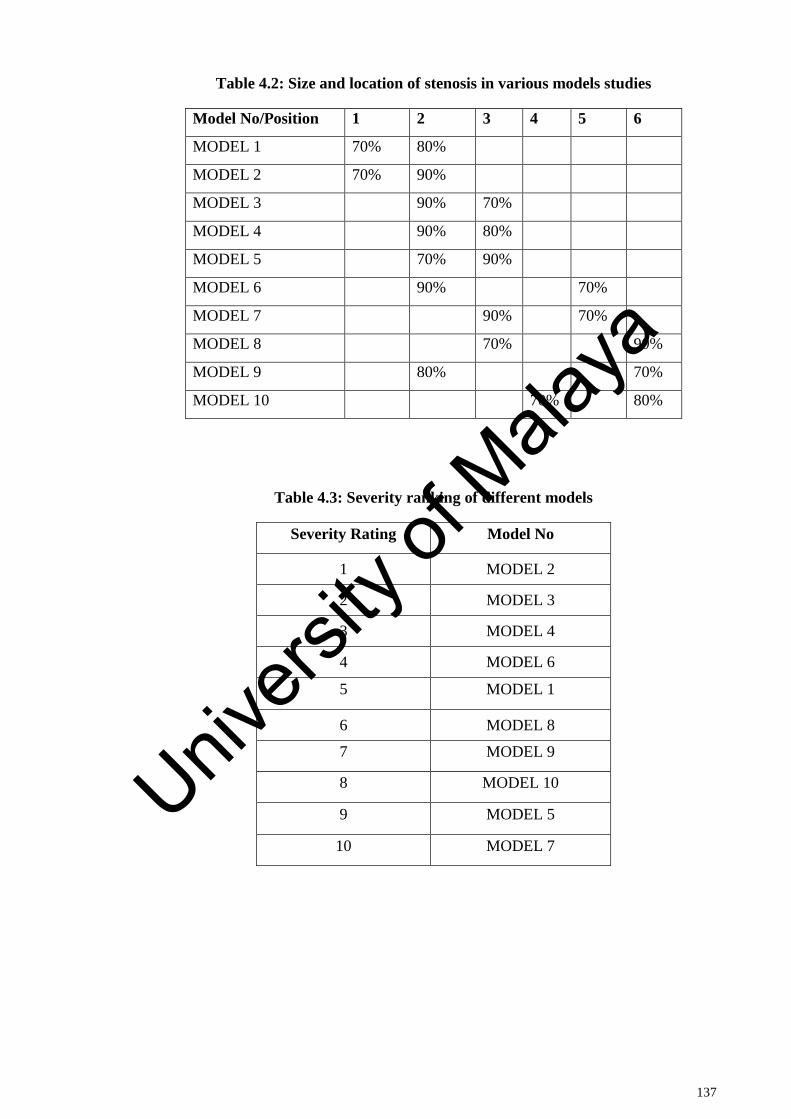
137
Table 4.2: Size and location of stenosis in various models studies
Model No/Position 1 2 3 4 5 6
MODEL 1 70% 80%
MODEL 2 70% 90%
MODEL 3 90% 70%
MODEL 4 90% 80%
MODEL 5 70% 90%
MODEL 6 90% 70%
MODEL 7 90% 70%
MODEL 8 70% 90%
MODEL 9 80% 70%
MODEL 10 70% 80%
Table 4.3: Severity ranking of different models
Severity Rating Model No
1 MODEL 2
2 MODEL 3
3 MODEL 4
4 MODEL 6
5 MODEL 1
6 MODEL 8
7 MODEL 9
8 MODEL 10
9 MODEL 5
10 MODEL 7
Univers
ity of
Mala
ya
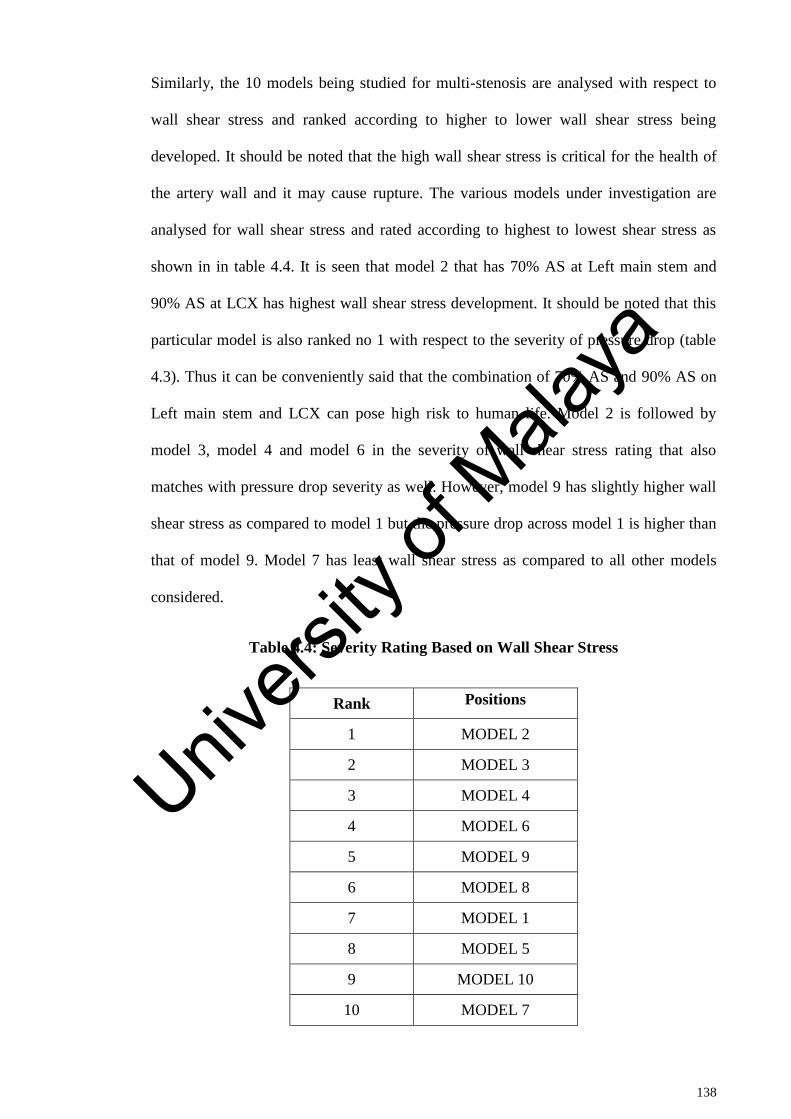
138
Similarly, the 10 models being studied for multi-stenosis are analysed with respect to
wall shear stress and ranked according to higher to lower wall shear stress being
developed. It should be noted that the high wall shear stress is critical for the health of
the artery wall and it may cause rupture. The various models under investigation are
analysed for wall shear stress and rated according to highest to lowest shear stress as
shown in in table 4.4. It is seen that model 2 that has 70% AS at Left main stem and
90% AS at LCX has highest wall shear stress development. It should be noted that this
particular model is also ranked no 1 with respect to the severity of pressure drop (table
4.3). Thus it can be conveniently said that the combination of 70% AS and 90% AS on
Left main stem and LCX can pose high risk to human life. Model 2 is followed by
model 3, model 4 and model 6 in the severity of wall shear stress rating that also
matches with pressure drop severity as well. However, model 9 has slightly higher wall
shear stress as compared to model 1 but the pressure drop across model 1 is higher than
that of model 9. Model 7 has least wall shear stress as compared to all other models
considered.
Table 4.4: Severity Rating Based on Wall Shear Stress
Rank Positions
1 MODEL 2
2 MODEL 3
3 MODEL 4
4 MODEL 6
5 MODEL 9
6 MODEL 8
7 MODEL 1
8 MODEL 5
9 MODEL 10
10 MODEL 7
Univers
ity of
Mala
ya

139
The study is further explored to analyse the transient velocity variation at the main left
stem (point 1) and near the branching point of main left stem into LAD and LCX (point
2). The transient velocity variation is studied for 4 blood flow rates such as 100ml, 125
ml, 150ml and 175 ml, as shown in figures 4.60 to 4.69. As expected, the velocity for
higher flow rate is high in all the models studied. The trend of velocity variation is
found to be similar for all the models corresponding to the cardiac cycle of 1.6 s. It is
further observed that the velocity at point 1 which lies in left main stem is higher than
that of the point near the bifurcation into LCX and LAD. This is due to the obstruction
offered by the bifurcation region. It is seen that the velocity at point 1 does not vary
much for different models. This happens because point 1 is near the inlet boundary of
coronary artery. However, velocity at point 2 reduces significantly when stenosis is
present in the branch and sub-branch of coronary artery.
Univers
ity of
Mala
ya

140
Figure 4.60: Velocity profile for model 1 at point 1 and point 2 for various flow rate
Figure 4.61: Velocity profile for model 2 at point 1 and point 2 for various flow rate
Figure 4.62: Velocity profile for model 3 at point 1 and point 2 for various flow rate
Univers
ity of
Mala
ya
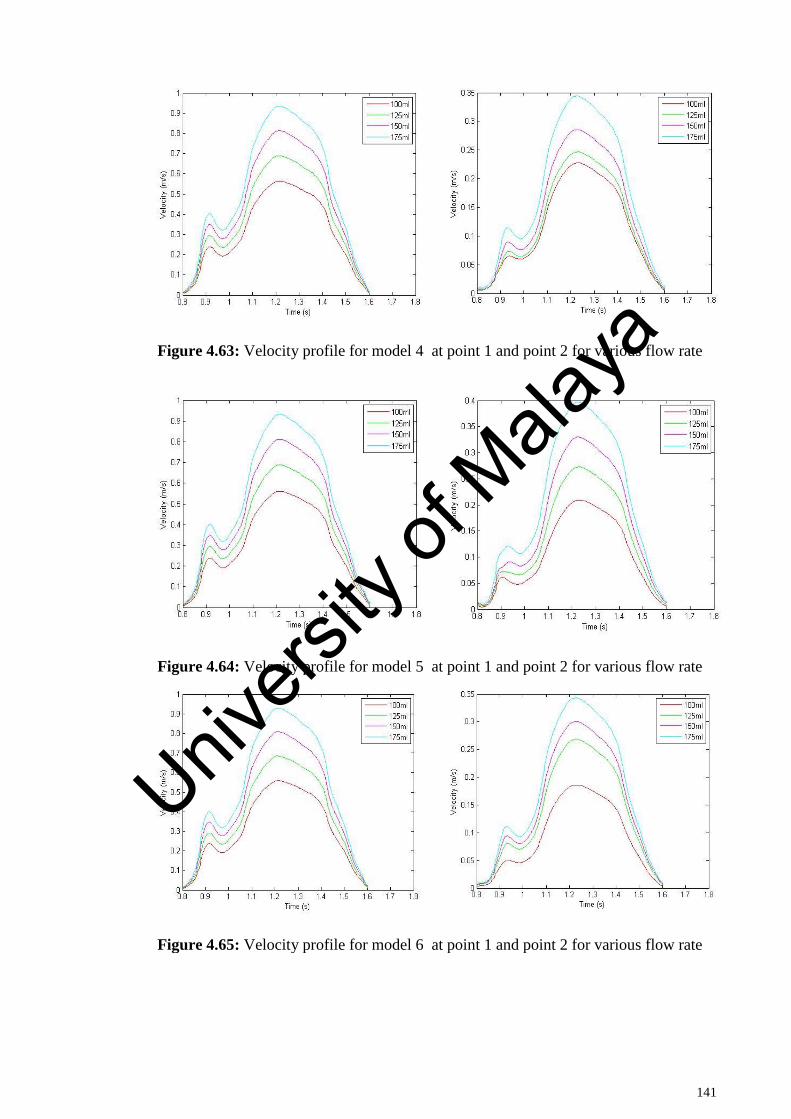
141
Figure 4.63: Velocity profile for model 4 at point 1 and point 2 for various flow rate
Figure 4.64: Velocity profile for model 5 at point 1 and point 2 for various flow rate
Figure 4.65: Velocity profile for model 6 at point 1 and point 2 for various flow rate
Univers
ity of
Mala
ya
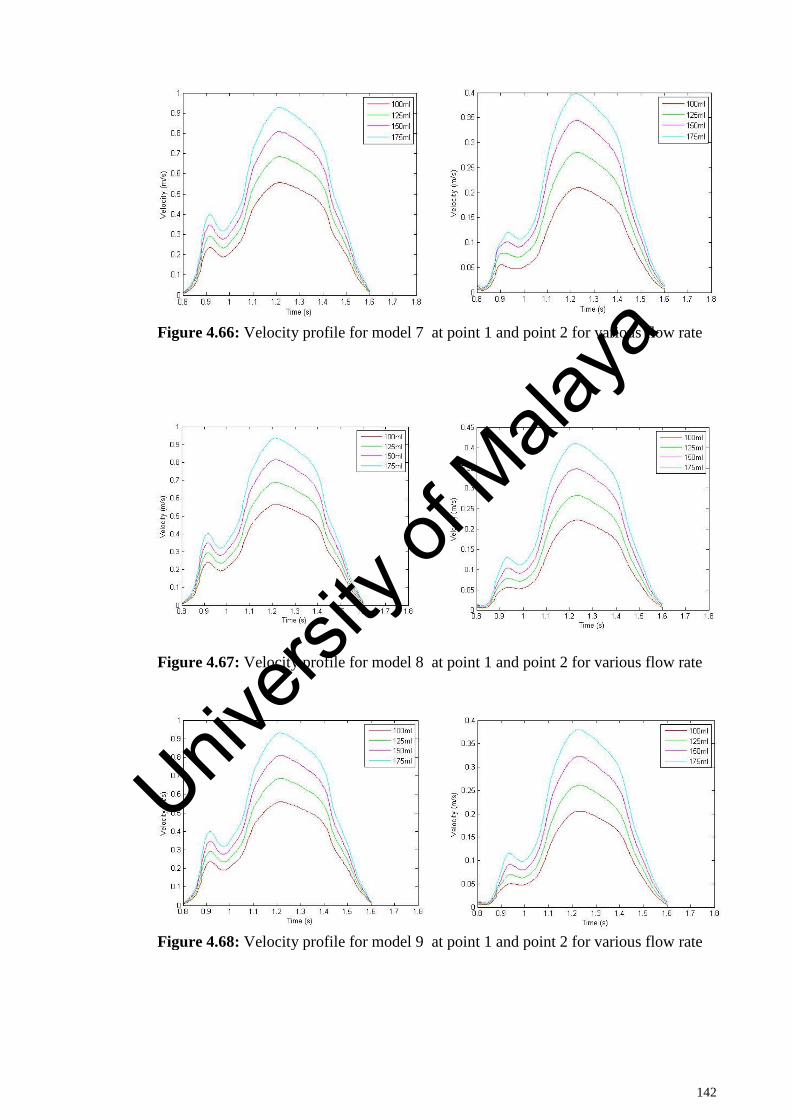
142
Figure 4.66: Velocity profile for model 7 at point 1 and point 2 for various flow rate
Figure 4.67: Velocity profile for model 8 at point 1 and point 2 for various flow rate
Figure 4.68: Velocity profile for model 9 at point 1 and point 2 for various flow rate
Univers
ity of
Mala
ya
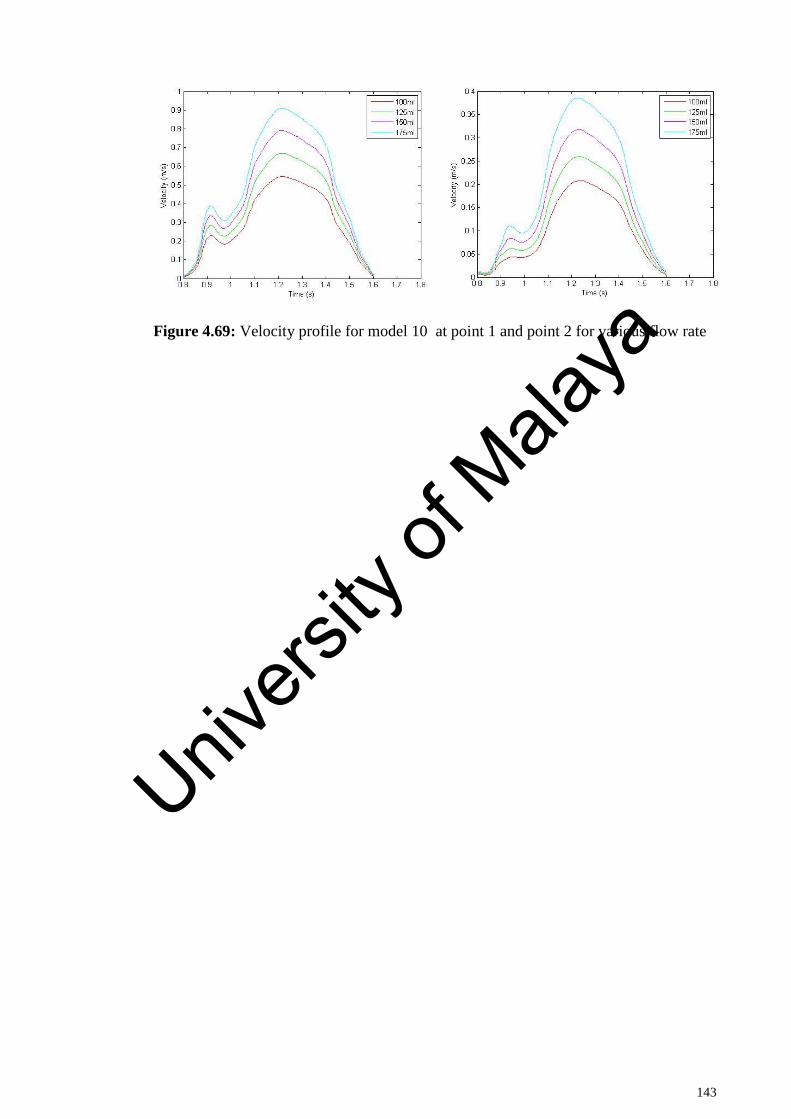
143
Figure 4.69: Velocity profile for model 10 at point 1 and point 2 for various flow rate
Univers
ity of
Mala
ya
144
CHAPTER 5: CONCLUSION
5.1 Conclusions
For a given percentage area stenosis, the different shapes of stenosis affect the
intraluminal flow and hence the changes in diagnostic parameter FFR were observed in
all the three models (triangular, elliptical, and trapezium). The following conclusion are
drawn from hemodynamic analysis of coronary artery model
The increase in percentage area stenosis, increase the velocity profile inside the
blockage region.
The pressure drop is highest in case of trapezoidal stenosis and least for
triangular shape for same area blockage due to stenosis thus the severity level of
patients increases in case of trapezoidal geometry.
The arterial wall is more prone to rupture due to trapezoidal stenosis than the
elliptical or triangular shapes.
The shape of stenosis has significant impact on the hemodynamic that should
not be neglected in clinical decision making.
In case of the investigation of curvature angle, the following conclusion can be drawn
from this study
The blood behavior is substantially affected by the combined effect of stenosis
and the curvature of artery.
The presence of curvature provides low blood flow region at the lower wall of
artery creating a potential stenotic region.
The blood flow recovery is least for the smaller curvature angle
Univers
ity of
Mala
ya
145
The upper wall of artery after stenotic region is subjected to high shear stress
due to curvature effect.
In case of study to investigate the effect of stenosis on the various hemodynamic
parameters in 4 suspected patients in vivo models, the following conclusion could be
drawn.
The changes in the hemodynamic parameters would result in corresponding
changes in the local blood flow conditions leading to the abnormalities in the
coronary arterial conditions.
The effect of the stenosis on the pressure variation could lead to the worsening
of the atherosclerosis in the patients leading to the complications in the normal
functioning off the heart.
The high wall shear stress at the stenosis may increase the potential risk of
stenosis rupture.
The recirculation region at post stenosis could lead to the formation of stenosis.
For the case of different degree of multi stenosis present at various locations in the left
coronary artery, the following conclusion can be drawn.
The pressure drops is maximum across the higher degree of stenosis in multi
stenosed models.
The most affected model is that of having 70% and 90% area stenosis
compared to other models studied.
The least effect of stenosis on the pressure was found for the model having
stenosis having 90% and 70% stenosis at position 3 and 5 respectively which are
located at LAD and sub branch of LCX.
Univers
ity of
Mala
ya
146
5.2 Recommendation for future research
In the current study, a computational fluid dynamic analysis on the idealistic and
realistic patients specific left coronary artery models with the various parameters such
as effect of different shapes of stenosis, angle of downstream curvatures, effects of
various degree of stenosis and their locations in the patient specific left coronary artery
models on the hemodynamic as well as on the diagnostic parameters have been studied
and found important clinical information. The following proposals are put forward for
future research work:
The coronary artery models considered in the whole computational fluid
dynamic studies as rigid artery wall rather than elastic, there for the simulation
does not reflect the fully realistic physiological conditions. Hence in future the
realistic patient’s specific coronary artery models with elastic artery wall could
be considered in future research.
The study could be extended to right coronary artery
Univers
ity of
Mala
ya
147
REFERENCES
Ahmed, Saad A. (1998). An experimental investigation of pulsatile flow through a
smooth constriction. Experimental Thermal and Fluid Science, 17(4), 309-318.
doi: http://dx.doi.org/10.1016/S0894-1777(98)00009-0
Ai, L., & Vafai, K. (2006). A coupling model for macromolecule transport in a stenosed
arterial wall. International Journal of Heat and Mass Transfer, 49(9–10), 1568-
1591. doi: 10.1016/j.ijheatmasstransfer.2005.10.041
Alberto Figueroa C. (2006). A coupled-momentum method to model blood flow and
vessel deformation in Human Arteries: Applications in disease research and
Simulation-Based Medical Planning. (Ph.D), Stanford University.
Alishahi, M, Alishahi, MM, & Emdad, H. (2011). Numerical simulation of blood flow
in a flexible stenosed abdominal real aorta. Scientia Iranica, 18(6), 1297-1305.
Alishahi, M., Alishahi, M. M., & Emdad, H. (2011). Numerical simulation of blood
flow in a flexible stenosed abdominal real aorta. Scientia Iranica, 18(6), 1297-
1305. doi: 10.1016/j.scient.2011.11.021
Andersson, Helge I., Halden, Ragnhild, & Glomsaker, Terje. (2000). Effects of surface
irregularities on flow resistance in differently shaped arterial stenoses. Journal
of Biomechanics, 33(10), 1257-1262. doi: http://dx.doi.org/10.1016/S0021-
9290(00)00088-9
Ashtekar, Koustubh D, Back, Lloyd H, Khoury, Saeb F, & Banerjee, Rupak K. (2007).
In vitro quantification of guidewire flow-obstruction effect in model coronary
stenoses for interventional diagnostic procedure. Journal of Medical Devices,
1(3), 185-196.
Banerjee, Rupak K., Peelukhana, Srikara V., & Goswami, Ishan. (2014). Influence of
newly designed monorail pressure sensor catheter on coronary diagnostic
parameters: An in vitro study. Journal of Biomechanics, 47(3), 617-624. doi:
http://dx.doi.org/10.1016/j.jbiomech.2013.12.005
Banerjee, RupakK, Ashtekar, KoustubhD, Helmy, TarekA, Effat, MohamedA, Back,
LloydH, & Khoury, SaebF. (2008). Hemodynamic diagnostics of epicardial
coronary stenoses: in-vitro experimental and computational study. BioMedical
Engineering OnLine, 7(1), 1-22. doi: 10.1186/1475-925x-7-24
Bernsdorf, Jörg, & Wang, Dinan. (2009). Non-Newtonian blood flow simulation in
cerebral aneurysms. Computers & Mathematics with Applications, 58(5), 1024-
1029.
Univers
ity of
Mala
ya
148
Bluestein, D, & Einav, S. (1993). Spectral estimation and analysis of LDA data in
pulsatile flow through heart valves. Experiments in Fluids, 15(4-5), 341-353.
Bluestein, Danny, Einav, Shmuel, & Hwang, Ned HC. (1994). A squeeze flow
phenomenon at the closing of a bileaflet mechanical heart valve prosthesis.
Journal of biomechanics, 27(11), 1369-1378.
Botar, C. C., Vasile, T., Sfrangeu, S., Clichici, S., Agachi, P. S., Badea, R., . . .
Moldovan, R. (2009). CFD Simulation of the Portal Vein Blood Flow. In S.
Vlad, R. V. Ciupa & A. I. Nicu (Eds.), International Conference on
Advancements of Medicine and Health Care through Technology (Vol. 26, pp.
359-362).
Brosh, David, Higano, Stuart T., Lennon, Ryan J., Holmes Jr, David R., & Lerman,
Amir. (2005). Effect of lesion length on fractional flow reserve in intermediate
coronary lesions. American Heart Journal, 150(2), 338-343. doi:
http://dx.doi.org/10.1016/j.ahj.2004.09.007
Brosig, Richard, Kowarschik, Markus, Maday, Peter, Katouzian, Amin, Demirci,
Stefanie, & Navab, Nassir. (2014). Blood Flow Quantification using 1D CFD
Parameter Identification. In S. Ourselin & M. A. Styner (Eds.), Medical Imaging
2014: Image Processing (Vol. 9034).
Byun, H. S., & Rhee, K. (2004). CFD modeling of blood flow following coil
embolization of aneurysms. Medical Engineering & Physics, 26(9), 755-761.
doi: 10.1016/j.medengphy.2004.06.008
Calfon, Marcella A, Vinegoni, Claudio, Ntziachristos, Vasilis, & Jaffer, Farouc A.
(2010). Intravascular near-infrared fluorescence molecular imaging of
atherosclerosis: toward coronary arterial visualization of biologically high-risk
plaques. Journal of biomedical optics, 15(1), 011107-011107-011106.
Chaichana, Thanapong, Sun, Zhonghua, & Jewkes, James. (2011). Computation of
hemodynamics in the left coronary artery with variable angulations. Journal of
Biomechanics, 44(10), 1869-1878. doi:
http://dx.doi.org/10.1016/j.jbiomech.2011.04.033
Chaichana, Thanapong, Sun, Zhonghua, & Jewkes, James. (2012). Computational fluid
dynamics analysis of the effect of plaques in the left coronary artery.
Computational and mathematical methods in medicine, 2012.
Univers
ity of
Mala
ya
149
Chaichana, Thanapong, Sun, Zhonghua, & Jewkes, James. (2013a). Haemodynamic
analysis of the effect of different types of plaques in the left coronary artery.
Computerized Medical Imaging and Graphics, 37(3), 197-206. doi:
http://dx.doi.org/10.1016/j.compmedimag.2013.02.001
Chaichana, Thanapong, Sun, Zhonghua, & Jewkes, James. (2013b). Hemodynamic
impacts of left coronary stenosis: A patient-specific analysis. Acta of
Bioengineering and Biomechanics, 15(3).
Chaichana, Thanapong, Sun, Zhonghua, & Jewkes, James. (2013c). Hemodynamic
impacts of various types of stenosis in the left coronary artery bifurcation: A
patient-specific analysis. Physica Medica, 29(5), 447-452. doi:
http://dx.doi.org/10.1016/j.ejmp.2013.02.001
Chaichana, Thanapong, Sun, Zhonghua, & Jewkes, James. (2014). Impact of plaques in
the left coronary artery on wall shear stress and pressure gradient in coronary
side branches. Computer methods in biomechanics and biomedical engineering,
17(2), 108-118.
Chakravarty, Santabrata, & Mandal, Prashanta Kumar. (2000). Two-dimensional blood
flow through tapered arteries under stenotic conditions. International Journal of
Non-Linear Mechanics, 35(5), 779-793.
Chakravarty, Santabrata, & Mandal, Prashanta Kumar. (2005). Effect of surface
irregularities on unsteady pulsatile flow in a compliant artery. International
Journal of Non-Linear Mechanics, 40(10), 1268-1281.
Chakravarty, Santabrata, & Mandal, Prashanta Kumar. (2009). Effect of heat and mass
transfer on non-Newtonian flow–Links to atherosclerosis. International Journal
of Heat and Mass Transfer, 52(25), 5719-5730.
Chen, Jie, & Lu, Xi-Yun. (2004). Numerical investigation of the non-Newtonian blood
flow in a bifurcation model with a non-planar branch. Journal of biomechanics,
37(12), 1899-1911.
Chen, Jie, & Lu, Xi-Yun. (2006). Numerical investigation of the non-Newtonian
pulsatile blood flow in a bifurcation model with a non-planar branch. Journal of
Biomechanics, 39(5), 818-832.
Cho, Young I, Back, Lloyd H, Crawford, Donald W, & Cuffel, Robert F. (1983).
Experimental study of pulsatile and steady flow through a smooth tube and an
atherosclerotic coronary artery casting of man. Journal of Biomechanics, 16(11),
933-946.
Univers
ity of
Mala
ya
150
Dash, R. K., Jayaraman, G., & Mehta, K. N. (1999). Flow in a catheterized curved
artery with stenosis. Journal of Biomechanics, 32(1), 49-61. doi:
http://dx.doi.org/10.1016/S0021-9290(98)00142-0
Dash, RK, Jayaraman, G, & Mehta, KN. (1999). Flow in a catheterized curved artery
with stenosis. Journal of Biomechanics, 32(1), 49-61.
De Bruyne, Bernard, Pijls, Nico H.J., Kalesan, Bindu, Barbato, Emanuele, Tonino, Pim
A.L., Piroth, Zsolt, . . . Fearon, William F. (2012). Fractional Flow Reserve–
Guided PCI versus Medical Therapy in Stable Coronary Disease. New England
Journal of Medicine, 367(11), 991-1001. doi: doi:10.1056/NEJMoa1205361
Delfino, A, Stergiopulos, N, Moore, JE, & Meister, J-J. (1997). Residual strain effects
on the stress field in a thick wall finite element model of the human carotid
bifurcation. Journal of biomechanics, 30(8), 777-786.
Dobrin, PhB, Littooy, FN, & Endean, ED. (1989). Mechanical factors predisposing to
intimal hyperplasia and medial thickening in autogenous vein grafts. Surgery,
105(3), 393-400.
Feng, Rui, Xenos, Michalis, Girdhar, Gaurav, Kang, Wei, Davenport, James W, Deng,
Yuefan, & Bluestein, Danny. (2012). Viscous flow simulation in a stenosis
model using discrete particle dynamics: a comparison between DPD and CFD.
Biomechanics and modeling in mechanobiology, 11(1-2), 119-129.
Fung, Y.C. (1984). Biodynamics (1 ed.). New York: Springer Verlag.
Fuster, Valentin. (1994). Lewis A. Conner Memorial Lecture. Mechanisms leading to
myocardial infarction: insights from studies of vascular biology. Circulation,
90(4), 2126-2146.
Goswami, Ishan, Peelukhana, Srikara V, Al-Rjoub, Marwan F, Back, Lloyd H, &
Banerjee, Rupak K. (2013). Influence of Variable Native Arterial Diameter and
Vasculature Status on Coronary Diagnostic Parameters. Journal of
biomechanical engineering, 135(9), 091005.
Govindaraju, Kalimuthu, Kamangar, Sarfaraz, Badruddin, Irfan Anjum, Viswanathan,
Girish N., Badarudin, A., & Salman Ahmed, N. J. (2014). Effect of porous
media of the stenosed artery wall to the coronary physiological diagnostic
parameter: A computational fluid dynamic analysis. Atherosclerosis, 233(2),
630-635. doi: http://dx.doi.org/10.1016/j.atherosclerosis.2014.01.043
Univers
ity of
Mala
ya
151
Ha, Hojin, & Lee, Sang-Joon. (2014). Effect of swirling inlet condition on the flow field
in a stenosed arterial vessel model. Medical engineering & physics, 36(1), 119-
128.
Han, H-C. (2012). Twisted blood vessels: symptoms, etiology and biomechanical
mechanisms. Journal of vascular research, 49(3), 185-197.
Huang, Rong Fung, Yang, Ten-Fang, & Lan, Y-K. (2010). Pulsatile flows and wall-
shear stresses in models simulating normal and stenosed aortic arches.
Experiments in fluids, 48(3), 497-508.
Ikbal, Asif. (2012). Viscoelastic blood flow through arterial stenosis—Effect of variable
viscosity. International Journal of Non-Linear Mechanics, 47(8), 888-894.
Ikbal, M. A. (2012). Viscoelastic blood flow through arterial stenosis-Effect of variable
viscosity. International Journal of Non-Linear Mechanics, 47(8), 888-894. doi:
10.1016/j.ijnonlinmec.2012.05.006
Ishikawa, Takuji, Guimaraes, Luis F. R., Oshima, Shuzo, & Yamane, Ryuichiro.
(1998). Effect of non-Newtonian property of blood on flow through a stenosed
tube. Fluid Dynamics Research, 22(5), 251-264. doi:
http://dx.doi.org/10.1016/S0169-5983(97)00041-5
Ismail, Zuhaila, Abdullah, Ilyani, Mustapha, Norzieha, & Amin, Norsarahaida. (2008).
A power-law model of blood flow through a tapered overlapping stenosed
artery. Applied Mathematics and Computation, 195(2), 669-680.
Jhunjhunwala, P., Padole, P. M., & Thombre, S. B. (2015). CFD Analysis of Pulsatile
Flow and Non-Newtonian Behavior of Blood in Arteries. Molecular & Cellular
Biomechanics, 12(1), 37-47.
Johnston, Barbara M, Johnston, Peter R, Corney, Stuart, & Kilpatrick, David. (2006).
Non-Newtonian blood flow in human right coronary arteries: transient
simulations. Journal of biomechanics, 39(6), 1116-1128.
Jou, Liang-Der, Lee, Deok Hee, & Mawad, Michel E. (2010). Cross-flow at the anterior
communicating artery and its implication in cerebral aneurysm formation.
Journal of biomechanics, 43(11), 2189-2195.
Jozwik, Krzysztof, & Obidowski, Damian. (2010). Numerical simulations of the blood
flow through vertebral arteries. Journal of Biomechanics, 43(2), 177-185. doi:
http://dx.doi.org/10.1016/j.jbiomech.2009.09.026
Univers
ity of
Mala
ya
152
Jung, Jonghwun, & Hassanein, Ahmed. (2008). Three-phase CFD analytical modeling
of blood flow. Medical Engineering & Physics, 30(1), 91-103. doi:
10.1016/j.medengphy.2006.12.004
Kagadis, George C, Skouras, Eugene D, Bourantas, George C, Paraskeva, Christakis A,
Katsanos, Konstantinos, Karnabatidis, Dimitris, & Nikiforidis, George C.
(2008). Computational representation and hemodynamic characterization of< i>
in vivo</i> acquired severe stenotic renal artery geometries using turbulence
modeling. Medical engineering & physics, 30(5), 647-660.
Kagadis, George C., Skouras, Eugene D., Bourantas, George C., Paraskeva, Christakis
A., Katsanos, Konstantinos, Karnabatidis, Dimitris, & Nikiforidis, George C.
(2008). Computational representation and hemodynamic characterization of in
vivo acquired severe stenotic renal artery geometries using turbulence modeling.
Medical Engineering & Physics, 30(5), 647-660. doi:
http://dx.doi.org/10.1016/j.medengphy.2007.07.005
Kanaris, AG, Anastasiou, AD, & Paras, SV. (2012). Modeling the effect of blood
viscosity on hemodynamic factors in a small bifurcated artery. Chemical
Engineering Science, 71, 202-211.
Kaye, E. K., Valencia, A., Baba, N., Spiro, A., 3rd, Dietrich, T., & Garcia, R. I. (2010).
Tooth loss and periodontal disease predict poor cognitive function in older men.
J Am Geriatr Soc, 58(4), 713-718. doi: 10.1111/j.1532-
5415.2010.02788.xJGS2788 [pii]
Kenjereš, Saša. (2008). Numerical analysis of blood flow in realistic arteries subjected
to strong non-uniform magnetic fields. International Journal of Heat and Fluid
Flow, 29(3), 752-764.
Keshavarz-Motamed, Z, & Kadem, L. (2011). 3D pulsatile flow in a curved tube with
coexisting model of aortic stenosis and coarctation of the aorta. Medical
engineering & physics, 33(3), 315-324.
Koerselman, J., van der Graaf, Y., de Jaegere, P. P., & Grobbee, D. E. (2003). Coronary
collaterals: an important and underexposed aspect of coronary artery disease.
Circulation, 107(19), 2507-2511. doi: 10.1161/01.cir.0000065118.99409.5f
Konala, Bhaskar Chandra, Das, Ashish, & Banerjee, Rupak K. (2011). Influence of
arterial wall-stenosis compliance on the coronary diagnostic parameters. Journal
of Biomechanics, 44(5), 842-847. doi: 10.1016/j.jbiomech.2010.12.011
Univers
ity of
Mala
ya
153
Koo, Bon-Kwon, Kang, Hyun-Jai, Youn, Tae-Jin, Chae, In-Ho, Choi, Dong-Joo, Kim,
Hyo-Soo, . . . Tahk, Seung-Jae. (2005). Physiologic Assessment of Jailed Side
Branch Lesions Using Fractional Flow Reserve. Journal of the American
College of Cardiology, 46(4), 633-637. doi: 10.1016/j.jacc.2005.04.054
Krams, R, Wentzel, JJ, Cespedes, I, Vinke, R, Carlier, S, Van Der Steen, AFW, . . .
Slager, CJ. (1999). Effect of catheter placement on 3-D velocity profiles in
curved tubes resembling the human coronary system. Ultrasound in medicine &
biology, 25(5), 803-810.
Kristensen, Thomas Skaarup, Engstrøm, Thomas, Kelbæk, Henning, von der Recke,
Peter, Nielsen, Michael Bachmann, & Kofoed, Klaus Fuglsang. (2010).
Correlation between coronary computed tomographic angiography and
fractional flow reserve. International Journal of Cardiology, 144(2), 200-205.
doi: 10.1016/j.ijcard.2009.04.024
Kumar Mandal, P, Chakravarty, Santabrata, & Mandal, Arabinda. (2007). Numerical
study of the unsteady flow of non-Newtonian fluid through differently shaped
arterial stenoses. International Journal of Computer Mathematics, 84(7), 1059-
1077.
Lee, Seung E, Lee, Sang-Wook, Fischer, Paul F, Bassiouny, Hisham S, & Loth, Francis.
(2008). Direct numerical simulation of transitional flow in a stenosed carotid
bifurcation. Journal of biomechanics, 41(11), 2551-2561.
Lefèvre, Thierry, Louvard, Yves, Morice, Marie‐Claude, Dumas, Pierre, Loubeyre,
Christophe, Benslimane, Abdeljabbar, . . . Piéchaud, Jean‐François. (2000).
Stenting of bifurcation lesions: classification, treatments, and results.
Catheterization and cardiovascular interventions, 49(3), 274-283.
Leguy, CAD, Bosboom, EMH, Hoeks, APG, & van de Vosse, FN. (2009). Assessment
of blood volume flow in slightly curved arteries from a single velocity profile.
Journal of biomechanics, 42(11), 1664-1672.
Leuprecht, A., Perktold, K., Kozerke, S., & Boesiger, P. (2002). Combined CFD and
MRI study of blood flow in a human ascending aorta model. Biorheology, 39(3-
4), 425-429.
Li, M. X., Beech-Brandt, J. J., John, L. R., Hoskins, P. R., & Easson, W. J. (2007).
Numerical analysis of pulsatile blood flow and vessel wall mechanics in
different degrees of stenoses. Journal of Biomechanics, 40(16), 3715-3724. doi:
http://dx.doi.org/10.1016/j.jbiomech.2007.06.023
Univers
ity of
Mala
ya
154
Liu, Biyue. (2007). The influences of stenosis on the downstream flow pattern in curved
arteries. Medical Engineering & Physics, 29(8), 868-876. doi:
10.1016/j.medengphy.2006.09.009
Long, Q, Xu, XY, Ramnarine, KV, & Hoskins, P. (2001). Numerical investigation of
physiologically realistic pulsatile flow through arterial stenosis. Journal of
Biomechanics, 34(10), 1229-1242.
Lorenzini, Giulio, & Casalena, Erminio. (2008). CFD analysis of pulsatile blood flow in
an atherosclerotic human artery with eccentric plaques. Journal of
Biomechanics, 41(9), 1862-1870.
Mandal, Prashanta Kumar. (2005). An unsteady analysis of non-Newtonian blood flow
through tapered arteries with a stenosis. International Journal of Non-Linear
Mechanics, 40(1), 151-164. doi: 10.1016/j.ijnonlinmec.2004.07.007
Manimaran, R. (2011). CFD simulation of non-Newtonian fluid flow in arterial stenoses
with surface irregularities. World Academy of Science, Engineering
andTechnology, 73, 957-962.
Meijboom, W. Bob, Van Mieghem, Carlos A. G., van Pelt, Niels, Weustink, Annick,
Pugliese, Francesca, Mollet, Nico R., . . . de Feyter, Pim J. (2008).
Comprehensive Assessment of Coronary Artery Stenoses: Computed
Tomography Coronary Angiography Versus Conventional Coronary
Angiography and Correlation With Fractional Flow Reserve in Patients With
Stable Angina. Journal of the American College of Cardiology, 52(8), 636-643.
doi: http://dx.doi.org/10.1016/j.jacc.2008.05.024
Melih Guleren, K. (2013). Numerical flow analysis of coronary arteries through
concentric and eccentric stenosed geometries. Journal of biomechanics, 46(6),
1043-1052.
Menter, F., Kuntz, M., & Langtry, R. (2003). Ten years of Industrial experience with
the {SST} model. Paper presented at the Turbulence, Heat and Mass Transfer 4.
Menter, Florian R. (2009). Review of the shear-stress transport turbulence model
experience from an industrial perspective. International Journal of
Computational Fluid Dynamics, 23(4), 305-316. doi:
10.1080/10618560902773387
Misra, JC, & Shit, GC. (2006). Blood flow through arteries in a pathological state: A
theoretical study. International journal of engineering science, 44(10), 662-671.
Univers
ity of
Mala
ya
155
Mustapha, Norzieha, Amin, Norsarahaida, Chakravarty, Santabrata, & Mandal,
Prashanta Kumar. (2009). Unsteady magnetohydrodynamic blood flow through
irregular multi-stenosed arteries. Computers in Biology and Medicine, 39(10),
896-906.
Mustapha, Norzieha, Mandal, Prashanta K., Johnston, Peter R., & Amin, Norsarahaida.
(2010). A numerical simulation of unsteady blood flow through multi-irregular
arterial stenoses. Applied Mathematical Modelling, 34(6), 1559-1573. doi:
http://dx.doi.org/10.1016/j.apm.2009.09.008
Myer, Kutz. (2003). PHYSICAL AND FLOW PROPERTIES OF BLOOD Standard
Handbook of Biomedical Engineering & Design: McGraw Hill Professional,
Access Engineering.
Nadeem, S, Akbar, Noreen Sher, Hendi, Awatif A, & Hayat, Tasawar. (2011). Power
law fluid model for blood flow through a tapered artery with a stenosis. Applied
Mathematics and Computation, 217(17), 7108-7116.
Naruse, T, & Tanishita, K. (1996). Large curvature effect on pulsatile entrance flow in a
curved tube: model experiment simulating blood flow in an aortic arch. Journal
of biomechanical engineering, 118(2), 180-186.
Nichols, W.W., and O'Rourke M.F. (1998). McDonald's blood flow in arteries:
Theoretical, experimental and clinical principles: Oxford University Press, New
York.
Nissen, S. E., & Gurley, J. C. (1991). Application of intravascular ultrasound for
detection and quantitation of coronary atherosclerosis. Int J Card Imaging, 6(3-
4), 165-177.
Nissen, S. E., & Yock, P. (2001). Intravascular ultrasound: novel pathophysiological
insights and current clinical applications. Circulation, 103(4), 604-616.
Park, Seung-Jung, Kang, Soo-Jin, Ahn, Jung-Min, Shim, Eun Bo, Kim, Young-Tae,
Yun, Sung-Cheol, . . . Park, Seong-Wook. (2012). Visual-Functional Mismatch
Between Coronary Angiography and Fractional Flow Reserve. JACC:
Cardiovascular Interventions, 5(10), 1029-1036. doi: 10.1016/j.jcin.2012.07.007
Paul, Manosh C., & Larman, Arkaitz. (2009). Investigation of spiral blood flow in a
model of arterial stenosis. Medical Engineering & Physics, 31(9), 1195-1203.
doi: http://dx.doi.org/10.1016/j.medengphy.2009.07.008
Univers
ity of
Mala
ya
156
Peelukhana, Srikara Viswanath, Back, Lloyd H., & Banerjee, Rupak K. (2009).
Influence of coronary collateral flow on coronary diagnostic parameters: An in
vitro study. Journal of Biomechanics, 42(16), 2753-2759. doi:
10.1016/j.jbiomech.2009.08.013
Pielhop, K, Klaas, M, & Schröder, W. (2012). Analysis of the unsteady flow in an
elastic stenotic vessel. European Journal of Mechanics-B/Fluids, 35, 102-110.
Pijls, N. H., Van Gelder, B., Van der Voort, P., Peels, K., Bracke, F. A., Bonnier, H. J.,
& el Gamal, M. I. (1995). Fractional flow reserve. A useful index to evaluate the
influence of an epicardial coronary stenosis on myocardial blood flow.
Circulation, 92(11), 3183-3193.
Pijls, Nico H. J., Fearon, William F., Tonino, Pim A. L., Siebert, Uwe, Ikeno, Fumiaki,
Bornschein, Bernhard, . . . De Bruyne, Bernard. (2010). Fractional Flow Reserve
Versus Angiography for Guiding Percutaneous Coronary Intervention in
Patients With Multivessel Coronary Artery Disease: 2-Year Follow-Up of the
FAME (Fractional Flow Reserve Versus Angiography for Multivessel
Evaluation) Study. Journal of the American College of Cardiology, 56(3), 177-
184. doi: http://dx.doi.org/10.1016/j.jacc.2010.04.012
Pijls, Nico H. J., & Sels, Jan-Willem E. M. (2012). Functional Measurement of
Coronary Stenosis. Journal of the American College of Cardiology, 59(12),
1045-1057. doi: http://dx.doi.org/10.1016/j.jacc.2011.09.077
Qiao, AK, Guo, XL, Wu, SG, Zeng, YJ, & Xu, XH. (2004). Numerical study of
nonlinear pulsatile flow in S-shaped curved arteries. Medical engineering &
physics, 26(7), 545-552.
Rajabi-Jaghargh, Ehsan, Kolli, Kranthi K, Back, Lloyd H, & Banerjee, Rupak K.
(2011). Effect of guidewire on contribution of loss due to momentum change
and viscous loss to the translesional pressure drop across coronary artery
stenosis: An analytical approach. Biomedical engineering online, 10(1), 51.
Ramanathan, Tamilselvi, & Skinner, Henry. (2005). Coronary blood flow. Continuing
Education in Anaesthesia, Critical Care & Pain, 5(2), 61-64. doi:
10.1093/bjaceaccp/mki012
Razavi, A, Shirani, E, & Sadeghi, MR. (2011). Numerical simulation of blood pulsatile
flow in a stenosed carotid artery using different rheological models. Journal of
biomechanics, 44(11), 2021-2030.
Univers
ity of
Mala
ya
157
Seiler, C., Stoller, M., Pitt, B., & Meier, P. (2013). The human coronary collateral
circulation: development and clinical importance. Eur Heart J, 34(34), 2674-
2682. doi: 10.1093/eurheartj/eht195
Seiler, Christian. (2003). The human coronary collateral circulation. Heart, 89(11),
1352-1357.
Shipkowitz, Tanya, Rodgers, VGJ, Frazin, Lee J, & Chandran, KB. (2000). Numerical
study on the effect of secondary flow in the human aorta on local shear stresses
in abdominal aortic branches. Journal of Biomechanics, 33(6), 717-728.
Siebes, Maria, Chamuleau, Steven A. J., Meuwissen, Martijn, Piek, Jan J., & Spaan, Jos
A. E. (2002). Influence of hemodynamic conditions on fractional flow reserve:
parametric analysis of underlying model. American Journal of Physiology -
Heart and Circulatory Physiology, 283(4), H1462-H1470. doi:
10.1152/ajpheart.00165.2002
Sinha Roy, Abhijit, Back, Lloyd H., & Banerjee, Rupak K. (2006). Guidewire flow
obstruction effect on pressure drop-flow relationship in moderate coronary
artery stenosis. Journal of Biomechanics, 39(5), 853-864. doi:
10.1016/j.jbiomech.2005.01.020
Soulis, Johannes V., Farmakis, Thomas M., Giannoglou, George D., & Louridas,
George E. (2006). Wall shear stress in normal left coronary artery tree. Journal
of Biomechanics, 39(4), 742-749. doi: 10.1016/j.jbiomech.2004.12.026
Stroud, JS, Berger, SA, & Saloner, D. (2000). Influence of stenosis morphology on flow
through severely stenotic vessels: implications for plaque rupture. Journal of
biomechanics, 33(4), 443-455.
Su, Boyang, Huo, Yunlong, Kassab, Ghassan S, Kabinejadian, Foad, Kim, Sangho, Leo,
Hwa Liang, & Zhong, Liang. (2014). Numerical investigation of blood flow in
three-dimensional porcine left anterior descending artery with various stenoses.
Computers in biology and medicine, 47, 130-138.
Sun, Zhonghua, & Cao, Yan. (2011). Multislice CT angiography assessment of left
coronary artery: Correlation between bifurcation angle and dimensions and
development of coronary artery disease. European Journal of Radiology, 79(2),
e90-e95. doi: http://dx.doi.org/10.1016/j.ejrad.2011.04.015
Sung, Kun Hyuk, Ro, Kyoung Chul, & Ryou, Hong Sun. (2009). Numerical
investigation on the blood flow characteristics considering the axial rotation in
stenosed artery. Korea-Australia Rheology Journal, 21(2), 119-126.
Univers
ity of
Mala
ya
158
Takeshita, A., Koiwaya, Y., Nakamura, M., Yamamoto, K., & Torii, S. (1982).
Immediate appearance of coronary collaterals during ergonovine-induced
arterial spasm. Chest, 82(3), 319-322.
Tang, Dalin, Yang, Chun, Kobayashi, Shunichi, Zheng, Jie, Woodard, Pamela K., Teng,
Zhongzhao, . . . Ku, David N. (2009). 3D MRI-Based Anisotropic FSI Models
With Cyclic Bending for Human Coronary Atherosclerotic Plaque Mechanical
Analysis. Journal of Biomechanical Engineering, 131(6), 061010. doi:
10.1115/1.3127253
Tashtoush, Bourhan, & Magableh, Ahmad. (2008). Magnetic field effect on heat
transfer and fluid flow characteristics of blood flow in multi-stenosis arteries.
Heat and Mass Transfer, 44(3), 297-304.
Tobis, Jonathan, Azarbal, Babak, & Slavin, Leo. (2007). Assessment of Intermediate
Severity Coronary Lesions in the Catheterization Laboratory. Journal of the
American College of Cardiology, 49(8), 839-848. doi:
10.1016/j.jacc.2006.10.055
Toloui, M., Firoozabadi, B., & Saidi, M. S. (2012). A numerical study of the effects of
blood rheology and vessel deformability on the hemodynamics of carotid
bifurcation. Scientia Iranica, 19(1), 119-126. doi:
http://dx.doi.org/10.1016/j.scient.2011.12.008
Tonino, Pim A.L., De Bruyne, Bernard, Pijls, Nico H.J., Siebert, Uwe, Ikeno, Fumiaki,
van `t Veer, Marcel, . . . Fearon, William F. (2009). Fractional Flow Reserve
versus Angiography for Guiding Percutaneous Coronary Intervention. New
England Journal of Medicine, 360(3), 213-224. doi:
doi:10.1056/NEJMoa0807611
Torii, Ryo, Wood, Nigel B, Hughes, Alun D, Thom, Simon A, Aguado-Sierra, Jazmin,
Davies, Justin E, . . . Xu, X Yun. (2007). A computational study on the influence
of catheter-delivered intravascular probes on blood flow in a coronary artery
model. Journal of biomechanics, 40(11), 2501-2509.
Tu, Cheng, & Deville, Michel. (1996). Pulsatile flow of non-Newtonian fluids through
arterial stenoses. Journal of biomechanics, 29(7), 899-908.
van Werkhoven, Jacob M., Schuijf, Joanne D., Jukema, J. Wouter, Pundziute, Gabija,
de Roos, Albert, Schalij, Martin J., . . . Bax, Jeroen J. (2009). Comparison of
Non-Invasive Multi-Slice Computed Tomography Coronary Angiography
Versus Invasive Coronary Angiography and Fractional Flow Reserve for the
Evaluation of Men With Known Coronary Artery Disease. The American
Journal of Cardiology, 104(5), 653-656. doi: 10.1016/j.amjcard.2009.04.045
Univers
ity of
Mala
ya

159
Versteeg, Henk Kaarle, & Malalasekera, Weeratunge. (2007). An introduction to
computational fluid dynamics: the finite volume method: Pearson Education.
Wang, Xiaohong, & Li, Xiaoyang. (2011). Biomechanical behaviors of curved artery
with flexible wall: A numerical study using fluid–structure interaction method.
Computers in biology and medicine, 41(11), 1014-1021.
White, SS, Zarins, CK, Giddens, DP, Bassiouny, H, Loth, F, Jones, SA, & Glagov, S.
(1993). Hemodynamic patterns in two models of end-to-side vascular graft
anastomoses: effects of pulsatility, flow division, Reynolds number, and hood
length. Journal of biomechanical engineering, 115(1), 104-111.
Wilcox, David Alem. (1994). Simulation of Transition with a Two-Equation Turbulence
Model. AIAA Journal, 32(2), 247-255. doi: 10.2514/3.59994
Wilson, R. F., Johnson, M. R., Marcus, M. L., Aylward, P. E., Skorton, D. J., Collins,
S., & White, C. W. (1988). The effect of coronary angioplasty on coronary flow
reserve. Circulation, 77(4), 873-885.
Yamashita, Takehiro, Nishida, Takahiro, Adamian, Milena G, Briguori, Carlo, Vaghetti,
Marco, Corvaja, Nicola, . . . Tobis, Jonathan M. (2000). Bifurcation lesions: two
stents versus one stent—immediate and follow-up results. Journal of the
American College of Cardiology, 35(5), 1145-1151.
Zeev Vlodaver , Robert F. Wilson , Daniel J. Garry. (2012). Coronary Heart Disease.
Zendehbudi, GR, & Moayeri, MS. (1999). Comparison of physiological and simple
pulsatile flows through stenosed arteries. Journal of Biomechanics, 32(9), 959-
965.
Zhang, Chi, Xie, Sheng, Li, Shuyu, Pu, Fang, Deng, Xiaoyan, Fan, Yubo, & Li, Deyu.
(2012). Flow patterns and wall shear stress distribution in human internal carotid
arteries: the geometric effect on the risk for stenoses. Journal of biomechanics,
45(1), 83-89.
Univers
ity of
Mala
ya

160
LIST OF PUBLICATION
1) Sarfaraz Kamangar, Govindaraju Kalimuthu, Irfan Anjum Badruddin, A.
Badarudin, N. J. Salman Ahmed, and T.M. Yunus Khan. Numerical
Investigation of the Effect of Stenosis Geometry on the Coronary Diagnostic
Parameters. The Scientific World Journal, Volume 2014, Article ID 354946, 7
pages. doi.org/10.1155/2014/354946
2) Sarfaraz Kamangar, Irfan Anjum Badruddin, A. Badarudin, N. Nik-Ghazali,
Govindaraju Kalimuthu, N. J. Salman Ahmed, and T.M. Yunus Khan. Influence
of stenosis on hemodynamic parameters in the realistic left coronary artery
under hyperemic conditions, In Press
(http://dx.doi.org/10.1080/10255842.2016.1233402)
Univers
ity of
Mala
ya