Embed Size (px)
Citation preview
Computational Competenciesof
Prospective Elementary Mathematics Teachers
Melfried OlsonScience-Mathematics Teaching Center
Box 3992 University StationLaramie, Wyoming 82071
Recently an assessment of mathematical skills was performed by theNational Assessment of Educational Progress (NAEP) on a randomsample of people drawn from four populations with regard to age. Thesepopulations are: 9-year-olds, 13-year-olds, 17-year-olds, and adult (ages26-35). One area assessed was computational skills, dealing with the fourbasic operations�addition, subtraction, multiplication and division.NAEP listed 18 exercises dealing with computational skills together
with the percentage of the respondents who correctly answered the exer-cises. Seventeen of these exercises portray questions from material that iscovered in Arithmetic for Teachers (Math 2413) at Oklahoma State Uni-versity. Most of the students enrolled in Math 2413 are prospective ele-mentary school teachers. The author, in order to compare the competen-cies of these prospective teachers with the competencies observed for theage group reported by NAEP, presented these 17 exercises to the 117 stu-dents enrolled in Math 2413 during the spring semester, 1975, and cal-culated the percentage of correct responses for each item.The 117 students who took the final test are divided into age groups as
follows: (1) 17 18-year-olds, (2) 41 19-year-olds, (3) 25 20-year-olds, (4)14 21-year-olds, (5) 6 22-year-olds, (6) 1 23-year-old, (7) 3 24-year-olds,(8) 1 25-year-old, (9) 1 26-year-old, (10) 1 27-year-old, (11) 1 31-year-old,(12) 1 34-year-old, (13) 1 38-year-old, and (14) 4 ages not reported. Thus,the majority of the students (83 per cent) are in the 18 to 21-year-old agecategories, hence the statistics to be reported here are a natural extentionof the NAEP statistics and are also useful when comparisons are madewith the NAEP statistics for the 17-year-old and adult populations.Although the statistics reported that the students in Math 2413 did not
have a lower percentage of correct responses than the NAEP statistics re-port for any group, it was not unexpected. If our institutions of highereducation are providing the mathematics background material for futureelementary teachers, these teachers would score higher than the average17-year-old and also score higher than the adults. Otherwise, there wouldbe little need for more than a high school education in mathematics forelementary teachers.The 17 questions with the percentage of correct responses are reported
below for the 13- year-old, 17-year-old, and adult populations fromNAEP (where available), and also from the Math 2413 students.
613
614 School Science and Mathematics
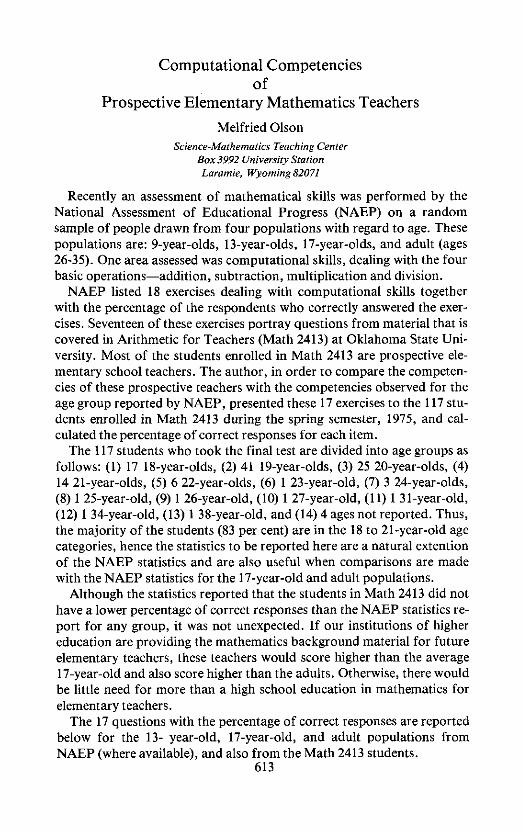
Question from NAEP Percentage Correct by Groups13 17 Adult Math 2413
1. 3 + 0 = 98 1002. 3 � 0 = 95 993.3-0= 94 974. 38 + 19 = 94 97 97 975. 3.09 + 10.00 + 9.14 + 5.10 = 84 92 86 976. 36 - 19 = 89 92 92 987. 1,054 - 865 = 80 89 90 998. If 23.8 is subtracted from 62.1, the result is 61 78 74 909. 38 � 9 = 83 88 81 9110. 10 � 10 � 10 � 10 = 66 79 9511. 5|125= 89 93 93 9912. /2 + /3= 42 66 9413. ^ � /4= 62 74 8214. (-5) + (-9) = 66 78 9415. (-2) � (-3) = 39 68 8816. If X and Y are negative numbers, then X +
Y is............................... 47 64 8717. If X and Y are negative numbers, then X � Y
is................................. 39 64 94
Even though the students in Math 2413 did not score lower on any ofthe items, there appears to be room for improvement with regard toitems 8, 9, 13, 15, and 16 where the percentages for Math 2413 were inthe 80’s or low 90’s for these basic computational exercises which occurin the elementary curriculum.Math 2413 did not provide a random sample, but the data reported
here provides insight into the capabilities of future elementary schoolteachers, with regard to their mathematical computational skills. This,however, leaves open the question of whether these competencies will beenhanced or will deteriorate before or during actual teaching experiencefor these teachers.
BIBLIOGRAPHY
1. National Assessment of Educational Progress. Math Fundamentals: Selected Resultsfrom the First National Assessment of Mathematics. Washington, D.C.: National As-sessment of Educational Progress, 1975.
Make Plans Now to Bein Cedar Falls for SSMANovember 9-11,1978