Embed Size (px)
Citation preview
Computational Comparative Study of
Transcription Regulation in Eukaryotes
Thesis submitted for the degree of
“Doctor of Philosophy”
by
Naomi Habib
Submitted to the Senate of the Hebrew University
August 2012

This work was carried out under the supervision of
Prof. Nir Friedman and Prof. Hanah Margalit
Abstract
Transcription regulation plays a central role in the activity of living cells and in their
response to internal or external stimuli. This complex regulatory process is mediated by
multiple interacting mechanisms. These mechanisms include both sequence specific binding
proteins called transcription factors, and epigenetic mechanisms, including DNA
methylations and chromatin modifications, as well as non-coding regulatory RNAs. Changes
in gene regulation have been postulated to play a key role in generating the wide phenotypic
diversity observed across species. Yet the evolutionary driving forces and the dynamics of
this evolutionary process are largely unknown. I studied this process from two different
perspectives.
Cis-regulatory evolution
Regulation of gene expression can evolve through mutations in the DNA sequence
leading to altered activity of trans acting factors such as transcription factors, or to changes in
cis-regulatory sequences at promoter and enhancer regions, which affect the binding of
regulatory proteins. While trans acting factors are largely conserved, large-scale changes in
cis-elements were observed for specific factors in organisms as diverse as yeasts, flies, and
mammals. Rigorously studying regulatory evolution has been hampered by the lack of large-
scale and systematic experimental studies, and by the noisy nature of computational
predictions.
We developed an unbiased computational scheme to study the evolution of
transcription regulation across large phylogenies, and used it to trace the regulatory history of
more than 90 transcription factors across 23 yeast species. Our analysis revealed general
principles in the evolution of transcription regulation both in yeasts and mammals. We
found that: (1) The regulatory network of transcription factors and their target genes is highly
plastic (i.e. transcription factors gain and lose target genes at a fast rate). (2) Transcription
factors tend to conserve their functions. (3) A functional selection turnover model can
reconcile these two trends, suggesting that the global functional roles associated with a
transcription factor are under stronger selection than the individual target genes. In our
model, selective pressures act differentially to conserve target genes within the same
biological process (compared to outside of the process), but not particular target genes within
that process. The model is sufficient to explain the observed number of highly conserved
targets (across all species), and fits the variation in measured transcription factor binding
profiles across species, both in yeasts and mammals. Our findings suggest that selection
forces are more permissive than has been previously assumed. We show that selective
pressures on regulatory networks tolerate massive local rewiring, facilitating adaptation of
gene-expression while controlling against dramatic changes in phenotype.
Epigenetic inheritance
Epigenetic regulatory mechanisms provide an additional potential driving force in the
evolution of transcription regulation, which can lead to transgenerational reprograming of
gene-expression. Epigenetic inheritance implies that information about the environment
experienced by parents could be transferred to offspring by non-Mendelian inheritance.
Whether or not organisms can inherit characters induced by ancestral environments in
mammals is unclear and has far-reaching implications. To test whether such transgenerational
inheritance occurs, we carried out an expression-profiling screen for genes in mice that
responded to paternal diet. We focused on paternal diet to rule out simple plastic responses of
offspring to the in-utero environment, as fathers often contribute little more than sperm to
offspring.
Relative to the offspring of males fed a control diet, the offspring of males fed a low-
protein diet increased the expression of many genes involved in lipid and cholesterol
biosynthesis, and had increased levels of cholesterol esters, triglycerides, and free fatty acids,
lipids. Extensive epigenetic profiling and computational analysis of offspring livers, as well
as whole genome characterization of cytosine methylation patterns and RNA content in
sperm, revealed numerous modest (20%) changes in cytosine methylation of offspring liver
depending on paternal diet, including reproducible changes in methylation over a likely
enhancer for the key lipid regulator Ppara. Our work is one of the first to provide a systematic
evidence that: (1) Paternal diet affects metabolic gene expression in the offspring of mice.
(2) Epigenetic information carriers in sperm respond to environmental conditions. These
results, in conjunction with recent human epidemiological data, indicate that parental diet can
affect cholesterol and lipid metabolism in offspring and define a model system to study
environmental reprogramming of the heritable epigenome. Moreover, these results suggest
rethinking basic practices in epidemiological studies of complex diseases such as
diabetes, heart disease, or alcoholism.
Taken together, our results shed light on two different selection forces driving
evolution of transcription regulation, and emphasize the need for an extended evolutionary
theory, integrating both genetic and non-genetic inheritance.
Contents Pages Chapter 1 – Introduction 1-7 1.1 From DNA to RNA……….......................………....................................... 1 1.2 Transcription factors and regulatory networks…......................................... 2 1.3 Epigenetic factors - DNA and chromatin modification................................ 3 1.4 Regulatory non-coding RNAs...................………....................................... 4 1.5 Evolution of transcription regulation........………........................................ 5 1.6 Overview……….......................……….......................……….................... 7 Chapter 2 - A Functional Selection Model Explain Robustness Despite Plasticity in cis-Regulatory Networks…………………………...... 8-59 2.1 Introduction……….......................……….......................……………….. 8-15 2.1.1 Rewiring of regulatory networks through changes of cis-regulatory elements…............……….......................………….………........................ 8 2.1.2 Experimental methods to study cis-regulatory evolution………................. 9 2.1.3 Computational methods to study cis-regulatory evolution………............... 10 2.1.4 Current studies of cis-regulatory evolution...………….……….................. 12 2.1.5 Yeast as a model for cis-regulatory evolution...………….……….............. 13 2.2 Results….......................……….......................………….………............... 16-43 2.2.1 CladeoScope: a framework for reconstructing cis-regulatory evolution….. 16 2.2.2 Systematic reconstruction of the regulatory history of 23 Ascomycota species….......……….......................………….………................................ 20 2.2.3 Plasticity of regulatory networks in Ascomycota fungi…........................... 27 2.2.4 Functional evolution of transcription factors in Ascomycota fungi............. 30 2.2.5 Functional Selection Turnover Model – A general Principle of Regulatory Evolution.......... ……….......................………….………........................... 38 2.3 Methods.......................……….......................………….………................ 44-59 2.3.1 CladeoScope algorithm: Phylogenetic reconstruction of Cis-regulatory networks...……….......................………….……….................................... 44 2.3.2 Resources for phylogenetic reconstruction in Ascomycota fungi………… 50 2.3.3 Evaluations of CladeoScope in Ascomycota fungi…….............................. 51 2.3.4 Targets turnover rates and expected number of changes in target genes…. 53 2.3.5 Annotating motifs with functional modules and their evaluation……........ 54 2.3.6 The functional selection turnover model……............................………….. 56
Chapter 3 - Paternally Induced Transgenerational Environmental Reprogramming of Metabolic Gene Expression in Mammals…... 60-80 3.1 Introduction…….......................……….......................………….………. 60-62 3.1.1 Epigenetic Inherence and the Environment...................………….……….. 60 3.1.2 Evidence for Trans-Generational Effects of the Environment….………… 61 3.1.3 Evidence for Heritable Epigenetic Effects of Environmental Perturbations 61 3.2 Results…….......................……….......................………….………........... 63-75 3.2.1 Experimental paradigm......……….......................………….……….......... 63 3.2.2 Upregulation of proliferation and lipid biosynthesis genes in low protein offspring......………........………….………........... ......……….................. 66 3.2.3 Transgenerational effects on lipid metabolism.......... ......………................ 68 3.2.4 MicroRNAs in offspring.......... ......………............... .......... ......………..... 70 3.2.5 Cytosine methylation in offspring.......... ......………................................... 71 3.2.6 Cytosine methylation, RNA, and chromatin in sperm................................. 73 3.3 Methods….......................………….………........... ......………................. 76-80 3.3.1 Experimental procedure…...................………….………........... ......….…. 76 3.3.2 Micro-Arrays data processing and differentially expressed genes in the liver...............………….………........... ......………..................................... 77 3.3.3 MicroRNA identification from deep sequencing data and analysis………. 78 3.3.4 Comparison to public murine liver microarray data………………………. 79 3.3.5 Percent variance explained by Ppara RNA levels………………………... 80 3.3.6 Analysis of sperm RNA data……………………….……………………... 80 Chapter 4 - Discussion…………………………………………………................ 81-91 4.1 Robustness in the face of plasticity – cis-regulatory evolution………........ 81 4.2 Epigenetic inheritance - Transgenerational environmental………............. reprogramming of gene expression………........………........……….......... 86 4.3 An extended evolutionary theory………........………........………............. 90 References………………………………………………………………............... 92 Appendices……………………………………………………………….............. i-xvii
1
Chapter 1 - Introduction
1.1 From DNA to RNA
The genome of a living organism contains the hereditary instructions for its
development and function. This information is encoded in DNA molecules that are found
inside each cell, and are built of nucleotides (A,C,G,T). Segments of the DNA sequence
(genes) are transcribed to RNA molecules, and can then be translated to proteins (gene
expression). Proteins perform a variety of functions in the cell. The collection of RNAs
and proteins expressed in a cell determine its morphology and how it functions. The
DNA sequence does not change in different stages throughout the life of a cell and is
identical in different cell types of multicellular organisms. However, the function and
structure of cells are not constant, but change in response to internal or external stimuli
(e.g. while cells differentiate; in single cellular organisms in response to changes in the
environment). Generating diverse outputs from a single set of instructions (DNA
sequence), requires a tight and highly specific regulation on the content of RNA
molecules and active proteins in the cell.
Transcription regulation is the first layer of this regulation, which plays a critical
role in the activity of living cells and in their response to internal or external stimuli.
Complex regulation is required to determine which genes would be expressed at any
given time and to what extent. This regulation responds to changes in the environment, as
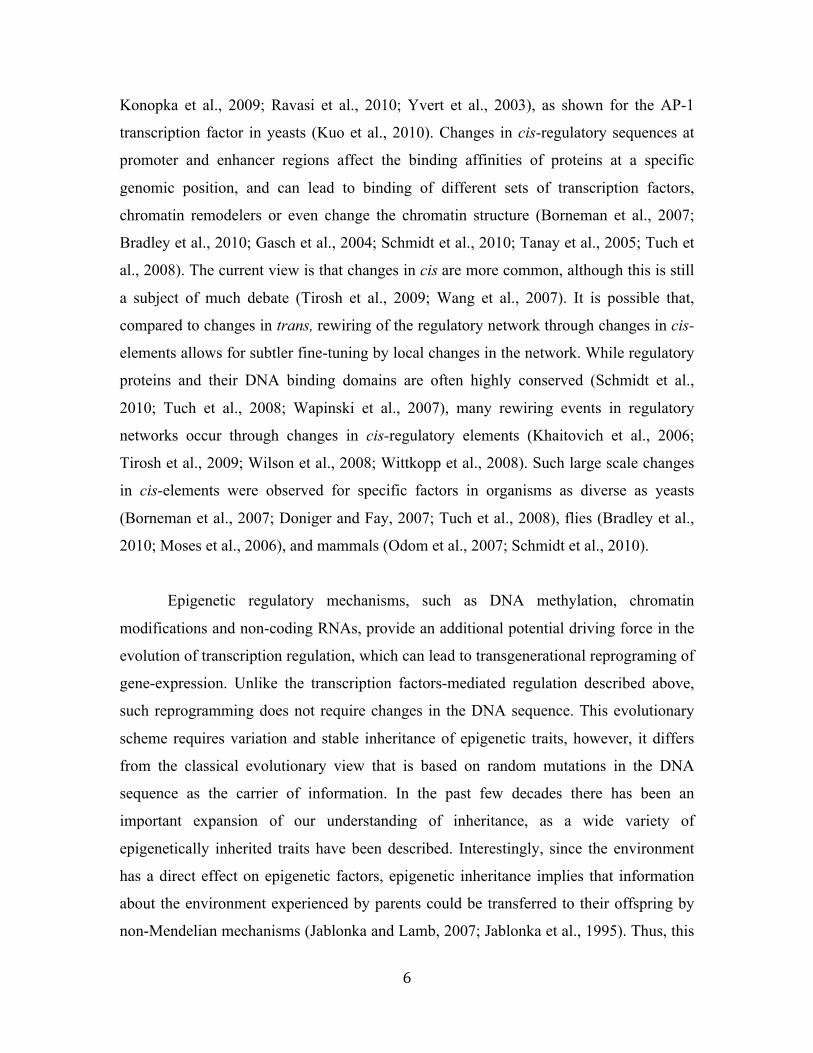
well as to the internal state of the cell, and is mediated by multiple interacting
mechanisms (Figure 1). These mechanisms include regulatory proteins that bind to
specific DNA sequences, as well as diverse epigenetic regulatory mechanisms, including
the chromatin state, DNA modification and regulation by non-coding RNAs. I review
each of these mechanisms in more detail.
2
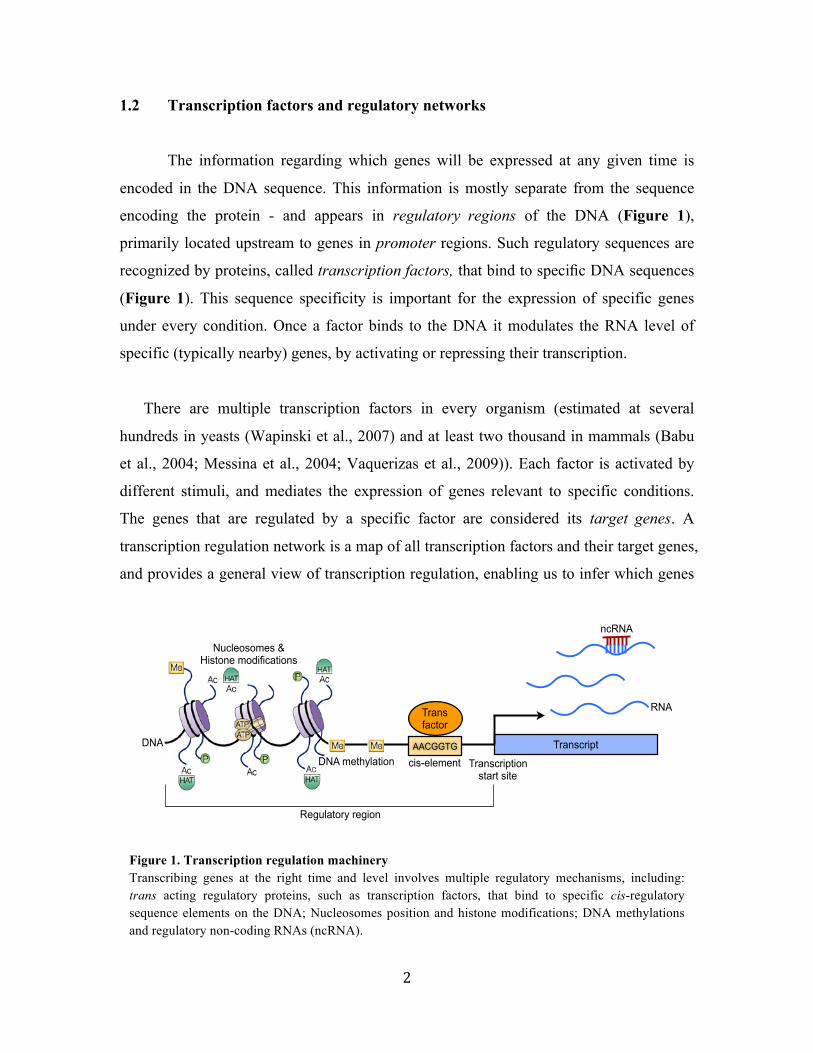
1.2 Transcription factors and regulatory networks
The information regarding which genes will be expressed at any given time is
encoded in the DNA sequence. This information is mostly separate from the sequence
encoding the protein - and appears in regulatory regions of the DNA (Figure 1),
primarily located upstream to genes in promoter regions. Such regulatory sequences are
recognized by proteins, called transcription factors, that bind to specific DNA sequences
(Figure 1). This sequence specificity is important for the expression of specific genes
under every condition. Once a factor binds to the DNA it modulates the RNA level of
specific (typically nearby) genes, by activating or repressing their transcription.
There are multiple transcription factors in every organism (estimated at several
hundreds in yeasts (Wapinski et al., 2007) and at least two thousand in mammals (Babu
et al., 2004; Messina et al., 2004; Vaquerizas et al., 2009)). Each factor is activated by
different stimuli, and mediates the expression of genes relevant to specific conditions.
The genes that are regulated by a specific factor are considered its target genes. A
transcription regulation network is a map of all transcription factors and their target genes,
and provides a general view of transcription regulation, enabling us to infer which genes
Figure 1. Transcription regulation machinery Transcribing genes at the right time and level involves multiple regulatory mechanisms, including: trans acting regulatory proteins, such as transcription factors, that bind to specific cis-regulatory sequence elements on the DNA; Nucleosomes position and histone modifications; DNA methylations and regulatory non-coding RNAs (ncRNA).
AACGGTG
Trans factor
cis-element
Nucleosomes & Histone modifications
DNA methylationTranscript
Transcription start site
ncRNA
Regulatory region
RNA
DNA
3
will be expressed under diverse conditions. Previous studies, focusing on specific
systems across different organisms (Amit et al., 2009; Benfey and Chua, 1990; Capaldi et
al., 2008; Davidson, 2001; Novershtern et al., 2011; Parker et al., 2011) showed that a
gene is often controlled by several transcription factors and each factor regulates multiple
genes, implying a complex transcription regulation network.
An example of a combinatorial regulatory system is the response to osmotic stress in
yeast. In this system, five different transcription factors were found to coordinately
activate and repress hundreds of genes (Capaldi et al., 2008). Induced genes can be
divided to eight sets, each regulated by a different combination of these factors (Capaldi
et al., 2008). Interestingly, among these factors Capaldi et al found that the Sko1 factor
both represses and activates the same genes before and after the stress, respectively
(Capaldi et al., 2008). This complex network allows a sensitive activation of specific
combination of genes in responses to different stresses, such as osmotic stress by salt
versus sugar.
1.3 Epigenetic factors - DNA and chromatin modification
The traditional view of transcription regulation was based on the
acknowledgement that all the regulatory information is encoded in the DNA sequence,
and this information is "read" by sequence specific transcription factors. More recently,
other layers of information beyond the DNA sequence have been recognized as central
players in transcription regulation. These layers include chemical modifications of the
DNA or chromatin (Figure 1). These include:
(1) DNA Methylation - Addition of methyl groups to the DNA, usually occurs at a
cytosine nucleotide immediately followed by a guanine (CpG dinucleotide). This is a
stable modification that can be inherited through cell divisions (Wigler et al., 1981). In
animals, methylation near gene promoters varies considerably depending on cell type.
The degree of methylation in the promoter correlates with low transcription of the
downstream gene (Colot and Rossignol, 1999; Jones and Taylor, 1980; Suzuki and Bird,
4
2008). In addition, the DNA methylation pattern is primarily determined early during
development of the organism, and is required for maintaining the specific transcriptional
program in different cell types.
(2) Chromatin modification - In eukaryotic cells, the DNA is condensed within the
nucleus, packed around proteins to form chromatin (Kornberg, 1999). The basic
packaging units are nucleosomes, complexes of histone proteins wrapped with DNA.
This packing serves not only to condense DNA within the nucleus, but also plays an
important role in transcription regulation. First, changes in position of the nucleosomes
on the DNA can inhibit or enable access to specific DNA regions and as a result
modulate gene expression (Almer et al., 1986; Bergman and Kramer, 1983; Tirosh and
Barkai, 2008). Second, the histone proteins are subjected to modifications, such as
addition of methyl and acetyl groups, which are associated with repression and activation
of genes (Koch et al., 2007; Kooistra and Helin, 2012; Liu et al., 2005).
Importantly, several of these modifications were shown to cause heritable changes
in gene expression, since they may remain through cell divisions for the remainder of the
cell's life and may also last for multiple generations (Bird, 2002; Colot and Rossignol,
1999; Groth et al., 2007; van der Heijden et al., 2006).
1.4 Regulatory non-coding RNAs
Some RNA molecules are not translated to proteins, but rather have important
functions in the cell. Among these non-coding RNAs (ncRNA)s are several classes of
regulatory RNAs that affect the levels of other RNA molecules, by either regulating gene
expression, or post-transcriptionally regulating the degradation or translation of RNAs
(Figure 1). For example, there are short RNA sequences of ~21 nucleotides called
microRNAs, that bind to complementary sequences on target mRNA transcripts, resulting
in inhibition of translation and/or destabilization of the target mRNA. Another example is
of the Piwi-interacting RNAs (piRNAs), which silence specific genes by mediating DNA
methylation (Aravin et al., 2008; Rajasethupathy et al., 2012) and also cause the
5
degradation of target RNA molecules (O'Donnell and Boeke, 2007). Overall, regulatory
RNAs preform a wide range of important function in the cell (Costa, 2007; Eddy, 2001;
Mattick and Makunin, 2006; Storz, 2002). Moreover, recent evidence suggest that they
can trans-generationally reprogram gene-expression, since not only that they are
transferred through cell divisions, but they can also be inherited to offspring through the
germ cells (Ashe et al., 2012; Burton et al., 2011; Cuzin and Rassoulzadegan, 2010;
Rechavi et al., 2011).
1.5 Evolution of Transcription Regulation
Changes in gene regulation have been postulated to play a key role in generating
the wide phenotypic diversity observed across species (King and Wilson, 1975;
Prud'homme et al., 2007; Wittkopp et al., 2004). For example, comparison of humans to
our closest living primate relatives shows that despite the vast phenotypic differences
between humans and other primates, we all share a remarkable amount of DNA sequence
(King and Wilson, 1975). These apparent phenotypic differences are mostly explained by
significant changes in gene expression patterns among primate species (Caceres et al.,
2003; Enard et al., 2002; Gilad et al., 2006). Moreover, it was recently shown that these
transcriptional differences are caused mainly by changes in non-coding regions of the
DNA, and specifically in transcription factor binding sites (McLean et al., 2011; Shibata
et al., 2012), indicating that changes in transcription regulation are driving the phenotypic
changes.
Transcription regulation evolves through two types of changes. The first type
follows the classical evolutionary theory, where random mutations in the DNA sequence
can lead to rewiring of the transcription regulation network. These changes are inherited,
exposed to selection pressures and eventually might fixate within the population. The
mutations cause rewiring of the network when they lead to changes in cis or trans:
Changes in trans-acting transcription factors can alter their DNA binding specificity,
which might lead to recognition of different sets of target genes (Doniger and Fay, 2007;
6
Konopka et al., 2009; Ravasi et al., 2010; Yvert et al., 2003), as shown for the AP-1
transcription factor in yeasts (Kuo et al., 2010). Changes in cis-regulatory sequences at
promoter and enhancer regions affect the binding affinities of proteins at a specific
genomic position, and can lead to binding of different sets of transcription factors,
chromatin remodelers or even change the chromatin structure (Borneman et al., 2007;
Bradley et al., 2010; Gasch et al., 2004; Schmidt et al., 2010; Tanay et al., 2005; Tuch et
al., 2008). The current view is that changes in cis are more common, although this is still
a subject of much debate (Tirosh et al., 2009; Wang et al., 2007). It is possible that,
compared to changes in trans, rewiring of the regulatory network through changes in cis-
elements allows for subtler fine-tuning by local changes in the network. While regulatory
proteins and their DNA binding domains are often highly conserved (Schmidt et al.,
2010; Tuch et al., 2008; Wapinski et al., 2007), many rewiring events in regulatory
networks occur through changes in cis-regulatory elements (Khaitovich et al., 2006;
Tirosh et al., 2009; Wilson et al., 2008; Wittkopp et al., 2008). Such large scale changes
in cis-elements were observed for specific factors in organisms as diverse as yeasts
(Borneman et al., 2007; Doniger and Fay, 2007; Tuch et al., 2008), flies (Bradley et al.,
2010; Moses et al., 2006), and mammals (Odom et al., 2007; Schmidt et al., 2010).
Epigenetic regulatory mechanisms, such as DNA methylation, chromatin
modifications and non-coding RNAs, provide an additional potential driving force in the
evolution of transcription regulation, which can lead to transgenerational reprograming of
gene-expression. Unlike the transcription factors-mediated regulation described above,
such reprogramming does not require changes in the DNA sequence. This evolutionary
scheme requires variation and stable inheritance of epigenetic traits, however, it differs
from the classical evolutionary view that is based on random mutations in the DNA
sequence as the carrier of information. In the past few decades there has been an
important expansion of our understanding of inheritance, as a wide variety of
epigenetically inherited traits have been described. Interestingly, since the environment
has a direct effect on epigenetic factors, epigenetic inheritance implies that information
about the environment experienced by parents could be transferred to their offspring by
non-Mendelian mechanisms (Jablonka and Lamb, 2007; Jablonka et al., 1995). Thus, this
7
provides a highly effective mechanism to modulate gene-expression in the short term of
just one or two generations.
1.6 Overview
In this work I studied the evolution of transcription regulation from these two
different perspectives. In the first chapter I discuss cis-regulatory evolution, and describe
a cross species comparative study in yeasts that addresses central questions regarding the
evolution of cis-regulatory networks. This work was part of a collaborative effort, in
which Dr. Ilan Wapinski (while doing his PhD in The Broad Institute of MIT/Harvard)
and I developed a novel computational scheme and applied it to yeasts. I then conducted
extensive data analysis and derived models (Habib et al., 2012). In addition, I discuss the
analysis I have done within a collaborative effort lead by Prof. Nicholas Rhind
(University of Massachusetts) to study fission yeasts (Rhind et al., 2011b). Throughout
these works I received guidance from my two advisors, Prof. Hanah Margalit and Prof.
Nir Friedman, and from Prof. Aviv Regev (The Broad Institute of MIT/Harvard). In
addition, I took part in other collaborative works, not detailed in this dissertation, where
my focus was on developing computational methods for analysis of regulatory networks
and dynamic gene expression data both in yeasts and in mammals (Capaldi et al., 2008;
Habib et al., 2008; Novershtern et al., 2011; Sivriver et al., 2011).
In the second chapter I discuss epigenetic inheritance, and describe an experiment
in mice aimed to test the existence of transgenerational environmental reprogramming of
gene-expression and a search for the epigenetic ‘carrier’ of the environmental
information. This work was done in collaboration with Prof. Oliver Rando (University of
Massachusetts) and his experimental lab. Oliver designed the experiment and conducted,
with several students in his lab, large-scale and extensive experiments. My contribution
to this work was in the computational analysis and interpretation of the results, under the
guidance of my advisor Prof. Nir Friedman (Carone et al., 2010).
8
Chapter 2 –
A Functional Selection Model Explains Robustness Despite
Plasticity in cis-Regulatory Networks
2.1 Introduction
The first part of this dissertation focuses on evolution of transcription regulation,
driven by mutations in the DNA sequence. Specifically it regards cis-regulatory evolution,
which refers to changes in cis-regulatory elements in the DNA that affect binding of
transcription factors and can lead to rewiring of the regulatory network.
2.1.1 Rewiring of regulatory networks through changes of cis regulatory elements
Changes in cis-regulatory elements in genes’ promoters can have diverse effects
on the regulatory network. On the one hand, such changes can lead to fine-grained
regulatory ‘tinkering’ of the regulation of individual genes (Borneman et al., 2007;
Lavoie et al., 2010). For example, the individual target genes of the yeast regulatory
factor Mcm1 have diverged significantly between three related yeasts species (Tuch et al.,
2008). However, the factor still regulates the cell cycle and mating processes in all three
species. On the other hand, there are cases where changes in cis-regulatory elements lead
to dramatic rewiring of the regulation of entire sets of gene (Hogues et al., 2008; Tuch et
al., 2008). For example, the transcription of ribosomal protein encoding genes in yeasts is
regulated by distinct transcription factors in Candida albicans (Tbf1 and Cbf1) and
Saccharomyces cerevisiae (Rap1), primarily through changes in cis-regulatory elements
in promoter regions (Hogues et al., 2008; Tanay et al., 2005).
The connection between rewiring of regulatory networks and changes in gene
expression is unclear. Previous studies on gene modules in bacteria (Isalan et al., 2008)
and yeasts (Hogues et al., 2008; Tanay et al., 2005; Tsong et al., 2006; Tuch et al., 2008;
Weirauch and Hughes, 2010c; Wohlbach et al., 2009) showed that while some regulatory
9
changes (e.g., in the control of mitochondrial ribosomal protein encoding genes (Tsong et
al., 2006)) can be coupled to a transcriptional and phenotypic change, many other
dramatic re-wiring events (e.g., in ribosomal proteins (Hogues et al., 2008; Tanay et al.,
2005) or mating genes (Tuch et al., 2008)) have little or no apparent impact (reviewed in
(Wohlbach et al., 2009; Weirauch and Hughes, 2010)). For example, over 40% of the
binding events of four orthologous liver-specific transcription factors in mouse and
human are species-specific (Odom et al., 2007), but the liver-associated function of the
factors and the liver-specific expression of their target genes are highly conserved (Odom
et al., 2007). This demonstrates the complexity of the regulatory system and raises
important questions regarding the implications of the plasticity in regulatory networks,
and specifically the implications on the functions of transcription factors (i.e. which
cellular processes do they control).
The mechanism leading to a coordinated loss or gain of a transcription factor’s
binding sites in many functionally related genes is unclear, especially when the gene
expression does not change. Analysis of specific regulatory programs led to different
suggested mechanisms for this dynamic evolutionary process (Dermitzakis et al., 2003;
Gasch et al., 2004; Ihmels et al., 2005; Tanay et al., 2005), calling for a comprehensive
study of this question. While individual examples of cis-regulatory evolution are
instructive, they represent only anecdotal evidence of the role that cis-regulatory
divergence plays across evolution. It is thus of great interest to quantitatively and
qualitatively assess the extent of cis-regulatory plasticity of different regulatory DNA
motifs and their associated target genes, its functional implications and the underlying
selection forces. A large-scale unbiased study of the evolutionary history of regulatory
networks, by a cross-species comparative analysis of regulatory networks in extant
species, will advance us toward this goal.
2.1.2 Experimental methods to study cis-regulatory evolution
Rigorously studying cis-regulatory evolution has been hampered by the lack of
large-scale and systematic experimental studies (Wohlbach et al., 2009). One major
10
obstacle is the limited data on transcription factor-target interactions in non-model
organisms. Genome-wide experimental determination of factor-target interactions can be
conducted by a couple of approaches. One approach is location analysis (chromatin
immunoprecipitation followed by micro-arrays assay or DNA sequencing) (Ren et al.,
2000), measuring directly where a transcription factor binds to the DNA. Another
approach regards genetic perturbations, finding direct and indirect targets by measuring
changes in expression levels of genes in response to a knockout or over-expression of a
transcription factor (Amit et al., 2009; Capaldi et al., 2008; Chua et al., 2006; Horton et
al., 2003). The main caveat of the first approach is that it may lead to false targets due to
spurious and non-functional binding to the DNA. The major limitation in the second
approach is that direct and indirect target genes are indistinguishable. Overall, in all
experimental methods, measuring targets of dozens of factors across dozens of species is
prohibitively expensive and labor intensive. In addition, since the regulation of a gene by
a transcription factor is specific to the cell’s state, a complete characterization of target
genes requires many experiments under different environmental conditions.
There are few studies that measured the binding of one or a few transcription
factors across two or three yeast species (Borneman et al., 2007; Hogues et al., 2008;
Tuch et al., 2008), flies (Bradley et al., 2010; Moses et al., 2006), or mammals (Konopka
et al., 2009; Odom et al., 2007; Schmidt et al., 2010), showing in all cases extensive
rewiring of the regulatory networks, even within closely related species. These intriguing
anecdotal examples on the role that cis-regulatory divergence plays across evolution, call
for extending such studies to the entire repertoire of transcription factors across dozens of
species.
2.1.3 Computational methods to study cis-regulatory evolution
A possible alternative is to computationally predict regulatory interactions of
transcription factors and their target genes from widely available genome sequences of
many species. Such predictions require a DNA motif model of the sequence binding
preferences of each transcription factor. This model can then predict the factor’s potential
11
binding sites across the genome. This initial mapping indicates which factors can bind to
the DNA at a given location and consequently are potential regulators of proximal genes.
The association between DNA motifs and target genes is the basic computational scheme
for constructing a full regulatory network from DNA sequence data and a catalogue of
DNA motif models. Thus, DNA motifs can be viewed as a compact and informative
representation of the building blocks of the regulatory network.
Modeling the sequence preferences of DNA-binding proteins with DNA motif
models, can be done in several different ways, most of which rely on a set of known
binding sites (Benos et al., 2002; Bulyk et al., 2001; Day and McMorris, 1992; Osada et
al., 2004; Stormo, 2000). A common representation, which benefits from being relatively
simple yet flexible, is a matrix of positions in the binding site versus nucleotides. In the
matrix each row represents one residue (A, C, G or T), and each column represents a
position in a set of aligned binding sites. All matrix representations assume that the
choice of nucleotides in each position of the motif is independent of all other positions.
Such a matrix representation that is widely used is a Position Weight Matrix (PWM),
which contains nucleotide frequencies in each position of the motif.
To learn DNA motif model of a specific transcription factor requires an aligned
set of its known binding site. Due to the lack of known sites for many factors, different
algorithms were developed for the identification of transcription factor DNA motifs (e.g.
(Bailey and Elkan, 1995; Hughes et al., 2000a; Liu et al., 2002; Siddharthan et al., 2005)).
Most algorithms identify statistically significant overrepresented sequence patterns in the
promoters of co-regulated genes, which are presumably binding sites of a specific
transcription factor, and require as input only promoter DNA sequences. Several analysis
pipelines were developed for such tasks, which output a non-redundant set of statistically
significant motifs (Gordon et al., 2005; Habib et al., 2008; Mahony et al., 2007). An
alternative approach is to use protein binding microarray technology to characterize in
vitro the transcription factor sequence specificities in a high-throughput manner
(Mukherjee et al., 2004). This method might suffer from artifacts since it is done in-vitro,
usually using only the DNA-binding domain of the factor.
12
To associate between motifs and target genes in the construction of a regulatory
network, we computationally infer each transcription factor putative binding sites across
a genome by scanning the genome for the corresponding binding motifs. The genes
containing a motif instance in their promoters are termed here motif targets. Different
scoring schemes have been used for such scans (Barash et al., 2005; Hughes et al., 2000a;
Tanay, 2006). After inferring motif targets, we can determine the functional role of a
transcription factor (or equivalently its DNA motif) according to the known functional
annotation of its target genes. This requires functional annotations of genes, and improves
our understanding of the regulatory network.
2.1.4 Current studies of cis-regulatory evolution
Computational methods can be used to conduct a large-scale study of cis-
regulatory evolution. However, there are several drawbacks in the computational scheme
described above: (1) Motif discovery algorithms have limited success rate and are not
entirely robust to noisy inputs (Li and Tompa, 2006; MacIsaac and Fraenkel, 2006).
Moreover, the co-regulated gene sets used as input are both noisy and incomplete. (2)
Networks derived by computational methods are notoriously noisy, with both spurious
and missing connections between transcription factors and their target genes. This is
primarily because not all instances of the motifs in the genome are bound by the relevant
factor and the bound instances are not necessarily functional (Capaldi et al., 2008). (3)
Inferring the function of a transcription factor or a motif is affected by the noisy targets
and is limited due to missing gene annotations. (4) This approach is limited to model
organisms, due to the lack of known DNA regulatory motifs in non-model organisms.
The common approach to address these problems is to leverage evolutionary
conservation to filter out spurious predictions of motifs, target genes and functions
(Gasch et al., 2004; Kellis et al., 2003; Tanay et al., 2005). Evolutionary conservation is
also used to find regulatory motifs in non model organisms with missing annotations
(Gasch et al., 2004; Tanay et al., 2005). However, the conservation assumption is
especially problematic when attempting to study divergence across species. Previous
13
studies (Cliften et al., 2003; Gasch et al., 2004; Ihmels et al., 2005; Kellis et al., 2003;
Lavoie et al., 2010; Marino-Ramirez et al., 2006; Tan et al., 2007; Tanay et al., 2005)
overcame these obstacles by focusing on at least one conserved feature, and tested
divergence in the others. These conserved features include studying transcription factors
with strongly conserved functions and target genes (Gasch et al., 2004), modules of
orthologous genes with conserved expression patterns (Tanay et al., 2005), or binding
sites whose relative positioning is conserved in individual promoters (Cliften et al., 2003;
Gasch et al., 2004; Kellis et al., 2003) or classes of genes (Lavoie et al., 2010).
These studies (Cliften et al., 2003; Gasch et al., 2004; Ihmels et al., 2005; Kellis et al.,
2003; Lavoie et al., 2010; Marino-Ramirez et al., 2006; Tan et al., 2007; Tanay et al.,
2005) have found both conserved and diverged motifs associated with specific functions.
Overall, they uncovered substantial plasticity in regulatory networks, with extensive
turnover of motif targets and diverged location of binding sites within promoters of target
genes. This is consistent with the experimental studies described above (Borneman et al.,
2007; Hogues et al., 2008; Tuch et al., 2008) (Bradley et al., 2010; Moses et al., 2006)
(Konopka et al., 2009; Odom et al., 2007; Schmidt et al., 2010). However, each
computational work has made strong conservation assumptions to overcome noisy
predictions, resulting in crude snapshots of a complex evolutionary process and biasing
the results by the underlying assumptions of the computational method. Thus, an
unbiased computational approach to reconstruct cis-regulatory evolution across large
phylogenies for dozens of transcription factors is needed.
2.1.5 Yeast as a model for cis-regulatory evolution
The comparative studies described above were done in the Ascomycota fungi
phylogeny (yeasts), which includes the known model organism Saccharomyces
cerevisiae, the human pathogen Candida albicans and the remote Schizosaccharomyces
pombe. Yeasts have proven to be an ideal model for studying transcription regulation and
regulatory evolution. On the one hand, these are simple single cells eukaryotic organisms,
easy to grow in the lab and manipulate genetically. They have a condensed genome with
14
4,000-7,000 genes and relatively short intergenic regions, simplifying computational
analysis and models. Several yeasts species, mainly S. cerevisiae, have been extensively
studied, and thus a lot of information is available, including fully sequenced and well-
annotated genomes. On the other hand, yeasts share the same complex internal cell
structure as higher eukaryotes, including similar transcriptional machinery and
transcription regulation mechanisms. An extreme example is the Hsf1 transcription factor,
which is highly conserved, including its DNA binding domain, from yeasts to mammals
(Liu et al., 1997). Thus, yeasts are suitable for developing and testing new
methodologies, and many of the principles discovered in them are potentially relevant to
higher organisms as well. For a comparative study across species this phylogeny provides
an optimal setting, since it includes dozens of fully sequenced genomes of highly diverse
organisms, both in sequence and phenotype, spanning more than 800 million years of
evolution.
In mammalian systems, transcription regulation is much more complex compared
to yeasts. First, the intergenic regions are much longer, and transcription factors can bind
to remote regulatory sequences, enhancers, which can be more than 100kb away from the
genes they are modulating (Bejerano et al., 2006). Second, the number of transcription
factors regulating a single response or biological process is large (Amit et al., 2009;
Novershtern et al., 2011). An example for a complex regulatory system in mammals is
the transcriptional response to inflammation in immune system cells in mice, which is
regulated by at least a dozen transcription factors, operating through different modes of
activation, including fast responding factors (e.g. NFkB) and secondary response factors
synthesized de-novo during the response (e.g. Irf8), resulting in a wide range of
dynamical transcriptional responses (Amit et al., 2009; Hoffmann et al., 2006; Medzhitov
and Horng, 2009; Sivriver et al., 2011).
Thus, model organisms can be used to develop methodologies relevant to higher
eukaryotes, but these require adjustments to account for the increased complexity of the
system. Specifically when considering DNA motifs, the long intergenic regions can
introduce an enormous amount of noise that will be difficult to overcome. A possible
15
alternative approach is to derive models based on observations in yeasts, and then directly
test these models in higher eukaryotes, to deduce general principles of transcription
regulation and regulatory evolution.
Here, we conduct a large-scale study of cis-regulatory evolution for dozens of
transcription factors across large phylogenies of yeast species. To this end we developed
an unbiased computational method and used it to address several questions: (1) What is
the extent of plasticity in regulatory networks? (2) What is the impact of the network’s
plasticity on the function of transcription factors? (3) What are the underlying selection
pressures driving this evolutionary process? (4) Can we find a general model relevant to
yeasts and mammalian species?
16
2.2 Results
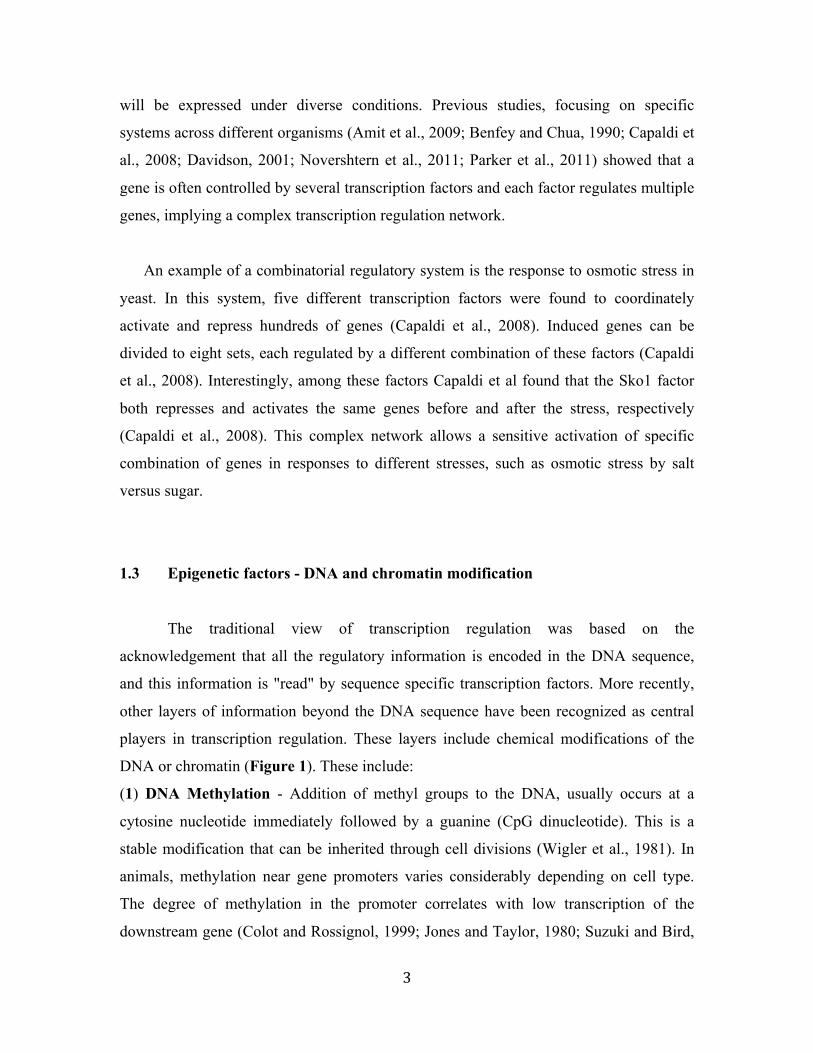
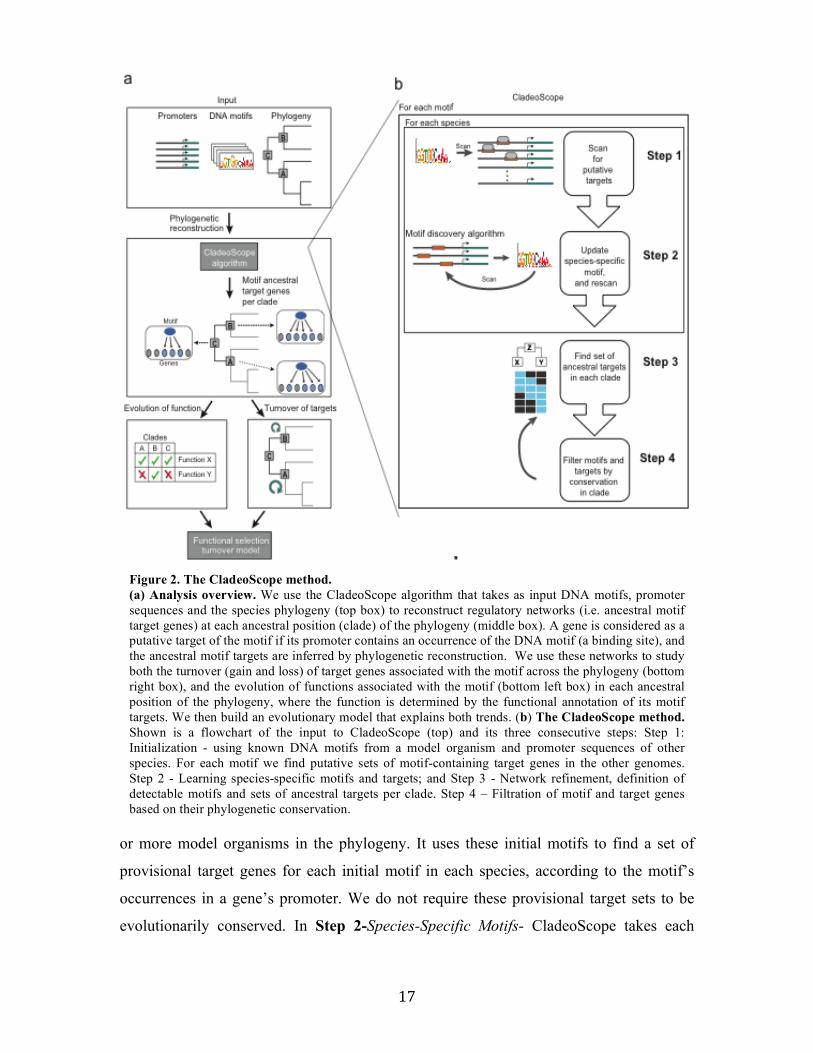
2.2.1 CladeoScope: a framework for reconstructing cis-‐regulatory evolution
We developed CladeoScope (Figure 2), a computational framework for an
unbiased reconstruction of cis-regulatory networks and their evolution across a
phylogeny of species. CladeoScope relies on two assumptions. First, we assume that the
binding specificities of transcription factors, represented as DNA motifs, are largely
conserved, even when their specific target genes and functional roles may have
substantially diverged (Schmidt et al., 2010; Tuch et al., 2008; Wapinski et al., 2007). We
therefore initiate our reconstruction with DNA motifs of known transcription factors that
have been experimentally determined, but without any further assumptions about
conservation of their individual targets or their global functional roles. We do allow for
relatively small changes in binding affinities across evolution, and thus refine those
motifs in a species-specific manner (see below). Second, although predicting the target
genes for a motif (motif targets) across the genome is prone to errors (Hannenhalli, 2008),
we assume that targets that are conserved across several related species within a
monophyletic clade provide a reliable and conservative estimate for the targets in the
ancestor of the clade. Thus, for each motif associated with a known transcription factor in
S. cerevisiae (e.g., Gcn4), CladeoScope finds its ancestral target genes in various
ancestors in the phylogeny. A gene is considered to be targeted by a motif in the ancestor
of a clade of species only if evolutionary analysis of the orthologous targets across the
species in the clade indicated that the ancestral gene of that clade was a target of the
motif (Wapinski et al., 2007) (Methods). CladeoScope then compares between the
ancestral targets of different clades, allowing us to reliably track evolutionary changes
across the phylum by considering the evolutionary changes between clades while filtering
out spurious targets within a clade.
An overview of the CladeoScope method
CladeoScope consists of four steps (Figure 2b): In Step 1- Initialization-
CladeoScope is initialized with known DNA motifs (Position Weight Matrices) from one
17
or more model organisms in the phylogeny. It uses these initial motifs to find a set of
provisional target genes for each initial motif in each species, according to the motif’s
occurrences in a gene’s promoter. We do not require these provisional target sets to be
evolutionarily conserved. In Step 2-Species-Specific Motifs- CladeoScope takes each
Figure 2. The CladeoScope method. (a) Analysis overview. We use the CladeoScope algorithm that takes as input DNA motifs, promoter sequences and the species phylogeny (top box) to reconstruct regulatory networks (i.e. ancestral motif target genes) at each ancestral position (clade) of the phylogeny (middle box). A gene is considered as a putative target of the motif if its promoter contains an occurrence of the DNA motif (a binding site), and the ancestral motif targets are inferred by phylogenetic reconstruction. We use these networks to study both the turnover (gain and loss) of target genes associated with the motif across the phylogeny (bottom right box), and the evolution of functions associated with the motif (bottom left box) in each ancestral position of the phylogeny, where the function is determined by the functional annotation of its motif targets. We then build an evolutionary model that explains both trends. (b) The CladeoScope method. Shown is a flowchart of the input to CladeoScope (top) and its three consecutive steps: Step 1: Initialization - using known DNA motifs from a model organism and promoter sequences of other species. For each motif we find putative sets of motif-containing target genes in the other genomes. Step 2 - Learning species-specific motifs and targets; and Step 3 - Network refinement, definition of detectable motifs and sets of ancestral targets per clade. Step 4 – Filtration of motif and target genes based on their phylogenetic conservation.
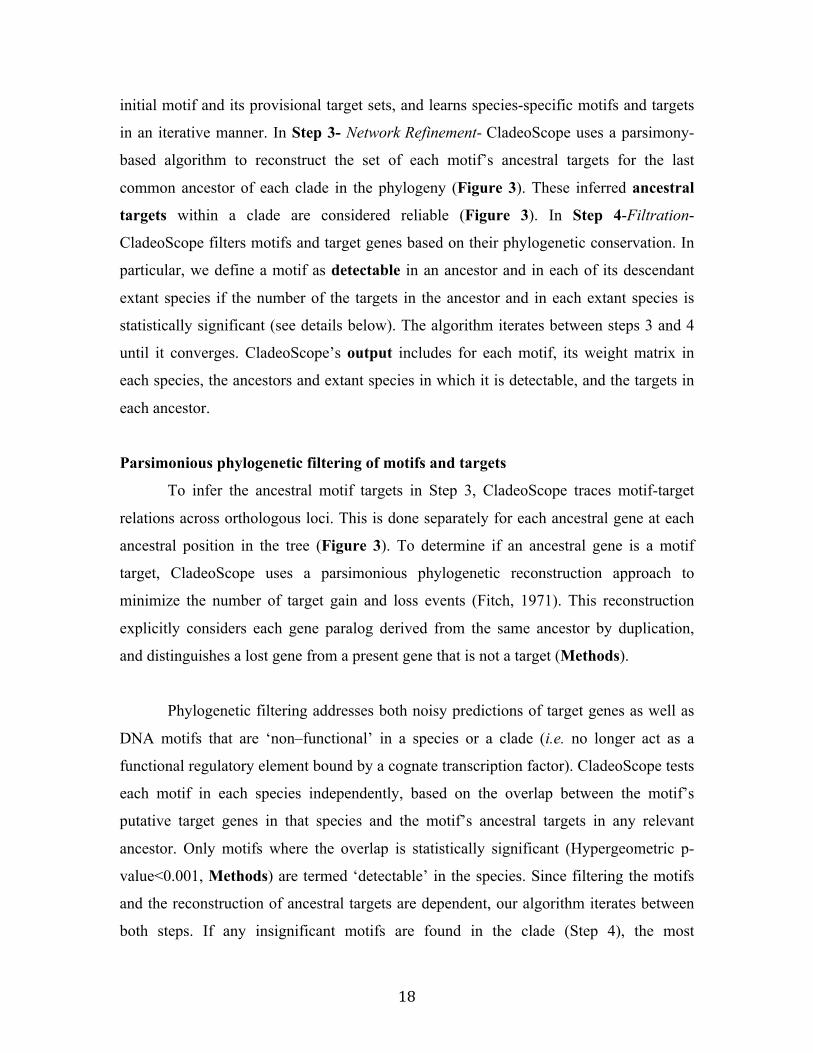
18
initial motif and its provisional target sets, and learns species-specific motifs and targets
in an iterative manner. In Step 3- Network Refinement- CladeoScope uses a parsimony-
based algorithm to reconstruct the set of each motif’s ancestral targets for the last
common ancestor of each clade in the phylogeny (Figure 3). These inferred ancestral
targets within a clade are considered reliable (Figure 3). In Step 4-Filtration-
CladeoScope filters motifs and target genes based on their phylogenetic conservation. In
particular, we define a motif as detectable in an ancestor and in each of its descendant
extant species if the number of the targets in the ancestor and in each extant species is
statistically significant (see details below). The algorithm iterates between steps 3 and 4
until it converges. CladeoScope’s output includes for each motif, its weight matrix in
each species, the ancestors and extant species in which it is detectable, and the targets in
each ancestor.
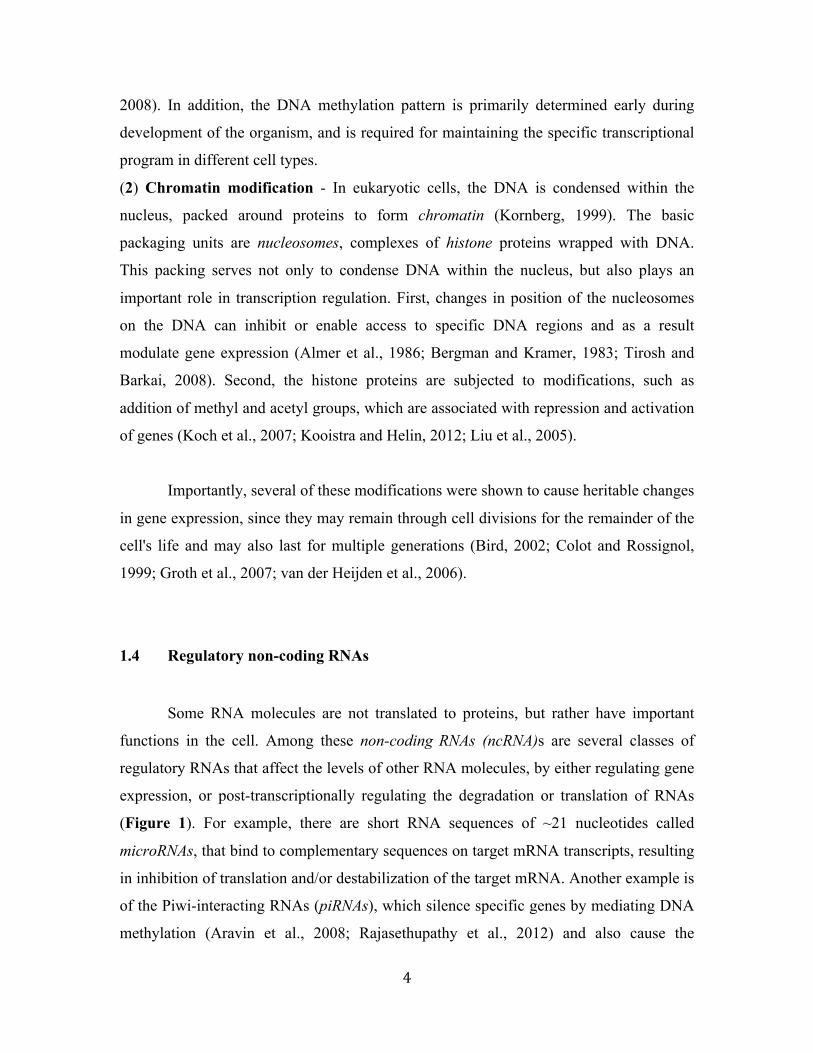
Parsimonious phylogenetic filtering of motifs and targets
To infer the ancestral motif targets in Step 3, CladeoScope traces motif-target
relations across orthologous loci. This is done separately for each ancestral gene at each
ancestral position in the tree (Figure 3). To determine if an ancestral gene is a motif
target, CladeoScope uses a parsimonious phylogenetic reconstruction approach to
minimize the number of target gain and loss events (Fitch, 1971). This reconstruction
explicitly considers each gene paralog derived from the same ancestor by duplication,
and distinguishes a lost gene from a present gene that is not a target (Methods).
Phylogenetic filtering addresses both noisy predictions of target genes as well as
DNA motifs that are ‘non–functional’ in a species or a clade (i.e. no longer act as a
functional regulatory element bound by a cognate transcription factor). CladeoScope tests
each motif in each species independently, based on the overlap between the motif’s
putative target genes in that species and the motif’s ancestral targets in any relevant
ancestor. Only motifs where the overlap is statistically significant (Hypergeometric p-
value<0.001, Methods) are termed ‘detectable’ in the species. Since filtering the motifs
and the reconstruction of ancestral targets are dependent, our algorithm iterates between
both steps. If any insignificant motifs are found in the clade (Step 4), the most
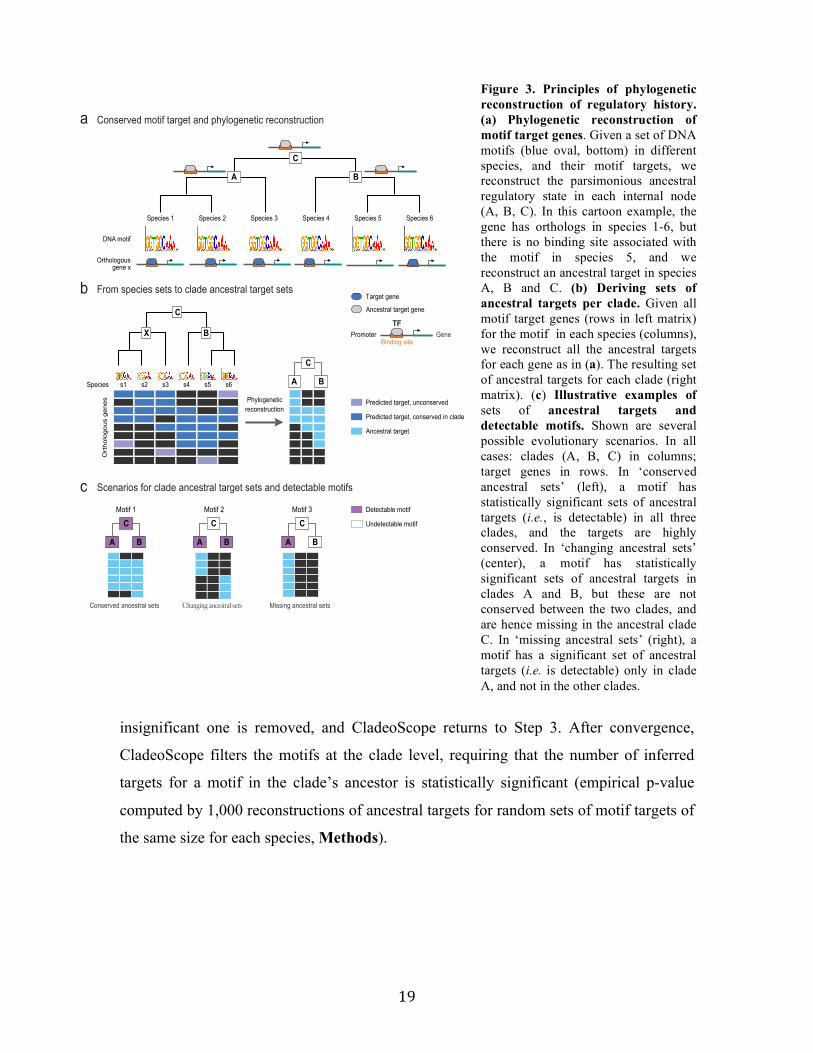
19
insignificant one is removed, and CladeoScope returns to Step 3. After convergence,
CladeoScope filters the motifs at the clade level, requiring that the number of inferred
targets for a motif in the clade’s ancestor is statistically significant (empirical p-value
computed by 1,000 reconstructions of ancestral targets for random sets of motif targets of
the same size for each species, Methods).
Figure 3. Principles of phylogenetic reconstruction of regulatory history. (a) Phylogenetic reconstruction of motif target genes. Given a set of DNA motifs (blue oval, bottom) in different species, and their motif targets, we reconstruct the parsimonious ancestral regulatory state in each internal node (A, B, C). In this cartoon example, the gene has orthologs in species 1-6, but there is no binding site associated with the motif in species 5, and we reconstruct an ancestral target in species A, B and C. (b) Deriving sets of ancestral targets per clade. Given all motif target genes (rows in left matrix) for the motif in each species (columns), we reconstruct all the ancestral targets for each gene as in (a). The resulting set of ancestral targets for each clade (right matrix). (c) Illustrative examples of sets of ancestral targets and detectable motifs. Shown are several possible evolutionary scenarios. In all cases: clades (A, B, C) in columns; target genes in rows. In ‘conserved ancestral sets’ (left), a motif has statistically significant sets of ancestral targets (i.e., is detectable) in all three clades, and the targets are highly conserved. In ‘changing ancestral sets’ (center), a motif has statistically significant sets of ancestral targets in clades A and B, but these are not conserved between the two clades, and are hence missing in the ancestral clade C. In ‘missing ancestral sets’ (right), a motif has a significant set of ancestral targets (i.e. is detectable) only in clade A, and not in the other clades.
Species 2 Species 4Species 1 Species 3 Species 5 Species 6
DNA motif
Orthologousgene x
Promoter GeneBinding site
TF
Target gene
Ancestral target gene
From species sets to clade ancestral target sets
Conserved motif target and phylogenetic reconstruction
Species s1 s2 s3 s4 s5 s6
Predicted target, conserved in clade
Predicted target, unconserved
Ancestral target
Orthologous genes
Scenarios for clade ancestral target sets and detectable motifs
Conserved ancestral sets
Undetectable motif
Detectable motif
Phylogenetic reconstruction
Motif 1 Motif 2 Motif 3
a
b
c
C
A B
C
A B
C
BX
C
A B
C
A B
C
A B
Missing ancestral sets
Habib et al.Figure 2
20
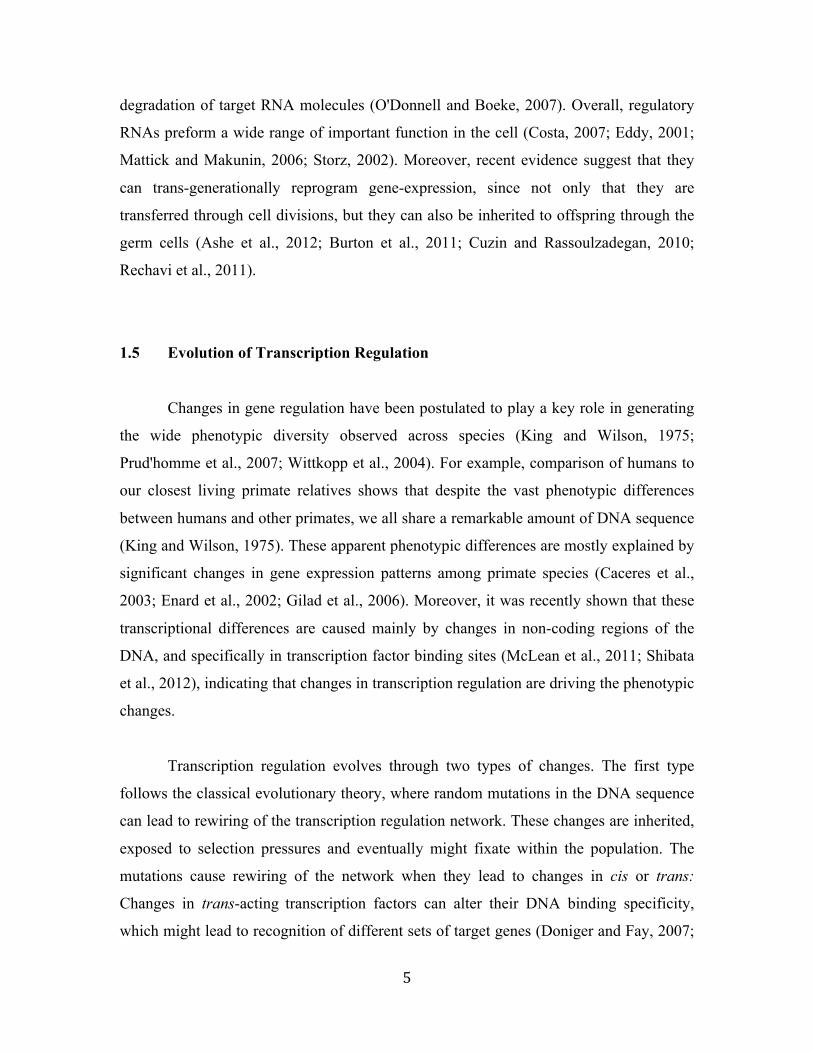
2.2.2 Systematic reconstruction of the regulatory history of 23 Ascomycota species
We applied CladeoScope to 88 DNA motifs associated with known transcription
factors or groups of paralogous factors from S. cerevisiae (MacIsaac et al., 2006; Matys
et al., 2006; Zhu et al., 2009) across 23 Ascomycota species, defining motif target genes
in 12 clades (A-L, Figure 4a, Supplementary website). As points for reconstruction of
ancestral targets we chose clades with a large evolutionary distance between them and
relatively small distances within each (Figure 4a). These clades include: the sensu stricto
Saccharomyces (four species, clade A), the Kluyveromyces (four species, clade C), the
Candida clades and Yarrowia lipolytica, 18 species, clade I), and the full Ascomycota
clade (23 species, clade L). The resulting ancestral network contains 190,689 reliable
motif-target connections (conserved in at least one clade), compared to 996,476
connections prior to phylogenetic filtering. For example, of the 307 predicted Gcn4
targets in S. cerevisiae, 195 pass our phylogenetic filter.
Regulatory motifs are detectable across large evolutionary distances
For most regulatory DNA motifs we could detect ancestral target genes within
clades across the phylogeny (Figure 4b). This is consistent with our assumptions that
transcription factors retain their binding specificities and that many of their target genes
are conserved in closely related species. For example, ~83% of the motifs were detectable
in clade D (Kluyveromyces and post-WGD clades) and ~68% were detectable in clade H,
including in species as remote from each other as S. cerevisiae and C. albicans. The latter
include motifs involved in central metabolic and cellular processes (Figure 4b, red
highlights), such as Gcn4 (amino acid biosynthesis), Rpn4 (proteasome), and Mig1
(glucose repression). 39% of motifs were detectable up to the last common ancestor
(LCA) of the entire Ascomycota phylum (clade L), including those involved in cell cycle
regulation (Fkh1, Swi6-MBP1, Figure 4b) and stress response factors (Hsf1, STRE,
Figure 4b, red highlights). The number of motifs detectable across the phylogeny is
particularly remarkable given the substantial evolutionary distances, the large intra-
species divergence within the Schizosaccharomyces (Rhind et al., 2011b), and the fact
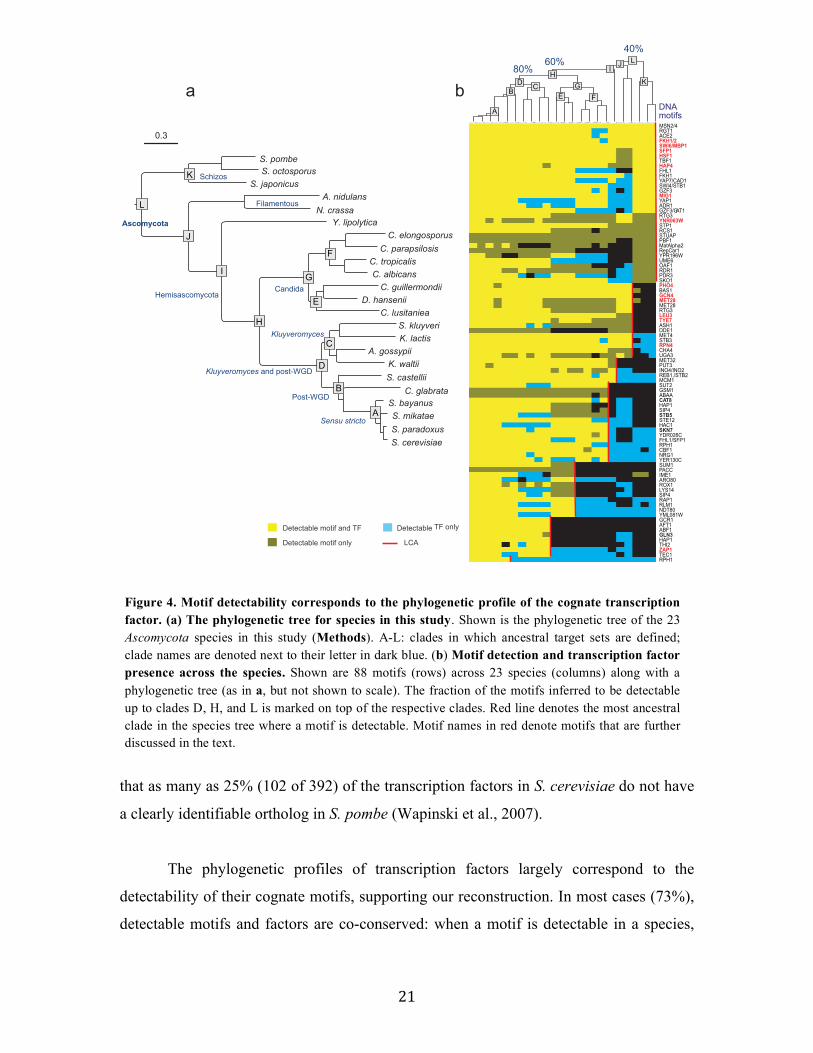
21
that as many as 25% (102 of 392) of the transcription factors in S. cerevisiae do not have
a clearly identifiable ortholog in S. pombe (Wapinski et al., 2007).
The phylogenetic profiles of transcription factors largely correspond to the
detectability of their cognate motifs, supporting our reconstruction. In most cases (73%),
detectable motifs and factors are co-conserved: when a motif is detectable in a species,
Figure 4. Motif detectability corresponds to the phylogenetic profile of the cognate transcription factor. (a) The phylogenetic tree for species in this study. Shown is the phylogenetic tree of the 23 Ascomycota species in this study (Methods). A-L: clades in which ancestral target sets are defined; clade names are denoted next to their letter in dark blue. (b) Motif detection and transcription factor presence across the species. Shown are 88 motifs (rows) across 23 species (columns) along with a phylogenetic tree (as in a, but not shown to scale). The fraction of the motifs inferred to be detectable up to clades D, H, and L is marked on top of the respective clades. Red line denotes the most ancestral clade in the species tree where a motif is detectable. Motif names in red denote motifs that are further discussed in the text.
Detectable TF only
Detectable motif only
Detectable motif and TF
40%
60%80%
MSN2/4RGT1ACE2FKH1/2SWI6/MBP1SFP1HSF1TBF1HAP4FHL1FKH1YAP7/CAD1SWI4/STB1GZF3MIG1YAP1ADR1GZF3/GAT1RTG3YNR063WSTP1RCS1STUAPPBF1MatAlpha2RepCar1YPR196WUME6OAF1RDR1PDR3SKO1PHO4BAS1GCN4MET28MET28RTG3LEU3TYE7ASH1DDE1MET4STB3RPN4CHA4UGA3MET32PUT3INO4/INO2REB1,/STB2MCM1SUT2GSM1ABAACAT8HAP1SIP4STB5STE12HAC1SKN7YDR026CFHL1/SFP1RPH1CBF1NRG1YER130CSUM1PACCIME1ARO80ROX1LYS14SIP4RAP1RLM1NDT80YML081WGCR1AFT1ABF1GLN3HAP1THI2ZAP1TEC1RPH1
LCA
a bDNA
motifsA
BC
D
E F
G
HIJ
K
L
Post-WGD
Sensu stricto
Hemisascomycota
Schizos
Filamentous
Kluyveromyces
Kluyveromyces and post-WGD
Candida
S. cerevisiaeS. paradoxusS. mikataeS. bayanus
C. glabrataS. castelliiK. waltii
A. gossypiiK. lactisS. kluyveri
C. lusitanieaD. hansenii
C. guillermondiiC. albicansC. tropicalisC. parapsilosisC. elongosporus
Y. lipolyticaN. crassaA. nidulans
S. japonicusS. octosporusS. pombe
Ascomycota
K
L
J
I
H
F
G
E
C
D
B
A
0.3
22
the ortholog of its known cognate factor is present in the same species, and vice versa
(Figure 4b). In a minority of cases (15%), a factor is present in a species, but its cognate
motif is not detectable, possibly due to lack of conserved targets within this species, or to
substantial changes in the factor’s sequence specificity (Baker et al., 2011). For example,
the Zap1 motif is detectable only up to clade D, despite the presence of its ortholog up to
clade J, suggesting a possible change of its DNA binding specificity or a lack of any
significant target conservation within the relevant clades. These cases demonstrate the
limitations of our approach in tracing regulatory evolution when the factor’s binding
specificity has diverged substantially, or when target turnover rate within a clade is very
high. This can be alleviated if more binding profiles are measured in non-model
organisms. In a few cases (12%), a motif is detectable in a species lacking a clear
orthologous cognate factor. This may indicate a relic ‘pseudomotif’ that is present in a
genome but no longer functional. However, in our case this is not very likely, since we
require the conservation of the motif and its targets across a clade of species in which the
promoter sequences diverged significantly. More likely, we detect a DNA motif without
its factor due to faulty orthology resolution (e.g. the Sko1 motif in Schizosaccharomyces)
or to multiple members of a transcription factor family with similar binding specificities
(e.g. factors binding the CACGTG motif).
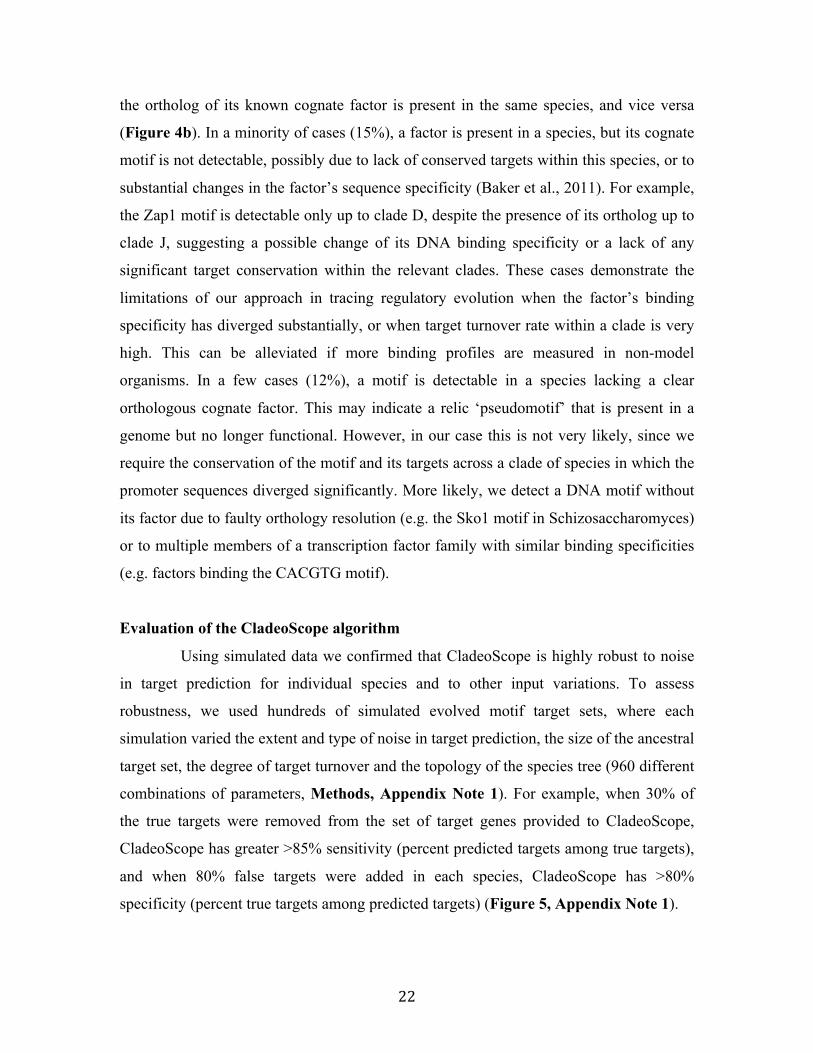
Evaluation of the CladeoScope algorithm
Using simulated data we confirmed that CladeoScope is highly robust to noise
in target prediction for individual species and to other input variations. To assess
robustness, we used hundreds of simulated evolved motif target sets, where each
simulation varied the extent and type of noise in target prediction, the size of the ancestral
target set, the degree of target turnover and the topology of the species tree (960 different
combinations of parameters, Methods, Appendix Note 1). For example, when 30% of
the true targets were removed from the set of target genes provided to CladeoScope,
CladeoScope has greater >85% sensitivity (percent predicted targets among true targets),
and when 80% false targets were added in each species, CladeoScope has >80%
specificity (percent true targets among predicted targets) (Figure 5, Appendix Note 1).
23
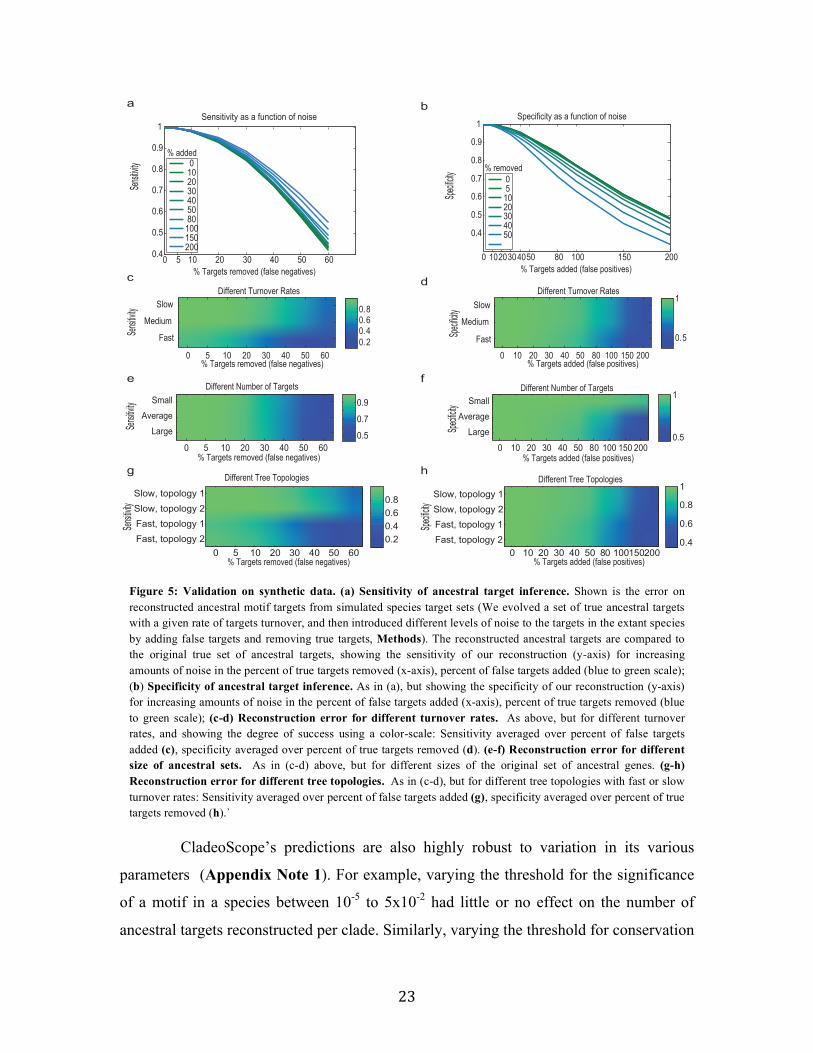
CladeoScope’s predictions are also highly robust to variation in its various
parameters (Appendix Note 1). For example, varying the threshold for the significance
of a motif in a species between 10-5 to 5x10⁻² had little or no effect on the number of
ancestral targets reconstructed per clade. Similarly, varying the threshold for conservation
Figure 5: Validation on synthetic data. (a) Sensitivity of ancestral target inference. Shown is the error on reconstructed ancestral motif targets from simulated species target sets (We evolved a set of true ancestral targets with a given rate of targets turnover, and then introduced different levels of noise to the targets in the extant species by adding false targets and removing true targets, Methods). The reconstructed ancestral targets are compared to the original true set of ancestral targets, showing the sensitivity of our reconstruction (y-axis) for increasing amounts of noise in the percent of true targets removed (x-axis), percent of false targets added (blue to green scale); (b) Specificity of ancestral target inference. As in (a), but showing the specificity of our reconstruction (y-axis) for increasing amounts of noise in the percent of false targets added (x-axis), percent of true targets removed (blue to green scale); (c-d) Reconstruction error for different turnover rates. As above, but for different turnover rates, and showing the degree of success using a color-scale: Sensitivity averaged over percent of false targets added (c), specificity averaged over percent of true targets removed (d). (e-f) Reconstruction error for different size of ancestral sets. As in (c-d) above, but for different sizes of the original set of ancestral genes. (g-h) Reconstruction error for different tree topologies. As in (c-d), but for different tree topologies with fast or slow turnover rates: Sensitivity averaged over percent of false targets added (g), specificity averaged over percent of true targets removed (h).`
Habib et al.
Figure S1
a
0 5 10 20 30 40 50 60
Slow, topology 1
Slow, topology 2
Fast, topology 1
Fast, topology 2 0.2
0.4
0.6
0.8
0 10 20 30 40 50 80 100150200
Slow, topology 1
Slow, topology 2
Fast, topology 1
Fast, topology 2 0.4
0.6
0.8
1
Different Tree Topologies
Sensitivity as a function of noise
0 5 10 20 30 40 50 600.4
0.5
0.6
0.7
0.8
0.9
1
0
10
20
30
40
50
80
100
150
200
0 1020304050 80 100 150 200
0.4
0.5
0.6
0.7
0.8
0.9
1
0
5
10
20
30
40
50
0 5 10 20 30 40 50 60
Small
Average
Large0.5
0.7
0.9
0 10 20 30 40 50 80 100 150 200
Small
Average
Large0.5
1
0 5 10 20 30 40 50 60
Slow
Medium
Fast0.2
0.4
0.6
0.8
0 10 20 30 40 50 80 100 150 200
Slow
Medium
Fast 0.5
1
g h
cd
b
e f
Different Turnover Rates Different Turnover Rates
Different Number of Targets Different Number of Targets
Different Tree Topologies
% Targets removed (false negatives) % Targets added (false positives)
% removed
% added
% Targets removed (false negatives)
% Targets removed (false negatives)
% Targets removed (false negatives)
% Targets added (false positives)
% Targets added (false positives)
% Targets added (false positives)
Sensitivity
Sensitivity
Sensitivity
Sensitivity
24
of a motif in a clade between 0.05 to 0.001 had little impact on the number of significant
motifs per clade (Figure 6). Thus, evolutionary conservation within a clade – rather than
parameter fine-tuning – is the main determinant of CladeoScope’s results and
performance.
To examine the possibility that our relatively strict motif target detection
threshold excludes weak, yet functional, binding sites, we compared the score distribution
of functional but weak binding sites to non-functional sites. We identify potential
candidates for weak functional sites as ones with a conserved target genes in the sister
species within the same clade, which are classified as non-target (‘lost’) in the reference
species. Indeed, in 85% of the cases we tested, such ‘lost’ targets have a distribution of
scores similar to genes that are not targets throughout the clade. Hence, lowering the
threshold would not have increased our sensitivity to such weak sites (Appendix Note 2).
Nonetheless, as an additional validation, we tested the main findings using a lower
Figure 6. Robustness of p-value threshold for significance of ancestral target sets in a clade. (a) The fraction of significant ancestral motif target sets across all clades, per threshold of the empirical p-value estimates ranging from 0.05 to 0.001, as computed by applying CladeoScope to 1,000 simulations of random target sets of the motif (cases where no ancestral targets were reconstructed in the simulations are marked as 0). (b) The absolute number of significant ancestral motif target sets, separately per clade and per threshold (as in (a)).
a
b
>0.001
>0.001
25
threshold for motif targets detection and found our results to be robust (Appendix Note 1
& 3).
As a negative control, we provided CladeoScope an input set of randomly
generated motifs. Although in each species we do find targets for such motifs,
CladeoScope’s phylogenetic filtering found that these motifs are not conserved
(Appendix Note 1). The only exception is in the closely related sensu stricto
Saccharomyces, where intergenic sequences have not yet had enough time to acquire
sufficient mutations. We therefore do not report motifs found to be conserved only in
this clade. We tested the contribution of the species-specific motif refinement process to
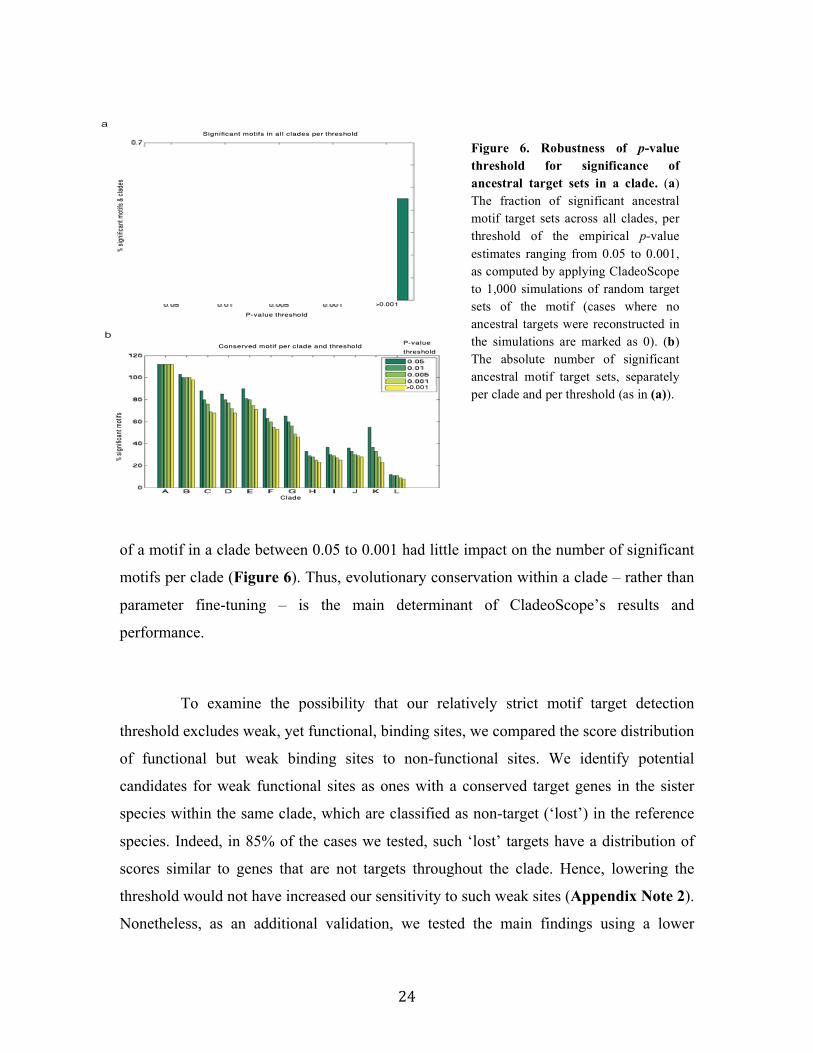
the quality of CladeoScope. This refinement step generates a species-specific motif based
on an input motif in the model organism S. cerevisiae (see Methods). While the distances
between the motifs are small (measured by BLiC (Habib et al., 2008)), they increase with
the distance between species (Methods, Correlation = -0.58, p-value=0.005, for the mean
distance of all motifs in each species). Since the distances are small, we next compared
motif targets predicted for the S. cerevisiae motif to prediction for the species-specific
Figure 7. Comparison of motif targets predicted with the known S.cervisiae motif and the refined motif. A plot of the fraction of the shared predicted motif targets (blue), targets predicted by S. cerevisiae motif only (red), and targets predicted by the species-specific refined motif only (green), for different motifs and species (from left to right): Fkh1 motif in S.bayanus, K.lactis, C.albicans and S.pombe; Hsf1 motif in S.bayanus, K.lactis, C.albicans and S.pombe; Rpn4 motif in S.bayanus, K.lactis and C.albicans; Gcn4 motif in S.bayanus, K.lactis and C.albicans; Mbp1 motif in S.bayanus, K.lactis, C.albicans and S.pombe; Mig1 motif in S.bayanus, K.lactis and C.albicans.
26
motif. We find that even in species within the sensu-stricto clade that refinement of
motifs does change the predicted targets by adding and removing targets (Figure 7).
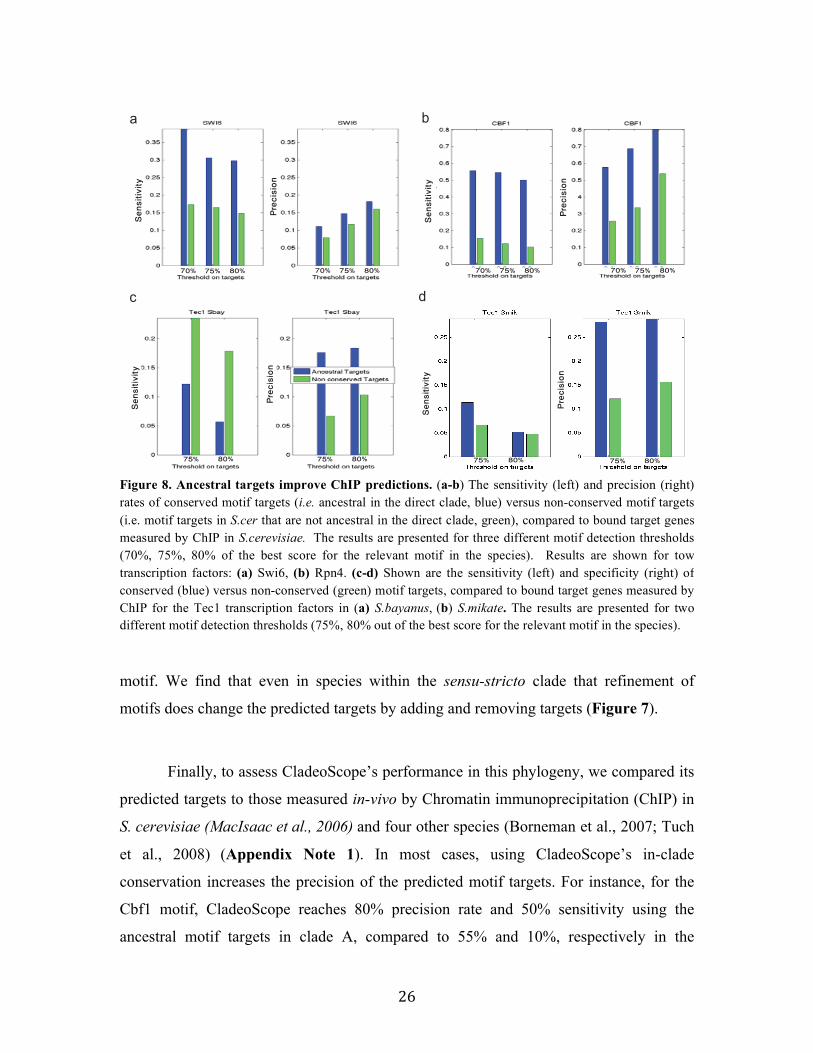
Finally, to assess CladeoScope’s performance in this phylogeny, we compared its
predicted targets to those measured in-vivo by Chromatin immunoprecipitation (ChIP) in
S. cerevisiae (MacIsaac et al., 2006) and four other species (Borneman et al., 2007; Tuch
et al., 2008) (Appendix Note 1). In most cases, using CladeoScope’s in-clade
conservation increases the precision of the predicted motif targets. For instance, for the
Cbf1 motif, CladeoScope reaches 80% precision rate and 50% sensitivity using the
ancestral motif targets in clade A, compared to 55% and 10%, respectively in the
a b
70% 75% 80% 70% 75% 80% 70% 75% 80% 70% 75% 80%Precision
Sensitiv
ity
c d
75% 80% 75% 80% 75% 80% 75% 80%
Precision
Sensitiv
ity
Precision
Sensitiv
ity
Precision
Sensitiv
ity
Figure 8. Ancestral targets improve ChIP predictions. (a-b) The sensitivity (left) and precision (right) rates of conserved motif targets (i.e. ancestral in the direct clade, blue) versus non-conserved motif targets (i.e. motif targets in S.cer that are not ancestral in the direct clade, green), compared to bound target genes measured by ChIP in S.cerevisiae. The results are presented for three different motif detection thresholds (70%, 75%, 80% of the best score for the relevant motif in the species). Results are shown for tow transcription factors: (a) Swi6, (b) Rpn4. (c-d) Shown are the sensitivity (left) and specificity (right) of conserved (blue) versus non-conserved (green) motif targets, compared to bound target genes measured by ChIP for the Tec1 transcription factors in (a) S.bayanus, (b) S.mikate. The results are presented for two different motif detection thresholds (75%, 80% out of the best score for the relevant motif in the species).
27
predicted motif targets in S. cerevisiae that are not conserved (Figure 8). These improved
predictions are consistent for different thresholds for motif targets detection in each
species (Figure 8).
2.2.3 Plasticity of regulatory networks in Ascomycota fungi
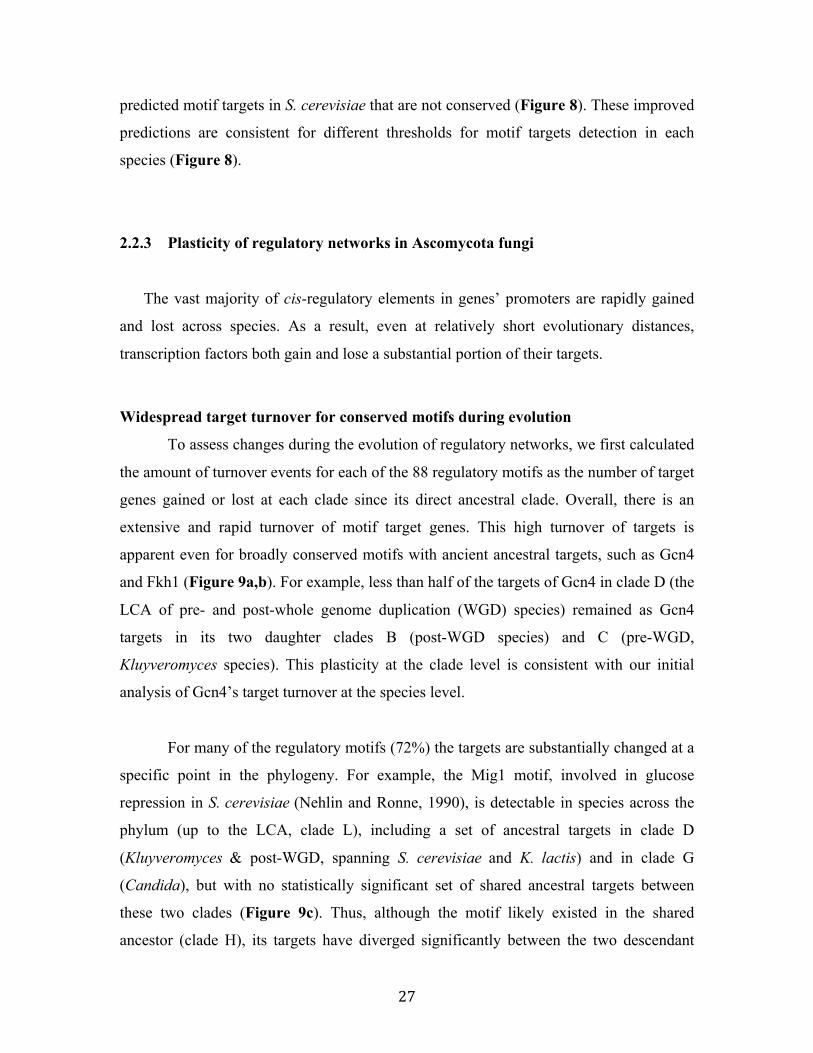
The vast majority of cis-regulatory elements in genes’ promoters are rapidly gained
and lost across species. As a result, even at relatively short evolutionary distances,
transcription factors both gain and lose a substantial portion of their targets.
Widespread target turnover for conserved motifs during evolution
To assess changes during the evolution of regulatory networks, we first calculated
the amount of turnover events for each of the 88 regulatory motifs as the number of target
genes gained or lost at each clade since its direct ancestral clade. Overall, there is an
extensive and rapid turnover of motif target genes. This high turnover of targets is
apparent even for broadly conserved motifs with ancient ancestral targets, such as Gcn4
and Fkh1 (Figure 9a,b). For example, less than half of the targets of Gcn4 in clade D (the
LCA of pre- and post-whole genome duplication (WGD) species) remained as Gcn4
targets in its two daughter clades B (post-WGD species) and C (pre-WGD,
Kluyveromyces species). This plasticity at the clade level is consistent with our initial
analysis of Gcn4’s target turnover at the species level.
For many of the regulatory motifs (72%) the targets are substantially changed at a
specific point in the phylogeny. For example, the Mig1 motif, involved in glucose
repression in S. cerevisiae (Nehlin and Ronne, 1990), is detectable in species across the
phylum (up to the LCA, clade L), including a set of ancestral targets in clade D
(Kluyveromyces & post-WGD, spanning S. cerevisiae and K. lactis) and in clade G
(Candida), but with no statistically significant set of shared ancestral targets between
these two clades (Figure 9c). Thus, although the motif likely existed in the shared
ancestor (clade H), its targets have diverged significantly between the two descendant
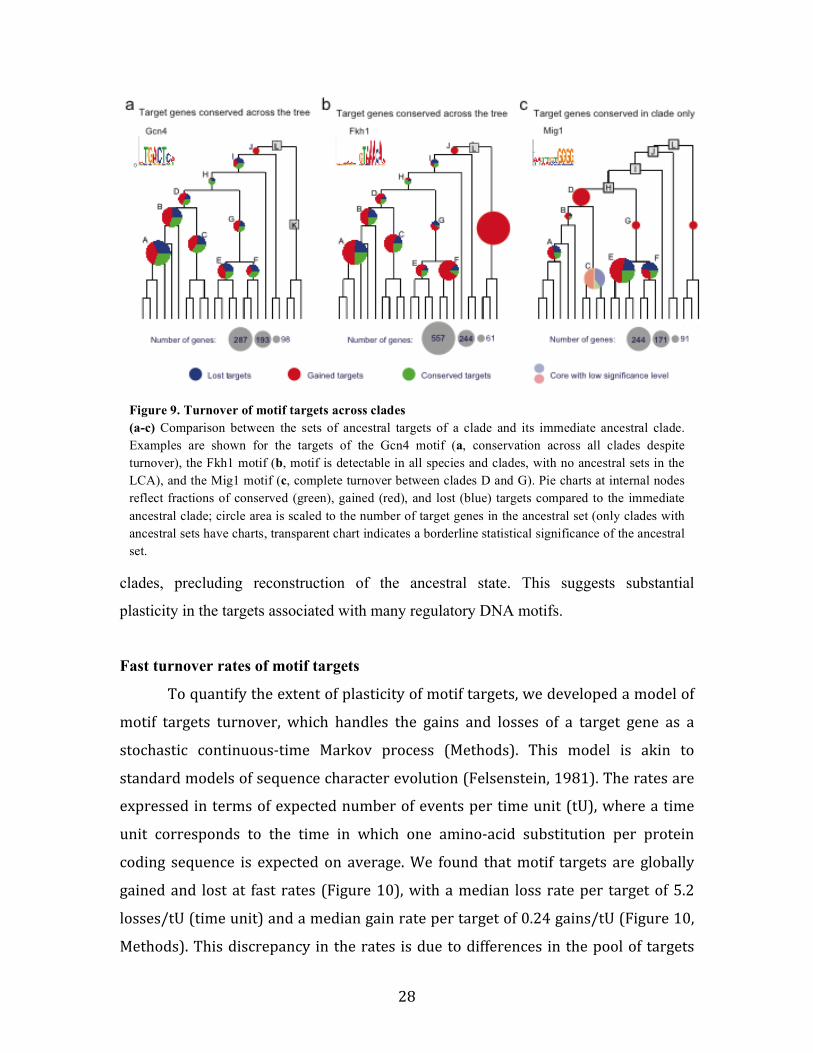
28
clades, precluding reconstruction of the ancestral state. This suggests substantial
plasticity in the targets associated with many regulatory DNA motifs.
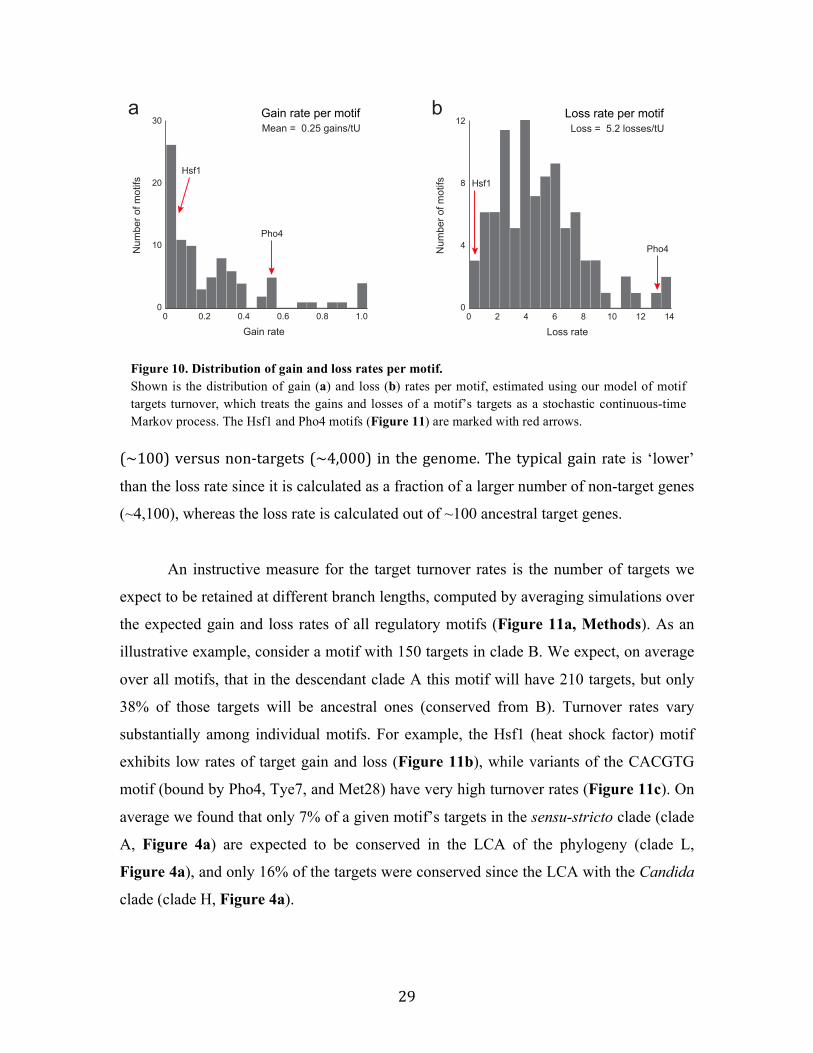
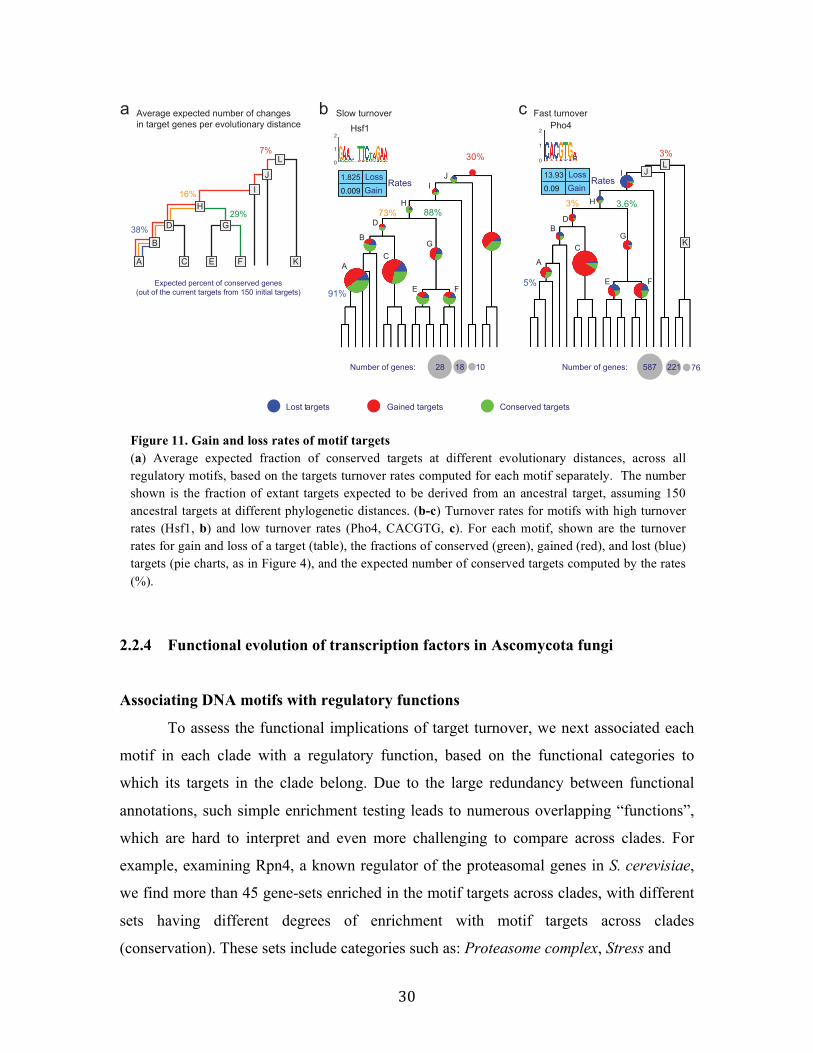
Fast turnover rates of motif targets
To quantify the extent of plasticity of motif targets, we developed a model of
motif targets turnover, which handles the gains and losses of a target gene as a
stochastic continuous-‐time Markov process (Methods). This model is akin to
standard models of sequence character evolution (Felsenstein, 1981). The rates are
expressed in terms of expected number of events per time unit (tU), where a time
unit corresponds to the time in which one amino-‐acid substitution per protein
coding sequence is expected on average. We found that motif targets are globally
gained and lost at fast rates (Figure 10), with a median loss rate per target of 5.2
losses/tU (time unit) and a median gain rate per target of 0.24 gains/tU (Figure 10,
Methods). This discrepancy in the rates is due to differences in the pool of targets
Figure 9. Turnover of motif targets across clades (a-c) Comparison between the sets of ancestral targets of a clade and its immediate ancestral clade. Examples are shown for the targets of the Gcn4 motif (a, conservation across all clades despite turnover), the Fkh1 motif (b, motif is detectable in all species and clades, with no ancestral sets in the LCA), and the Mig1 motif (c, complete turnover between clades D and G). Pie charts at internal nodes reflect fractions of conserved (green), gained (red), and lost (blue) targets compared to the immediate ancestral clade; circle area is scaled to the number of target genes in the ancestral set (only clades with ancestral sets have charts, transparent chart indicates a borderline statistical significance of the ancestral set.
29
(~100) versus non-‐targets (~4,000) in the genome. The typical gain rate is ‘lower’
than the loss rate since it is calculated as a fraction of a larger number of non-target genes
(~4,100), whereas the loss rate is calculated out of ~100 ancestral target genes.
An instructive measure for the target turnover rates is the number of targets we
expect to be retained at different branch lengths, computed by averaging simulations over
the expected gain and loss rates of all regulatory motifs (Figure 11a, Methods). As an
illustrative example, consider a motif with 150 targets in clade B. We expect, on average
over all motifs, that in the descendant clade A this motif will have 210 targets, but only
38% of those targets will be ancestral ones (conserved from B). Turnover rates vary
substantially among individual motifs. For example, the Hsf1 (heat shock factor) motif
exhibits low rates of target gain and loss (Figure 11b), while variants of the CACGTG
motif (bound by Pho4, Tye7, and Met28) have very high turnover rates (Figure 11c). On
average we found that only 7% of a given motif’s targets in the sensu-stricto clade (clade
A, Figure 4a) are expected to be conserved in the LCA of the phylogeny (clade L,
Figure 4a), and only 16% of the targets were conserved since the LCA with the Candida
clade (clade H, Figure 4a).
Figure 10. Distribution of gain and loss rates per motif. Shown is the distribution of gain (a) and loss (b) rates per motif, estimated using our model of motif targets turnover, which treats the gains and losses of a motif’s targets as a stochastic continuous-time Markov process. The Hsf1 and Pho4 motifs (Figure 11) are marked with red arrows.
Habib et al.
Figure S2
Gain rate
Number of motifs
10
30
20
0
0 0.2 0.4 0.80.6 1.0
aMean = 0.25 gains/tU
Gain rate per motif
Pho4
Hsf1
Loss rate
Number of motifs
4
12
8
0
0 2 4 86 10
bLoss = 5.2 losses/tU
Loss rate per motif
Pho4
Hsf1
12 14
30
2.2.4 Functional evolution of transcription factors in Ascomycota fungi
Associating DNA motifs with regulatory functions
To assess the functional implications of target turnover, we next associated each
motif in each clade with a regulatory function, based on the functional categories to
which its targets in the clade belong. Due to the large redundancy between functional
annotations, such simple enrichment testing leads to numerous overlapping “functions”,
which are hard to interpret and even more challenging to compare across clades. For
example, examining Rpn4, a known regulator of the proteasomal genes in S. cerevisiae,
we find more than 45 gene-sets enriched in the motif targets across clades, with different
sets having different degrees of enrichment with motif targets across clades
(conservation). These sets include categories such as: Proteasome complex, Stress and
Figure 11. Gain and loss rates of motif targets (a) Average expected fraction of conserved targets at different evolutionary distances, across all regulatory motifs, based on the targets turnover rates computed for each motif separately. The number shown is the fraction of extant targets expected to be derived from an ancestral target, assuming 150 ancestral targets at different phylogenetic distances. (b-c) Turnover rates for motifs with high turnover rates (Hsf1, b) and low turnover rates (Pho4, CACGTG, c). For each motif, shown are the turnover rates for gain and loss of a target (table), the fractions of conserved (green), gained (red), and lost (blue) targets (pie charts, as in Figure 4), and the expected number of conserved targets computed by the rates (%).
Conserved targetsGained targetsLost targets
A
7%
29%
16%
38%
1.825
0.009
Loss
Gain
Slow turnover
91%
73%
30%
88%
Fast turnover
5%
3% 3.6%
3%
Average expected number of changes
in target genes per evolutionary distance
a b c
Expected percent of conserved genes
(out of the current targets from 150 initial targets)
B
C
D
E F
G
H
I
J
K
L
A
B
D
E F
G
C
L
K
A
B
D
E F
G
C
Hsf12
1
0
Pho42
1
0
28 1018Number of genes: 587 76221Number of genes:
H
I
Rates
13.93
0.09
Loss
GainRates
J
I
H
J
Habib et al.
Figure 5
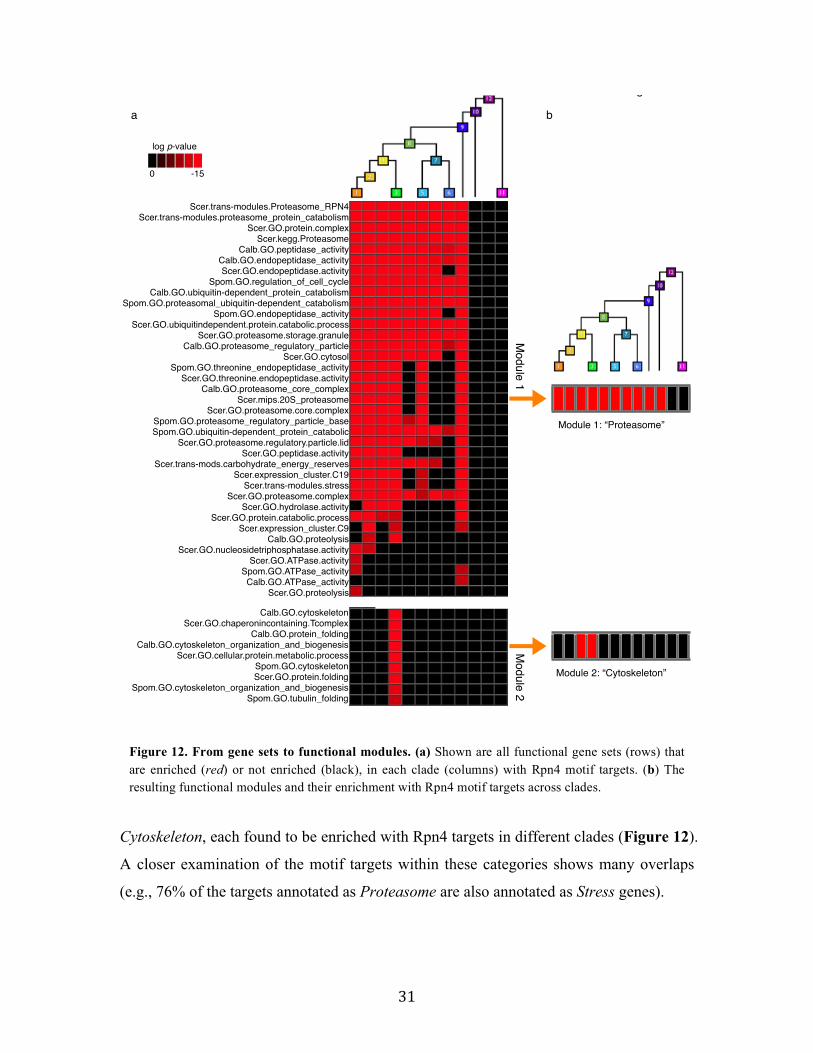
31
Cytoskeleton, each found to be enriched with Rpn4 targets in different clades (Figure 12).
A closer examination of the motif targets within these categories shows many overlaps
(e.g., 76% of the targets annotated as Proteasome are also annotated as Stress genes).
Figure 12. From gene sets to functional modules. (a) Shown are all functional gene sets (rows) that are enriched (red) or not enriched (black), in each clade (columns) with Rpn4 motif targets. (b) The resulting functional modules and their enrichment with Rpn4 motif targets across clades.
Scer.trans-modules.Proteasome_RPN4Scer.trans-modules.proteasome_protein_catabolism
Scer.GO.protein.complexScer.kegg.Proteasome
Calb.GO.peptidase_activityCalb.GO.endopeptidase_activityScer.GO.endopeptidase.activity
Spom.GO.regulation_of_cell_cycleCalb.GO.ubiquitin-dependent_protein_catabolism
Spom.GO.proteasomal_ubiquitin-dependent_catabolismSpom.GO.endopeptidase_activity
Scer.GO.ubiquitindependent.protein.catabolic.processScer.GO.proteasome.storage.granule
Calb.GO.proteasome_regulatory_particleScer.GO.cytosol
Spom.GO.threonine_endopeptidase_activityScer.GO.threonine.endopeptidase.activity
Calb.GO.proteasome_core_complexScer.mips.20S_proteasome
Scer.GO.proteasome.core.complexSpom.GO.proteasome_regulatory_particle_baseSpom.GO.ubiquitin-dependent_protein_catabolic
Scer.GO.proteasome.regulatory.particle.lidScer.GO.peptidase.activity
Scer.trans-mods.carbohydrate_energy_reservesScer.expression_cluster.C19
Scer.trans-modules.stressScer.GO.proteasome.complex
Scer.GO.hydrolase.activityScer.GO.protein.catabolic.process
Scer.expression_cluster.C9Calb.GO.proteolysis
Scer.GO.nucleosidetriphosphatase.activityScer.GO.ATPase.activity
Spom.GO.ATPase_activityCalb.GO.ATPase_activity
Scer.GO.proteolysis
a b
Calb.GO.cytoskeletonScer.GO.chaperonincontaining.Tcomplex
Calb.GO.protein_foldingCalb.GO.cytoskeleton_organization_and_biogenesis
Scer.GO.cellular.protein.metabolic.processSpom.GO.cytoskeletonScer.GO.protein.folding
Spom.GO.cytoskeleton_organization_and_biogenesisSpom.GO.tubulin_folding
Module 1
Module 2
log p-value
0 -15
Module 1: “Proteasome”
Module 2: “Cytoskeleton”
Figure S12
32
To obtain a non-redundant description of motif functions, we developed an
algorithm that clusters functional gene-sets by the fraction of associated motif targets
shared between them. This procedure defines functional modules, each containing genes
that share functional annotations and are ancestral targets of the same regulatory motif in
at least one clade (Methods). Revisiting the Rpn4 example, we see that we have two
functional modules: stress response and proteasome module conserved across species,
and cytoskeleton module conserved mainly in clade C (Figure 12).
An additional example, Gcn4 targets in each clade are associated only with the
amino acid metabolism module (Figure 13a). This module includes several overlapping
gene sets, such as amino acid biosynthetic process (Ashburner et al., 2000), amino acid
metabolism (Segal et al., 2003), amino acid nitrogen metabolism (Segal et al., 2003), or
pyridoxal phosphate binding (Ashburner et al., 2000). Notably, each motif can be
associated with one or more such modules in each clade, and possibly with different
modules in different clades.
Compared to direct enrichment of individual gene sets, functional modules are a
more concise, non-redundant and robust representation that can be easily compared
across the phylogeny. We extensively evaluated the robustness and correctness of the
functional module assignments. We show that the method is robust to different
parameters in the algorithm, including the choices of motif detection threshold, the
threshold over enrichment of functional categories with motif targets, and to the threshold
for merging functional categories (Appendix Note 3). Furthermore, in support of our
procedure and CladeoScope’s predictions, our functional assignments are consistent with
known functions of the associated transcription factors in S.cerevisaie, C.albicans and S.
pombe, for most motifs with a known function (75%) (with another 12% of the motifs
with a partial match; Appendix Note 3).
Innovations through expansion and switch of functions
In some cases turnover of target genes contributes to evolutionary innovation, by
either expanding or switching the scope of functions ascribed to a regulatory DNA motif
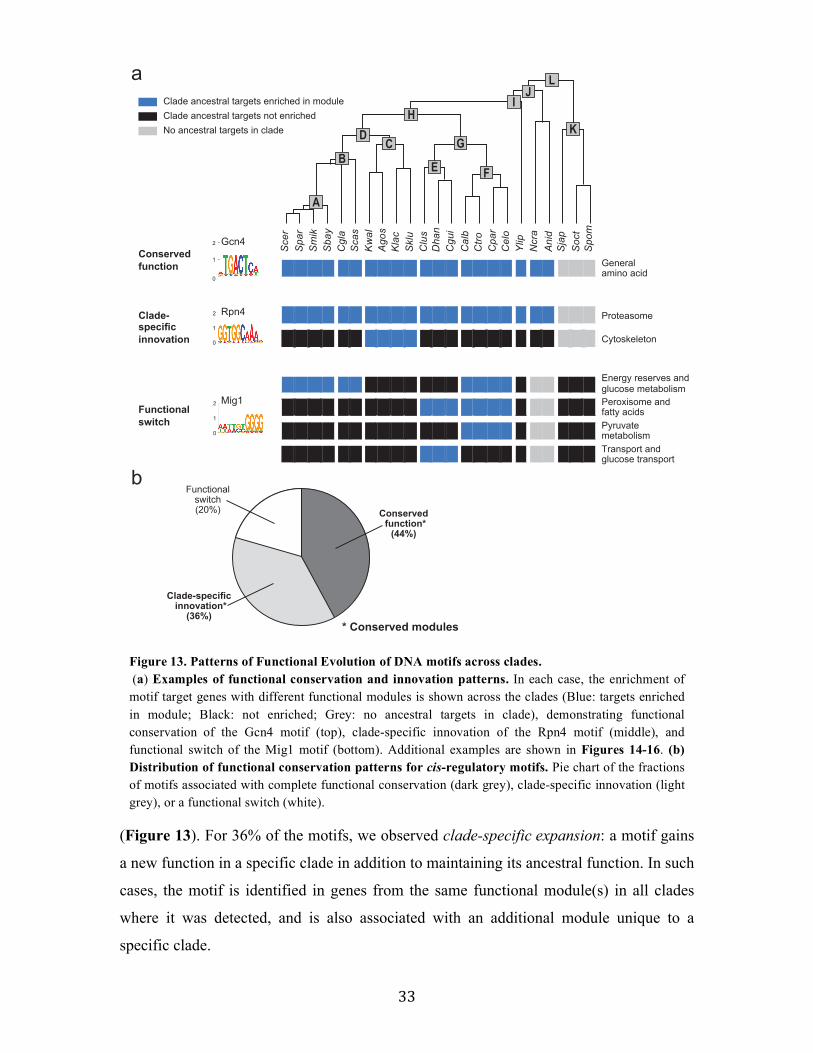
33
(Figure 13). For 36% of the motifs, we observed clade-specific expansion: a motif gains
a new function in a specific clade in addition to maintaining its ancestral function. In such
cases, the motif is identified in genes from the same functional module(s) in all clades
where it was detected, and is also associated with an additional module unique to a
specific clade.
Figure 13. Patterns of Functional Evolution of DNA motifs across clades. (a) Examples of functional conservation and innovation patterns. In each case, the enrichment of motif target genes with different functional modules is shown across the clades (Blue: targets enriched in module; Black: not enriched; Grey: no ancestral targets in clade), demonstrating functional conservation of the Gcn4 motif (top), clade-specific innovation of the Rpn4 motif (middle), and functional switch of the Mig1 motif (bottom). Additional examples are shown in Figures 14-16. (b) Distribution of functional conservation patterns for cis-regulatory motifs. Pie chart of the fractions of motifs associated with complete functional conservation (dark grey), clade-specific innovation (light grey), or a functional switch (white).
Scer
Spar
Smik
Sbay
Cgla
Scas
Kwal
Agos
Klac
Sklu
Clus
Dhan
Cgui
Calb
CtroCpar
Celo
YlipNcra
Anid
Sjap
Soct
Spom
General
amino acid
Conserved function
Proteasome
Cytoskeleton
Clade-
innovation
Functional switch
Peroxisome and
fatty acids
Pyruvate
metabolism
Energy reserves and
glucose metabolism
Transport and
glucose transport
Habib et al.
Figure 6
G
FE
H
CD
B
A
J
K
L
IClade ancestral targets enriched in module
Clade ancestral targets not enriched
No ancestral targets in clade
Conservedfunction*(44%)
innovation*(36%)
Functional
switch
(20%)
a
b
* Conserved modules
2
1
0
Rpn4
2
1
0
Mig1
2
1
0
Gcn4
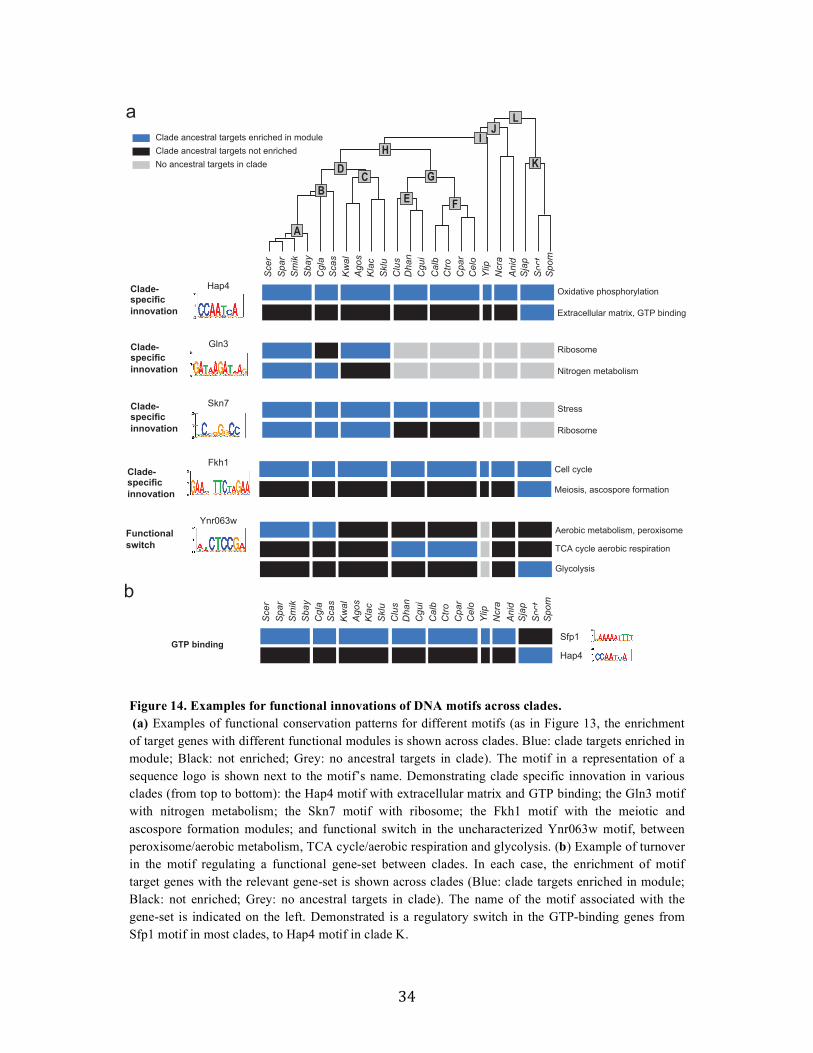
34
Figure 14. Examples for functional innovations of DNA motifs across clades. (a) Examples of functional conservation patterns for different motifs (as in Figure 13, the enrichment of target genes with different functional modules is shown across clades. Blue: clade targets enriched in module; Black: not enriched; Grey: no ancestral targets in clade). The motif in a representation of a sequence logo is shown next to the motif’s name. Demonstrating clade specific innovation in various clades (from top to bottom): the Hap4 motif with extracellular matrix and GTP binding; the Gln3 motif with nitrogen metabolism; the Skn7 motif with ribosome; the Fkh1 motif with the meiotic and ascospore formation modules; and functional switch in the uncharacterized Ynr063w motif, between peroxisome/aerobic metabolism, TCA cycle/aerobic respiration and glycolysis. (b) Example of turnover in the motif regulating a functional gene-set between clades. In each case, the enrichment of motif target genes with the relevant gene-set is shown across clades (Blue: clade targets enriched in module; Black: not enriched; Grey: no ancestral targets in clade). The name of the motif associated with the gene-set is indicated on the left. Demonstrated is a regulatory switch in the GTP-binding genes from Sfp1 motif in most clades, to Hap4 motif in clade K.
Scer
Spar
Smik
Sbay
Cgla
Scas
Kwal
Agos
Klac
Sklu
Clus
Dhan
Cgui
Calb
CtroCpar
Celo
YlipNcra
Anid
Sjap
Soct
Spom
Functional switch
G
FE
H
CD
B
A
J
K
L
IClade ancestral targets enriched in moduleClade ancestral targets not enrichedNo ancestral targets in clade
a
Ynr063wAerobic metabolism, peroxisome
TCA cycle aerobic respiration
Hap4 Oxidative phosphorylation
Extracellular matrix, GTP binding
Clade-
innovation
Scer
Spar
Smik
Sbay
Cgla
Scas
Kwal
Agos
Klac
Sklu
Clus
Dhan
Cgui
Calb
CtroCpar
Celo
YlipNcra
Anid
Sjap
Soct
Spom
b
Hap4GTP binding
Sfp1
Gln3 Ribosome
Nitrogen metabolism
Clade-
innovation
Skn7 Stress
Ribosome
Clade-
innovation
Fkh1Cell cycle
Meiosis, ascospore formation
Clade-
innovation
Glycolysis
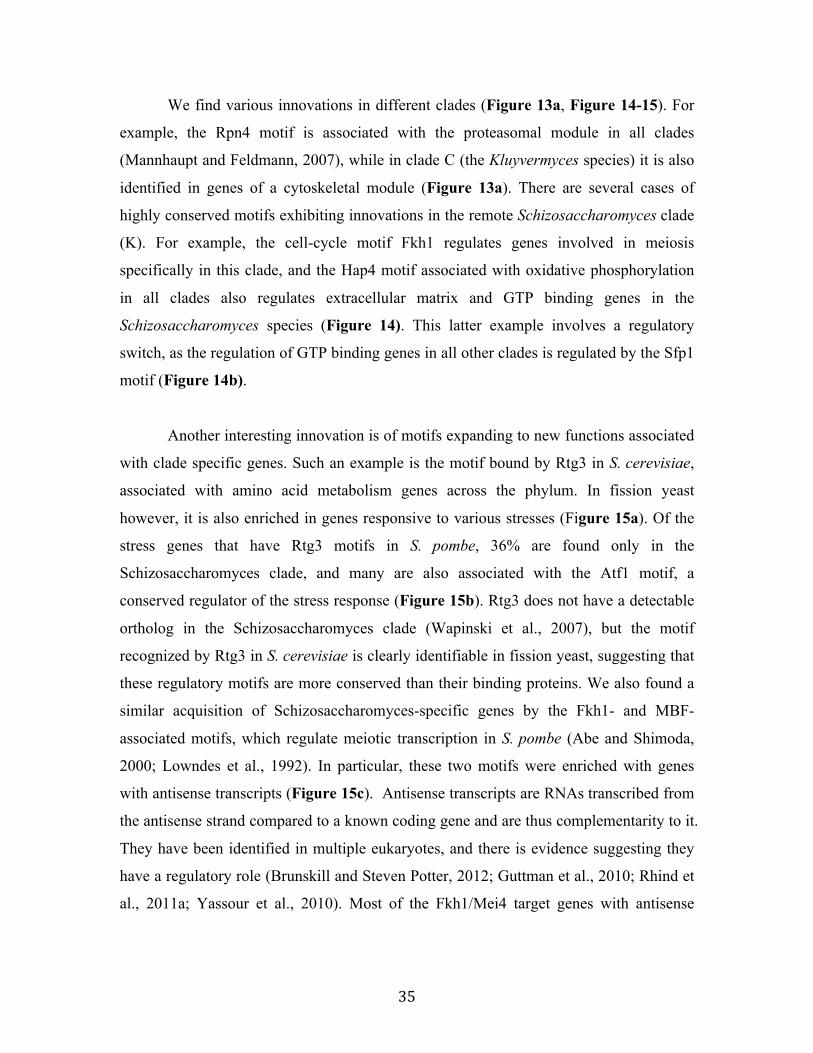
35
We find various innovations in different clades (Figure 13a, Figure 14-15). For
example, the Rpn4 motif is associated with the proteasomal module in all clades
(Mannhaupt and Feldmann, 2007), while in clade C (the Kluyvermyces species) it is also
identified in genes of a cytoskeletal module (Figure 13a). There are several cases of
highly conserved motifs exhibiting innovations in the remote Schizosaccharomyces clade
(K). For example, the cell-cycle motif Fkh1 regulates genes involved in meiosis
specifically in this clade, and the Hap4 motif associated with oxidative phosphorylation
in all clades also regulates extracellular matrix and GTP binding genes in the
Schizosaccharomyces species (Figure 14). This latter example involves a regulatory
switch, as the regulation of GTP binding genes in all other clades is regulated by the Sfp1
motif (Figure 14b).
Another interesting innovation is of motifs expanding to new functions associated
with clade specific genes. Such an example is the motif bound by Rtg3 in S. cerevisiae,
associated with amino acid metabolism genes across the phylum. In fission yeast
however, it is also enriched in genes responsive to various stresses (Figure 15a). Of the
stress genes that have Rtg3 motifs in S. pombe, 36% are found only in the
Schizosaccharomyces clade, and many are also associated with the Atf1 motif, a
conserved regulator of the stress response (Figure 15b). Rtg3 does not have a detectable
ortholog in the Schizosaccharomyces clade (Wapinski et al., 2007), but the motif
recognized by Rtg3 in S. cerevisiae is clearly identifiable in fission yeast, suggesting that
these regulatory motifs are more conserved than their binding proteins. We also found a
similar acquisition of Schizosaccharomyces-specific genes by the Fkh1- and MBF-
associated motifs, which regulate meiotic transcription in S. pombe (Abe and Shimoda,
2000; Lowndes et al., 1992). In particular, these two motifs were enriched with genes
with antisense transcripts (Figure 15c). Antisense transcripts are RNAs transcribed from
the antisense strand compared to a known coding gene and are thus complementarity to it.
They have been identified in multiple eukaryotes, and there is evidence suggesting they
have a regulatory role (Brunskill and Steven Potter, 2012; Guttman et al., 2010; Rhind et
al., 2011a; Yassour et al., 2010). Most of the Fkh1/Mei4 target genes with antisense
36
transcripts (80%, 47 genes) are meiotic genes (Rhind et al., 2011a), the majority of which
are specific to the Schizosaccharomyces clade (Figure 15c).
For 20% of the regulatory motifs we observed a functional switch between clades: the
same motif has target genes from distinct functional modules in different clades, thus
losing one function while gaining another. For example, the Mig1 motif is associated in
Figure 15. Conserved regulatory motifs with clade specific target genes A) The enrichment of gene functional modules regulated by the Rtg3-biding motif in 23 Ascomycota. This motif is enriched upstream of amino acid metabolism genes in all Ascomycota. However, in fission yeast, it is specifically enriched upstream of stress-response genes. S. cerevisiae (Scer), S. paradoxus (Spar), S. mikatae (Smik), S. bayanus (Sbay), C. glabrata (Cgla), S. castellii (Scas), K. waltii (Kwal), A. gossypii (Agos), K. lactis (Klac), S. kluyveri (Sklu), D. hansenii (Dhan), C. guilliermondii (Cgui), C. lusitaniae (Clus), C. albicans (Calb), C. tropicalis (Ctro), C. parapsilosis (Cpar), C. elongosporus (Celo), Y. lipolytica (Ylip), N. crassa (Ncra), A. nidulans (Anid), S. japonicus (Sjap), S. octosporus (Soct), S. pombe (Spom). B) Enrichment of Rtg3- and Aft1-binding sites in the promoters of stress response genes. Each row represents a gene. The strength of the strongest regulatory site upstream of the gene is indicated in the blue heat map. The expression of the gene in glucose depletion (gd) and early-stationery phase (es) relative to log phase is indicated in the blue-yellow heat map. Genes specific to the fission yeast clade are indicated in orange. C) Enrichment of Fkh2/Mei4- and MBF-binding sites in front of antisense-transcribed genes. As in B, but each row represents a gene with greater antisense than sense transcription. Gene associated with meiosis (Mata et al., 2002) are indicated in magenta.

37
the Candida (G) clade with modules such as peroxisome and fatty acid metabolism,
whereas in the Kluyveromyces (C), the ‘post-WGD’ (B) and the Schizosaccharomyces
(K) clades it is associated with other carbon metabolism modules (Figure 13a). An
additional example is the motif bound by the factor Ynr063w (Zhu et al., 2009). This
motif is associated with general metabolic processes in all clades where it is detected, but
switches its specific function: it is associated with the TCA cycle in the Candida clades
(E-G), glycolysis in Schizosaccharomyces clade (K), but with the peroxisome and aerobic
metabolism in the ‘post-WGD’ clade (A-B) (Figure 14a).
Extensive functional conservation of regulatory DNA motifs
We observed functional conservation for a large fraction of the regulatory DNA motifs.
44% of motifs are associated only with the same functions in all clades in which the motif
is detectable, even across large phylogenetic distances. Examples include the Gcn4 motif
with Amino-Acid biosynthesis module (described above, Figure 13a), the Hsf1 motif
with a heat shock module across the entire phylogeny (Figure 16), and the Mbp1 motif
with cell-cycle and DNA replication modules across the entire phylogeny (Figure 16).
Furthermore, although in other cases the motif might gain or lose an association to
functional modules during evolution, 80% of all the motifs have at least one conserved
function across all clades (Figure 13b).
A resource for studying regulatory evolution in Ascomycota
The regulatory history of the 88 transcription factors across the Ascomycota phylum,
including their specific target genes in each clade, their turnover rates and their functions,
constitutes a valuable resource for future studies of regulatory evolution and of individual
species, including human and plant pathogens. We provide this resource as a website
(http://www.compbio.cs.huji.ac.il/OrthoMotifs), where a user can query individual motifs,
or genes, and trace their evolutionary relationship at the species and clade level.
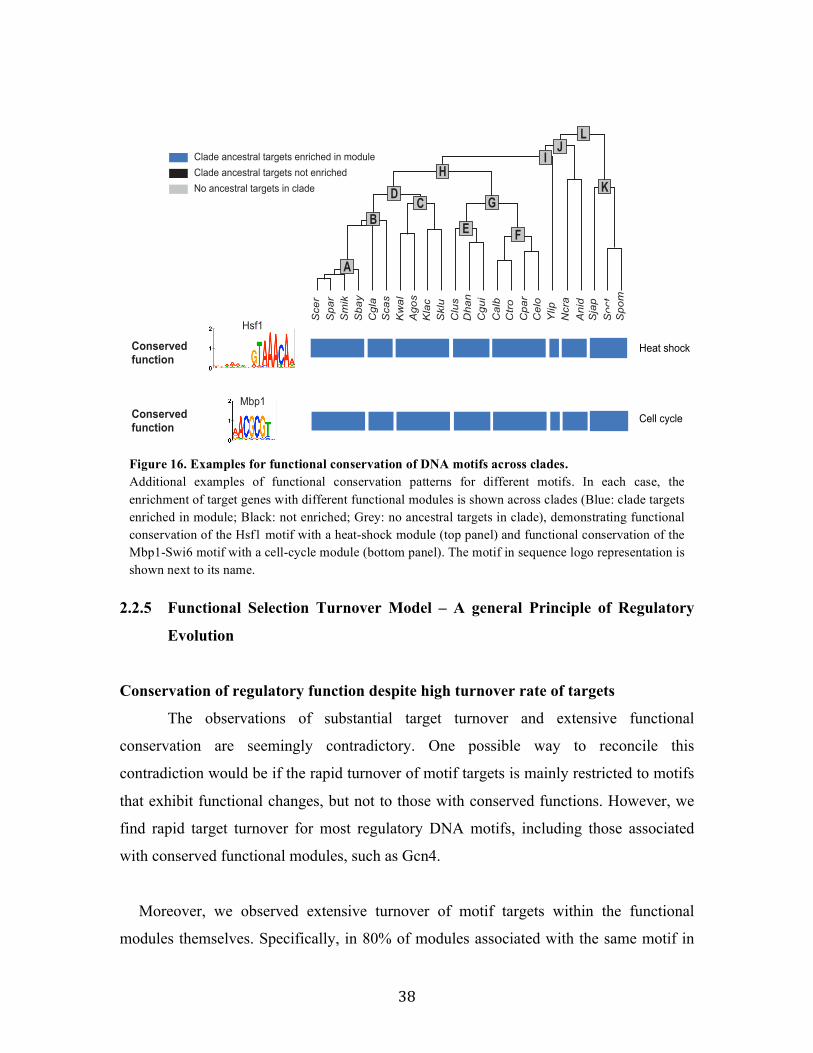
38
2.2.5 Functional Selection Turnover Model – A general Principle of Regulatory
Evolution
Conservation of regulatory function despite high turnover rate of targets
The observations of substantial target turnover and extensive functional
conservation are seemingly contradictory. One possible way to reconcile this
contradiction would be if the rapid turnover of motif targets is mainly restricted to motifs
that exhibit functional changes, but not to those with conserved functions. However, we
find rapid target turnover for most regulatory DNA motifs, including those associated
with conserved functional modules, such as Gcn4.
Moreover, we observed extensive turnover of motif targets within the functional
modules themselves. Specifically, in 80% of modules associated with the same motif in
Figure 16. Examples for functional conservation of DNA motifs across clades. Additional examples of functional conservation patterns for different motifs. In each case, the enrichment of target genes with different functional modules is shown across clades (Blue: clade targets enriched in module; Black: not enriched; Grey: no ancestral targets in clade), demonstrating functional conservation of the Hsf1 motif with a heat-shock module (top panel) and functional conservation of the Mbp1-Swi6 motif with a cell-cycle module (bottom panel). The motif in sequence logo representation is shown next to its name.
Motif ancestral
target genes
Functional
annotations
Heat shock
Cell cycle
Habib et al.
Figure S3
Conserved function
Mbp1
Hsf1
Conserved function
a
b
Functional gene setsenriched with target genes
Merge
overlapping
sets
Functional modules 1–3
1
2 3
Scer
Spar
Smik
Sbay
Cgla
Scas
Kwal
Agos
Klac
Sklu
Clus
Dhan
Cgui
Calb
Ctro
Cpar
Celo
YlipNcra
Anid
Sjap
Soct
Spom
G
FE
H
CD
B
A
J
K
L
IClade ancestral targets enriched in module
Clade ancestral targets not enriched
No ancestral targets in clade
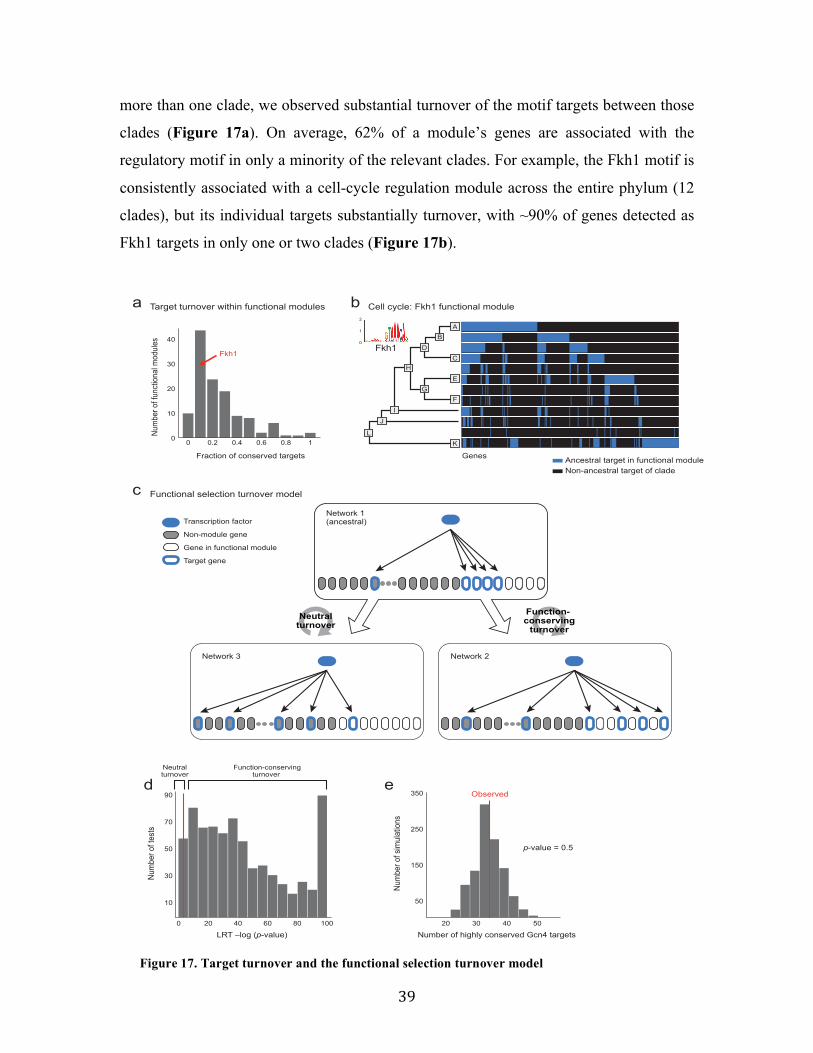
39
more than one clade, we observed substantial turnover of the motif targets between those
clades (Figure 17a). On average, 62% of a module’s genes are associated with the
regulatory motif in only a minority of the relevant clades. For example, the Fkh1 motif is
consistently associated with a cell-cycle regulation module across the entire phylum (12
clades), but its individual targets substantially turnover, with ~90% of genes detected as
Fkh1 targets in only one or two clades (Figure 17b).
Network 1(ancestral)
Network 2Network 3
Target gene
Non-module gene
Gene in functional module
Transcription factor
Function- conservingturnover
Habib et al.Figure 7
0 0.2 0.4 0.6 0.8 10
10
20
30
40
Fkh1
Target turnover within functional modulesa
Fraction of conserved targets
Number of functional modules
Genes
Cell cycle: Fkh1 functional modulebA
B
CD
E
FG
H
I
J
KL
Fkh1
Non-ancestral target of cladeAncestral target in functional module
2
1
0
Functional selection turnover modelc
Neutralturnover
LRT –log (p-value)
Number of tests
Function-conservingturnover
Neutralturnover
e
20 30 40 50
50
150
250
350
Number of highly conserved Gcn4 targets
Number of simulations
p-value = 0.5
Observed
10
30
50
90
70
0 20 40 8060 100
d
Figure 17. Target turnover and the functional selection turnover model
40
A functional selection turnover model
The observed conservation of regulatory function despite high target turnover suggests
that the global functional roles associated with a regulatory motif are under stronger
selection than the individual regulatory interactions. To formalize this notion we propose
the Functional Selection Turnover Model, where selective pressure acts differentially to
conserve motif-target relations within the same biological process (compared to outside
of the process), but not particular target genes within that process (Figure 17c).
To test this hypothesis, we used a likelihood ratio test to compare two alternative
evolutionary models (Methods): (1) a ‘neutral’ turnover model, where targets are gained
and lost at the same rates regardless of the functional module to which they belong; and
(2) a ‘module-specific’ turnover model (described above), where turnover rates – both
gain and loss – are different for targets in the functional module compared to those
Figure 17. Target turnover and the functional selection turnover model (a) Extent of target turnover within functional modules. The distribution of the percent of conserved targets (x-axis, defined as targets of a motif in the majority of the clades associated with the functional module), for all functional modules with targets in at least two clades. The bin pertaining to the Fkh1 cell-cycle module is marked with a red arrow. (b) Fkh1 target turnover within the cell cycle module. Target genes (rows) for the Fkh1 motif within the cell cycle module across the clades (columns). Blue: target in a clade; black: non ancestral target in the clade. (c) Functional Selection Turnover Model. Cartoon illustration of the model (White: gene in functional module; Grey: gene not in module; Blue border: target gene of motif; Blue node: motif/transcription factor) with two alternative scenarios for target genes turnover from the ancestral Network 1 (top). Both scenarios (bottom) show extensive turnover of target genes. The functional selection scenario (Network 2, bottom right) has selection on the genes’ function, as reflected by the module to which they belong, but not on individual targets, and leads to enrichment of targets within the module along with turnover of individual targets. The module-neutral scenario (Network 3, bottom left) has random turnover of targets and thus leads to loss of target enrichment within the module genes. (d) Testing the functional selection model for cis-regulatory site turnover. The distribution of the log p-value of the Likelihood-Ratio Test between the two models for target turnover, a module-neutral turnover model (H0, Figure 3c, bottom left) and a functional selection turnover model (H1, Figure 3c, bottom right), for 745 functional modules and each of their associated clades. Red line - Threshold of p-value 0.05 after the Bonferoni multiple hypothesis correction for rejecting the H0 model. (e) The number of highly conserved Gcn4 target genes is as expected given the functional selection turnover model. The distribution of the number of expected highly conserved Gcn4 targets from 1,000 simulations, according to the functional selection turnover model. The observed number of Gcn4 targets conserved up to clade H is 35 (red line), with an empirical p-value>=0.5. Thus, we cannot reject the null hypothesis that the number of highly conserved genes is as expected by the functional selection turnover model.
41
outside. We applied this test to all functional modules in all associated clades (a total of
745 tests).
In nearly all cases (96%, 715 tests), target turnover is significantly constrained by the
genes’ function (p-value <0.05 after Bonferroni correction, Figure 17d). Most notably,
the probability to gain an additional target gene within the same functional module is
typically at least two orders of magnitude higher than the probability to gain a new target
from genes outside of the module. Thus, gain and loss of target genes are highly
constrained by their function, resulting in conservation of the motif’s functional role
despite turnover at individual sites. These results are not sensitive to the choice of
parameters used in the process of target prediction or in defining functional modules, and
hence are not an artifact of specific threshold choices made in our computational analysis
(Appendix Note 3).
The fit of our model is good in all thresholds and parameters. More specifically, we
find a fit to the model (p-value<0.01 after Bonferoni correction for multiple hypothesis)
for at least 91% of the functional modules when changing the different thresholds in the
algorithm and input (as described in section 2). More specifically, ranging between 91%
- 95% when changing the enrichment threshold, ranging between 94% - 96% when
changing the merge threshold, and between 92% - 96% when changing the motif
detection threshold.
The functional selection turnover model explains the number of highly conserved
targets
Against the backdrop of rapid turnover, some motif targets remain highly conserved.
For example, 25 of the Gcn4 targets have Gcn4 binding motifs in their promoters in every
clade (out of an average of 130 Gcn4 targets per clade). Such conservation may reflect an
important specific function of these particular genes; alternatively, a few conserved genes
may be expected by chance, given the functionally constrained turnover rate of the motif
and the size of the functional module. To distinguish between these possibilities, we
performed simulations to estimate the probability of the observed number of highly
42
conserved targets under our functional selection model (Methods), assuming a
differential turnover rate for the targets, based on their function but not based on their
individual identity. We examined 20 regulatory DNA motifs that have ancestral targets
broadly conserved across clades, such as Gcn4 (Figure 17e), Mbp1 and Rpn4.
For all motifs tested, we could not reject the null hypothesis that the observed number
of highly conserved targets is consistent with the overall turnover rates according to the
Functional Selection Turnover Model (p ≥ 0.5). Thus, even the number of highly
conserved targets is consistent with selection at the module level rather than selection
towards the individual function of each gene within the module.
The functional selection turnover model is consistent with transcription factor
binding data measured across yeast and mammalian species
To examine the generality of our results we tested whether they hold at the level
of individual species as well as clades, when targets are determined experimentally rather
than computationally. We thus examined published in vivo transcription factor binding
data (from ChIP-chip or ChIP-seq experiments (Borneman et al., 2007; Schmidt et al.,
2010; Tuch et al., 2008)). Recent functional studies of transcription factor binding to
DNA reported substantial divergence in the bound targets of conserved transcription
factors in Ascomycota yeast species (Borneman et al., 2007; Tuch et al., 2008) and
between mammalian species (Schmidt et al., 2010). These include Mcm1 binding
measured across three relatively distant species (S. cerevisiae, K. lactis and C. albicans)
(Tuch et al., 2008), Ste12 and Tec1 binding in three closely-related Saccharomyces
species (S. cerevisiae, S. mikatae and S. bayanus) (Borneman et al., 2007), and HNF4α
measured across three mammalian species (human, mouse and dog) (Schmidt et al.,
2010).
Consistent with our cis-regulatory analysis, the binding profiles of all four factors
demonstrate high turnover of targets within conserved functional modules (Methods,
Figure 18), in addition to some species-specific innovations. Applying the two tests
described above, we find that the Functional Selection Turnover Model fits the binding
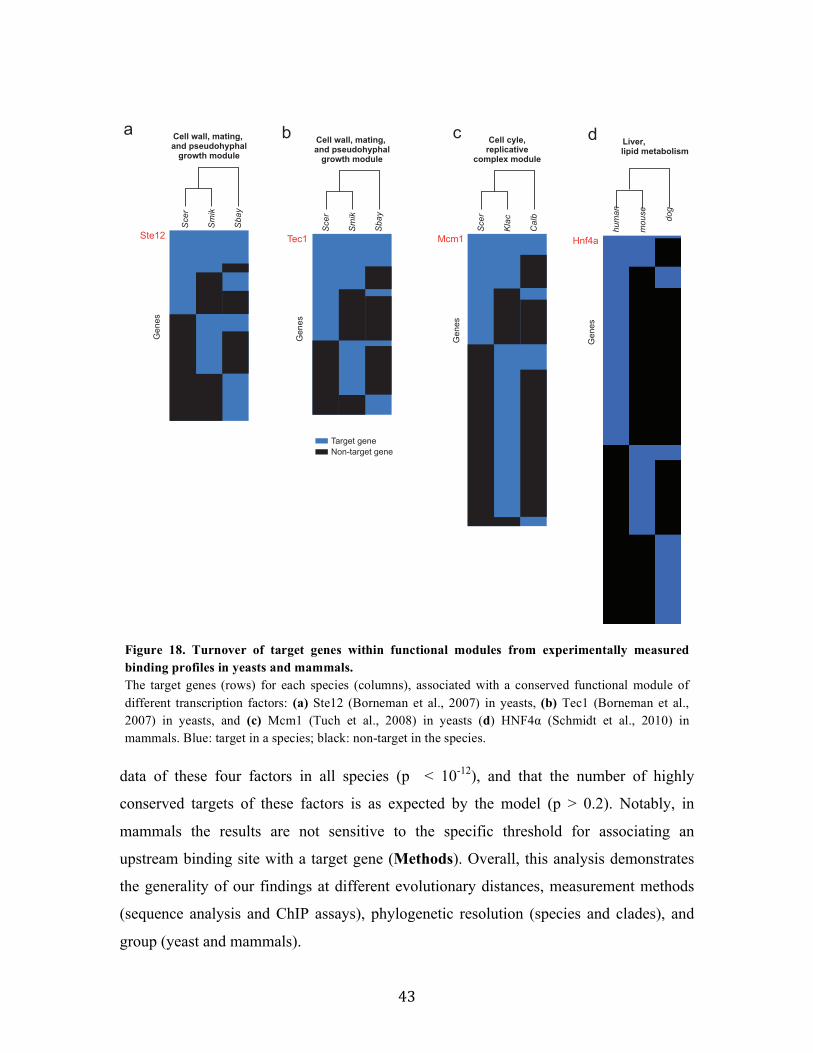
43
data of these four factors in all species (p < 10-12), and that the number of highly
conserved targets of these factors is as expected by the model (p > 0.2). Notably, in
mammals the results are not sensitive to the specific threshold for associating an
upstream binding site with a target gene (Methods). Overall, this analysis demonstrates
the generality of our findings at different evolutionary distances, measurement methods
(sequence analysis and ChIP assays), phylogenetic resolution (species and clades), and
group (yeast and mammals).
Figure 18. Turnover of target genes within functional modules from experimentally measured binding profiles in yeasts and mammals. The target genes (rows) for each species (columns), associated with a conserved functional module of different transcription factors: (a) Ste12 (Borneman et al., 2007) in yeasts, (b) Tec1 (Borneman et al., 2007) in yeasts, and (c) Mcm1 (Tuch et al., 2008) in yeasts (d) HNF4α (Schmidt et al., 2010) in mammals. Blue: target in a species; black: non-target in the species.
Genes
Ste12
Genes
Tec1
Genes
Mcm1
Non-target gene
Target gene
Scer
Smik
Sbay
Scer
Smik
Sbay
Scer
Klac
Calb
Cell wall, mating, and pseudohyphalgrowth module
Cell cyle,replicative
complex module
Cell wall, mating, and pseudohyphalgrowth module
a b c
Genes
Hnf4a
human
mouse dog
Liver,lipid metabolism
d
44
2.2 Methods
2.3.1 CladeoScope algorithm: Phylogenetic reconstruction of Cis-regulatory
networks
General Overview The CladeoScope algorithm reconstructs Cis-regulatory networks across species:
It learns species-specific DNA motifs (including in species lacking any functional
annotations and known motifs), using prior knowledge about known position weight
matrices (PWMs) in a model organism, and computationally adapting them to each
species (see Species-specific motifs). For each motif it then assigns a set of ancestral
target genes in the last common ancestor (LCA) of each clade of species across the
phylogeny (Figure 2), inferred using a maximal parsimonious phylogenetic
reconstruction (see Phylogenetic reconstruction of ancestral targets). Initially a gene
is predicted to be targeted by a regulatory DNA motif in a species if it contains a binding-
site of the motif in its promoter (see Motif scanning for putative targets). These
predicted targets are used in the reconstruction to find the ancestral set of target genes. In
addition, after the reconstruction of ancestral targets, we use them as an input to the motif
refinement per species, and choose the optimal motif (see Species-Specific motifs). The
DNA motifs in each species and the ancestral targets in each clade are filtered based on
evolutionary conservation within clades of species by their statistical significance (see
Phylogenetic filter for noisy motifs and statistical significance). The resulting resource
of species-specific motifs, ancestral target sets and functional modules per clade of
species are available for download at our supplementary website:
http://www.compbio.cs.huji.ac.il/OrthoMotifs.

45
Pseudocode:
Caldesosope(PWM, promoter sequences, gene-trees):
1. Find provisional motif targets in each species by scanning promoters
2. Learn species-specific motifs:
a. Apply motif discovery algorithm on the provisional target set initialized
by the PWM
b. Rescan for putative targets using new motif
c. Repeat steps a-b using the provisional targets defined in b
3. Reconstruct ancestral motif targets for each clade in the phylogeny from the
provisional species sets using maximum parsimonious dynamic programming
algorithm
4. Repeat step 2 starting with the ancestral targets in each clade, and choose the
motif conforming to the higher enrichment threshold.
5. Filter motifs:
a. Filter motifs in each species by enrichment of motif targets with ancestral
targets.
b. If any motifs are removed go back to step (3).
c. Filter motifs in the clade level based on statistical significance of the
number of ancestral targets.
We now describe the procedure involved in each step of this psuedocode.
Motif scanning for putative targets (Steps 1 and 2b)
To identify the putative targets of a motif in the genome, we score each gene’s
promoter by summing over all possible positions of the promoter on both strands (as in
(Tanay, 2006)), taking into account the nucleotide background distribution in the
promoters of the relevant genome:
Where, N is the length of the promoter; M is the length of the motif; ni is the nucleotide
at the i’th position of the promoter; PBG is the background distribution of nucleotides in !
score =PPWM j (ni+ j )PBG (ni+ j )j=1
M
" +Pr#PWM j (ni+ j )PBG (ni+ j )j=1
M
"$
% & &
'
( ) )
i=0
N #M +1
* log
46
all promoters of the genome; PPWMj is the probability vector for nucleotides in position j
of the motif and similarly Pr-PWMj for the reverse motif (equivalent to searching the
reverse strand of the DNA). We considered the 600 base region upstream of each gene’s
ATG as its promoter, truncating this region whenever it overlapped a neighboring gene.
We define the target set of the motif as those genes whose promoters have a score above
a threshold T = 0.8*(mean of 20 highest scoring promoters in the genome). The threshold
and scanning method where determined by optimizing the precision rate and sensitivity
of predictions of in-vivo transcription factor target genes from ChIP-chip (Harbison et al.,
2004) assays in S. cerevisiae of two different transcription factors: Hsf1 and Rpn4
(Appendix Note 4). Arguably, this might bias our choices to levels of binding that are
significantly detectable by these assays. However, perturbation analysis of this threshold
shows that our result are mostly robust to this choice (Appendix Notes 1-3). Since this
score is relative to each genome and to each motif, we exclude motifs that do not have
any occurrences in the genome by filtering out motifs whose highest score in the genome
is less than 50% of the maximum possible score of this motif in a single location.
Additionally, we removed motifs from the collection if the number of inferred targets was
greater than 1,500 (the upper bound was chosen to exceed the maximal number of
promoters bound by any transcription factor in S. cerevisiae, as measured by ChIP-chip
(Harbison et al., 2004)).
Optimization of the scanning method and threshold
To find the optimal scanning method and threshold we compared two different
methods for scoring putative instances of a DNA motif (binding sites):
1. Max – maximum log-likelihood scores over all possible positions along the
promoter, where the log likelihood ratio score is the ratio between the probability
of an individual K-mer within the promoter given the motif model and its
probability in the background distribution of nucleotides across all promoters
(Stormo, 2000).
2. Sum - Summing the likelihood scores over all possible positions on the promoter
(Tanay, 2006):
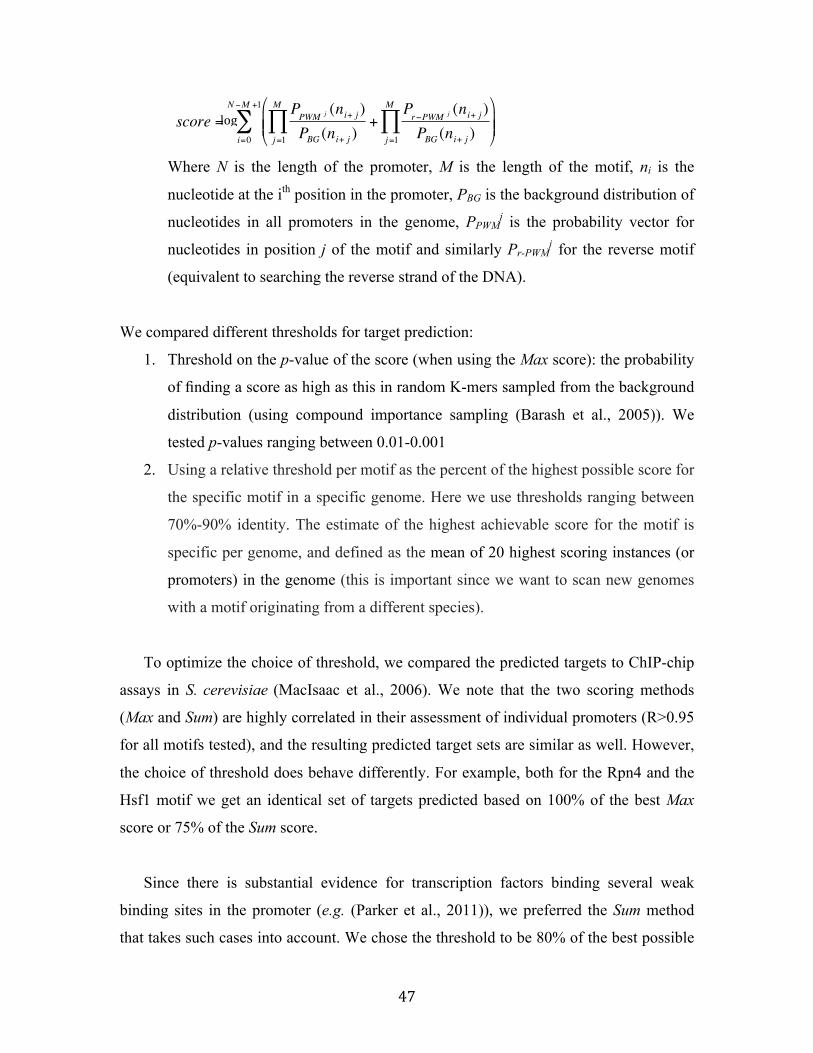
47
Where N is the length of the promoter, M is the length of the motif, ni is the
nucleotide at the ith position in the promoter, PBG is the background distribution of
nucleotides in all promoters in the genome, PPWMj is the probability vector for
nucleotides in position j of the motif and similarly Pr-PWMj for the reverse motif
(equivalent to searching the reverse strand of the DNA).
We compared different thresholds for target prediction:
1. Threshold on the p-value of the score (when using the Max score): the probability
of finding a score as high as this in random K-mers sampled from the background
distribution (using compound importance sampling (Barash et al., 2005)). We
tested p-values ranging between 0.01-0.001
2. Using a relative threshold per motif as the percent of the highest possible score for
the specific motif in a specific genome. Here we use thresholds ranging between
70%-90% identity. The estimate of the highest achievable score for the motif is
specific per genome, and defined as the mean of 20 highest scoring instances (or
promoters) in the genome (this is important since we want to scan new genomes
with a motif originating from a different species).
To optimize the choice of threshold, we compared the predicted targets to ChIP-chip
assays in S. cerevisiae (MacIsaac et al., 2006). We note that the two scoring methods
(Max and Sum) are highly correlated in their assessment of individual promoters (R>0.95
for all motifs tested), and the resulting predicted target sets are similar as well. However,
the choice of threshold does behave differently. For example, both for the Rpn4 and the
Hsf1 motif we get an identical set of targets predicted based on 100% of the best Max
score or 75% of the Sum score.
Since there is substantial evidence for transcription factors binding several weak
binding sites in the promoter (e.g. (Parker et al., 2011)), we preferred the Sum method
that takes such cases into account. We chose the threshold to be 80% of the best possible
!
score =PPWM j (ni+ j )PBG (ni+ j )j=1
M
" +Pr#PWM j (ni+ j )PBG (ni+ j )j=1
M
"$
% & &
'
( ) )
i=0
N #M +1
*log
48
Sum score (equivalent to ~70% of the Max score, which is similar to the threshold used in
Harbison, et. al.(Harbison et al., 2004)). This is the lowest threshold that still had a high
precision in the predictions. We see that for 75% threshold there is already a big decrease
in accuracy. Additional tests for the effects of lowering this threshold on our predictions
of ancestral targets and assignments of motifs to functional modules are included in
Appendix Notes 1&3.
Species-specific motifs (Step 2)
Our underlying assumption in this step is that the binding specificities of
transcription factors, represented as DNA motifs, are largely conserved, even when their
specific target genes and functional roles may have substantially diverged (Schmidt et al.,
2010; Tuch et al., 2008; Wapinski et al., 2007). We therefore initiate our reconstruction
with DNA motifs for known transcription factors that have been experimentally
determined in model organisms. CladeoScope uses the MEME motif discovery algorithm
(Bailey and Elkan, 1994) on the promoters of the putative targets of each initial motif in
each species, with the initial motif’s consensus sequence as the initialization point to the
algorithm. MEME is parameterized to identify motifs on either strand, of length within
two bases from the input consensus, and it is given the species-specific nucleotide
distributions as background models for learning. Of the top two motifs reported by
MEME, the highest scoring motif in this species is then used to re-scan the species’
genome and to identify a revised set of targets. CladeoScope repeats this process of motif
discovery and rescanning to refine the motif and its target set once; typically the motif is
not altered after the first iteration. To allow more variation in the motifs, we repeat the
process, initializing the refinement with the conserved ancestral targets. This allows us to
find motifs in species where the first iteration did not succeed. CladeoScope chooses the
motif with the highest enrichment score between these iterations.
Phylogenetic reconstruction of ancestral targets (Step 3)
To infer the ancestral motif targets we trace regulatory events across orthologous
loci. CladeoScope handles genes derived from a common ancestor gene in the root of the
phylogeny as related (“orthogroup” in the terminology of (Wapinski et al., 2007)), and
49
defines an orthogroup as a target of a motif if it is predicted as a target in at least one of
the ancestors in the phylogeny. The reconstruction is done using maximum parsimony
(Fitch, 1971) to minimize the number of target gain and loss events along the branches of
the tree. This is done separately for any potential ancestral target gene by a dynamic
programming algorithm. The inputs to the algorithm are (1) the phylogenetic gene trees
for each set of orthologous genes (Wapinski et al., 2007), and (2) a binary classification
denoting whether each gene in the tree is a predicted target of the motif in each species.
This reconstruction accounts for gene duplications and losses, distinguishing a lost gene
from a present gene that is not a target, and operates independently on each paralogous
lineage following gene duplication events, by utilizing gene trees when reconstructing
ancestral targets. Given that most of these species have diverged sufficiently to lose
sequence similarity at the promoters, paralogs will not necessarily be co-targets of a motif
due to spurious conservation of their promoters. Thus, paralogs can be in different motif
target sets in the CladeoScope output.
Phylogenetic filter for noisy motifs and statistical significance (Step 4)
We use phylogenetic conservation within a clade of species as a filter for noisy
predictions of target genes (described above) as well as the DNA motifs themselves.
CladeoScope filters the motifs for each species independently by enrichment of their
putative target genes in that species with ancestral targets in any relevant clade
(Hypergeometric p-value<0.001). Since filtering the motifs (step 4) and the
reconstruction of ancestral targets (step 3) are dependent, we solve this problem by
iterating between the two steps. If any insignificant motifs are found in the clade, the
most insignificant one is removed, and CladeoScope returns to step 3 of reconstructing
the ancestral targets. This filtration per species allows for a motif to be detected in a clade
of species, although it is not functional in a single species but is functional in all other
species in the clade. We then filter the motifs at each clade, requiring that the number of
inferred targets for a motif in the clade’s ancestor be statistically significant (p-
value≤0.005) against the null hypothesis that the targets predicted in the individual
species are independent. We compute an empirical p-value by simulating target sets of
the relevant size for each species in the clade, and reconstructing ancestral targets from
50
these random sets. This process is repeated 1,000 times to estimate the probability of
getting a set of ancestral targets of a certain size or larger by chance. A motif is detectable
in a clade if it has a statistically significant (p-value<0.005) set of ancestral targets in the
clade. Finally, we exclude motifs that are found to be significant only in clade A (sensu-
stricto), since in this clade promoter sequences have not evolved enough for random
occurrences of a motif have a non-trivial chance to be conserved.
2.3.2 Resources for phylogenetic reconstruction in Ascomycota fungi
Gene, promoter annotations and DNA motifs
We acquired the genome sequences and annotations of the 23 Ascomycota species
from the online Fungal Orthogroups (Butler et al., 2009; Cherry et al., 1997; Cliften et al.,
2003; Dietrich et al., 2004; Dujon et al., 2004; Kellis et al., 2004; Kellis et al., 2003)
(Arnaud et al., 2007; Galagan et al., 2005; Rhind et al., 2011b; Wood et al., 2002).
Promoters were defined as the 600 bases upstream from the first codon, truncated at the
neighboring coding sequence. To avoid bias in the motif discovery stage, we filter out
stretches of poly-A or poly-T sequences of 5 bases or longer and poly-A/T sequences
longer than 9 bases and replaced them with poly-N of the same length.
Motifs were assembled from TRANSFAC (Matys et al., 2006), protein
microarrays (Zhu et al., 2009), and previous analysis of ChIP-chip data (MacIsaac et al.,
2006). All motifs were transformed to a Position Weight Matrix (PWM) format (a n×4
matrix, where each i,j cell contains the count of nucleotide j in position i of the motif),
and clustered (using BLiC (Habib et al., 2008)) to unite highly identical motifs.
Species phylogeny
The CladeoScope algorithm, as well as in the Maximum-Likelihood estimators
described above, assume the species phylogeny is known. Thus, to reconstruct the
phylogenetic relationship between the species, we first identified all the orthologous
genes with exactly one copy in each of the species (Wapinski et al., 2007) and aligned
51
their orthologous protein sequences. We concatenated all of these alignments to produce
a meta-alignment of over 300,000 positions. We sampled 10,000 residues from this
alignment, giving us an artificial protein from which we reconstructed the phylogeny
using the PhyML (Guindon et al., 2010) software package with its default parameter
settings. We repeated this process 10 times, rendering the same phylogeny at all branches
except for the post-WGD clade of species, in which C. glabrata and S. castellii were
found to be inverted in some cases. Recent work (Scannell et al., 2006) has shown that it
requires fewer genomic rearrangements to place S. castellii as the outgroup of this clade
and that the longer branch length leading to C. glabrata may be due to increased selective
pressure as it became a pathogenic species. Thus, we fixed the branches at this location of
the tree. In order to re-estimate the branch lengths with this fixed tree topology, we
repeated the same process to construct an artificial protein and ran the SEMPHY software
package (Friedman et al., 2002) to optimize branch lengths with default parameters. We
repeated this process 10 times and found branch length correlations of over 0.99 between
replicates. We then averaged the branch lengths among the 10 replicates to obtain branch
length estimates for the given species phylogeny.
2.3.3 Evaluations of CladeoScope in Ascomycota fungi
Validating CladeoScope’s performance using synthetic data
We generated simulated target sets in extant species for evaluating
CladeoScope’s robustness by evolving targets from an ancestral set of targets using
turnover (gain and loss) rates of target genes, with several variations. First, we used two
types of noise factors: (1) The proportion of erroneous target genes relative to the
species true motif targets (false positives, ranging between 0% and 200% of erroneous
targets within each species set); and (2) The proportion of missing (true) targets not
included in the species motif target set (false negatives, ranging between 0% and 60% of
removed targets from each original species set). Second, we varied the size of the
ancestral target set. Using ancestral motif targets in clade A (Figure 4a): 22 targets of
Hsf1, 198 targets of Mbp1, 297 targets of Fkh1. Third, we varied the degree of targets
52
turnover (the fast turnover is the average frequency measured in clade E (Figure 4a)
over all motifs: Fast Fgain=0.002 Floss=0.3, Medium Fgain=0.0002 Floss=0.03, Slow
Fgain=0.00002 Floss=0.003). Forth, we estimated the gain and loss frequencies for each of
the three motifs in each relevant species directly from the data (as in the Likelihood
Ratio Test described below) (Appendix Note 1). Fifth, we used two topologies of the
species tree: the topology in the sensu-stricto clade (clade A, Figure 4a), and the
asymmetrical topology in the Candida clade (clade E, Figure 4a). Overall, we
considered 960 combinations of these parameters. For each set of parameters, we
executed CladeoScope and calculated sensitivity and specificity measures averaged over
100 independent simulations.
Assessing performance on random motifs
We created random motifs by concatenating randomly sampled positions from all
known motifs from the literature (using all motifs from S. cerevisiae, as described below).
We confirmed that the random motifs we constructed were not similar to any known
motifs, comparing the random motifs to all known motifs using BLiC (Habib et al., 2008).
For each random motif, we scanned for targets in each species (as described above), and
ran CladeoScope to reconstruct the ancestral sets. We then computed an empirical p-
value for each motif in all clades using random targets (as described above).
Assessing CladeoScope’s robustness to parameters and comparison to the literature
We tested CladeoScope’s robustness to variations in different parameters
including (as described in Appendix Note 1): (1) The p-value threshold for detection of a
motif in a species - We ran the algorithm on nine different motifs across all clades, using
seven different thresholds, ranging between 5e-2 and 1e-5, and compared the number of
ancestral targets reconstructed per clade. (2) The p-value threshold for conservation of a
motif in a clade - We tested different p-value thresholds ranging between 0.05 and 0.001,
and compared the number of statistically significant ancestral motifs predicted per clade.
(3) The motif targets detection threshold - We tested three different thresholds (80%,
75% or 70% out of the best score per motif and species). In each case, we compared the
ancestral and species targets determined by CladeoScope to those from in-vivo ChIP-chip
data in S. cerevisiae and four other species (Appendix Note 1).

53
2.3.4 Targets turnover rates and expected number of changes in target genes
For each motif we computed the turnover rate of its target genes based on the
following model. The model treats each pair (motif, gene) as a binary character denoting
whether the gene is a target of the motif or not. We model changes in this character (gain
or loss events) as a stochastic continuous-time Markov process parameterized by motif-
specific rates, one for gain, and another for loss. This model is akin to standard models of
character evolution (Felsenstein, 1981). The rates are expressed in terms of expected
number of events per time unit (tU), where a time unit corresponds to the time in which 1
amino-acid substitution per site is expected on average. The model assumes a constant
turnover rate of targets along the phylogeny, which is reflected by two parameters for
each motif: its gain rate (a) and its loss rate (b), given by the following rate matrix R:
Given this rate matrix we can compute the probabilities for target gain and loss for a
given evolutionary distance t using the following equations:
We use a maximum likelihood estimator to infer the parameters in R for each motif. The
likelihood is computed based on sufficient statistics for each clade relative to its
immediate ancestral clade, including the branch length (t), the observed number of gained
(Ngain), lost (Nloss) and conserved (Ncons) target genes, and the probabilities described
above, as:
The maximum likelihood estimator is found by a gradient descent algorithm using
Matlab’s fminunc function. We assume the tree topology and branch length are known
(see Species phylogeny).
⎟⎟⎠
⎞⎜⎜⎝
⎛
−
−=
bbaa
R
!
P(Gain | t) =a
a + b(1" e"(a+b )t )
!
P(Loss | t) =b
a + b(1" e"(a+b )t )
€
lnLikelihhod(Motif ) =Ngain
b lnP(Gain | t b ) +Nlossb lnP(Loss | t b )
+Nconsb ln(1− P(Loss | t b )) +NnonT arget
b ln(1− P(Gain | t b ))
⎡
⎣ ⎢ ⎢
⎤
⎦ ⎥ ⎥ b∈branches
∑

54
2.3.5 Annotating motifs with functional modules and their evaluation
The functional modules algorithm
To associate motifs with regulatory functions, we cluster functional gene-sets
together by the fraction of associated motif targets shared between them, creating sets of
functional modules containing genes that share functional annotations and are all
ancestral targets of the same regulatory motif in at least one clade.
The method is applied to each motif separately. As input we provide the ancestral
target genes of the motif in each clade, and gene sets of functional annotations from
various sources. In Step 1 (Initialization), we identify all functional annotations enriched
in each set of ancestral targets in each clade using Fisher’s exact test (p < 0.01 after
correction, however the results presented here are robust to various thresholds), and
define a functional module as genes from each enriched category that are ancestral targets
in any clade. In Step 2 (Merge functional modules), we merge modules according to the
fraction of associated motif targets shared between them. In this greedy procedure, we
start from the most enriched module, choose another one that is most highly overlapping
with it (at least 60% gene membership overlap, however the results presented here are
robust to various thresholds) and unite them into a new functional module, eliminating
the two daughter modules from the collection. In Step 3 (Recalculate enrichments), we
recalculate the enrichment of the ancestral targets in each clade with this new functional
module. We repeat Steps 2 and 3 until no further functional modules are merged.
Following the automatic assignment of modules, we manually annotated each functional
module with a biologically meaningful label based on its underlying annotations.
Note that the assignment to functional modules is based on phylogenetic
projection from S. cerevisiae, C. albicans and S. pombe annotations. As a consequence,
the function assignment often cannot distinguish between paralogs. Moreover, in a
previous study of functional evolution (Wapinski, et al, Nature 2007), it was shown that
when it is possible to evaluate such divergence, most paralogs maintain the same
functional category. Thus, we expect some functional modules to be enriched for
55
paralogs (e.g. the Ribosome, due to the massive duplications of genes encoding
ribosomal proteins). This, however, reflects a real phenomenon.
Functional annotation resources
We used functional annotations from several sources. GO annotations (Ashburner
et al., 2000) were assembled from the genome databases of S. cerevisiae (SGD), C.
albicans (CGD), and S. pombe (GeneDB). Other S. cerevisiae-based annotations include
transcription-modules (Segal et al., 2003), MIPS (Mewes et al., 2010), KEGG (Kanehisa
and Goto, 2000; Kanehisa et al., 2006), and mutant phenotypes (Hughes et al., 2000b).
Other S. pombe-based annotations include expression clusters (Chen et al., 2003). We
projected each set of annotations from genes to their orthologs (Wapinski et al., 2007) to
test gene set enrichments across all clade core-sets, as previously described (Wapinski et
al., 2007).
Assessing Robustness of functional modules and their comparison to the literature
To test the robustness of the functional modules, we applied the algorithm with
different parameters and inputs, including (See Appendix Note 3): (1) Enrichment
thresholds for functional modules with motif targets (HyperGeometric p-value threshold
ranging between: 1e-3 and 1e-6). (2) Threshold for merging gene-sets (overlap threshold
ranging between 40% and 75%). (3) Threshold for initial predictions of target genes
(80% or 75% out of the bests score per motif and species).
For each set of parameters we tested several characteristics: (1) The number of
modules; (2) The fit of our Functional Selection Turnover model; (3) The classification
of motifs to functional classes (Functional conservation, Clade specific innovation or
Functional switch), where we examined in detail 18 motifs including those discussed in
this chapter; and (4) Robustness of the functional annotations of motifs by the functional
modules, where we examined in detail 18 motifs including those discussed in this chapter.
In addition, we compared the resulting functional modules to known motif and
transcription factor annotations from the literature in S.cerevisiae (SGD), C.albicans
(CGD) and S.pombe (GeneDB).
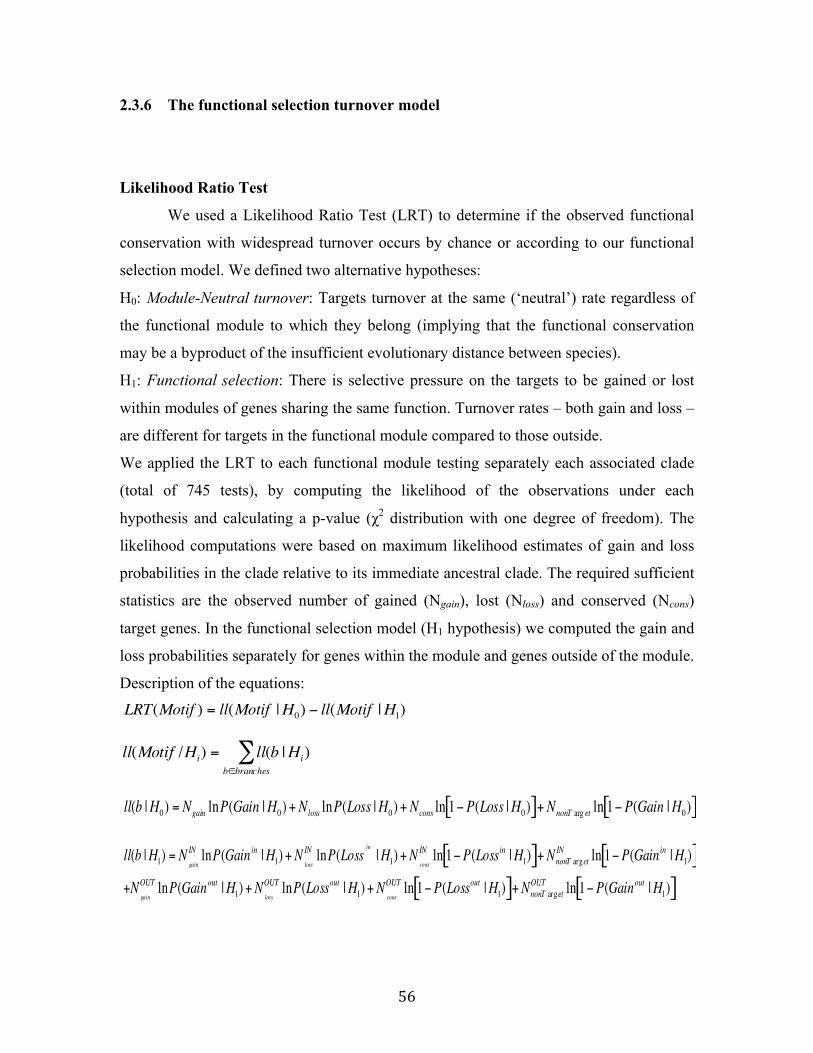
56
2.3.6 The functional selection turnover model
Likelihood Ratio Test
We used a Likelihood Ratio Test (LRT) to determine if the observed functional
conservation with widespread turnover occurs by chance or according to our functional
selection model. We defined two alternative hypotheses:
H0: Module-Neutral turnover: Targets turnover at the same (‘neutral’) rate regardless of
the functional module to which they belong (implying that the functional conservation
may be a byproduct of the insufficient evolutionary distance between species).
H1: Functional selection: There is selective pressure on the targets to be gained or lost
within modules of genes sharing the same function. Turnover rates – both gain and loss –
are different for targets in the functional module compared to those outside.
We applied the LRT to each functional module testing separately each associated clade
(total of 745 tests), by computing the likelihood of the observations under each
hypothesis and calculating a p-value (χ2 distribution with one degree of freedom). The
likelihood computations were based on maximum likelihood estimates of gain and loss
probabilities in the clade relative to its immediate ancestral clade. The required sufficient
statistics are the observed number of gained (Ngain), lost (Nloss) and conserved (Ncons)
target genes. In the functional selection model (H1 hypothesis) we computed the gain and
loss probabilities separately for genes within the module and genes outside of the module.
Description of the equations:
€
LRT(Motif ) = ll(Motif |H0) − ll(Motif |H1)
€
ll(Motif /Hi) = ll(b |Hib∈branches∑ )
€
ll(b |H0) = Ngain lnP(Gain |H0)+Nloss lnP(Loss |H0)+Ncons ln 1− P(Loss |H0)[ ]+NnonT arg et ln 1− P(Gain |H0)[ ]
€
ll(b |H1) = Ngain
IN lnP(Gainin |H1)+Nloss
IN lnP(Lossin|H1) +N
cons
IN ln 1− P(Lossin |H1)[ ]+NnonT argetIN ln 1− P(Gainin |H1)[ ]
+Ngain
OUT lnP(Gainout |H1) +Nloss
OUT lnP(Lossout |H1) +Ncons
OUT ln 1− P(Lossout |H1)[ ]+NnonT argetOUT ln 1− P(Gainout |H1)[ ]

57
The maximum likelihood estimation for the probability of gain and loss of each motif’s
target genes in the current clade C1, compared to the immediate ancestral clade Cp:
Where,
Ntotal = Total number of genes in the genome
TCp= Total number of targets in clade Cp
IN = Genes belonging to the functional module
OUT = Genes not belonging to the functional module
NINtotal = Total number of genes in the functional module
TINCp= Total number of genes in the functional module that are targets in clade Cp
Simulating the number of highly conserved targets
To test whether the number of highly conserved targets is explained by the
functional selection model, we computed the probability of observing the inferred
number of these targets under the functional selection model (the H1 hypothesis defined
in the LRT, above). We then simulated targets in the two sub-clades that share the same
direct ancestral clade, and computed the overlaps between these simulated target sets.
The simulations were initialized with the target set of the ancestral clade, and we
simulated the targets in each sub-clade according to its probability of gain or loss of
target genes, within and outside of the functional module (computed as described above
for the Likelihood Ratio Test, using a maximum likelihood estimator). We repeated this
€
P(Gain |H0) =Ngain
Ntotal −TCp
€
P(Loss |H0) =Nloss
TCp
€
P(GainIN |H1) =N
gain
IN
Ntotal
IN −TCp
IN
€
P(LossIN |H1) =Nloss
IN
TCp
IN
58
process 1,000 times, counting the number of times in which the number of simulated
ancestral targets was equal to or greater than the number observed in our data. We ran the
test on motifs conserved at least up to clade H (29 motifs), and computed these empirical
probabilities of the intersection between the target sets at clade D and clade G. In general,
for two target sets C1 and C2 of clades that share an immediate ancestral clade, we
computed the empirical probability for the number of genes in the intersection between
the two target sets, denoted as Ip:
Where: is the number of simulations where and #simulations
is the total number of simulations (1,000).
Experimental transcription factor binding data
We used Ste12 and Tec1 binding in three closely-related Saccharomyces species
by ChIP-chip (Borneman et al., 2007); Mcm1 binding measured across three more distant
yeast species by ChIP-chip (Tuch et al., 2008); and HNF4α binding measured across
three mammalian species (human, mouse and dog) by ChIP-seq (Schmidt et al., 2010).
For the yeast studies, we used target genes defined in the original manuscripts. For the
mammals, where regulatory elements can reside far from their target genes, we had to
assign each bound regulatory element with the gene(s) it controls. We focused on binding
events in the proximity of the gene, and used five alternative definitions of promoters,
ranging between 1kp to 5kp upstream of the transcription start site (sequences taken from
UCSC genome Browser versions hg19 (Lander et al., 2001), canFam2 (Lindblad-Toh et
al., 2011), mm10 (Waterston et al., 2002)). The specific list of target genes changes when
we modify this parameter, but the fit to the functional turnover model does not.
To find functional modules we conducted the same analysis as described above,
using the target gene enrichments from the individual species instead of the targets at the
clades. For the LRT and simulation tests, we conducted the same analysis as described
€
P(I ≥ Ip ) =#(Isimulated ≥ Ip )# simulations
€
#(Isimulated ≥ Ip )
€
C1∩C2 ≥ Ip

59
above, but comparing targets of each individual species to the ancestral target set of all
three species, defining the highly conserved targets as targets conserved in all three
species. For mammals, we used gene functional annotations from MsigDB (Liberzon et
al., 2011) (Release 3.0).
60
Chapter 3 -
Paternally Induced Transgenerational Environmental
Reprogramming of Metabolic Gene Expression in Mammals
3.1 Introduction
My second focus in this work is on evolution of transcription regulation driven by
epigenetic changes. Specifically, on transgenerational reprogramming of gene expression
by epigenetic inheritance, and the interplay between the environment and such
reprogramming.
3.1.1 Epigenetic Inherence and the Environment
Inheritance of epigenetic regulatory factors, such as DNA methylations,
chromatin modifications and non-coding RNAs can lead to transgenerational
reprograming of gene-expression. Epigenetic inheritance mechanisms are potential
carriers of information about the environment experienced by parents to their offspring
(Jablonka and Lamb, 2007; Jablonka et al., 1995). Theoretical studies imply that
environmental regimes exist for which “carryover” epigenetic memory would be adaptive
(Jablonka and Lamb, 2007; Jablonka et al., 1995). In other words, mechanisms exist that
could allow organisms to “inform” their progeny about prevailing environmental
conditions. Under certain historical circumstances – for example, repeated exposure over
evolutionary time to a moderately toxic environment that persists for tens of generations
– such non-Mendelian information transfer would be adaptive (Jablonka et al., 1995;
Rando and Verstrepen, 2007). Whether or not organisms can inherit characters induced
by ancestral environments has far-reaching implications, and this type of inheritance has
come to be called “Lamarckian” inheritance after the early evolutionary theorist J.
Lamarck. However, there is scant evidence for trans-generational effects of the
environment in mammals.
61
3.1.2 Evidence for Trans-Generational Effects of the Environment
A small number of cases have been described in which phenotype of an organism
differs depending of the environment experienced by the parents. This is most commonly
seen as a maternal effect. In a variety of rodents, information about photoperiod can be
passed on to offspring by mothers, and cross-fostering experiments show that this
information is transmitted in utero (Horton, 2005). In worms, osmotic stress applied in
one generation results in offspring with increased resistance to osmotic stress, but
decreased resistance to anoxia(Frazier and Roth, 2009). In this case, the maternal effect
appears to function via altered sugar metabolism – offspring of osmotically-stressed
worms have less glycogen, but more glycerol, than offspring of unstressed worms. In
human populations, epidemiological data, particularly from the Dutch “Hunger Winter”
of World War II, suggests that children whose mothers went hungry during pregnancy
have significantly increased rates of diabetes, obesity, and cardiovascular disease (Hales
and Barker, 2001; Lumey et al., 2007).
The existence of effects of the maternal environment on phenotype is not
particularly surprising, as the womb is a baby’s first environment – for example, fetal
alcohol syndrome is a phenotypic consequence of excessive maternal alcohol intake, and
conceptually does not require epigenetic information to mediate the phenotype. Thus,
demonstration of multi-generational changes is important in maternal effects to rule out
simple plastic responses of offspring to the in utero environment.
3.1.3 Evidence for Heritable Epigenetic Effects of Environmental Perturbations
Some studies have demonstrated heritable epigenetic effects of environmental
perturbations on offspring. For example, treatment of gestating rat mothers with the
endocrine disruptor vinclozolin results in decreased fertility and behavioral changes in
several generations of offspring (Anway et al., 2005; Crews et al., 2007; Skinner et al.,
2008). The authors suggested that the mechanism for inheritance was induction of
62
changes in cytosine methylation patterns, although genetic alterations to the Y
chromosome were not ruled out. In another study, withholding methyl donors (such as
folate) from pregnant female mice resulted in decreased cytosine methylation across a
transposable element inserted in the agouti gene (Waterland and Jirtle, 2003). While an
effect in the first generation might simply reflect a direct environmental influence, the
altered cytosine methylation profile persisted well beyond the first generation (Cropley et
al., 2006) and was even transmissible through the male germ line. In neither of these
cases is the detailed mechanism of transgenerational heritability understood.
While in principle these effects may be passed through the maternal or paternal
germline, in practice it is quite difficult in females to separate epigenetically heritable
effects from plastic responses of the progeny to its environment. Fathers, on the other
hand, often have very little direct influence on their offspring’s environment, especially
in mice. If the paternal environment affects the progeny, such effects are likely to act
through the germ line. A handful of paternal effects have been documented in the
literature – preconception fasting of male mice has been reported to affect serum glucose
in offspring (Anderson et al., 2006), and epidemiological data from human populations
links hunger in paternal grandfathers to obesity and cardiovascular disease two
generations later (Kaati et al., 2002; Pembrey et al., 2006).
It is therefore of great interest to determine what environmental conditions have
transgenerational effects in mammals, and to characterize the mechanisms that mediate
these effects. To test whether such transgenerational inheritance occurs in mammals, we
carried out a screen for genes and epigenetic modifications in mice that responded to
paternal diet. Relative to the offspring of males fed a control diet, the offspring of males
fed a low-protein diet increased the expression of many genes involved in lipid and
cholesterol biosynthesis, and had increased levels of cholesterol esters, triglycerides, and
free fatty acids, lipids.
63
3.2 Results
3.2.1 Experimental paradigm
Male mice were fed control or low protein diet (11% rather than 20% protein,
with the remaining mass made up with sucrose. While the relevant dietary change in this
experiment could be protein content, sucrose content, fat/protein ratio, etc., for simplicity
we refer to the diet as low protein throughout the text) from weaning until sexual
maturity. They were then mated to females reared on control diet (Figure 19A, 20A).
Fathers were removed after one or two days of mating, limiting their influence on their
progeny to the mating itself. All mothers were maintained on control diet throughout the
course of the experiment. After birth, the offspring were reared with their mothers until
three weeks old, at which point their livers were harvested for RNA isolation. DNA
microarrays were used to profile global gene expression differences in the livers of the
offspring from the two types of crosses.
Testing for differences between 26 matched pairs of mice from the two F1 groups,
we found a significant overabundance of differentially-expressed genes, relative to the
null hypothesis that the parental treatment does not affect offspring (1,595 genes at false
discovery rate – FDR – of 0.001, Figure 20B-C). We also identified a more robust (t-test
with null hypothesis of mean change 0.2, FDR of 0.01) group of 445 genes whose
expression strongly depended on the diet consumed by their fathers (Figure 19B). In our
analysis we focus on this more robust group of genes, however, all the phenomena
described below are true for the larger group as well. These gene expression changes
were observed in 13 (7 low protein, 6 control) litters in experiments spanning several
years, carried out in three different animal facilities. In principle, random factors should
be distributed equally between our two groups given the numbers of offspring examined,
but we directly address a number of potential artifacts nonetheless, including changes in
cell populations, circadian cycle, litter size, order of sacrifice, and cage location.
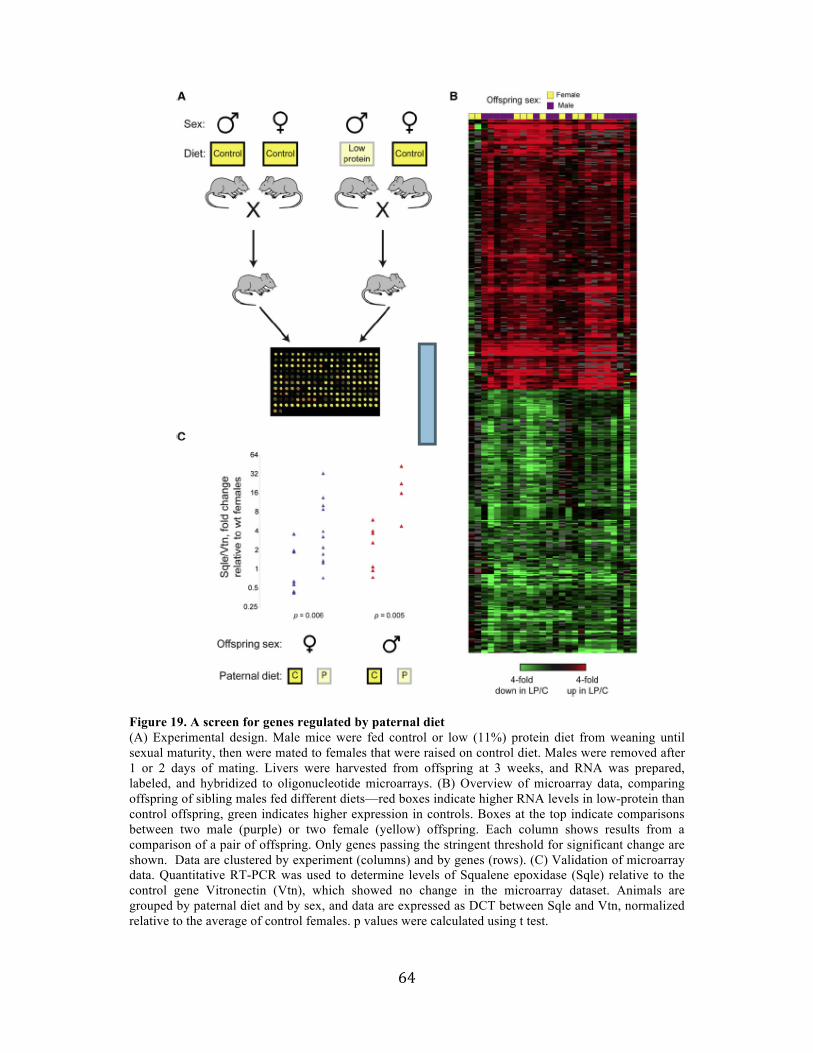
64
Figure 19. A screen for genes regulated by paternal diet (A) Experimental design. Male mice were fed control or low (11%) protein diet from weaning until sexual maturity, then were mated to females that were raised on control diet. Males were removed after 1 or 2 days of mating. Livers were harvested from offspring at 3 weeks, and RNA was prepared, labeled, and hybridized to oligonucleotide microarrays. (B) Overview of microarray data, comparing offspring of sibling males fed different diets—red boxes indicate higher RNA levels in low-protein than control offspring, green indicates higher expression in controls. Boxes at the top indicate comparisons between two male (purple) or two female (yellow) offspring. Each column shows results from a comparison of a pair of offspring. Only genes passing the stringent threshold for significant change are shown. Data are clustered by experiment (columns) and by genes (rows). (C) Validation of microarray data. Quantitative RT-PCR was used to determine levels of Squalene epoxidase (Sqle) relative to the control gene Vitronectin (Vtn), which showed no change in the microarray dataset. Animals are grouped by paternal diet and by sex, and data are expressed as DCT between Sqle and Vtn, normalized relative to the average of control females. p values were calculated using t test.
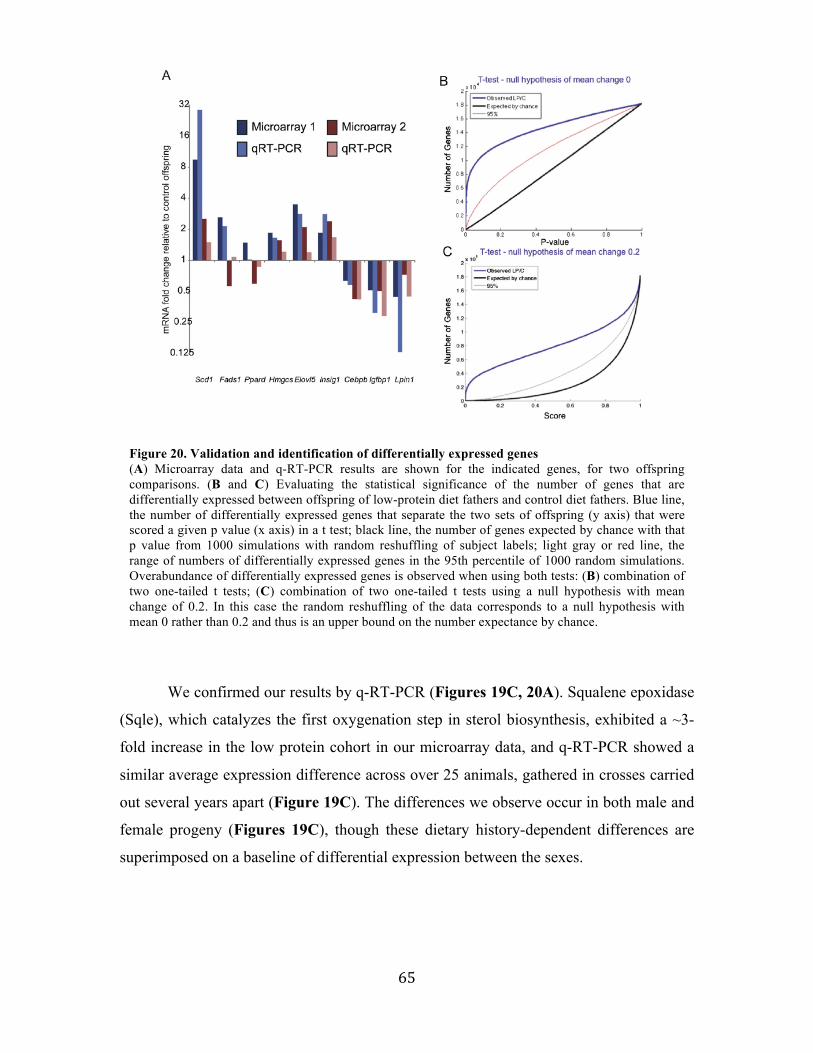
65
We confirmed our results by q-RT-PCR (Figures 19C, 20A). Squalene epoxidase
(Sqle), which catalyzes the first oxygenation step in sterol biosynthesis, exhibited a ~3-
fold increase in the low protein cohort in our microarray data, and q-RT-PCR showed a
similar average expression difference across over 25 animals, gathered in crosses carried
out several years apart (Figure 19C). The differences we observe occur in both male and
female progeny (Figures 19C), though these dietary history-dependent differences are
superimposed on a baseline of differential expression between the sexes.
Figure 20. Validation and identification of differentially expressed genes (A) Microarray data and q-RT-PCR results are shown for the indicated genes, for two offspring comparisons. (B and C) Evaluating the statistical significance of the number of genes that are differentially expressed between offspring of low-protein diet fathers and control diet fathers. Blue line, the number of differentially expressed genes that separate the two sets of offspring (y axis) that were scored a given p value (x axis) in a t test; black line, the number of genes expected by chance with that p value from 1000 simulations with random reshuffling of subject labels; light gray or red line, the range of numbers of differentially expressed genes in the 95th percentile of 1000 random simulations. Overabundance of differentially expressed genes is observed when using both tests: (B) combination of two one-tailed t tests; (C) combination of two one-tailed t tests using a null hypothesis with mean change of 0.2. In this case the random reshuffling of the data corresponds to a null hypothesis with mean 0 rather than 0.2 and thus is an upper bound on the number expectance by chance.
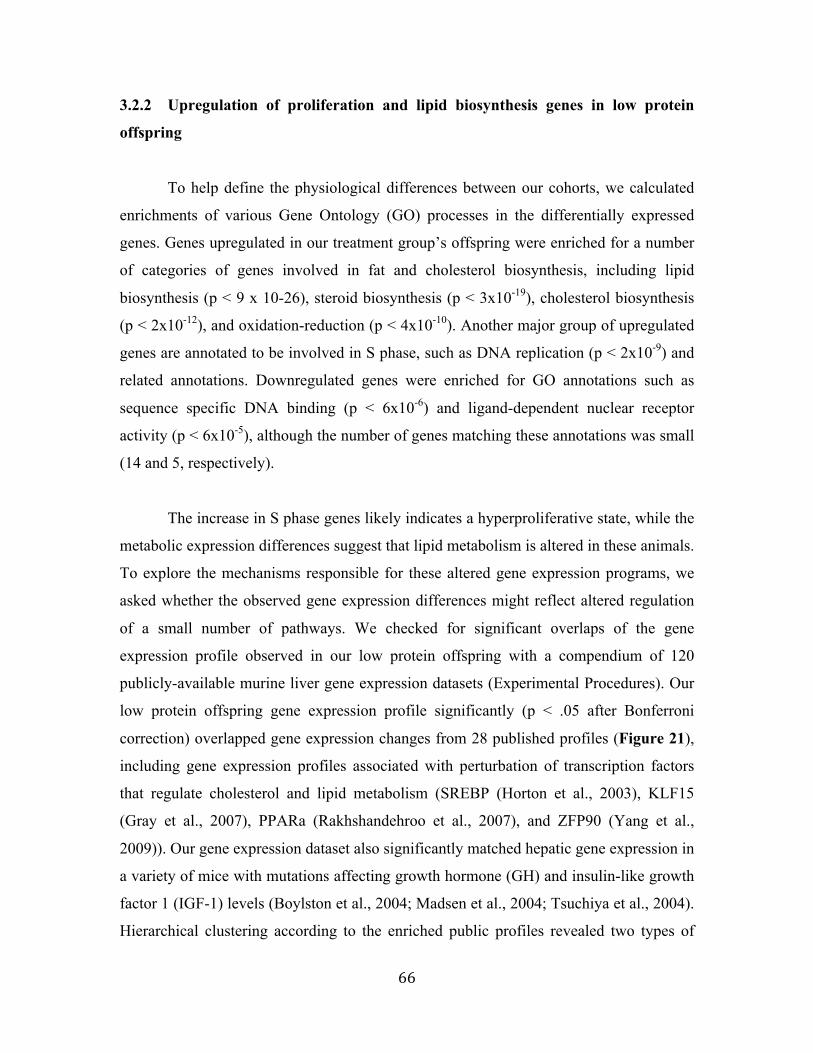
66
3.2.2 Upregulation of proliferation and lipid biosynthesis genes in low protein
offspring
To help define the physiological differences between our cohorts, we calculated
enrichments of various Gene Ontology (GO) processes in the differentially expressed
genes. Genes upregulated in our treatment group’s offspring were enriched for a number
of categories of genes involved in fat and cholesterol biosynthesis, including lipid
biosynthesis (p < 9 x 10-26), steroid biosynthesis (p < 3x10-19), cholesterol biosynthesis
(p < 2x10-12), and oxidation-reduction (p < 4x10⁻¹⁰). Another major group of upregulated
genes are annotated to be involved in S phase, such as DNA replication (p < 2x10⁻⁹) and
related annotations. Downregulated genes were enriched for GO annotations such as
sequence specific DNA binding (p < 6x10⁻⁶) and ligand-dependent nuclear receptor
activity (p < 6x10⁻⁵), although the number of genes matching these annotations was small
(14 and 5, respectively).
The increase in S phase genes likely indicates a hyperproliferative state, while the
metabolic expression differences suggest that lipid metabolism is altered in these animals.
To explore the mechanisms responsible for these altered gene expression programs, we
asked whether the observed gene expression differences might reflect altered regulation
of a small number of pathways. We checked for significant overlaps of the gene
expression profile observed in our low protein offspring with a compendium of 120
publicly-available murine liver gene expression datasets (Experimental Procedures). Our
low protein offspring gene expression profile significantly (p < .05 after Bonferroni
correction) overlapped gene expression changes from 28 published profiles (Figure 21),
including gene expression profiles associated with perturbation of transcription factors
that regulate cholesterol and lipid metabolism (SREBP (Horton et al., 2003), KLF15
(Gray et al., 2007), PPARa (Rakhshandehroo et al., 2007), and ZFP90 (Yang et al.,
2009)). Our gene expression dataset also significantly matched hepatic gene expression in
a variety of mice with mutations affecting growth hormone (GH) and insulin-like growth
factor 1 (IGF-1) levels (Boylston et al., 2004; Madsen et al., 2004; Tsuchiya et al., 2004).
Hierarchical clustering according to the enriched public profiles revealed two types of
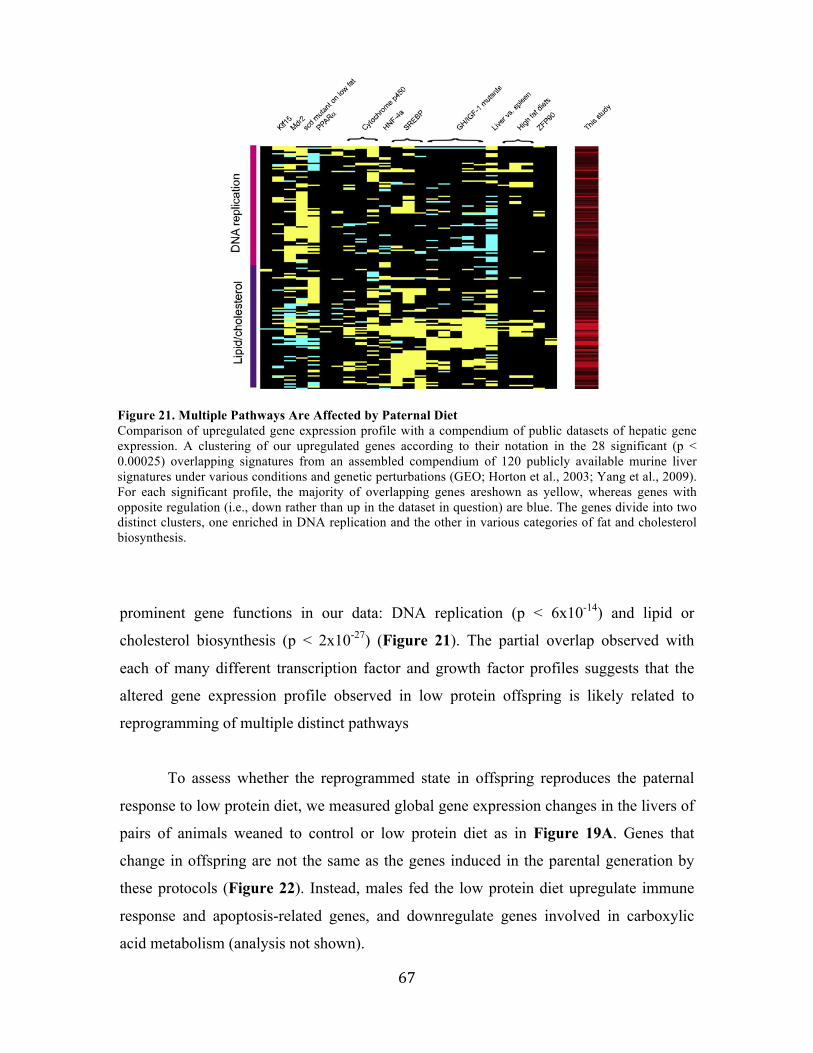
67
prominent gene functions in our data: DNA replication (p < 6x10-14) and lipid or
cholesterol biosynthesis (p < 2x10-27) (Figure 21). The partial overlap observed with
each of many different transcription factor and growth factor profiles suggests that the
altered gene expression profile observed in low protein offspring is likely related to
reprogramming of multiple distinct pathways
To assess whether the reprogrammed state in offspring reproduces the paternal
response to low protein diet, we measured global gene expression changes in the livers of
pairs of animals weaned to control or low protein diet as in Figure 19A. Genes that
change in offspring are not the same as the genes induced in the parental generation by
these protocols (Figure 22). Instead, males fed the low protein diet upregulate immune
response and apoptosis-related genes, and downregulate genes involved in carboxylic
acid metabolism (analysis not shown).
Figure 21. Multiple Pathways Are Affected by Paternal Diet Comparison of upregulated gene expression profile with a compendium of public datasets of hepatic gene expression. A clustering of our upregulated genes according to their notation in the 28 significant (p < 0.00025) overlapping signatures from an assembled compendium of 120 publicly available murine liver signatures under various conditions and genetic perturbations (GEO; Horton et al., 2003; Yang et al., 2009). For each significant profile, the majority of overlapping genes areshown as yellow, whereas genes with opposite regulation (i.e., down rather than up in the dataset in question) are blue. The genes divide into two distinct clusters, one enriched in DNA replication and the other in various categories of fat and cholesterol biosynthesis.
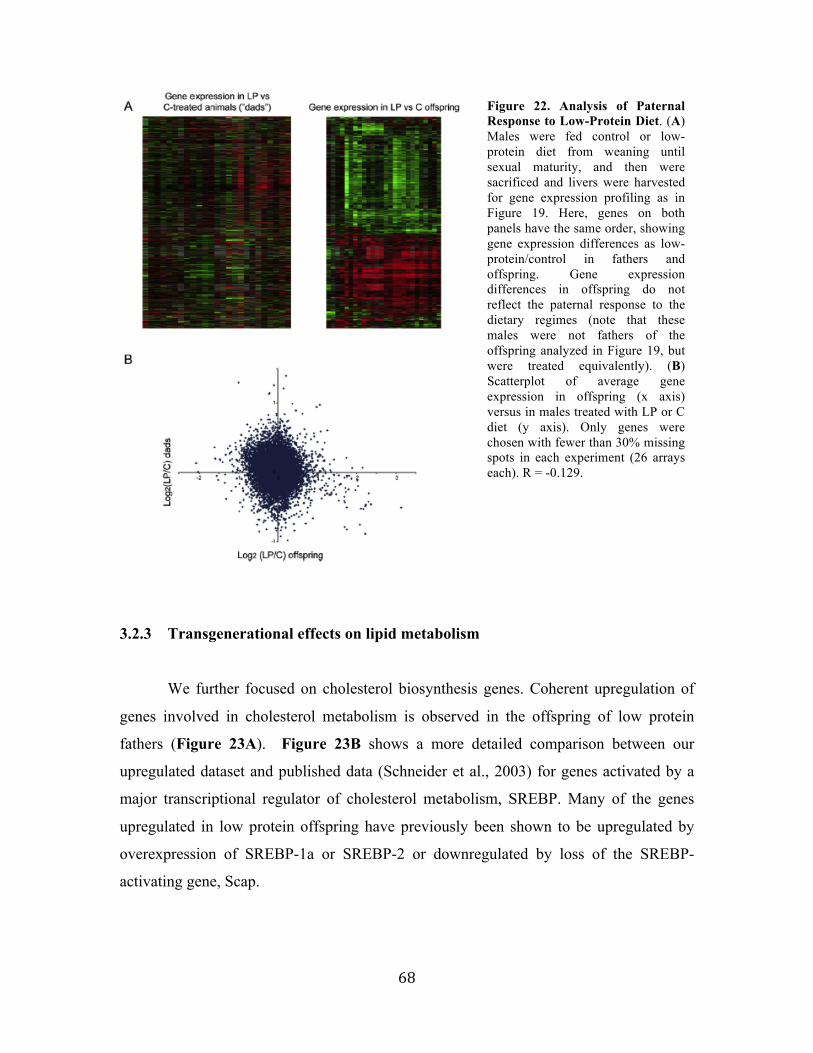
68
3.2.3 Transgenerational effects on lipid metabolism
We further focused on cholesterol biosynthesis genes. Coherent upregulation of
genes involved in cholesterol metabolism is observed in the offspring of low protein
fathers (Figure 23A). Figure 23B shows a more detailed comparison between our
upregulated dataset and published data (Schneider et al., 2003) for genes activated by a
major transcriptional regulator of cholesterol metabolism, SREBP. Many of the genes
upregulated in low protein offspring have previously been shown to be upregulated by
overexpression of SREBP-1a or SREBP-2 or downregulated by loss of the SREBP-
activating gene, Scap.
Figure 22. Analysis of Paternal Response to Low-Protein Diet. (A) Males were fed control or low-protein diet from weaning until sexual maturity, and then were sacrificed and livers were harvested for gene expression profiling as in Figure 19. Here, genes on both panels have the same order, showing gene expression differences as low-protein/control in fathers and offspring. Gene expression differences in offspring do not reflect the paternal response to the dietary regimes (note that these males were not fathers of the offspring analyzed in Figure 19, but were treated equivalently). (B) Scatterplot of average gene expression in offspring (x axis) versus in males treated with LP or C diet (y axis). Only genes were chosen with fewer than 30% missing spots in each experiment (26 arrays each). R = -0.129.
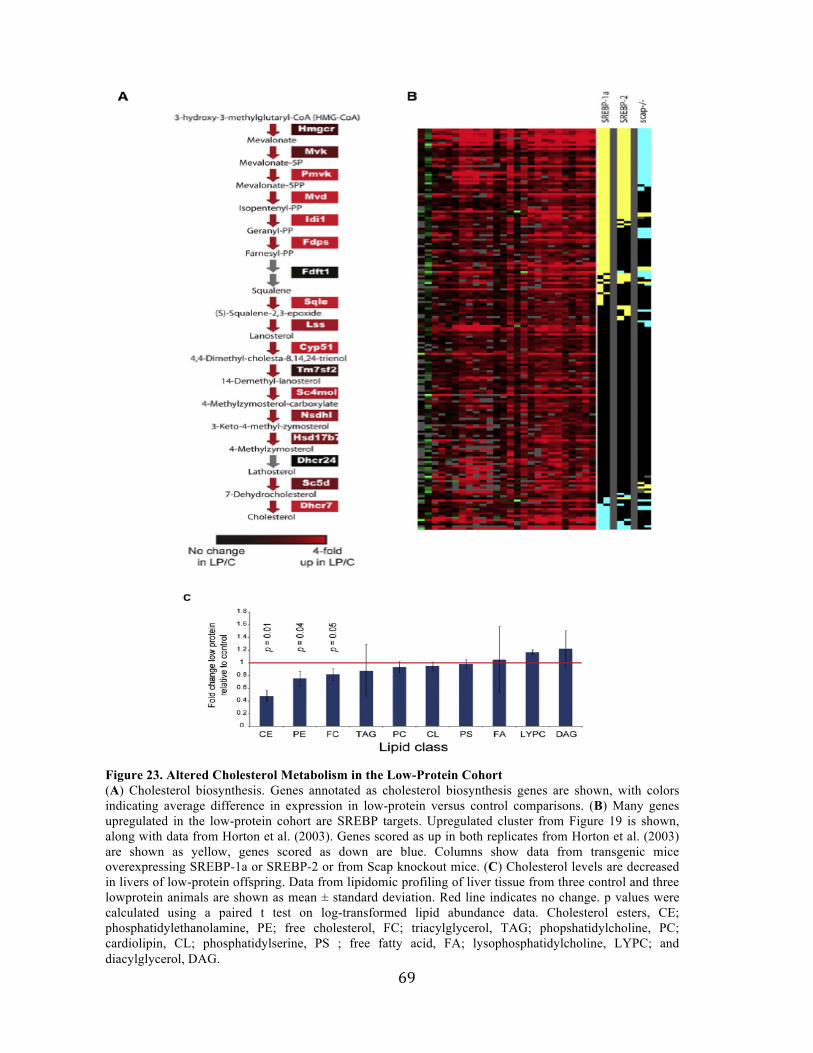
69
Figure 23. Altered Cholesterol Metabolism in the Low-Protein Cohort (A) Cholesterol biosynthesis. Genes annotated as cholesterol biosynthesis genes are shown, with colors indicating average difference in expression in low-protein versus control comparisons. (B) Many genes upregulated in the low-protein cohort are SREBP targets. Upregulated cluster from Figure 19 is shown, along with data from Horton et al. (2003). Genes scored as up in both replicates from Horton et al. (2003) are shown as yellow, genes scored as down are blue. Columns show data from transgenic mice overexpressing SREBP-1a or SREBP-2 or from Scap knockout mice. (C) Cholesterol levels are decreased in livers of low-protein offspring. Data from lipidomic profiling of liver tissue from three control and three lowprotein animals are shown as mean ± standard deviation. Red line indicates no change. p values were calculated using a paired t test on log-transformed lipid abundance data. Cholesterol esters, CE; phosphatidylethanolamine, PE; free cholesterol, FC; triacylglycerol, TAG; phopshatidylcholine, PC; cardiolipin, CL; phosphatidylserine, PS ; free fatty acid, FA; lysophosphatidylcholine, LYPC; and diacylglycerol, DAG.
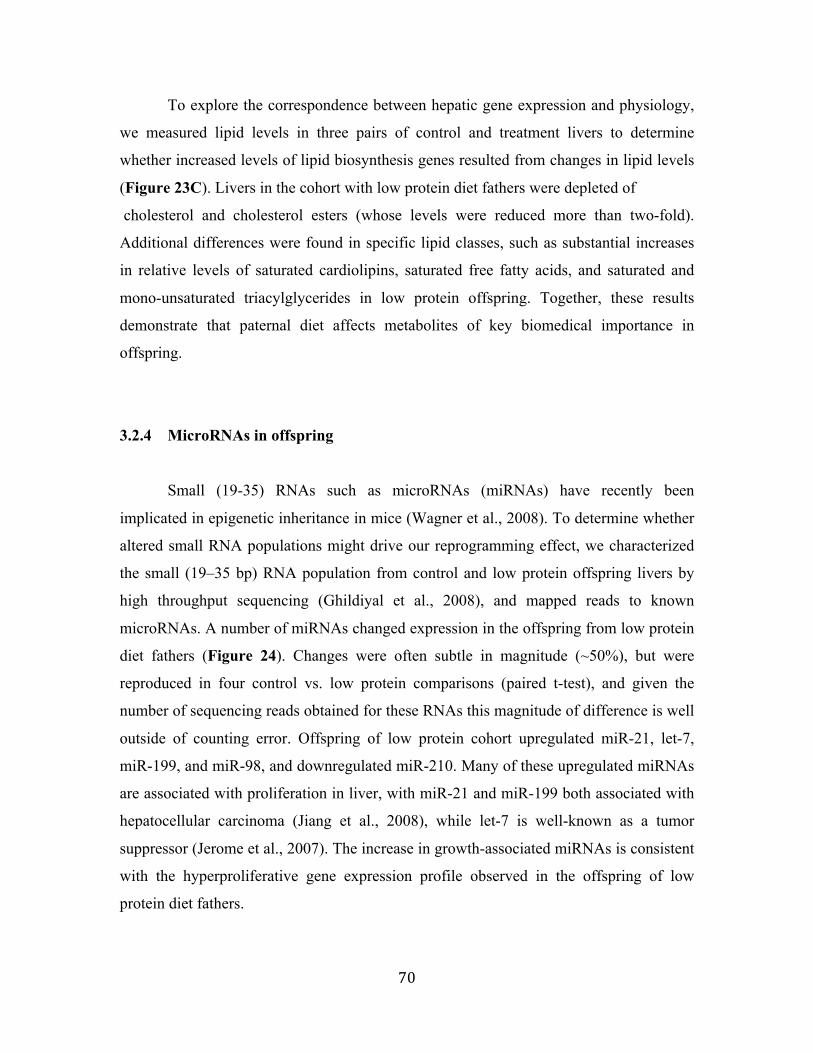
70
To explore the correspondence between hepatic gene expression and physiology,
we measured lipid levels in three pairs of control and treatment livers to determine
whether increased levels of lipid biosynthesis genes resulted from changes in lipid levels
(Figure 23C). Livers in the cohort with low protein diet fathers were depleted of
cholesterol and cholesterol esters (whose levels were reduced more than two-fold).
Additional differences were found in specific lipid classes, such as substantial increases
in relative levels of saturated cardiolipins, saturated free fatty acids, and saturated and
mono-unsaturated triacylglycerides in low protein offspring. Together, these results
demonstrate that paternal diet affects metabolites of key biomedical importance in
offspring.
3.2.4 MicroRNAs in offspring
Small (19-35) RNAs such as microRNAs (miRNAs) have recently been
implicated in epigenetic inheritance in mice (Wagner et al., 2008). To determine whether
altered small RNA populations might drive our reprogramming effect, we characterized
the small (19–35 bp) RNA population from control and low protein offspring livers by
high throughput sequencing (Ghildiyal et al., 2008), and mapped reads to known
microRNAs. A number of miRNAs changed expression in the offspring from low protein
diet fathers (Figure 24). Changes were often subtle in magnitude (~50%), but were
reproduced in four control vs. low protein comparisons (paired t-test), and given the
number of sequencing reads obtained for these RNAs this magnitude of difference is well
outside of counting error. Offspring of low protein cohort upregulated miR-21, let-7,
miR-199, and miR-98, and downregulated miR-210. Many of these upregulated miRNAs
are associated with proliferation in liver, with miR-21 and miR-199 both associated with
hepatocellular carcinoma (Jiang et al., 2008), while let-7 is well-known as a tumor
suppressor (Jerome et al., 2007). The increase in growth-associated miRNAs is consistent
with the hyperproliferative gene expression profile observed in the offspring of low
protein diet fathers.
71
We found no statistically-significant overlap (p > 0.05) between the predicted
targets of the miRNAs here and the gene expression changes we observe, though the
subtle (~50%) changes in miRNA abundance we observe might be expected to have little
effect on mRNA – even when specific miRNAs are artificially introduced in cells,
downregulation of target mRNAs is less than 2-fold for the majority of predicted targets
(Hendrickson et al., 2008). Our results therefore suggest that miRNAs are likely to be
additional targets of the reprogramming pathway, yet are likely not the direct upstream
regulators of the entire response (but see (Yotova et al., 2008)).
3.2.5 Cytosine methylation in offspring
How are offspring reprogrammed by paternal diet? Cytosine methylation is a
widespread DNA modification that is environmentally-responsive, and carries at least
some heritable information between generations (Bartolomei et al., 1993; Cropley et al.,
2006; Holliday, 1987; Rakyan et al., 2003; Waterland, 2003). We performed reduced
Figure 24. Proliferation-Related MicroRNAs Respond to Paternal Diet. Small (<35 nt) RNAs from the livers of eight offspring (four control, four lowprotein) were isolated and subjected to high-throughput sequencing. MicroRNAs that exhibited consistent changes in all four pairs of animals are shown, with average change shown as a bar and individual comparisons shown as points.
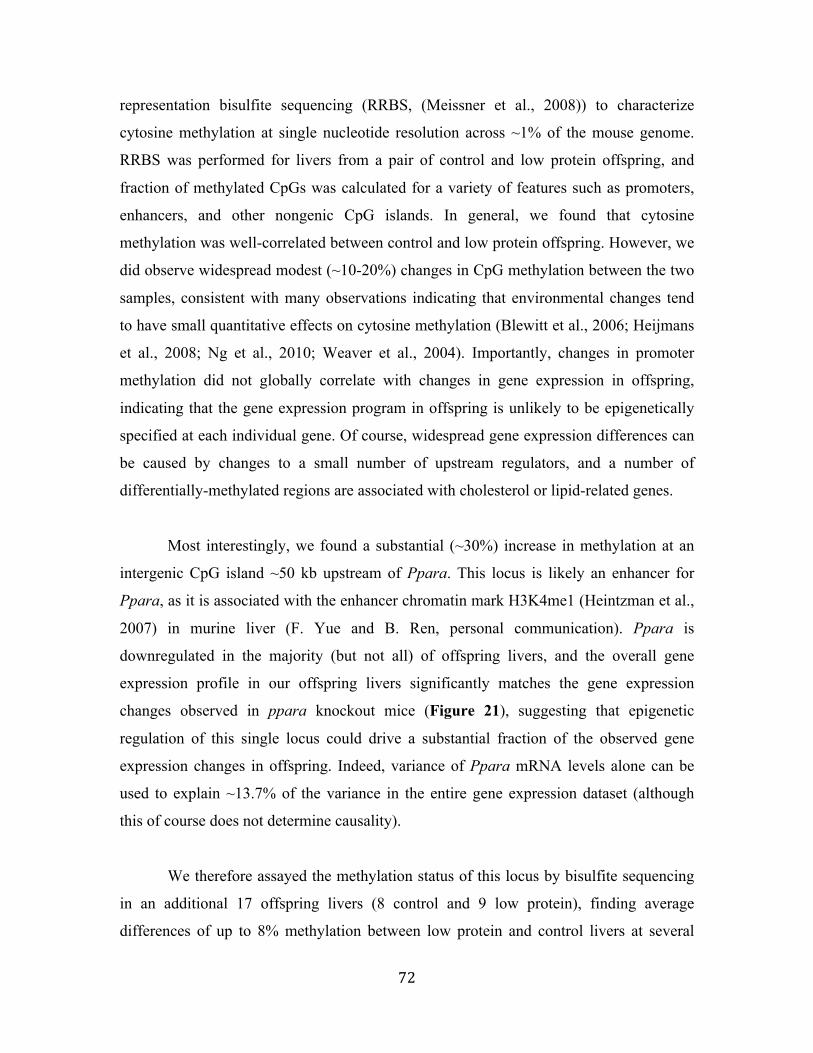
72
representation bisulfite sequencing (RRBS, (Meissner et al., 2008)) to characterize
cytosine methylation at single nucleotide resolution across ~1% of the mouse genome.
RRBS was performed for livers from a pair of control and low protein offspring, and
fraction of methylated CpGs was calculated for a variety of features such as promoters,
enhancers, and other nongenic CpG islands. In general, we found that cytosine
methylation was well-correlated between control and low protein offspring. However, we
did observe widespread modest (~10-20%) changes in CpG methylation between the two
samples, consistent with many observations indicating that environmental changes tend
to have small quantitative effects on cytosine methylation (Blewitt et al., 2006; Heijmans
et al., 2008; Ng et al., 2010; Weaver et al., 2004). Importantly, changes in promoter
methylation did not globally correlate with changes in gene expression in offspring,
indicating that the gene expression program in offspring is unlikely to be epigenetically
specified at each individual gene. Of course, widespread gene expression differences can
be caused by changes to a small number of upstream regulators, and a number of
differentially-methylated regions are associated with cholesterol or lipid-related genes.
Most interestingly, we found a substantial (~30%) increase in methylation at an
intergenic CpG island ~50 kb upstream of Ppara. This locus is likely an enhancer for
Ppara, as it is associated with the enhancer chromatin mark H3K4me1 (Heintzman et al.,
2007) in murine liver (F. Yue and B. Ren, personal communication). Ppara is
downregulated in the majority (but not all) of offspring livers, and the overall gene
expression profile in our offspring livers significantly matches the gene expression
changes observed in ppara knockout mice (Figure 21), suggesting that epigenetic
regulation of this single locus could drive a substantial fraction of the observed gene
expression changes in offspring. Indeed, variance of Ppara mRNA levels alone can be
used to explain ~13.7% of the variance in the entire gene expression dataset (although
this of course does not determine causality).
We therefore assayed the methylation status of this locus by bisulfite sequencing
in an additional 17 offspring livers (8 control and 9 low protein), finding average
differences of up to 8% methylation between low protein and control livers at several
73
CpGs in this locus. Importantly, these pooled data underestimate the potential role of this
locus in reprogramming as they include animals exhibiting a range of changes in Ppara
gene expression – individual animals exhibit differences of up to 30% at various
cytosines across this locus. Taken together, these results identify a differentially-
methylated locus that is a strong candidate to be one of the upstream controllers of the
hepatic gene expression response.
3.2.6 Cytosine methylation, RNA, and chromatin in sperm
To globally investigate effects of paternal diet on sperm cytosine methylation, we
isolated sperm from four males– two consuming control diet, one consuming low protein
diet, and one subjected to a caloric restriction regimen. We then surveyed cytosine
methylation patterns across the entire genome via MeDIP-Seq (immunoprecipitation
using antibodies against 5me-C followed by deep sequencing (Jacinto et al., 2008; Weber
et al., 2005)). Notably, global cytosine methylation profiles were highly correlated
between any pair of samples, indicating that the sperm “epigenome” is largely
unresponsive to these differences in diet. This lead us to consider alternative epigenetic
information carriers including RNA (Rassoulzadegan et al., 2006; Wagner et al., 2008)
and chromatin (Arpanahi et al., 2009; Brykczynska et al., 2010; Hammoud et al., 2009;
Ooi and Wood, 2007).
We analyzed RNA levels for three pairs of males and for two matched epididymis
samples by Affymetrix microarray (Figures 25A). Curiously, low protein and caloric
restriction samples consistently exhibited more “sperm-like” RNA populations (as
opposed to epididymis RNA) than did control samples (Figure 25B). Whether this
reflects systematic contamination issues or biological differences in sperm maturity or
quality is presently unknown, although we note that we confirmed consistently-higher
levels of the sperm-specific Dnahc3 by q-RT-PCR in an additional 7/8 low protein sperm
samples (Figure 25E). We note that control sperm samples were routinely >99.5% sperm
as assayed by microscopy, but nonetheless we cannot completely rule out systematic
74
contamination issues. With this possibility in mind, we identified genes were
differentially-packaged in control vs. low protein sperm by correcting for potential
Figure 25. Effects of Diet on Sperm RNA Content and Chromatin, (A) Sperm RNA populations exhibit expected enrichments. Histogram of average Affymetrix microarray probe intensities for all six sperm samples is shown, with abundant RNAs in sperm exhibiting expected GO enrichments. (B) Sperm from animals consuming low-protein or caloric restriction diets exhibit relative depletion of epididymis-enriched genes, relative to sperm from animals on control diet. Data from 8 Affymetrix microarray analyses are shown. Log-transformed abundance data for each gene was row-normalized (i.e., the average value of each row is zero), and genes with fold change > 1.8 in at least two samples are shown. Thus, the upper half of the cluster shows genes that are relatively abundant in epididymis (red), relatively depleted in low-protein and caloric restriction sperm (green), and of intermediate abundance in control sperm (black/light green). (C) Low-protein sperm are more ‘‘sperm-like’’ than are control sperm. Scatterplot of difference in RNA signal between sperm and epididymis (x axis) versus difference between sperm from one of the pairs of low-protein versus control animals (y axis). Red line shows LOWESS fit between sperm/epididymis and low-protein/control, and red and green dots show genes exhibiting a ‘‘corrected’’ low-protein/control enrichment above or below 1.8-fold. (D) Cluster of corrected sperm RNA changes between two low-protein/control pairs and one caloric restriction/control pair. Genes more abundant in low-protein or caloric restriction sperm exhibit relatively nonspecific GO enrichments, whereas genes depleted in low-protein sperm are enriched for GO annotations including lipid metabolism, regulation of transcription, and organ development. (E) Validation of microarray results. q-RT-PCR was performed for the indicated genes, normalized against Gapdhs, and low-protein/control ratios are shown (±SEM). Microarray values shown are LOWESS-corrected for possible epididymis contamination as in (C). (F) Individual low-protein/control ratios for nine animal pairs used for (E).
75
epididymal contamination (Figures 25B-F). Interestingly, we observed downregulation
of a number of transcription factors and chromatin regulators such as Smarcd3 and Ppard,
although q-RT-PCR validation was not statistically significant due to high inter-animal
variability (Figure 25F).
Although the downregulation of Smarcd3 was not significantly confirmed by q-
RT-PCR, this could reflect the variable penetrance described above. Given that
heterozygous mutants in chromatin remodelers can affect offspring phenotype even when
the mutant allele segregates away (Chong et al., 2007), we used an initial genome-wide
mapping (not shown) of overall histone retention (pan-H3 ChIP) abundance and the key
epigenetic histone modification H3K27me3 in sperm to identify targets for single locus
analysis. We observed a consistent decrease in H3K27me3 in low protein sperm at the
promoter of Maoa (Monoamine oxidase) in 5/5 pairs of sperm samples, and a decrease in
H3K27me3 at Eftud1 in 4/5 paired samples. These results demonstrate proof of principle
that the sperm epigenome is regulated by dietary conditions, although the biological
implications of these observations are not yet clear.
76
3.3 Methods
3.3.1 Experimental procedure for the epigenetic inheritance experiment in mice
The experimental work was led by Prof. Oliver Rando, and were carried out by
various people all acknowledged in Carone et el., 2010. The extended experimental
procedures can be found in the supplementary section of Carone et el.
Mouse husbandry and diets
All experiments were performed with mice which had been raised for at least two
generations on control diet. Male mice were weaned from mothers at 21 days of age, and
sibling males were put into cages with low protein or control diet (moistened with water
to allow mice to break the hard pellets). Females were weaned to control diet. Males were
raised on diet until 9-12 weeks of age, at which point they were placed with females for
one or two days. At three weeks of age offspring were sacrificed, and median lobe of
liver was rapidly dissected out and flash-frozen in liquid N2. Diets were obtained from
Bio-serv, and sterilized per standard protocol.
RNA extraction and Microarray hybridization
Liver samples were ground with a liquid N2-cooled mortar and pestle. Total RNA
for microarray analysis was extracted from liver powder using Trizol. For the microarray
hybridization, 30 mg of total RNA was labeled for 2 hours at 42 C with Superscript II
reverse transcriptase using 4 mg of random hexamer and 4 mg of oligo dT. Cy3 and Cy5-
labeled samples were hybridized to home-printed “MEEBO” microarrays. Microarrays
were hybridized at 65 C for 16 hours, washed as previously described (Diehn et al., 2002),
and scanned using Axon Genepix 4000B microarray scanner.
Lipid measurements, Small RNA cloning and sequencing
For lipid measurements ~50-100 mg of ground liver tissue from six animals (three
paired sets) was sent to Lipomics for “Truemass” mass spectrometry characterization of
450 lipid levels. Total RNA was isolated from ground liver tissue using mirVana
77
(Ambion). 18–35 nt small RNA was purified from 100 µg of total RNA, ligated to
adaptors, amplified, gel-purified, and sequenced using a Solexa Genome Analyzer
(Illumina) (Ghildiyal et al., 2008).
Sperm isolation
Caudal epididymis was dissected from sacrificed animals, punctured, and
incubated for 30 minutes in M2 media at 37 C. Supernatant was removed, pelleted
(10,000g for 10 minutes), and washed 2X with PBS, then 1X in water. Sperm
preparations were only used that were >99.5% pure as assessed by microscopy, and q-
RT-PCR was also used to reject any sperm samples with detectable epididymis-specific
genes Actb or Myh11 compared to sperm-specific genes Smcp or Odf1.
RRBS and MeDIP
Reduced representation bisulfite sequencing (RRBS) was carried out as
previously described (Meissner et al., 2008). Methyl-DNA immunoprecipitation (MeDIP)
was carried out essentially as described (Weber et al., 2005; Weber et al., 2007). 4 mg of
purified genomic DNA was fragmented to a mean size of 300bp using a Covaris machine,
denatured, and immunoprecipitated with 5mC antibody (Eurogentec). ChIP material was
Solexa sequenced, with ~21 million uniquely mappable reads per library.
3.3.2 Micro-Arrays data processing and differentially expressed genes in the liver
Array features were filtered using the autoflagging feature. The remaining
features for each array were then block normalized by calculating the average net signal
intensity for each channel in a given block, and then taking the product of this average
and the net signal intensity for each filtered array feature in the block. Afterwards, all
block-normalized array features were normalized using a global average net signal
intensity as the normalization factor (Liu et al., 2005).
Differential genes were determined based on a t-test, at FDR correction of 0.001 (Figure
20B). The second more stringent set of differential genes was determined using a
78
combination of two one-tailed t-test, testing for genes with mean fold change
significantly higher than 0.2 or lower than -0.2, at FDR correction of 0.01 (Figure 20C).
Enrichment of differential genes observed in our low protein offspring and of the two
distinct cluster of up regulated genes (described above) with GO categories was
computed using the Hyper-Geometric p-value ≤ 0.05 after Bonferoni correction for
multiple hypothesis testing.
3.3.3 MicroRNA identification from deep sequencing data and analysis
Deep sequencing reads where mapped to the mouse genome (July 2007 assembly
of the mouse genome - mm9, NCBI Build 37, (Waterston et al., 2002)), where at least the
first 18 bases of the read matches to the genome and the remainder matches to the 3ʹ′
adaptor sequence. In this mapping we allow up to 2 mismatched positions. Reads that had
six or more matching locations in the genome were discarded. We retained reads with
five or less matches to allow situations of micro-RNA families with highly similar
sequence. We then cluster the mapped locations from all lanes to find “islands” of close
location with a gap of less than 100 bases. Each island is a putative small RNA gene. We
filter out islands that contain less than 10 mapped reads or are represented by less than 3
different unique read sequences. Determining the differentially expressed small RNAs
(islands) was done using a paired t-test comparing pairs of lanes corresponding to age and
sex-matched low protein and control offspring. We tested for islands with mean log2 fold
change significantly higher than the null hypothesis of 0.2 or lower than -0.2.
MicroRNAs were identified using the known locations of microRNAs in the
genome. Novel microRNAs were predicted using a modified version of the MirDeep
package (Friedlander et al., 2008). The first stage of the prediction in which we
identifying the candidate precursors was based on the mapping to the genome and
clustering to islands described above. The rest of the prediction stages where done as in
(Friedlander et al., 2008) using the MirDeep package. Briefly, this procedure selects
islands that the position and frequency of the sequenced reads are compatible with the
79
secondary structure of the miRNA precursor. We predict an island is a microRNA if it
has a prediction score above 0. Prediction of miRNA targets were taken from the
TargetScan (Friedman et al., 2009) database (Release 4.2), and were then checked for
enrichment in differentially expressed genes using the Hyper-Geometric p-value.
3.3.4 Comparison to public murine liver microarray data
We built a compendium of public microarray data consisting of 120 gene-
expression profiles in the murine liver under various conditions and genetic perturbations.
To build this compendium we retrieved 113 datasets from GEO
(http://www.ncbi.nlm.nih.gov/projects/geo/), manually chose the relevant labels for
comparison, and created signatures of differentially expressed genes. The signatures
where determined using a combination of two one-tailed t-test, with FDR correction of
0.1. In addition, we added further published sets of differentially-expressed genes
(Horton et al., 2003; Yang et al., 2009) to the compendium. Expression-profiles
significantly enriched with up or down regulated genes in our low protein offspring, were
defined by a Hyper-Geometric p-value <= 0.05 after bonferoni correction for multiple
hypotheses (p<0.00025). In this enrichment test we included only genes which were
measured both in our expression arrays and in at least one other public murine liver
profile. Our up regulated set of genes was clustered according to their overlap with the
significantly enriched signatures, using a hierarchical clustering algorithm (with default
parameters, (de Hoon et al., 2004; Eisen et al., 1998)).
While most of the overlaps described in Figure 21 are with gene expression
measured upon perturbation of transcription factor activity, for HNF-4a not only do our
differential genes significantly overlap those genes affected by a deletion of this factor (p
< 4 x 10⁻⁶), but our differentially-expressed genes were also significantly enriched for
genes previously shown to be directly bound by HNF-4a (Odom et al., 2007) (p < 0.01,
data not shown).
80
3.3.5 Percent variance explained by Ppara RNA levels
We performed PVE (percent variance explained) analysis to determine how much
of the overall gene expression profile is explained by Ppara. In this analysis we learn for
each gene a linear prediction based on the Ppara expression values (standard linear-
regression in Matlab), and then compare the gene's variance in expression across samples
(Vtotal), to the variance after we remove the prediction (Vpred). The PVE is the percent
of the total variance (without prediction) explained by the prediction, or in formula
100*(1 - Vpred/Vtotal). Note that this does not determine whether Ppara is causal for the
genes that it “explains”, as Ppara could be part of a regulon with the genes it correlates
with.
3.3.6 Analysis of sperm RNA data
We first normalized the eight Affymetrix arrays using rmasummary method in
Matlab (RMA normalization for the probe intensity and quantile normalization between
arrays). We computed log-ratio values per gene in the six sperm RNA arrays, using
matched pairs of low-protein diet compared to control diet arrays (2 pairs), and caloric-
restriction diet compared to control diet (1 pair). To correct the sperm data for possible
contamination by epididymis RNA, we used the two additional epididymal RNA data,
and applied two different methods. In the first method we correct each sperm sample
separately, by learning the maximal possible fraction of epididymal RNA within each
sperm RNA sample (maximization is done by requiring all genes except 2% should have
a non negative expression value after subtracting the epididymal fraction). The resulting
fractions vary between 10%-30%. In the second method we correct each log-ratio value
compared to the log-ratio of sperm RNA and Epididymis RNA (mean values across all
sperm or epididymal samples), by using a standard lowess normalization (malowess
function in Matlab).
81
Chapter 4 - Discussion
The evolution of transcription regulation is a major driving force generating the
wide phenotypic diversity observed across species. Overall in this work I unraveled basic
selection forces underlying this evolutionary process. First, we focused on evolution
driven by random mutations in the DNA sequence, focusing on changes in DNA binding
sites of transcription factors (cis), showing that: (1) The regulatory network of
transcription factors and their target genes is highly plastic. (2) The transcription factors
tend to conserve their functions. (3) A functional selection turnover model can reconcile
these two trends, unlike traditional gene-centered models. Second, we focused on
epigenetic inheritance mechanism, directly affected by previous parental environmental
exposures. The evidence we present indicates that: (1) Paternal diet affects gene
expression in the offspring of mice. (2) Epigenetic information carriers in sperm respond
to environmental conditions. Each of these studies raises numerous mechanistic questions
(discussed below).
4.1 Robustness in the face of plasticity – cis-regulatory evolution
To study regulatory evolution we applied to 23 Ascomycota species a novel
approach for reconstructing regulatory networks based on cis-elements. Using this
approach, we systematically built regulatory networks from 88 known regulatory DNA
motifs across the 23 species, their conserved target genes in each clade and their
functional annotations. We exploited this resource to study the regulatory history of
specific transcription factors and to reach general principles of regulatory evolution,
relevant to yeasts and mammals. In addition, we established a rich public resource
(http://www.compbio.cs.huji.ac.il/OrthoMotifs/) that will facilitate studies of regulatory
evolution of individual clades or species, including human and plant pathogens.
Our computational pipeline, CladeoScope, provides a major advance toward the
computational reconstruction of cis-regulatory networks across many transcription factors
82
and species - a notoriously challenging problem (Weirauch and Hughes, 2010).
CladeoScope relies on two assumptions. First, it assumes that transcription factor
binding specificities, as reflected in DNA motifs, are largely conserved, even when their
specific targets and functional roles have diverged. Thus, unlike previous approaches
(Gasch et al., 2004; Kellis et al., 2003), CladeoScope does not assume any conservation
of the known motif function or target genes. However, CladeoScope cannot track
transcription factors whose binding specificity has significantly changed (as previously
reported for some transcription factors (Baker et al., 2011; Kuo et al., 2010; Ravasi et al.,
2010; Yvert et al., 2003)). This can be alleviated if more binding profiles are measured in
non-model organisms. Second, we use conservation within a clade to focus on a reliable
set of ancestral targets, improving the quality of the motif-target prediction for each clade.
This minimizes many of the spurious interactions present in inferred cis-regulatory
networks in a single species, while allowing us to trace regulatory divergence between
clades, albeit at the cost of studying species-specific innovations.
While the conservation profiles of most DNA motifs match those of their cognate
transcription factors, 27% of pairs show some discrepancy, more typically in the species
most distant from S. cerevisiae. In some cases, a motif is not detectable despite the
conservation of the related transcription factor (e.g. Zap1). This demonstrates the
limitations of our approach in tracing regulatory evolution when the factor’s binding
specificity has diverged substantially, or when target turnover rate within a clade is very
high. These problems can be partially alleviated by using additional binding profiles from
non-model organisms. In other cases, a motif is detectable but the related transcription
factor is not identified as conserved, due to faulty target predictions, faulty orthology
resolution (e.g. Sko1), or the presence of a family of related transcription factors with
very similar binding specificities (e.g. the CBF1 family).
We find and quantify a pervasive gain and loss of motif targets at high
evolutionary rates. The high turnover rates that we estimate from data for all motifs
(average ~7% expected conserved targets from the LCA of the phylum, Figure 11a) are
reflected by the small number of highly conserved targets, and by the complete switch of
83
targets for 72% of motifs in at least one point in the phylogeny. These high turnover rates
generalize previous binding studies of few individual transcription factors across three
yeast species (Borneman et al., 2007; Tuch et al., 2008), four flies (Bradley et al., 2010;
Moses et al., 2006) and five mammals (Schmidt et al., 2010).
The seemingly contradictory trends of a broad conservation of the functions
associated with a motif, and the pervasive gain and loss of the motif in individual targets
within the module are reconciled by our proposed Functional Selection Turnover Model,
implying that it is a general principle of regulatory evolution. Such conservation of a
transcription factor’s cellular function but high turnover of its individual targets was
previously indirectly implicated in the comparison of cell cycle genes between two yeast
species (S. cerevisiae and S. pombe) (de Lichtenberg et al., 2007) and for liver-specific
transcription factors across five vertebrates (Schmidt et al., 2010). Our analysis suggests
that it is a broad and general phenomenon and our model shows that it can be explained
by a strong selection to conserve the function of the motif, but a weaker selection over
the specific target genes within this function. This evolutionary model accounts for
patterns of turnover from direct measurements of transcription factors across individual
species in yeast and mammals, suggesting that the same principle applies at different
evolutionary distances, measurement methods, phylogenetic resolution (clades and
species), and remote phyla.
There are several alternative potential explanations for the observed conservation
of regulatory function despite high target turnover. First, determination of transcription
factor targets based on cis-regulatory elements (rather than on limited experimental ChIP
data) is challenging and noisy (Gasch et al., 2004; Tanay et al., 2005; Wohlbach et al.,
2009), resulting in many false positives and false negatives, which may lead to low
overlap in target genes between species. To exclude this option we compared
evolutionarily conserved target genes at the clade level instead of target genes for
individual species. Second, the transcription factor may target additional genes in some
species, thus expanding the scope of functions it regulates, as has been previously shown
in yeasts for various factors, such as Mcm1 (Tuch et al., 2008). Although we detect such
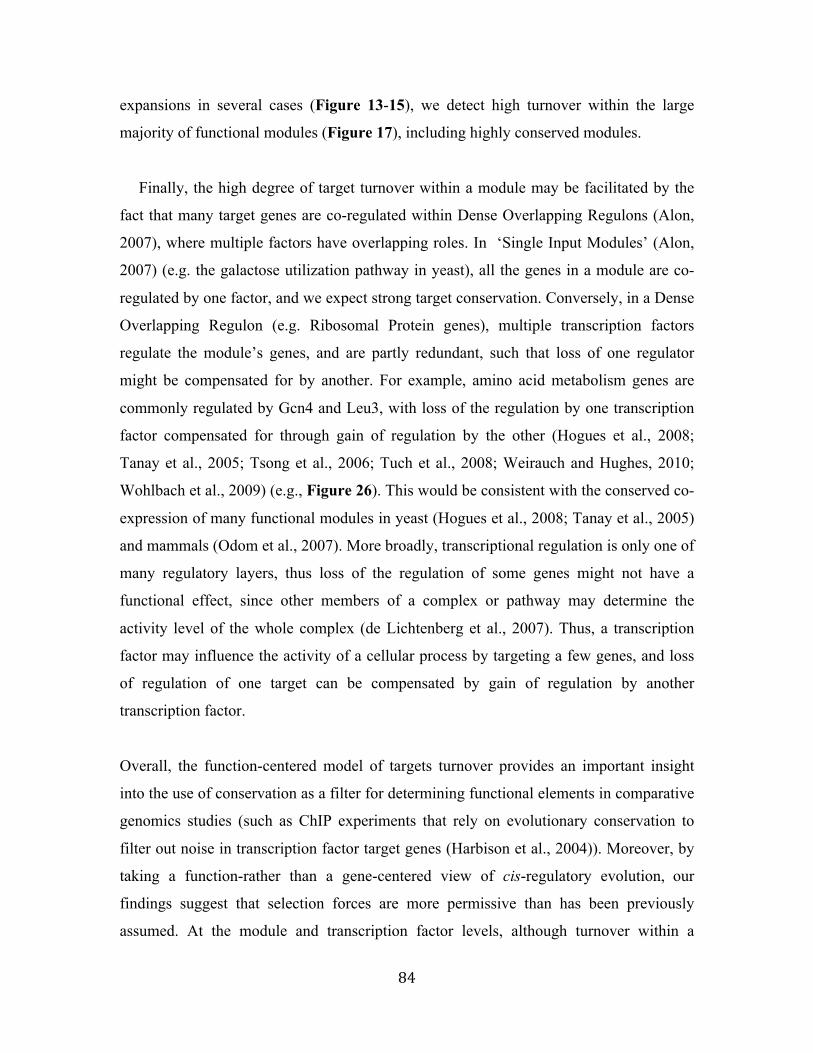
84
expansions in several cases (Figure 13-15), we detect high turnover within the large
majority of functional modules (Figure 17), including highly conserved modules.
Finally, the high degree of target turnover within a module may be facilitated by the
fact that many target genes are co-regulated within Dense Overlapping Regulons (Alon,
2007), where multiple factors have overlapping roles. In ‘Single Input Modules’ (Alon,
2007) (e.g. the galactose utilization pathway in yeast), all the genes in a module are co-
regulated by one factor, and we expect strong target conservation. Conversely, in a Dense
Overlapping Regulon (e.g. Ribosomal Protein genes), multiple transcription factors
regulate the module’s genes, and are partly redundant, such that loss of one regulator
might be compensated for by another. For example, amino acid metabolism genes are
commonly regulated by Gcn4 and Leu3, with loss of the regulation by one transcription
factor compensated for through gain of regulation by the other (Hogues et al., 2008;
Tanay et al., 2005; Tsong et al., 2006; Tuch et al., 2008; Weirauch and Hughes, 2010;
Wohlbach et al., 2009) (e.g., Figure 26). This would be consistent with the conserved co-
expression of many functional modules in yeast (Hogues et al., 2008; Tanay et al., 2005)
and mammals (Odom et al., 2007). More broadly, transcriptional regulation is only one of
many regulatory layers, thus loss of the regulation of some genes might not have a
functional effect, since other members of a complex or pathway may determine the
activity level of the whole complex (de Lichtenberg et al., 2007). Thus, a transcription
factor may influence the activity of a cellular process by targeting a few genes, and loss
of regulation of one target can be compensated by gain of regulation by another
transcription factor.
Overall, the function-centered model of targets turnover provides an important insight
into the use of conservation as a filter for determining functional elements in comparative
genomics studies (such as ChIP experiments that rely on evolutionary conservation to
filter out noise in transcription factor target genes (Harbison et al., 2004)). Moreover, by
taking a function-rather than a gene-centered view of cis-regulatory evolution, our
findings suggest that selection forces are more permissive than has been previously
assumed. At the module and transcription factor levels, although turnover within a
85
module may not affect the overall regulatory role of a factor, it may allow for more subtle
fine-tuning of gene regulation, facilitating adaptation while controlling against dramatic
changes in phenotype.
Figure 26. Target turnover and compensatory regulation within a functional module (a) Compensatory regulation by Leu3 and Gcn4 at leucine & isoleucine biosynthesis genes. Shown are selected target genes (rows) and their connection to Leu3 and Gcn4 motifs across the different clades (columns). (b) The position of the target genes in the Leucine-Isoleucine biosynthesis pathway.
Habib et al.
Figure S5
A
B
C
D
E F
G
H
I
J
K
L
a
Gcn4 ancestral target only
Leu3 ancestral target only
Leu3 and Gcn4 regulation of leucine
and isoleucine biosynthesis genes
Non-target
Leu3/Gcn4 ancestral target
Leu1
Leu2
Ilv3
Ilv5
Ilv1
Ilv6
Leu4,9
Leu3
Ilv2
b Leucine and isoleucine biosynthesis pathway
Isoleucine Leucine
Ilv1Ilv2,
Ilv6Ilv5 Ilv3 Bat1 Leu1 Leu2 Bat2
86
4.2 Epigenetic inheritance - Transgenerational environmental reprogramming
of gene expression
To test the existence of transgenerational environmental reprogramming we
developed an experimental system in which we can directly test the effects of paternal
exposures on their offspring, and on the germline. Our results demonstrate that paternal
diet in mice reprograms gene-expression in the offspring and pertrube epigenetic
information carriers in sperm. These results have numerous implications for human
health.
We clearly identify a set of physiological pathways whose expression is sensitive
to paternal diet. Specifically, we find that hepatic expression of genes involved in
proliferation and cholesterol biosynthesis can be regulated by paternal diet, and these
changes are reflected in levels of several lipid metabolites. Combined with data showing
that offspring glucose levels are affected by paternal fasting in mice (Anderson et al.,
2006), these results demonstrate that paternal diet has wide-ranging effects on the
metabolism of offspring in rodents. Interestingly, a very recent study from Ng et al (Ng et
al., 2010) reported that chronic exposure of male rats to high fat diet was associated with
pancreatic beta cell dysfunction in female offspring. It will naturally be of great interest
in the near future to compare the transgenerational effects of high fat and low protein
diets, although one clear difference is that in our system a transgenerational effect is
observed in both sex offspring. Whether the effects we observe on cholesterol
metabolism prove advantageous in low protein conditions remains to be tested, but it will
be important to investigate ecologically-relevant diets in order to speculate more firmly
about adaptive significance of any observed transgenerational effects. For example, at
present we cannot say with certainty what aspect of the low protein regimen is sensed by
males – it is possible that offspring metabolism is affected by overall protein
consumption, or high sucrose, or fat/protein ratio, or even levels of micronutrients, as our
males consumed diets ad libitum and thus might have over consumed the low protein diet.
87
What is the mechanistic basis for the reprogrammed gene expression state?
Genome-scale analyses of cytosine methylation in offspring livers identified several
lipid-related genes that were differentially-methylated depending on paternal diet. Most
notably, a putative enhancer for a major lipid regulator, PPARa, exhibited generally
higher methylation in low protein offspring than in control offspring. Methylation at this
locus was variable between animals, consistent with the partial penetrance of Ppara
down-regulation in our data. The overall gene expression profile observed in low protein
offspring significantly overlaps gene expression changes observed in ppara-/- mice
(Rakhshandehroo et al., 2007), leading to the hypothesis that epigenetic Ppara
downregulation via enhancer methylation is an upstream event that affects an entire
downstream regulon in reprogrammed animals. Note that while the hepatic
downregulation of Ppara suggests a liver-autonomous epigenetic change, we cannot rule
out that hepatic gene expression changes result from global physiological changes
resulting from downregulation of Ppara in some other tissue. Interestingly, Ppara
expression in liver is also regulated by maternal diet – offspring of female mice
consuming a high fat diet exhibit altered hepatic Ppara expression, with increased
expression at birth but decreased expression at weaning (Yamaguchi et al., 2010).
Together with our data, these results suggest that Ppara is a key nexus that integrates
ancestral dietary information to control offspring metabolism.
Paternal diet could potentially affect offspring phenotype via a number of
different mechanisms. While we focus here on epigenetic inheritance systems, it is
important to note that parental information can also be passed to offspring via social or
cultural inheritance systems (Champagne and Meaney, 2001; Jablonka et al., 1995;
Meaney et al., 2007; Weaver et al., 2004). While such maternally-provided social
inheritance is unlikely in our paternal effect system – males were typically only in
females’ cages for one day – it is known that in some animals females can judge mate
quality and allocate resources accordingly (Pryke and Griffith, 2009), and that seminal
fluid can influence female postcopulatory behavior in Drosophila (Fricke et al., 2008;
Wolfner, 2002). These and other plausible transgenerational information carriers cannot
be excluded at present – ongoing artificial insemination and in vitro fertilization
88
experiments will determine whether sperm carry the relevant metabolic information in
our system.
We focused on the hypothesis that paternal dietary information does indeed reside
in sperm epigenetic information carriers. First, a subset of cytosine methylation patterns
in sperm are known to be heritable (Chong et al., 2007; Cropley et al., 2006; Rakyan et
al., 2003; Waterland and Jirtle, 2003). Second, several reports suggest that RNA
molecules packaged in sperm can affect offspring phenotype (Rassoulzadegan et al.,
2006; Wagner et al., 2008). Third, chromatin structure has been proposed to carry
epigenetic information, as sperm are largely devoid of histone proteins but retain them at
a subset of developmentally-important loci (Arpanahi et al., 2009; Brykczynska et al.,
2010; Chong et al., 2007; Hammoud et al., 2009). Finally, it is conceivable that additional
or novel epigenetic regulators (such as prions) are packaged into sperm, or that sperm
quality is affected by diet, or that genetic changes are directed by the environment
(although it is important to emphasize that inbred mouse strains were used in this study).
Here, we report whole genome characterization of cytosine methylation patterns
and RNA content in sperm obtained from mice maintained on control, low protein, and
caloric restriction diets. Globally, cytosine methylation patterns are similar in all three
conditions, indicating that the sperm epigenome is largely unaffected by these diets.
Nonetheless, changes in relatively few loci can have profound effect in the developing
animal, and our data do not rule out the possibility of inheritance through sperm cytosine
methylation, especially given that MeDIP is unlikely to identify ~10-20% differences in
methylation at a small number of cytosines. Importantly, the putative enhancer of Ppara
was not differentially-methylated in sperm. It will therefore be of great interest in the
future to determine when during development the differential methylation observed in
liver is established, and to identify the upstream events leading to differential methylation
(Blewitt et al., 2006).
Interestingly, we did identify effects of diet on RNA content and chromatin
packaging of sperm. For example, sperm from control animals were consistently depleted
89
of the highly sperm-specific Dnahc3 gene relative to sperm from low protein animals.
We cannot presently determine whether this represents reproducible differences in
contamination, differences in sperm maturity, or something else. Finally, based on our
observation that low protein sperm tended to be depleted of genes encoding a number of
chromatin regulators, we have begun to search for dietary effects on sperm chromatin
structure. Interestingly we found that the Maoa promoter was consistently depleted of the
key Polycomb-related chromatin mark H3K27me3, demonstrating as a proof of concept
that chromatin packaging of the sperm genome is responsive to the environment, and
motivating genome-wide investigation into dietary effects on sperm chromatin. Given the
common behavorial changes observed in other transgenerational inheritance paradigms,
the possibility that H3K27me3 at Maoa affects offspring behavior will be of great future
interest.
These results are likely to be relevant for human disease, because not only is
maternal starvation in humans correlated with obesity and diabetes in children (Lumey et
al., 2007), but, remarkably, limited food in fathers and grandfathers has also been
associated with changed risk of diabetes and cardiovascular disease in grandchildren
(Kaati et al., 2002; Pembrey et al., 2006). Interestingly, in these studies paternal access to
food and disease risk was not associated with disease risk in the next generation, but was
only associated with F2 disease risk. However, it is important to note that the
transgenerational effects of food availability for paternal grandfathers depend on the
exact period during childhood of exposure to rich or poor diets (Pembrey et al., 2006),
whereas our experimental protocol involved continuous low protein diet from weaning
until mating. Thus, future studies are required to define when and how paternal exposure
to a low protein diet affects epigenetic programming of offspring metabolism.
Together, these results suggest rethinking basic practices in epidemiological
studies of complex diseases such as diabetes, heart disease, or alcoholism. We believe
that future environmental exposure histories will need to include parental exposure
histories as well as the exposure histories of the patient, to disentangle induced epigenetic
effects from the currently-sought genetic and environmental factors underlying complex
90
diseases. Our observations provide an inbred mammalian model for transgenerational
reprogramming of metabolic phenotype that will enable dissection of the exposure
history necessary for reprogramming, genetic analysis of the machinery involved in
reprogramming, and suggest a number of specific pathways likely to be the direct targets
of epigenetic reprogramming.
4.3 An extended evolutionary theory
Taken together, our results shed light on two different selection forces driving
evolution of transcription regulation, and emphasize the need for an extended
evolutionary theory, integrating both genetic and non-genetic inheritance (Danchin et al.,
2011; Jablonka et al., 1998; Jablonka and Raz, 2009; Shea et al., 2011).
To understand evolutionary processes inclusively, it is necessary to account for all
forms of inheritance and selection pressures. Specifically, adaptation to the environment
involves changes in the expression pattern of genes, which can be caused by both genetic
and non-genetic inheritance, yet on different time scales. Genetic inheritance involves the
slow process of natural selection and fixation of random mutations, and non-genetic
inheritance involves the direct inheritance of acquired characteristics immediately
effecting the variation in the population (Jablonka et al., 1998). Notably, the evolutionary
implications of epigenetic inheritance mechanisms might be different for unicellular and
multicellular organisms (Shea et al., 2011), and should be accounted for. In the integrated
evolutionary theory (Danchin et al., 2011; Day and Bonduriansky, 2011), variation in
both genetic and non-genetic factors drive evolution, with a strong interplay between
them. In which, the DNA sequence encodes potential epigenetic carriers of information,
such as non-coding RNAs or positions of CpG dinucleotide potentially subjected to DNA
methylations. Moreover, the DNA sequence directs environmental reprograming of these
information carriers, for example, through cis-regulatory elements controlling the
expression of non-coding RNAs in the germline. At the same time, these non-genetic
91
factors can potentially shape the selection landscape on the DNA sequence, affecting for
example the rewiring of regulatory networks.
An example demonstrating such a causal relationship between non-genetic
inheritance and the evolution of the DNA sequence is of nucleosome occupancy in
human sperm. Recent evidence suggests that transmission of paternal nucleosomes and
their modifications influences gene expression in the early embryo (Vavouri and Lehner,
2011). Vavouri and Lehner show that nucleosome retention in human sperm is related to
base composition variation, indicating that chromatin organization in the male germline
may be an important selective pressure on GC-content evolution in mammalian genomes.
Taken more broadly, this example strengthens the hypothesis that a requirement to
propagate paternal epigenetic information to the embryo may be an important selective
pressure on sequence evolution in mammalian genomes. Another example for interaction
between different inheritance mechanisms is of maternal care in rodents (Champagne,
2008). The level of maternal care affects the level of DNA methylation of genes in
offspring’s brain, which is maintained throughout their life, and lowers the level of
maternal care they provide (Champagne, 2008). The extended evolutionary theory,
combining both genetic and non-genetic inheritance and the interplay between them, has
implications for diverse areas, from the question of missing heritability in human
complex-trait genetics (Maher, 2008) to the basis of major evolutionary transitions.
92
References
Abe, H., and Shimoda, C. (2000). Autoregulated expression of Schizosaccharomyces pombe meiosis-‐specific transcription factor Mei4 and a genome-‐wide search for its target genes. Genetics 154, 1497-‐1508. Almer, A., Rudolph, H., Hinnen, A., and Horz, W. (1986). Removal of positioned nucleosomes from the yeast PHO5 promoter upon PHO5 induction releases additional upstream activating DNA elements. Embo J 5, 2689-‐2696. Alon, U. (2007). Network motifs: theory and experimental approaches. Nat Rev Genet 8, 450-‐461. Amit, I., Garber, M., Chevrier, N., Leite, A. P., Donner, Y., Eisenhaure, T., Guttman, M., Grenier, J. K., Li, W., Zuk, O., et al. (2009). Unbiased reconstruction of a mammalian transcriptional network mediating pathogen responses. Science 326, 257-‐263. Anderson, L. M., Riffle, L., Wilson, R., Travlos, G. S., Lubomirski, M. S., and Alvord, W. G. (2006). Preconceptional fasting of fathers alters serum glucose in offspring of mice. Nutrition 22, 327-‐331. Anway, M. D., Cupp, A. S., Uzumcu, M., and Skinner, M. K. (2005). Epigenetic transgenerational actions of endocrine disruptors and male fertility. Science 308, 1466-‐1469. Aravin, A. A., Sachidanandam, R., Bourc'his, D., Schaefer, C., Pezic, D., Toth, K. F., Bestor, T., and Hannon, G. J. (2008). A piRNA pathway primed by individual transposons is linked to de novo DNA methylation in mice. Mol Cell 31, 785-‐799. Arnaud, M. B., Costanzo, M. C., Skrzypek, M. S., Shah, P., Binkley, G., Lane, C., Miyasato, S. R., and Sherlock, G. (2007). Sequence resources at the Candida Genome Database. Nucleic Acids Res 35, D452-‐456. Arpanahi, A., Brinkworth, M., Iles, D., Krawetz, S. A., Paradowska, A., Platts, A. E., Saida, M., Steger, K., Tedder, P., and Miller, D. (2009). Endonuclease-‐sensitive regions of human spermatozoal chromatin are highly enriched in promoter and CTCF binding sequences. Genome Res 19, 1338-‐1349. Ashburner, M., Ball, C. A., Blake, J. A., Botstein, D., Butler, H., Cherry, J. M., Davis, A. P., Dolinski, K., Dwight, S. S., Eppig, J. T., et al. (2000). Gene ontology: tool for the unification of biology. The Gene Ontology Consortium. Nat Genet 25, 25-‐29. Ashe, A., Sapetschnig, A., Weick, E. M., Mitchell, J., Bagijn, M. P., Cording, A. C., Doebley, A. L., Goldstein, L. D., Lehrbach, N. J., Le Pen, J., et al. (2012). piRNAs Can Trigger a Multigenerational Epigenetic Memory in the Germline of C. elegans. Cell 150, 88-‐99. Babu, M. M., Luscombe, N. M., Aravind, L., Gerstein, M., and Teichmann, S. A. (2004). Structure and evolution of transcriptional regulatory networks. Curr Opin Struct Biol 14, 283-‐291. Bailey, T. L., and Elkan, C. (1994). Fitting a mixture model by expectation maximization to discover motifs in biopolymers. Proc Int Conf Intell Syst Mol Biol 2, 28-‐36. Bailey, T. L., and Elkan, C. (1995). The value of prior knowledge in discovering motifs with MEME. Proc Int Conf Intell Syst Mol Biol 3, 21-‐29.
93
Baker, C. R., Tuch, B. B., and Johnson, A. D. (2011). Extensive DNA-‐binding specificity divergence of a conserved transcription regulator. Proc Natl Acad Sci U S A 108, 7493-‐7498. Barash, Y., Elidan, G., Kaplan, T., and Friedman, N. (2005). CIS: compound importance sampling method for protein-‐DNA binding site p-‐value estimation. Bioinformatics 21, 596-‐600. Bartolomei, M. S., Webber, A. L., Brunkow, M. E., and Tilghman, S. M. (1993). Epigenetic mechanisms underlying the imprinting of the mouse H19 gene. Genes Dev 7, 1663-‐1673. Bejerano, G., Lowe, C. B., Ahituv, N., King, B., Siepel, A., Salama, S. R., Rubin, E. M., Kent, W. J., and Haussler, D. (2006). A distal enhancer and an ultraconserved exon are derived from a novel retroposon. Nature 441, 87-‐90. Benfey, P. N., and Chua, N. H. (1990). The Cauliflower Mosaic Virus 35S Promoter: Combinatorial Regulation of Transcription in Plants. Science 250, 959-‐966. Benos, P. V., Bulyk, M. L., and Stormo, G. D. (2002). Additivity in protein-‐DNA interactions: how good an approximation is it? Nucleic Acids Res 30, 4442-‐4451. Bergman, L. W., and Kramer, R. A. (1983). Modulation of chromatin structure associated with derepression of the acid phosphatase gene of Saccharomyces cerevisiae. J Biol Chem 258, 7223-‐7227. Bird, A. (2002). DNA methylation patterns and epigenetic memory. Genes Dev 16, 6-‐21. Blewitt, M. E., Vickaryous, N. K., Paldi, A., Koseki, H., and Whitelaw, E. (2006). Dynamic reprogramming of DNA methylation at an epigenetically sensitive allele in mice. PLoS Genet 2, e49. Borneman, A. R., Gianoulis, T. A., Zhang, Z. D., Yu, H., Rozowsky, J., Seringhaus, M. R., Wang, L. Y., Gerstein, M., and Snyder, M. (2007). Divergence of transcription factor binding sites across related yeast species. Science 317, 815-‐819. Boylston, W. H., Gerstner, A., DeFord, J. H., Madsen, M., Flurkey, K., Harrison, D. E., and Papaconstantinou, J. (2004). Altered cholesterologenic and lipogenic transcriptional profile in livers of aging Snell dwarf (Pit1dw/dwJ) mice. Aging Cell 3, 283-‐296. Bradley, R. K., Li, X. Y., Trapnell, C., Davidson, S., Pachter, L., Chu, H. C., Tonkin, L. A., Biggin, M. D., and Eisen, M. B. (2010). Binding site turnover produces pervasive quantitative changes in transcription factor binding between closely related Drosophila species. PLoS Biol 8, e1000343. Brunskill, E. W., and Steven Potter, S. (2012). RNA-‐Seq defines novel genes, RNA processing patterns and enhancer maps for the early stages of nephrogenesis: Hox supergenes. Dev Biol 368, 4-‐17. Brykczynska, U., Hisano, M., Erkek, S., Ramos, L., Oakeley, E. J., Roloff, T. C., Beisel, C., Schubeler, D., Stadler, M. B., and Peters, A. H. (2010). Repressive and active histone methylation mark distinct promoters in human and mouse spermatozoa. Nat Struct Mol Biol 17, 679-‐687. Bulyk, M. L., Huang, X., Choo, Y., and Church, G. M. (2001). Exploring the DNA-‐binding specificities of zinc fingers with DNA microarrays. Proc Natl Acad Sci U S A 98, 7158-‐7163.
94
Burton, N. O., Burkhart, K. B., and Kennedy, S. (2011). Nuclear RNAi maintains heritable gene silencing in Caenorhabditis elegans. Proc Natl Acad Sci U S A 108, 19683-‐19688. Butler, G., Rasmussen, M. D., Lin, M. F., Santos, M. A., Sakthikumar, S., Munro, C. A., Rheinbay, E., Grabherr, M., Forche, A., Reedy, J. L., et al. (2009). Evolution of pathogenicity and sexual reproduction in eight Candida genomes. Nature 459, 657-‐662. Caceres, M., Lachuer, J., Zapala, M. A., Redmond, J. C., Kudo, L., Geschwind, D. H., Lockhart, D. J., Preuss, T. M., and Barlow, C. (2003). Elevated gene expression levels distinguish human from non-‐human primate brains. Proc Natl Acad Sci U S A 100, 13030-‐13035. Capaldi, A. P., Kaplan, T., Liu, Y., Habib, N., Regev, A., Friedman, N., and O'Shea, E. K. (2008). Structure and function of a transcriptional network activated by the MAPK Hog1. Nat Genet 40, 1300-‐1306. Carone, B. R., Fauquier, L., Habib, N., Shea, J. M., Hart, C. E., Li, R., Bock, C., Li, C., Gu, H., Zamore, P. D., et al. (2010). Paternally induced transgenerational environmental reprogramming of metabolic gene expression in mammals. Cell 143, 1084-‐1096. Champagne, F., and Meaney, M. J. (2001). Like mother, like daughter: evidence for non-‐genomic transmission of parental behavior and stress responsivity. Prog Brain Res 133, 287-‐302. Champagne, F. A. (2008). Epigenetic mechanisms and the transgenerational effects of maternal care. Front Neuroendocrinol 29, 386-‐397. Chen, D., Toone, W. M., Mata, J., Lyne, R., Burns, G., Kivinen, K., Brazma, A., Jones, N., and Bahler, J. (2003). Global transcriptional responses of fission yeast to environmental stress. Mol Biol Cell 14, 214-‐229. Cherry, J. M., Ball, C., Weng, S., Juvik, G., Schmidt, R., Adler, C., Dunn, B., Dwight, S., Riles, L., Mortimer, R. K., and Botstein, D. (1997). Genetic and physical maps of Saccharomyces cerevisiae. Nature 387, 67-‐73. Chong, S., Vickaryous, N., Ashe, A., Zamudio, N., Youngson, N., Hemley, S., Stopka, T., Skoultchi, A., Matthews, J., Scott, H. S., et al. (2007). Modifiers of epigenetic reprogramming show paternal effects in the mouse. Nat Genet 39, 614-‐622. Chua, G., Morris, Q. D., Sopko, R., Robinson, M. D., Ryan, O., Chan, E. T., Frey, B. J., Andrews, B. J., Boone, C., and Hughes, T. R. (2006). Identifying transcription factor functions and targets by phenotypic activation. Proc Natl Acad Sci U S A 103, 12045-‐12050. Cliften, P., Sudarsanam, P., Desikan, A., Fulton, L., Fulton, B., Majors, J., Waterston, R., Cohen, B. A., and Johnston, M. (2003). Finding functional features in Saccharomyces genomes by phylogenetic footprinting. Science 301, 71-‐76. Colot, V., and Rossignol, J. L. (1999). Eukaryotic DNA methylation as an evolutionary device. Bioessays 21, 402-‐411. Costa, F. F. (2007). Non-‐coding RNAs: lost in translation? Gene 386, 1-‐10. Crews, D., Gore, A. C., Hsu, T. S., Dangleben, N. L., Spinetta, M., Schallert, T., Anway, M. D., and Skinner, M. K. (2007). Transgenerational epigenetic imprints on mate preference. Proc Natl Acad Sci U S A 104, 5942-‐5946.
95
Cropley, J. E., Suter, C. M., Beckman, K. B., and Martin, D. I. (2006). Germ-‐line epigenetic modification of the murine A vy allele by nutritional supplementation. Proc Natl Acad Sci U S A 103, 17308-‐17312. Cuzin, F., and Rassoulzadegan, M. (2010). Non-‐Mendelian epigenetic heredity: gametic RNAs as epigenetic regulators and transgenerational signals. Essays Biochem 48, 101-‐106. Danchin, E., Charmantier, A., Champagne, F. A., Mesoudi, A., Pujol, B., and Blanchet, S. (2011). Beyond DNA: integrating inclusive inheritance into an extended theory of evolution. Nat Rev Genet 12, 475-‐486. Davidson, E. H. (2001). Genomic regulatory systems : development and evolution, (San Diego: Academic Press). Day, T., and Bonduriansky, R. (2011). A unified approach to the evolutionary consequences of genetic and nongenetic inheritance. Am Nat 178, E18-‐36. Day, W. H., and McMorris, F. R. (1992). Critical comparison of consensus methods for molecular sequences. Nucleic Acids Res 20, 1093-‐1099. de Hoon, M. J., Imoto, S., Nolan, J., and Miyano, S. (2004). Open source clustering software. Bioinformatics 20, 1453-‐1454. de Lichtenberg, U., Jensen, T. S., Brunak, S., Bork, P., and Jensen, L. J. (2007). Evolution of cell cycle control: same molecular machines, different regulation. Cell Cycle 6, 1819-‐1825. Dermitzakis, E. T., Bergman, C. M., and Clark, A. G. (2003). Tracing the evolutionary history of Drosophila regulatory regions with models that identify transcription factor binding sites. Mol Biol Evol 20, 703-‐714. Diehn, M., Alizadeh, A. A., Rando, O. J., Liu, C. L., Stankunas, K., Botstein, D., Crabtree, G. R., and Brown, P. O. (2002). Genomic expression programs and the integration of the CD28 costimulatory signal in T cell activation. Proc Natl Acad Sci U S A 99, 11796-‐11801. Dietrich, F. S., Voegeli, S., Brachat, S., Lerch, A., Gates, K., Steiner, S., Mohr, C., Pohlmann, R., Luedi, P., Choi, S., et al. (2004). The Ashbya gossypii genome as a tool for mapping the ancient Saccharomyces cerevisiae genome. Science 304, 304-‐307. Doniger, S. W., and Fay, J. C. (2007). Frequent gain and loss of functional transcription factor binding sites. PLoS Comput Biol 3, e99. Dujon, B., Sherman, D., Fischer, G., Durrens, P., Casaregola, S., Lafontaine, I., De Montigny, J., Marck, C., Neuveglise, C., Talla, E., et al. (2004). Genome evolution in yeasts. Nature 430, 35-‐44. Eddy, S. R. (2001). Non-‐coding RNA genes and the modern RNA world. Nat Rev Genet 2, 919-‐929. Eisen, M. B., Spellman, P. T., Brown, P. O., and Botstein, D. (1998). Cluster analysis and display of genome-‐wide expression patterns. Proc Natl Acad Sci U S A 95, 14863-‐14868. Enard, W., Khaitovich, P., Klose, J., Zollner, S., Heissig, F., Giavalisco, P., Nieselt-‐Struwe, K., Muchmore, E., Varki, A., Ravid, R., et al. (2002). Intra-‐ and interspecific variation in primate gene expression patterns. Science 296, 340-‐343. Felsenstein, J. (1981). Evolutionary trees from DNA sequences: a maximum likelihood approach. J Mol Evol 17, 368-‐376.
96
Fitch, W. M. (1971). Toward defining the course of evolution: minimum change for a specified tree topology. Systematic Zoology 20, 406-‐416. Frazier, H. N., 3rd, and Roth, M. B. (2009). Adaptive sugar provisioning controls survival of C. elegans embryos in adverse environments. Curr Biol 19, 859-‐863. Fricke, C., Bretman, A., and Chapman, T. (2008). Adult male nutrition and reproductive success in Drosophila melanogaster. Evolution 62, 3170-‐3177. Friedlander, M. R., Chen, W., Adamidi, C., Maaskola, J., Einspanier, R., Knespel, S., and Rajewsky, N. (2008). Discovering microRNAs from deep sequencing data using miRDeep. Nat Biotechnol 26, 407-‐415. Friedman, N., Ninio, M., Pe'er, I., and Pupko, T. (2002). A structural EM algorithm for phylogenetic inference. J Comput Biol 9, 331-‐353. Friedman, R. C., Farh, K. K., Burge, C. B., and Bartel, D. P. (2009). Most mammalian mRNAs are conserved targets of microRNAs. Genome Res 19, 92-‐105. Galagan, J. E., Calvo, S. E., Cuomo, C., Ma, L. J., Wortman, J. R., Batzoglou, S., Lee, S. I., Basturkmen, M., Spevak, C. C., Clutterbuck, J., et al. (2005). Sequencing of Aspergillus nidulans and comparative analysis with A. fumigatus and A. oryzae. Nature 438, 1105-‐1115. Gasch, A. P., Moses, A. M., Chiang, D. Y., Fraser, H. B., Berardini, M., and Eisen, M. B. (2004). Conservation and evolution of cis-‐regulatory systems in ascomycete fungi. PLoS Biol 2, e398. Ghildiyal, M., Seitz, H., Horwich, M. D., Li, C., Du, T., Lee, S., Xu, J., Kittler, E. L., Zapp, M. L., Weng, Z., and Zamore, P. D. (2008). Endogenous siRNAs derived from transposons and mRNAs in Drosophila somatic cells. Science 320, 1077-‐1081. Gilad, Y., Oshlack, A., Smyth, G. K., Speed, T. P., and White, K. P. (2006). Expression profiling in primates reveals a rapid evolution of human transcription factors. Nature 440, 242-‐245. Gordon, D. B., Nekludova, L., McCallum, S., and Fraenkel, E. (2005). TAMO: a flexible, object-‐oriented framework for analyzing transcriptional regulation using DNA-‐sequence motifs. Bioinformatics 21, 3164-‐3165. Gray, S., Wang, B., Orihuela, Y., Hong, E. G., Fisch, S., Haldar, S., Cline, G. W., Kim, J. K., Peroni, O. D., Kahn, B. B., and Jain, M. K. (2007). Regulation of gluconeogenesis by Kruppel-‐like factor 15. Cell Metab 5, 305-‐312. Groth, A., Rocha, W., Verreault, A., and Almouzni, G. (2007). Chromatin challenges during DNA replication and repair. Cell 128, 721-‐733. Guindon, S., Dufayard, J. F., Lefort, V., Anisimova, M., Hordijk, W., and Gascuel, O. (2010). New algorithms and methods to estimate maximum-‐likelihood phylogenies: assessing the performance of PhyML 3.0. Syst Biol 59, 307-‐321. Guttman, M., Garber, M., Levin, J. Z., Donaghey, J., Robinson, J., Adiconis, X., Fan, L., Koziol, M. J., Gnirke, A., Nusbaum, C., et al. (2010). Ab initio reconstruction of cell type-‐specific transcriptomes in mouse reveals the conserved multi-‐exonic structure of lincRNAs. Nat Biotechnol 28, 503-‐510. Habib, N., Kaplan, T., Margalit, H., and Friedman, N. (2008). A novel Bayesian DNA motif comparison method for clustering and retrieval. PLoS Comput Biol 4, e1000010.
97
Habib, N., Wapinski, I., Margalit, H., Regev, A., and Friedman, N. (2012). A functional selection model explains evolutionary robustness despite plasticity in regulatory networks. Accepted to Mol Sys Biol. Hales, C. N., and Barker, D. J. (2001). The thrifty phenotype hypothesis. Br Med Bull 60, 5-‐20. Hammoud, S. S., Nix, D. A., Zhang, H., Purwar, J., Carrell, D. T., and Cairns, B. R. (2009). Distinctive chromatin in human sperm packages genes for embryo development. Nature 460, 473-‐478. Hannenhalli, S. (2008). Eukaryotic transcription factor binding sites-‐-‐modeling and integrative search methods. Bioinformatics 24, 1325-‐1331. Harbison, C. T., Gordon, D. B., Lee, T. I., Rinaldi, N. J., Macisaac, K. D., Danford, T. W., Hannett, N. M., Tagne, J. B., Reynolds, D. B., Yoo, J., et al. (2004). Transcriptional regulatory code of a eukaryotic genome. Nature 431, 99-‐104. Heijmans, B. T., Tobi, E. W., Stein, A. D., Putter, H., Blauw, G. J., Susser, E. S., Slagboom, P. E., and Lumey, L. H. (2008). Persistent epigenetic differences associated with prenatal exposure to famine in humans. Proc Natl Acad Sci U S A 105, 17046-‐17049. Heintzman, N. D., Stuart, R. K., Hon, G., Fu, Y., Ching, C. W., Hawkins, R. D., Barrera, L. O., Van Calcar, S., Qu, C., Ching, K. A., et al. (2007). Distinct and predictive chromatin signatures of transcriptional promoters and enhancers in the human genome. Nat Genet 39, 311-‐318. Hendrickson, D. G., Hogan, D. J., Herschlag, D., Ferrell, J. E., and Brown, P. O. (2008). Systematic identification of mRNAs recruited to argonaute 2 by specific microRNAs and corresponding changes in transcript abundance. PLoS One 3, e2126. Hoffmann, A., Natoli, G., and Ghosh, G. (2006). Transcriptional regulation via the NF-‐kappaB signaling module. Oncogene 25, 6706-‐6716. Hogues, H., Lavoie, H., Sellam, A., Mangos, M., Roemer, T., Purisima, E., Nantel, A., and Whiteway, M. (2008). Transcription factor substitution during the evolution of fungal ribosome regulation. Mol Cell 29, 552-‐562. Holliday, R. (1987). The inheritance of epigenetic defects. Science 238, 163-‐170. Horton, J. D., Shah, N. A., Warrington, J. A., Anderson, N. N., Park, S. W., Brown, M. S., and Goldstein, J. L. (2003). Combined analysis of oligonucleotide microarray data from transgenic and knockout mice identifies direct SREBP target genes. Proc Natl Acad Sci U S A 100, 12027-‐12032. Horton, T. H. (2005). Fetal origins of developmental plasticity: animal models of induced life history variation. Am J Hum Biol 17, 34-‐43. Hughes, J. D., Estep, P. W., Tavazoie, S., and Church, G. M. (2000a). Computational identification of cis-‐regulatory elements associated with groups of functionally related genes in Saccharomyces cerevisiae. J Mol Biol 296, 1205-‐1214. Hughes, T. R., Marton, M. J., Jones, A. R., Roberts, C. J., Stoughton, R., Armour, C. D., Bennett, H. A., Coffey, E., Dai, H., He, Y. D., et al. (2000b). Functional discovery via a compendium of expression profiles. Cell 102, 109-‐126. Ihmels, J., Bergmann, S., Gerami-‐Nejad, M., Yanai, I., McClellan, M., Berman, J., and Barkai, N. (2005). Rewiring of the yeast transcriptional network through the evolution of motif usage. Science 309, 938-‐940.
98
Isalan, M., Lemerle, C., Michalodimitrakis, K., Horn, C., Beltrao, P., Raineri, E., Garriga-‐Canut, M., and Serrano, L. (2008). Evolvability and hierarchy in rewired bacterial gene networks. Nature 452, 840-‐845. Jablonka, E., and Lamb, M. J. (2007). Precis of Evolution in Four Dimensions. Behav Brain Sci 30, 353-‐365; discusssion 365-‐389. Jablonka, E., Lamb, M. J., and Avital, E. (1998). 'Lamarckian' mechanisms in darwinian evolution. Trends Ecol Evol 13, 206-‐210. Jablonka, E., Oborny, B., Molnar, I., Kisdi, E., Hofbauer, J., and Czaran, T. (1995). The adaptive advantage of phenotypic memory in changing environments. Philos Trans R Soc Lond B Biol Sci 350, 133-‐141. Jablonka, E., and Raz, G. (2009). Transgenerational epigenetic inheritance: prevalence, mechanisms, and implications for the study of heredity and evolution. Q Rev Biol 84, 131-‐176. Jacinto, F. V., Ballestar, E., and Esteller, M. (2008). Methyl-‐DNA immunoprecipitation (MeDIP): hunting down the DNA methylome. Biotechniques 44, 35, 37, 39 passim. Jerome, T., Laurie, P., Louis, B., and Pierre, C. (2007). Enjoy the Silence: The Story of let-‐7 MicroRNA and Cancer. Curr Genomics 8, 229-‐233. Jiang, J., Gusev, Y., Aderca, I., Mettler, T. A., Nagorney, D. M., Brackett, D. J., Roberts, L. R., and Schmittgen, T. D. (2008). Association of MicroRNA expression in hepatocellular carcinomas with hepatitis infection, cirrhosis, and patient survival. Clin Cancer Res 14, 419-‐427. Jones, P. A., and Taylor, S. M. (1980). Cellular differentiation, cytidine analogs and DNA methylation. Cell 20, 85-‐93. Kaati, G., Bygren, L. O., and Edvinsson, S. (2002). Cardiovascular and diabetes mortality determined by nutrition during parents' and grandparents' slow growth period. Eur J Hum Genet 10, 682-‐688. Kanehisa, M., and Goto, S. (2000). KEGG: kyoto encyclopedia of genes and genomes. Nucleic Acids Res 28, 27-‐30. Kanehisa, M., Goto, S., Hattori, M., Aoki-‐Kinoshita, K. F., Itoh, M., Kawashima, S., Katayama, T., Araki, M., and Hirakawa, M. (2006). From genomics to chemical genomics: new developments in KEGG. Nucleic Acids Res 34, D354-‐357. Kellis, M., Birren, B. W., and Lander, E. S. (2004). Proof and evolutionary analysis of ancient genome duplication in the yeast Saccharomyces cerevisiae. Nature 428, 617-‐624. Kellis, M., Patterson, N., Endrizzi, M., Birren, B., and Lander, E. S. (2003). Sequencing and comparison of yeast species to identify genes and regulatory elements. Nature 423, 241-‐254. Khaitovich, P., Enard, W., Lachmann, M., and Paabo, S. (2006). Evolution of primate gene expression. Nat Rev Genet 7, 693-‐702. King, M. C., and Wilson, A. C. (1975). Evolution at two levels in humans and chimpanzees. Science 188, 107-‐116. Koch, C. M., Andrews, R. M., Flicek, P., Dillon, S. C., Karaoz, U., Clelland, G. K., Wilcox, S., Beare, D. M., Fowler, J. C., Couttet, P., et al. (2007). The landscape of histone modifications across 1% of the human genome in five human cell lines. Genome Res 17, 691-‐707.
99
Konopka, G., Bomar, J. M., Winden, K., Coppola, G., Jonsson, Z. O., Gao, F., Peng, S., Preuss, T. M., Wohlschlegel, J. A., and Geschwind, D. H. (2009). Human-‐specific transcriptional regulation of CNS development genes by FOXP2. Nature 462, 213-‐217. Kooistra, S. M., and Helin, K. (2012). Molecular mechanisms and potential functions of histone demethylases. Nat Rev Mol Cell Biol 13, 297-‐311. Kornberg, R. D. (1999). Eukaryotic transcriptional control. Trends Cell Biol 9, M46-‐49. Kuo, D., Licon, K., Bandyopadhyay, S., Chuang, R., Luo, C., Catalana, J., Ravasi, T., Tan, K., and Ideker, T. (2010). Coevolution within a transcriptional network by compensatory trans and cis mutations. Genome Res 20, 1672-‐1678. Lander, E. S., Linton, L. M., Birren, B., Nusbaum, C., Zody, M. C., Baldwin, J., Devon, K., Dewar, K., Doyle, M., FitzHugh, W., et al. (2001). Initial sequencing and analysis of the human genome. Nature 409, 860-‐921. Lavoie, H., Hogues, H., Mallick, J., Sellam, A., Nantel, A., and Whiteway, M. (2010). Evolutionary tinkering with conserved components of a transcriptional regulatory network. PLoS Biol 8, e1000329. Li, N., and Tompa, M. (2006). Analysis of computational approaches for motif discovery. Algorithms Mol Biol 1, 8. Liberzon, A., Subramanian, A., Pinchback, R., Thorvaldsdottir, H., Tamayo, P., and Mesirov, J. P. (2011). Molecular signatures database (MSigDB) 3.0. Bioinformatics 27, 1739-‐1740. Lindblad-‐Toh, K., Garber, M., Zuk, O., Lin, M. F., Parker, B. J., Washietl, S., Kheradpour, P., Ernst, J., Jordan, G., Mauceli, E., et al. (2011). A high-‐resolution map of human evolutionary constraint using 29 mammals. Nature 478, 476-‐482. Liu, C. L., Kaplan, T., Kim, M., Buratowski, S., Schreiber, S. L., Friedman, N., and Rando, O. J. (2005). Single-‐nucleosome mapping of histone modifications in S. cerevisiae. PLoS Biol 3, e328. Liu, X. D., Liu, P. C., Santoro, N., and Thiele, D. J. (1997). Conservation of a stress response: human heat shock transcription factors functionally substitute for yeast HSF. Embo J 16, 6466-‐6477. Liu, X. S., Brutlag, D. L., and Liu, J. S. (2002). An algorithm for finding protein-‐DNA binding sites with applications to chromatin-‐immunoprecipitation microarray experiments. Nat Biotechnol 20, 835-‐839. Lowndes, N. F., Johnson, A. L., Breeden, L., and Johnston, L. H. (1992). SWI6 protein is required for transcription of the periodically expressed DNA synthesis genes in budding yeast. Nature 357, 505-‐508. Lumey, L. H., Stein, A. D., Kahn, H. S., van der Pal-‐de Bruin, K. M., Blauw, G. J., Zybert, P. A., and Susser, E. S. (2007). Cohort profile: the Dutch Hunger Winter families study. Int J Epidemiol 36, 1196-‐1204. MacIsaac, K. D., and Fraenkel, E. (2006). Practical strategies for discovering regulatory DNA sequence motifs. PLoS Comput Biol 2, e36. MacIsaac, K. D., Wang, T., Gordon, D. B., Gifford, D. K., Stormo, G. D., and Fraenkel, E. (2006). An improved map of conserved regulatory sites for Saccharomyces cerevisiae. BMC Bioinformatics 7, 113.
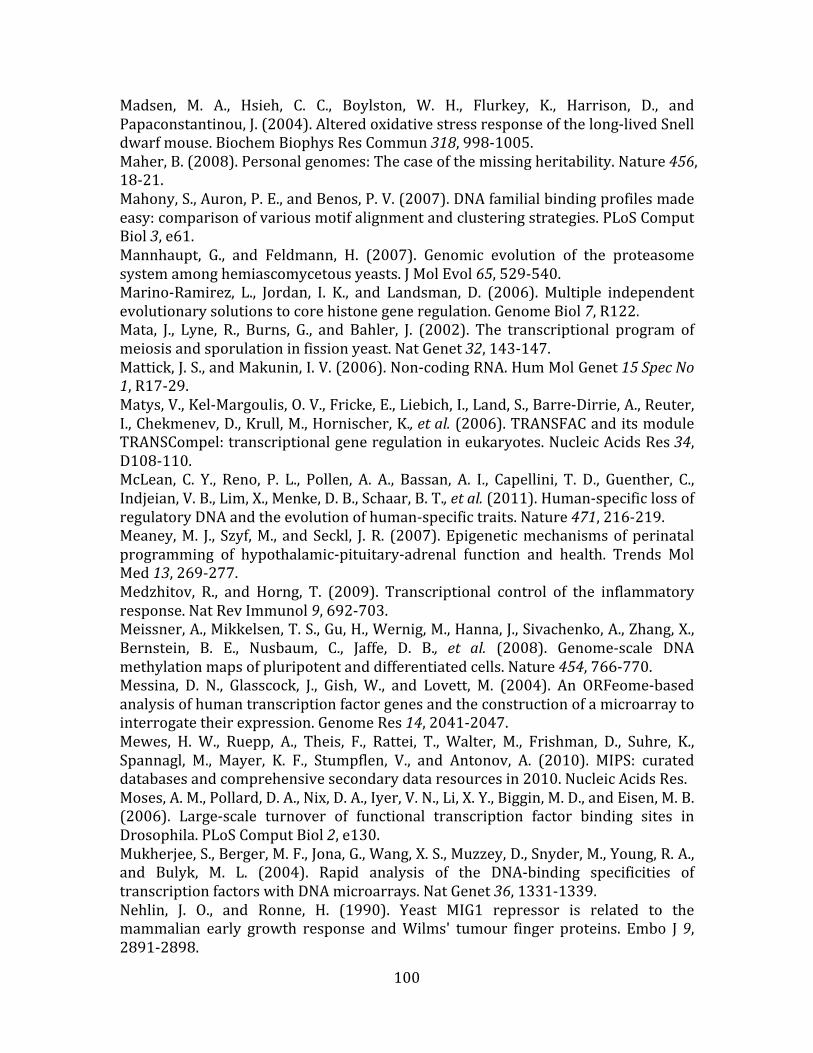
100
Madsen, M. A., Hsieh, C. C., Boylston, W. H., Flurkey, K., Harrison, D., and Papaconstantinou, J. (2004). Altered oxidative stress response of the long-‐lived Snell dwarf mouse. Biochem Biophys Res Commun 318, 998-‐1005. Maher, B. (2008). Personal genomes: The case of the missing heritability. Nature 456, 18-‐21. Mahony, S., Auron, P. E., and Benos, P. V. (2007). DNA familial binding profiles made easy: comparison of various motif alignment and clustering strategies. PLoS Comput Biol 3, e61. Mannhaupt, G., and Feldmann, H. (2007). Genomic evolution of the proteasome system among hemiascomycetous yeasts. J Mol Evol 65, 529-‐540. Marino-‐Ramirez, L., Jordan, I. K., and Landsman, D. (2006). Multiple independent evolutionary solutions to core histone gene regulation. Genome Biol 7, R122. Mata, J., Lyne, R., Burns, G., and Bahler, J. (2002). The transcriptional program of meiosis and sporulation in fission yeast. Nat Genet 32, 143-‐147. Mattick, J. S., and Makunin, I. V. (2006). Non-‐coding RNA. Hum Mol Genet 15 Spec No 1, R17-‐29. Matys, V., Kel-‐Margoulis, O. V., Fricke, E., Liebich, I., Land, S., Barre-‐Dirrie, A., Reuter, I., Chekmenev, D., Krull, M., Hornischer, K., et al. (2006). TRANSFAC and its module TRANSCompel: transcriptional gene regulation in eukaryotes. Nucleic Acids Res 34, D108-‐110. McLean, C. Y., Reno, P. L., Pollen, A. A., Bassan, A. I., Capellini, T. D., Guenther, C., Indjeian, V. B., Lim, X., Menke, D. B., Schaar, B. T., et al. (2011). Human-‐specific loss of regulatory DNA and the evolution of human-‐specific traits. Nature 471, 216-‐219. Meaney, M. J., Szyf, M., and Seckl, J. R. (2007). Epigenetic mechanisms of perinatal programming of hypothalamic-‐pituitary-‐adrenal function and health. Trends Mol Med 13, 269-‐277. Medzhitov, R., and Horng, T. (2009). Transcriptional control of the inflammatory response. Nat Rev Immunol 9, 692-‐703. Meissner, A., Mikkelsen, T. S., Gu, H., Wernig, M., Hanna, J., Sivachenko, A., Zhang, X., Bernstein, B. E., Nusbaum, C., Jaffe, D. B., et al. (2008). Genome-‐scale DNA methylation maps of pluripotent and differentiated cells. Nature 454, 766-‐770. Messina, D. N., Glasscock, J., Gish, W., and Lovett, M. (2004). An ORFeome-‐based analysis of human transcription factor genes and the construction of a microarray to interrogate their expression. Genome Res 14, 2041-‐2047. Mewes, H. W., Ruepp, A., Theis, F., Rattei, T., Walter, M., Frishman, D., Suhre, K., Spannagl, M., Mayer, K. F., Stumpflen, V., and Antonov, A. (2010). MIPS: curated databases and comprehensive secondary data resources in 2010. Nucleic Acids Res. Moses, A. M., Pollard, D. A., Nix, D. A., Iyer, V. N., Li, X. Y., Biggin, M. D., and Eisen, M. B. (2006). Large-‐scale turnover of functional transcription factor binding sites in Drosophila. PLoS Comput Biol 2, e130. Mukherjee, S., Berger, M. F., Jona, G., Wang, X. S., Muzzey, D., Snyder, M., Young, R. A., and Bulyk, M. L. (2004). Rapid analysis of the DNA-‐binding specificities of transcription factors with DNA microarrays. Nat Genet 36, 1331-‐1339. Nehlin, J. O., and Ronne, H. (1990). Yeast MIG1 repressor is related to the mammalian early growth response and Wilms' tumour finger proteins. Embo J 9, 2891-‐2898.
101
Ng, S. F., Lin, R. C., Laybutt, D. R., Barres, R., Owens, J. A., and Morris, M. J. (2010). Chronic high-‐fat diet in fathers programs beta-‐cell dysfunction in female rat offspring. Nature 467, 963-‐966. Novershtern, N., Subramanian, A., Lawton, L. N., Mak, R. H., Haining, W. N., McConkey, M. E., Habib, N., Yosef, N., Chang, C. Y., Shay, T., et al. (2011). Densely interconnected transcriptional circuits control cell states in human hematopoiesis. Cell 144, 296-‐309. O'Donnell, K. A., and Boeke, J. D. (2007). Mighty Piwis defend the germline against genome intruders. Cell 129, 37-‐44. Odom, D. T., Dowell, R. D., Jacobsen, E. S., Gordon, W., Danford, T. W., MacIsaac, K. D., Rolfe, P. A., Conboy, C. M., Gifford, D. K., and Fraenkel, E. (2007). Tissue-‐specific transcriptional regulation has diverged significantly between human and mouse. Nat Genet 39, 730-‐732. Ooi, L., and Wood, I. C. (2007). Chromatin crosstalk in development and disease: lessons from REST. Nat Rev Genet 8, 544-‐554. Osada, R., Zaslavsky, E., and Singh, M. (2004). Comparative analysis of methods for representing and searching for transcription factor binding sites. Bioinformatics 20, 3516-‐3525. Parker, D. S., White, M. A., Ramos, A. I., Cohen, B. A., and Barolo, S. (2011). The cis-‐regulatory logic of Hedgehog gradient responses: key roles for gli binding affinity, competition, and cooperativity. Sci Signal 4, ra38. Pembrey, M. E., Bygren, L. O., Kaati, G., Edvinsson, S., Northstone, K., Sjostrom, M., and Golding, J. (2006). Sex-‐specific, male-‐line transgenerational responses in humans. Eur J Hum Genet 14, 159-‐166. Prud'homme, B., Gompel, N., and Carroll, S. B. (2007). Emerging principles of regulatory evolution. Proc Natl Acad Sci U S A 104 Suppl 1, 8605-‐8612. Pryke, S. R., and Griffith, S. C. (2009). Genetic incompatibility drives sex allocation and maternal investment in a polymorphic finch. Science 323, 1605-‐1607. Rajasethupathy, P., Antonov, I., Sheridan, R., Frey, S., Sander, C., Tuschl, T., and Kandel, E. R. (2012). A role for neuronal piRNAs in the epigenetic control of memory-‐related synaptic plasticity. Cell 149, 693-‐707. Rakhshandehroo, M., Sanderson, L. M., Matilainen, M., Stienstra, R., Carlberg, C., de Groot, P. J., Muller, M., and Kersten, S. (2007). Comprehensive analysis of PPARalpha-‐dependent regulation of hepatic lipid metabolism by expression profiling. PPAR Res 2007, 26839. Rakyan, V. K., Chong, S., Champ, M. E., Cuthbert, P. C., Morgan, H. D., Luu, K. V., and Whitelaw, E. (2003). Transgenerational inheritance of epigenetic states at the murine Axin(Fu) allele occurs after maternal and paternal transmission. Proc Natl Acad Sci U S A 100, 2538-‐2543. Rando, O. J., and Verstrepen, K. J. (2007). Timescales of genetic and epigenetic inheritance. Cell 128, 655-‐668. Rassoulzadegan, M., Grandjean, V., Gounon, P., Vincent, S., Gillot, I., and Cuzin, F. (2006). RNA-‐mediated non-‐mendelian inheritance of an epigenetic change in the mouse. Nature 441, 469-‐474.
102
Ravasi, T., Suzuki, H., Cannistraci, C. V., Katayama, S., Bajic, V. B., Tan, K., Akalin, A., Schmeier, S., Kanamori-‐Katayama, M., Bertin, N., et al. (2010). An atlas of combinatorial transcriptional regulation in mouse and man. Cell 140, 744-‐752. Rechavi, O., Minevich, G., and Hobert, O. (2011). Transgenerational inheritance of an acquired small RNA-‐based antiviral response in C. elegans. Cell 147, 1248-‐1256. Ren, B., Robert, F., Wyrick, J. J., Aparicio, O., Jennings, E. G., Simon, I., Zeitlinger, J., Schreiber, J., Hannett, N., Kanin, E., et al. (2000). Genome-‐wide location and function of DNA binding proteins. Science 290, 2306-‐2309. Rhind, N., Chen, Z., Yassour, M., Thompson, D. A., Haas, B. J., Habib, N., Wapinski, I., Roy, S., Lin, M. F., Heiman, D. I., et al. (2011a). Comparative functional genomics of the fission yeasts. Science 332, 930-‐936. Scannell, D. R., Byrne, K. P., Gordon, J. L., Wong, S., and Wolfe, K. H. (2006). Multiple rounds of speciation associated with reciprocal gene loss in polyploid yeasts. Nature 440, 341-‐345. Schmidt, D., Wilson, M. D., Ballester, B., Schwalie, P. C., Brown, G. D., Marshall, A., Kutter, C., Watt, S., Martinez-‐Jimenez, C. P., Mackay, S., et al. (2010). Five-‐vertebrate ChIP-‐seq reveals the evolutionary dynamics of transcription factor binding. Science 328, 1036-‐1040. Schneider, J. S., Stone, M. K., Wynne-‐Edwards, K. E., Horton, T. H., Lydon, J., O'Malley, B., and Levine, J. E. (2003). Progesterone receptors mediate male aggression toward infants. Proc Natl Acad Sci U S A 100, 2951-‐2956. Segal, E., Shapira, M., Regev, A., Pe'er, D., Botstein, D., Koller, D., and Friedman, N. (2003). Module networks: identifying regulatory modules and their condition-‐specific regulators from gene expression data. Nat Genet 34, 166-‐176. Shea, N., Pen, I., and Uller, T. (2011). Three epigenetic information channels and their different roles in evolution. J Evol Biol 24, 1178-‐1187. Shibata, Y., Sheffield, N. C., Fedrigo, O., Babbitt, C. C., Wortham, M., Tewari, A. K., London, D., Song, L., Lee, B. K., Iyer, V. R., et al. (2012). Extensive Evolutionary Changes in Regulatory Element Activity during Human Origins Are Associated with Altered Gene Expression and Positive Selection. PLoS Genet 8, e1002789. Siddharthan, R., Siggia, E. D., and van Nimwegen, E. (2005). PhyloGibbs: a Gibbs sampling motif finder that incorporates phylogeny. PLoS Comput Biol 1, e67. Sivriver, J., Habib, N., and Friedman, N. (2011). An integrative clustering and modeling algorithm for dynamical gene expression data. Bioinformatics 27, i392-‐400. Skinner, M. K., Anway, M. D., Savenkova, M. I., Gore, A. C., and Crews, D. (2008). Transgenerational epigenetic programming of the brain transcriptome and anxiety behavior. PLoS One 3, e3745. Stormo, G. D. (2000). DNA binding sites: representation and discovery. Bioinformatics 16, 16-‐23. Storz, G. (2002). An expanding universe of noncoding RNAs. Science 296, 1260-‐1263. Suzuki, M. M., and Bird, A. (2008). DNA methylation landscapes: provocative insights from epigenomics. Nat Rev Genet 9, 465-‐476. Tan, K., Shlomi, T., Feizi, H., Ideker, T., and Sharan, R. (2007). Transcriptional regulation of protein complexes within and across species. Proc Natl Acad Sci U S A 104, 1283-‐1288.
103
Tanay, A. (2006). Extensive low-‐affinity transcriptional interactions in the yeast genome. Genome Res 16, 962-‐972. Tanay, A., Regev, A., and Shamir, R. (2005). Conservation and evolvability in regulatory networks: the evolution of ribosomal regulation in yeast. Proc Natl Acad Sci U S A 102, 7203-‐7208. Tirosh, I., and Barkai, N. (2008). Two strategies for gene regulation by promoter nucleosomes. Genome Res 18, 1084-‐1091. Tirosh, I., Reikhav, S., Levy, A. A., and Barkai, N. (2009). A yeast hybrid provides insight into the evolution of gene expression regulation. Science 324, 659-‐662. Tsong, A. E., Tuch, B. B., Li, H., and Johnson, A. D. (2006). Evolution of alternative transcriptional circuits with identical logic. Nature 443, 415-‐420. Tsuchiya, T., Dhahbi, J. M., Cui, X., Mote, P. L., Bartke, A., and Spindler, S. R. (2004). Additive regulation of hepatic gene expression by dwarfism and caloric restriction. Physiol Genomics 17, 307-‐315. Tuch, B. B., Galgoczy, D. J., Hernday, A. D., Li, H., and Johnson, A. D. (2008). The evolution of combinatorial gene regulation in fungi. PLoS Biol 6, e38. van der Heijden, G. W., Derijck, A. A., Ramos, L., Giele, M., van der Vlag, J., and de Boer, P. (2006). Transmission of modified nucleosomes from the mouse male germline to the zygote and subsequent remodeling of paternal chromatin. Dev Biol 298, 458-‐469. Vaquerizas, J. M., Kummerfeld, S. K., Teichmann, S. A., and Luscombe, N. M. (2009). A census of human transcription factors: function, expression and evolution. Nat Rev Genet 10, 252-‐263. Vavouri, T., and Lehner, B. (2011). Chromatin organization in sperm may be the major functional consequence of base composition variation in the human genome. PLoS Genet 7, e1002036. Wagner, K. D., Wagner, N., Ghanbarian, H., Grandjean, V., Gounon, P., Cuzin, F., and Rassoulzadegan, M. (2008). RNA induction and inheritance of epigenetic cardiac hypertrophy in the mouse. Dev Cell 14, 962-‐969. Wang, D., Sung, H. M., Wang, T. Y., Huang, C. J., Yang, P., Chang, T., Wang, Y. C., Tseng, D. L., Wu, J. P., Lee, T. C., et al. (2007). Expression evolution in yeast genes of single-‐input modules is mainly due to changes in trans-‐acting factors. Genome Res 17, 1161-‐1169. Wapinski, I., Pfeffer, A., Friedman, N., and Regev, A. (2007). Natural history and evolutionary principles of gene duplication in fungi. Nature 449, 54-‐61. Waterland, R. A. (2003). Do maternal methyl supplements in mice affect DNA methylation of offspring? J Nutr 133, 238; author reply 239. Waterland, R. A., and Jirtle, R. L. (2003). Transposable elements: targets for early nutritional effects on epigenetic gene regulation. Mol Cell Biol 23, 5293-‐5300. Waterston, R. H., Lindblad-‐Toh, K., Birney, E., Rogers, J., Abril, J. F., Agarwal, P., Agarwala, R., Ainscough, R., Alexandersson, M., An, P., et al. (2002). Initial sequencing and comparative analysis of the mouse genome. Nature 420, 520-‐562. Weaver, I. C., Cervoni, N., Champagne, F. A., D'Alessio, A. C., Sharma, S., Seckl, J. R., Dymov, S., Szyf, M., and Meaney, M. J. (2004). Epigenetic programming by maternal behavior. Nat Neurosci 7, 847-‐854. Weber, M., Davies, J. J., Wittig, D., Oakeley, E. J., Haase, M., Lam, W. L., and Schubeler, D. (2005). Chromosome-‐wide and promoter-‐specific analyses identify sites of
104
differential DNA methylation in normal and transformed human cells. Nat Genet 37, 853-‐862. Weber, M., Hellmann, I., Stadler, M. B., Ramos, L., Paabo, S., Rebhan, M., and Schubeler, D. (2007). Distribution, silencing potential and evolutionary impact of promoter DNA methylation in the human genome. Nat Genet 39, 457-‐466. Weirauch, M. T., and Hughes, T. R. (2010). Conserved expression without conserved regulatory sequence: the more things change, the more they stay the same. Trends Genet 26, 66-‐74. Wigler, M., Levy, D., and Perucho, M. (1981). The somatic replication of DNA methylation. Cell 24, 33-‐40. Wilson, M. D., Barbosa-‐Morais, N. L., Schmidt, D., Conboy, C. M., Vanes, L., Tybulewicz, V. L., Fisher, E. M., Tavare, S., and Odom, D. T. (2008). Species-‐specific transcription in mice carrying human chromosome 21. Science 322, 434-‐438. Wittkopp, P. J., Haerum, B. K., and Clark, A. G. (2004). Evolutionary changes in cis and trans gene regulation. Nature 430, 85-‐88. Wittkopp, P. J., Haerum, B. K., and Clark, A. G. (2008). Regulatory changes underlying expression differences within and between Drosophila species. Nat Genet 40, 346-‐350. Wohlbach, D. J., Thompson, D. A., Gasch, A. P., and Regev, A. (2009). From elements to modules: regulatory evolution in Ascomycota fungi. Curr Opin Genet Dev 19, 571-‐578. Wolfner, M. F. (2002). The gifts that keep on giving: physiological functions and evolutionary dynamics of male seminal proteins in Drosophila. Heredity (Edinb) 88, 85-‐93. Wood, V., Gwilliam, R., Rajandream, M. A., Lyne, M., Lyne, R., Stewart, A., Sgouros, J., Peat, N., Hayles, J., Baker, S., et al. (2002). The genome sequence of Schizosaccharomyces pombe. Nature 415, 871-‐880. Yamaguchi, R., Nakagawa, Y., Liu, Y. J., Fujisawa, Y., Sai, S., Nagata, E., Sano, S., Satake, E., Matsushita, R., Nakanishi, T., et al. (2010). Effects of maternal high-‐fat diet on serum lipid concentration and expression of peroxisomal proliferator-‐activated receptors in the early life of rat offspring. Horm Metab Res 42, 821-‐825. Yang, X., Deignan, J. L., Qi, H., Zhu, J., Qian, S., Zhong, J., Torosyan, G., Majid, S., Falkard, B., Kleinhanz, R. R., et al. (2009). Validation of candidate causal genes for obesity that affect shared metabolic pathways and networks. Nat Genet 41, 415-‐423. Yassour, M., Pfiffner, J., Levin, J. Z., Adiconis, X., Gnirke, A., Nusbaum, C., Thompson, D. A., Friedman, N., and Regev, A. (2010). Strand-‐specific RNA sequencing reveals extensive regulated long antisense transcripts that are conserved across yeast species. Genome Biol 11, R87. Yotova, I. Y., Vlatkovic, I. M., Pauler, F. M., Warczok, K. E., Ambros, P. F., Oshimura, M., Theussl, H. C., Gessler, M., Wagner, E. F., and Barlow, D. P. (2008). Identification of the human homolog of the imprinted mouse Air non-‐coding RNA. Genomics 92, 464-‐473. Yvert, G., Brem, R. B., Whittle, J., Akey, J. M., Foss, E., Smith, E. N., Mackelprang, R., and Kruglyak, L. (2003). Trans-‐acting regulatory variation in Saccharomyces cerevisiae and the role of transcription factors. Nat Genet 35, 57-‐64.

105
Zhu, C., Byers, K. J., McCord, R. P., Shi, Z., Berger, M. F., Newburger, D. E., Saulrieta, K., Smith, Z., Shah, M. V., Radhakrishnan, M., et al. (2009). High-‐resolution DNA-‐binding specificity analysis of yeast transcription factors. Genome Res 19, 556-‐566.
i
Appendices
Pages
1. Appendix Note 1 - Validations of the CladeoScope Method i-vi 1.1. Evaluations with synthetic data 1.2. Robustness 1.3. Evaluation of the phylogenetic filtering of non functional motifs 1.4. Comparing motif targets to bound target genes measured by ChIP
2. Appendix Note 2 - Characteristics of Motifs and Target Genes vi-vii
2.1. Distances between species-specific motifs 2.2. Motif score distribution of lost targets vs. non-targets
3. Appendix Note 3 - Validations of the Functional Modules vii-xi
3.1. Robustness of the functional modules 3.2. Comparison of functional modules to the literature
Appendix Note 1 – Validations of the CladeoScope Method
1.1 Evaluations with synthetic data
We evaluated CladeoScope on synthetic data, where the ground truth is known. We
defined a set of true ancestral targets (‘original set’) and evolved them into extant targets
with a given turnover rate. We then introduced different levels of noise to the “predicted”
targets in the extant species (false positives and false negatives) and applied CladeoScope to
this noisy input. Finally, we compared the reconstructed ancestral set to the original (true)
set, to test CladeoScope’s sensitivity and specificity. We conducted these tests multiple
times, varying the extent of noise, the size of the ancestral target set, the degree of target
turnover and the topology of the species tree. For each set of parameters (a total of 720
different sets), our results are averaged over 100 independent simulations.
CladeoScope is highly robust to noisy target predictions and other variations in the
input (the percent of false positives we tested ranges between 0%-200%, and the percent of
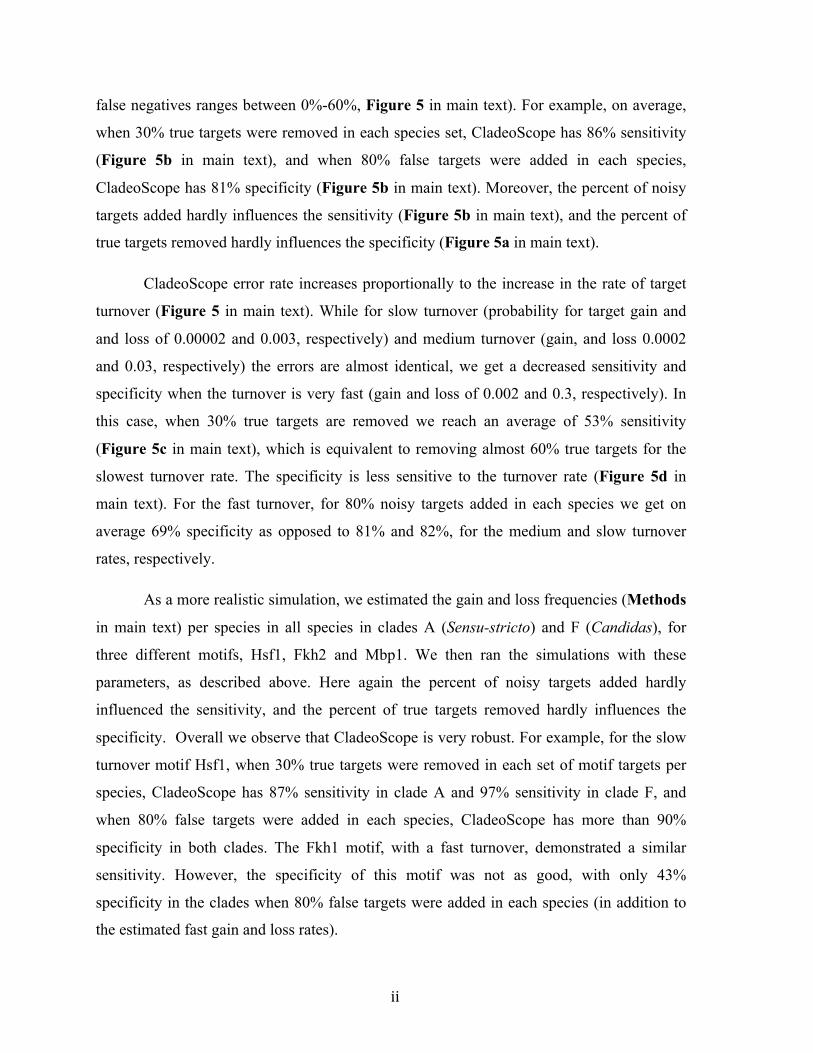
ii
false negatives ranges between 0%-60%, Figure 5 in main text). For example, on average,
when 30% true targets were removed in each species set, CladeoScope has 86% sensitivity
(Figure 5b in main text), and when 80% false targets were added in each species,
CladeoScope has 81% specificity (Figure 5b in main text). Moreover, the percent of noisy
targets added hardly influences the sensitivity (Figure 5b in main text), and the percent of
true targets removed hardly influences the specificity (Figure 5a in main text).
CladeoScope error rate increases proportionally to the increase in the rate of target
turnover (Figure 5 in main text). While for slow turnover (probability for target gain and
and loss of 0.00002 and 0.003, respectively) and medium turnover (gain, and loss 0.0002
and 0.03, respectively) the errors are almost identical, we get a decreased sensitivity and
specificity when the turnover is very fast (gain and loss of 0.002 and 0.3, respectively). In
this case, when 30% true targets are removed we reach an average of 53% sensitivity
(Figure 5c in main text), which is equivalent to removing almost 60% true targets for the
slowest turnover rate. The specificity is less sensitive to the turnover rate (Figure 5d in
main text). For the fast turnover, for 80% noisy targets added in each species we get on
average 69% specificity as opposed to 81% and 82%, for the medium and slow turnover
rates, respectively.
As a more realistic simulation, we estimated the gain and loss frequencies (Methods
in main text) per species in all species in clades A (Sensu-stricto) and F (Candidas), for
three different motifs, Hsf1, Fkh2 and Mbp1. We then ran the simulations with these
parameters, as described above. Here again the percent of noisy targets added hardly
influenced the sensitivity, and the percent of true targets removed hardly influences the
specificity. Overall we observe that CladeoScope is very robust. For example, for the slow
turnover motif Hsf1, when 30% true targets were removed in each set of motif targets per
species, CladeoScope has 87% sensitivity in clade A and 97% sensitivity in clade F, and
when 80% false targets were added in each species, CladeoScope has more than 90%
specificity in both clades. The Fkh1 motif, with a fast turnover, demonstrated a similar
sensitivity. However, the specificity of this motif was not as good, with only 43%
specificity in the clades when 80% false targets were added in each species (in addition to
the estimated fast gain and loss rates).
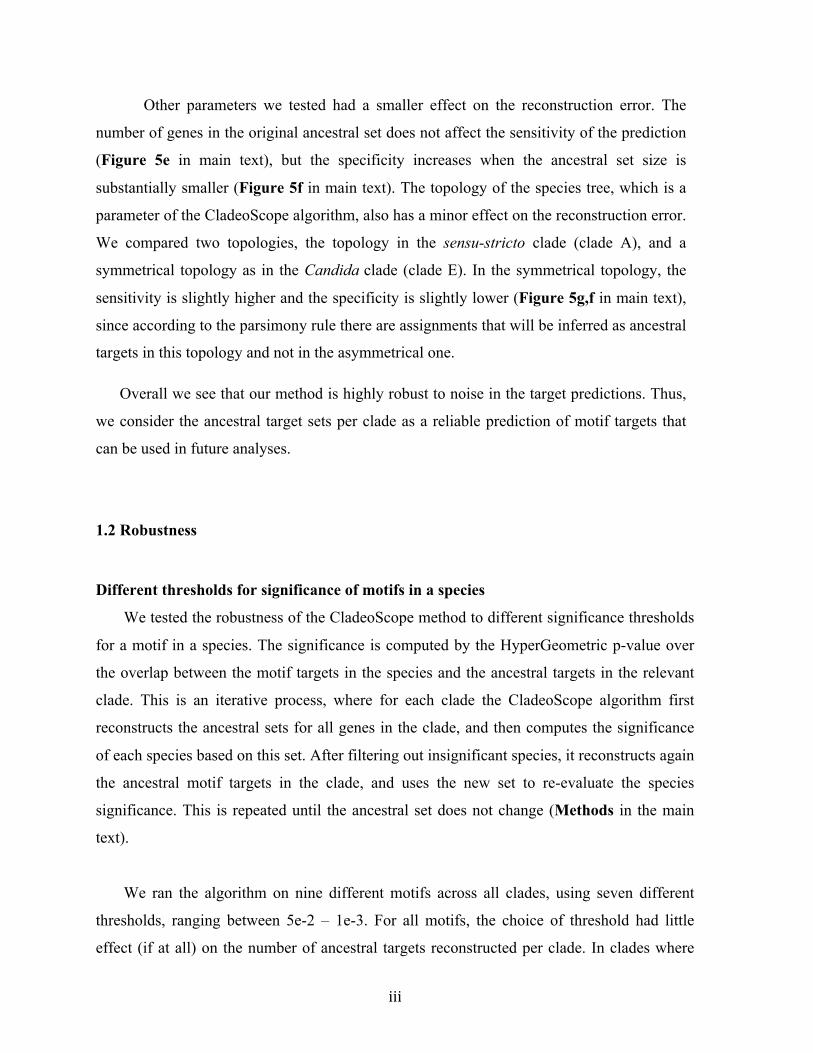
iii
Other parameters we tested had a smaller effect on the reconstruction error. The
number of genes in the original ancestral set does not affect the sensitivity of the prediction
(Figure 5e in main text), but the specificity increases when the ancestral set size is
substantially smaller (Figure 5f in main text). The topology of the species tree, which is a
parameter of the CladeoScope algorithm, also has a minor effect on the reconstruction error.
We compared two topologies, the topology in the sensu-stricto clade (clade A), and a
symmetrical topology as in the Candida clade (clade E). In the symmetrical topology, the
sensitivity is slightly higher and the specificity is slightly lower (Figure 5g,f in main text),
since according to the parsimony rule there are assignments that will be inferred as ancestral
targets in this topology and not in the asymmetrical one.
Overall we see that our method is highly robust to noise in the target predictions. Thus,
we consider the ancestral target sets per clade as a reliable prediction of motif targets that
can be used in future analyses.
1.2 Robustness
Different thresholds for significance of motifs in a species
We tested the robustness of the CladeoScope method to different significance thresholds
for a motif in a species. The significance is computed by the HyperGeometric p-value over
the overlap between the motif targets in the species and the ancestral targets in the relevant
clade. This is an iterative process, where for each clade the CladeoScope algorithm first
reconstructs the ancestral sets for all genes in the clade, and then computes the significance
of each species based on this set. After filtering out insignificant species, it reconstructs again
the ancestral motif targets in the clade, and uses the new set to re-evaluate the species
significance. This is repeated until the ancestral set does not change (Methods in the main
text).
We ran the algorithm on nine different motifs across all clades, using seven different
thresholds, ranging between 5e-2 – 1e-3. For all motifs, the choice of threshold had little
effect (if at all) on the number of ancestral targets reconstructed per clade. In clades where
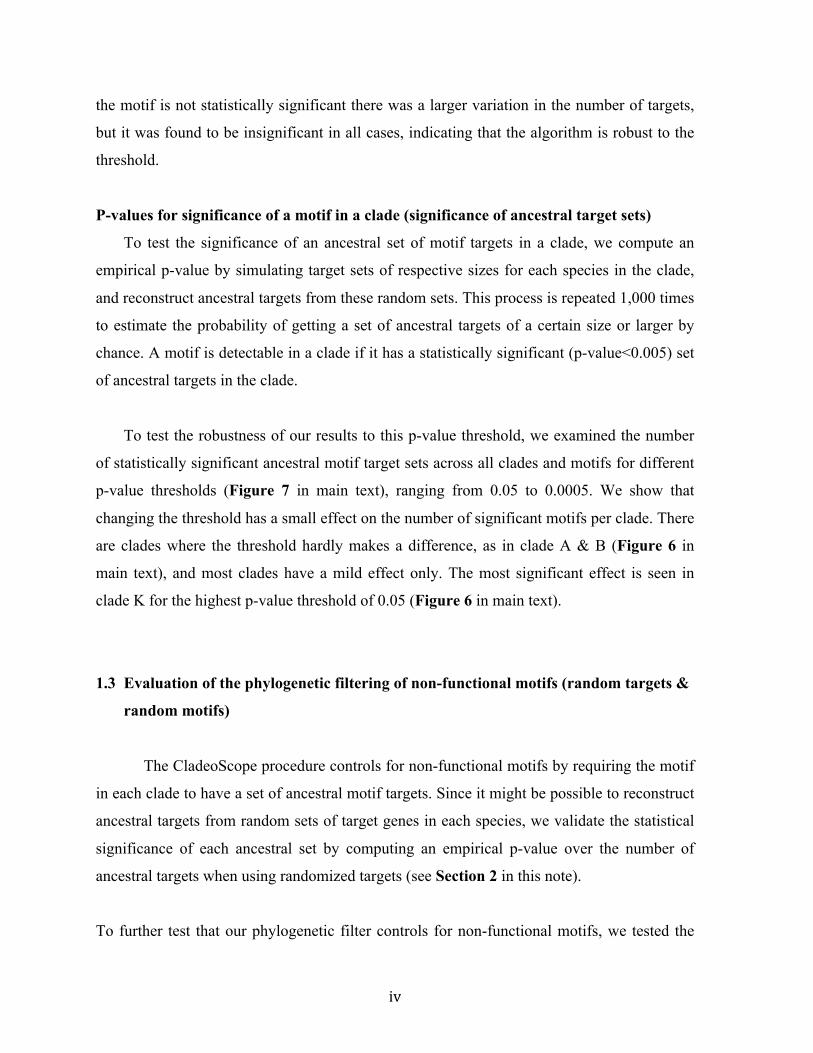
iv
the motif is not statistically significant there was a larger variation in the number of targets,
but it was found to be insignificant in all cases, indicating that the algorithm is robust to the
threshold.
P-values for significance of a motif in a clade (significance of ancestral target sets) To test the significance of an ancestral set of motif targets in a clade, we compute an
empirical p-value by simulating target sets of respective sizes for each species in the clade,
and reconstruct ancestral targets from these random sets. This process is repeated 1,000 times
to estimate the probability of getting a set of ancestral targets of a certain size or larger by
chance. A motif is detectable in a clade if it has a statistically significant (p-value<0.005) set
of ancestral targets in the clade.
To test the robustness of our results to this p-value threshold, we examined the number
of statistically significant ancestral motif target sets across all clades and motifs for different
p-value thresholds (Figure 7 in main text), ranging from 0.05 to 0.0005. We show that
changing the threshold has a small effect on the number of significant motifs per clade. There
are clades where the threshold hardly makes a difference, as in clade A & B (Figure 6 in
main text), and most clades have a mild effect only. The most significant effect is seen in
clade K for the highest p-value threshold of 0.05 (Figure 6 in main text).
1.3 Evaluation of the phylogenetic filtering of non-functional motifs (random targets &
random motifs)
The CladeoScope procedure controls for non-functional motifs by requiring the motif
in each clade to have a set of ancestral motif targets. Since it might be possible to reconstruct
ancestral targets from random sets of target genes in each species, we validate the statistical
significance of each ancestral set by computing an empirical p-value over the number of
ancestral targets when using randomized targets (see Section 2 in this note).
To further test that our phylogenetic filter controls for non-functional motifs, we tested the
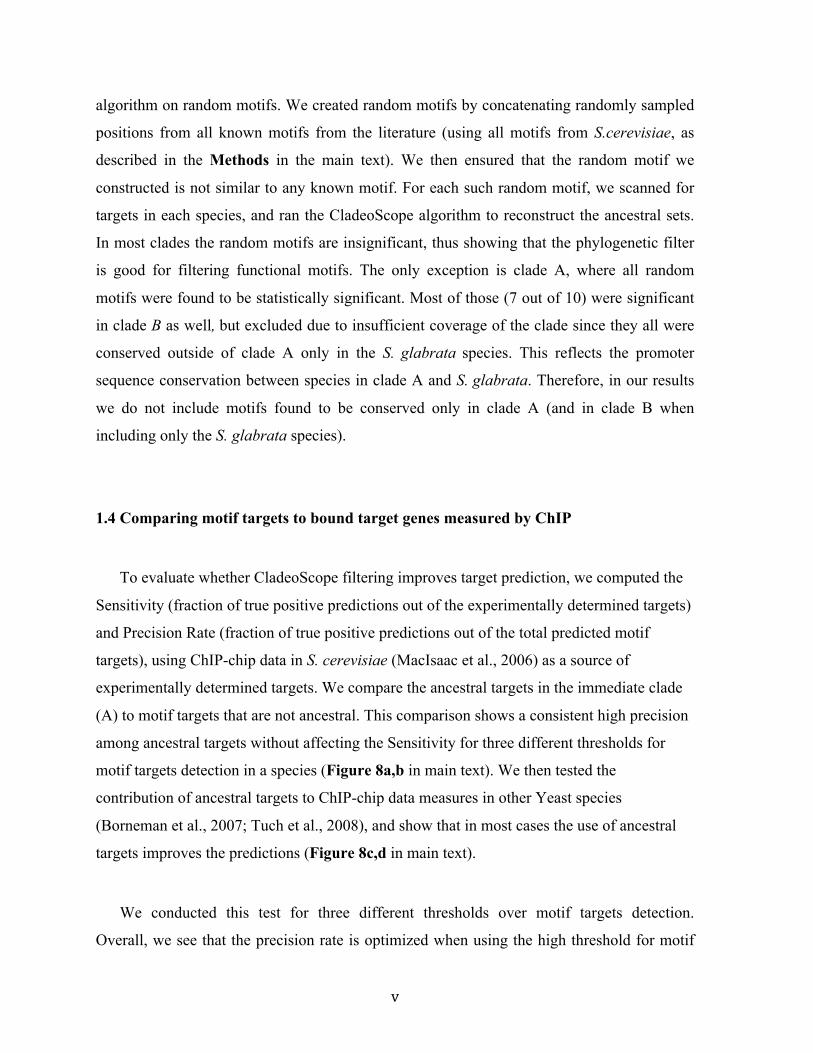
v
algorithm on random motifs. We created random motifs by concatenating randomly sampled
positions from all known motifs from the literature (using all motifs from S.cerevisiae, as
described in the Methods in the main text). We then ensured that the random motif we
constructed is not similar to any known motif. For each such random motif, we scanned for
targets in each species, and ran the CladeoScope algorithm to reconstruct the ancestral sets.
In most clades the random motifs are insignificant, thus showing that the phylogenetic filter
is good for filtering functional motifs. The only exception is clade A, where all random
motifs were found to be statistically significant. Most of those (7 out of 10) were significant
in clade B as well, but excluded due to insufficient coverage of the clade since they all were
conserved outside of clade A only in the S. glabrata species. This reflects the promoter
sequence conservation between species in clade A and S. glabrata. Therefore, in our results
we do not include motifs found to be conserved only in clade A (and in clade B when
including only the S. glabrata species).
1.4 Comparing motif targets to bound target genes measured by ChIP
To evaluate whether CladeoScope filtering improves target prediction, we computed the
Sensitivity (fraction of true positive predictions out of the experimentally determined targets)
and Precision Rate (fraction of true positive predictions out of the total predicted motif
targets), using ChIP-chip data in S. cerevisiae (MacIsaac et al., 2006) as a source of
experimentally determined targets. We compare the ancestral targets in the immediate clade
(A) to motif targets that are not ancestral. This comparison shows a consistent high precision
among ancestral targets without affecting the Sensitivity for three different thresholds for
motif targets detection in a species (Figure 8a,b in main text). We then tested the
contribution of ancestral targets to ChIP-chip data measures in other Yeast species
(Borneman et al., 2007; Tuch et al., 2008), and show that in most cases the use of ancestral
targets improves the predictions (Figure 8c,d in main text). We conducted this test for three different thresholds over motif targets detection.
Overall, we see that the precision rate is optimized when using the high threshold for motif
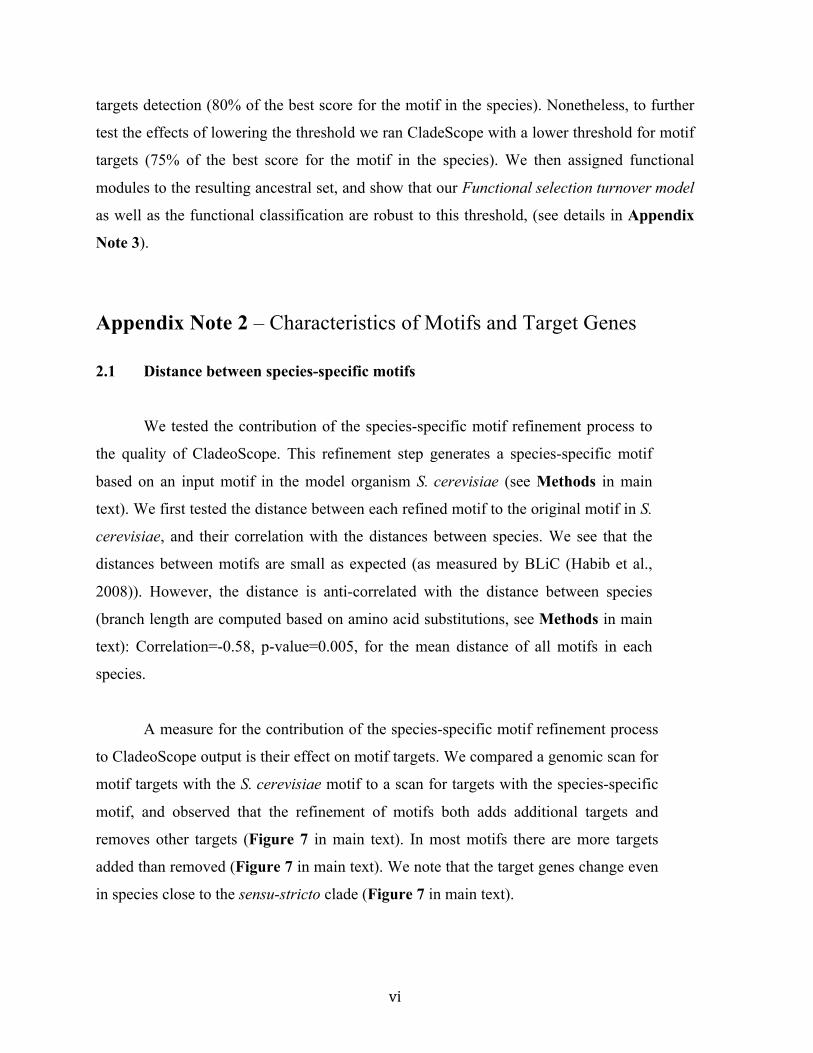
vi
targets detection (80% of the best score for the motif in the species). Nonetheless, to further
test the effects of lowering the threshold we ran CladeScope with a lower threshold for motif
targets (75% of the best score for the motif in the species). We then assigned functional
modules to the resulting ancestral set, and show that our Functional selection turnover model
as well as the functional classification are robust to this threshold, (see details in Appendix
Note 3).
Appendix Note 2 – Characteristics of Motifs and Target Genes
2.1 Distance between species-specific motifs
We tested the contribution of the species-specific motif refinement process to
the quality of CladeoScope. This refinement step generates a species-specific motif
based on an input motif in the model organism S. cerevisiae (see Methods in main
text). We first tested the distance between each refined motif to the original motif in S.
cerevisiae, and their correlation with the distances between species. We see that the
distances between motifs are small as expected (as measured by BLiC (Habib et al.,
2008)). However, the distance is anti-correlated with the distance between species
(branch length are computed based on amino acid substitutions, see Methods in main
text): Correlation=-0.58, p-value=0.005, for the mean distance of all motifs in each
species.
A measure for the contribution of the species-specific motif refinement process
to CladeoScope output is their effect on motif targets. We compared a genomic scan for
motif targets with the S. cerevisiae motif to a scan for targets with the species-specific
motif, and observed that the refinement of motifs both adds additional targets and
removes other targets (Figure 7 in main text). In most motifs there are more targets
added than removed (Figure 7 in main text). We note that the target genes change even
in species close to the sensu-stricto clade (Figure 7 in main text).
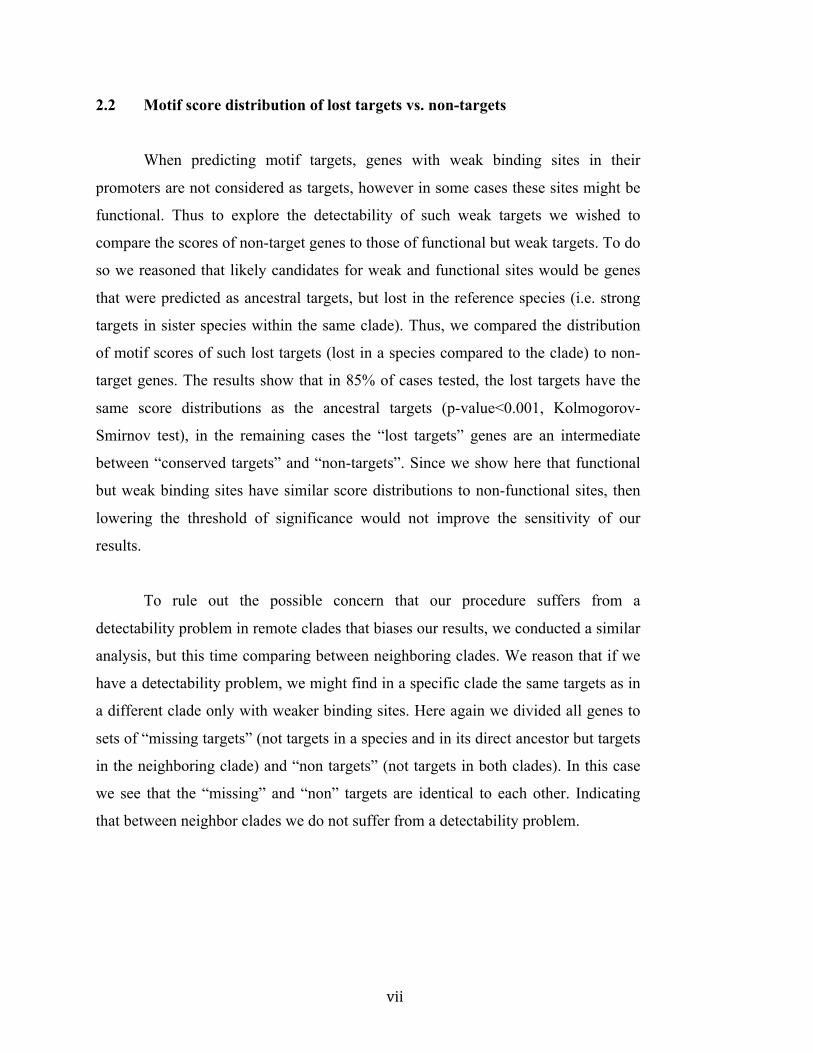
vii
2.2 Motif score distribution of lost targets vs. non-targets
When predicting motif targets, genes with weak binding sites in their
promoters are not considered as targets, however in some cases these sites might be
functional. Thus to explore the detectability of such weak targets we wished to
compare the scores of non-target genes to those of functional but weak targets. To do
so we reasoned that likely candidates for weak and functional sites would be genes
that were predicted as ancestral targets, but lost in the reference species (i.e. strong
targets in sister species within the same clade). Thus, we compared the distribution
of motif scores of such lost targets (lost in a species compared to the clade) to non-
target genes. The results show that in 85% of cases tested, the lost targets have the
same score distributions as the ancestral targets (p-value<0.001, Kolmogorov-
Smirnov test), in the remaining cases the “lost targets” genes are an intermediate
between “conserved targets” and “non-targets”. Since we show here that functional
but weak binding sites have similar score distributions to non-functional sites, then
lowering the threshold of significance would not improve the sensitivity of our
results.
To rule out the possible concern that our procedure suffers from a
detectability problem in remote clades that biases our results, we conducted a similar
analysis, but this time comparing between neighboring clades. We reason that if we
have a detectability problem, we might find in a specific clade the same targets as in
a different clade only with weaker binding sites. Here again we divided all genes to
sets of “missing targets” (not targets in a species and in its direct ancestor but targets
in the neighboring clade) and “non targets” (not targets in both clades). In this case
we see that the “missing” and “non” targets are identical to each other. Indicating
that between neighbor clades we do not suffer from a detectability problem.

viii
Appendix Note 3 – Validations of the Functional Modules 3.1 Robustness of the functional modules
To test the robustness of the functional modules, we applied the algorithm with
different parameters and inputs, including:
Enrichment thresholds for functional modules with motif targets
When creating functional modules our procedure selects for the relevant functional
annotations by selecting only categories that are enriched with motif targets. We tested the
robustness of our method to the HyperGeometric p-value threshold ranging between: 1e-3-
1e-6.
Threshold for merging gene-sets
The procedure for building functional modules merges gene-sets (in the context of a given
motif across all clades) by comparing the set of motif targets in each gene set and checking
that the fraction of motif targets in the intersection is above the threshold. We tested the
robustness of our method to this threshold by comparing results with thresholds ranging
between: 40% – 75%.
Thresholds for initial predictions of target genes
We tested the robustness of our method to different motif target detection thresholds. Testing
two alternative thresholds (80% and 75% out of the best possible score for each motif in each
species). The change in threshold results in different number of ancestral targets per clade
(see Appendix Note 1).
For each set of parameters we tested several characteristics:
a) The number of modules
b) The fit of our Functional Selection Turnover model
c) The classification of motifs to functional classes (Functional conservation, Clade specific
innovation or Functional switch) – we examined in detail 18 motifs including those
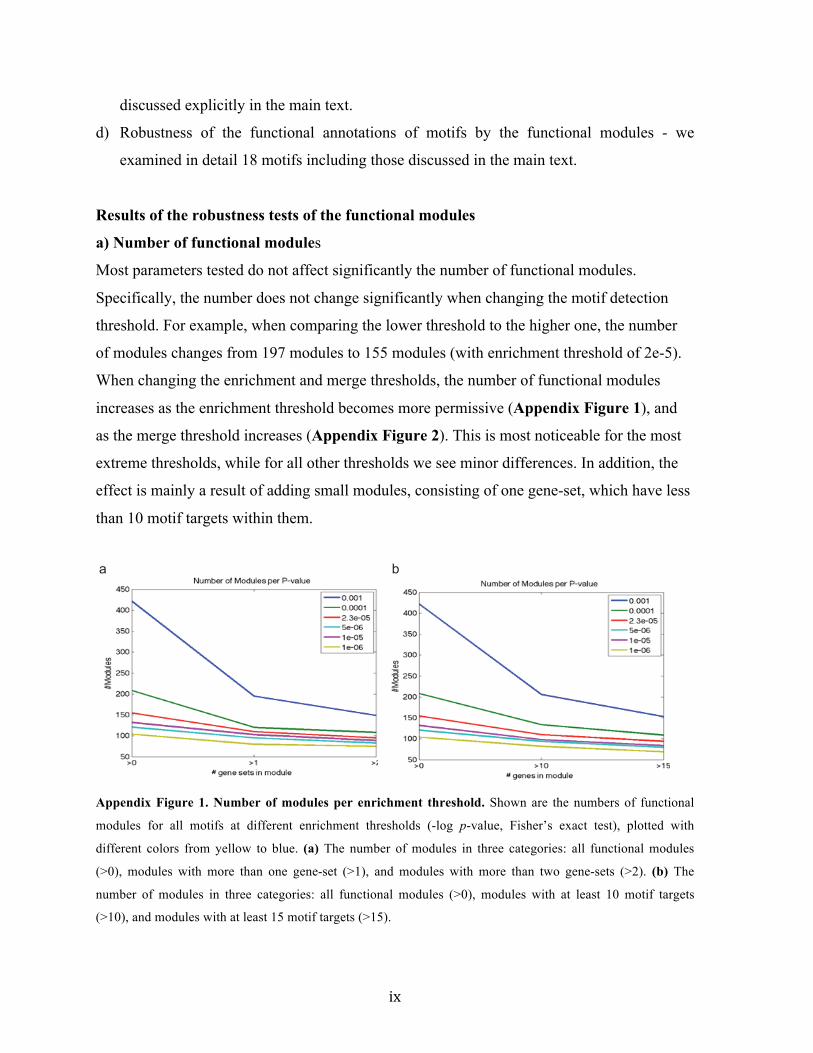
ix
discussed explicitly in the main text.
d) Robustness of the functional annotations of motifs by the functional modules - we
examined in detail 18 motifs including those discussed in the main text.
Results of the robustness tests of the functional modules
a) Number of functional modules
Most parameters tested do not affect significantly the number of functional modules.
Specifically, the number does not change significantly when changing the motif detection
threshold. For example, when comparing the lower threshold to the higher one, the number
of modules changes from 197 modules to 155 modules (with enrichment threshold of 2e-5).
When changing the enrichment and merge thresholds, the number of functional modules
increases as the enrichment threshold becomes more permissive (Appendix Figure 1), and
as the merge threshold increases (Appendix Figure 2). This is most noticeable for the most
extreme thresholds, while for all other thresholds we see minor differences. In addition, the
effect is mainly a result of adding small modules, consisting of one gene-set, which have less
than 10 motif targets within them.
Appendix Figure 1. Number of modules per enrichment threshold. Shown are the numbers of functional
modules for all motifs at different enrichment thresholds (-log p-value, Fisher’s exact test), plotted with
different colors from yellow to blue. (a) The number of modules in three categories: all functional modules
(>0), modules with more than one gene-set (>1), and modules with more than two gene-sets (>2). (b) The
number of modules in three categories: all functional modules (>0), modules with at least 10 motif targets
(>10), and modules with at least 15 motif targets (>15).
Figure S13a b
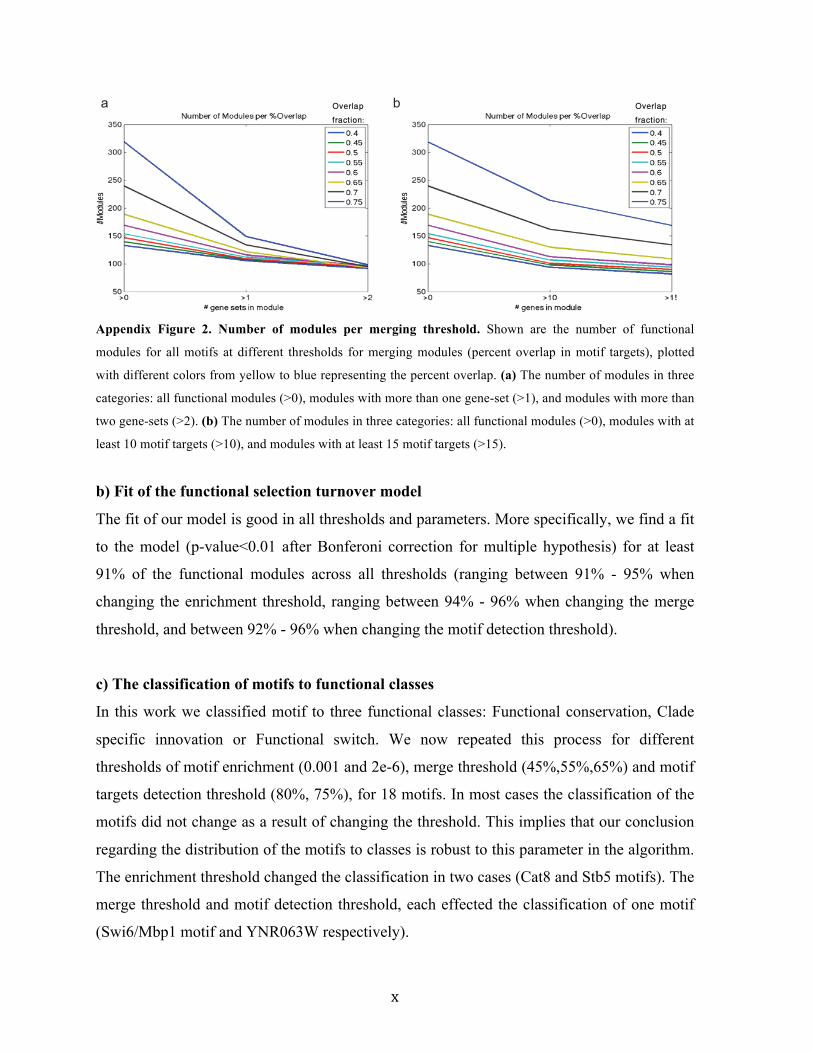
x
Appendix Figure 2. Number of modules per merging threshold. Shown are the number of functional
modules for all motifs at different thresholds for merging modules (percent overlap in motif targets), plotted
with different colors from yellow to blue representing the percent overlap. (a) The number of modules in three
categories: all functional modules (>0), modules with more than one gene-set (>1), and modules with more than
two gene-sets (>2). (b) The number of modules in three categories: all functional modules (>0), modules with at
least 10 motif targets (>10), and modules with at least 15 motif targets (>15).
b) Fit of the functional selection turnover model
The fit of our model is good in all thresholds and parameters. More specifically, we find a fit
to the model (p-value<0.01 after Bonferoni correction for multiple hypothesis) for at least
91% of the functional modules across all thresholds (ranging between 91% - 95% when
changing the enrichment threshold, ranging between 94% - 96% when changing the merge
threshold, and between 92% - 96% when changing the motif detection threshold).
c) The classification of motifs to functional classes
In this work we classified motif to three functional classes: Functional conservation, Clade
specific innovation or Functional switch. We now repeated this process for different
thresholds of motif enrichment (0.001 and 2e-6), merge threshold (45%,55%,65%) and motif
targets detection threshold (80%, 75%), for 18 motifs. In most cases the classification of the
motifs did not change as a result of changing the threshold. This implies that our conclusion
regarding the distribution of the motifs to classes is robust to this parameter in the algorithm.
The enrichment threshold changed the classification in two cases (Cat8 and Stb5 motifs). The
merge threshold and motif detection threshold, each effected the classification of one motif
(Swi6/Mbp1 motif and YNR063W respectively).
a bOverlap
fraction:
Overlap
fraction:
xi
d) Robustness of the functional annotations of motifs
The functional annotations of motifs are largely robust to the choice of threshold, although
many gene-sets are not found to be enriched when lowering the threshold. The robustness of
the modules is due to compensation by overlapping gene-sets. Thus, by creating modules we
overcome sporadic non-enrichment of specific gene sets. However, we do find that small
modules (usually with a small number of motif targets and only one gene-set) enriched in a
single clade are sensitive to the choice of threshold and tend to be excluded as the threshold
is stricter.
3.2 Comparison of functional modules to the literature
The CladeoScope algorithm itself does not take functional annotation into consideration.
Moreover, we do not require the motif targets in S. cerevisiae to be conserved in remote
clades and species. Thus, we can use the known functional annotations as an indication for
the functionality of the DNA motifs. For each motif we compared the functional annotations
to the known function of the motif (when available) in S.cerevisiae, C. albicans and S.
pombe. Overall we find a very good fit between the functional modules and the known
function. From all motifs with known annotations we find 75% that have an exact match,
12% that have a partial match and 13% with no match.
References Borneman, A. R., Gianoulis, T. A., Zhang, Z. D., Yu, H., Rozowsky, J., Seringhaus, M. R., Wang, L. Y., Gerstein, M., and Snyder, M. (2007). Divergence of transcription factor binding sites across related yeast species. Science 317, 815-‐819. Habib, N., Kaplan, T., Margalit, H., and Friedman, N. (2008). A novel Bayesian DNA motif comparison method for clustering and retrieval. PLoS Comput Biol 4, e1000010. MacIsaac, K. D., Wang, T., Gordon, D. B., Gifford, D. K., Stormo, G. D., and Fraenkel, E. (2006). An improved map of conserved regulatory sites for Saccharomyces cerevisiae. BMC Bioinformatics 7, 113. Tuch, B. B., Galgoczy, D. J., Hernday, A. D., Li, H., and Johnson, A. D. (2008). The evolution of combinatorial gene regulation in fungi. PLoS Biol 6, e38.

ת הראשונות המספקות ראיות חותכות העבודו העבודה שלנו היא האחת. Ppara ,של ליפידים
גורמים (2)בצאצאים של עכברים מטבוליים םתזונה אבהית משפיעה על ביטוי גני( 1: )לכך ש
, אלו תוצאו .סביבההלתנאי משתנים בתגובה , דורי-היכולים להעביר מידע בין, אפיגנטיים בזרע
ההורים יכולה של תזונהעל כך שה יםמצביע, אדםבאפידמיולוגיים ממחקרים בשילוב עם נתונים
מודל כמו כן בעבודה זו הגדרנו . בצאצאים של כולסטרול ושומניםמטבוליזם להשפיע על
יתר. גורמים אפיגנטייםהורית על ידי הורשה של סביבה שינוי תלוי המאפשרת לחקורלמערכת
דמיולוגיים של אפי יםמחקרמצביעות על הצורך בחשיבה מחודשת לגבי תוצאות אלו , על כן
. או אלכוהוליזם, מחלות לב, סוכרת גוןכבאדם מחלות מורכבות
מנגנוני הורשה שונים אור על שני שתי העבודות המובאות כאן שופכות התוצאות של, לסיכום
מדגישות את הצורך עבודות אלו . שעתוק בקרת אבולוציה שלסלקציה הפועלים בכוחות ו
.יםגנטי-לאו יםגנטיהמשלבת מנגנוני הורשה , בולוציה מורחבתא בתיאורית

.שלהם בתאים ם הרגולטורייםתפקידישמור על ההשעתוק נוטים לפקטורי (2) .(מטרה קיימים
הפועל על החלפת גני סלקציה על פי פונקציהסותרות אלו מיושבות על ידי מודל שתי מגמות (3)
ק נמצאים שעתורגולטוריים של פקטורי הה התפקידים, על פי המודל. מטרה של פקטורי שעתוק
הסלקציה לחצי , שלנו במודל. מטרה בודדיםמאשר הבקרה של גני תחת סלקציה חזקה יותר
אבל לא , ביולוגיתהליך אותוהמשתייכים לגני מטרה באופו כללי כדי לשמר פועלים באופן שונה
מספר הנצפה ל הסבר נאותמספק המודל .התהליך ז בתוך מסוימיםגני מטרה פועלים לשימור
כן מסביר את ו, (שמורים במספר רב של מינים)באבולוציה מאוד שמוריםהמטרה ה גנישל
הן בשמרים ון ה, מספר מינים ךלאורמסוימים שעתוק טורי קלפנמדדו השינויים בגני המטרה ש
אנו .בעבר וממה שהניח םהם יותר מתירניהסלקציה הממצאים שלנו מראים כי כוחות . םביונקי
חיווט ים המוביל לבקרה מאפשר הרבה שינויים מקומיעל רשתות כי לחץ הסלקציה מראים
התנגדותתוך כדי , ותורם לאדפטציה של ביטוי הגנים לתנאי סביבה משתנים, של הרשת מחדש
.עלולים להיות קטלנייםה שינויים דרמטיים בפנוטיפל
הורשה אפיגנטית
מכיוון ,של בקרת שעתוק נוסף באבולוציהאפשרי בקרה אפיגנטיים הם כוח מניע מנגנוני
הורשה . של פרופיל ביטוי הגניםדורי -ביןתכנות הוביל לל היכולשהורשה של גורמים אפיגנטיים
יכול להיות ( כגון תזונה או טמפרטורה)הורים השחוו מרמזת כי מידע על הסביבהאפיגנטית
ביונקים קיימת האםהיה ברור לא לפני מחקרנו . מנדלית-מנגנון הורשה לאמועבר לצאצאים ב
דורית -הורשה ביןאם הכדי לבדוק . הוריםה קודמות שלסביבות מ תהמושפעהורשה אפיגנטית
צאצאים בעקבות שינוי ה במשתנביטיים אשר גנים בעכברים ביצענו חיפוש של , כזו מתרחשת
מכיוון שאצל העכברים האבות תורמים מעט אבהית תזונה הבהתמקדנו אנו . של תזונת האבות
ובפרט, שיניים בסביבהצאצאים להשל ישירות לשלול תגובות וכך יכולנו , ים למעט זרעלצאצא
.רחםהראשונה שהיא הלסביבתם
לצאצאים של בהשוואה, חלבוניםאבות שאכלו תזונה דלת הצאצאים של מצאנו כי אצל
יצירה של ליפידים מעורבים בהביטוי של גנים רבים עלתה רמת ה, אבות שהוזנו בתזונה רגילה
וחומצות שומן ליפידים, טריגליצרידים, אסטר-רמות גבוהות של כולסטרולכן נמדדו ו, וכולסטרול
, של גורמים אפיגנטיים בכבד של הצאצאים נרחב ואנליזה רחבת היקףמיפוי , בנוסף. חופשיות
הוביל , א על פני הגנום כולו בזרע של האבות"ת דנא ומתילצי"פרופיל ביטוי הרנכמו גם שינוי של
בכבד של א במקומות רבים בגנום"דנ תתזונה הורית במתילצי ישינוי תלו 02%-לגילוי של כ
באזור בקרה מרוחק המקושר לגן המקודד לבקר מרכזי שינויבין שינוים אלו נמצא גם . הצאצאים

תקציר
בקרת שעתוק ממלא תפקיד מרכזי בפעילות של תאים חיים ובתגובתם לאותות פנימיים
עם אינטראקציה זה בהנמצאים .ביםר םעל ידי מנגנוני כתמתוו ,וז תמורכב בקרה .או חיצוניים
א המזהים רצפים ספציפיים"חלבונים קושרי דני "בקרת שעתוק עאלה כוללים מנגנונים .זה
כמו , א"ילציה של הדנמודיפיקציות של הכרומטין ומת תהכולל תבקרה אפיגנטי ,(קשעתו פקטורי)
הנחה (.שאינן מקודדות לחלבונים)א רגולטוריות "מולקולות רני "בקרה לאחר שעתוק עגם
מרכזי ביצירת הגיוון הפנוטיפי הרחב הנצפה ם גורםנהשעתוק הרווחת היא ששינויים בבקרת
.אינם ידועיםלרוב של התהליך והדינאמיקההאבולוציוניים הפועלים ת הכוחו, עם זאת .בין מינים
הורשה גנטית של , ת מבט שונותוהזה משתי נקודהאבולוציוני את התהליך חקרתי ,בעבודתי
.גנטית-ולא
בקרת שעתוק דרך הורשה גנטית ה שלאבולוצי
א אשר "דנבאמצעות מוטציות ברצף הלהתפתח באבולוציה בקרת ביטוי גנים יכולה
רשת בשינוי ועל ידי כך ל, גורמות לשינוי הקשר בין חלבוני הבקרה לגנים אותם הם מבקרים
מוטציות באזורים . על ידי שני תרחישים שוניםיכולים להתרחש שינויים אלו . בקרת השעתוק
(. כגון פקטורי שעתוק)חלבוני בקרה להשפיע ישירות על פעילותם שליכולות א "מקודדים בדנ
על קישור של חלבוני ולהשפיע , א"רצפי בקרה בדנ המוטציות עלולות לגרום לשינוי, ופיןלחל
חלבוני בעוד .באזור גניםשל ביטויה תבקרלשנות את הבקרה באזורים אלה וכתוצאה מכך
מגוון ברצפי בקרה נצפו ב שינויים בקנה מידה גדול, הבקרה הם ברובם מאוד שמורים בין המינים
ר יסודי ומקיף של תהליך אבולוציוני זה הוגבל חק, אולם .זבובים ויונקים, מו שמריםכ ,אורגניזמים
של פקטורי שעתוק וגני המטרה שלהם בקנה מידה גדולושיטתיות במדידות על ידי החוסר
של הפוגם בדיוק הקביעה תחזיות חישוביותבעש הרעל ידי כן הוגבל ו, הרבה מינים שוניםב
. רשת בקרת השעתוק
, שיטה חישובית לחקר האבולוציה של בקרת שעתוק על פני מינים רבים נופיתחאנו
פקטורי תשעיםשל יותר מבקרת השעתוק של כדי לעקוב אחר ההיסטוריה והשתמשתי בה
כללי באבולוציה של ןעקרולגילוי הובילהניתוח שלנו .שמרים מיני עשרים ושלושהפני על שעתוק
המקשרת בין ,רשת הרגולציה( 1: )מצאנו כיאנו .יונקיםהן לשמרים ונכון הן לשעתוק ה בקרת
משנים את גני שעתוק פקטורי ה, כלומר)מאוד גמישה שלהם היא המטרה גני לשעתוק פקטורי ה
איבוד גני והן שים השגת גני מטרה חדהן שינויים אלה כוללים . בקצב מהיר המטרה שלהם

עבודה זו נעשתה בהדרכתם של:
פרופ' ניר פרידמן פרופ' חנה מרגלית

מחקר חישובי השוואתי של בקרת שעתוק
באאוקריוטים
חיבור לשם קבלת תואר דוקטור לפילוסופיה
מאת
נעמי חביב
הוגש לסנט האוניברסיטה העברית, בירושלים
אוגוסט 2012