Embed Size (px)
Citation preview
Computational and Experimental Investigation of
Li-doped Ionic Liquid Electrolytes: [pyr14][TFSI],
[pyr13][FSI], and [EMIM][BF4]
Justin B. Haskins,† William R. Bennett,‡ James J. Wu,‡ Dionne M. Hernández,‡
Oleg Borodin,¶ Joshua D. Monk,† Charles W. Bauschlicher, Jr.,§ and John W.
Lawson∗,‖
ERC Inc., Thermal Protection Materials and Systems Branch, NASA Ames Research
Center, Moffett Field, California 94035, USA, Electrochemistry Branch, NASA Glenn
Research Center, Cleveland, OH 44135, USA, Electrochemistry Branch, Sensor & Electron
Devices Directorate, U.S. Army Research Laboratory, Adelphi, Maryland 20783, USA,
Entry Systems and Technology Division, NASA Ames Research Center, Moffett Field,
California 94035, USA, and Thermal Protection Materials and Systems Branch, NASA
Ames Research Center, Moffett Field, California 94035, USA
E-mail: [email protected]
∗To whom correspondence should be addressed†ERC Inc., Thermal Protection Materials and Systems Branch, NASA Ames Research Center, Moffett
Field, California 94035, USA‡Electrochemistry Branch, NASA Glenn Research Center, Cleveland, OH 44135, USA¶Electrochemistry Branch, Sensor & Electron Devices Directorate, U.S. Army Research Laboratory, Adel-
phi, Maryland 20783, USA§Entry Systems and Technology Division, NASA Ames Research Center, Moffett Field, California 94035,
USA‖Thermal Protection Materials and Systems Branch, NASA Ames Research Center, Moffett Field, Cali-
fornia 94035, USA
1
Abstract
We employ molecular dynamics (MD) simulation and experiment to investigate the
structure, thermodynamics, and transport of N -methyl-N -butylpyrrolidinium bis(tri-
fluoromethylsufonyl)imide ([pyr14][TFSI]), N -methyl-N -propylpyrrolidinium bis(fluoro-
sufonyl)imide ([pyr13][FSI]), and 1-ethyl-3-methylimidazolium boron tetrafluoride ([EM-
IM][BF4]), as a function of Li-salt mole fraction (0.05 ≤ xLi+ ≤ 0.33) and temperature
(298 K ≤ T ≤ 393 K). Structurally, Li+ is shown to be solvated by three anion neigh-
bors in [pyr14][TFSI] and four anion neighbors in both [pyr13][FSI] and [EMIM][BF4],
and at all levels of xLi+ we find the presence of lithium aggregates. Pulsed field gradient
spin-echo NMR measurements of diffusion and electrochemical impedance spectroscopy
measurements of ionic conductivity are made for the neat ionic liquids as well as 0.5
molal solutions of Li-salt in the ionic liquids. Bulk ionic liquid properties (density,
diffusion, viscosity, and ionic conductivity) are obtained with MD and show excellent
agreement with experiment. While the diffusion exhibits a systematic decrease with
increasing xLi+ , the contribution of Li+ to ionic conductivity increases until reach-
ing a saturation doping level of xLi+ = 0.10. Comparatively, the Li+ conductivity of
[pyr14][TFSI] is an order of magnitude lower than that of the other liquids, which range
between 0.1-0.3 mS/cm. Our transport results also demonstrate the necessity of long
MD simulation runs (∼ 200 ns) required to converge transport properties at room T .
The differences in Li+ transport are reflected in the residence times of Li+ with the
anions (τLi/−), which are revealed to be much larger for [pyr14][TFSI] (up to 100 ns
at the highest doping levels) than in either [EMIM][BF4] or [pyr13][FSI]. Finally, to
comment on the relative kinetics of Li+ transport in each liquid, we find that while the
net motion of Li+ with its solvation shell (vehicular) significantly contributes to net
diffusion in all liquids, the importance of transport through anion exchange (hopping)
increases at high xLi+ and in liquids with large anions.
2
Introduction
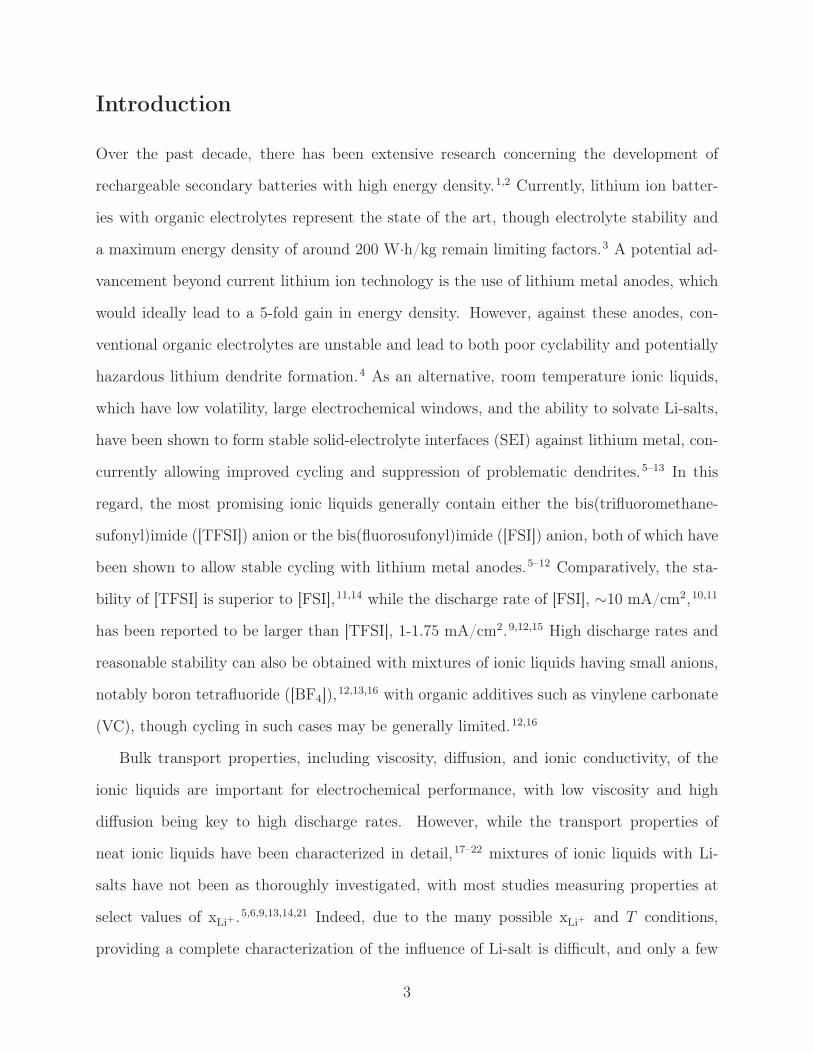
Over the past decade, there has been extensive research concerning the development of
rechargeable secondary batteries with high energy density.1,2 Currently, lithium ion batter-
ies with organic electrolytes represent the state of the art, though electrolyte stability and
a maximum energy density of around 200 W·h/kg remain limiting factors.3 A potential ad-
vancement beyond current lithium ion technology is the use of lithium metal anodes, which
would ideally lead to a 5-fold gain in energy density. However, against these anodes, con-
ventional organic electrolytes are unstable and lead to both poor cyclability and potentially
hazardous lithium dendrite formation.4 As an alternative, room temperature ionic liquids,
which have low volatility, large electrochemical windows, and the ability to solvate Li-salts,
have been shown to form stable solid-electrolyte interfaces (SEI) against lithium metal, con-
currently allowing improved cycling and suppression of problematic dendrites.5–13 In this
regard, the most promising ionic liquids generally contain either the bis(trifluoromethane-
sufonyl)imide ([TFSI]) anion or the bis(fluorosufonyl)imide ([FSI]) anion, both of which have
been shown to allow stable cycling with lithium metal anodes.5–12 Comparatively, the sta-
bility of [TFSI] is superior to [FSI],11,14 while the discharge rate of [FSI], ∼10 mA/cm2,10,11
has been reported to be larger than [TFSI], 1-1.75 mA/cm2.9,12,15 High discharge rates and
reasonable stability can also be obtained with mixtures of ionic liquids having small anions,
notably boron tetrafluoride ([BF4]),12,13,16 with organic additives such as vinylene carbonate
(VC), though cycling in such cases may be generally limited.12,16
Bulk transport properties, including viscosity, diffusion, and ionic conductivity, of the
ionic liquids are important for electrochemical performance, with low viscosity and high
diffusion being key to high discharge rates. However, while the transport properties of
neat ionic liquids have been characterized in detail,17–22 mixtures of ionic liquids with Li-
salts have not been as thoroughly investigated, with most studies measuring properties at
select values of xLi+ .5,6,9,13,14,21 Indeed, due to the many possible xLi+ and T conditions,
providing a complete characterization of the influence of Li-salt is difficult, and only a few
3
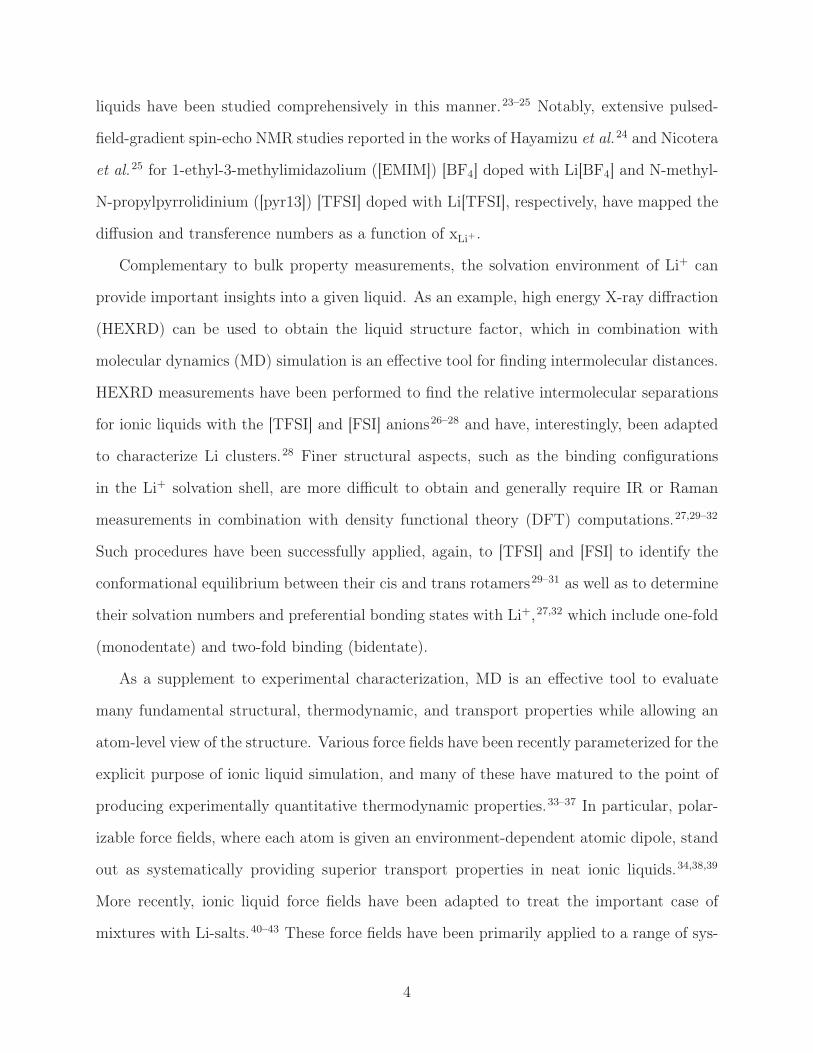
liquids have been studied comprehensively in this manner.23–25 Notably, extensive pulsed-
field-gradient spin-echo NMR studies reported in the works of Hayamizu et al.24 and Nicotera
et al.25 for 1-ethyl-3-methylimidazolium ([EMIM]) [BF4] doped with Li[BF4] and N-methyl-
N-propylpyrrolidinium ([pyr13]) [TFSI] doped with Li[TFSI], respectively, have mapped the
diffusion and transference numbers as a function of xLi+ .
Complementary to bulk property measurements, the solvation environment of Li+ can
provide important insights into a given liquid. As an example, high energy X-ray diffraction
(HEXRD) can be used to obtain the liquid structure factor, which in combination with
molecular dynamics (MD) simulation is an effective tool for finding intermolecular distances.
HEXRD measurements have been performed to find the relative intermolecular separations
for ionic liquids with the [TFSI] and [FSI] anions26–28 and have, interestingly, been adapted
to characterize Li clusters.28 Finer structural aspects, such as the binding configurations
in the Li+ solvation shell, are more difficult to obtain and generally require IR or Raman
measurements in combination with density functional theory (DFT) computations.27,29–32
Such procedures have been successfully applied, again, to [TFSI] and [FSI] to identify the
conformational equilibrium between their cis and trans rotamers29–31 as well as to determine
their solvation numbers and preferential bonding states with Li+,27,32 which include one-fold
(monodentate) and two-fold binding (bidentate).
As a supplement to experimental characterization, MD is an effective tool to evaluate
many fundamental structural, thermodynamic, and transport properties while allowing an
atom-level view of the structure. Various force fields have been recently parameterized for the
explicit purpose of ionic liquid simulation, and many of these have matured to the point of
producing experimentally quantitative thermodynamic properties.33–37 In particular, polar-
izable force fields, where each atom is given an environment-dependent atomic dipole, stand
out as systematically providing superior transport properties in neat ionic liquids.34,38,39
More recently, ionic liquid force fields have been adapted to treat the important case of
mixtures with Li-salts.40–43 These force fields have been primarily applied to a range of sys-
4
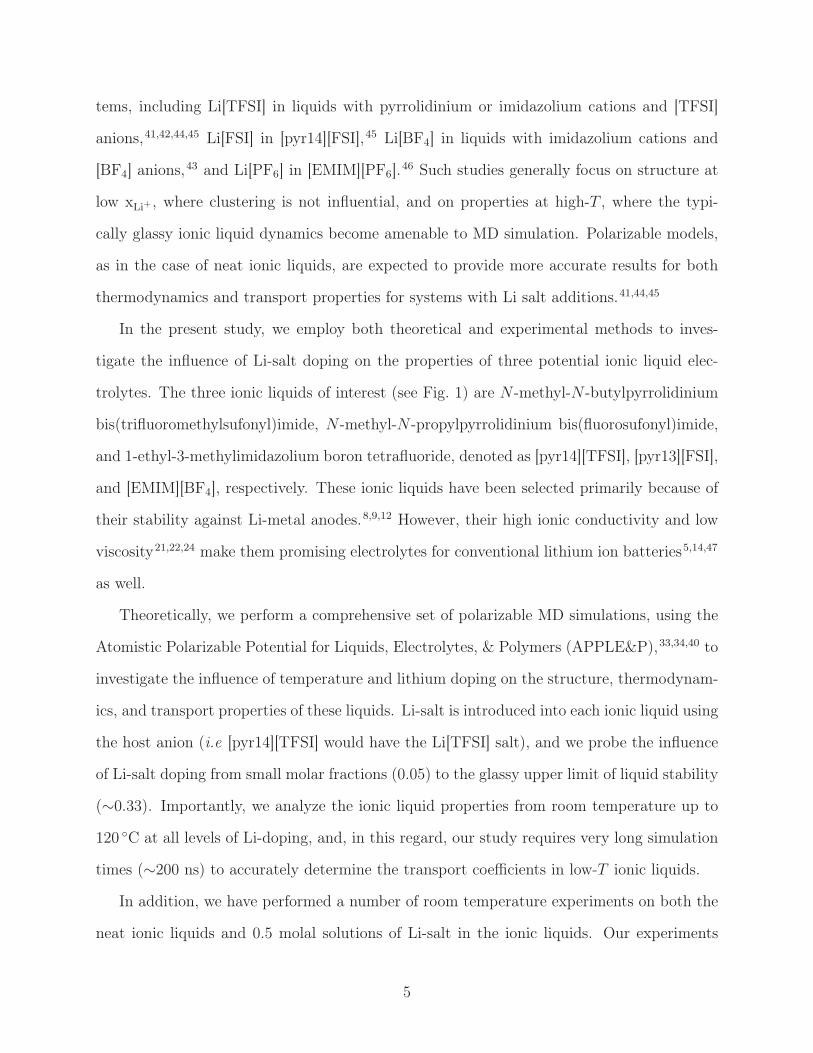
tems, including Li[TFSI] in liquids with pyrrolidinium or imidazolium cations and [TFSI]
anions,41,42,44,45 Li[FSI] in [pyr14][FSI],45 Li[BF4] in liquids with imidazolium cations and
[BF4] anions,43 and Li[PF6] in [EMIM][PF6].46 Such studies generally focus on structure at
low xLi+ , where clustering is not influential, and on properties at high-T , where the typi-
cally glassy ionic liquid dynamics become amenable to MD simulation. Polarizable models,
as in the case of neat ionic liquids, are expected to provide more accurate results for both
thermodynamics and transport properties for systems with Li salt additions.41,44,45
In the present study, we employ both theoretical and experimental methods to inves-
tigate the influence of Li-salt doping on the properties of three potential ionic liquid elec-
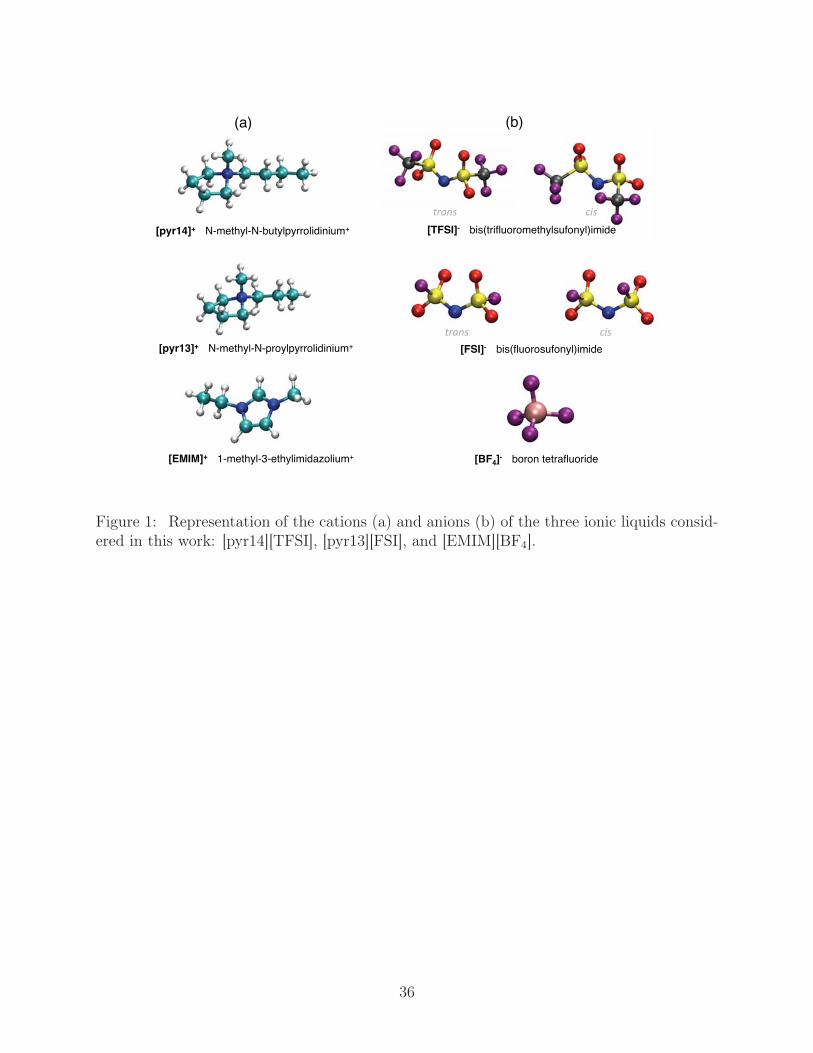
trolytes. The three ionic liquids of interest (see Fig. 1) are N -methyl-N -butylpyrrolidinium
bis(trifluoromethylsufonyl)imide, N -methyl-N -propylpyrrolidinium bis(fluorosufonyl)imide,
and 1-ethyl-3-methylimidazolium boron tetrafluoride, denoted as [pyr14][TFSI], [pyr13][FSI],
and [EMIM][BF4], respectively. These ionic liquids have been selected primarily because of
their stability against Li-metal anodes.8,9,12 However, their high ionic conductivity and low
viscosity21,22,24 make them promising electrolytes for conventional lithium ion batteries5,14,47
as well.
Theoretically, we perform a comprehensive set of polarizable MD simulations, using the
Atomistic Polarizable Potential for Liquids, Electrolytes, & Polymers (APPLE&P),33,34,40 to
investigate the influence of temperature and lithium doping on the structure, thermodynam-
ics, and transport properties of these liquids. Li-salt is introduced into each ionic liquid using
the host anion (i.e [pyr14][TFSI] would have the Li[TFSI] salt), and we probe the influence
of Li-salt doping from small molar fractions (0.05) to the glassy upper limit of liquid stability
(∼0.33). Importantly, we analyze the ionic liquid properties from room temperature up to
120 ◦C at all levels of Li-doping, and, in this regard, our study requires very long simulation
times (∼200 ns) to accurately determine the transport coefficients in low-T ionic liquids.
In addition, we have performed a number of room temperature experiments on both the
neat ionic liquids and 0.5 molal solutions of Li-salt in the ionic liquids. Our experiments
5
include measures of density, pulsed field gradient spin-echo NMR measurements of diffusion
coefficients, and electrochemical impedance spectroscopy measurements of ionic conductivity.
Methods
APPLE&P Interatomic Potential
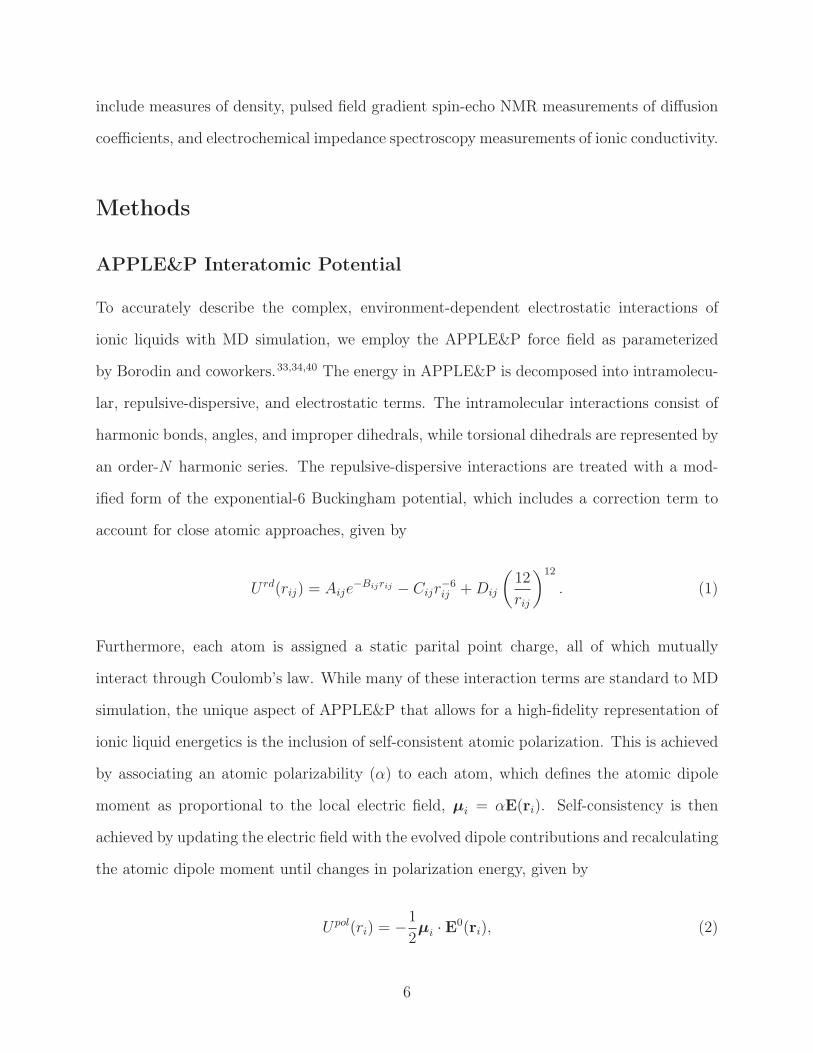
To accurately describe the complex, environment-dependent electrostatic interactions of
ionic liquids with MD simulation, we employ the APPLE&P force field as parameterized
by Borodin and coworkers.33,34,40 The energy in APPLE&P is decomposed into intramolecu-
lar, repulsive-dispersive, and electrostatic terms. The intramolecular interactions consist of
harmonic bonds, angles, and improper dihedrals, while torsional dihedrals are represented by
an order-N harmonic series. The repulsive-dispersive interactions are treated with a mod-
ified form of the exponential-6 Buckingham potential, which includes a correction term to
account for close atomic approaches, given by
U rd(rij) = Aije−Bijrij − Cijr
−6ij +Dij
(12
rij
)12
. (1)
Furthermore, each atom is assigned a static parital point charge, all of which mutually
interact through Coulomb’s law. While many of these interaction terms are standard to MD
simulation, the unique aspect of APPLE&P that allows for a high-fidelity representation of
ionic liquid energetics is the inclusion of self-consistent atomic polarization. This is achieved
by associating an atomic polarizability (α) to each atom, which defines the atomic dipole
moment as proportional to the local electric field, μi = αE(ri). Self-consistency is then
achieved by updating the electric field with the evolved dipole contributions and recalculating
the atomic dipole moment until changes in polarization energy, given by
Upol(ri) = −1
2μi · E0(ri), (2)
6
where E0(ri) is the electrostatic field contribution from permanent charges only, reach a
requisite tolerance. Specific to the [FSI] and [TFSI] anions investigated in this work and in
addition to the atom center terms, a single lone-pair force center is associated with the S-N-S
bridge, and the position of this center is instantaneously determined during the simulations
as a given distance, � = 1.4 Å, along a bisector of the S-N-S angle.
Molecular Dynamics Simulations
The majority of the MD simulations in the present work are performed with the Large-scale
Atomic / Molecular Massively Parallel Simulator (LAMMPS).48 We have modified LAMMPS
to include the following functionalities required by APPLE&P: lone pairs force centers for
the [TFSI] and [FSI] anions; self-consistent update of atomic dipoles using the previously
discussed atomic polarizability; and energy, force, and virial terms that arise from long
range charge-dipole interactions. For purposes of validation and statistical error estimation,
a small subset of simulations on [pyr14][TFSI] are duplicated with Lucretius 49 an simulation
package specifically tailored to perform MD simulation using the APPLE&P. The simulations
are integrated using a 3-2-1 reversible reference system propagation algorithm (rRESPA),50
which allows the use of a large 3 fs timestep for the long-range Ewald summation of the
charge and dipole interactions; a 1.5 fs timestep for local charge, repulsive-dispersive, and
dihedral interactions; and 0.5 fs for the remaining bonds, angles, and improper dihedrals. The
cutoff used for non-bonded interactions is 12 Å for [pyr14][TFSI] and [pyr13][FSI] systems
and 11 Å for [EMIM][BF4] systems; the cutoff used for non-bonded interactions in the 1.5
fs rRESPA step is 7 Å. For further efficiency, a coupled reaction field/Ewald summation
formalism is employed in the outer rRESPA partition to evaluate the dipole-dipole (reaction
field) and dipole-charge (Ewald summation) long range interactions; these computations are
performed iteratively in the outer partition until the change in the dipole energy reaches a
convergence criterion of 10−9 kcal/mol.
The systems used in our MD simulations contain 144 cation/anion pairs for the [pyr14]-
7
[TFSI] ionic liquid and 216 pairs for both the [pyr13][FSI] and [EMIM][BF4] ionic liquids, and
Li-salt is introduced into each system by replacing a given number of cations with lithium
ions. At T = 298 K, we perform MD simulations across a range of Li-salt mole fractions
(xLi+ from 0.05 to 0.33), while at higher-T we perform calculations at select values of xLi+
that correspond to specific experimental conditions. To equilibrate each system, we perform
simulations at ambient P and the desired T using the Nosé-Hoover thermostat and barostat.
The thermalization is carried out over 20 ns at each T , which we have found to be sufficient
for density convergence in the system with the lowest temperature and the highest Li-salt
doping.
There are additional challenges to the MD simulation of ionic liquids with Li-salt doping,
primarily due to the glassy nature of the systems at T ≤ 333 K. This is especially relevant
when considering the calculation of transport coefficients, which are well known to converge
more slowly than other properties like density. To ensure convergence, we progressively
compute the transport properties by incrementally adding 30-50 ns of simulation statistics
to the transport average until the change in the property of interest is less than 5%. In this
way, we have determined that simulations of 200 ns are required to converge the transport
properties for the T = 298 K and 333 K systems, while 90-120 ns simulation times appear
more than sufficient to converge properties at higher T .
Experimental Techniques
We have performed extensive experimental characterization of [pyr14][TFSI], [EMIM][BF4],
and [pyr13][FSI] in both neat samples and those having 0.5 moles of Li-salt per kilogram of
ionic liquid, denoted as a 0.5 molal solution (m). For these liquids we have measured the
density, diffusion and ionic conductivity.
Density is measured under an argon atmosphere (humidity ≤ 1 ppm) in a glovebox at
room temperature, using a 5 cm3 graduated cylinder (0.1 cm3 graduations). Mass is measured
to the nearest milligram with a calculated uncertainty of <3%.
8
The diffusion coefficients of cation and anion species are measured by pulse-field gradient
spin echo NMR. The signals of the methyl 1H and 19F are used to determine the self-diffusion
coefficients (D+ and D−) of the cations and anions, respectively, and in the presence of
lithium salt, the signal of 7Li is used to determine the Li+ diffusion coefficient. In the NMR
experiments, D is obtained using
ln(A/A0) = −Dγ2(∇− δ/3)δ2g2, (3)
where A and A0 represent the signal integrals in the presence of and absence of the pulsed-
field gradient, γ is the nuclear magnetogyric ratio, ∇ is the time interval between the two
gradient pulses, δ is the gradient pulse width, and g is the gradient magnitude.
Samples are loaded into a 5 mm cylindrical thin wall 9” NMR tube inside a glovebox
and at room temperature, and then the NMR tube was sealed tightly with the cup coming
with the tube as the tube was purchased. A total of four samples were prepared and loaded
into the tubes for NMR measurements: [pyr14][TFSI]; 0.5 m Li[TFSI] in [pyr14][TFSI];
[EMIM][BF4]; 0.5 m Li[BF4] in [EMIM][BF4]. All samples were made with pure materials
and no d-solvent was added. Although the samples inside the NMR tubes were cupped and
tightly sealed, the samples were also kept in a desiccator to prevent moisture pick-up before
measurement.
The samples are inserted into 5 mm BB (broad band) PFG (pulsed field gradient) probe
equipped with a triple axis gradient amplifier, and all the measurements were collected on
a Varian VNMRS 500 MHz spectrometer. The grade type “ppp" was used to achieve the
highest gradient strength of 130 G/cm, which is the result of using two PFG amplifiers
together with the grade type selection. A doped D2O standard sample from Agilent was
used to calibrate the gradients before the experiments are carried out. In addition, before
each experiment, the 90◦ pulse width was determined on each nuclei (1H, 19F , and 7Li) for
every sample. Typically, 32-64 transients were used to collect the data for each experiment
9
depending on the signal to noise ratio. The diffusion coefficients of Li+, cations, and anions
are measured at 30◦C, with sample temperature being controlled by a variable temperature
control unit using a heated dry air. The experimental errors in the diffusion coefficient
measurements are estimated to be less than 3%.
Ionic conductivities are determined by electrochemical impedance spectroscopy (EIS)
methods, using a Solarton 1250 frequency response analyzer coupled to a Solartron 1286
electrochemical interface. The operation of these instruments is automated using Scribner
and Associates’ Zpolt R© software for Windows. Impedance is measured using a 10 mV ampli-
tude signal (55 kHz to 0.1 Hz) with the cell held at the open-circuit potential. Such methods
have been previously used to measure the conductivity of polymer electrolytes.51,52 The con-
ductivity fixture, displayed in Figure S6 of the supplementary, uses 1-inch diameter, AISI
304 stainless steel electrodes, mounted in rigid, electrically insulating plates. The electrodes
are lapped flat with the inside face of the insulating plate, and polished with 600 grit emery
cloth. Steel dowel pins control the alignment of the electrodes, and inter-electrode spacing
is established by a slotted, polypropylene mask, which confines the liquid sample between
the electrodes. The electrode spacing is typically 1 mm.
Material handling and cell assembly are performed inside an inert atmosphere glovebox
to minimize the absorption of water (humidity ≤ 1 ppm). After assembly, the fixtures are
sealed in modified NalgeneTM jars before being transferred out of the glovebox atmosphere
for testing. Measurements are typically completed between 20oC and 80oC, with temperature
being allowed to stabilize at ±0.1oC before testing. Electrode spacing, L, and area, A, are
controlled by the fixture, and electrochemical impedance data provides a measure of sample
bulk-resistence, Rb. Ionic conductivity, λ, is calculated using λ = L/ARb. The error in the
calculated conductivity is ±10%, based on tolerances for L, A, and Rb.
10
Structural Implications of Li-doping
Ionic Liquid Coordination and Conformations
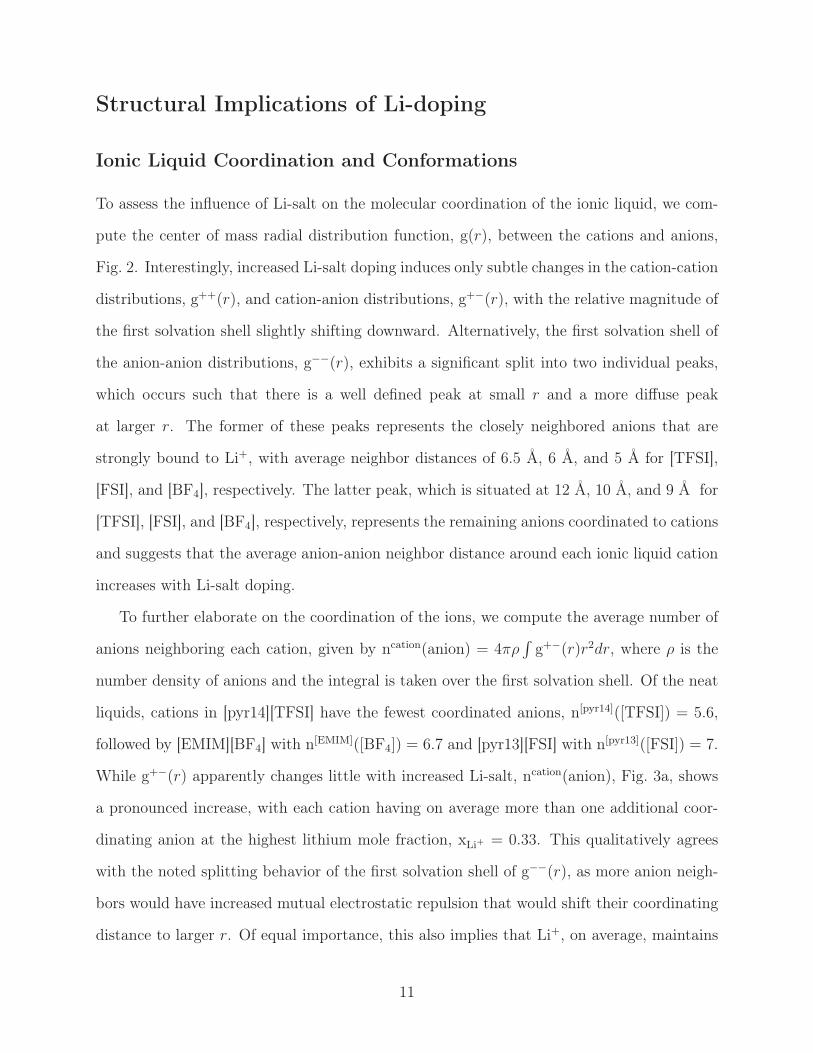
To assess the influence of Li-salt on the molecular coordination of the ionic liquid, we com-
pute the center of mass radial distribution function, g(r), between the cations and anions,
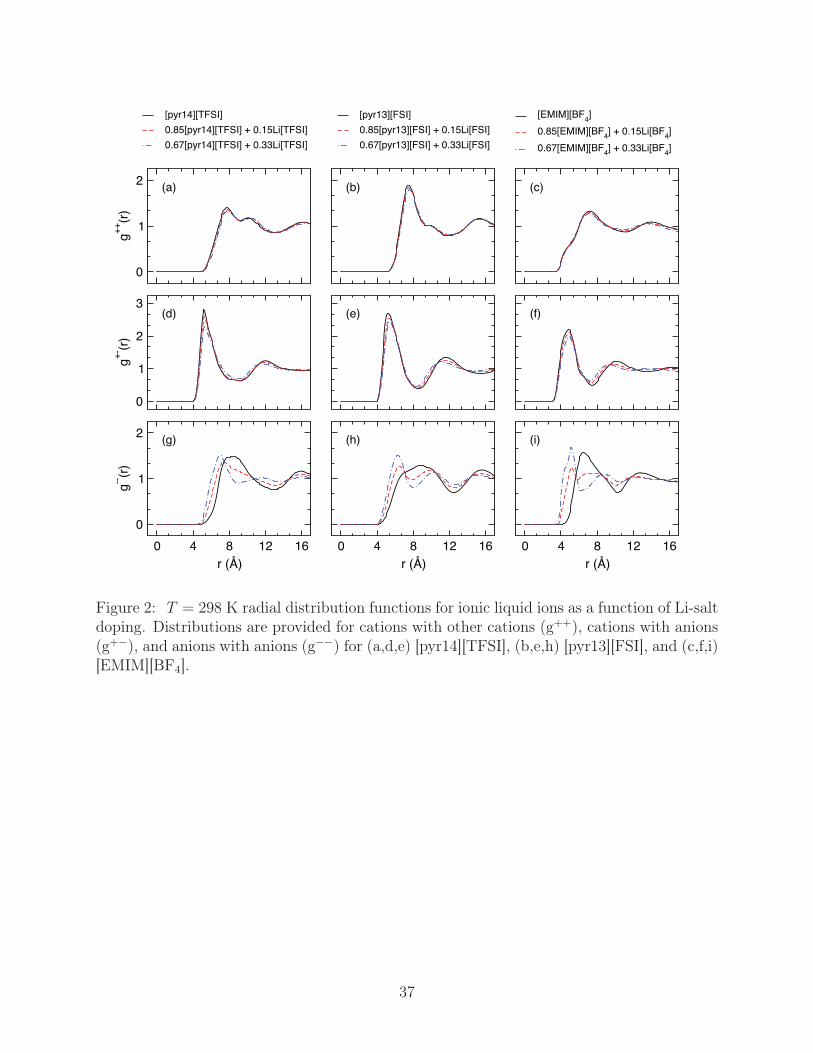
Fig. 2. Interestingly, increased Li-salt doping induces only subtle changes in the cation-cation
distributions, g++(r), and cation-anion distributions, g+−(r), with the relative magnitude of
the first solvation shell slightly shifting downward. Alternatively, the first solvation shell of
the anion-anion distributions, g−−(r), exhibits a significant split into two individual peaks,
which occurs such that there is a well defined peak at small r and a more diffuse peak
at larger r. The former of these peaks represents the closely neighbored anions that are
strongly bound to Li+, with average neighbor distances of 6.5 Å, 6 Å, and 5 Å for [TFSI],
[FSI], and [BF4], respectively. The latter peak, which is situated at 12 Å, 10 Å, and 9 Å for
[TFSI], [FSI], and [BF4], respectively, represents the remaining anions coordinated to cations
and suggests that the average anion-anion neighbor distance around each ionic liquid cation
increases with Li-salt doping.
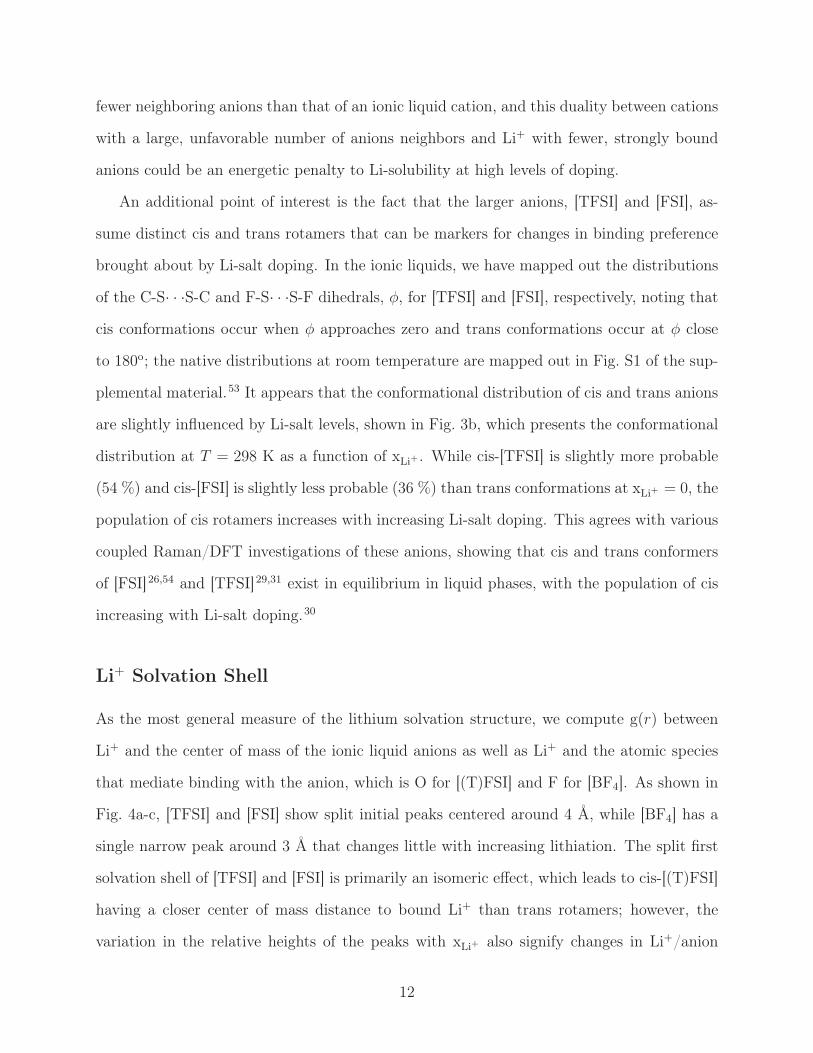
To further elaborate on the coordination of the ions, we compute the average number of
anions neighboring each cation, given by ncation(anion) = 4πρ∫
g+−(r)r2dr, where ρ is the
number density of anions and the integral is taken over the first solvation shell. Of the neat
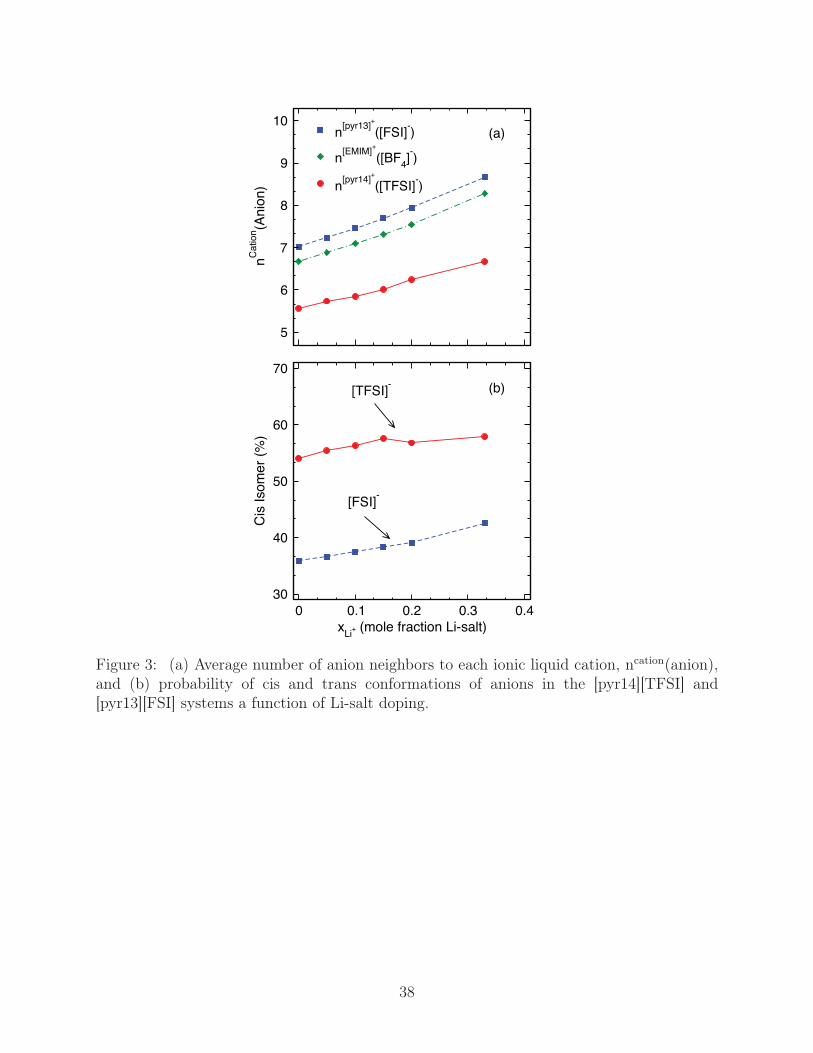
liquids, cations in [pyr14][TFSI] have the fewest coordinated anions, n[pyr14]([TFSI]) = 5.6,
followed by [EMIM][BF4] with n[EMIM]([BF4]) = 6.7 and [pyr13][FSI] with n[pyr13]([FSI]) = 7.
While g+−(r) apparently changes little with increased Li-salt, ncation(anion), Fig. 3a, shows
a pronounced increase, with each cation having on average more than one additional coor-
dinating anion at the highest lithium mole fraction, xLi+ = 0.33. This qualitatively agrees
with the noted splitting behavior of the first solvation shell of g−−(r), as more anion neigh-
bors would have increased mutual electrostatic repulsion that would shift their coordinating
distance to larger r. Of equal importance, this also implies that Li+, on average, maintains
11
fewer neighboring anions than that of an ionic liquid cation, and this duality between cations
with a large, unfavorable number of anions neighbors and Li+ with fewer, strongly bound
anions could be an energetic penalty to Li-solubility at high levels of doping.
An additional point of interest is the fact that the larger anions, [TFSI] and [FSI], as-
sume distinct cis and trans rotamers that can be markers for changes in binding preference
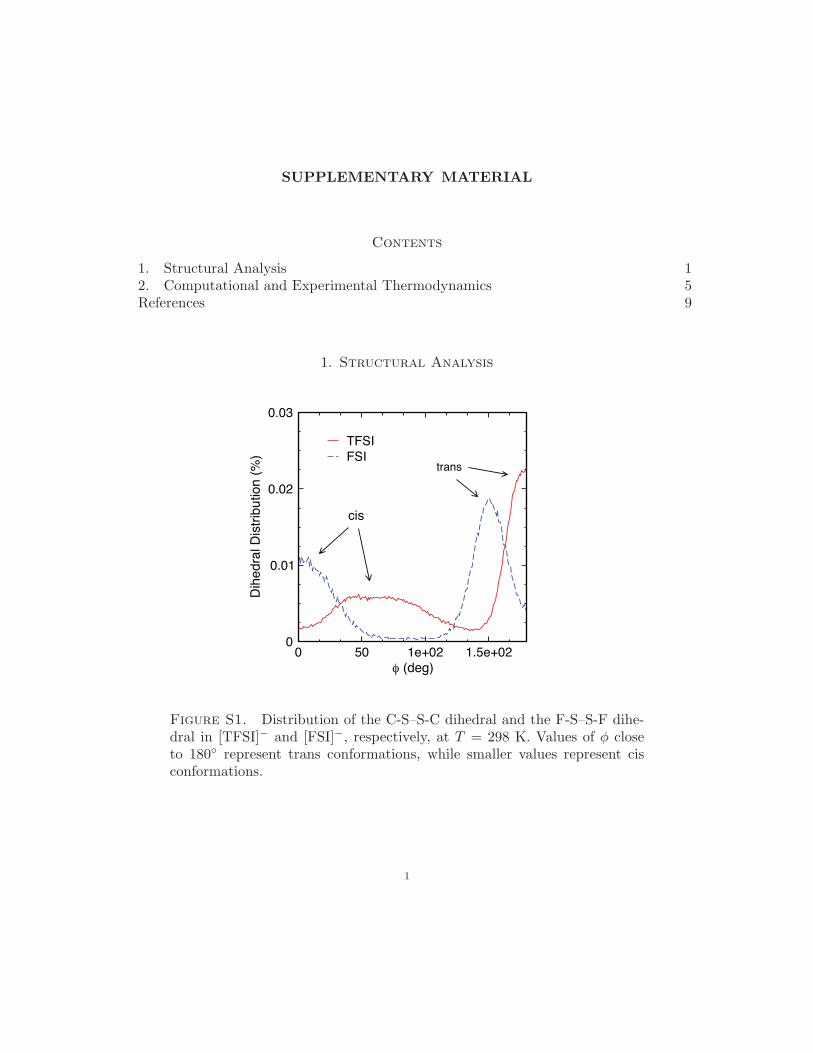
brought about by Li-salt doping. In the ionic liquids, we have mapped out the distributions
of the C-S· · ·S-C and F-S· · ·S-F dihedrals, φ, for [TFSI] and [FSI], respectively, noting that
cis conformations occur when φ approaches zero and trans conformations occur at φ close
to 180o; the native distributions at room temperature are mapped out in Fig. S1 of the sup-
plemental material.53 It appears that the conformational distribution of cis and trans anions
are slightly influenced by Li-salt levels, shown in Fig. 3b, which presents the conformational
distribution at T = 298 K as a function of xLi+ . While cis-[TFSI] is slightly more probable
(54 %) and cis-[FSI] is slightly less probable (36 %) than trans conformations at xLi+ = 0, the
population of cis rotamers increases with increasing Li-salt doping. This agrees with various
coupled Raman/DFT investigations of these anions, showing that cis and trans conformers
of [FSI]26,54 and [TFSI]29,31 exist in equilibrium in liquid phases, with the population of cis
increasing with Li-salt doping.30
Li+ Solvation Shell
As the most general measure of the lithium solvation structure, we compute g(r) between
Li+ and the center of mass of the ionic liquid anions as well as Li+ and the atomic species
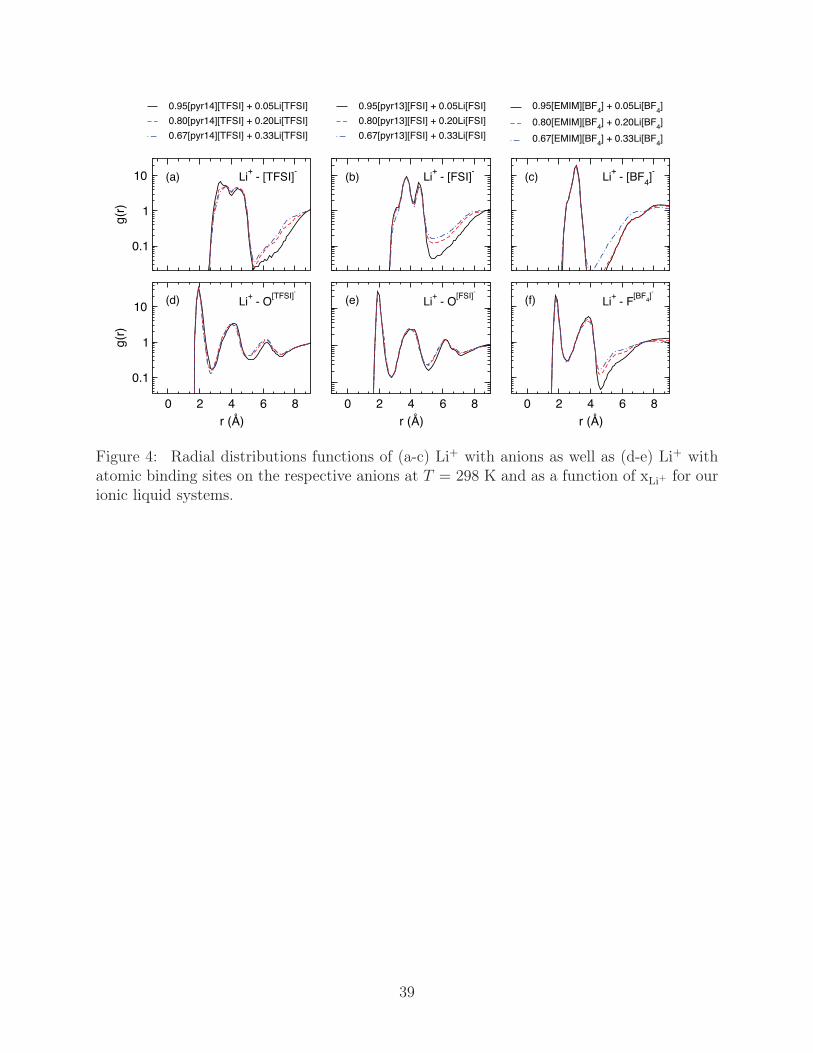
that mediate binding with the anion, which is O for [(T)FSI] and F for [BF4]. As shown in
Fig. 4a-c, [TFSI] and [FSI] show split initial peaks centered around 4 Å, while [BF4] has a
single narrow peak around 3 Å that changes little with increasing lithiation. The split first
solvation shell of [TFSI] and [FSI] is primarily an isomeric effect, which leads to cis-[(T)FSI]
having a closer center of mass distance to bound Li+ than trans rotamers; however, the
variation in the relative heights of the peaks with xLi+ also signify changes in Li+/anion
12
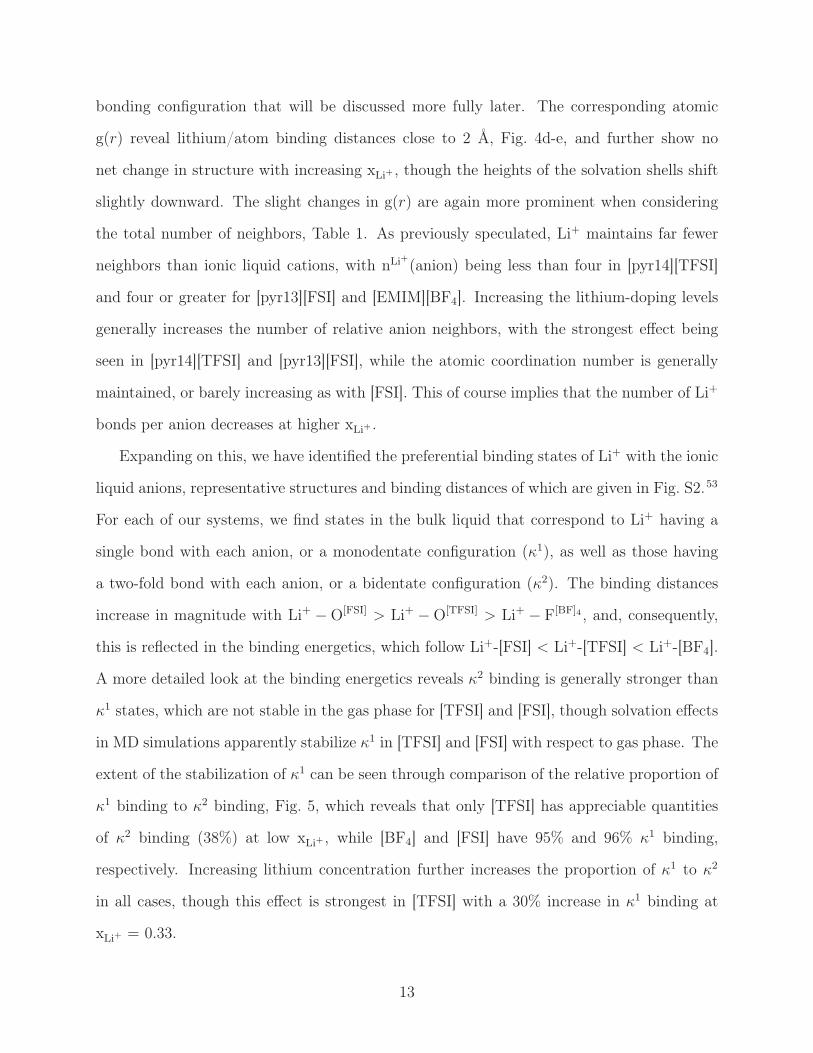
bonding configuration that will be discussed more fully later. The corresponding atomic
g(r) reveal lithium/atom binding distances close to 2 Å, Fig. 4d-e, and further show no
net change in structure with increasing xLi+ , though the heights of the solvation shells shift
slightly downward. The slight changes in g(r) are again more prominent when considering
the total number of neighbors, Table 1. As previously speculated, Li+ maintains far fewer
neighbors than ionic liquid cations, with nLi+(anion) being less than four in [pyr14][TFSI]
and four or greater for [pyr13][FSI] and [EMIM][BF4]. Increasing the lithium-doping levels
generally increases the number of relative anion neighbors, with the strongest effect being
seen in [pyr14][TFSI] and [pyr13][FSI], while the atomic coordination number is generally
maintained, or barely increasing as with [FSI]. This of course implies that the number of Li+
bonds per anion decreases at higher xLi+ .
Expanding on this, we have identified the preferential binding states of Li+ with the ionic
liquid anions, representative structures and binding distances of which are given in Fig. S2.53
For each of our systems, we find states in the bulk liquid that correspond to Li+ having a
single bond with each anion, or a monodentate configuration (κ1), as well as those having
a two-fold bond with each anion, or a bidentate configuration (κ2). The binding distances
increase in magnitude with Li+ − O[FSI] > Li+ − O[TFSI] > Li+ − F[BF]4 , and, consequently,
this is reflected in the binding energetics, which follow Li+-[FSI] < Li+-[TFSI] < Li+-[BF4].
A more detailed look at the binding energetics reveals κ2 binding is generally stronger than
κ1 states, which are not stable in the gas phase for [TFSI] and [FSI], though solvation effects
in MD simulations apparently stabilize κ1 in [TFSI] and [FSI] with respect to gas phase. The
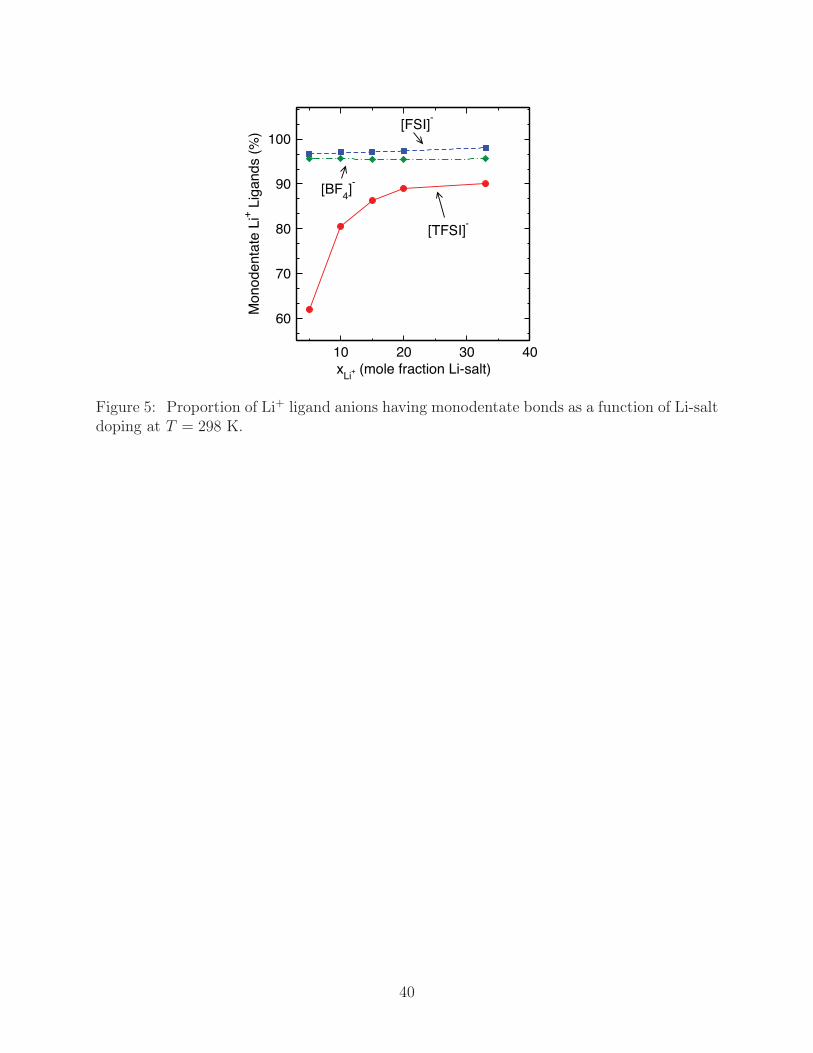
extent of the stabilization of κ1 can be seen through comparison of the relative proportion of
κ1 binding to κ2 binding, Fig. 5, which reveals that only [TFSI] has appreciable quantities
of κ2 binding (38%) at low xLi+ , while [BF4] and [FSI] have 95% and 96% κ1 binding,
respectively. Increasing lithium concentration further increases the proportion of κ1 to κ2
in all cases, though this effect is strongest in [TFSI] with a 30% increase in κ1 binding at
xLi+ = 0.33.
13
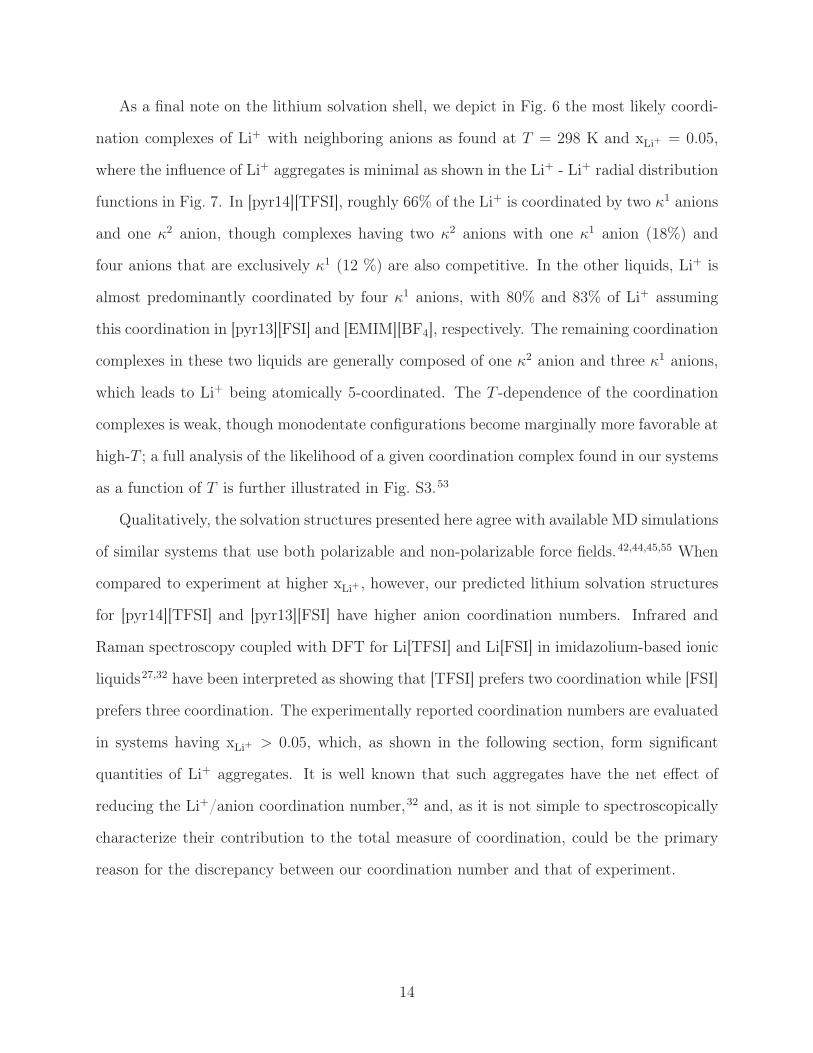
As a final note on the lithium solvation shell, we depict in Fig. 6 the most likely coordi-
nation complexes of Li+ with neighboring anions as found at T = 298 K and xLi+ = 0.05,
where the influence of Li+ aggregates is minimal as shown in the Li+ - Li+ radial distribution
functions in Fig. 7. In [pyr14][TFSI], roughly 66% of the Li+ is coordinated by two κ1 anions
and one κ2 anion, though complexes having two κ2 anions with one κ1 anion (18%) and
four anions that are exclusively κ1 (12 %) are also competitive. In the other liquids, Li+ is
almost predominantly coordinated by four κ1 anions, with 80% and 83% of Li+ assuming
this coordination in [pyr13][FSI] and [EMIM][BF4], respectively. The remaining coordination
complexes in these two liquids are generally composed of one κ2 anion and three κ1 anions,
which leads to Li+ being atomically 5-coordinated. The T -dependence of the coordination
complexes is weak, though monodentate configurations become marginally more favorable at
high-T ; a full analysis of the likelihood of a given coordination complex found in our systems
as a function of T is further illustrated in Fig. S3.53
Qualitatively, the solvation structures presented here agree with available MD simulations
of similar systems that use both polarizable and non-polarizable force fields.42,44,45,55 When
compared to experiment at higher xLi+ , however, our predicted lithium solvation structures
for [pyr14][TFSI] and [pyr13][FSI] have higher anion coordination numbers. Infrared and
Raman spectroscopy coupled with DFT for Li[TFSI] and Li[FSI] in imidazolium-based ionic
liquids27,32 have been interpreted as showing that [TFSI] prefers two coordination while [FSI]
prefers three coordination. The experimentally reported coordination numbers are evaluated
in systems having xLi+ > 0.05, which, as shown in the following section, form significant
quantities of Li+ aggregates. It is well known that such aggregates have the net effect of
reducing the Li+/anion coordination number,32 and, as it is not simple to spectroscopically
characterize their contribution to the total measure of coordination, could be the primary
reason for the discrepancy between our coordination number and that of experiment.
14
Li+ Clusters
As previously mentioned, spectroscopic experiments32 have noted that the Li+/[TFSI] coor-
dination number decreases at high xLi+ , which has been attributed to the tendency of Li+
to aggregate into clusters - networks of lithium ions bound by shared, or bridging, anions.
The signature of such clusters has additionally been noted in HEXRD experiments28 as well
as MD simulations.41 Here, too, we observe the presence of Li+ clusters and attribute the
majority of the aforementioned xLi+-mediated structure dependence to their formation. To
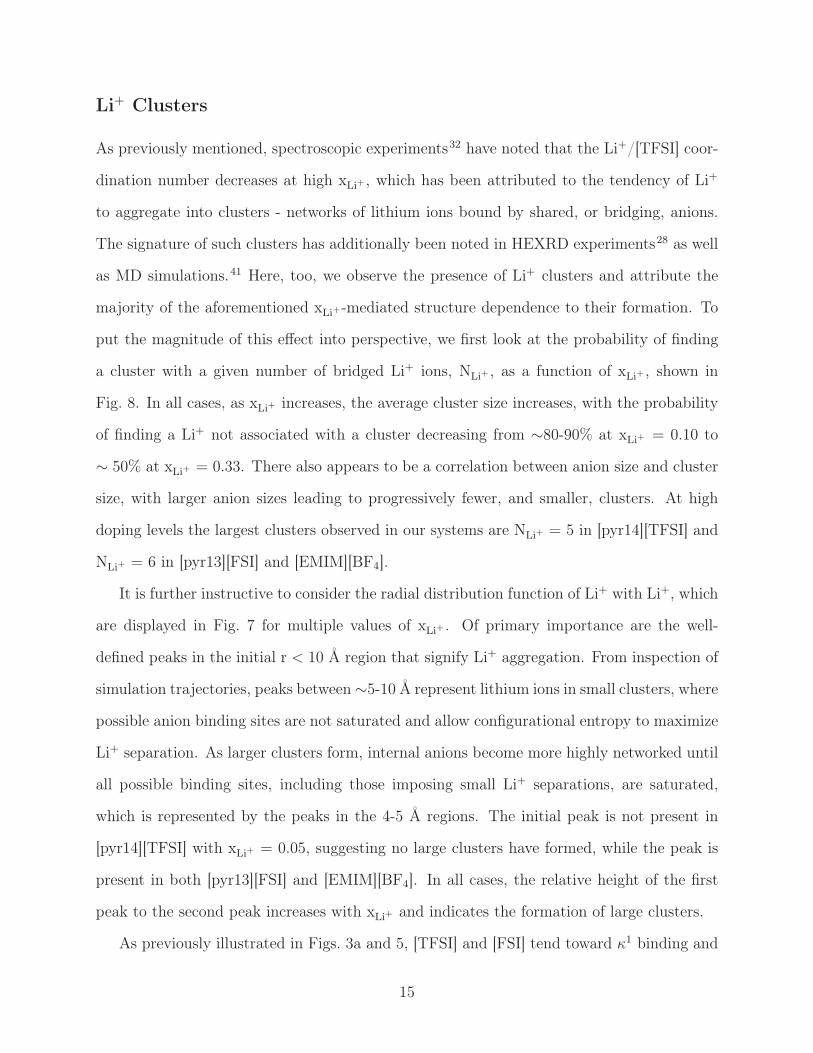
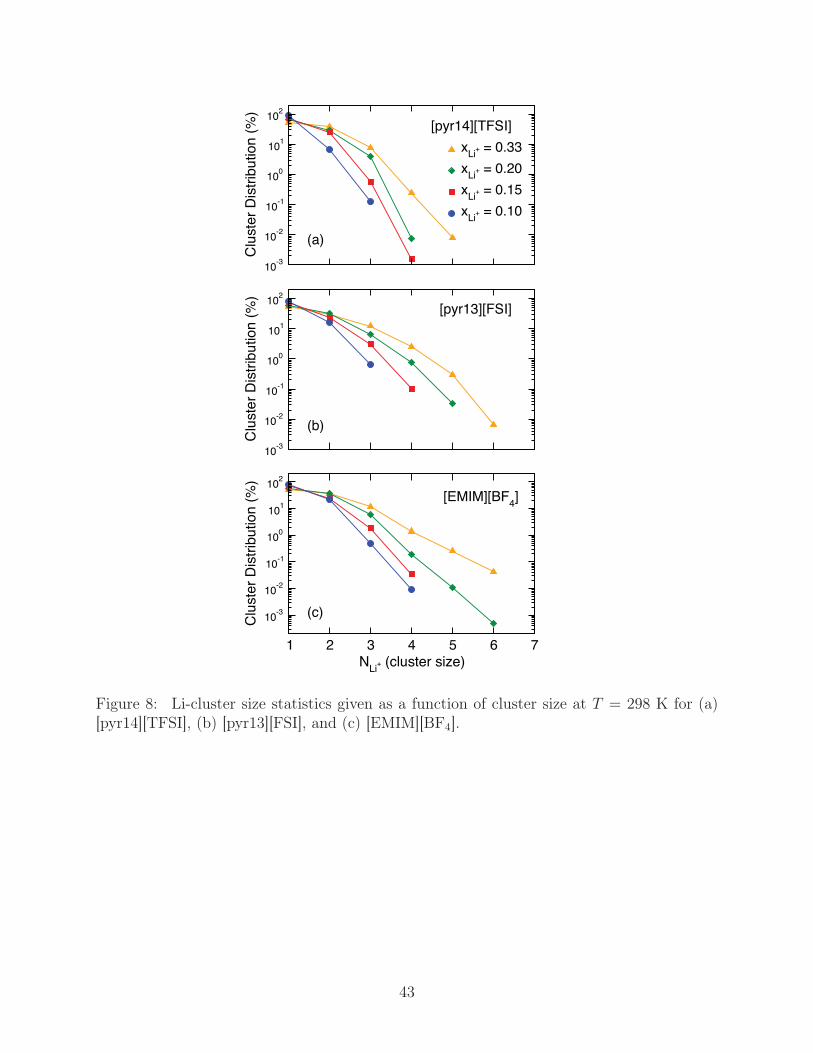
put the magnitude of this effect into perspective, we first look at the probability of finding
a cluster with a given number of bridged Li+ ions, NLi+ , as a function of xLi+ , shown in
Fig. 8. In all cases, as xLi+ increases, the average cluster size increases, with the probability
of finding a Li+ not associated with a cluster decreasing from ∼80-90% at xLi+ = 0.10 to
∼ 50% at xLi+ = 0.33. There also appears to be a correlation between anion size and cluster
size, with larger anion sizes leading to progressively fewer, and smaller, clusters. At high
doping levels the largest clusters observed in our systems are NLi+ = 5 in [pyr14][TFSI] and
NLi+ = 6 in [pyr13][FSI] and [EMIM][BF4].
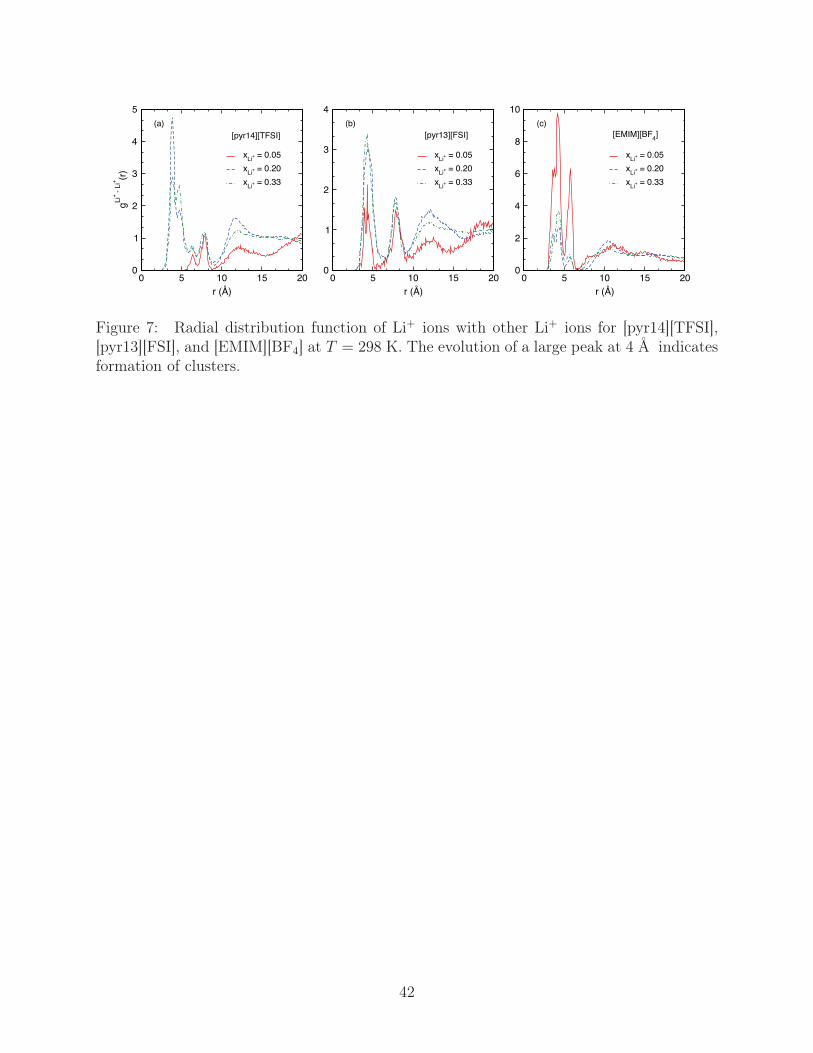
It is further instructive to consider the radial distribution function of Li+ with Li+, which
are displayed in Fig. 7 for multiple values of xLi+ . Of primary importance are the well-
defined peaks in the initial r < 10 Å region that signify Li+ aggregation. From inspection of
simulation trajectories, peaks between ∼5-10 Å represent lithium ions in small clusters, where
possible anion binding sites are not saturated and allow configurational entropy to maximize
Li+ separation. As larger clusters form, internal anions become more highly networked until
all possible binding sites, including those imposing small Li+ separations, are saturated,
which is represented by the peaks in the 4-5 Å regions. The initial peak is not present in
[pyr14][TFSI] with xLi+ = 0.05, suggesting no large clusters have formed, while the peak is
present in both [pyr13][FSI] and [EMIM][BF4]. In all cases, the relative height of the first
peak to the second peak increases with xLi+ and indicates the formation of large clusters.
As previously illustrated in Figs. 3a and 5, [TFSI] and [FSI] tend toward κ1 binding and
15
cis-rotamers as lithium-salt doping increases. To examine the contribution of Li+ aggrega-
tion to these changes, we have evaluated the probability of finding the cis rotamer and κ1
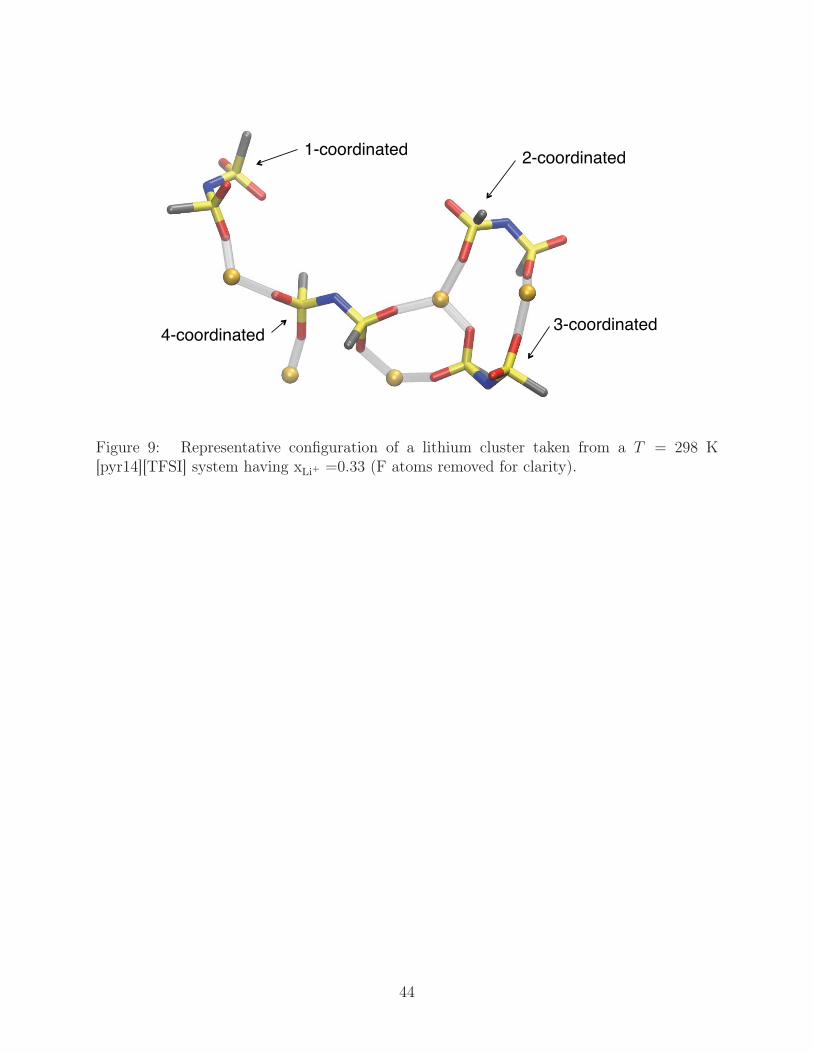
binding in anions coordinated with multiple Li+, the NLi+ = 5 cluster represented in Fig. 9
showing the possible anion coordinations (one Li+ being the minimum and four Li+ being
the maximum). For both the [TFSI] and [FSI] anions, as coordination increases, we find
that the anions tend to primarily assume κ1 binding states and cis configurations. At the
highest coordination, both anions are 100% κ1, each available O binding to a Li+, while 86%
of [TFSI] anions and 82% or [FSI] anions assume the cis conformation. These changes mirror
experimental studies of the condensed phases of Li[FSI] and Li[TFSI], which also generally
trend toward monodentate binding56 and cis-rotamers.57,58 Further evidence of the influence
of clusters is provided in Figs. S4 and S5 of the supplementary, which explicitly evaluate
the cluster contributions to changes in cis-rotamers and κ1 binding in the same manner as
Figs. 3a and 5.
Thermodynamic and Transport Properties
Density
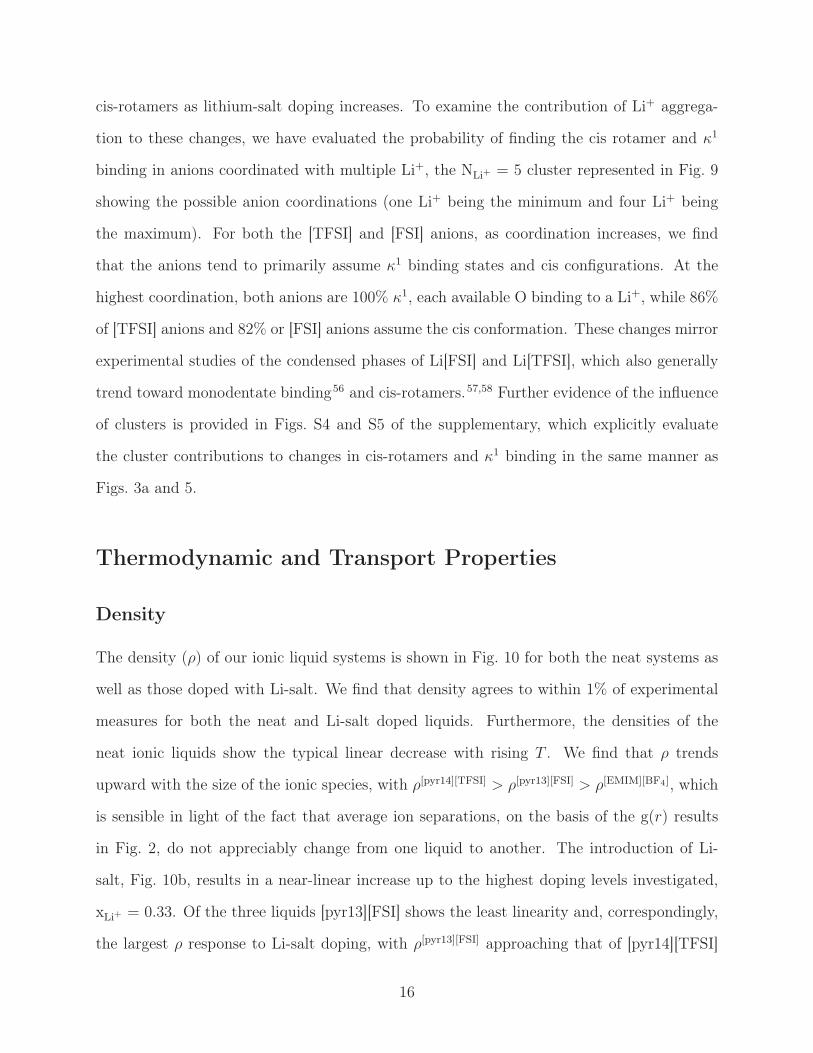
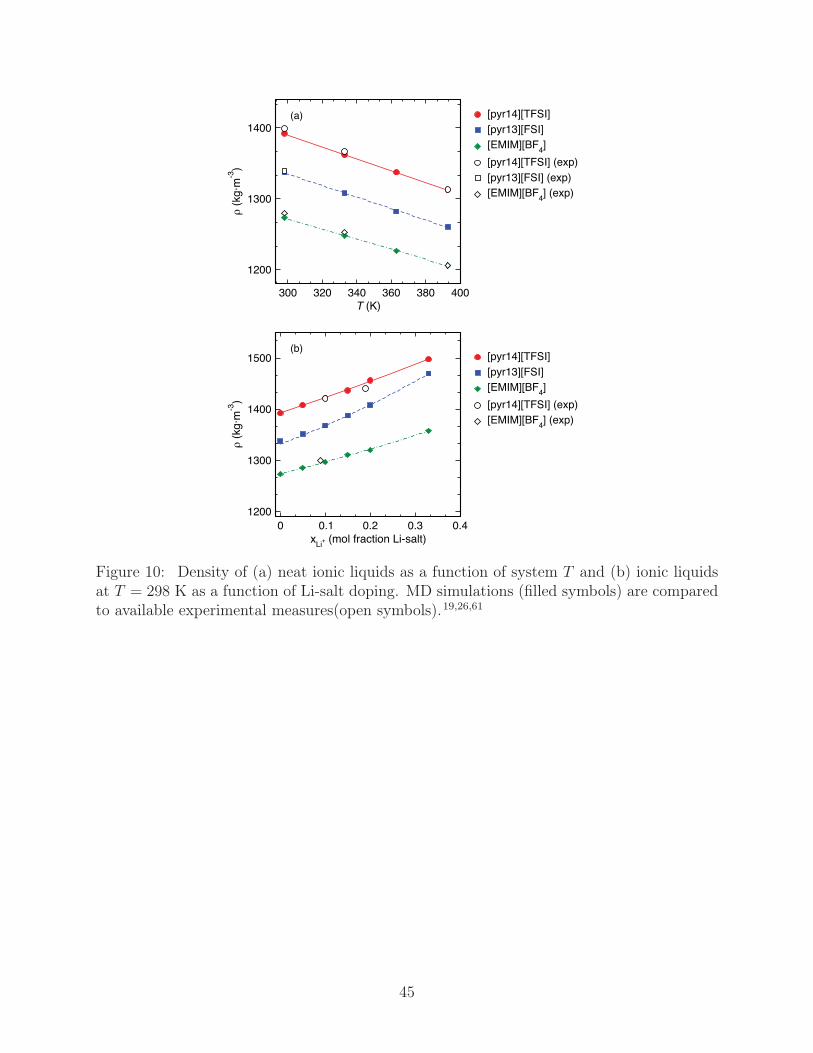
The density (ρ) of our ionic liquid systems is shown in Fig. 10 for both the neat systems as
well as those doped with Li-salt. We find that density agrees to within 1% of experimental
measures for both the neat and Li-salt doped liquids. Furthermore, the densities of the
neat ionic liquids show the typical linear decrease with rising T . We find that ρ trends
upward with the size of the ionic species, with ρ[pyr14][TFSI] > ρ[pyr13][FSI] > ρ[EMIM][BF4], which
is sensible in light of the fact that average ion separations, on the basis of the g(r) results
in Fig. 2, do not appreciably change from one liquid to another. The introduction of Li-
salt, Fig. 10b, results in a near-linear increase up to the highest doping levels investigated,
xLi+ = 0.33. Of the three liquids [pyr13][FSI] shows the least linearity and, correspondingly,
the largest ρ response to Li-salt doping, with ρ[pyr13][FSI] approaching that of [pyr14][TFSI]
16
at high xLi+ . The relatively large ρ increase is indicative of the efficient packing of [FSI]
around [pyr13] and Li+, which is supported on the basis of Fig. 3a and Table 1, where the
[pyr13][FSI] have the largest values of ncation(anion) and nLi+(anion) at high xLi+ .
Transport Properties
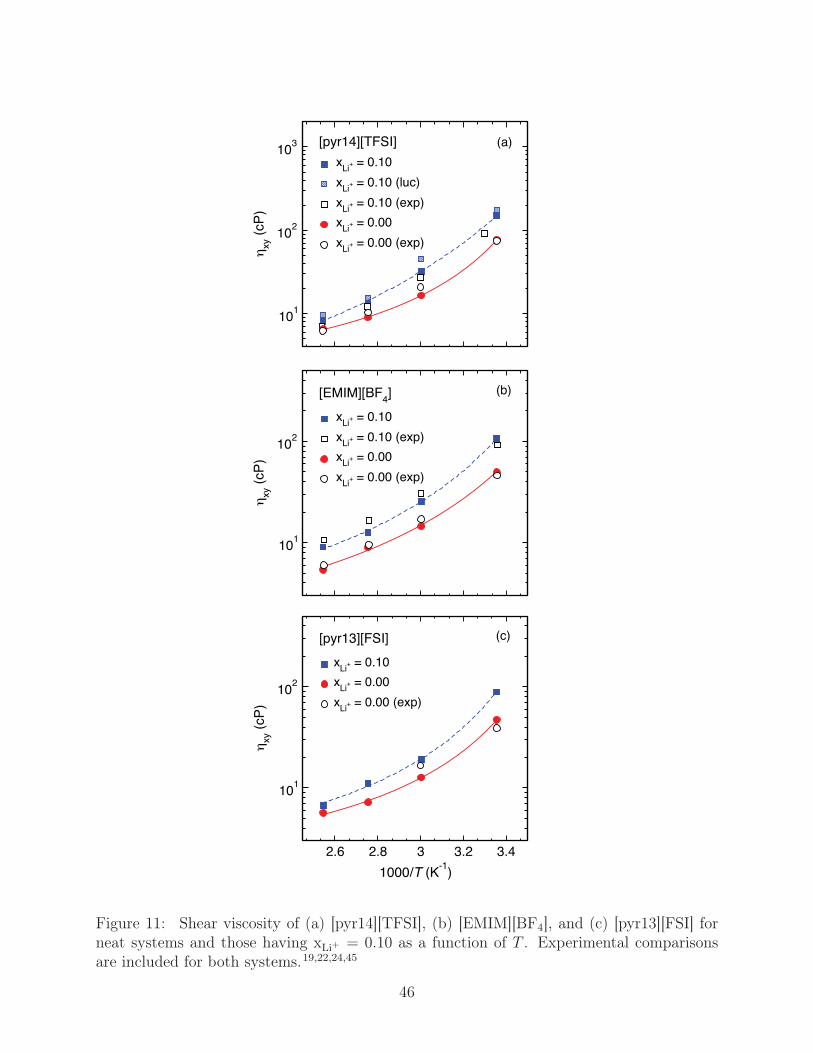
To compute the shear viscosity (ηxy) of the ionic liquids, we have employed the Green-Kubo
relation,
ηxy =V
kBT
∫ ∞
0
〈Pxy(t)Pxy(0)〉 dt, (4)
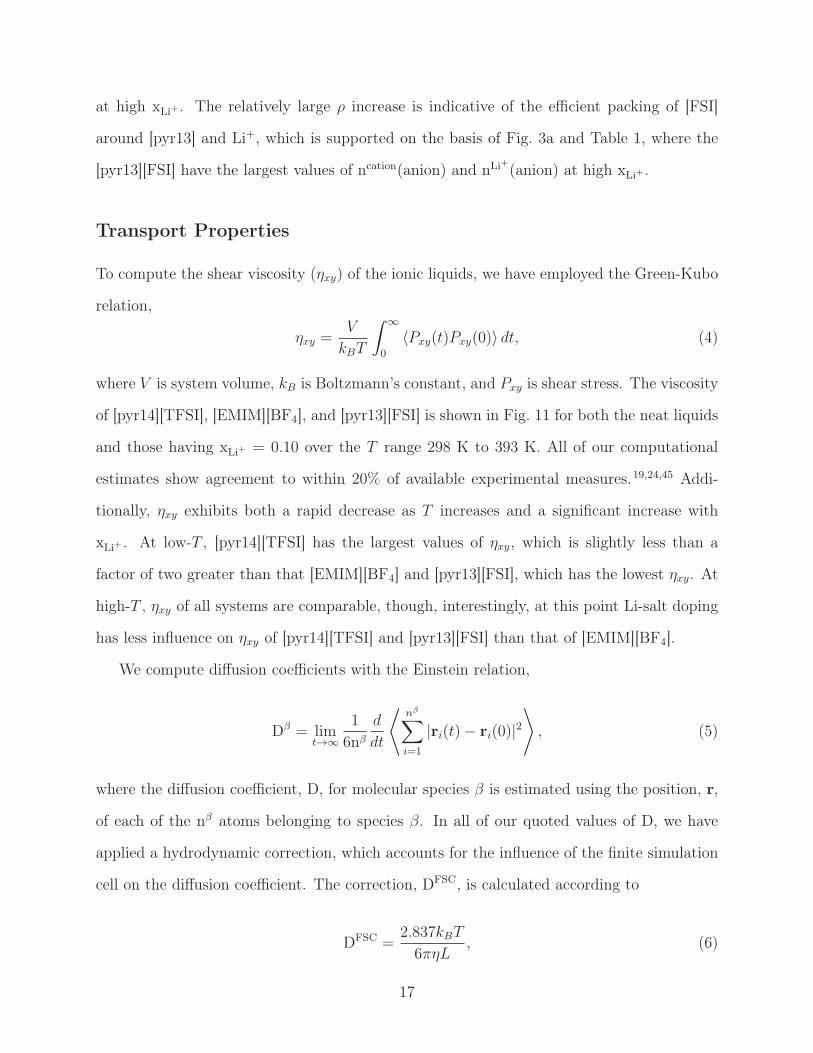
where V is system volume, kB is Boltzmann’s constant, and Pxy is shear stress. The viscosity
of [pyr14][TFSI], [EMIM][BF4], and [pyr13][FSI] is shown in Fig. 11 for both the neat liquids
and those having xLi+ = 0.10 over the T range 298 K to 393 K. All of our computational
estimates show agreement to within 20% of available experimental measures.19,24,45 Addi-
tionally, ηxy exhibits both a rapid decrease as T increases and a significant increase with
xLi+ . At low-T , [pyr14][TFSI] has the largest values of ηxy, which is slightly less than a
factor of two greater than that [EMIM][BF4] and [pyr13][FSI], which has the lowest ηxy. At
high-T , ηxy of all systems are comparable, though, interestingly, at this point Li-salt doping
has less influence on ηxy of [pyr14][TFSI] and [pyr13][FSI] than that of [EMIM][BF4].
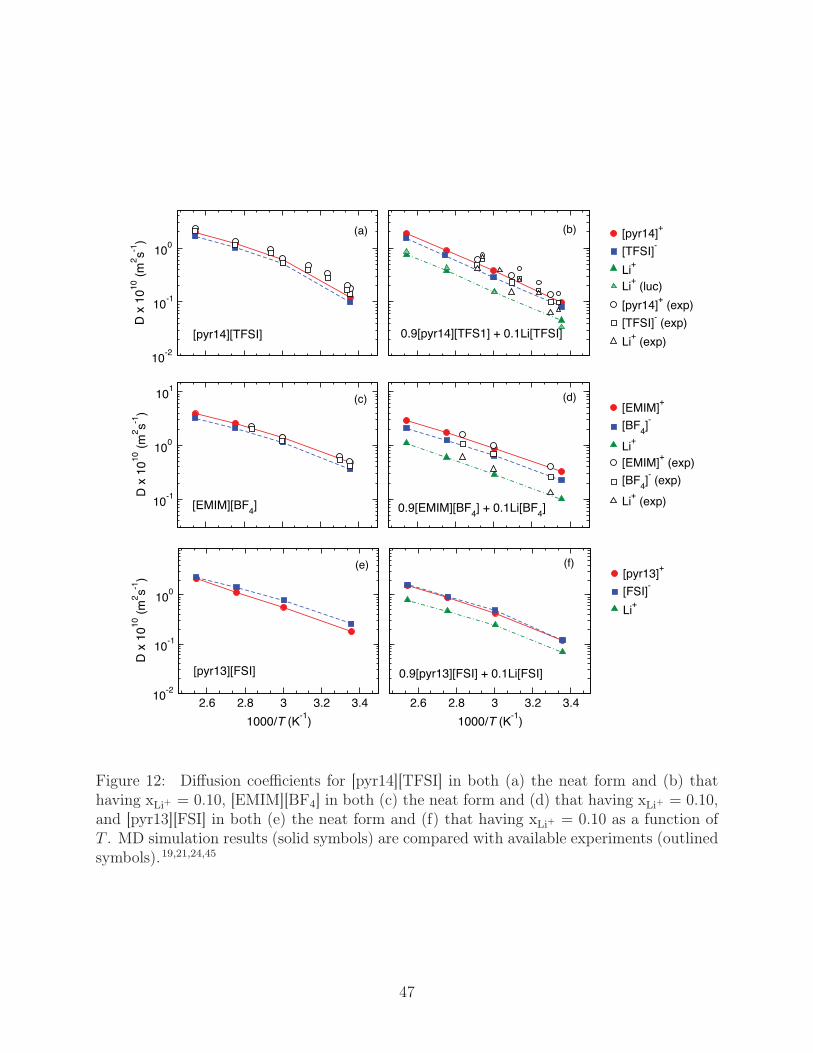
We compute diffusion coefficients with the Einstein relation,
Dβ = limt→∞
1
6nβ
d
dt
⟨nβ∑i=1
|ri(t)− ri(0)|2⟩, (5)
where the diffusion coefficient, D, for molecular species β is estimated using the position, r,
of each of the nβ atoms belonging to species β. In all of our quoted values of D, we have
applied a hydrodynamic correction, which accounts for the influence of the finite simulation
cell on the diffusion coefficient. The correction, DFSC, is calculated according to
DFSC =2.837kBT
6πηL, (6)
17
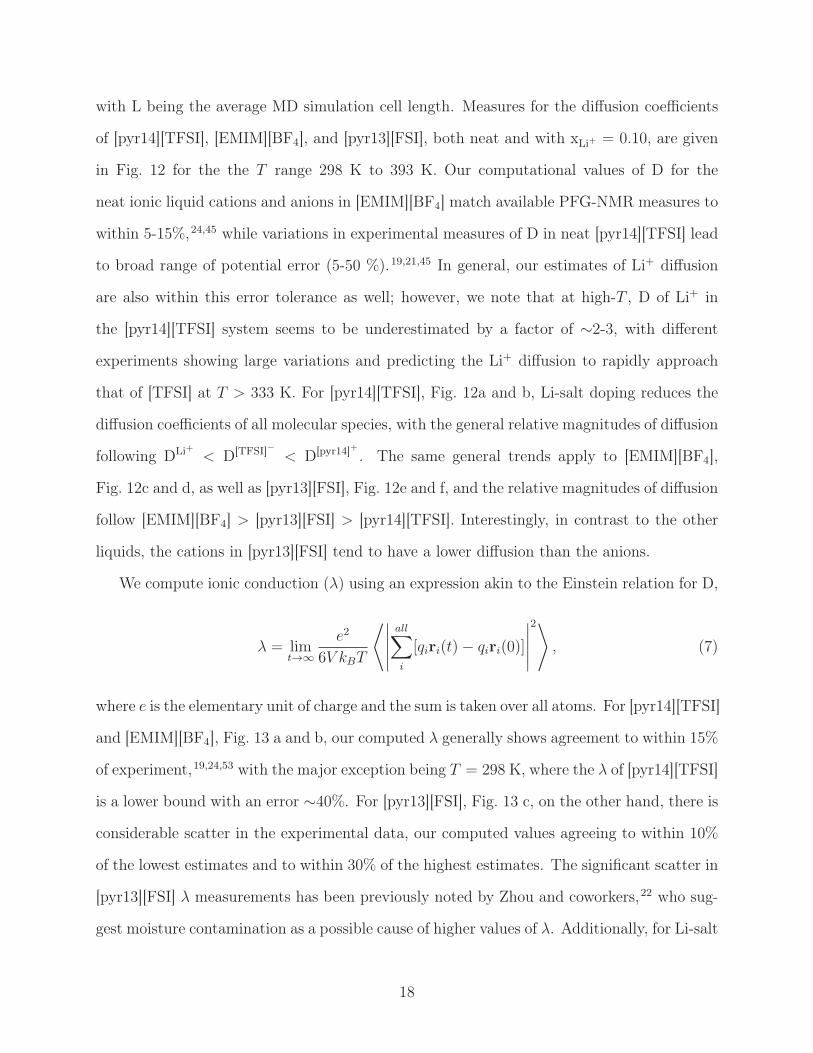
with L being the average MD simulation cell length. Measures for the diffusion coefficients
of [pyr14][TFSI], [EMIM][BF4], and [pyr13][FSI], both neat and with xLi+ = 0.10, are given
in Fig. 12 for the the T range 298 K to 393 K. Our computational values of D for the
neat ionic liquid cations and anions in [EMIM][BF4] match available PFG-NMR measures to
within 5-15%,24,45 while variations in experimental measures of D in neat [pyr14][TFSI] lead
to broad range of potential error (5-50 %).19,21,45 In general, our estimates of Li+ diffusion
are also within this error tolerance as well; however, we note that at high-T , D of Li+ in
the [pyr14][TFSI] system seems to be underestimated by a factor of ∼2-3, with different
experiments showing large variations and predicting the Li+ diffusion to rapidly approach
that of [TFSI] at T > 333 K. For [pyr14][TFSI], Fig. 12a and b, Li-salt doping reduces the
diffusion coefficients of all molecular species, with the general relative magnitudes of diffusion
following DLi+ < D[TFSI]− < D[pyr14]+ . The same general trends apply to [EMIM][BF4],
Fig. 12c and d, as well as [pyr13][FSI], Fig. 12e and f, and the relative magnitudes of diffusion
follow [EMIM][BF4] > [pyr13][FSI] > [pyr14][TFSI]. Interestingly, in contrast to the other
liquids, the cations in [pyr13][FSI] tend to have a lower diffusion than the anions.
We compute ionic conduction (λ) using an expression akin to the Einstein relation for D,
λ = limt→∞
e2
6V kBT
⟨∣∣∣∣∣all∑i
[qiri(t)− qiri(0)]
∣∣∣∣∣2⟩
, (7)
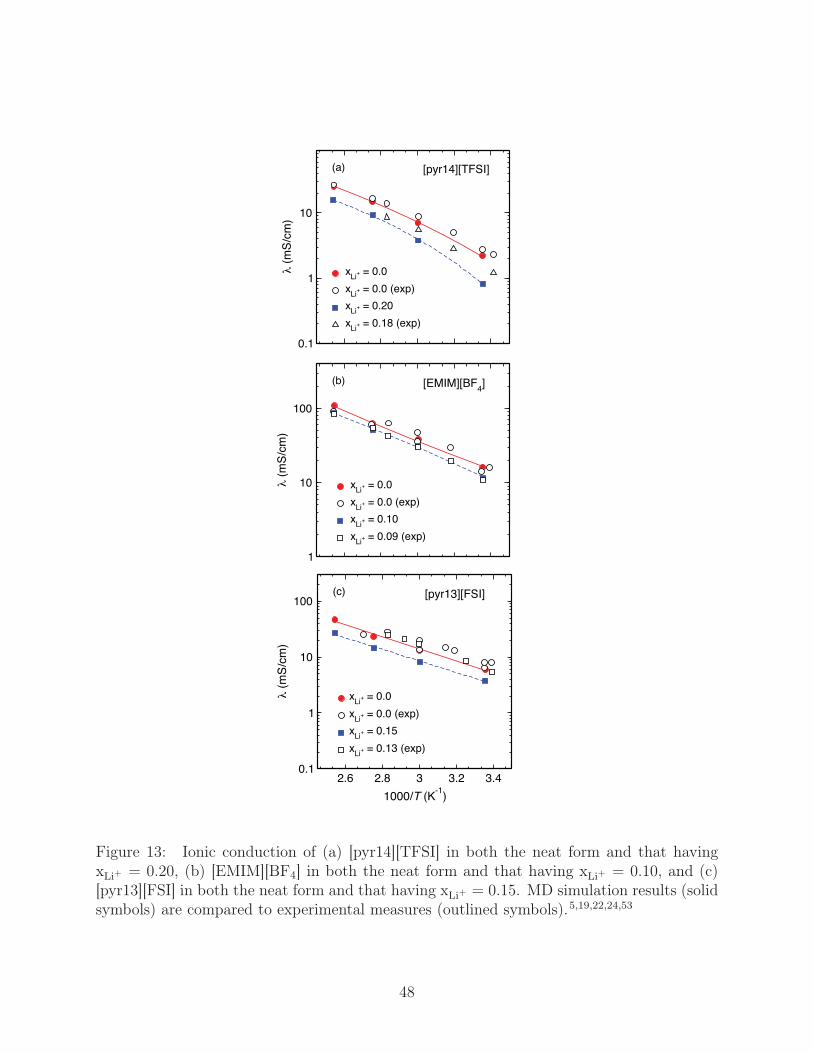
where e is the elementary unit of charge and the sum is taken over all atoms. For [pyr14][TFSI]
and [EMIM][BF4], Fig. 13 a and b, our computed λ generally shows agreement to within 15%
of experiment,19,24,53 with the major exception being T = 298 K, where the λ of [pyr14][TFSI]
is a lower bound with an error ∼40%. For [pyr13][FSI], Fig. 13 c, on the other hand, there is
considerable scatter in the experimental data, our computed values agreeing to within 10%
of the lowest estimates and to within 30% of the highest estimates. The significant scatter in
[pyr13][FSI] λ measurements has been previously noted by Zhou and coworkers,22 who sug-
gest moisture contamination as a possible cause of higher values of λ. Additionally, for Li-salt
18
doped systems, underestimates of λ could be a repercussion of the slight overbidding of the
force field for [TFSI] and [FSI] to Li+ when compared to quantum chemical computations.59
As expected, T has a strong influence on λ, which increases by an order of magnitude from
298 K to 393 K, and the addition of Li-salt decreases the net ionic conduction. At high-T ,
the ionic conduction of [EMIM][BF4] is a factor ∼4 greater than [pyr14][TFS] and a factor
of ∼ 2 greater than [pyr13][FSI], while this increases to ∼ 10 for [pyr14][TFSI] at lower T .
Additional information on the experimental measurement of λ is presented in Figure S7 of
the supplementary material.
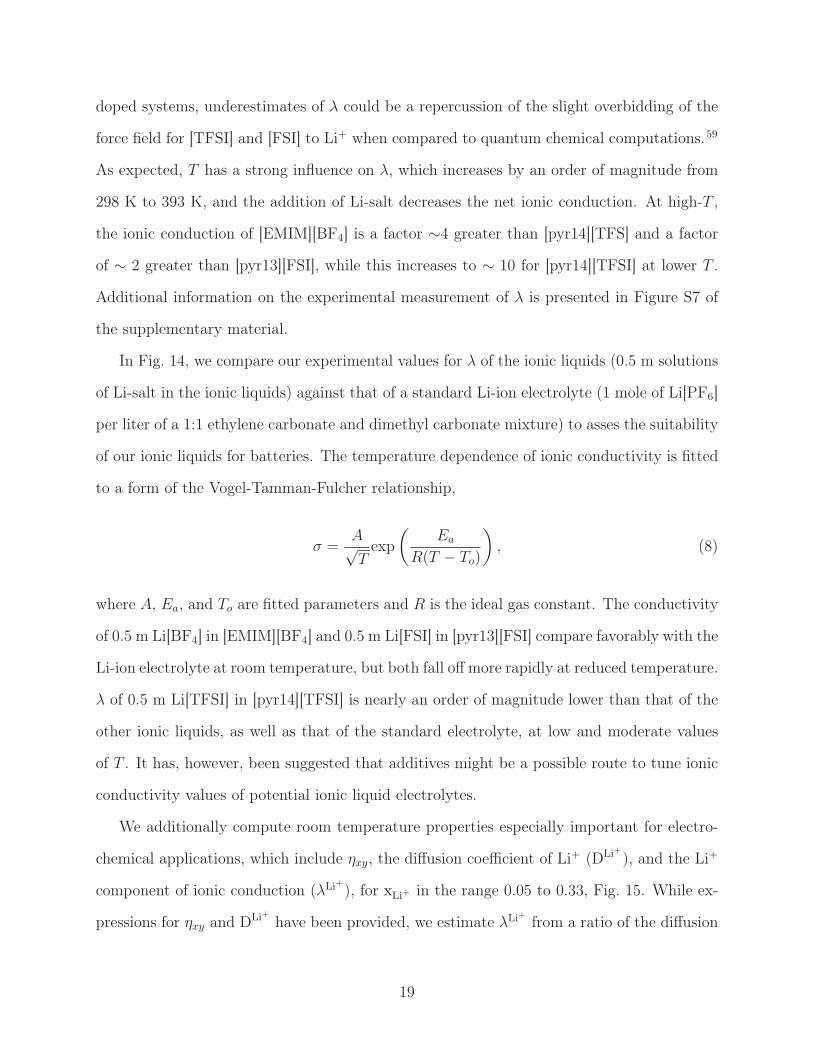
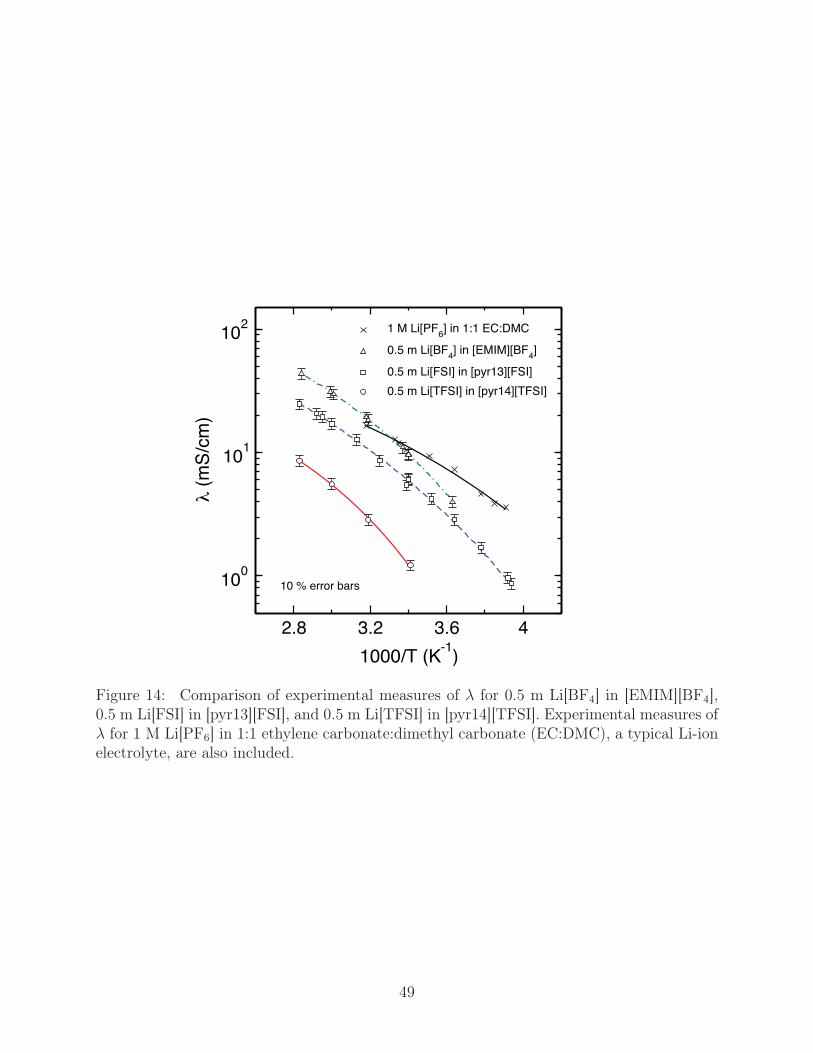
In Fig. 14, we compare our experimental values for λ of the ionic liquids (0.5 m solutions
of Li-salt in the ionic liquids) against that of a standard Li-ion electrolyte (1 mole of Li[PF6]
per liter of a 1:1 ethylene carbonate and dimethyl carbonate mixture) to asses the suitability
of our ionic liquids for batteries. The temperature dependence of ionic conductivity is fitted
to a form of the Vogel-Tamman-Fulcher relationship,
σ =A√T
exp(
Ea
R(T − To)
), (8)
where A, Ea, and To are fitted parameters and R is the ideal gas constant. The conductivity
of 0.5 m Li[BF4] in [EMIM][BF4] and 0.5 m Li[FSI] in [pyr13][FSI] compare favorably with the
Li-ion electrolyte at room temperature, but both fall off more rapidly at reduced temperature.
λ of 0.5 m Li[TFSI] in [pyr14][TFSI] is nearly an order of magnitude lower than that of the
other ionic liquids, as well as that of the standard electrolyte, at low and moderate values
of T . It has, however, been suggested that additives might be a possible route to tune ionic
conductivity values of potential ionic liquid electrolytes.
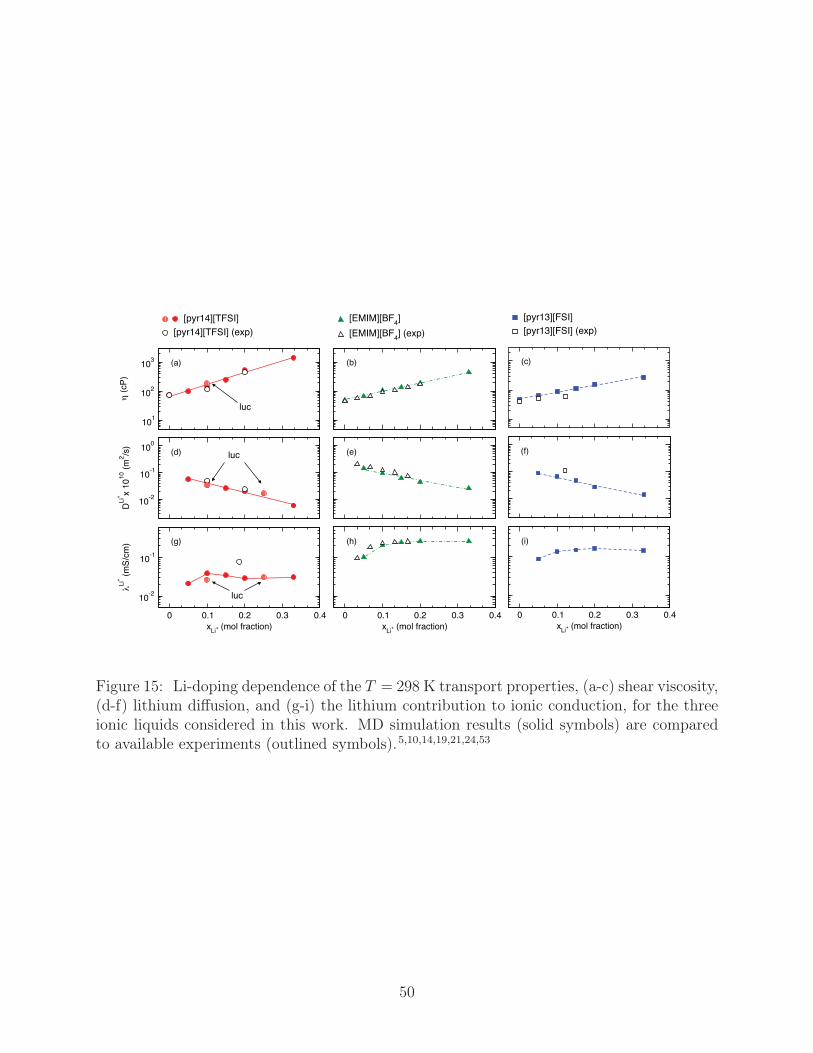
We additionally compute room temperature properties especially important for electro-
chemical applications, which include ηxy, the diffusion coefficient of Li+ (DLi+), and the Li+
component of ionic conduction (λLi+), for xLi+ in the range 0.05 to 0.33, Fig. 15. While ex-
pressions for ηxy and DLi+ have been provided, we estimate λLi+ from a ratio of the diffusion
19
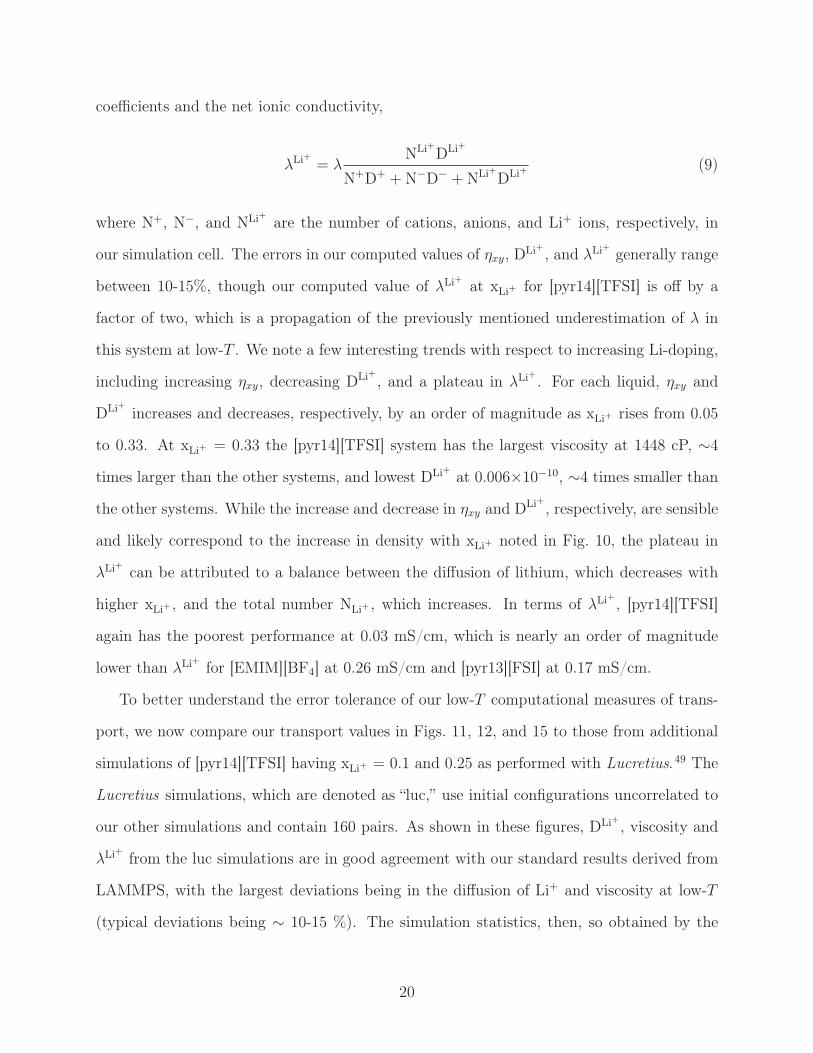
coefficients and the net ionic conductivity,
λLi+ = λNLi+DLi+
N+D+ + N−D− + NLi+DLi+(9)
where N+, N−, and NLi+ are the number of cations, anions, and Li+ ions, respectively, in
our simulation cell. The errors in our computed values of ηxy, DLi+ , and λLi+ generally range
between 10-15%, though our computed value of λLi+ at xLi+ for [pyr14][TFSI] is off by a
factor of two, which is a propagation of the previously mentioned underestimation of λ in
this system at low-T . We note a few interesting trends with respect to increasing Li-doping,
including increasing ηxy, decreasing DLi+ , and a plateau in λLi+ . For each liquid, ηxy and
DLi+ increases and decreases, respectively, by an order of magnitude as xLi+ rises from 0.05
to 0.33. At xLi+ = 0.33 the [pyr14][TFSI] system has the largest viscosity at 1448 cP, ∼4
times larger than the other systems, and lowest DLi+ at 0.006×10⁻¹⁰, ∼4 times smaller than
the other systems. While the increase and decrease in ηxy and DLi+ , respectively, are sensible
and likely correspond to the increase in density with xLi+ noted in Fig. 10, the plateau in
λLi+ can be attributed to a balance between the diffusion of lithium, which decreases with
higher xLi+ , and the total number NLi+ , which increases. In terms of λLi+ , [pyr14][TFSI]
again has the poorest performance at 0.03 mS/cm, which is nearly an order of magnitude
lower than λLi+ for [EMIM][BF4] at 0.26 mS/cm and [pyr13][FSI] at 0.17 mS/cm.
To better understand the error tolerance of our low-T computational measures of trans-
port, we now compare our transport values in Figs. 11, 12, and 15 to those from additional
simulations of [pyr14][TFSI] having xLi+ = 0.1 and 0.25 as performed with Lucretius.49 The
Lucretius simulations, which are denoted as “luc,” use initial configurations uncorrelated to
our other simulations and contain 160 pairs. As shown in these figures, DLi+ , viscosity and
λLi+ from the luc simulations are in good agreement with our standard results derived from
LAMMPS, with the largest deviations being in the diffusion of Li+ and viscosity at low-T
(typical deviations being ∼ 10-15 %). The simulation statistics, then, so obtained by the
20
two simulation packages are congruent. The variability in transport is likely less dependent
on initial configuration than errors related to the length of simulation time, which is further
discussed in Fig. S8 of the supplementary material on the basis of deviations in low-T DLi+
over the course of hundreds of nanoseconds of statistical averaging. Thus, we strongly sug-
gest that care be taken to ensure that ample statistics are taken over long simulation times
to produce converged transport properties in Li-doped room-T ionic liquids, with hundreds
of nanoseconds of simulation statistics being necessary to prevent large errors in transport
estimates.
Kinetics of Lithium Transport
It is worthwhile to further analyze the underlying mechanisms that govern the transport, in
particular that of Li+, in our ionic liquid systems. As a first approach, we compare the λ of
our liquids, as computed from Eq. 7, with an ideal measure of ionic conduction (λuc) that
does not account for the correlated motion of the ions,
λuc =e2
kBV T
Nions∑β=1
(zβ)2DβNβ, (10)
where zβ is the net charge of each ionic species β. Expressing the effect of correlated ion
motion as the ratio α = λ/λuc, we provide in Table 2 measures of α for the ionic liquids
at T = 298 K and selected values of xLi+ . We find that our estimated α is on the order
of both experimental measurements, which have yielded 0.39-0.86 for [pyr13][TFSI] with
Li[TFSI]25,60 and 0.7-0.85 for [EMIM][BF4] with Li[BF4],24 as well as alternate MD studies
of Li-doped ionic liquids.20,41,44,45 With increased xLi+ , we observe a slight increase in α that
suggests less correlated ion diffusion.
In order to further probe possible mechanisms of transport, we look to the average resi-
21
dence time of neighboring ions. This is accomplished by defining a neighbor function (Hβγ),
Hβγ(Rij, t) =
⎧⎪⎪⎨⎪⎪⎩0, if Rij > R|MAX|
βγ
1, if Rij ≤ R|MAX|βγ
(11)
which determines whether the ions i and j of species type β and γ, respectively, are neighbors
based on their center of mass separation, Rij, and the average maximum extent of the first
solvation shell, R|MAX|βγ , which can be obtained from the g(r). The residence time, then, can
be evaluated from the autocorrelation of Hβγ,
Sβγ(t) =
⟨∑Nβ
i=1
∑Nγ
j=1 Hβγ(Rij, t)Hβγ(Rij, 0)∑Nβ
i=1
∑Nγ
j=1 Hβγ(Rij, 0)Hβγ(Rij, 0)
⟩, (12)
which exhibits a roughly exponential decay, the average decay time of which is τβ/γ between
ion species β and γ.
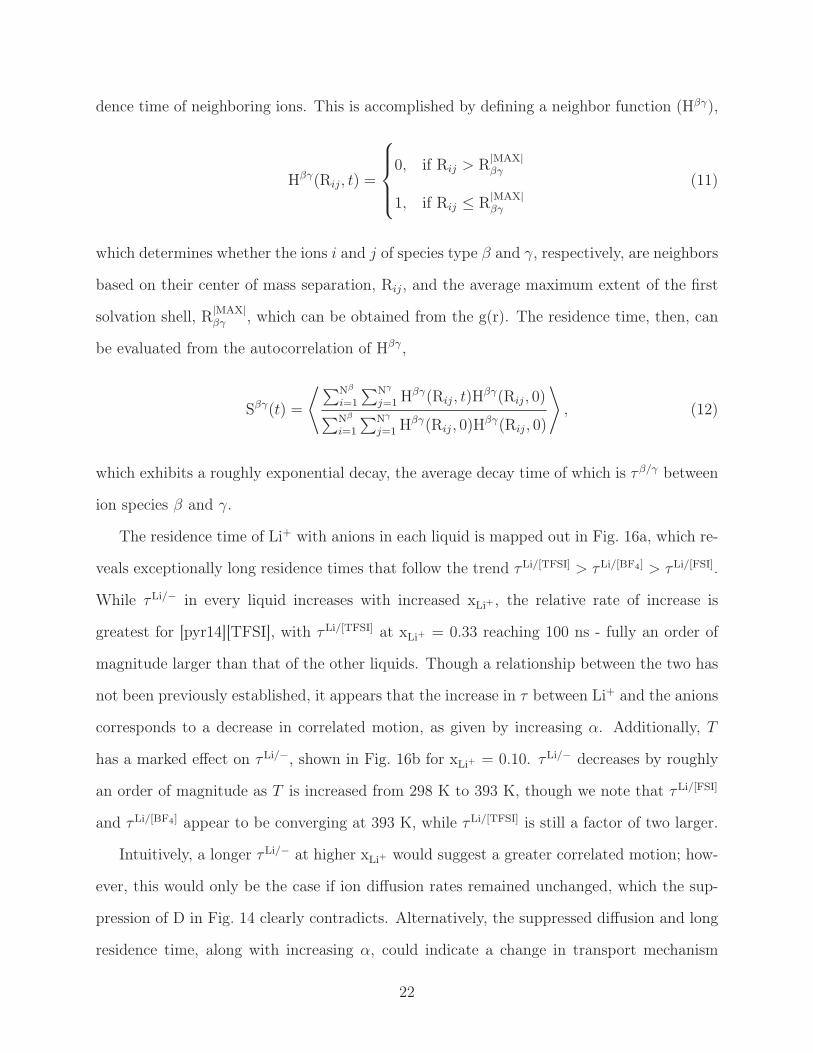
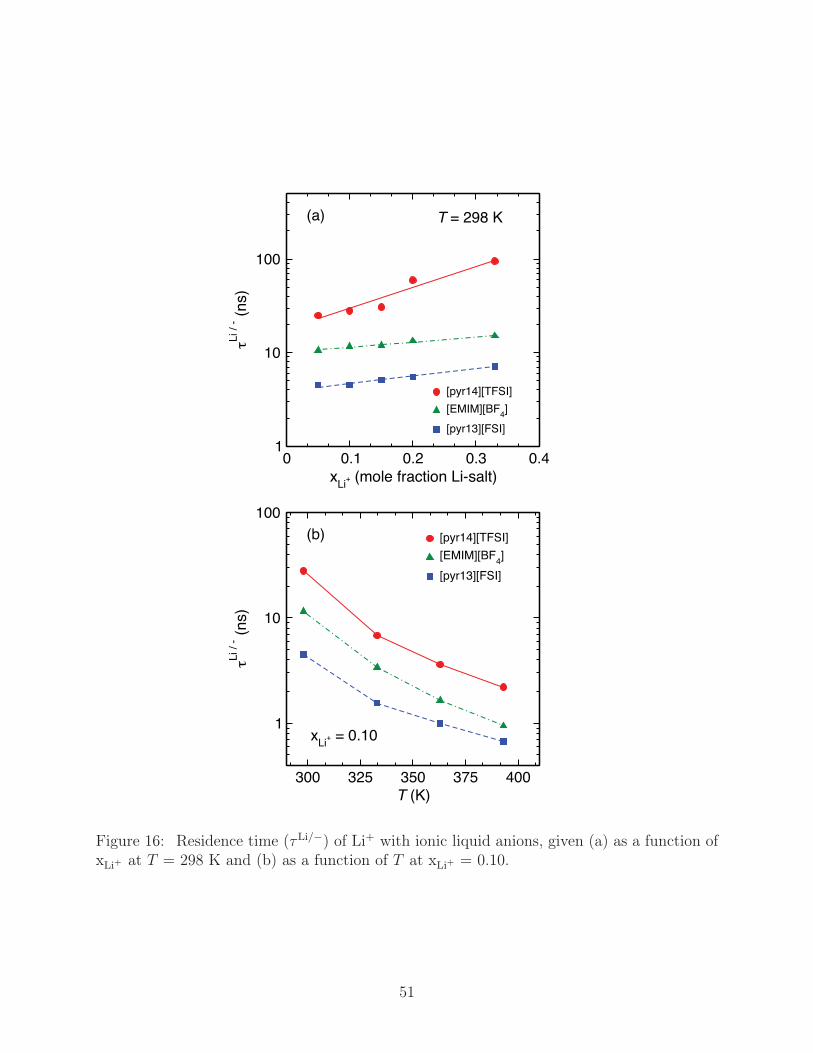
The residence time of Li+ with anions in each liquid is mapped out in Fig. 16a, which re-
veals exceptionally long residence times that follow the trend τLi/[TFSI] > τLi/[BF4] > τLi/[FSI].
While τLi/− in every liquid increases with increased xLi+ , the relative rate of increase is
greatest for [pyr14][TFSI], with τLi/[TFSI] at xLi+ = 0.33 reaching 100 ns - fully an order of
magnitude larger than that of the other liquids. Though a relationship between the two has
not been previously established, it appears that the increase in τ between Li+ and the anions
corresponds to a decrease in correlated motion, as given by increasing α. Additionally, T
has a marked effect on τLi/−, shown in Fig. 16b for xLi+ = 0.10. τLi/− decreases by roughly
an order of magnitude as T is increased from 298 K to 393 K, though we note that τLi/[FSI]
and τLi/[BF4] appear to be converging at 393 K, while τLi/[TFSI] is still a factor of two larger.
Intuitively, a longer τLi/− at higher xLi+ would suggest a greater correlated motion; how-
ever, this would only be the case if ion diffusion rates remained unchanged, which the sup-
pression of D in Fig. 14 clearly contradicts. Alternatively, the suppressed diffusion and long
residence time, along with increasing α, could indicate a change in transport mechanism
22
to one in which diffusion occurs with less correlated motion. Consequently, the primary
mechanisms proposed for Li+ diffusion include the highly correlated vehicular mechanism,
where Li+ moves with its solvation shell, and the hopping mechanism, where Li+ is pulled
through the liquid via anion exchange. To compare these mechanisms, we compute the av-
erage displacement of Li+ before an anion exchange event occurs at time τLi/− as well as the
ratio of Li+ diffusion before anion exchange (DLi+bax) to DLi+ ; a small ratio of DLi+
bax to DLi+
implies more importance of anion exchange on diffusion. In Table 3, we provide DLi+bax/DLi+
at selected conditions along with the Li+ displacement measured in numbers of average an-
ion radii, N〈R〉. With increasing xLi+ , we see a shift to lower DLi+bax/DLi+ as well as a lower
N〈R〉, indicating that anion exchange contributes more greatly to net Li+ diffusion and that
Li+ is displaced on average less before an anion exchange event, supporting the increase of
α in Table 2. Based on a comparison of the magnitudes of DLi+bax/DLi+ , the importance of
the vehicular mechanism follows [EMIM][BF4] > [pyr13][FSI] > [pyr14][TFSI], which also
implies anion exchange becomes more important as anion size increases.
As a final evaluation of transport in Li-doped ionic liquids, we look at the influence of
Li+ clusters on both τLi/− and DLi+ . As shown in Table 4, we compute τLi/− and DLi+ for
single Li+ ions (denoted clusters of one, NLi+= 1) and cluster Li+ with common bridging
anions (NLi+ > 1); the average duration of the clusters is also quoted on the basis of the
Li-Li residence time (τLi/Li). We initially note that the magnitude of τLi/Li with respect to
ionic liquid follows the order previously established for τLi/− and that in all cases τLi/− is
larger for NLi+ > 1 systems than NLi+ = 1 systems. The magnitude of this effect, however,
varies markedly by system, with τLi/− for NLi+ > 1 clusters being a factor of ∼ 2 and
∼ 3/2 larger than τLi/− for NLi+ = 1 in [pyr14][TFSI] and [pyr13][FSI], respectively, while
both Li+-Anion residence times are comparable for [EMIM][BF4]. Associated with this
increase in cluster residence time is an increase by a factor of ∼ 1.5 in DLi+ for NLi+ = 1
when compared to NLi+ > 1 systems in [pyr14][TFSI] and [pyr13][FSI], with [EMIM][BF4]
again being the exception with comparable DLi+ independent of cluster size. Upon closer
23
inspection of the structures associated with these values, it is noted that the increase in τLi/−
for NLi+ > 1 systems can almost completely be attributed to the long-lived bridging anions
(given by coordination > 1 in Fig. 9), while anions on the exterior of the cluster (given by
1-coordination in Fig. 9) are exchanged at rates comparable to those associated with NLi+ =
1 clusters.
Conclusions
We have presented an comprehensive investigation of the structure, thermodynamics and
transport properties of the ionic liquids [pyr14][TFSI], [pyr13][FSI], and [EMIM][BF4] as
a function of Li-salt doping and T . Molecular dynamics simulation are performed using
the polarizable force field, APPLE&P. An analysis of the influence of xLi+ on ionic liquid
structure reveals a complex binding environment in which Li+ prefers 4-coordination, which
is generally mediated through 4 anions having κ1 binding, except for the case of [pyr14][TFSI]
which prefers a 3 anion coordination consisting of 2 κ1 bonds and 2 κ2 bonds. A result of
adding Li+ past a threshold value of xLi+ = 0.05 is the mutual coordination of lithium ions to
the same anion, resulting in lithium clusters. The clustering effect has a significant impact
on both the structure and transport properties of our ionic liquids, reducing the prevalence
of κ2 binding in [pyr14][TFSI] and [pyr13][FSI] as well as slowing the dynamics of the liquids
through a substantial increase in density.
We have evaluated the expected performance of each electrolyte based on their viscosity,
diffusion, and ionic conduction as well as the individual contribution of Li+ to the ionic con-
duction. MD simulation predictions were found to be in good agreement with pulsed field
gradient spin-echo NMR measurements of diffusion and electrochemical impedance spec-
troscopy measurements of ionic conductivity for the neat ionic liquids and 0.5 m solutions
of Li-salt in the ionic liquids. With increasing Li-salt doping, all liquids exhibit the same
general trends of increasing viscosity and decreasing diffusion and ionic conductivity. The
24
influence of Li-salt doping is notable, with our T = 298 K systems showing a net increase of
ηxy and a net decrease of DLi+ of an order of magnitude as xLi+ increases from 0.05 to 0.33.
Contrasting this behavior, increasing Li-salt doping causes λLi+ to saturate after a threshold
of xLi+ = 0.15, which is shown to be the combined influence of decreasing diffusion and
increasing number of Li+. Comparing the properties of our potential electrolytes across the
entire range of xLi+ , a correlation between anion size and transport emerges, with smaller
anions having smaller viscosity and higher rates of Li+ transport. The liquid with the largest
anion, [pyr14][TFSI], has the highest viscosity, being a factor of ∼4 larger than the other
liquids, while DLi+ is a factor of ∼4 lower. Without question, [pyr14][TFSI] exhibits the
lowest Li+ contribution to ionic conduction, λLi+ being roughly an order of magnitude lower
than that of the other liquids, and [EMIM][BF4] has the highest λLi+ , reaching values of 0.30
mS/cm at high xLi+ , though [pyr13][FSI] is a close lower bound at 0.17 mS/cm. It should
additionally be noted that our room-T simulation results of Li-doped ionic liquids demon-
strate the necessity of long MD simulation runs (∼ 200 ns) to obtain accurate measures of
transport.
An analysis of the kinetics of Li+ transport has been performed on the basis of resi-
dence times, τLi/−, of anions with Li+. At T = 298 K, Li[TFSI] binding persists up to
100 ns at xLi+ =0.33. Li[FSI] and Li[BF4] binding, on the other hand, have much smaller
values of τLi/− at 8 ns and 17 ns, respectively. Increasing T reduces the residence times
dramatically, exhibiting an order of magnitude decrease from 298 K to 393 K. Using τLi/−
along with diffusion data, we have additionally investigated the competition between the
hopping mechanism and the vehicular mechanism in the transport of Li+. The contribution
of Li+/anion exchange to Li+ diffusion is estimated to be less that 40 % and increases with
both increasing xLi+ and anion size ([TFSI] > [FSI] > [BF4]).
Finally, we briefly note that Li+ transport is governed by the correlated influence of anion
size, anion binding strength, and liquid density. For instance, [pyr14][TFSI] and [pyr13][FSI]
are similar ionic liquids in terms of structure, though the residence time of Li+ with [TFSI]
25
is roughly an order of magnitude larger, which inevitably leads to slower diffusion of Li+.
It is attractive to attribute this to the bonding energy, which is stronger for [TFSI] than
[FSI]; however, bonding alone does not completely govern τLi/−, as [BF4] has the strongest
binding energy with a τLi/− several times smaller than that of [TFSI]. What, then, emerges
is a picture where strong anion binding, large anion size, and high density create a prolonged
Li[TFSI] solvation structure that leads to slow transport. While Li[BF4] has strong binding,
the small anion size and low density allow rapid diffusion of Li+ with its solvation shell as
well as a high rate of anion exchange. Finally, the weak binding of Li[FSI] and intermediate
density of [pyr13][FSI] seem to allow a greater rate of anion exchange and result in higher
Li+ mobility.
Acknowledgement
This work was supported by funding from the NASA Aeronautics Research Institute (NARI)
Seedling program.
References
(1) Armand, M.; Tarascon, J. M. Nature 2008, 451, 652–657.
(2) Scrosati, B.; Garche, J. J. Power Sources 2010, 195, 2419–2430.
(3) Goodenough, J. B.; Kim, Y. Chem. Mater 2010, 22, 587–603.
(4) Ellis, B. L.; Lee, K. T.; Nazar, L. F. Chem. Mater. 2010, 22, 691–714.
(5) Matsumoto, H.; Sakaebe, H.; Tatsumi, K.; Kikuta, M.; Ishiko, E.; Kono, M. J. Power
Sources 2006, 160, 1308–1313.
(6) Schweikert, N.; Hofmann, A.; Schulz, M.; Scheuermann, M.; Boles, S. T.; Hanemann, T.;
Hahn, H.; Indris, S. J. Power Sources 2013, 228, 237–243.
26
(7) Xu, J.; Yang, J.; NuLi, Y.; Wang, J.; Zhang, Z. J. Power Sources 2006, 160, 621–626.
(8) Basile, A.; Hollenkamp, A. F.; Bhatt, A. I.; O’Mullane, A. P. Electrochem. Commun.
2013, 27, 69–72.
(9) Howlett, P. C.; MacFarlane, D. R.; Hollenkamp, A. F. Electrochem. Solid State Lett.
2004, 5, A97–A101.
(10) Bhatt, A. I.; Best, A. S.; Huang, J.; Hollenkamp, A. F. J. Electrochem. Soc. 2010, 157,
A66.
(11) Best, A. S.; Bhatt, A. I.; Hollenkamp, A. F. J. Electrochem. Soc. 2010, 157, A903–A911.
(12) Bhattacharyya, R.; Key, B.; Chen, H.; Best, A. S.; Hollenkamp, A. F.; Grey, C. P.
Nature. Mater. 2010, 9, 504–510.
(13) Wang, H.; Liu, S.; Huang, K.; Yin, X.; Liu, Y.; Peng, S. Int. J. Electrochem. Sci. 2012,
7, 1688–1698.
(14) Wang, Y.; Zaghib, K.; Guerfi, A.; Bazito, F. F. C.; Torresi, R. M.; Dahn, J. R. Elec-
trochim. Acta 2007, 52, 6346–6352.
(15) Saint, J.; Best, A. S.; Hollenkamp, A. F.; Kerr, J.; Shin, J.-H.; Doeff, M. M. J. Elec-
trochem. Soc. 2008, 155, A127–A180.
(16) Lane, G. H.; Best, A. S.; MacFarlane, D. R.; Forsyth, M.; Hollenkamp, A. F. Elec-
trochim. Acta 2010, 55, 2210–2215.
(17) Tokuda, H.; Hayamizu, K.; Ishii, K.; Abu Bin Hasan Susan, M.; Watanabe, M. J. Phys.
Chem. B 2004, 108, 16593–16600.
(18) Tokuda, H.; Hayamizu, K.; Ishii, K.; Abu Bin Hasan Susan, M.; Watanabe, M. J. Phys.
Chem. B 2005, 109, 6103–6110.
27
(19) Tokuda, H.; Ishii, K.; Abu Bin Hasan Susan, M.; Tsuzuki, S.; Hayamizu, K.; Watan-
abe, M. J. Phys. Chem. B 2006, 110, 2833–2839.
(20) Borodin, O.; Gorecki, W.; Smith, G. D.; Armand, M. J. Phys. Chem. B 2010, 114,
6786–6798.
(21) Castiglione, F.; Ragg, E.; Mele, A.; Appetecchi, G. B.; Montanino, M.; Passerini, S. J.
Phys. Chem. Lett. 2011, 2, 153–157.
(22) Zhou, Q.; Henderson, W.; Appetecchi, G.; Montanino, M.; Passerini, S. J. Phys. Chem.
B 2008, 112, 13577–13580.
(23) Zhou, Q.; Boyle, P. D.; Malpezzi, L.; Mele, A.; Shin, J.-H.; Passerini, S.; Hender-
son, W. A. Chem. Mater 2011, 23, 4331–4337.
(24) Hayamizu, K.; Aihara, Y.; Nakagawa, H.; Nukuda, T.; Price, W. S. J. Phys. Chem. B
2004, 108, 19527–19532.
(25) Nicotera, I.; Oliviero, C.; Henderson, W. A.; Appetecchi, G. B.; Passerini, S. J. Phys.
Chem. B 2005, 109, 22814–22819.
(26) Fujii, K.; Seki, S.; Fukuda, S.; Takamuku, T.; Kohara, S.; Kameda, Y.; Umebayashi, Y.;
Ishiguro, S. J. Mol. Liq. 2008, 143, 64–69.
(27) Fujii, K.; Hamano, H.; Doi, H.; Song, X.; Tsuzuki, S.; Hayamizu, K.; Seki, S.;
Kameda, Y.; Dokko, K.; Watanabe, M.; Umebayashi, Y. J. Phys. Chem. C 2013,
117, 19314–19324.
(28) Umebayashi, Y.; Hamamo, H.; Seki, A.; Minofar, B.; Fujii, K.; Hayamizu, K.;
Tsuzuki, S.; Kameda, Y.; Kohara, S.; Watanabe, M. J. Phys. Chem. B 2011, 115,
12179–12191.
(29) Fujii, K.; Fujimori, T.; Takamuku, T.; Kanzaki, R.; Umebayashi, Y.; Ishiguro, S. J.
Phys. Chem. B 2006, 110, 8179–8183.
28
(30) Umebayashi, Y.; Mitsugi, T.; Fukuda, S.; Fujimori, T.; Fujii, K.; Kanzaki, R.;
Takeuchi, M.; Ishiguro, S. J. Phys. Chem. B 2007, 111, 13028–13032.
(31) Herstedt, M.; Smirnov, M.; Johansson, P.; Chami, M.; Grondin, J.; Servant, L.;
Lassègues, J. C. J. Raman Spectrosc. 2005, 36, 762–770.
(32) Lassègues, J.-C.; Grondin, J.; Aupetit, C.; Johansson, P. J. Phys. Chem. A 2009, 113,
305–314.
(33) Borodin, O.; Smith, G. D. J. Phys. Chem. B 2006, 110, 6293–6299.
(34) Borodin, O. J. Phys. Chem. B 2009, 113, 11463–11478.
(35) Liu, H.; Maginn, E.; Visser, A. E.; Bridges, N. J.; Fox, E. B. Ind. Eng. Chem. Res.
2012, 51, 7242–7254.
(36) Canongia Lopes, J. N. A.; Padau, A. A. H. J. Phys. Chem. B 2006, 110, 7485–7489.
(37) Hunt, P. A. Mol. Simul. 2006, 32, 1–10.
(38) Borodin, O.; Smith, G. D.; Kim, H. J. Phys. Chem. B 2009, 113, 4771–4774.
(39) Borodin, O.; D., S. G. J. Phys. Chem. B 2006, 110, 11481–11490.
(40) Borodin, O.; Smith, G. D. J. Phys. Chem. B 2006, 110, 6279–6292.
(41) Borodin, O.; D., S. G.; Henderson, W. J. Phys. Chem. B 2006, 110, 16879–16886.
(42) Liu, H.; Maginn, E. J. Chem. Phys. 2013, 139, 114508.
(43) Méndez-Morales, T.; Carrete, J.; Bouzón-Capelo, S.; Pérez-Rodriguez, M.; Cabeza, O.;
Gallego, L. J.; Varela, L. M. J. Phys. Chem. B 2013, 117, 3207–3220.
(44) Li, Z.; Smith, G. D.; Bedrov, D. J. Phys. Chem. B 2012, 116, 12801–12809.
(45) Solano, C. J. F.; Jeremias, S.; Paillard, E.; Beljonne, D.; Lazzaroni, R. J. Chem. Phys.
2013, 139, 034502.
29
(46) Niu, S.; Cao, Z.; Li, S.; Yan, T. J. Phys. Chem. B 2010, 114, 877–881.
(47) Markevich, E.; Baranchugov, V.; Aurbach, D. Electrochem. Commun. 2006, 8, 1331–
1334.
(48) Plimpton, S. J. Comp. Phys. 1995, 117, 1–19, see http://lammps.sandia.gov.
(49) Ayyagari, C.; Bedrov, D.; Borodin, O.; Smith, G. D. simulation code see http://
www.eng.utah.edu/gdsmith/lucretius.html.
(50) Tuckerman, M.; Berne, B. J.; Martyna, G. J. J. Chem. Phys. 1992, 97, 1990.
(51) Qian, X.; Gu, N.; Cheng, Z.; Yang, X.; Wang, E.; Dong, S. Electrochimica Acta 2001,
46, 1829–1836.
(52) Song, J. Y.; Wang, Y.; Wan, C. J. Electrochem. Soc. 2000, 147, 3219–3225.
(53) See supplementary material for additional details on lithium binding and dynamics and
on the experiments.
(54) Fujii, K.; Seki, S.; Fukuda, S.; Kanzaki, R.; Takamuku, T.; Umebayashi, Y.; Ishiguro, S.
J. Phys. Chem. B 2007, 111, 12829.
(55) Montiero, M. J.; Bazito, F. F. C.; Siqueira, L. J. A.; Ribiero, M. C. C.; Torresi, R. M.
J. Phys. Chem. B 2008, 112, 2102–2109.
(56) Nowinski, J. L.; Lightfoot, P.; Bruce, P. G. J. Mater. Chem. 1994, 4, 1579–1580.
(57) Beran, M.; Příhoda, J.; Žák, Z.; Černík, M. Polyhedron 2006, 25, 1292–1298.
(58) Xue, L.; Padgett, C. W.; DesMarteau, D. D.; Pennington, W. T. Solid State Sci. 2002,
4, 1535–1545.
(59) Bauschlicher Jr., C. W.; Haskins, J. B.; Bucholz, E. W.; Monk, J. D.; Lawson, J. W.
J. Chem. Phys. to be submitted.
30

(60) Bayley, P. M.; Lane, G. H.; Lyons, L. J.; MacFarlane, D. R.; Forsyth, M. J. Phys.
Chem. C 2010, 114, 20569–20576.
(61) Shiflett, M. B.; Yokozeki, A. J. J. Chem. Eng. Data 2007, 52, 1302–1306.
31
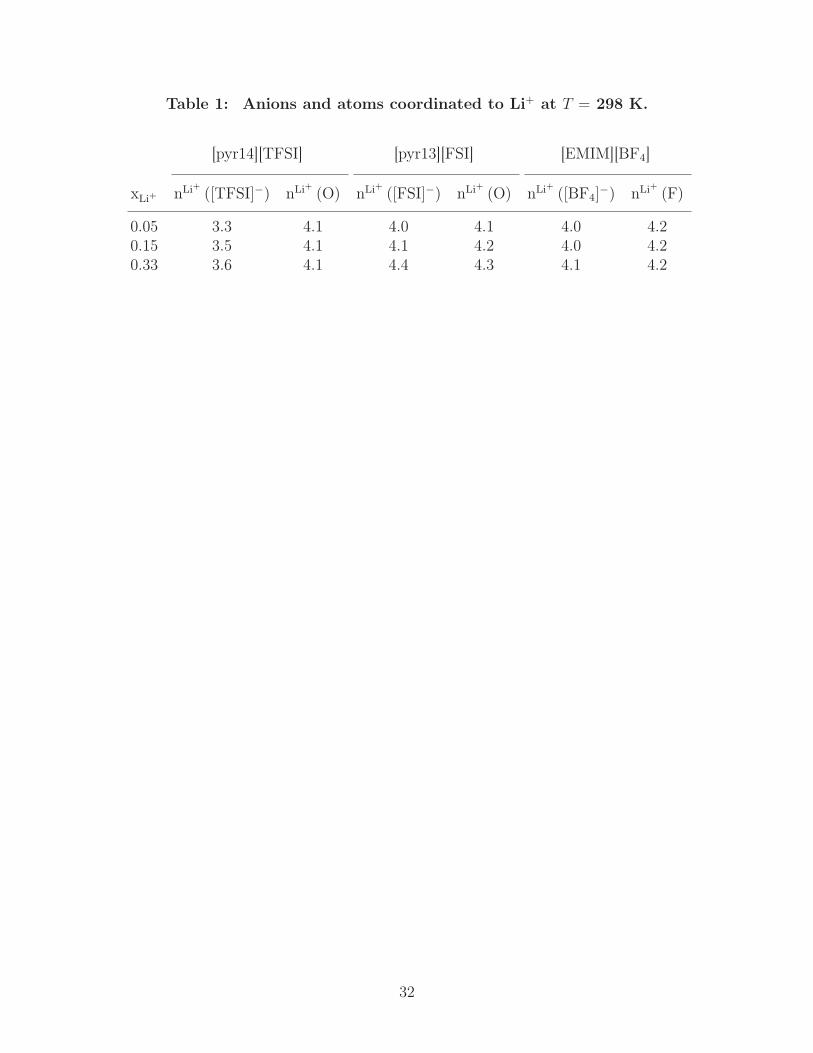
Table 1: Anions and atoms coordinated to Li+ at T = 298 K.
[pyr14][TFSI] [pyr13][FSI] [EMIM][BF4]
xLi+ nLi+ ([TFSI]−) nLi+ (O) nLi+ ([FSI]−) nLi+ (O) nLi+ ([BF4]−) nLi+ (F)
0.05 3.3 4.1 4.0 4.1 4.0 4.20.15 3.5 4.1 4.1 4.2 4.0 4.20.33 3.6 4.1 4.4 4.3 4.1 4.2
32
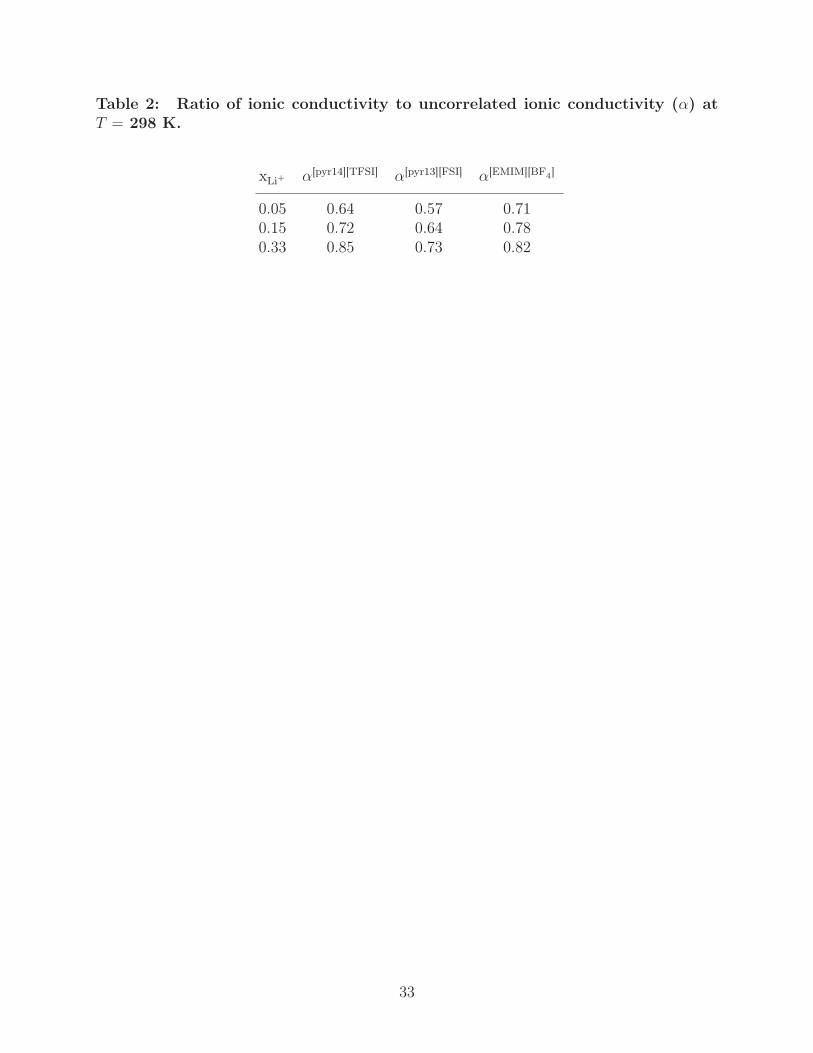
Table 2: Ratio of ionic conductivity to uncorrelated ionic conductivity (α) atT = 298 K.
xLi+ α[pyr14][TFSI] α[pyr13][FSI] α[EMIM][BF4]
0.05 0.64 0.57 0.710.15 0.72 0.64 0.780.33 0.85 0.73 0.82
33
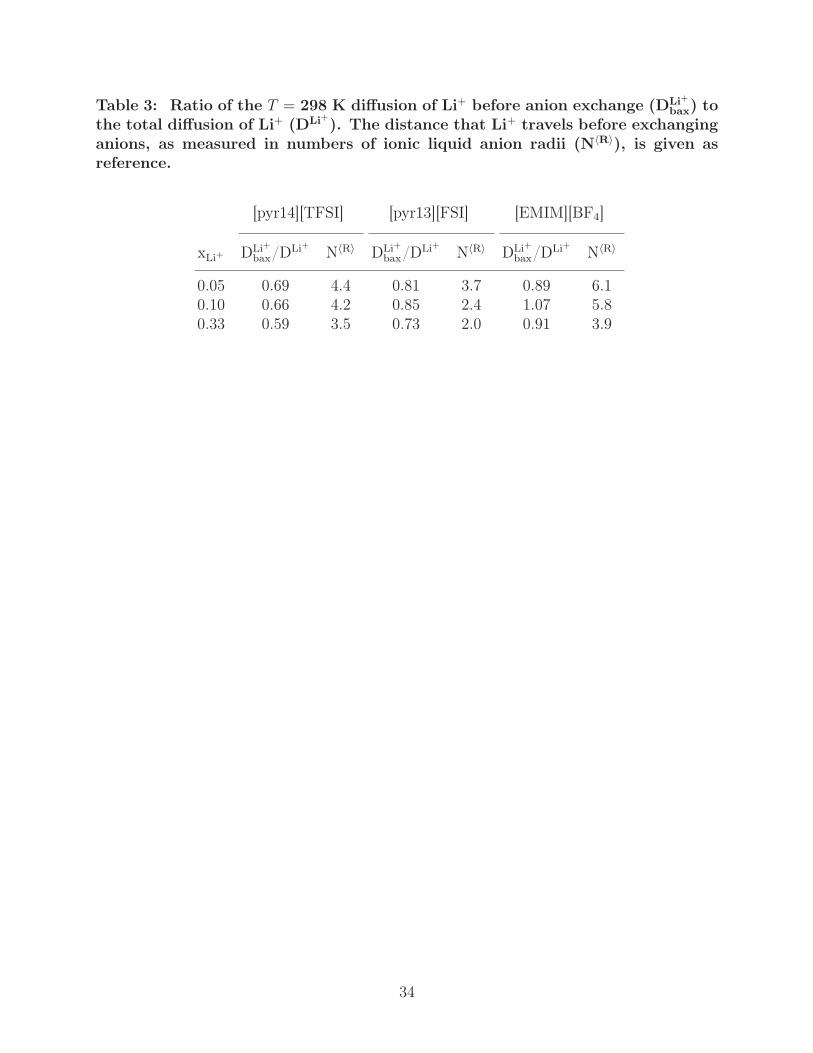
Table 3: Ratio of the T = 298 K diffusion of Li+ before anion exchange (DLi+bax) to
the total diffusion of Li+ (DLi+). The distance that Li+ travels before exchanginganions, as measured in numbers of ionic liquid anion radii (N〈R〉), is given asreference.
[pyr14][TFSI] [pyr13][FSI] [EMIM][BF4]
xLi+ DLi+bax/DLi+ N〈R〉 DLi+
bax/DLi+ N〈R〉 DLi+bax/DLi+ N〈R〉
0.05 0.69 4.4 0.81 3.7 0.89 6.10.10 0.66 4.2 0.85 2.4 1.07 5.80.33 0.59 3.5 0.73 2.0 0.91 3.9
34
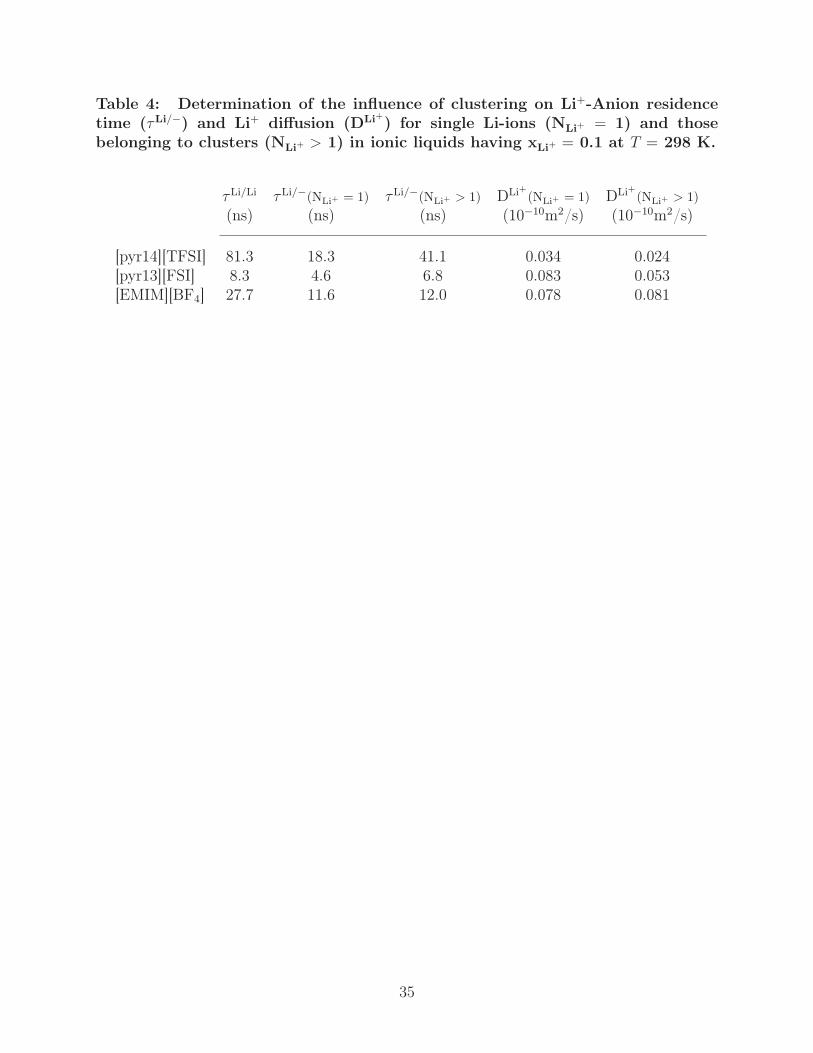
Table 4: Determination of the influence of clustering on Li+-Anion residencetime (τLi/−) and Li+ diffusion (DLi+) for single Li-ions (NLi+ = 1) and thosebelonging to clusters (NLi+ > 1) in ionic liquids having xLi+ = 0.1 at T = 298 K.
τLi/Li τLi/−(NLi+ = 1) τLi/−(NLi+ > 1) DLi+(NLi+ = 1) DLi+(NLi+ > 1)(ns) (ns) (ns) (10−10m2/s) (10−10m2/s)
[pyr14][TFSI] 81.3 18.3 41.1 0.034 0.024[pyr13][FSI] 8.3 4.6 6.8 0.083 0.053[EMIM][BF4] 27.7 11.6 12.0 0.078 0.081
35
[TFSI]- bis(trifluoromethylsufonyl)imide�
[FSI]- bis(fluorosufonyl)imide�
[BF4]- boron tetrafluoride�
[pyr14]+ N-methyl-N-butylpyrrolidinium+�
[pyr13]+ N-methyl-N-proylpyrrolidinium+�
[EMIM]+ 1-methyl-3-ethylimidazolium+�
����� � � � � �������
����� � � � ��������������������
(a)� (b)�
Figure 1: Representation of the cations (a) and anions (b) of the three ionic liquids consid-ered in this work: [pyr14][TFSI], [pyr13][FSI], and [EMIM][BF4].
36
0
1
2
g++(r
)[pyr14][TFSI]
0.85[pyr14][TFSI] + 0.15Li[TFSI]
0.67[pyr14][TFSI] + 0.33Li[TFSI]
0
1
2
3
g+- (r
)[pyr13][FSI]
0.85[pyr13][FSI] + 0.15Li[FSI]
0.67[pyr13][FSI] + 0.33Li[FSI]
0 4 8 12 16r (Å)
0
1
2
g--(r
)[EMIM][BF4]
0.85[EMIM][BF4] + 0.15Li[BF4]
0.67[EMIM][BF4] + 0.33Li[BF4]
0 4 8 12 16r (Å)
0 4 8 12 16r (Å)
(a)
(d)
(g)
(b)
(e)
(h)
(c)
(f)
(i)
Figure 2: T = 298 K radial distribution functions for ionic liquid ions as a function of Li-saltdoping. Distributions are provided for cations with other cations (g++), cations with anions(g+−), and anions with anions (g−−) for (a,d,e) [pyr14][TFSI], (b,e,h) [pyr13][FSI], and (c,f,i)[EMIM][BF4].
37
5
6
7
8
9
10
nCat
ion (A
nion
)
n[pyr13]
+
([FSI]-)
n[EMIM]
+
([BF4]-)
n[pyr14]
+
([TFSI]-)
0 0.1 0.2 0.3 0.4xLi
+ (mole fraction Li-salt)
30
40
50
60
70
Cis
Isom
er (
%)
[TFSI]-
(a)
(b)
[FSI]-
Figure 3: (a) Average number of anion neighbors to each ionic liquid cation, ncation(anion),and (b) probability of cis and trans conformations of anions in the [pyr14][TFSI] and[pyr13][FSI] systems a function of Li-salt doping.
38
0.1
1
10
g(r)
0.95[pyr14][TFSI] + 0.05Li[TFSI]
0.80[pyr14][TFSI] + 0.20Li[TFSI]
0.67[pyr14][TFSI] + 0.33Li[TFSI]
0 2 4 6 8
r (Å)
0.1
1
10
g(r)
0.95[pyr13][FSI] + 0.05Li[FSI]
0.80[pyr13][FSI] + 0.20Li[FSI]
0.67[pyr13][FSI] + 0.33Li[FSI]
0 2 4 6 8
r (Å)0 2 4 6 8
r (Å)
0.95[EMIM][BF4] + 0.05Li[BF4]
0.80[EMIM][BF4] + 0.20Li[BF4]
0.67[EMIM][BF4] + 0.33Li[BF4]
(a)
(d)
(b)
(e)
(c)
(f)
Li+ - [TFSI]
-Li
+ - [FSI]
-Li
+ - [BF4]
-
Li+ - F
[BF4]-
Li+ - O
[FSI]-
Li+ - O
[TFSI]-
Figure 4: Radial distributions functions of (a-c) Li+ with anions as well as (d-e) Li+ withatomic binding sites on the respective anions at T = 298 K and as a function of xLi+ for ourionic liquid systems.
39
10 20 30 40xLi
+ (mole fraction Li-salt)
60
70
80
90
100
Mon
oden
tate
Li+
Lig
ands
(%
)
[TFSI]-
[BF4]-
[FSI]-
Figure 5: Proportion of Li+ ligand anions having monodentate bonds as a function of Li-saltdoping at T = 298 K.
40
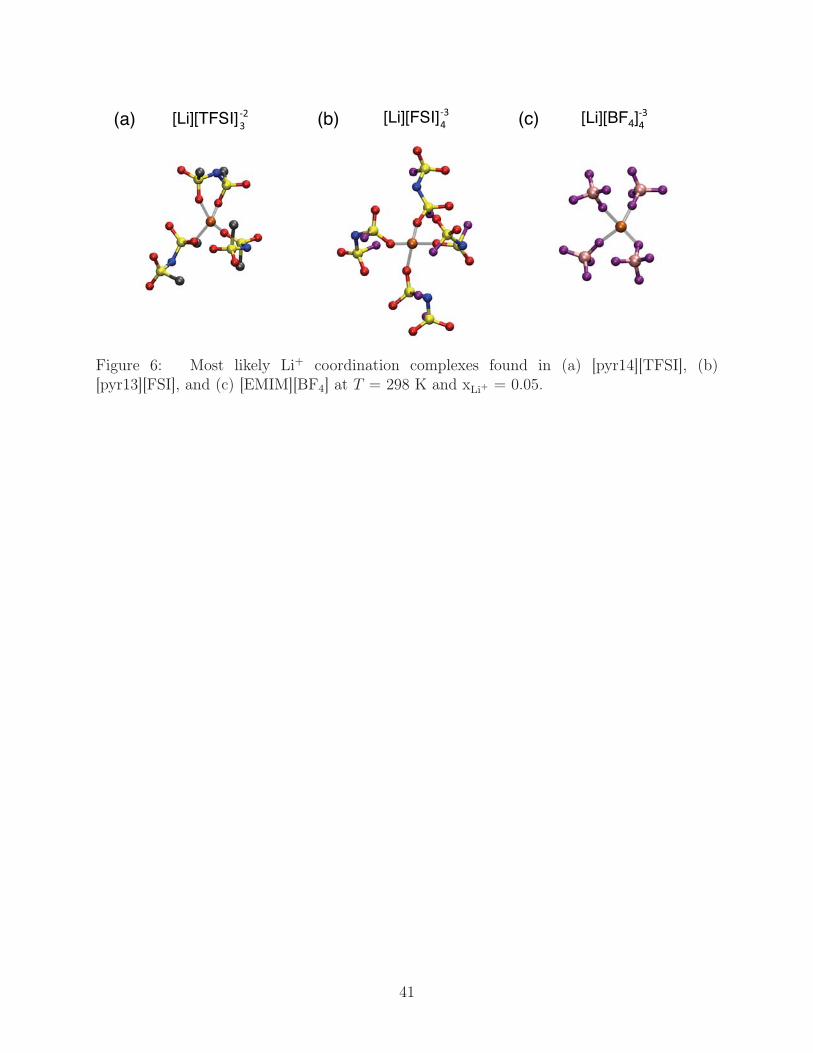
(a)� (b)� (c)�[Li][TFSI]������ [Li][FSI]������ [Li][BF4]������
Figure 6: Most likely Li+ coordination complexes found in (a) [pyr14][TFSI], (b)[pyr13][FSI], and (c) [EMIM][BF4] at T = 298 K and xLi+ = 0.05.
41
0 5 10 15 20r (Å)
0
2
4
6
8
10
gLi+ -L
i+ (r)
xLi+ = 0.05
xLi+ = 0.20
xLi+ = 0.33
[EMIM][BF4](c)
0 5 10 15 20r (Å)
0
1
2
3
4
gLi+ -
Li+
(r)
xLi+ = 0.05
xLi+ = 0.20
xLi+ = 0.33
[pyr13][FSI]
(b)
0 5 10 15 20r (Å)
0
1
2
3
4
5gLi
+ - L
i+
(r)
xLi+ = 0.05
xLi+ = 0.20
xLi+ = 0.33
[pyr14][TFSI](a)[pyr13][FSI] [EMIM][BF4][pyr14][TFSI]
Figure 7: Radial distribution function of Li+ ions with other Li+ ions for [pyr14][TFSI],[pyr13][FSI], and [EMIM][BF4] at T = 298 K. The evolution of a large peak at 4 Å indicatesformation of clusters.
42
10-3
10-2
10-1
100
101
102
Clu
ster
Dis
trib
utio
n (%
)
xLi+ = 0.33
xLi+ = 0.20
xLi+ = 0.15
xLi+ = 0.10
10-3
10-2
10-1
100
101
102
Clu
ster
Dis
trib
utio
n (%
)
1 2 3 4 5 6 7NLi
+ (cluster size)
10-3
10-2
10-1
100
101
102
Clu
ster
Dis
trib
utio
n (%
)(a)
(b)
(c)
[pyr14][TFSI]
[pyr13][FSI]
[EMIM][BF4]
Figure 8: Li-cluster size statistics given as a function of cluster size at T = 298 K for (a)[pyr14][TFSI], (b) [pyr13][FSI], and (c) [EMIM][BF4].
43
1-coordinated� 2-coordinated�
3-coordinated�4-coordinated�
Figure 9: Representative configuration of a lithium cluster taken from a T = 298 K[pyr14][TFSI] system having xLi+ =0.33 (F atoms removed for clarity).
44
300 320 340 360 380 400T (K)
1200
1300
1400
ρ (k
g·m
-3)
[pyr14][TFSI][pyr13][FSI][EMIM][BF4]
[pyr14][TFSI] (exp)[pyr13][FSI] (exp)[EMIM][BF4] (exp)
0 0.1 0.2 0.3 0.4xLi
+ (mol fraction Li-salt)
1200
1300
1400
1500
ρ (k
g·m
-3)
[pyr14][TFSI][pyr13][FSI][EMIM][BF4]
[pyr14][TFSI] (exp)[EMIM][BF4] (exp)
(a)
(b)
Figure 10: Density of (a) neat ionic liquids as a function of system T and (b) ionic liquidsat T = 298 K as a function of Li-salt doping. MD simulations (filled symbols) are comparedto available experimental measures(open symbols).19,26,61
45
101
102
2.6 2.8 3 3.2 3.4
1000/T (K-1
)
101
102
�xy
(cP
)
xLi+ = 0.10
xLi+ = 0.00
xLi+ = 0.00 (exp)
(c)[pyr13][FSI]
101
102
103
�xy
(cP
)
xLi+ = 0.10
xLi+ = 0.10 (luc)
xLi+ = 0.10 (exp)
xLi+ = 0.00
xLi+ = 0.00 (exp)
101
102
�xy
(cP
)
xLi+ = 0.10
xLi+ = 0.10 (exp)
xLi+ = 0.00
xLi+ = 0.00 (exp)
[pyr14][TFSI] (a)
(b)[EMIM][BF4]
Figure 11: Shear viscosity of (a) [pyr14][TFSI], (b) [EMIM][BF4], and (c) [pyr13][FSI] forneat systems and those having xLi+ = 0.10 as a function of T . Experimental comparisonsare included for both systems.19,22,24,45
46
10-2
10-1
100
2.6 2.8 3 3.2 3.4
1000/T (K-1
)
10-2
10-1
100
D x
1010
(m
2 s-1)
2.6 2.8 3 3.2 3.4
1000/T (K-1
)
[pyr13]+
[FSI]-
Li+
(e) (f)
0.9[pyr13][FSI] + 0.1Li[FSI][pyr13][FSI]
[pyr14]+ (exp)
[TFSI]- (exp)
Li+ (exp)
10-2
10-1
100
D x
1010
(m
2 s-1)
10-1
100
101
D x
1010
(m
2 s-1)
[pyr14]+
[TFSI]-
Li+
Li+ (luc)
[pyr14]+ (exp)
[TFSI]- (exp)
Li+ (exp)
[EMIM]+
[BF4]-
Li+
[EMIM]+ (exp)
[BF4]- (exp)
Li+ (exp)
(a)
(c)
(b)
(d)
[pyr14][TFSI] 0.9[pyr14][TFS1] + 0.1Li[TFSI]
0.9[EMIM][BF4] + 0.1Li[BF4][EMIM][BF4]
Figure 12: Diffusion coefficients for [pyr14][TFSI] in both (a) the neat form and (b) thathaving xLi+ = 0.10, [EMIM][BF4] in both (c) the neat form and (d) that having xLi+ = 0.10,and [pyr13][FSI] in both (e) the neat form and (f) that having xLi+ = 0.10 as a function ofT . MD simulation results (solid symbols) are compared with available experiments (outlinedsymbols).19,21,24,45
47
0.1
1
10
� (m
S/c
m)
xLi+ = 0.0
xLi+ = 0.0 (exp)
xLi+ = 0.20
xLi+ = 0.18 (exp)
1
10
100
� (m
S/c
m)
xLi+ = 0.0
xLi+ = 0.0 (exp)
xLi+ = 0.10
xLi+ = 0.09 (exp)
(a) [pyr14][TFSI]
(b) [EMIM][BF4]
2.6 2.8 3 3.2 3.4
1000/T (K-1
)
0.1
1
10
100
� (m
S/c
m)
xLi+ = 0.0
xLi+ = 0.0 (exp)
xLi+ = 0.15
xLi+ = 0.13 (exp)
(c) [pyr13][FSI]
0.1
1
10
100
2.6 2.8 3 3.2 3.4
1000/T (K-1
)
0.1
1
10
100
� (m
S/c
m)
xLi+ = 0.0
xLi+ = 0.0 (exp)
xLi+ = 0.10
(c) [pyr13][FSI]
0.1
1
10
λ (m
S/c
m)
xLi+ = 0.0
xLi+ = 0.0 (exp)
xLi+ = 0.20
xLi+ = 0.18 (exp)
1
10
100
λ (m
S/c
m)
xLi+ = 0.0
xLi+ = 0.0 (exp)
xLi+ = 0.10
xLi+ = 0.09 (exp)
(a) [pyr14][TFSI]
(b) [EMIM][BF4]
2.6 2.8 3 3.2 3.4
1000/T (K-1
)
0.1
1
10
100
� (m
S/c
m)
xLi+ = 0.0
xLi+ = 0.0 (exp)
xLi+ = 0.10
(c) [pyr13][FSI]
2.6 2.8 3 3.2 3.4
1000/T (K-1
)
0.1
1
10
100
� (m
S/c
m)
xLi+ = 0.0
xLi+ = 0.0 (exp)
xLi+ = 0.15
xLi+ = 0.13 (exp)
(c) [pyr13][FSI]
2.6 2.8 3 3.2 3.4
1000/T (K-1
)
0.1
1
10
100
� (m
S/c
m)
xLi+ = 0.0
xLi+ = 0.0 (exp)
xLi+ = 0.15
xLi+ = 0.13 (exp)
(c) [pyr13][FSI]
Figure 13: Ionic conduction of (a) [pyr14][TFSI] in both the neat form and that havingxLi+ = 0.20, (b) [EMIM][BF4] in both the neat form and that having xLi+ = 0.10, and (c)[pyr13][FSI] in both the neat form and that having xLi+ = 0.15. MD simulation results (solidsymbols) are compared to experimental measures (outlined symbols).5,19,22,24,53
48
2.8 3.2 3.6 4
1000/T (K-1
)
100
101
102
λ (m
S/c
m)
1 M Li[PF6] in 1:1 EC:DMC
0.5 m Li[BF4] in [EMIM][BF4]
0.5 m Li[FSI] in [pyr13][FSI]
0.5 m Li[TFSI] in [pyr14][TFSI]
10 % error bars
Figure 14: Comparison of experimental measures of λ for 0.5 m Li[BF4] in [EMIM][BF4],0.5 m Li[FSI] in [pyr13][FSI], and 0.5 m Li[TFSI] in [pyr14][TFSI]. Experimental measures ofλ for 1 M Li[PF6] in 1:1 ethylene carbonate:dimethyl carbonate (EC:DMC), a typical Li-ionelectrolyte, are also included.
49
101
102
103
� (
cP)
[pyr14][TFSI][pyr14][TFSI] (exp)
10-2
10-1
100
DLi
+ x 10
10 (
m2 /s
)
0 0.1 0.2 0.3 0.4xLi
+ (mol fraction)
10-2
10-1
�Li+ (
mS
/cm
)
(a)
(d)
(g)
[EMIM][BF4]
[EMIM][BF4] (exp)
0 0.1 0.2 0.3 0.4xLi
+ (mol fraction)
(b)
(e)
(h)
[pyr13][FSI][pyr13][FSI] (exp)
0 0.1 0.2 0.3 0.4xLi
+ (mol fraction)
(c)
(f)
(i)
(f)
0 0.1 0.2 0.3 0.4xLi
+ (mol fraction)
(i)
[pyr14][TFSI]
luc�
luc�
luc�
Figure 15: Li-doping dependence of the T = 298 K transport properties, (a-c) shear viscosity,(d-f) lithium diffusion, and (g-i) the lithium contribution to ionic conduction, for the threeionic liquids considered in this work. MD simulation results (solid symbols) are comparedto available experiments (outlined symbols).5,10,14,19,21,24,53
50
0 0.1 0.2 0.3 0.4xLi
+ (mole fraction Li-salt)
1
10
100�Li
/ - (
ns)
[pyr14][TFSI]
[EMIM][BF4]
[pyr13][FSI]
300 325 350 375 400T (K)
1
10
100
�Li /
- (ns
)
[pyr14][TFSI]
[EMIM][BF4]
[pyr13][FSI]
(a)
(b)
T = 298 K
xLi+ = 0.10
Figure 16: Residence time (τLi/−) of Li+ with ionic liquid anions, given (a) as a function ofxLi+ at T = 298 K and (b) as a function of T at xLi+ = 0.10.
51
SUPPLEMENTARY MATERIAL
Contents
1. Structural Analysis 12. Computational and Experimental Thermodynamics 5References 9
1. Structural Analysis
0 50 1e+02 1.5e+02 (deg)
0
0.01
0.02
0.03
Dih
edra
l Dis
trib
utio
n (%
)
TFSIFSI
(a)
cis
trans
Figure S1. Distribution of the C-S–S-C dihedral and the F-S–S-F dihe-dral in [TFSI]− and [FSI]−, respectively, at T = 298 K. Values of φ closeto 180◦ represent trans conformations, while smaller values represent cisconformations.
1
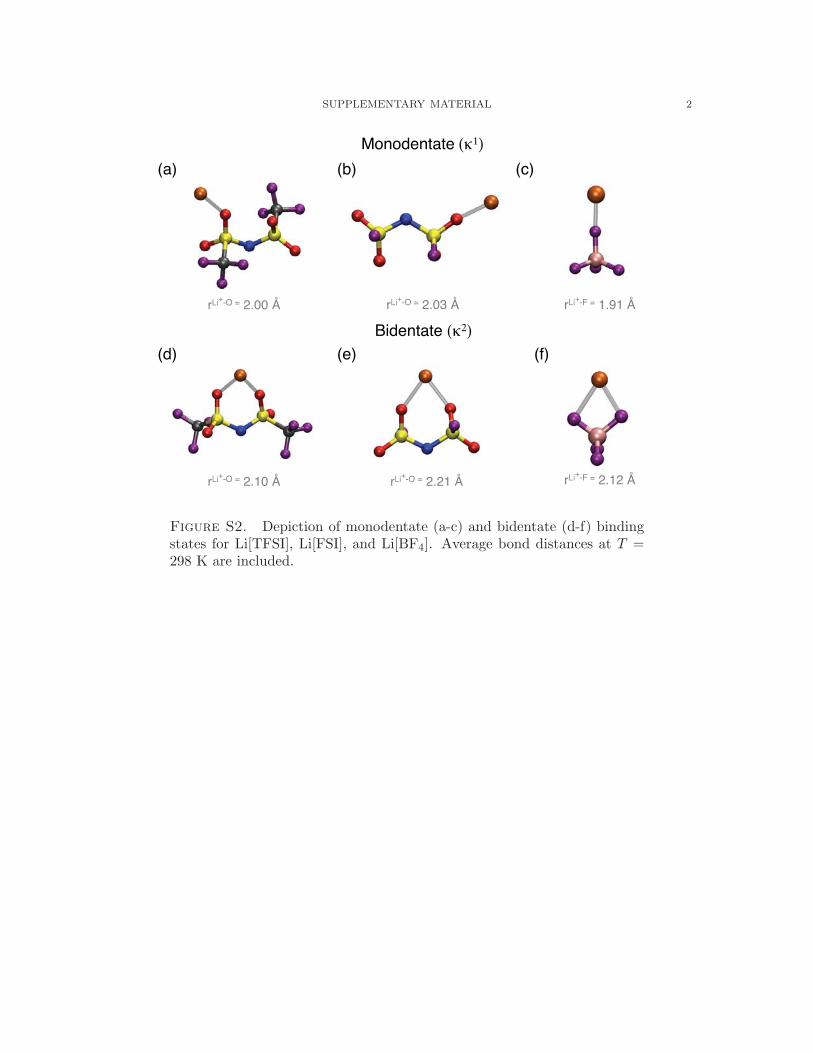
SUPPLEMENTARY MATERIAL 2
Monodentate (κ1)�
Bidentate (κ2)�
(a)�
(d)�
(b)� (c)�
(f)�(e)�
rLi+-O = 2.00 �
rLi+-O = 2.21 �
rLi+-F = 1.91 �
rLi+-O = 2.10 �
rLi+-O = 2.03 �
rLi+-F = 2.12 �
Figure S2. Depiction of monodentate (a-c) and bidentate (d-f) bindingstates for Li[TFSI], Li[FSI], and Li[BF4]. Average bond distances at T =298 K are included.
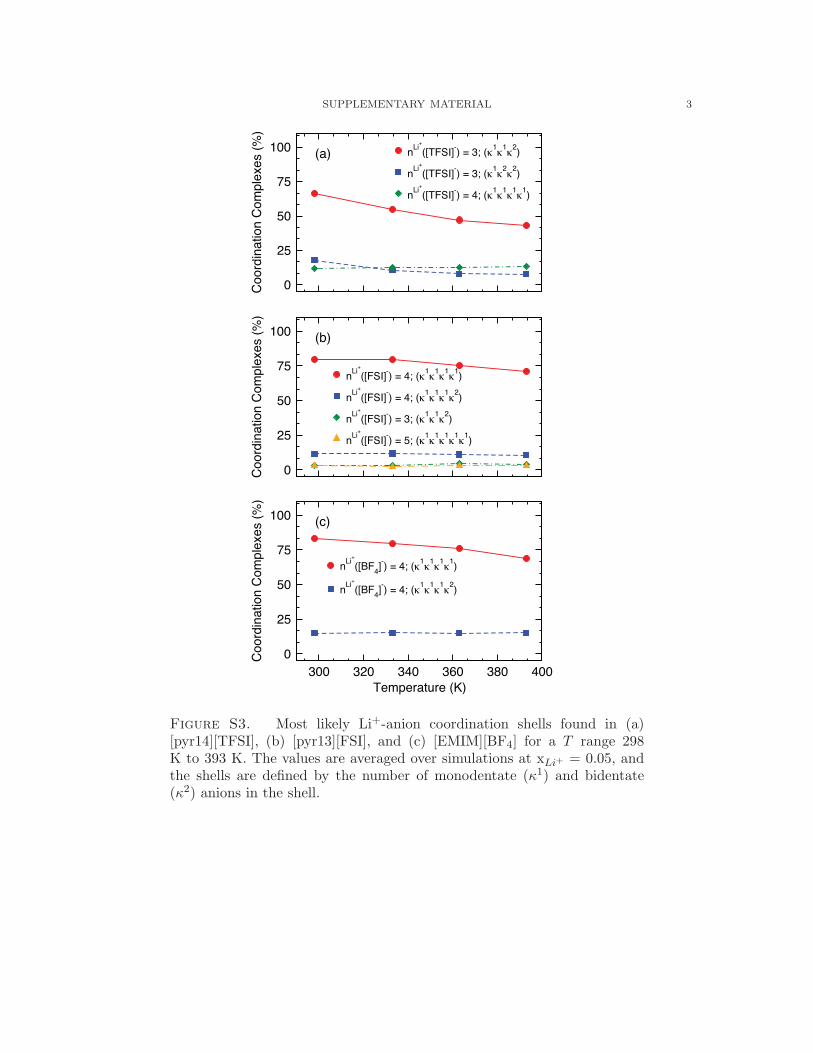
SUPPLEMENTARY MATERIAL 3
0
25
50
75
100
Coo
rdin
atio
n C
ompl
exes
(%
)
nLi
+
([TFSI]-) = 3; (κ
1κ
1κ
2)
nLi
+
([TFSI]-) = 3; (κ
1κ
2κ
2)
nLi
+
([TFSI]-) = 4; (κ
1κ
1κ
1κ
1)
0
25
50
75
100
Coo
rdin
atio
n C
ompl
exes
(%
)
nLi
+
([FSI]-) = 4; (κ
1κ
1κ
1κ
1)
nLi
+
([FSI]-) = 4; (κ
1κ
1κ
1κ
2)
nLi
+
([FSI]-) = 3; (κ
1κ
1κ
2)
nLi
+
([FSI]-) = 5; (κ
1κ
1κ
1κ
1κ
1)
300 320 340 360 380 400Temperature (K)
0
25
50
75
100
Coo
rdin
atio
n C
ompl
exes
(%
)
nLi
+
([BF4]-) = 4; (κ
1κ
1κ
1κ
1)
nLi
+
([BF4]-) = 4; (κ
1κ
1κ
1κ
2)
(a)
(b)
(c)
Figure S3. Most likely Li+-anion coordination shells found in (a)[pyr14][TFSI], (b) [pyr13][FSI], and (c) [EMIM][BF4] for a T range 298K to 393 K. The values are averaged over simulations at xLi+ = 0.05, andthe shells are defined by the number of monodentate (κ1) and bidentate(κ2) anions in the shell.
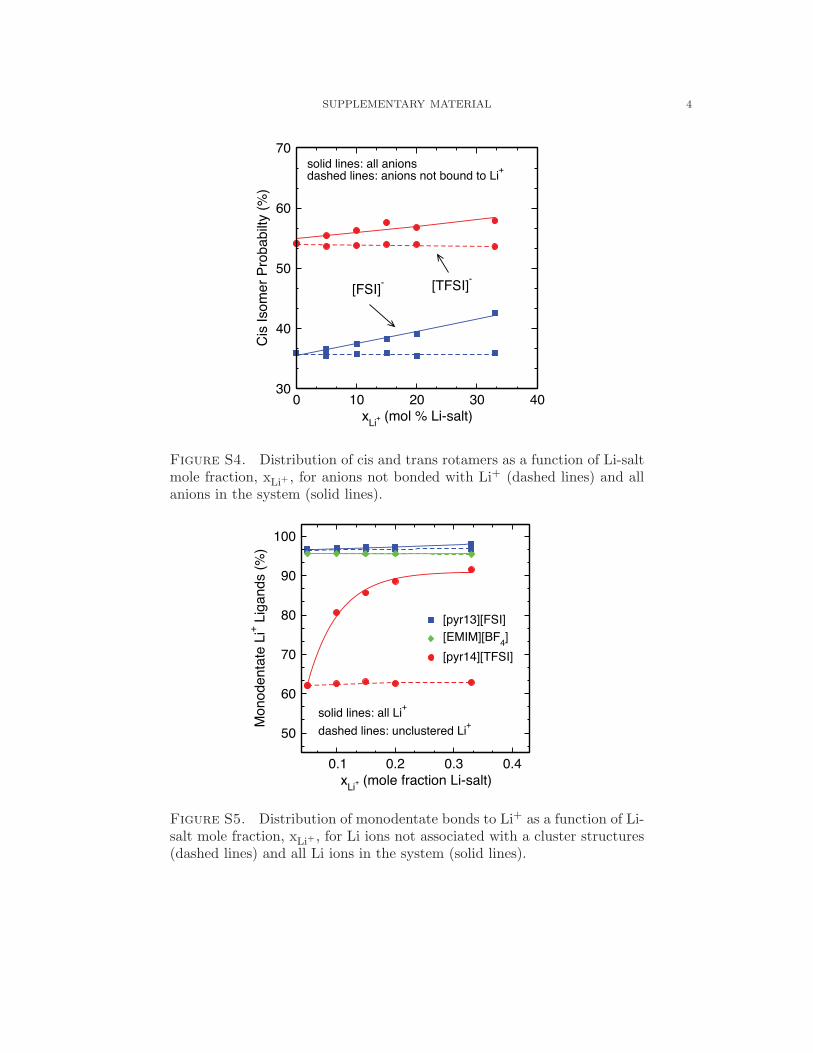
SUPPLEMENTARY MATERIAL 4
0 10 20 30 40xLi
+ (mol % Li-salt)
30
40
50
60
70
Cis
Isom
er P
roba
bilty
(%
)
[TFSI]-
[FSI]-
solid lines: all anionsdashed lines: anions not bound to Li
+
Figure S4. Distribution of cis and trans rotamers as a function of Li-saltmole fraction, xLi+ , for anions not bonded with Li+ (dashed lines) and allanions in the system (solid lines).
0.1 0.2 0.3 0.4xLi
+ (mole fraction Li-salt)
50
60
70
80
90
100
Mon
oden
tate
Li+
Lig
ands
(%
)
[pyr13][FSI][EMIM][BF4]
[pyr14][TFSI]
dashed lines: unclustered Li+
solid lines: all Li+
Figure S5. Distribution of monodentate bonds to Li+ as a function of Li-salt mole fraction, xLi+ , for Li ions not associated with a cluster structures(dashed lines) and all Li ions in the system (solid lines).
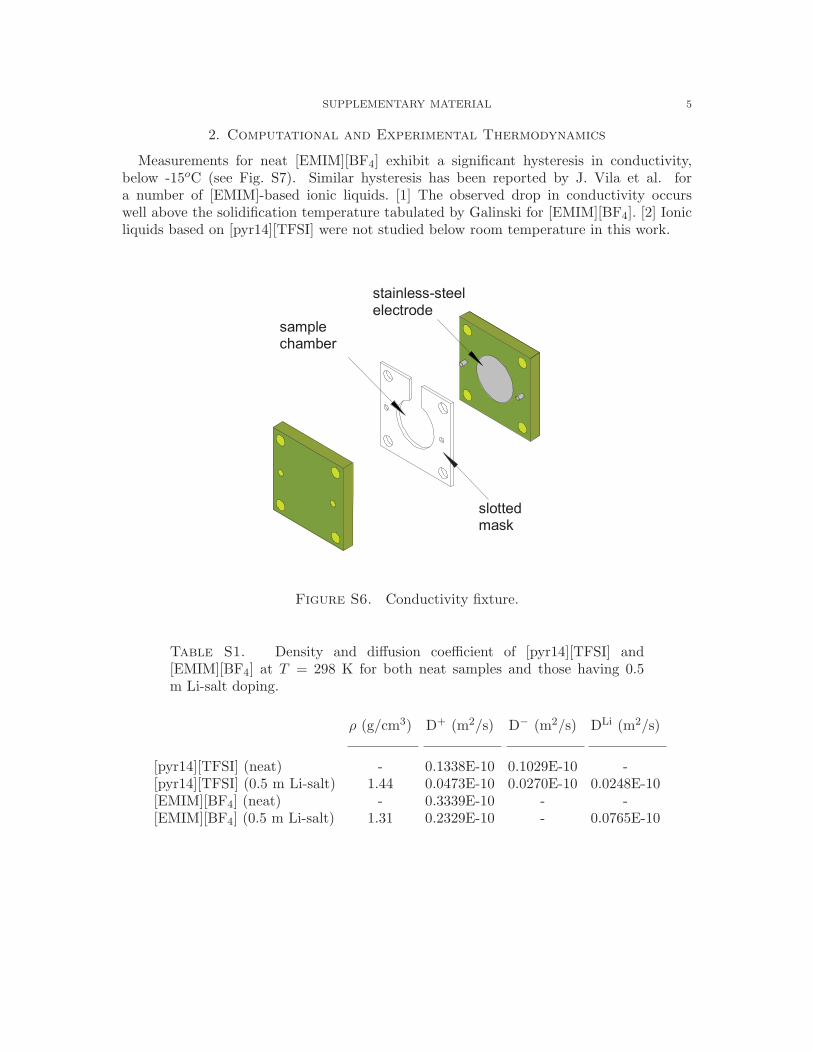
SUPPLEMENTARY MATERIAL 5
2. Computational and Experimental Thermodynamics
Measurements for neat [EMIM][BF4] exhibit a significant hysteresis in conductivity,below -15oC (see Fig. S7). Similar hysteresis has been reported by J. Vila et al. fora number of [EMIM]-based ionic liquids. [1] The observed drop in conductivity occurswell above the solidification temperature tabulated by Galinski for [EMIM][BF4]. [2] Ionicliquids based on [pyr14][TFSI] were not studied below room temperature in this work.
sample chamber
slotted mask
stainless-steel electrode
Figure S6. Conductivity fixture.
Table S1. Density and diffusion coefficient of [pyr14][TFSI] and[EMIM][BF4] at T = 298 K for both neat samples and those having 0.5m Li-salt doping.
ρ (g/cm3) D+ (m2/s) D− (m2/s) DLi (m2/s)
[pyr14][TFSI] (neat) - 0.1338E-10 0.1029E-10 -[pyr14][TFSI] (0.5 m Li-salt) 1.44 0.0473E-10 0.0270E-10 0.0248E-10[EMIM][BF4] (neat) - 0.3339E-10 - -[EMIM][BF4] (0.5 m Li-salt) 1.31 0.2329E-10 - 0.0765E-10
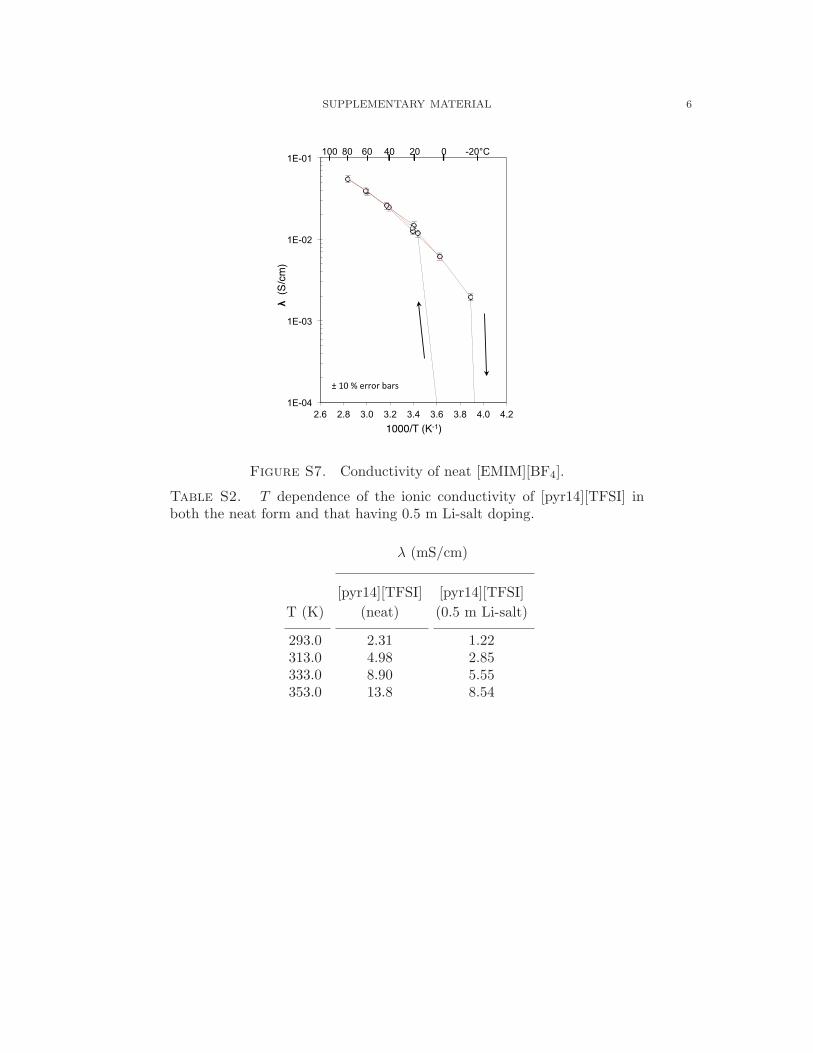
SUPPLEMENTARY MATERIAL 6
�
-20°C 0 20 40 60 80 100
1E-04
1E-03
1E-02
1E-01
2.6 2.8 3.0 3.2 3.4 3.6 3.8 4.0 4.2
λ (S
/cm
)�
1000/T (K-1)�
��������������
Figure S7. Conductivity of neat [EMIM][BF4].
Table S2. T dependence of the ionic conductivity of [pyr14][TFSI] inboth the neat form and that having 0.5 m Li-salt doping.
λ (mS/cm)
[pyr14][TFSI] [pyr14][TFSI]
T (K) (neat) (0.5 m Li-salt)
293.0 2.31 1.22313.0 4.98 2.85333.0 8.90 5.55353.0 13.8 8.54
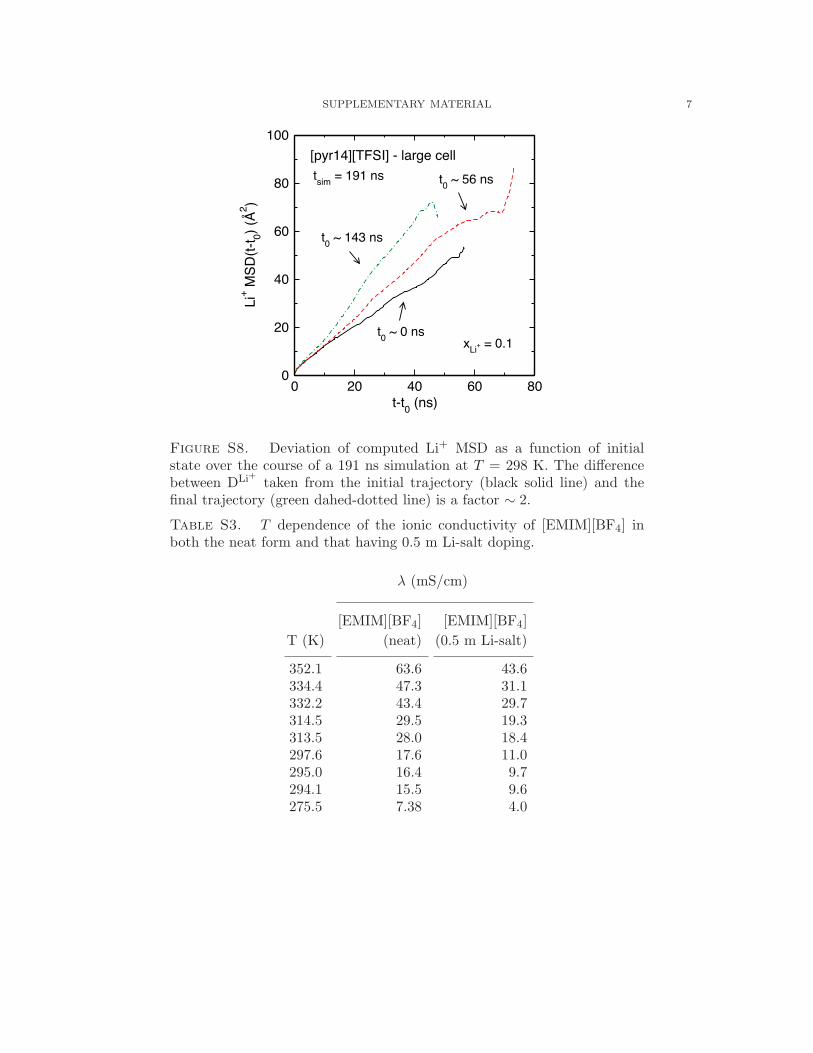
SUPPLEMENTARY MATERIAL 7
0 20 40 60 80t-t0 (ns)
0
20
40
60
80
100
Li+ M
SD
(t-t
0) (
Å2 )
[pyr14][TFSI] - large cell
xLi+ = 0.1
tsim = 191 ns
t0 ~ 0 ns
t0 ~ 143 ns
t0 ~ 56 ns
Figure S8. Deviation of computed Li+ MSD as a function of initialstate over the course of a 191 ns simulation at T = 298 K. The differencebetween DLi+ taken from the initial trajectory (black solid line) and thefinal trajectory (green dahed-dotted line) is a factor ∼ 2.
Table S3. T dependence of the ionic conductivity of [EMIM][BF4] inboth the neat form and that having 0.5 m Li-salt doping.
λ (mS/cm)
[EMIM][BF4] [EMIM][BF4]
T (K) (neat) (0.5 m Li-salt)
352.1 63.6 43.6334.4 47.3 31.1332.2 43.4 29.7314.5 29.5 19.3313.5 28.0 18.4297.6 17.6 11.0295.0 16.4 9.7294.1 15.5 9.6275.5 7.38 4.0
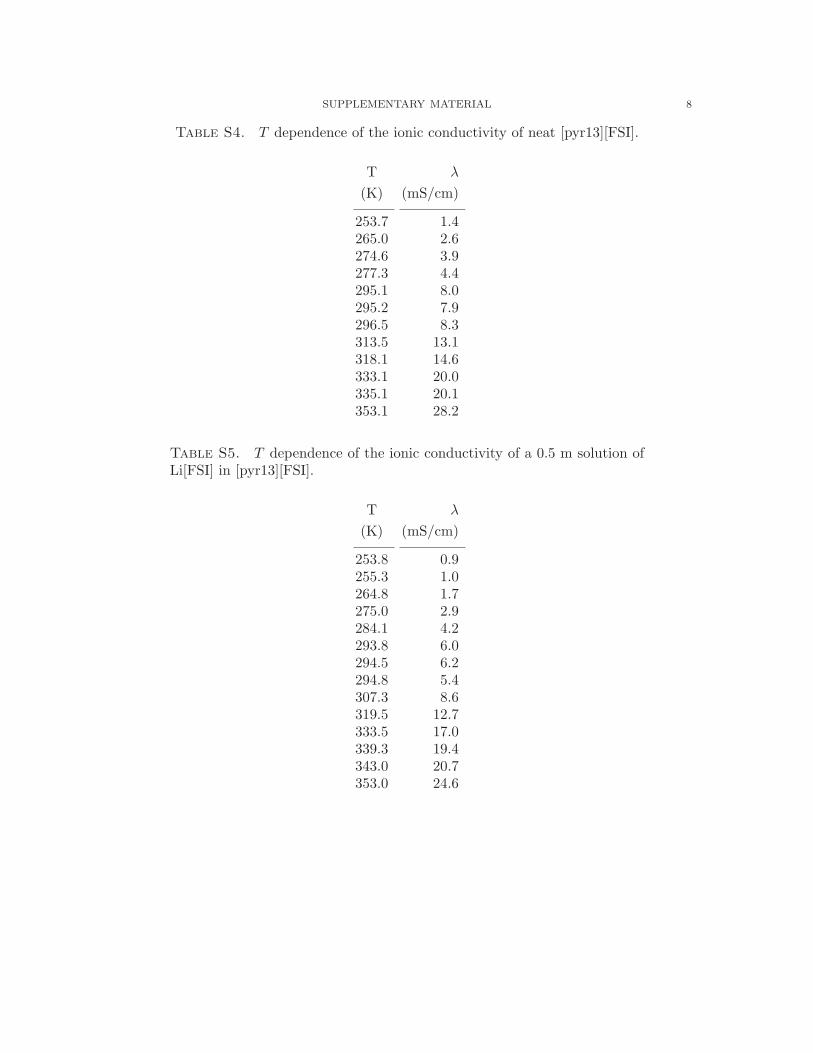
SUPPLEMENTARY MATERIAL 8
Table S4. T dependence of the ionic conductivity of neat [pyr13][FSI].
T λ
(K) (mS/cm)
253.7 1.4265.0 2.6274.6 3.9277.3 4.4295.1 8.0295.2 7.9296.5 8.3313.5 13.1318.1 14.6333.1 20.0335.1 20.1353.1 28.2
Table S5. T dependence of the ionic conductivity of a 0.5 m solution ofLi[FSI] in [pyr13][FSI].
T λ
(K) (mS/cm)
253.8 0.9255.3 1.0264.8 1.7275.0 2.9284.1 4.2293.8 6.0294.5 6.2294.8 5.4307.3 8.6319.5 12.7333.5 17.0339.3 19.4343.0 20.7353.0 24.6

SUPPLEMENTARY MATERIAL 9
References
[1] J. Vila, C. Franjo, J. M. Pico, L. M. Varela, and O. Cabeza. Port. Electrochim. Acta, 51:5567–5580,2006.
[2] M. Galinski, A. Lewandowski, and I. Stepniak. Electrochim. Acta, 51:5567–5580, 2006.