Embed Size (px)
Citation preview
Computational and Experimental Investigation of Camber Morphing Airfoils forReverse Flow Drag Reduction on High-Speed Rotorcraft
George Jacobellis*PhD candidate
Farhan GandhiProfessor
Center for Mobility with Vertical Lift (MOVE)Rennselaer Polytechnic Institute
Thomas RicePhD candidate
Michael AmitayProfessor
Center for Flow Physics and ControlRennselaer Polytechnic Institute
ABSTRACTThrough computational fluid dynamics simulations and wind tunnel tests this study examines a NACA63-218 airfoilin reverse flow at Re = 375,000, and demonstrates reduction in reverse flow drag through the introduction of reflexcamber when the airfoil is pitched nose up in reverse flow. Of the three dominant sources of reverse flow drag - rampressure on the upper surface near the trailing-edge, suction on the lower surface near the trailing-edge, and bluff bodyseparation at the rounded nose, reflex camber influences the first two, while leaving the third mostly unaffected. Thechange in trailing-edge geometry reduces exposure to ram drag on the upper surface while the suction on the lowersurface rotates to result in a force opposite to the direction of the free stream. Although the 2D CFD simulations(URANS with SA turbulence model) had difficulty predicting the bluff body separation at the airfoil nose well, thechange in flow at the trailing-edge was well captured yielding drag reductions of around 60% for a 10◦ reflex camber(compared to reductions of around 50% in the wind-tunnel test). Even greater percentage reductions in drag (upto 70%) were observed with a larger 15◦ reflex angle for nose-up pitch angles greater than 5◦ in reverse flow. Withsimulations at a higher Reynolds number (1.5 million) showing very similar drag reductions, using reflex camber overinboard blade sections appears to have signifcant promise for alleviating reverse flow drag on edgewise rotors at highadvance ratio.
INTRODUCTION
In recent years there has been tremendous interest in extend-ing the maximum forward speed of rotary-wing aircraft op-erating with edgewise rotors to around 250 kts. Two config-urations that have been heavily studied are the slowed rotorcompound and the lift-offset coaxial configurations. In bothcases, constraints on the maximum advancing tip Mach num-ber require that the main rotor progressively slow down asthe forward speed increases. The increasing forward speedcombined with the reduction in rotor RPM results in rapidincreases in advance ratio, and the high advance ratio (ap-proaching 1, or greater) puts large inboard sections of theretreating blade in reverse flow, the phenomena whereby airflows from the sharp trailing-edge of the blade toward therounded leading edge. To mitigate this adverse aerodynamiccondition, slowed rotor compound helicopters transfer the ma-jority of the lifting function to the wing in high-speed flight,while lift-offset coaxial helicopters transfer the lifting func-tion to the advancing side of each of its counter-rotating ro-tors.
*corresponding author. Submitted for the AHS 74th Annual Forum,Phoenix, AZ, USA, May 15–17, 2018.
Despite significantly offloading the entire rotor (for theslowed rotor compound helicopters) or the retreating side (forlift-offset coaxial helicopters), the reverse flow region stillremains hugely problematic; generating negative lift, largeamounts of drag (which increases rotor H-force and reducesrotor L/De), and high vibratory loads on the blades, pitch linksand rotor hub. In the development of the X2TD, Sikorsky Air-craft Corporation introduced very specific design changes onthe rotor blades targeted towards improvement in the reverseflow region (Ref. 1). Compared to the more conventionalblades on the XH-59A, Sikorsky’s previous coaxial helicopterfrom the 1970’s, the X2TD blades had a lower chord in theinboard region, a lower pitch, and used double-ended airfoils.Figure 1 shows a schematic comparison of the operating statesof these airfoils in reverse flow. While all of these changeswere beneficial for the reverse flow region, they can be ex-pected to be significantly detrimental to hover performance(recall that high pitch and chord is desirable over the inboardsections of the blade in hover). Additionally, using double-ended airfoils on the inboard blade sections to address reverseflow will result in even more lift being generated outboard inhover, yielding a further increase in rotor induced power. Arecent study by Giovanetti and Hall (Ref. 2) suggests that a
1
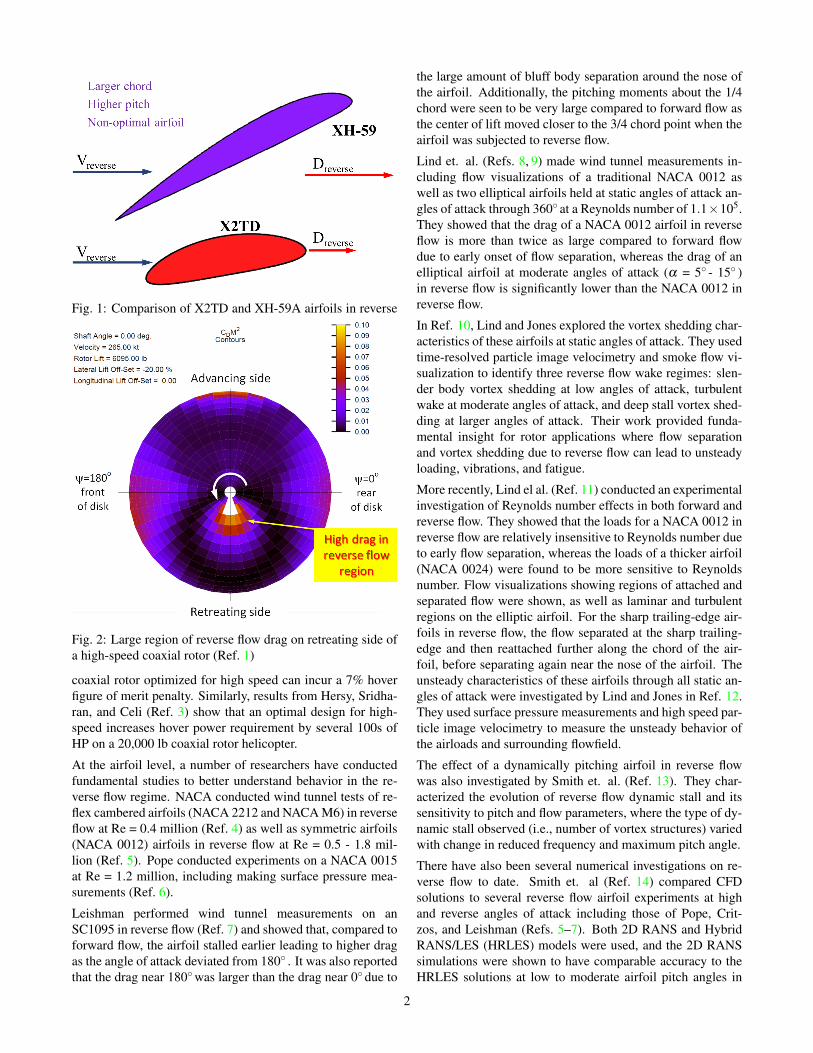
Fig. 1: Comparison of X2TD and XH-59A airfoils in reverseflow
Fig. 2: Large region of reverse flow drag on retreating side ofa high-speed coaxial rotor (Ref. 1)
coaxial rotor optimized for high speed can incur a 7% hoverfigure of merit penalty. Similarly, results from Hersy, Sridha-ran, and Celi (Ref. 3) show that an optimal design for high-speed increases hover power requirement by several 100s ofHP on a 20,000 lb coaxial rotor helicopter.
At the airfoil level, a number of researchers have conductedfundamental studies to better understand behavior in the re-verse flow regime. NACA conducted wind tunnel tests of re-flex cambered airfoils (NACA 2212 and NACA M6) in reverseflow at Re = 0.4 million (Ref. 4) as well as symmetric airfoils(NACA 0012) airfoils in reverse flow at Re = 0.5 - 1.8 mil-lion (Ref. 5). Pope conducted experiments on a NACA 0015at Re = 1.2 million, including making surface pressure mea-surements (Ref. 6).
Leishman performed wind tunnel measurements on anSC1095 in reverse flow (Ref. 7) and showed that, compared toforward flow, the airfoil stalled earlier leading to higher dragas the angle of attack deviated from 180◦ . It was also reportedthat the drag near 180◦ was larger than the drag near 0◦ due to
the large amount of bluff body separation around the nose ofthe airfoil. Additionally, the pitching moments about the 1/4chord were seen to be very large compared to forward flow asthe center of lift moved closer to the 3/4 chord point when theairfoil was subjected to reverse flow.
Lind et. al. (Refs. 8, 9) made wind tunnel measurements in-cluding flow visualizations of a traditional NACA 0012 aswell as two elliptical airfoils held at static angles of attack an-gles of attack through 360◦ at a Reynolds number of 1.1×10⁵.They showed that the drag of a NACA 0012 airfoil in reverseflow is more than twice as large compared to forward flowdue to early onset of flow separation, whereas the drag of anelliptical airfoil at moderate angles of attack (α = 5◦ - 15◦ )in reverse flow is significantly lower than the NACA 0012 inreverse flow.
In Ref. 10, Lind and Jones explored the vortex shedding char-acteristics of these airfoils at static angles of attack. They usedtime-resolved particle image velocimetry and smoke flow vi-sualization to identify three reverse flow wake regimes: slen-der body vortex shedding at low angles of attack, turbulentwake at moderate angles of attack, and deep stall vortex shed-ding at larger angles of attack. Their work provided funda-mental insight for rotor applications where flow separationand vortex shedding due to reverse flow can lead to unsteadyloading, vibrations, and fatigue.
More recently, Lind el al. (Ref. 11) conducted an experimentalinvestigation of Reynolds number effects in both forward andreverse flow. They showed that the loads for a NACA 0012 inreverse flow are relatively insensitive to Reynolds number dueto early flow separation, whereas the loads of a thicker airfoil(NACA 0024) were found to be more sensitive to Reynoldsnumber. Flow visualizations showing regions of attached andseparated flow were shown, as well as laminar and turbulentregions on the elliptic airfoil. For the sharp trailing-edge air-foils in reverse flow, the flow separated at the sharp trailing-edge and then reattached further along the chord of the air-foil, before separating again near the nose of the airfoil. Theunsteady characteristics of these airfoils through all static an-gles of attack were investigated by Lind and Jones in Ref. 12.They used surface pressure measurements and high speed par-ticle image velocimetry to measure the unsteady behavior ofthe airloads and surrounding flowfield.
The effect of a dynamically pitching airfoil in reverse flowwas also investigated by Smith et. al. (Ref. 13). They char-acterized the evolution of reverse flow dynamic stall and itssensitivity to pitch and flow parameters, where the type of dy-namic stall observed (i.e., number of vortex structures) variedwith change in reduced frequency and maximum pitch angle.
There have also been several numerical investigations on re-verse flow to date. Smith et. al (Ref. 14) compared CFDsolutions to several reverse flow airfoil experiments at highand reverse angles of attack including those of Pope, Crit-zos, and Leishman (Refs. 5–7). Both 2D RANS and HybridRANS/LES (HRLES) models were used, and the 2D RANSsimulations were shown to have comparable accuracy to theHRLES solutions at low to moderate airfoil pitch angles in
2
reverse flow with substantially reduced computational time.Hodora and Smith extended the numerical study to variousMach numbers and yaw angles in Ref. 15.
A collaborative experimental and numerical investigation ofairfoils in reverse flow conducted by Hodora et al. (Ref. 16)further characterized the performance of airfoils in reverseflow by comparing simulations with the experiments per-formed by Lind et. al. in Ref. 9. The authors successfullypredicted the presence of the three unsteady wake regimesshown experimentally in Ref. 10. They showed that at an-gles of attack from about α = 170◦ -190◦ (+/- 10◦ in reverseflow) both 2D RANS and HRLES simulations compared wellwith the experiments from Ref. 9, reinforcing the result fromRef 14 that 2D RANS is can provide good performance pre-dictions at low to moderate reverse flow angles of attack. Ref.16 also included an investigation of a two-dimensional NACA0012 airfoil dynamically pitched through stall in reverse flowand compared with the experimental results in Ref. 13.
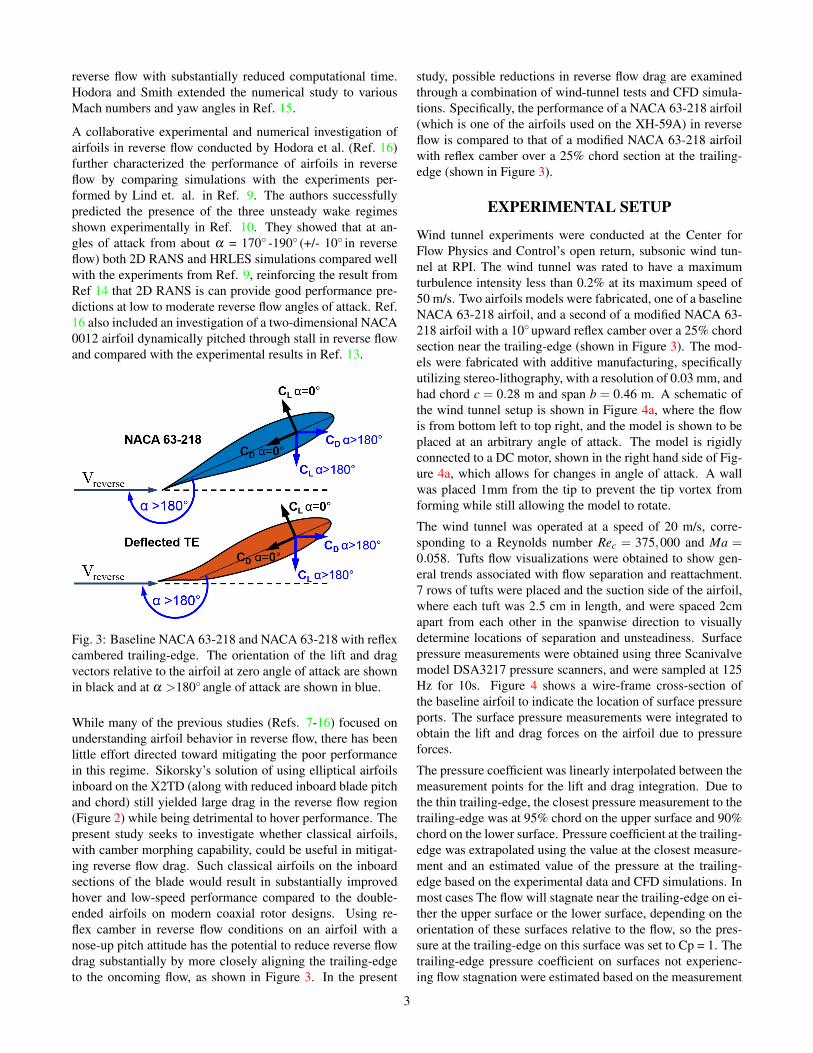
Fig. 3: Baseline NACA 63-218 and NACA 63-218 with reflexcambered trailing-edge. The orientation of the lift and dragvectors relative to the airfoil at zero angle of attack are shownin black and at α >180◦ angle of attack are shown in blue.
While many of the previous studies (Refs. 7-16) focused onunderstanding airfoil behavior in reverse flow, there has beenlittle effort directed toward mitigating the poor performancein this regime. Sikorsky’s solution of using elliptical airfoilsinboard on the X2TD (along with reduced inboard blade pitchand chord) still yielded large drag in the reverse flow region(Figure 2) while being detrimental to hover performance. Thepresent study seeks to investigate whether classical airfoils,with camber morphing capability, could be useful in mitigat-ing reverse flow drag. Such classical airfoils on the inboardsections of the blade would result in substantially improvedhover and low-speed performance compared to the double-ended airfoils on modern coaxial rotor designs. Using re-flex camber in reverse flow conditions on an airfoil with anose-up pitch attitude has the potential to reduce reverse flowdrag substantially by more closely aligning the trailing-edgeto the oncoming flow, as shown in Figure 3. In the present
study, possible reductions in reverse flow drag are examinedthrough a combination of wind-tunnel tests and CFD simula-tions. Specifically, the performance of a NACA 63-218 airfoil(which is one of the airfoils used on the XH-59A) in reverseflow is compared to that of a modified NACA 63-218 airfoilwith reflex camber over a 25% chord section at the trailing-edge (shown in Figure 3).
EXPERIMENTAL SETUP
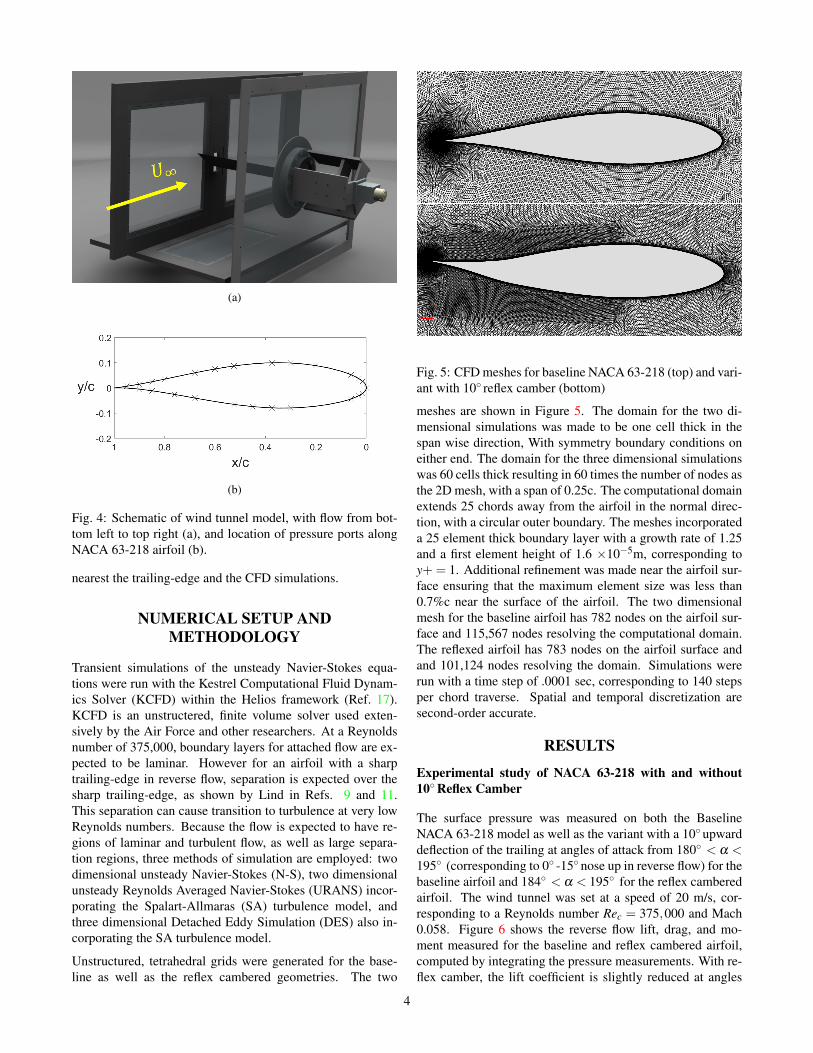
Wind tunnel experiments were conducted at the Center forFlow Physics and Control’s open return, subsonic wind tun-nel at RPI. The wind tunnel was rated to have a maximumturbulence intensity less than 0.2% at its maximum speed of50 m/s. Two airfoils models were fabricated, one of a baselineNACA 63-218 airfoil, and a second of a modified NACA 63-218 airfoil with a 10◦ upward reflex camber over a 25% chordsection near the trailing-edge (shown in Figure 3). The mod-els were fabricated with additive manufacturing, specificallyutilizing stereo-lithography, with a resolution of 0.03 mm, andhad chord c = 0.28 m and span b = 0.46 m. A schematic ofthe wind tunnel setup is shown in Figure 4a, where the flowis from bottom left to top right, and the model is shown to beplaced at an arbitrary angle of attack. The model is rigidlyconnected to a DC motor, shown in the right hand side of Fig-ure 4a, which allows for changes in angle of attack. A wallwas placed 1mm from the tip to prevent the tip vortex fromforming while still allowing the model to rotate.
The wind tunnel was operated at a speed of 20 m/s, corre-sponding to a Reynolds number Rec = 375,000 and Ma =0.058. Tufts flow visualizations were obtained to show gen-eral trends associated with flow separation and reattachment.7 rows of tufts were placed and the suction side of the airfoil,where each tuft was 2.5 cm in length, and were spaced 2cmapart from each other in the spanwise direction to visuallydetermine locations of separation and unsteadiness. Surfacepressure measurements were obtained using three Scanivalvemodel DSA3217 pressure scanners, and were sampled at 125Hz for 10s. Figure 4 shows a wire-frame cross-section ofthe baseline airfoil to indicate the location of surface pressureports. The surface pressure measurements were integrated toobtain the lift and drag forces on the airfoil due to pressureforces.
The pressure coefficient was linearly interpolated between themeasurement points for the lift and drag integration. Due tothe thin trailing-edge, the closest pressure measurement to thetrailing-edge was at 95% chord on the upper surface and 90%chord on the lower surface. Pressure coefficient at the trailing-edge was extrapolated using the value at the closest measure-ment and an estimated value of the pressure at the trailing-edge based on the experimental data and CFD simulations. Inmost cases The flow will stagnate near the trailing-edge on ei-ther the upper surface or the lower surface, depending on theorientation of these surfaces relative to the flow, so the pres-sure at the trailing-edge on this surface was set to Cp = 1. Thetrailing-edge pressure coefficient on surfaces not experienc-ing flow stagnation were estimated based on the measurement
3
(a)
(b)
Fig. 4: Schematic of wind tunnel model, with flow from bot-tom left to top right (a), and location of pressure ports alongNACA 63-218 airfoil (b).
nearest the trailing-edge and the CFD simulations.
NUMERICAL SETUP ANDMETHODOLOGY
Transient simulations of the unsteady Navier-Stokes equa-tions were run with the Kestrel Computational Fluid Dynam-ics Solver (KCFD) within the Helios framework (Ref. 17).KCFD is an unstructered, finite volume solver used exten-sively by the Air Force and other researchers. At a Reynoldsnumber of 375,000, boundary layers for attached flow are ex-pected to be laminar. However for an airfoil with a sharptrailing-edge in reverse flow, separation is expected over thesharp trailing-edge, as shown by Lind in Refs. 9 and 11.This separation can cause transition to turbulence at very lowReynolds numbers. Because the flow is expected to have re-gions of laminar and turbulent flow, as well as large separa-tion regions, three methods of simulation are employed: twodimensional unsteady Navier-Stokes (N-S), two dimensionalunsteady Reynolds Averaged Navier-Stokes (URANS) incor-porating the Spalart-Allmaras (SA) turbulence model, andthree dimensional Detached Eddy Simulation (DES) also in-corporating the SA turbulence model.
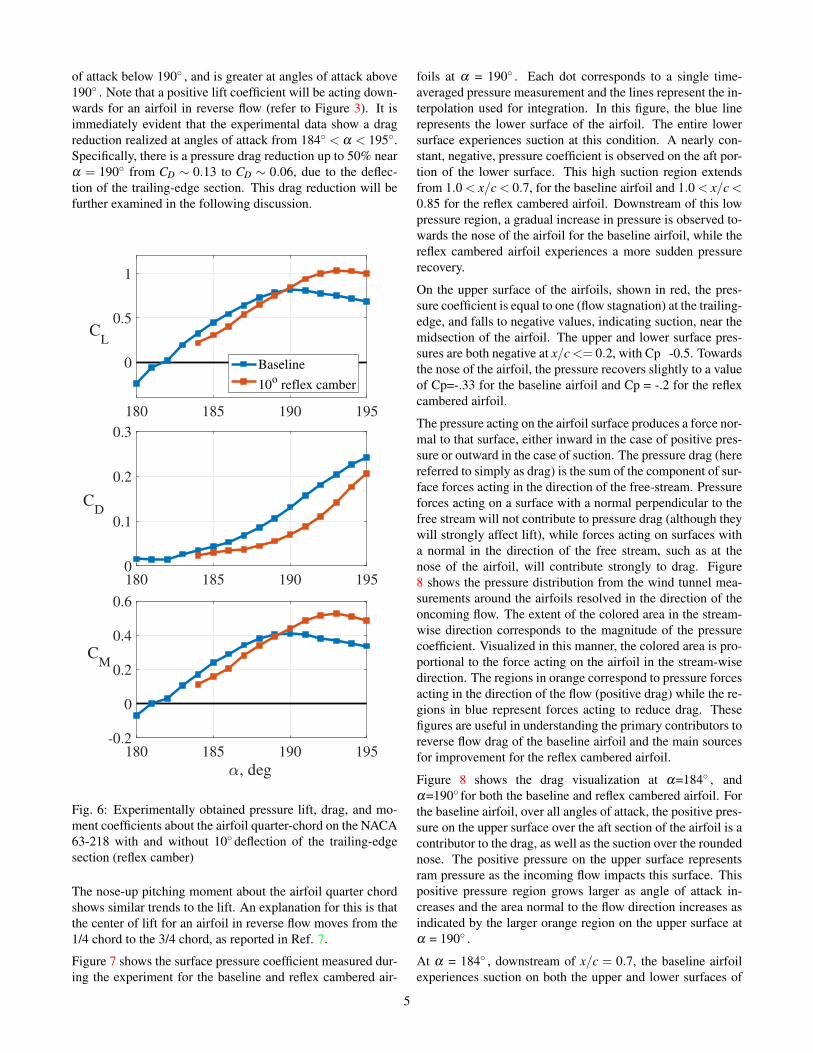
Unstructured, tetrahedral grids were generated for the base-line as well as the reflex cambered geometries. The two
Fig. 5: CFD meshes for baseline NACA 63-218 (top) and vari-ant with 10◦ reflex camber (bottom)
meshes are shown in Figure 5. The domain for the two di-mensional simulations was made to be one cell thick in thespan wise direction, With symmetry boundary conditions oneither end. The domain for the three dimensional simulationswas 60 cells thick resulting in 60 times the number of nodes asthe 2D mesh, with a span of 0.25c. The computational domainextends 25 chords away from the airfoil in the normal direc-tion, with a circular outer boundary. The meshes incorporateda 25 element thick boundary layer with a growth rate of 1.25and a first element height of 1.6 ×10⁻⁵m, corresponding toy+= 1. Additional refinement was made near the airfoil sur-face ensuring that the maximum element size was less than0.7%c near the surface of the airfoil. The two dimensionalmesh for the baseline airfoil has 782 nodes on the airfoil sur-face and 115,567 nodes resolving the computational domain.The reflexed airfoil has 783 nodes on the airfoil surface andand 101,124 nodes resolving the domain. Simulations wererun with a time step of .0001 sec, corresponding to 140 stepsper chord traverse. Spatial and temporal discretization aresecond-order accurate.
RESULTS
Experimental study of NACA 63-218 with and without10◦ Reflex Camber
The surface pressure was measured on both the BaselineNACA 63-218 model as well as the variant with a 10◦ upwarddeflection of the trailing at angles of attack from 180◦ < α <195◦ (corresponding to 0◦ -15◦ nose up in reverse flow) for thebaseline airfoil and 184◦ < α < 195◦ for the reflex camberedairfoil. The wind tunnel was set at a speed of 20 m/s, cor-responding to a Reynolds number Rec = 375,000 and Mach0.058. Figure 6 shows the reverse flow lift, drag, and mo-ment measured for the baseline and reflex cambered airfoil,computed by integrating the pressure measurements. With re-flex camber, the lift coefficient is slightly reduced at angles
4
of attack below 190◦ , and is greater at angles of attack above190◦ . Note that a positive lift coefficient will be acting down-wards for an airfoil in reverse flow (refer to Figure 3). It isimmediately evident that the experimental data show a dragreduction realized at angles of attack from 184◦ < α < 195◦.Specifically, there is a pressure drag reduction up to 50% nearα = 190◦ from CD ∼ 0.13 to CD ∼ 0.06, due to the deflec-tion of the trailing-edge section. This drag reduction will befurther examined in the following discussion.
180 185 190 195
0
0.5
1
CL
Baseline
10o reflex camber
180 185 190 1950
0.1
0.2
0.3
CD
180 185 190 195
, deg
-0.2
0
0.2
0.4
0.6
CM
Fig. 6: Experimentally obtained pressure lift, drag, and mo-ment coefficients about the airfoil quarter-chord on the NACA63-218 with and without 10◦ deflection of the trailing-edgesection (reflex camber)
The nose-up pitching moment about the airfoil quarter chordshows similar trends to the lift. An explanation for this is thatthe center of lift for an airfoil in reverse flow moves from the1/4 chord to the 3/4 chord, as reported in Ref. 7.
Figure 7 shows the surface pressure coefficient measured dur-ing the experiment for the baseline and reflex cambered air-
foils at α = 190◦ . Each dot corresponds to a single time-averaged pressure measurement and the lines represent the in-terpolation used for integration. In this figure, the blue linerepresents the lower surface of the airfoil. The entire lowersurface experiences suction at this condition. A nearly con-stant, negative, pressure coefficient is observed on the aft por-tion of the lower surface. This high suction region extendsfrom 1.0 < x/c < 0.7, for the baseline airfoil and 1.0 < x/c <0.85 for the reflex cambered airfoil. Downstream of this lowpressure region, a gradual increase in pressure is observed to-wards the nose of the airfoil for the baseline airfoil, while thereflex cambered airfoil experiences a more sudden pressurerecovery.
On the upper surface of the airfoils, shown in red, the pres-sure coefficient is equal to one (flow stagnation) at the trailing-edge, and falls to negative values, indicating suction, near themidsection of the airfoil. The upper and lower surface pres-sures are both negative at x/c <= 0.2, with Cp -0.5. Towardsthe nose of the airfoil, the pressure recovers slightly to a valueof Cp=-.33 for the baseline airfoil and Cp = -.2 for the reflexcambered airfoil.
The pressure acting on the airfoil surface produces a force nor-mal to that surface, either inward in the case of positive pres-sure or outward in the case of suction. The pressure drag (herereferred to simply as drag) is the sum of the component of sur-face forces acting in the direction of the free-stream. Pressureforces acting on a surface with a normal perpendicular to thefree stream will not contribute to pressure drag (although theywill strongly affect lift), while forces acting on surfaces witha normal in the direction of the free stream, such as at thenose of the airfoil, will contribute strongly to drag. Figure8 shows the pressure distribution from the wind tunnel mea-surements around the airfoils resolved in the direction of theoncoming flow. The extent of the colored area in the stream-wise direction corresponds to the magnitude of the pressurecoefficient. Visualized in this manner, the colored area is pro-portional to the force acting on the airfoil in the stream-wisedirection. The regions in orange correspond to pressure forcesacting in the direction of the flow (positive drag) while the re-gions in blue represent forces acting to reduce drag. Thesefigures are useful in understanding the primary contributors toreverse flow drag of the baseline airfoil and the main sourcesfor improvement for the reflex cambered airfoil.
Figure 8 shows the drag visualization at α=184◦ , andα=190◦ for both the baseline and reflex cambered airfoil. Forthe baseline airfoil, over all angles of attack, the positive pres-sure on the upper surface over the aft section of the airfoil is acontributor to the drag, as well as the suction over the roundednose. The positive pressure on the upper surface representsram pressure as the incoming flow impacts this surface. Thispositive pressure region grows larger as angle of attack in-creases and the area normal to the flow direction increases asindicated by the larger orange region on the upper surface atα = 190◦ .
At α = 184◦ , downstream of x/c = 0.7, the baseline airfoilexperiences suction on both the upper and lower surfaces of
5
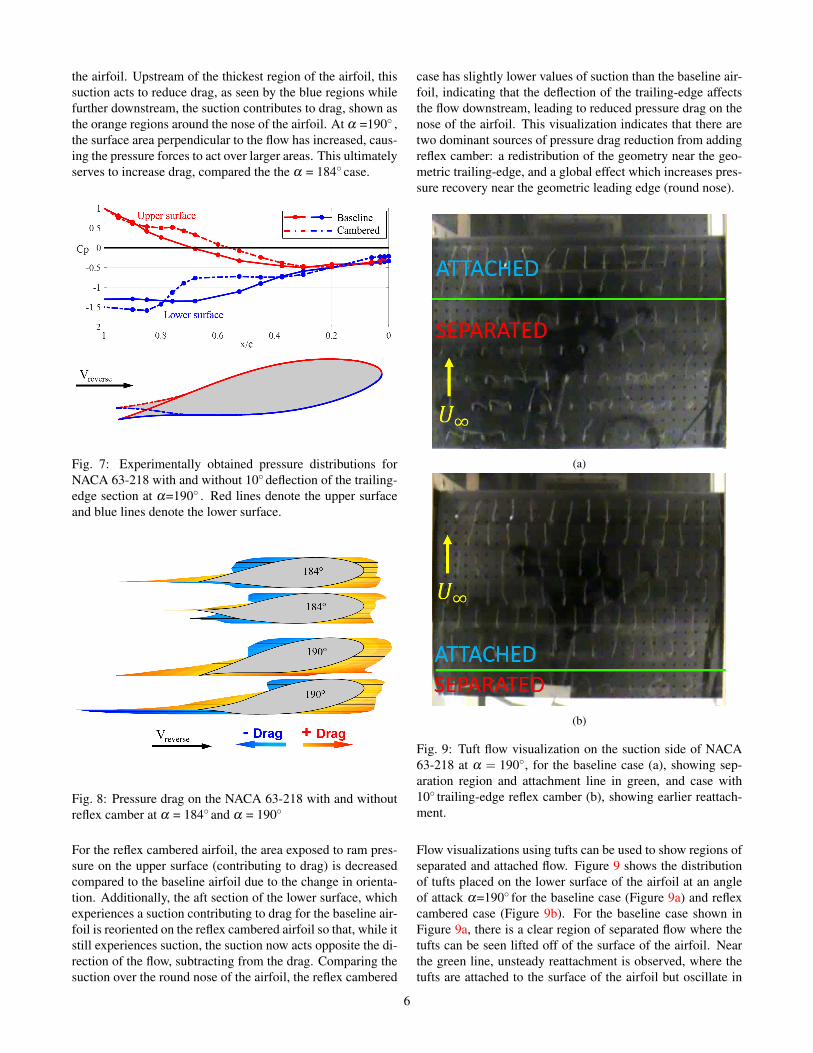
the airfoil. Upstream of the thickest region of the airfoil, thissuction acts to reduce drag, as seen by the blue regions whilefurther downstream, the suction contributes to drag, shown asthe orange regions around the nose of the airfoil. At α =190◦ ,the surface area perpendicular to the flow has increased, caus-ing the pressure forces to act over larger areas. This ultimatelyserves to increase drag, compared the the α = 184◦ case.
Fig. 7: Experimentally obtained pressure distributions forNACA 63-218 with and without 10◦ deflection of the trailing-edge section at α=190◦ . Red lines denote the upper surfaceand blue lines denote the lower surface.
Fig. 8: Pressure drag on the NACA 63-218 with and withoutreflex camber at α = 184◦ and α = 190◦
For the reflex cambered airfoil, the area exposed to ram pres-sure on the upper surface (contributing to drag) is decreasedcompared to the baseline airfoil due to the change in orienta-tion. Additionally, the aft section of the lower surface, whichexperiences a suction contributing to drag for the baseline air-foil is reoriented on the reflex cambered airfoil so that, while itstill experiences suction, the suction now acts opposite the di-rection of the flow, subtracting from the drag. Comparing thesuction over the round nose of the airfoil, the reflex cambered
case has slightly lower values of suction than the baseline air-foil, indicating that the deflection of the trailing-edge affectsthe flow downstream, leading to reduced pressure drag on thenose of the airfoil. This visualization indicates that there aretwo dominant sources of pressure drag reduction from addingreflex camber: a redistribution of the geometry near the geo-metric trailing-edge, and a global effect which increases pres-sure recovery near the geometric leading edge (round nose).
(a)
(b)
Fig. 9: Tuft flow visualization on the suction side of NACA63-218 at α = 190◦, for the baseline case (a), showing sep-aration region and attachment line in green, and case with10◦ trailing-edge reflex camber (b), showing earlier reattach-ment.
Flow visualizations using tufts can be used to show regions ofseparated and attached flow. Figure 9 shows the distributionof tufts placed on the lower surface of the airfoil at an angleof attack α=190◦ for the baseline case (Figure 9a) and reflexcambered case (Figure 9b). For the baseline case shown inFigure 9a, there is a clear region of separated flow where thetufts can be seen lifted off of the surface of the airfoil. Nearthe green line, unsteady reattachment is observed, where thetufts are attached to the surface of the airfoil but oscillate in
6
the spanwise direction. For the reflex cambered case shownin Figure 9b, the tufts are attached to the surface of the airfoilover nearly the entire length of the airfoil. The observed re-gions of separated flow show a qualitative comparison to thelow pressure regions on the underside of the airfoil shown inFigure 7, suggesting the presence of separation bubbles thatwill experience large amounts of suction, with the suction de-creasing as the flow reattaches.
CFD Simulations of NACA 63-218 with and without10◦ Reflex Camber
CFD simulations were carried out for the same airfoil geome-try and at the same conditions as the wind tunnel experiment.2D unsteady N-S and URANS/SA simulations were run forangles of attack from 180◦< α <194◦ in 2◦ increments. 3DDES simulations were also run for the baseline airfoil at 182◦ ,186◦ , and 190◦ . The 2D N-S simulations without the turbu-lence model are laminar in regions of attached flow, so theyare referred to as laminar, although large scale turbulence andunsteadiness was observed for these simulations in the de-tached regions of the flow. The 2D RANS simulations in-corporating the SA turbulence model are referred to as turbu-lent and the 3D DES simulations are referred to as DES. TheDES simulations were only slightly unsteady while the turbu-lent simulations showed almost no unsteadiness. Hodora et.al. also observed turbulent URANS simulations to result ina steady wake due to the dissipative nature of the turbulencemodel in Ref. 16.
All of the simulations were run for until the mean values oflift, drag, and moment stabilized, which was within about 20-40 chord passages. Only the forces due to pressure are shownhere so that they may be compared with the data from theexperiment, which was obtained by pressure integration.
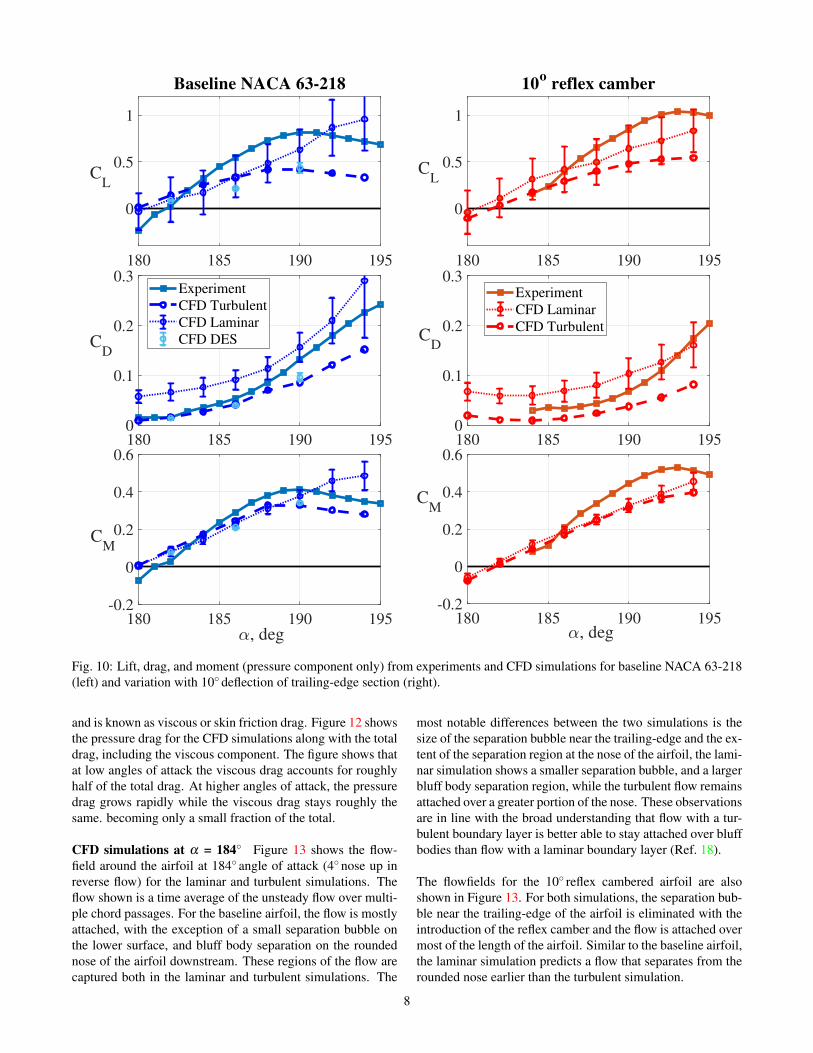
Figure 10 shows a comparison of the lift, drag, and momentcoefficients from the CFD simulations and the experiment.The values shown are time averages of the unsteady data overthe last five chord passages. Both the laminar and turbulentsimulations under predict the lift curve slope, causing the liftcoefficient to be under-predicted at moderate angles of attack(around α = 190◦ ) for both the baseline and reflex camberedairfoil. The laminar simulations show a larger peak lift co-efficient compared to both the experiment and the turbulentsimulations. The DES simulations show very similar trendsas the two dimensional turbulent simulations although the liftis slightly lower at α = 186◦ . The laminar simulations hada highly unsteady flowfield, represented by the vertical barsin the figure, which indicate one standard deviation of thelift, drag, or moment coefficient. The pitching moment showssimilar trends as the lift as it is largely driven by the lift actingat the 3/4 chord location.
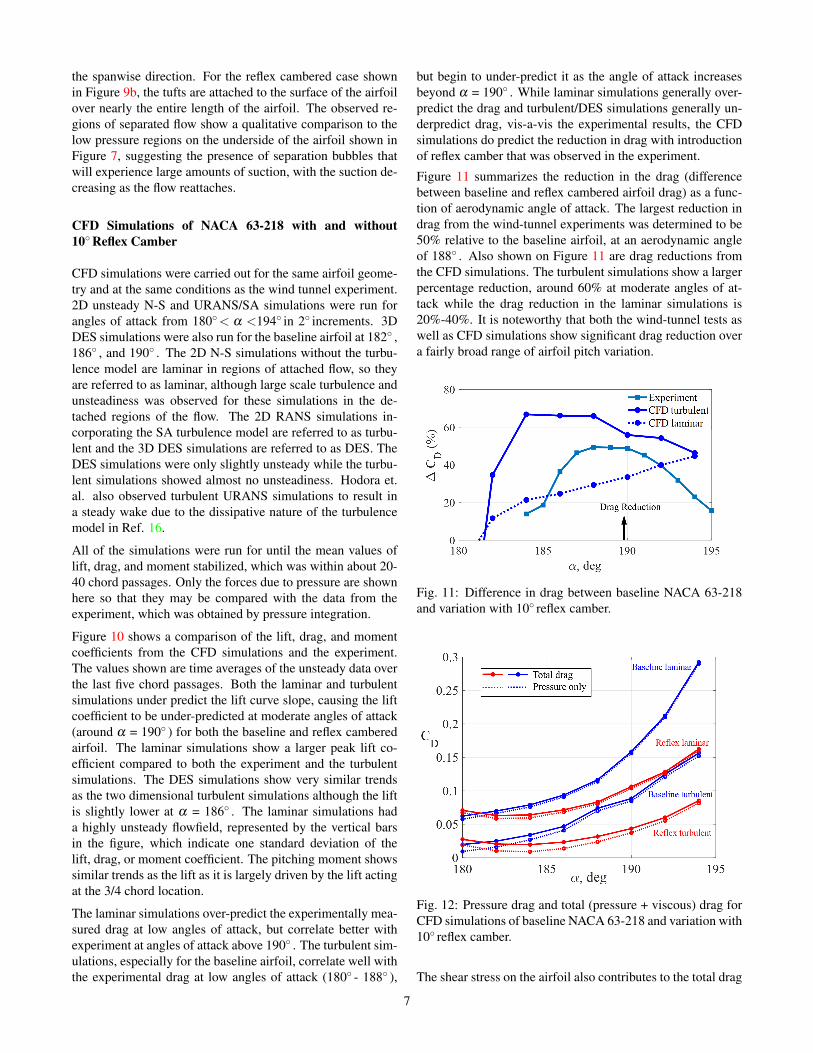
The laminar simulations over-predict the experimentally mea-sured drag at low angles of attack, but correlate better withexperiment at angles of attack above 190◦ . The turbulent sim-ulations, especially for the baseline airfoil, correlate well withthe experimental drag at low angles of attack (180◦ - 188◦ ),
but begin to under-predict it as the angle of attack increasesbeyond α = 190◦ . While laminar simulations generally over-predict the drag and turbulent/DES simulations generally un-derpredict drag, vis-a-vis the experimental results, the CFDsimulations do predict the reduction in drag with introductionof reflex camber that was observed in the experiment.
Figure 11 summarizes the reduction in the drag (differencebetween baseline and reflex cambered airfoil drag) as a func-tion of aerodynamic angle of attack. The largest reduction indrag from the wind-tunnel experiments was determined to be50% relative to the baseline airfoil, at an aerodynamic angleof 188◦ . Also shown on Figure 11 are drag reductions fromthe CFD simulations. The turbulent simulations show a largerpercentage reduction, around 60% at moderate angles of at-tack while the drag reduction in the laminar simulations is20%-40%. It is noteworthy that both the wind-tunnel tests aswell as CFD simulations show significant drag reduction overa fairly broad range of airfoil pitch variation.
Fig. 11: Difference in drag between baseline NACA 63-218and variation with 10◦ reflex camber.
Fig. 12: Pressure drag and total (pressure + viscous) drag forCFD simulations of baseline NACA 63-218 and variation with10◦ reflex camber.
The shear stress on the airfoil also contributes to the total drag
7
180 185 190 195
0
0.5
1
CL
Baseline NACA 63-218
180 185 190 1950
0.1
0.2
0.3
CD
Experiment
CFD Turbulent
CFD Laminar
CFD DES
180 185 190 195, deg
-0.2
0
0.2
0.4
0.6
CM
180 185 190 195
0
0.5
1
CL
10o reflex camber
180 185 190 1950
0.1
0.2
0.3
CD
Experiment
CFD Laminar
CFD Turbulent
180 185 190 195, deg
-0.2
0
0.2
0.4
0.6
CM
Fig. 10: Lift, drag, and moment (pressure component only) from experiments and CFD simulations for baseline NACA 63-218(left) and variation with 10◦ deflection of trailing-edge section (right).
and is known as viscous or skin friction drag. Figure 12 showsthe pressure drag for the CFD simulations along with the totaldrag, including the viscous component. The figure shows thatat low angles of attack the viscous drag accounts for roughlyhalf of the total drag. At higher angles of attack, the pressuredrag grows rapidly while the viscous drag stays roughly thesame. becoming only a small fraction of the total.
CFD simulations at α = 184◦ Figure 13 shows the flow-field around the airfoil at 184◦ angle of attack (4◦ nose up inreverse flow) for the laminar and turbulent simulations. Theflow shown is a time average of the unsteady flow over multi-ple chord passages. For the baseline airfoil, the flow is mostlyattached, with the exception of a small separation bubble onthe lower surface, and bluff body separation on the roundednose of the airfoil downstream. These regions of the flow arecaptured both in the laminar and turbulent simulations. The
most notable differences between the two simulations is thesize of the separation bubble near the trailing-edge and the ex-tent of the separation region at the nose of the airfoil, the lami-nar simulation shows a smaller separation bubble, and a largerbluff body separation region, while the turbulent flow remainsattached over a greater portion of the nose. These observationsare in line with the broad understanding that flow with a tur-bulent boundary layer is better able to stay attached over bluffbodies than flow with a laminar boundary layer (Ref. 18).
The flowfields for the 10◦ reflex cambered airfoil are alsoshown in Figure 13. For both simulations, the separation bub-ble near the trailing-edge of the airfoil is eliminated with theintroduction of the reflex camber and the flow is attached overmost of the length of the airfoil. Similar to the baseline airfoil,the laminar simulation predicts a flow that separates from therounded nose earlier than the turbulent simulation.
8
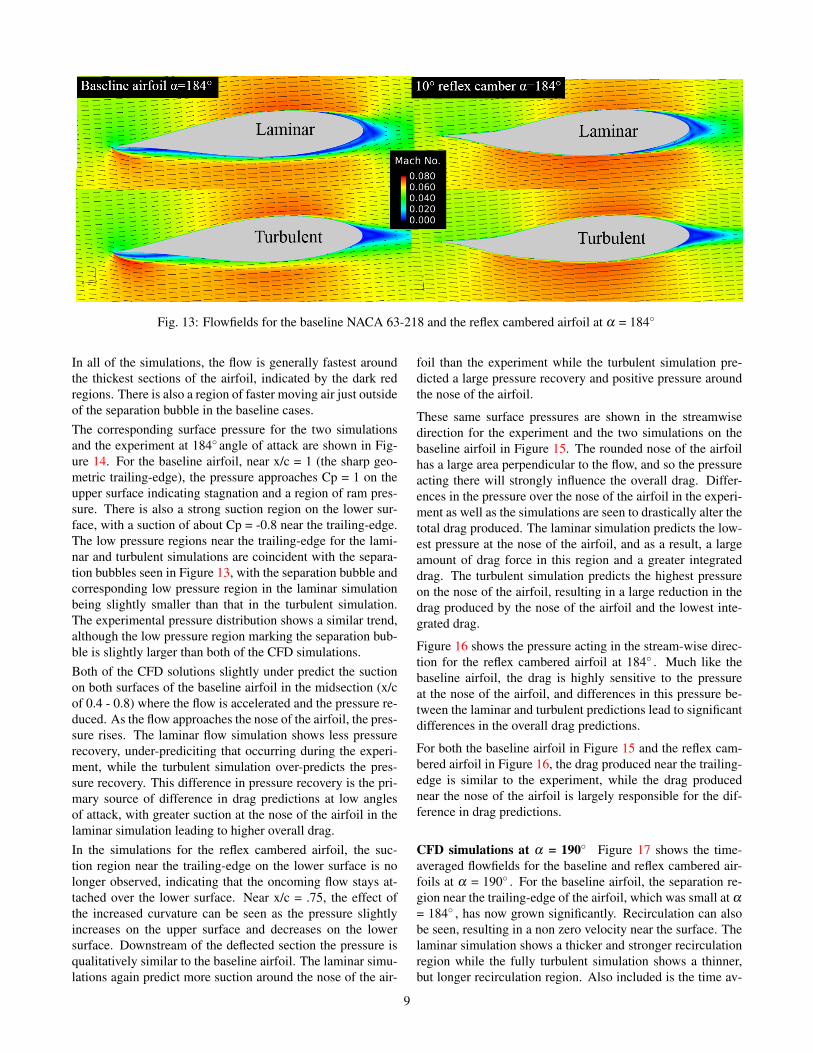
Fig. 13: Flowfields for the baseline NACA 63-218 and the reflex cambered airfoil at α = 184◦
In all of the simulations, the flow is generally fastest aroundthe thickest sections of the airfoil, indicated by the dark redregions. There is also a region of faster moving air just outsideof the separation bubble in the baseline cases.The corresponding surface pressure for the two simulationsand the experiment at 184◦ angle of attack are shown in Fig-ure 14. For the baseline airfoil, near x/c = 1 (the sharp geo-metric trailing-edge), the pressure approaches Cp = 1 on theupper surface indicating stagnation and a region of ram pres-sure. There is also a strong suction region on the lower sur-face, with a suction of about Cp = -0.8 near the trailing-edge.The low pressure regions near the trailing-edge for the lami-nar and turbulent simulations are coincident with the separa-tion bubbles seen in Figure 13, with the separation bubble andcorresponding low pressure region in the laminar simulationbeing slightly smaller than that in the turbulent simulation.The experimental pressure distribution shows a similar trend,although the low pressure region marking the separation bub-ble is slightly larger than both of the CFD simulations.Both of the CFD solutions slightly under predict the suctionon both surfaces of the baseline airfoil in the midsection (x/cof 0.4 - 0.8) where the flow is accelerated and the pressure re-duced. As the flow approaches the nose of the airfoil, the pres-sure rises. The laminar flow simulation shows less pressurerecovery, under-prediciting that occurring during the experi-ment, while the turbulent simulation over-predicts the pres-sure recovery. This difference in pressure recovery is the pri-mary source of difference in drag predictions at low anglesof attack, with greater suction at the nose of the airfoil in thelaminar simulation leading to higher overall drag.In the simulations for the reflex cambered airfoil, the suc-tion region near the trailing-edge on the lower surface is nolonger observed, indicating that the oncoming flow stays at-tached over the lower surface. Near x/c = .75, the effect ofthe increased curvature can be seen as the pressure slightlyincreases on the upper surface and decreases on the lowersurface. Downstream of the deflected section the pressure isqualitatively similar to the baseline airfoil. The laminar simu-lations again predict more suction around the nose of the air-
foil than the experiment while the turbulent simulation pre-dicted a large pressure recovery and positive pressure aroundthe nose of the airfoil.
These same surface pressures are shown in the streamwisedirection for the experiment and the two simulations on thebaseline airfoil in Figure 15. The rounded nose of the airfoilhas a large area perpendicular to the flow, and so the pressureacting there will strongly influence the overall drag. Differ-ences in the pressure over the nose of the airfoil in the experi-ment as well as the simulations are seen to drastically alter thetotal drag produced. The laminar simulation predicts the low-est pressure at the nose of the airfoil, and as a result, a largeamount of drag force in this region and a greater integrateddrag. The turbulent simulation predicts the highest pressureon the nose of the airfoil, resulting in a large reduction in thedrag produced by the nose of the airfoil and the lowest inte-grated drag.
Figure 16 shows the pressure acting in the stream-wise direc-tion for the reflex cambered airfoil at 184◦ . Much like thebaseline airfoil, the drag is highly sensitive to the pressureat the nose of the airfoil, and differences in this pressure be-tween the laminar and turbulent predictions lead to significantdifferences in the overall drag predictions.
For both the baseline airfoil in Figure 15 and the reflex cam-bered airfoil in Figure 16, the drag produced near the trailing-edge is similar to the experiment, while the drag producednear the nose of the airfoil is largely responsible for the dif-ference in drag predictions.
CFD simulations at α = 190◦ Figure 17 shows the time-averaged flowfields for the baseline and reflex cambered air-foils at α = 190◦ . For the baseline airfoil, the separation re-gion near the trailing-edge of the airfoil, which was small at α
= 184◦ , has now grown significantly. Recirculation can alsobe seen, resulting in a non zero velocity near the surface. Thelaminar simulation shows a thicker and stronger recirculationregion while the fully turbulent simulation shows a thinner,but longer recirculation region. Also included is the time av-
9
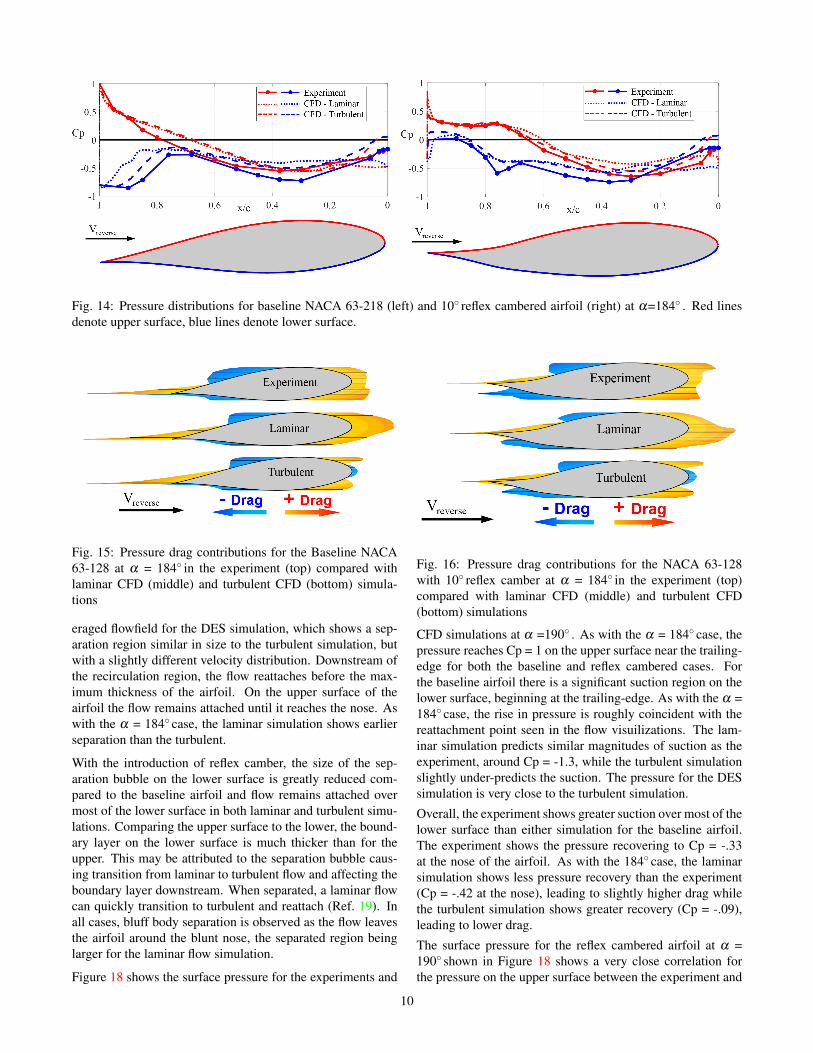
Fig. 14: Pressure distributions for baseline NACA 63-218 (left) and 10◦ reflex cambered airfoil (right) at α=184◦ . Red linesdenote upper surface, blue lines denote lower surface.
Fig. 15: Pressure drag contributions for the Baseline NACA63-128 at α = 184◦ in the experiment (top) compared withlaminar CFD (middle) and turbulent CFD (bottom) simula-tions
eraged flowfield for the DES simulation, which shows a sep-aration region similar in size to the turbulent simulation, butwith a slightly different velocity distribution. Downstream ofthe recirculation region, the flow reattaches before the max-imum thickness of the airfoil. On the upper surface of theairfoil the flow remains attached until it reaches the nose. Aswith the α = 184◦ case, the laminar simulation shows earlierseparation than the turbulent.
With the introduction of reflex camber, the size of the sep-aration bubble on the lower surface is greatly reduced com-pared to the baseline airfoil and flow remains attached overmost of the lower surface in both laminar and turbulent simu-lations. Comparing the upper surface to the lower, the bound-ary layer on the lower surface is much thicker than for theupper. This may be attributed to the separation bubble caus-ing transition from laminar to turbulent flow and affecting theboundary layer downstream. When separated, a laminar flowcan quickly transition to turbulent and reattach (Ref. 19). Inall cases, bluff body separation is observed as the flow leavesthe airfoil around the blunt nose, the separated region beinglarger for the laminar flow simulation.
Figure 18 shows the surface pressure for the experiments and
Fig. 16: Pressure drag contributions for the NACA 63-128with 10◦ reflex camber at α = 184◦ in the experiment (top)compared with laminar CFD (middle) and turbulent CFD(bottom) simulations
CFD simulations at α =190◦ . As with the α = 184◦ case, thepressure reaches Cp = 1 on the upper surface near the trailing-edge for both the baseline and reflex cambered cases. Forthe baseline airfoil there is a significant suction region on thelower surface, beginning at the trailing-edge. As with the α =184◦ case, the rise in pressure is roughly coincident with thereattachment point seen in the flow visuilizations. The lam-inar simulation predicts similar magnitudes of suction as theexperiment, around Cp = -1.3, while the turbulent simulationslightly under-predicts the suction. The pressure for the DESsimulation is very close to the turbulent simulation.
Overall, the experiment shows greater suction over most of thelower surface than either simulation for the baseline airfoil.The experiment shows the pressure recovering to Cp = -.33at the nose of the airfoil. As with the 184◦ case, the laminarsimulation shows less pressure recovery than the experiment(Cp = -.42 at the nose), leading to slightly higher drag whilethe turbulent simulation shows greater recovery (Cp = -.09),leading to lower drag.
The surface pressure for the reflex cambered airfoil at α =190◦ shown in Figure 18 shows a very close correlation forthe pressure on the upper surface between the experiment and
10
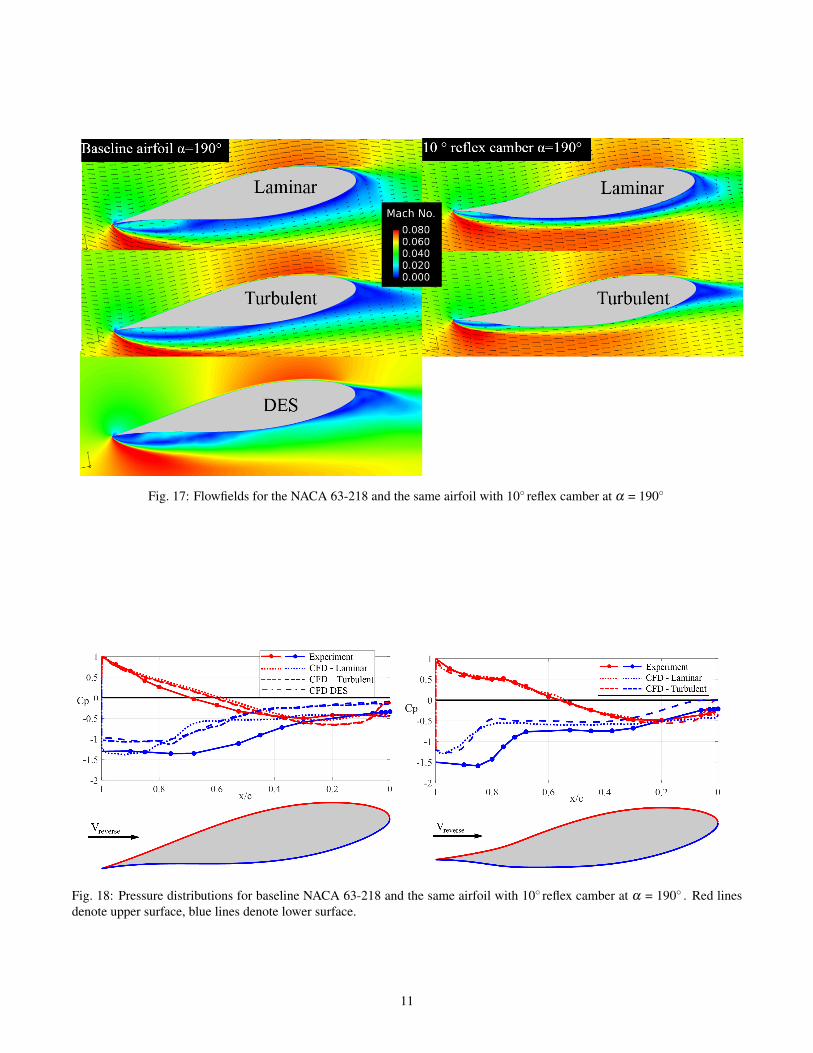
Fig. 17: Flowfields for the NACA 63-218 and the same airfoil with 10◦ reflex camber at α = 190◦
Fig. 18: Pressure distributions for baseline NACA 63-218 and the same airfoil with 10◦ reflex camber at α = 190◦ . Red linesdenote upper surface, blue lines denote lower surface.
11
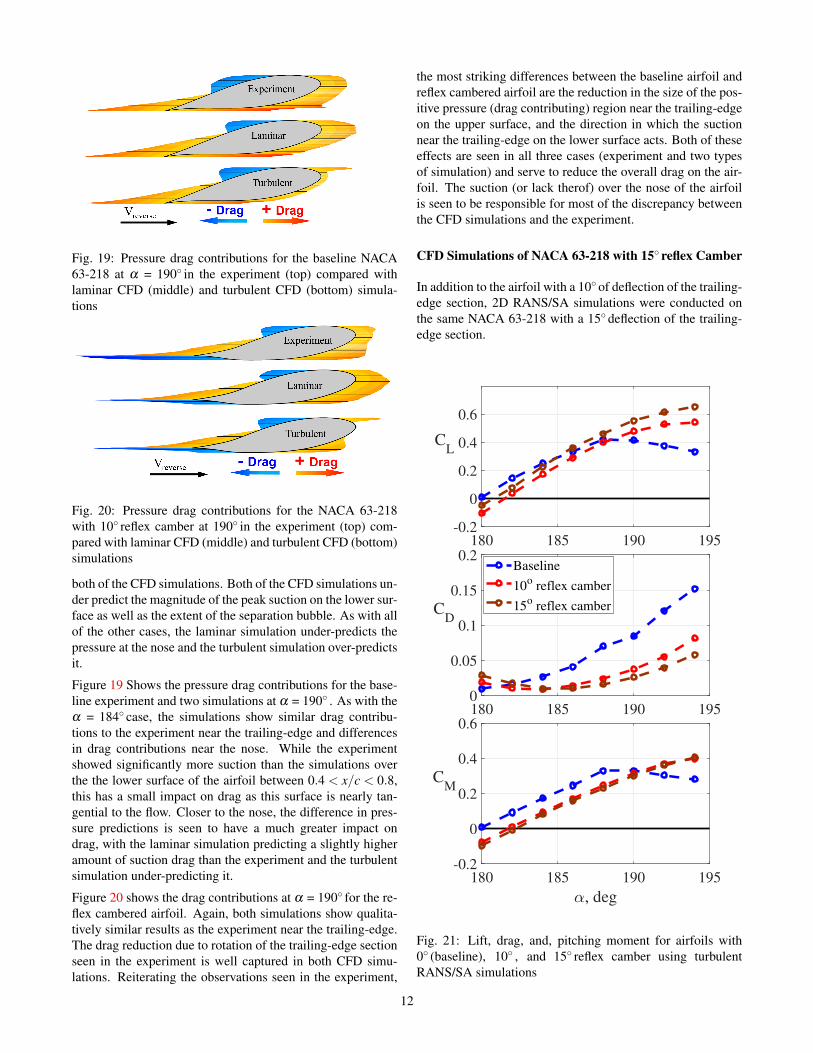
Fig. 19: Pressure drag contributions for the baseline NACA63-218 at α = 190◦ in the experiment (top) compared withlaminar CFD (middle) and turbulent CFD (bottom) simula-tions
Fig. 20: Pressure drag contributions for the NACA 63-218with 10◦ reflex camber at 190◦ in the experiment (top) com-pared with laminar CFD (middle) and turbulent CFD (bottom)simulations
both of the CFD simulations. Both of the CFD simulations un-der predict the magnitude of the peak suction on the lower sur-face as well as the extent of the separation bubble. As with allof the other cases, the laminar simulation under-predicts thepressure at the nose and the turbulent simulation over-predictsit.
Figure 19 Shows the pressure drag contributions for the base-line experiment and two simulations at α = 190◦ . As with theα = 184◦ case, the simulations show similar drag contribu-tions to the experiment near the trailing-edge and differencesin drag contributions near the nose. While the experimentshowed significantly more suction than the simulations overthe the lower surface of the airfoil between 0.4 < x/c < 0.8,this has a small impact on drag as this surface is nearly tan-gential to the flow. Closer to the nose, the difference in pres-sure predictions is seen to have a much greater impact ondrag, with the laminar simulation predicting a slightly higheramount of suction drag than the experiment and the turbulentsimulation under-predicting it.
Figure 20 shows the drag contributions at α = 190◦ for the re-flex cambered airfoil. Again, both simulations show qualita-tively similar results as the experiment near the trailing-edge.The drag reduction due to rotation of the trailing-edge sectionseen in the experiment is well captured in both CFD simu-lations. Reiterating the observations seen in the experiment,
the most striking differences between the baseline airfoil andreflex cambered airfoil are the reduction in the size of the pos-itive pressure (drag contributing) region near the trailing-edgeon the upper surface, and the direction in which the suctionnear the trailing-edge on the lower surface acts. Both of theseeffects are seen in all three cases (experiment and two typesof simulation) and serve to reduce the overall drag on the air-foil. The suction (or lack therof) over the nose of the airfoilis seen to be responsible for most of the discrepancy betweenthe CFD simulations and the experiment.
CFD Simulations of NACA 63-218 with 15◦ reflex Camber
In addition to the airfoil with a 10◦ of deflection of the trailing-edge section, 2D RANS/SA simulations were conducted onthe same NACA 63-218 with a 15◦ deflection of the trailing-edge section.
180 185 190 195-0.2
0
0.2
0.4
0.6
CL
180 185 190 1950
0.05
0.1
0.15
0.2
CD
Baseline
10o reflex camber
15o reflex camber
180 185 190 195
, deg
-0.2
0
0.2
0.4
0.6
CM
Fig. 21: Lift, drag, and, pitching moment for airfoils with0◦ (baseline), 10◦ , and 15◦ reflex camber using turbulentRANS/SA simulations
12
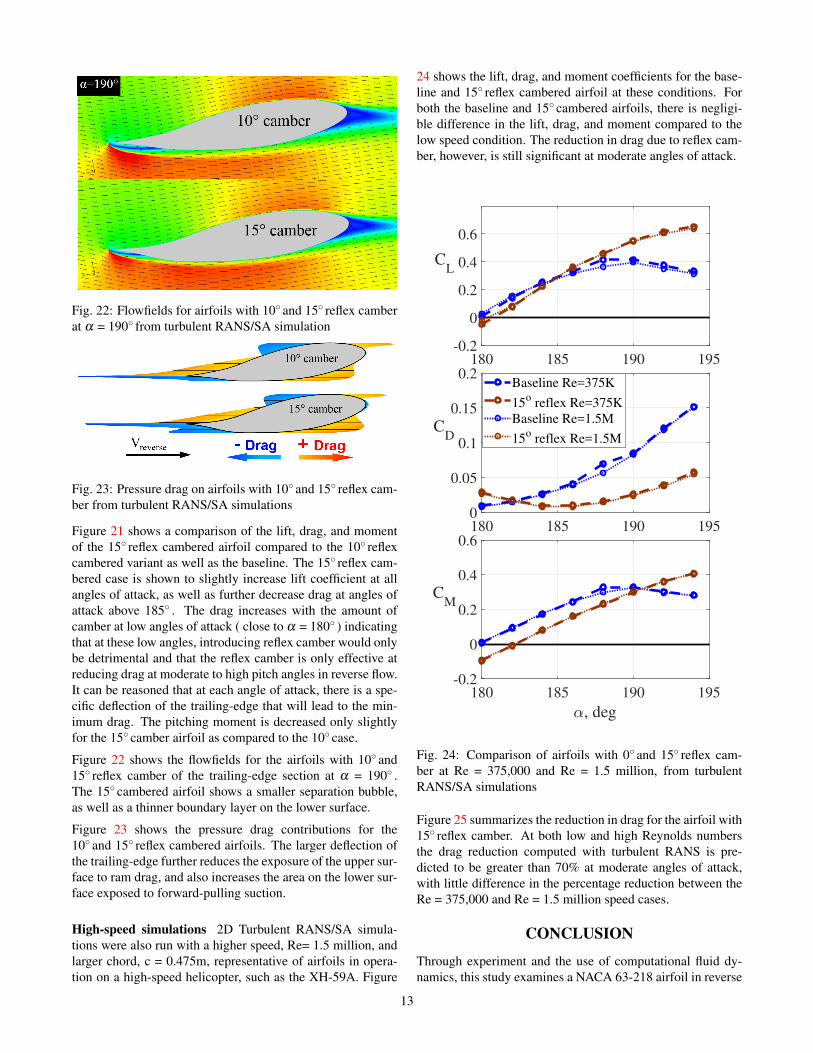
Fig. 22: Flowfields for airfoils with 10◦ and 15◦ reflex camberat α = 190◦ from turbulent RANS/SA simulation
Fig. 23: Pressure drag on airfoils with 10◦ and 15◦ reflex cam-ber from turbulent RANS/SA simulations
Figure 21 shows a comparison of the lift, drag, and momentof the 15◦ reflex cambered airfoil compared to the 10◦ reflexcambered variant as well as the baseline. The 15◦ reflex cam-bered case is shown to slightly increase lift coefficient at allangles of attack, as well as further decrease drag at angles ofattack above 185◦ . The drag increases with the amount ofcamber at low angles of attack ( close to α = 180◦ ) indicatingthat at these low angles, introducing reflex camber would onlybe detrimental and that the reflex camber is only effective atreducing drag at moderate to high pitch angles in reverse flow.It can be reasoned that at each angle of attack, there is a spe-cific deflection of the trailing-edge that will lead to the min-imum drag. The pitching moment is decreased only slightlyfor the 15◦ camber airfoil as compared to the 10◦ case.
Figure 22 shows the flowfields for the airfoils with 10◦ and15◦ reflex camber of the trailing-edge section at α = 190◦ .The 15◦ cambered airfoil shows a smaller separation bubble,as well as a thinner boundary layer on the lower surface.
Figure 23 shows the pressure drag contributions for the10◦ and 15◦ reflex cambered airfoils. The larger deflection ofthe trailing-edge further reduces the exposure of the upper sur-face to ram drag, and also increases the area on the lower sur-face exposed to forward-pulling suction.
High-speed simulations 2D Turbulent RANS/SA simula-tions were also run with a higher speed, Re= 1.5 million, andlarger chord, c = 0.475m, representative of airfoils in opera-tion on a high-speed helicopter, such as the XH-59A. Figure
24 shows the lift, drag, and moment coefficients for the base-line and 15◦ reflex cambered airfoil at these conditions. Forboth the baseline and 15◦ cambered airfoils, there is negligi-ble difference in the lift, drag, and moment compared to thelow speed condition. The reduction in drag due to reflex cam-ber, however, is still significant at moderate angles of attack.
180 185 190 195-0.2
0
0.2
0.4
0.6
CL
180 185 190 1950
0.05
0.1
0.15
0.2
CD
Baseline Re=375K
15o reflex Re=375K
Baseline Re=1.5M
15o reflex Re=1.5M
180 185 190 195
, deg
-0.2
0
0.2
0.4
0.6
CM
Fig. 24: Comparison of airfoils with 0◦ and 15◦ reflex cam-ber at Re = 375,000 and Re = 1.5 million, from turbulentRANS/SA simulations
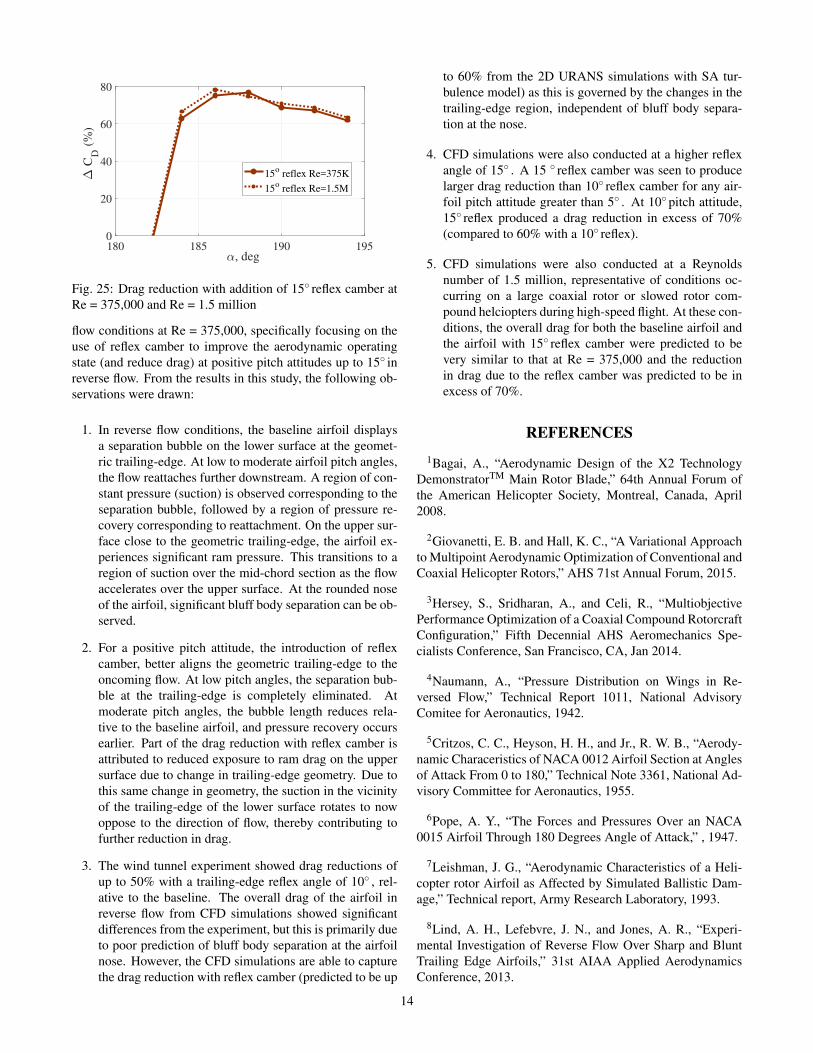
Figure 25 summarizes the reduction in drag for the airfoil with15◦ reflex camber. At both low and high Reynolds numbersthe drag reduction computed with turbulent RANS is pre-dicted to be greater than 70% at moderate angles of attack,with little difference in the percentage reduction between theRe = 375,000 and Re = 1.5 million speed cases.
CONCLUSION
Through experiment and the use of computational fluid dy-namics, this study examines a NACA 63-218 airfoil in reverse
13
180 185 190 195, deg
0
20
40
60
80 C
D (
%)
15o reflex Re=375K
15o reflex Re=1.5M
Fig. 25: Drag reduction with addition of 15◦ reflex camber atRe = 375,000 and Re = 1.5 million
flow conditions at Re = 375,000, specifically focusing on theuse of reflex camber to improve the aerodynamic operatingstate (and reduce drag) at positive pitch attitudes up to 15◦ inreverse flow. From the results in this study, the following ob-servations were drawn:
1. In reverse flow conditions, the baseline airfoil displaysa separation bubble on the lower surface at the geomet-ric trailing-edge. At low to moderate airfoil pitch angles,the flow reattaches further downstream. A region of con-stant pressure (suction) is observed corresponding to theseparation bubble, followed by a region of pressure re-covery corresponding to reattachment. On the upper sur-face close to the geometric trailing-edge, the airfoil ex-periences significant ram pressure. This transitions to aregion of suction over the mid-chord section as the flowaccelerates over the upper surface. At the rounded noseof the airfoil, significant bluff body separation can be ob-served.
2. For a positive pitch attitude, the introduction of reflexcamber, better aligns the geometric trailing-edge to theoncoming flow. At low pitch angles, the separation bub-ble at the trailing-edge is completely eliminated. Atmoderate pitch angles, the bubble length reduces rela-tive to the baseline airfoil, and pressure recovery occursearlier. Part of the drag reduction with reflex camber isattributed to reduced exposure to ram drag on the uppersurface due to change in trailing-edge geometry. Due tothis same change in geometry, the suction in the vicinityof the trailing-edge of the lower surface rotates to nowoppose to the direction of flow, thereby contributing tofurther reduction in drag.
3. The wind tunnel experiment showed drag reductions ofup to 50% with a trailing-edge reflex angle of 10◦ , rel-ative to the baseline. The overall drag of the airfoil inreverse flow from CFD simulations showed significantdifferences from the experiment, but this is primarily dueto poor prediction of bluff body separation at the airfoilnose. However, the CFD simulations are able to capturethe drag reduction with reflex camber (predicted to be up
to 60% from the 2D URANS simulations with SA tur-bulence model) as this is governed by the changes in thetrailing-edge region, independent of bluff body separa-tion at the nose.
4. CFD simulations were also conducted at a higher reflexangle of 15◦ . A 15 ◦ reflex camber was seen to producelarger drag reduction than 10◦ reflex camber for any air-foil pitch attitude greater than 5◦ . At 10◦ pitch attitude,15◦ reflex produced a drag reduction in excess of 70%(compared to 60% with a 10◦ reflex).
5. CFD simulations were also conducted at a Reynoldsnumber of 1.5 million, representative of conditions oc-curring on a large coaxial rotor or slowed rotor com-pound helciopters during high-speed flight. At these con-ditions, the overall drag for both the baseline airfoil andthe airfoil with 15◦ reflex camber were predicted to bevery similar to that at Re = 375,000 and the reductionin drag due to the reflex camber was predicted to be inexcess of 70%.
REFERENCES1Bagai, A., “Aerodynamic Design of the X2 Technology
DemonstratorTM Main Rotor Blade,” 64th Annual Forum ofthe American Helicopter Society, Montreal, Canada, April2008.
2Giovanetti, E. B. and Hall, K. C., “A Variational Approachto Multipoint Aerodynamic Optimization of Conventional andCoaxial Helicopter Rotors,” AHS 71st Annual Forum, 2015.
3Hersey, S., Sridharan, A., and Celi, R., “MultiobjectivePerformance Optimization of a Coaxial Compound RotorcraftConfiguration,” Fifth Decennial AHS Aeromechanics Spe-cialists Conference, San Francisco, CA, Jan 2014.
4Naumann, A., “Pressure Distribution on Wings in Re-versed Flow,” Technical Report 1011, National AdvisoryComitee for Aeronautics, 1942.
5Critzos, C. C., Heyson, H. H., and Jr., R. W. B., “Aerody-namic Characeristics of NACA 0012 Airfoil Section at Anglesof Attack From 0 to 180,” Technical Note 3361, National Ad-visory Committee for Aeronautics, 1955.
6Pope, A. Y., “The Forces and Pressures Over an NACA0015 Airfoil Through 180 Degrees Angle of Attack,” , 1947.
7Leishman, J. G., “Aerodynamic Characteristics of a Heli-copter rotor Airfoil as Affected by Simulated Ballistic Dam-age,” Technical report, Army Research Laboratory, 1993.
8Lind, A. H., Lefebvre, J. N., and Jones, A. R., “Experi-mental Investigation of Reverse Flow Over Sharp and BluntTrailing Edge Airfoils,” 31st AIAA Applied AerodynamicsConference, 2013.
14
9Lind, A. H., Lefebvre, J. N., and Jones, A. R., “Time-Averaged Aerodynamics of Sharp and Blunt Trailing-EdgeStatic Airfoils in Reverse Flow,” AIAA Journal, Vol. 52, (12),December 2014, pp. 2751–2764.doi: DOI: 10.2514/1.J052967
10Lind, A. H. and Jones, A. R., “Vortex Shedding from Air-foils in Reverse Flow,” AIAA Journal, Vol. 53, (9), 2015,pp. 2621–2633.doi: DOI: 10.2514/1.J053764
11Lind, A. H., Smith, L. R., Milluzzo, J. I., and Jones, A. R.,“Reynolds Number Effects on Rotor Blade Sections in Re-verse Flow,” Journal of Aircraft, Vol. 53, (5), 2016.
12Lind, A. H. and Jones, A. R., “Unsteady Airloads onStatic Airfoils Through High Angles of Attack and in Re-verse Flow,” Journal of Fluids and Structures, Vol. 63, 2016,pp. 259–279.
13Smith, L. R., Lind, A. H., Jacobson, K. E., Smith, M. J.,and Jones, A. R., “Experimental and Computational Investi-gation of a Linearly Pitching NACA 0012 in Reverse Flow,”AHS 72nd Annual Forum, West Palm Beach, 2016.
14Smith, M. J., Ligget, N. D., and Koukol, B. C., “Aerody-namics of Airfoils at High and Reverse Angles of Attack,”Journal of Aircraft, Vol. 48, (6), 2011, pp. 2012–2023.doi: DOI: 10.2514/1.C031428
15Hodara, J. and Smith, M. J., “Improvement of CrossflowAerodynamic Predictions for forward Flight at All AdvanceRatios,” 40th European Rotorcraft Forum, 2014.
16Hodara, J., Lind, A. H., Jones, A. R., and Smith, M. J.,“Collaborative Investigation of the Aerodynamic Behavior ofAirfoils in Reverse Flow,” AHS 71st Annual Forum, May2015.
17Andrew M. Wissink, a. B. J. and Sitaraman, J., “An Assess-ment of the Dual Mesh Paradigm Using Different Near-BodySolvers in Helios,” 55th AIAA Aerospace Sciences Meeting,2017.doi: 10.2514/6.2017-0287
18Panton, R. L., Incompressible Flow, John Wiley & Sons,Inc., third edition, 2005, Chapter 14, pp. 326–330.
19Bertin, J. J. and Cummings, R. M., Aerodynamics for En-gineers, Pearson, fifth edition, 2009, Chapter 6, p. 298.
15