Embed Size (px)
Citation preview

Yi-ion fic\cdrc.h Vul. 20. pp. 6.85 I0 669 Psrg~tnon Prcsh LtJ 1980. Pr~nrcd i n Grcdt H r ~ i ~ t n
COMPUTATIONAL ANATOMY AND FUNCTIONAL ARCHITECTURE OF STRIATE CORTEX: A SPATIAL MAPPING APPROACH TO PERCEPTUAL CODING
ERIC L. SCHWARTZ Brain Research Laboratories. Dept. of Psychiatry, New York University Medical Center, 550 First Avenue,
New York. NY 10016, U.S.A.
(Received 32 February 1980)
Abstract-The spatial inhomogeneity of the retino-striate syslem is summarized by the vector cortical magnification factor. The logarithm of retinal eccentricity provides a good fit to the integrated cortical magnification factor. Under the assumption that the cortical map is analytic (conformal), this implies that a complex logarithmic function of retinal coordinates describes the two-dimensional structure of the cortical representation of a visual stimulus. This hypothesis is in good agreement with the measured global structure of rhesus, squirrel, and owl monkey retino-striate mappings, as well as that of the upper visual field of the cat.
The geometric structure of the local hypercolumnar unit of striate cortex may also be characterized in terms of the complex Logarithmic mapping: thus. the retino-cortical system may be thought of as a concatenated cornplex logarithmic mapping. A simple developmental mechanism is capable of construct- ing a map of this form, and the general mathematical properties of conformal mappings allow some Insight into the nature of the minimal coding requirements which must be specified to encode a neural map.
Complex logarithmic mapping yields a cortical "Gestalt" which is pseudo-invariant to size, rotation. and projection scaling: these symmetries. for a given fixation point. result in a linear shift of an invariant cortical pattern. The term computational anatomy refers to the possibility that the anatomical structure of the retinotopic mapping may simplify certain aspects of perceptual coding. Similar uses of the complex logarithmic mapping, in computer pattern recognition, are cited in support of this concept. Furthermore, it is shown that columnar structure, together with topographic mapping, may also provide a direct computational function. If two topographic mappings are appropriately interlaced. by columns, then the difirence mapping of the two independent inputs is encoded within a spatial frequency channel determined by the period of the columns.
A quantitative model of the human visual cortex is developed and used to portray the detailed structure of certain visual stimuli. as they would appear at the level of the striate cortex. The local and global geometric structure of the striate map suggests a simple explanation for several visual illusions. Thus. it is demonstrated that the geometric structure of visual stimuli. at the level of striate cortex. may be of significance to perception.
Finally, the concept of computational anatomy is discussed in relation to other contemporary notions of perceptual coding. [t is argued that both single cell feature extraction models and Fourier analysis models of visual coding are inconsistent with the known properties of the visual system, and moreover, have never been adequately formulated in computational terms. The approach of the present paper is to suggest that the basic data structure of perceptual coding consists of two-dimensional laminar mapping. and that successive stages of remapping, along with columnar architecture, may provide important computational functions.
INTRODUCTION
A universal feature of the anatomical organization of the vertebrate sensory system is that the v~sual (Tal- bot and Marshall, 1941; Allman and Kaas. 1971) auditory (Lorente de No, 1936; Merzenich et ul., 19751, somatosensory (Woolsey er al., 1942; Werner, 1970) and olfactory (Moulton, 1976) systems are orga- nized in terms of orderly spatial projections of a peri- pheral receptor mosaic to more central processing sites. Embedded within this "receptotopic structure" is the detailed, local neurophysioIogical processing
that results in the existence of well-defined neuronul "trigger features". Thus, at the level of the striate cor- tex (in cat and primate), cells respond optimally to oriented, elongated stimuli with well-defined velocity, direction of movement, b~nocular disparity, ocular dominance, and color. Cortical cells which are sensi- tive to the orientation of a stimulus are grouped Into
columns. o r slabs. of common orientation iHubel and Wiesel, 1962. 1974). These slabs themselves are arranged in a highly structured geometric pattern, termed "requencr regularity" by Hubel and Wiesel (1974) u h c ~ introduced the term "functional architec- ture" to describe this anatomical arrangement of physiolo~~cally significant cortical structure.
In the present paper, the term "functional architec- ture" will be generalized to include the global. retlno- topic organization of the cortical spatial map. as well as the local columnar structure described by Hubel and Wiesel. It will be shown, following a recently published series of papers. that both the local colum- nar structure and the global retinotopic structure of the cortex may be chi~racterized in terms of the geo- metric properties of the complex !ogarithrnic m a p ping. Furthermore. the complex logarithmic re-' mapping of visual pattern, at the level of the striate

cortex. provides a possible mechanism for size and rotation invariance in vision. This property is particu- larly important because a number of "explanations" of size and rotation invariance in vision, which are based on the presumed properties of spatial frequency channels (Blakemore and Campbell, 1969; Cavanagh, 1978) have confused the geometric aspects of these
. symmetry operations with the controversial question of the nature of spatial frequency processing in the visual system. A precise definition of both size and rotation symmetry will be presented, and it will be shown that the anatomical structure of the cortical map, both on the local. and on the global level, may provide a "pre-processing" of visual input which is pseudo-invariant to size and rotation change.
The local geometric structure of the striate cortex, represented by Hubel and Wiesel's hypercolumn model. is remarkably similar to that of the global geometric structure of the retinotopic mapping: both mappings may be concisely summarized in terms of the geometry of the complex logarithmic mapping (Schwartz, 1976a, b, 1977a, b, c). The cortical trigger features of orientation tuning, sequence regularity, ocular dominance and binocular disparity tuning may be derived from a simple model of cortical summation of a specific afferent geometry, and a uni-directional intra-cortical inhibitory operator. This approach has provided quantitative estimates of the above men- tioned cortical trigger features, as well as predictions for the magnitude of rhesus monkey binocular dispar- ity tuning and hypercolumn scale which have been subsequently verified (Schwartt 1977~). In addition, it will be demonstrated that several visual illusions may be better understood from a consideration of the spa- tial structure assumed by stimuli at the level of the striate cortex. rather than at the level of the retina (or visual field). In order to make this discussion of visual illusions concrete, a quantitative model of the local (columnar) and global (retinotopic) spatial structure of human striate cortex is constructed. Following these demonstrations, i t will be suggested that the term "functional architecture" may be taken in a very literal sense: the spatial structure of neural activity in the primary sensory system may itself be of direct significance to visual perception. This hypothesis will be illustrated by the demonstration that appropriate columnar interlacing of two slightly different top* graphic mappings results in the spatial difference of the two maps being encoded as a high spatial- frequency component of the resultant map (Schwartc 1979a. d). This allows the coding of more than two dimensions in a single topographic mapping. since a third dimension (e.g. depth) is represented by the dif- ference map of left and right eye input to the cortex. In fact, more than one extra dimension may be "mul- tiplexed" by this method, using one "spatial-frequency channel" for each extra-spatial dimension. This analy- sis provides an additional example of the term "com- putational anatomy", which will then be briefly dis- cussed in the context of contemporary notions of sen-
sory coding. information processing. and single cell feature extraction. It will be suggested that the b,~sic informational structure of early visual processing may be cc~nceptualized in terms of anatomical mapping and columnar architecture, rather than single cells "labeled" by univariate trigger features.
The local and global architecture of the striate cortex
The terms "local" and "klobal" will be used in this paper to .refer to the spatial structure of cortical "hypercolumns" (Hubel and Wiesel. 1974) and the cortical retinotopic mapping. respectively. A cortical hypercolumn has been defined by Hubel and Wiesel (1974) to be the basic functional unit of cortical archi- tecture. which spans a full sequence of orientation- tuned cortical columns, as well as a pair of left- and right-eye ocular dominance columns. In rhesus mon- key, the dimensions of a hypercolumn are 770 pm (spanning two ocular dominance columns) and 5 5 0 p (Hubel et al., 1977) (spanning 180' of orienta- tion columns). This small functional unit is repeated across the surface of the striate cortex in a swirling pattern that is regular on the scale of perhaps 3-6 successive periods. The surface area of a single func- tional unit is roughly 0.4mm2 (based on 180" of orientation columns and a left- and right-eye pair of ocular dominance columns). In rhesus monkey, the surface area of striate cortex (one hemisphere) has been estimated at 1380 mrn2 (Rolls and Cowey, 1970). Thus, there are approximately 3000 individual colum- nar units across the surface of the striate cortex in each cortical hemisphere. This great disparity in scale justifies the separate consideration of "local" and "global" spatial structure. From the point of view of the entire cortical map. each hypercolumnar unit may be safely considered to be a "point". The distribution of these "points" defines the global map. This view is in close accordance with the experimental methods which are typically used to cqnstruct experimental mappings, in which multi-unit data is used to obtain an estimate of retinotopic structure. These methods are too coarse to observe the local hypercolumnar structure, which is significant at . a level which is smaller by several orders of magnitude. The similarity between the spatial structure of the cortical map as a whole and the local hypercolumn structure (which is concatenated within this global cortical map on a scale that is roughly 1000 times smaller) lies in their close resemblance in, geometrical form (Schwartz, 1976a. b; 1977a, b), which will now be demonstrated.
GLOBAL WETISOTOPIC MAP
The principal quantitative measure of the structure of the cortical map is the "magnification factor", introduced by Daniel and Whitteridge (1961). The magnification factor is the ratio of the distance moved across the surface of the cortex to the corresponding distance moved by a spot in the visual field (equiva- lently, across the surface of the retina). For the central
Computational anatomy of striate cortex 647
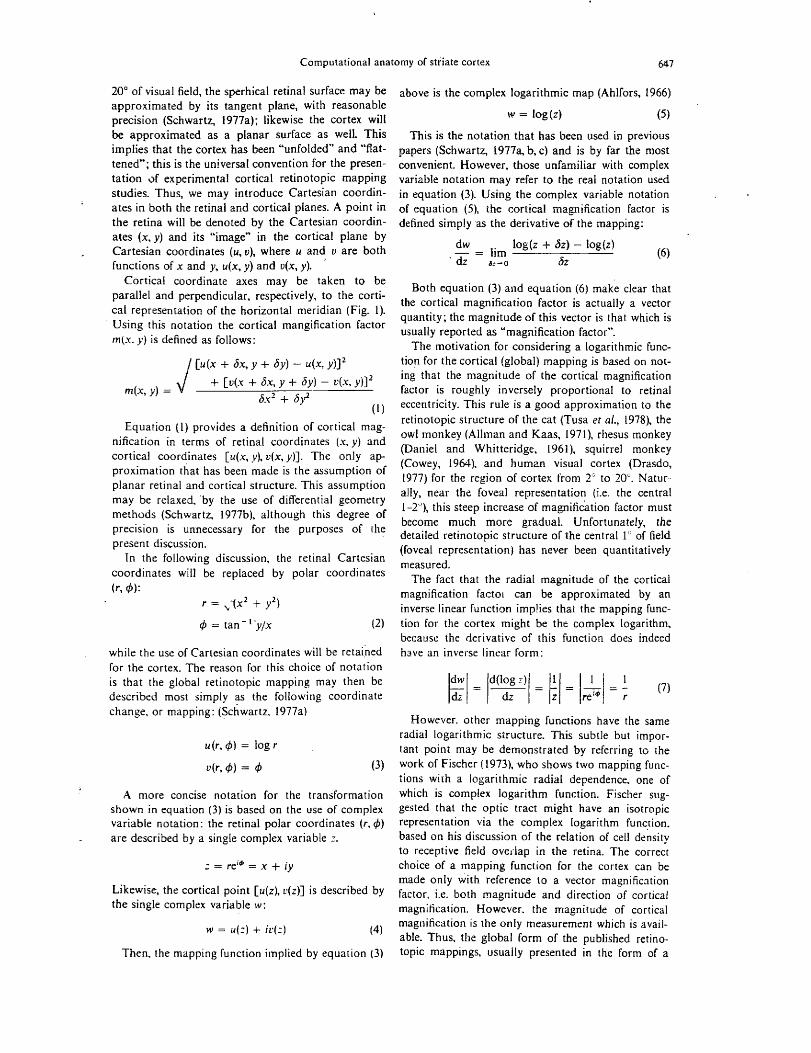
20" of visual field, the spcrhical retinai surface may be approximated by its tangent plane, with reasonable precision (Schwart; 1977a); likewise the cortex will be approximated as a planar surface as well. This implies that the cortex has been "unfolded" and "flat- tened"; this is the universal convention for the presen- tation of experimental cortical retinotopic mapping studies. Thus, we may introduce Cartesian coordin- ates in both the retinai and cortical planes. A point in the retina will be denoted by the Cartesian coordin- ates (x.y) and its "image" in the cortical plane by Cartesian coordinates (u, v), where u and o are both functions of x and y, u(x, y) and v(x, y).
'
Cortical coordinate axes may be taken to be parallel and perpendicular, respectively, to the corti- cal representation of the horizontal meridian (Fig. 1). Using this notation the cortical mangification factor tn(x. y ) is defined as follows:
above is the complex logaritl~mic map (Ahlfors, 1966)
This is the notation that has been used in previous papers (Schwartz, 1977% b, c) and is by far the most convenient. However, those unfamiliar with complex variable notation may refer to the real notation used in equation (3). Using the complex variabie notation of equation (3, the cortical magnification factor is defined simply as the derivative of the mapping:
dw - = Iim
lo& + 62) - logfz) dz 8r-0 62 (6)
Both equation (3) and equation (6 ) make clear that the cortical magnification factor is actually a vector quantity; the magnitude of this vector is that which is usually reported as "magnification factor".
The motivation for considering a logarithmic func-
J [u(x + Sx, y + 6y) - u(x, y)I2 tion for the cortical (global) mapping is based on not- ing that the magnitude of the cortical magnification + [v(.u + 6.u, y + 6y) - c(x, Y)]'
m(xl Y) = factor is roughly inversely proportional to retinal 6x2 + ~ 3 ~ 4 eccentricity. This rule is a good approximation to the . #
Equation (1) provides a definition of cortical mag- nification in terms of retinal coordinates (x. y) and cortical coordinates [u(x, y), ~ ( x , y)]. The only ap- proximation that has been made is the assumption of planar retinal and cortical structure. This assumption may be relaxed, 'by the use of differential geometry met hods (Schwar tz 1977b3, although this degree of precision is unnecessary for the purposes of rhe present discussion.
In the following discussion, the retinal Cartesian coordinates will be replaced by polar coordinates 0.3 $1:
r = ..(x2 + yZ)
$ = tan-"y/x (2)
while the use of Cartesian coordinates will be retained for the cortex. The reason for this choice of notation is that the global retinotopic mapping may then be described most simply as the following coordinate change. or mapping: (~chwartz. 1977al
u (r, 4) = log r
u(r, 9) = 4
A more concise notation for the transformation shown in equation ( 3 ) is based on the use of complex variable notation: the retinal polar coordinates (r. 4)
- are described by a single complex variable z.
Likewise, the cortical point [u(z) , o(z)] is described by the single complex variable w :
Then. the mapping function i~nplied by equation (3)
retinotopic structure of the cat (Tusa et al., 1978), the ow l monkey (Allman and Kaas, 197I), rhesus monkey (Daniel and Whitteridge, 1961 ), squirrel monkey (Cowey, 1964). and human visual cortex (Drasdo, 1977) for the region of cortex from 2'' to 20". Natur- alIy, near the foveal representation (i-e. the central 1-2"), this steep increase of magnifi&tion factor must become much more gradual. Unfortunately, the detailed retinotopic structure of the central 1" of field (foveal representation) has never been quantitatively measured.
The fact that the radial magnitude of the cortical magnification fact01 can be approximated by an inverse linear function imp!ies that the mapping func- tion for the cortex might be the complex logarithm, because the derivative of this f~~nction does indeed have an inverse linear form:
However. other mapping functions have the same radial logarithmic structure. This subtle but impor- tant point may be demonstrated by referring to the work of Fischer (1973). who shows two mapping func- tions wirh a logarithmic radial dependence. one of which is complex logarithm function. Fischer sug- gested that the optic tract might have an isotropic representation via the complex logarithm function. based on his discussion of the relation of cell density to receptive field ovedap in the retina. The correct choice of a mapping function for the cortex can be made only with reference ro a vector masnification factor, i.e. both magnitude and direction of cortical magnification. However. the magnitude of cortical magnification is the only measurement which is avail- able. Thus, the global form of the published retino- topic mappings, usually presented in the form of a

SQUIRREL MONKEY
OWL MONKEY
E. L. SCHU'ARTZ
EXPERIMENT THEORY
Fig. I. A series of computer generated complex logarithmic mappings which provide the best (visual) fit to published retinotopic (striate cortex) mappings in a number of primate species, as well as the cat. The experimental mappings are shown in the column labeled "experiment", and the complex logarithmic mappings in the column labeled "theory". Only the central 2040 ' are presented in the theoretical maps, and the corresponding areas of the experimental maps have been emphasized with the following graphic symbols: circles mark the projection of the vertical meridian, and squares mark the projection of the horizontal meridian. In the cat. i t appears thal the complex logarithmic approximation is quite good for the upper visual field, as shown, but fails to represent the lower visual field. For the "rhesus" monkey map (Daniel and U'hitteridge. 1961). the experi~ental map was drawn as an "orthogonal projection", rather than as a "flat map", which is the case for the other data. This accounts for the lack of curvature of the circles of constant eccentricity (compare with the owl monkey (Allman and Kaas, 1971) map, or the theoretical maps. Also. in this work, a mixture of different primate species, in addition, to rhesus monkeys, were used, although only one map was published; this fact is acknowledged by the use of the quotation marks (i.e. "rhesus"). In summary, this figure demonstrates that i t is possible lo provide a simple analytic approximation to the global retinotopic mappings of a number of different species, in terms of the general form of the complex logarithm of a linear function of visual field coordinates.
In the case of the squirrel monkey (Cowey. 1964) only the central 4" of cortical map have been published as a flat map; however. the magnification factor of squirrel monkey and rhesus monkey have
the same functional form.

Compurational anatomy of striate cortex 649
drawing, along with the magnitude of cortical magni- fication. must provide the estimate of the two- dimensional structure of the retinotopic mapping; these data are well fit by a function which is the complex logarithm of a linear function of eccentricity (Schwartz. 1977a 1978).
Thls discussion may be made precise by pointing out that the complex logarithm function is the only analytic function which maps an annulus (retina) to an (approximate) rectilinear strip. Analytic functions (or conformal mappings) are defined in a number of equivalent ways (Ahlfors, 1966). Two of these defini- tions are relevant to the current discussion. First, a mapping is analytic if its derivative (i.e. magnification factor) is independent of direction. This fact has been explicitly claimed for the cortical retitlotopic map by Daniel and Whitteridge (1961). who show that the value of the magnification factor is independent of the direction in which the spot of light in the retina is moved. In mure recent work. Levay rr al. (1975) have shown that a local measurement of magnification factor is actually anisotropic: i t is smaller in the dirzc- lion perpendicular to the ocular dominance column boundaries !han in the parallel direction. This result is consistent with Daniel and Whitteridge's (1961) more coarse measurement. since the dicrete interlad- ing of the left- and right-eye maps is expected to cause the eRect observed by Levay er al. (39753, and sup- ports the statzment that prior to ocular dominance column interlacing. i.e. pre-natally (Rakic. 1977). the magnification factor is approximately isotropic.
A second definition of analytic is based on the notion of a conformal map. Conformal maps are defined by the fact that they preserve the direction and magnitude of local angles (Ahlfors, 1966). This is equivalent to the previous definition. Thus, curves which intersect locally at right angles in the retina will intersect locally at right angles in the cortex. This feature of cortical maps is apparent in the previously cited maps of cat and primate striate cortex. The sig- nificance of this property for visual perception is that local angular relations are preserved by the retino- topic mapping despite the large global distortion caused by the logarithmic mapping function.
Following this long prelude, it is now possible to present mapping functions for the global retinotopic maps of a variety of species. The complex logarithmic mapFIng of equatlon (51 is not suitable as a mapping function. due to irs divergence at zero. However. the logarithm of a linear function of eccentricity is quite suitable (Schwartz 1977a. b; 1978):
The series expansion of this function in the vicinity of : = 0 (i.e. the fo\ea) is equal to:
Thus, for small ,- (i.e. ; < a), the map is essentially linear, and the magnification factor constant.
For larger T. (i.e. 2-3"). the mapping function of equation (8) is quite similar to the complex logarithm (log :). Thus the complex logarithm of a linear func- tion of eccentricity provides a smooth (analytic) map from a linear foveal representation to a complex logarithmic para- and peri-foveal surround. This is ilrustrated in Fig. 1. The choice of the linear constant in the equation has been ntade by generating a large number of mappings via computer graphics, of the form of equation (8). and then selecting, by visual inspection, the global mapping functions which pro- vide the best visual fit to the data of various species or primate, and of the cat. This heuristic method of map fitting is justified by the fact that the data is presented in a semi-quantitive manner (i-e. as a hand drawing).
The units to be used in the function log (z + a) are scaled as follows: the complex variable z = rei" rep- resents angular measure at the retina. Thus, r is measured in degrees of eccentricity and 4 is measured in degrees of azimuth (noting that these are really dimensionless angular measures). Scaling becomes im- portant at the cortex, where these retinal angular measures must be converted to Linear units (i-e. milli- meters). In Fig. I, the scale of azimuth and eccen- tricity were determined empirically from the pub- lished data of the species shown. In other words. the best visual fit of a mapping function of the form log ( z + a) was chosen, based on the published corti- cal mappings. Finally, i t should be pointed out that the cat mapping data of Tusa et al. (1978) used lati- tude and longitude measure. rather than eccentricity and azimuth, as other experimenters used. The theor- etical cat mapping is expressed therefore in the same units as the experimental cat mapping, i.e. in units of latitude and longitude. This involves a simple conver- sion from spherical polar coordinates (eccentricity and azimuth) to latitude and Longitude. but of course does not affect the visual comparison of the theoreti- cal with the experimental data.
Finally. it should be emphasized that the approxi- mation of equation (8) is intended to apply only to the central 20-30" of visual field. In the extreme per- iphery. the two branches of the representation of the vertical meridian begin to converge. The complex logarithmic approximation does not describe the extreme periphery of the visual field representation. This is not important lor the purposes of the present paper. which is oriented towards the question of form perception. and therefore is only concerned ~ i t h the foveal, para-foveal and peri-foveal field. However. .Daniel and W hitteridge ( 1 96 1) report that cortical n~agnification factor is the same magnitude when measured in two perpendicular orientations. from the foveal representation out to 45 in the peripheral vis- ual field. which constitutes over 90",, of the curricrll representation. Thus. cortical mri_rn~ficat~on factor is
isotrop~c over the entire mcasured extent of cor~ical representiltion. including the extreme periphery. X

map which has a magnification factor which is iso- tropic (i.e. which does not depend on the direction in which linear magnification is measured) is, by defini- tion, conformal (Ahlfors, 1966; Schwartz. 1977b). A conformal map is entirely determined by its boundary conditions (i.e. the "shape" of the cortical and retinal surfaces), and therefore a numerical approximation could be derived for the cortical map, as outlined in earlier work (Schwartq 1977b). This numerical a p proximation would be essentially identical in struc- ture to the complex logarithmic functions .shown in Fig. 1 and equation (8). but would have the disadvan- tage of having to be presented in tabular. rather than analytic form. The remainder of this paper is devoted to questions of form perception, invariance, visual illusions. and perceptual coding; for these discussions. the complex logarithmic fit to the central, para- peri- foveal visual field outlined in equation (8) is both con- venient and adequate.
Figure 1 indicates that the complex logarithm of a linear function of.eccentricity provides a good pheno- menological fit to the central-. para- and peri-foveal retinolopic structure of the rhesus, squirrel, and owl monkeys by means of a single analytic function; the upper visual field representation of the cat is also fit by a funclion of this form. Human data is not avail- able, but the form of the human magnification factor is the same as that of the primate (Drasdo. 1977: Rolls and Cowey, 1970). It will be assumed in the following discussion that the global human retino- topic mapping is of the same spatial form as that of the primate mappings shown in Fig. 1.
The mathematical details of this work. including the fact that the complex logarithm function is rnany- valued, and the generality of the linear function of retinal mordinates. are discussed in previous work (Schwartz 1977a).
Fig. 2. Graphic simulation of the geometrical properties of the complex logarithmic mapping. in terms of a series of deformations of an imaginary "plastic" material. On the top left, a logarithmic "radex" is drawn. In figures (bHe). this radex. which may be identified with the retina, or the visual field. is smoothly deformed so that its final state. (el, represents the complex logarithmic mapping of the radex.
'
The exponentially spaced concentric circles .of (2) have been mapped into parallel. equi-spaced vertical lines; the rays of (2) have been mapped into parallel. equi-spaced horizontal lines. The central black circle of (a) has been stretched into the black band of(e). This black circle represents the singularity of the logarithm function. I n the lower part of the figure, the singularity is removed by using as mapping function log ( I + :). This mapping is quite similar to the logarithm. except at 2 = 0. where it is finite. Also shown in the figure are the deformation of a large and small square. under this mapping. It can be seen that the change of shape induced by the mapping is exact11 such as to cause the final images t o be identical. in size and shape. A similar property holds for rotation. This is [he basis of the pseudo-
inbarisnce properties of the complex logarithmic mapping discussed in the text.

Computational anatomy of striate cortex 651
LOC.4L GEOMETRIC STRUCTURE OF
CORTICAL HYPERCOLUXIIVS
The previous analysis of the global architecture of the retino-striate mapping has indicated that the complex logarithm function provides Bn approximate summary of the phenomenology of the global cortical mappings of several species of primates, and the cat. The "distortion" of the retinotopic mapping due to the proportionally greater area devoted to the foveal and para-foveal visual field, is simply accounted for by the mapping of equations (3). ( 5 ) , and (6) . An attempt to provide a graphic suggestion of this map- ping is shown in Fig. 2, in order to provide an intui- tive summary of the mathematical analysis.
Figures 1 and 2 indicate that radial lines in the retina are mapped to parallel horizontal lines in the cortex. This is the characteristic signature of the complex logarithmic mapping (Schwartz, 1977a). However, this is also the characteristic feature of the sequence regularity property of the columnar organiz- ation of the cortex, as demonstrated by Hubel and Wiesel (1974) and Albus (1975).
Sequence regularity refers to the fact that simple cells in the cortex are grouped into orientation columns, which consist of cells that have the same angle of orientation tuning. Each "orientation column" therefore, represents an angle, or orientation in the visual field. Parallel slabs of cells, or columns, represent successive angles of orientation tuning. An entire range of 180" of orientation tuning occurs within a sequence of roughly 550pm in rhesus mon- key (Hubel et a!.. 1977). Thus, the geometric arrange- ment of orientation columns in striate cortex r e p resents the mapping of a polar coordinate pattern in
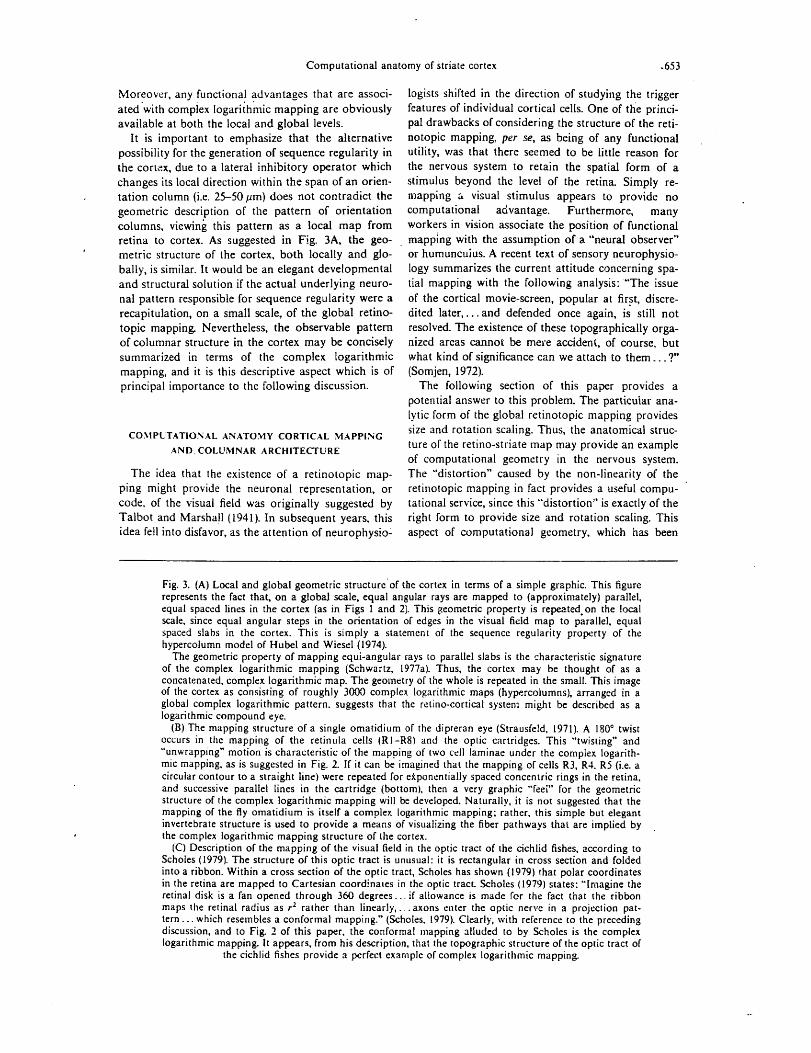
'the retina to a Cartesian, or rectilinear pattern in the cortex. This statement is illustrated in Fig. 3, which graphically emphasizes that the complex logarithmic mapping is characteristic of both the global and the local structure of the retino-cortical system.
The similarity of geometric structure between the global retinotopic mapping and the local hypercolum- nar pattern of Hubel and Wiesel (1974) has been ex- tensively investigated in previous work (Schwartz, 1977cl. [n this paper. a detailed model of spatial map- ping, on the level of a single hypercolumn. has been constructed. The point of this work was to construct an explicit model of the re-mapping of afferent input, arriving in layer IVc of the cortex, to the surrounding layers of simple cells in the cortex. Under the assump tion that the local structure of the cortical map is the same as that of the global structure. it is possible to provide a quantitative derivation of ocular domin- ance, sequence regularity and binocular disparity tun- ing. The quantitative nature of this derivation is based on the geometric summation of a complex logarith- mic atferent input, using the estimates of stellate and pyrgmidal tangential dendritic profiles of Colotlnier (1964). At the time that this paper was published, there was no evidence supporting the existence of
binocular disparity tuned neurons in rhesus monkey striate cortex (Hubel and Wiesel, 1970). However, the prediction that binocular disparity tuning should exist in rhesus striate cortex, and should be in the range of 0.05" (Schwartz, 1977~) was subsequently confirmed by Poggio and Fischer (1977). Thus, the simple assumption of dendritic summation of a specific affer- ent input seems to be supported.
A second prediction of this paper was that the ratio of the Length of a cortical hypercolumn to the width (ocular dominance column width) should be roughly 0.28. This was based on the nature of the stability of a row of logarithmic patterns. This prediction was also confirmed by Strykker rr al. (1977) and by Hubel et a/. (19771, who reported quantitative measurements of columnar structure in the cat and rhesus monkey equal to 0.29 and 0.34 respectively, as described in the paper cited above (Schwartq 1977~).
The detailed nature of the origin of cortical orienta- tion tuning and sequence regularity is at present un- known. Hubel and Wiesel (1962) proposed an early model which was based on the mapping of a row of geniculate afferents onto a single cortical cell. Later work by Cruetzfeldt et al. (1973) indicated that intra- cortical inhibition musr play a critical role in the gen- eration of orientation tuning in cortical cells. How- ever, if intra-cortical inhibition does in fact play this role, there are only two logicai possibilities for the geometrical arrangement of this . putative intra- cortical inhibitory operator which are consistent with the fact of sequence regularity. Either (a) the intra- cortical inhibitory operator "rotates" in direction every 25-50pm, providing both sequence regularity and orientation tuning, or (b) the intra-cortical inhibi- tory operator is uni-directional, on the scale of a hypercolumn (i.e. 500-1000 pm), but the underlying afferent input "rotates". An analytic mapping o f "rotating" segments of afferent input, to linear slabs of cortical cells, is represented by the geometric proper- ties of the complex logarithmic mapping. The second of these two models is capable of providing a qualitat- ive and quantitative derivation of a wide variety of cortical trigger features, and has in fact resulted in two quantitative predictions which have been subse- quently verified, as cited above (Schwartz, 1977~). The
'verification or rejection of this model depends on the detailed anatomical reconstruction of the afferent input to cortical simple cells, or else on a mezsure- ment of the direction of the intra-cortical inhibitory operator.
clearly, the model outlined above (Schwartz, 1977~) suggests a simple developmental mechanism. The developmental rules which are responsible for shaping the global structure of the cortex are aiso sufficient to specify the local structure of the cortical map (Schwartz. 1979b). A specific developmental model. based on a variational principle. is capable of specify- ing the detailed natbre of the local and the global structure of the primate cortex. and also describes the goldfish retino-tectal map as well (Schwartz, 1977b).

VISUAL FIELD CORTEX
Computational anatomy of striate cortex .653
Moreover, any functional advantazes that are associ- atedwith complex logariihkic mapping are obviously available at both the local and global levels.
It is important to emphasize that the alternative possibility for the generation of sequence regularity in the cortex. due to a lateral inhibitory operator which changes its local direction within the span of an orien-
, tation coiumn (i.e. 25-50 pm) does not contradict the geometric description of the pattern of orientation columns, viewing this pattern as a local map from retina to cortex. As suggested in Fig. 3A, the geo- . metric structure of the cortex, both locally and glo- bally, is similar. It would be an elegant developmental and structural solution if the actual underlying neuro- nal pattern responsible for sequence regularity were a recapitulation, on a small scale, of the global retino- topic mapping. Nevertheless, the observable pattern of columnar structure in the cortex may be concisely summarized in terms of the complex 1ogarithrni.c mapping, and it is this descriptive aspect which is of principal importance to the following discussion.
logists shifted in the direction of studying the trigger features of individual cortical cells. One of the princi- pal drawbacks of considering the structure of the reti- notopic mapping, per se, as being of any functional utility, was that there seemed to be little reason for the nervous system to retain the spatial form of a stimulus beyond the level of the retina. Simply re- mapping s visual stimulus appears to provide no computational advantage. Furthermore, many workers in vision associate the position of functional mapping with the assumption of a "neural observer" or humuncuius. A recent text of sensory neurophysio- logy summarizes the current attitude concerning spa- tial mapping with the following analysis: "The issue of the cortical movie-screen, popular at first, discre- dited later,. ..and defended once again, is still not resolved. The existence of these topographically orga- nized areas cannot be mere accident, of course, but what kind of significance can we attach to them.. . ?" (Somjen, 1972).
The following section of this paper provides a potential answer to this problem. The particuiar ana- lytic form of the global retinotopic mapping provides size and rotation scaling. Thus, the anatomical struc-
CO\IPUTATIO.K.AL ASATOIMY CORTICAL .MAPPING
AND COLUMNAR ARCHITECTURE ture of the retino-striate map may provide an example of computational geometry in the nervous system.
The idea that the existence of a retinotopic map- The "distortion" caused by the non-linearity of the ping might provide the neuronal representation, or retinotopic mapping in fact provides a useful compu- code. of the visual field was originally suggested by tational service, since this "distortion" is exactly of the Talbot and Marshall (1941). In subsequent years, this right form to provide size and rotation scaling. This idea fell into disfavor, as the attention of neurophysio- aspect of computational geometry. which has been
Fig. 3. (A) Local and global geometric structurc'of the cortex in terms of a simple graphic. This figure represents the fact that, on a global scale, equal angular rays are mapped to (approximately) parallel, equal spaced lines in the cortex (as in Figs 1 and 2). This ~eometric property is r e p t e d . o n the local scale, since equal angular steps in the orientation of edges in the visual fieid map to parallel. equal spaced slabs in the cortex. This is simply a statement of the sequence regularity property of the hypercolumn model of Hubel and Wiesel (1974).
The geometric property of mapping equi-angular rays to parallel slabs is the characteristic signature of the complex logarithmic mapping (Schwartz, 1977a). Thus, the cortex may be thought of as a concatenated, complex logarithmic map. The geometry of the whole is repeated in the small. This image of the cortex as consistin3 of roughly 3033 complex logarithmic maps (hypercolumns), arranged in a global complex logarithmic pattern. suggests that the retino-cortical systen; might be described as a logarithmic compound eye.
(B) The mapping structure of a single omatidium of the dipteran eye (Strausfeld. 1971). A 180" twist occurs in the mapping of the retinula cells (RI-'118) and the optic cartridges. This "twisting" and "unwrapping" motion is characteristic of the mapping of two cell laminae under the complex logarith- mic napping. as is suggested in Fig. 2. If it can be imagined that the mapping of cells R3, RJ. RS (i.e. a circular contour to a straight line) were repeated for ekponentially spaced concentric rings in the retina, and successive parallel lines in the cartridge (bottom). then a very graphic "feei" for the geometric structure of the complex logarithmic mapping will be developed. Naturally, it is not suggested that the mapping of the fly omatidium is itself a complex logarithmic mapping; rather. this simple but elegant invertebrate structure is used to provide a means of visualizing the fiber pathways that are implied by the complex logarithmic mapping structure of the cortex. (C) Description of the mapping of the visual field in the optic tract of the cichlid fishes. according to
Scholes (1979). The structure of this optic tract is unusual: i t is rectangular in cross section and folded into a ribbon. Within a cross section of the optic tract, Scholes has shown (1979) that polar coordinates in the retina are mapped to Cartesian coordinares in the optic tract. Scholes (1979) states: "Imagine the retinal disk is a fan opened through 360 degrees.. . if allowance is made for the fact that the ribbon maps the retinal radius as r2 rather than linearly,. . . axons enter the optic nerve in a projection pat- tern.. . which resembles a conformal mapping." (Scholes. 1979). Clearly, with relerence to the preceding discussion, and to Fig. 2 of this paper. the conformal 111apping alluded to by Scholes is the complex logarithmic mapping. It appears, from his description. that the topographic structure of the optic tract of
the cichlid fishes provide a perfect example of complex logarithmic mapping.

RETINA CORTEX
PROJECTION *
Fig. 4. Transformation properties of the complex logarithm function, under size, rotation, and trans- lation. On the top left are shown two stimuli: a large and small square. The fixation point is represented by a star. On the right is shown the mapping, under the function log ( z + 1 ) of these two stimuli. The squares are assumed to subtend 2" and 4" of visual field It is clear that the cortical images of these para-foveal stimuli. which differ in size by loo"/, are essentially similar in size and shape. (The left and right cortical images have been drawn together on the right.) A similar property is shown for rotation below. Size and rotation, in the complex logarithmic plane, are converted to shift, as described in the text. This property forms the basis for recent applications of complex logarithmic mapping in computer and optical pattern recognition. Also shown in the figure is the :'projectionw of a rectilinear grid, with the star representing fixation. The cortical mapping is suggested on the right. indicating that projection symmetry, which is in this case a special case of size symmetry, is also "normalized" by the complex logarithm. This suggests that the radial size variant flow of visual stimuli. during movement. may be converted to a rectilinear, size invariant flow at the cortex. for certain conditions of relative motion of the observer and the stimulus. Finally. at the bottom of the figure. translation is shown. Retinal images are distorted in both size and shape by the cortical map, although local angles are preserved, due to the
conformal property of the mapping (Ahlfors. 1966; Schwartz, 1977a).
recently exploited in several independent computer pat tern recognition applications, will now be demon- strated.
Size and rotation sprnmetry
The visual system is &mehow capable of process- ing a pattern of retinal information that is constantly changing due to eye movement, to physical motion of objects in the world, and t o relative motion of the obierver. Translation, rotation, and size invariance are basic geometric symmetries. It is therefore sugges- tive to note (Schwartz, 1976a, b; 1977a, b, c) that the anatomical form of the global cortical map provides size and rotation scaling of the retinal pattern. Specifi- cally. the cortical pattern of activity, corresponding to a large or to a small stimulus, for a given fixation point. is invariant up to a shift across the cortex. A
similar property holds for rotation. This is illustrated in Fig. 4.
This conversion of site and rotation symmetries to a shift, as shown in Fig. 4, and derived below. implies that the anatomical form of the cortical mapping may provide pseudo-invariance to these symmetry oper- ations. Any form of subsequent visual processing which provided shift invariance would then, com- bined with the complex logarithmic geometry of the cortex. provide invariance to the rotation and size symmetry operations. Examples of neural processing which could potentially provide this shift invariant property, and which have already been proposed in other contexts in vision, are spatial frequency analysis (Sekuler. 1974. Schwart r 1978) auto- correlation (Uttal. 1975) and receptive field shifting (Marg. 1973). This aspect of cortical anatomy will be discussed with

Computational anatomy of striate cortex &5
respect to several recent "explanations" of size and rotation scaling in vision, which have confounded the issue (Blakemore and Campbell, 1969; Cavanagh, 1978) of size and rotation symmetry with the contro- versial issue of spatial frequency analysis in the visual system.
The definition of size and rotation scaling fo l lo~~~s by considering an image to be a iocus of points in a plane Ixi,pi). Each point might be thought of as a. single grain of photographic emulsio~l making up the image. Increasing the size of the image is equavalent to multiplying the coordinates of each point by a con- stant k, so that the new, larger image is given by the locus of points (kx ; , kyi\ . Rotation of the image is more easily defined by using polar coordinates for the original image {ri ,Oi; . Rotating the image is then defined by adding a constant angle @ to each of the polar angular coordinates (r;, O i l . The use of complex variables to define size and rotation provides a much clearer definition of size and rotation. The image is the locus of complex variables ( z i ) = ( r eihi) ; size scaling is equivalent to multiplying each point by a real constant k, as above, while rotation is eqlrivaient t o multiplying each variable by an imaginary constant ei4, resulting in the rotated image (rieio+*i. The logarithmic image of the Locus of points (z;) is (logzi]. The logarithmic image of the locus of points { k z i ) is l log k + log z;], which is identical to the original locus. up to a linear shift in the real or imaginary direction, as illustrated in Fig. 4. In the complete logarithmic plane, size/rotation changes reduce to a linear shift of an invariant pattern.
. -- --.- . - - - From the previous definition, both size and rota-.
tion are multiplicative symmetries. In one dimension (e.g. as in the operation of a slide rule), the logarithm function transforms multiplication to addition. In two dimensions, the complex logarithm function also transforms multiplication to addition, although one may now attach a geometrical interpretation to the operations of multiplication and addition: multipli- cation, as above, refers to size and/or rotation scaling while addition refers to translation.
Thus, a complex logarithmic mapping transforms size and rotation (multiplicative symmetry) to shifting. Since the anatomical form of the cortex provides this mapping, at least for para- and peri-foveal cortex, then it is certainly possible that a subsequent stage of shift invariant processing may provide a basis for geo- metrical constancies in vision. ,
This discussion also indicates the problem with Blakemore and Campbell's (1969) suggestion that the existence of spatial frequency channels in the visual system might provide a basis for size and rotation constancy in vision. They u y , " . . . the relative harmo- nic content is independent of size; such a mechanism for analyzing spatial frequencies would be dificult to envisage if it had to operate simultaneously in two dimensions". Two remarks may be made concerning this statement: (1) the previous discussion indicates the correct method for dealing with the two-dimen-
sional nature of size and rotation scaiing, and (2) although it is true that "relative" harmonic content is invariant to size, the mere existence of spatial f e - quency channels does not provide a mechanism for
.
extracting the "relativen harmonic content. In fact, precisely what is required is some means of removing the multiplicative constants that are introduced by size and rotation scaling. Biakemore and Campbell have in fact merely defined these symmetries, by pointing out that "relative harmonic content" is in- variant. They have constructed a tautology, rather than an explanation. This argument is reinforced by the artificial pattern recogni tiol li terz ture. Spatial fre- quency analysis is readily available to workers in optical and computer pattern recognition. However. spatial frequency analysis itself has contributed nothing towards the solution of the problem of size and rotation invariance, which are wideiy recognized difficulties in pattern recognition (Duda and Hart. 1973). Tn fact. spatial frequency analysis offers trans- lation invariant possibilities (Duda and Hart, 1973; Casasent and Psaltis. 1976). However, the spatial Fourier map changes size and rotates with size dila- tion and rotation of the stimulus (Duda and Hart, 1973), and so contributes nothing by itself to invar- iance under these symmetries. Complex logarithmic remapping, however, provides a geometric basis for size and rotation invariance, and this geometric struc- ture is characteristic of the local and global functional architecture of the striate cortex (Schwartz. 1976a, b, 1977a, b, c).
The use of complex logarithmic pre-processing as a practical means of dealing with size and rotation scal- ing is demonstrated by a number of independent works in artificial pattern recognition (Brousil and Smith, 1967; Chaiken and \Vieman, !977 ; Casasent and Psaltis. 1976). Casasen~ and Psaitis (1976) provide a recent example of this approach. which is of con- siderable practical importance, because optic21 pat- tern correlation methods are very sensitive to size and rotation mis-match of ternpla tes. Aiso, optical engin- eers have a very convenient shift invariant mapping available to them, which is the optical fourier trans- form (Duda and Hart, 1973). Casasent and Psaltis (1976) have combined the geometric invariant proper- ties of the complex logaiithrnic mapping with the shift invariant properties oC the optical Fourier transform in a very effective and important pattern recognition method. Chaiken and Wieman (1977). independently, Rave made ingenious and extensive use of this map- .
ping in the context of computer pattern recognition. Cavanagh (1978) has suggested an analogy between
the previously cited artificial pattern recognition worl:, and vision. Unfortuna~ely, Cavanagh does not distinguish between the spatial frequency mapping that is used - .- by Casasent and Psaltis (1976) and the complex logarithmic mapping that is also used in their application; insread. Cavanagh confuses the . issue of spatial frequency coding in the visual syslem with logarithmic rilapping in the visual system. More-

over, he is apparently unaware that the global and local architecture of the cortex is described in terms of complex logarithmic geometric structure (Schwartz, 1976a, b, 1977% b, c, 1978). It is important to empha- size the distinction between the spatial frequency aspect of visual processing, and the geometric aspect. Size and rotation invariance, up to a linear shift, are due entirely to the geometric properties of the complex logarithmic mapping, both in the work of Cassessent and Psaltis (1976), Chaikin and Wiernan '(1977), and, in the context of biological vision, in the . work cited above (Schwartz 1976& b. 1977% b, c, 1978). There are numerous means of dealing with the final step of shift invariance, subsequent to complex logarithmic remapping. For example. if it could be demonstrated that a spatial frequency map is some- how constructed by the visual system, then the shift invariance property of the Fourier transform, coupled with the pseudo-invariance properties of the cortical map, could provide a size and rotation invariant mechanism for vision (Schwartz 1978). However, other neural processes may provide the shift invar- iance part of this mechanism. Uttal (1975) has sug- gested that the visual system may construct an auto- correlation map of the visual field. Auto-correlation is shift invariant, and in fact is very closely related to the Fourier transform (Duda and Hart, 1973).
To summarize the previous discussion of size and rotation symmetry, it should be pointed out that the question of perceptual constancy and the visual aspects of geometric invariance involve a wide variety of physiological and psychological factors, such as proprioceptive cues. size-distance estimates, move- ment, stereopsis, etc. It is not possible at the present time to construct a detailed physiological model of size, rotation and translation invariance. In the case of the retino-striate map, the non-linearity in cortical projection presents a severe problem to translation symmetry. Any non-linear map will cause a change in both size and shape as a given stimulus moves across the image plane. However, of all possible analytic non-linear cortical maps, the complex logarithmic mapping has the property that it simplifies certain aspects of size, rotation, and projection symmetries. Furthermore, a clear discussion of the computational bases of size invariance show that spatial frequency analysis, per se, has no computational role in size invariance, despite the often quoted assumption that the existence of "spatial frequency channels" some- how provides a mechanism for size invariance (Blake- more and Campbell, 1969).
Isotropic graring stimuli and the Mellitt-Fourier trans- form
The previous discussion of the relation of size invariance to cortical anatomy and Fourier analysis suggest that the commonly used linear Fourier grat- ing stimuli are not particularly well matched to the structure of the retino-striate system. In most appli-
cations of Fourier analysis, the natural boundary con- ditions of the problem are usually carefully studied, and an appropriate orthogonal system chosen. This point has been made by Kelly and Magnuski (1975), who used circular Bessel function gratings as visual probes. Bessel functions are clearly suggested by the polar coordinate symmetry of the retina. However, in addition to the polar coordinate symmetry of the vis- ual system, there is a logarithmic scale factor, which is reflected in retinal cell density, as well as cortical magnification factor. By considering conventional Fourier analysis on a logarithmically transformed manifold, it has been shown that size and rotation invariance may be obtained. The gratings associated with this form of Fourier analysis, called the Mellin- Fourier transform (Morse and Feshback, 1953), are exponentially spaced concentric circles, rays, and logarithmic spirals (Fig. 5). They represent a natural, isotropic system of grating stimuli for the visual sys- tem, which is matched to the natural boundary con- ditions associated with polar symmetry and logarith- mic structure of the retino-striate system.
Feature extraction, diflerence mapping and columnar architecture
Although ocular dominance columns in striate cor- tex prollide a prominent example of columnar archi- tecture, columnar structure has been found in audi- tory, motor, sensory, limbic, frontal, and association cortex (Schwartz, 1979d). No computational rationale has been presented for this characteristic feature of neuroanatomy, although Hubel and Wiesel (1979) have suggested that "column systems are a solution to the problem of portraying more than two dimensions in a two dimensional cortex". In recent work, a specific algorithm for encoding multidimensional stimulus modalities via columnar structure has been presented (Schwartz, 1979% d). This work will be briefly reviewed here. because it shows how the two most salient features of cortical anatomy (topographic mapping and columnar architecture) may provide a mechanism for segmentation and feature extraction.
The basic point of this algorithm rests on the obser- vation that it is possible to define binocular disparity as the difference map of the left- and right-eye views of a three-dimensional scene (Jules& 197 1 ; Koender- ink and van Doorn, 1976). Similarly, the color- opponent channels may be defined as difierence maps of the slightly different red, green, and blue chromati- cally filtered maps supplied by the three retinal cone systems. The common point in both binccular dispar- ity and color-opponent vision is that the relevant sig- nal is a two-dimensional difTerence map of two inde- pendent aflerent systems. Thus. the problem of feature extraction (sp~xifically segmentation) for color and depth may be phrased as the problem of constructing and extracting appropriate difference maps.
I t may be shown (Schwartz, 1979a. d) that if one appropriately constructs a composite mapping by

Computational anatomy of str'iate cortex I
Z PLANE W PLANE
Fig. 5. The patterns on the left (A. B, C) are examples of MacKay complementary stimuli. (A) and (B) are complementary while (C) is complementary to a log spiral of opposite "handedness". The images of these stimuli, under the map w = log(z) are shown on the right. The central circle (singularity of the logarithm function) is omitted in each case, and in fact, is omitted from MacKay's figures due to limitations of the printine process. This figure indicates that parallel rectilinear grids (or equivalently, sinusoidal gratings) are associated with MacKay grids, via the logarithmic mapping. The grid stimuli on the left are typical eigenpatterns of the Mellin-Fourier transform. It is clear that MacKay complemen- tary afterimages have a close relationship in the cortical plane. This fact is made clearer in Fig. 6, where
a more realistic model of the cortex, including the local hypercolumnar structure, is presented.

using "thin" strips of two slightly different mappings, then the difference map of the two input mappings is encoded within a s~at ia l frequency channel. The defi- nition of "appropriate" interlacing is provided by the following projection operators, which allow one to "slice" a mapping into thin "columns". Consider two slightly different maps. which for concreteness may be identified with the left- and right-eye view of a three- dimensional visual scene. Call these two maps lL(x, y ) &d I,(x, y). Now, "columns" may be produced by a projection operator of the following form (note that uniform y dependence is assumed but not explicitly notated):
The function R , may be thought of as a grating function [i.e. choose (a,) to represent a square-wave grating] which has transmittance which varies between 0 and 100% with a period off . Now, consider a similar grating but which is exactly one half-cycle out of phase with R , :
Images IL(x,y) and l,(x,g) may be sliced into "columns" and ihen re-assembled to form a new, composite mapping called l,(x, y). as follows:
The structure of the composite mapping I , ( s . y ) may be studied by re-writing it in terms of the explicit expression of equations (10) and (1 1):
-- -
Equation (14) shows that the structure of the map created by "slicing" two slightly different mappings into strips. and placing the adjacent strips together into a single composite map, contains two terms. The first term is the average of the two maps; the second term is the difference map [IL(x, y ) - lR(x, y)], which is multiplied by a spatial frequency modulation which is determined by the period f of the original "colum- nar" projection operator. The diflcrcncc. map contains
the binocular disparity cues, and may be "extracted" by passing the map I,(x, v) through a high-pass spa- tial filter. Then, only the difference map will be passed, and the magnitude of the difference will be expressed by the amplitude of the contours in this high-pass channel.
If one identifies the structure of the composite m a p ping I,(x,y) with striate cortex, and the two "colurn- nar" mappings as the left and right eye ocular dornin- ance mlcmn pattern, then it is ciear that a segmenta- tion for mininon values of bin~cular disparity may be accomplished by examination of a particular spatial frequency components of the cortical map. This com- ponent is given by the spatial frequency determined by the ocular dominance column spacing. In the next section of this paper, it is shown that in both rhesus monkey and humans, the width of ocular dominance column spacing may be related to va!ues of binocular disparily tuning and Panum's fusional area, respect- ively. Thus, for a human ocular dominance column width of roughly I rnm (Schwartz, 1978, 1980). and for a human cortical magnification factor of 12 mmldeg (Drasdo. 1977), the angular frequency suggested by this analysis is equal to about 1/12'. which is close to the minimal value of Panum's fusional area (6 min arc).
Thus, the discussion above. and equations ( I 1 H14) show a possible algorithm for feature extraction for the magnitude of binocular depth by means of a "cor- tex" which consists of columns of adjacent strips of alternating left- and right-eye input. High pass spatial filtering is then sufficient to "extract" the magnitude of binocular depth. No labeled "disparity extractors" are required. since the depth channel is labeled by the fact that it occupies a certain spatizl frequency chan- nel of the cortical map, determincd roughly by the magnitude of Panum's area.
In a recent paper, the computational and physio- logical aspects of this algorithm are discussed in re- lati on to both color-opponent and binocular depth sub-modalities (Schwartz, 1979ad). The difference mapping extractioi-I outlined in equations (10)-(14) is well known in the applied optics literature, where it has been proposed for motion detection (Pennington, 1970). Ir! the present case, one might ask whether the details of ocular dominance column structure are con- sistent with the requirements of this algorithm: how in detail could one constract this particular type of columnar interlacing? The answer is quite simple: if two maps are overlapped, and if alternately one and then the other map drops out a "column" of its input, then precisely the sort of columnar structure oulined in equation (14) will be produced. This is the simplest way to construct this form of columnar interlacing. and may be relevant to the structure of striate cortex: ". . . the formation of the adult pat tern (of ocular dominance columns) may involve the actual breaking of synaptic connections in the innappropriate columns. . . (Levay et al., 1978). If. on the other hand, the comple~e representalion of both maps must he

Computational anat~rny of striate cortex 659'
retained. then a more complicated columnar geo- metry must be considered. which is discussed in detail In other work (Schwartz, 1979d). In this same work, it is shown that more than one difference mapping may be encoded in ,this way, using additional sets of columns. with different spatial frequencies. This feature extraction algorithm is also discussed in re- lation to color-opponent extraction, which requires two difference mappings (i.e. red-green and b l u e yellow).
In summary, the existence of columnar interlacing and topographic mapping siggests the possibility of a form of computational anatomy relevant to difference map extraction. Thus, more than two stimulus dimen- sions could be represented in a single corti'cal lamina, expressed as a "texture" of spatial mapping. More importantly, the apparent necessity of retaining "labeled" cells for the detection of depth or color- opponency, is avoided. Although there is no doubt that trigger features for depth and color-opponency exist, there must be some doubt that the nervous sys- tem is capable of keeping track of which cells are tuned to which environmental features. The algorithm outlined above suggests an alternative to this form of single cell feature extraction. The widespread co- existence of columnar architecture and topographic mapping in the neo-cortex may be due to the funda- mental importance of representing and extracting the differences of two slightly different afferent inputs, and coding the result as a two-dimensional difference mapping.
VISUAL ILLUSION AND HU.MAN
FUNCTIONAL ARCHITECWRE
In the final section of this paper. it will be demon- stra~ed that several visual illusions may be under- stood in terms of the detailed geometrical structure of the retino-cortical map. both on the global and local levels. For the purposes of this discussion. a quanti- tative model of the human cortical map will be con- structed. This model will then be used to analyze the relationship between the visual stimuli which are related to each other as complementary, or "orthog- onal" afterimages. This discussion clearly indicates that certain patterns which are perceptually comple- mentary (i.z. complementary afterimages) are also anatomically complemen tary in terms of their re- mapped images, at the level of the visual cortex. This demonstration provides a clear-cut relationship between visual perception and cortical geometry. A second illusion which is examined in this way is the fortification pattern associated with migraine head- ache. Although somewhat speculative, this analysis of the fortification pattern may be of some practical im- portance to recent efforts at the development of a visual prosthesis (Dobelle et al., 1976; Brindley and Lewin. 1968): the visual percept that is associated with a relrt~ively simple pattern of cortical disturb- ance. as suggested by Richards (1971) to account for
the fortification illusion, may also be seen as the result of endogenous cortical stimulation. The relatively complex pattern that results (Fig. 8) may be related to the geometrical structure of the representation of the retina at the level of'the cortex, and so could provide some insight into the construction of a visual pros- thesis based on cortical stirnula tion.
A quantirarioe estimate of human funcrional architec- ture
Orientation columns and ocular dominance columns have been demonstrated physiologically and anatomically in the cat (Hubel and Wiesel. 1962; Strykker et' al., 1977) and the monkey (Hubel and Wiesel, 1974; Hubel et a/., 1977). and may be pre- sumed to exist in the human. In order to make the following discussion of visual illusions more concrete, it is useful to have a quantitative model of the func- tional architecture'of the human visual cortex, both locally and globally. Human magnification factor has been estimated by several workers (Cowey and Rolls. 1974; Drasdo, 1977), who report an inverse depen- dence on eccentricity, as in the primate, with a foveal value of magnification that is roughly 1 1.5 mmjdeg (Drasdo, 1977). Drasdo's study of human magnifica- tion factor indicates that integrated magnification factor is best fit by a function of the form log (r + 1.6), where r represents eccentricity. A detailed retinotopic map of the human cortex is not available. but under the assumption that the human map is similar to that of the primates (which is supported by the available linear magnification estimates), the human global map may be fit by a conformal map of the form log ( z + 1.6), using Drasdo's (1977) estimate of linear human magnification factor.
The magnitude of ocular dominance and orienta- tion columns in the human may be estimated by a variety of independent arguments, which are in good agreement with one another: (1) Panum's fusional area represents the area of visual field over which "patent" stercopis (i.e. effortless fusion) may be obtained. and is roughly 6-l0min arc in the foveal field (Gulick and Lawson, 1976). Panum's fusional area scales with a roughly linear dependence on eccentricity, and therefore suggests that a constant- sized anatdmical feature of the cortex underlies this quantity. Ocular dominance columns are constant in size across the cortex, and previous work has shown that the width of ocular dominance columns, coupled with a simple model of dendritic summation, has been capable of providing a correct qualitative and quanti- tative estimate of binocular disparity tuning in the rhesus monkey (Schwartl 1977~; Poggio and Fischer, 1977). Clearly, from the p i n t of view of cortical cells, a "jump" in the ability to fuse binocular input (or more precisely to be driven by binocularly disparate stimuli) would be scaled by the width of a cortical ocular dominance column. Thus, if one assumes that Panum's fusional area is essentially determined by the ' width of a single ocular dominance column, then the

value of cortical magnification (11.5 mm/deg) in the represented in terms of the l ~ c a l orientation and ocu- foveal representation, and the magnitude of Panum's lar dominance column structure. area (6-10 min arc) in the foveal representation, imply an ocular dominance column width equal to between Com?!e"enlar~ cBerin'qes 1.2 and 1.9 mm, or roughly 2-4 times the size of ocu- MacKay has shown that the stimuli of Fig. 5 are lar dominance columns in rhesus monkey. prceptualiy compiementai-y in the following sense: If
The basic size of the local urlt of cortical receptive stimulus 52 is viewed srsoboscopically with a fre- field size, in the foveal represeatation, may slso be quency cl fmr, than BOii-.:z- ihen stimulus 5b will be estimated from line tuning data- Wilson (1978) m i - pt?r~ei~/ed as a faint bluish iilusion. This complemen- 'mates that two adjacent lines in the foveal visual tarity is evident also in tthc brief afterimage following field inhibit one another, based on psychopbysica.1 norn~ai viewing oi these stimuli, or by ineans of pro- measurements, when they are closer together thm jecting visual noise onto acy one of them. which 0.2". This implies a local "scale" of 2.3 mm (based on causes its compiemeni to be visible (MacKay, 1964. a foveal magnification factor of 11.5 mm/deg (Drasdo, 19701. In fact normal viewing of any of these stimuli 1977). Similarly, the size of fortification iIlusions is is associated with perception OF the complement. seen also roughly 0.2' in the central visuai field (Richards. as a wavy, background iilusion. 1971). again suggesting a basic "spatial unit" of MaclCay h a suggested that the complementary roughly 2 mm. The peak sensitivity of human spatial af;erima:gc i j due to selective habituation of sub- frequency threshold-measurements is 4 c/deg (Keily, popula!ior.: of coriicai neurons tuned to orthogonal 1975). suggesting a basic cortical s a l e of 2.6 mm. orienbiions (idacKay, 1964.). This explanation was Finally. human subjects implanted with visual pros- proposed before the detailed nature of cortical func- thetic arrays can resolve adjacent electrodes only if tionzl architecture was well understood, and it is they are separated by more than 2-3 mrn (Dobell and worthwhile considering the detailed nature of the cor- Mladejovksy, 1974). tical representation of these stimuli.
Another rough estimate of human column size is Figure 6 shows a superposition of Hubel et al.'s based on the fact that human cortical magnification (1978) reconstruction of rhesus ocu!ar dominance and factor is about twice that of rhesus monkey. If human orientation columns, photographically superimposed ocular dominance columns are similarly scaled, then a over a computer graphic map of the topography of value of about 0.8-1 mm woilld be expected, giving a the striate cortex. The mzpping function used in this hypercolumn size that is about 2 mm. in agreement demonstration is log ( z + 1.6), in order to provide an with the above estimates. This value of' 1 mm oculzr . estimate ~f the human striate cortex topography. The dominance column size is used in the quantitative factor 1.6 has been taken from Drasdo's measurement model of human striate cortex shown in Fig. 6. of human magnificztion factor (1977). Below this ana-
Thus, the basic spatial "unit" of the human cortex, tornicxl and computer presentation is shown a sche- which may be tentatively identified in size with a matic reprod~~ction of a small section of orientation "hypercolumn", is estimated to be roughly 2 mm, columns, fron'the t ~ p cl the Agure. These lines r e p whether the estimate is based on Panum's fusional resezt the pattern of coi.tic4 activity resulting from area, linear tuning, spatial frequency sensitivity, the stimulation with vertical grids. Because of the linear size of fortification illusion sepents , or cortical mapping of angle that is cl~aractesistic of the sequence stimulation." regularity property, patterns that are 90' rotated in
Figure 6 shows a computer graphic simulatioi~ of the human cortex, with a photographic overlay of pri- mate (rhesus) hypercolumn patterns, redrawn accord- ing to the scale factors outlined above. This figure allows a very concrete disc~lssion of the pattern of excitation imposed by a specific, contoured visual stimulus, since the global retinotopic scaling suggests the overall "distortion" of a retinal image! mappecf to the cortex, while the local hypercolumn pattern sug- gests how the fine detail of the stimulus would be
the visual field map io patterns that are exactly one half of a hyperco!umnar distance out of phase at the cortex. This linear scaling of orthogonal contours is scherna.t.iczl!y re2resented in Fig. 7, where the cortical patterns associated vrith csmplementary visual images zre illustrated. Cleariy., habituation to one of these pa.tterns would tend to leave as a remainder, or "after- image", its Mackay cornplerr~tnt at the cortex. The +
details of cortical spa~ja! structure are apparently the basis of the *perceptual effects of the compIementary aftrrimages.
In summary, the Icca! hypercola~mnar geometry * Nore added afrer submission-The series of estimates indicates that orientatic>ns which are orthogonal in
outlined above for the size of h u n ~ a n hypercolumns I~ave recent]y hen supported by Hickey and Hitchcock (1980). the fie'd are orientation who were able to observe evidence for the existence of which are exactly one: half of' a hypercolumn out of human ocular dominance columns in p s i mortenz sections phase in the cortex. T h i s phase shift, coupled with the of human striate cortex. The size of a humrin ocular reguiarity of stimulation provided by grid stimuli, dominance column is estilnated by t h ~ workers to be a naturai associatjon between a pattern and roughly 1 mm (in viva). in good agreement with the esti- males outlined above. ( ~ i ~ k ~ ~ P. F. and ~ i , ~ h ~ ~ ~ l ; (19C0, itwrthogonal comp!ement. This association is maxi- Brain Res. P 82, 176-1 79.) ~nal for pa i te r~s which are globally complex logarith-

Computational anatomy of &ate cortex
Or~entatm Sequences
Fig. 6. (Top) A model of the human cortex is shown which is scaled according to the mapping function log (z + 1.6) (Drasdo, 1977). Superimposed on this mapping function is a columnar reconstruction of ocular dominance and orientation columns, from Hubel et al. (1978). which have been scaled according to the estimates in the text, for the human cortex. In addition. the mapping of one of MacKay's complimentary afterimage patterns (exponential concentric circles) is superimposed over the cortical model. The scale of this pattern has been taken from a typical viewing distance for which the MacKay pattern would subtend 10" of visual field. Because of the logarithmic global cortical map; the contours of the MacKay pattern are arranged approximately isotrapically across the cortex, and seem to intersect a constant number of hypercolumn boundaries (roughly 1-2 lines/hypercolumn). This isotropic global distribution holds only for the logarithmic patterns of Fig. 5.
(Bottom) Graphic simulation of the orientation column pattern within each hypercolumn. I h e dark lines are redrawn from a small segment of ocular dominance columns, and the parallel bars are meant to represent individual orientation columns, which are approximately perpendicular to the ocular domin- ance column boundaries, as can be seen by inspection in the figure above. The final step in this sequence . is presented in Fig. 7, which demonstrates that MacKay's complementary afterimages are complemen- tary in their anatomical pattern of cortical excitation, due to the local and global functional architecture
of the cortex.
mic in their structure. since these pitterns project to an isotropic distribution of contour at the level of the cortex. Clearly, any pattern which had a regular, grid- like structure would be associated with an orthogonal afterimage. due to the local sequence regularity p r o p erty of the cortex. Thus, the complementary after- images associated with the patterns of Fig. 5, for a central fixation point, are most simply analyzed in terms of their geometric structure at the level of the striate cortex, rather than the retina. For non-central
fixation points. or for non-logarithmic grid patterns, the association of an orthogonal afterimage is still clearly related to the local geometric structure of the cortical map.
Fortification illusions
A second visual illusion which may be explained in terms of cortical functional architecture is the fortifi- cation pattern that is often associated with migraine headaches (Richards. 1971). Although the "explica-

Fig. 7. (A) and (B) represent complementary stimuli, which map to equispaced, isotropic patterns under the global retinotopic mapping. as suggested in Figs 5 and 6. A small sectior~ of this isotropic pattern is reproduced in the central figure (a) and (b). The columnar structure of the cortex is suggested by the rows of parallel bars (i.r. orientation columns), as in Fig. 6. The pattern of columns that would be excited is indicated with dark bars. for patterns (a) and (b). These are reproduced sid.: by side, at the bottom, in order to demonstrate that the two patterns of columnar stimulation are in fact anatomically "comple- mentary". This complementarity is a result of both the local and globhl structure of the hnctional architecture of the cortex. The local sequence regularity property associates an isotropic and regular pattern of columnar stimulation with its orthogonal complement; the global map implies that complex logarithmic stimuli (as in Fig 5 ) will have the most isotropic representation at the cortex, and so should
ma.ximally faciiitate the complementarity caused by the local structure.

Computational anatomy of striate cortex
Fig. 6 . (A) Drawing of a typical fortification illusion pattern. from Richards (1971); (B) reproduction of (rhesus) striate cortex (Levay et al., 1975), with a "linear" pattern (shaded) superimposed on it. The mapping of this linear wavefront. moving a t constant velocity, would correspond to a series of exponen- tially iricreasing concentric circles. using the complex logarithmic mapping function (see Figs I and 2). Within the foveal representation. this "linear" wave would have to become almost circular, if it were to . remain constrained by the boundaries of the striate cortex; this initial circular shape is also required by the fact that cortical mapping is initially linear (for the foveal representation), and only becomes logar- ithmic within the parafoveal representation. (B) shows the interaction of this wavefront with an indivi- dual hypcrcolumn. .As discussed in the text, in layer IV of the cortex. the geometric pattern of cells is presumed to be centrally symmetric: the re-mapping of this layer of the cortex to the surrounding laminae is described by the complex logarithm function. The row of cells that lie in a direction that is (locally) perpendicular to the wavefront (shaded) will be the first to be inhibited. This is suggested in the figure by the shaded circle, representing one of the cells of layer IV which project to a simple cell whose orientation is perpendicular to the advancing wavefront. Inhibition of these simple cells would decrease . activity in an orientation column representing the perpendicular orientation to the advancing wavefront. A typical inhibitory profile, with disinhibited "wings" is shown on the right of (B).
(C) Pattern of orientation column activity associated with the above description. The white column represents the inhibited orientation. and the darkened columns represents the disinhibited neighboring . columns. which are then perceived as "fortification" elements. with an angle of 40-60". This angle is determined entirely by the spatial extent of the lateral dis-inhibition suggested in (B). The double lines of the fort~fication pattern correspond to the suggestion that the cells which are disinhibited are binocularly tuned. Measuring from Richards' (1971) figure. the angular spacing between these lines corresponds to 0.04" (foveally) which is in good agreement with recently measured values of binocular disparity tuning in rhesus striate cortex (Poggio and Fischer. 1977). as well as with values of Panum's fusional area in
humans (roughly 0.1 ").

tion" of the fortification illusion pattern is somewhat more speculative than that of the orihogonal after- image, this discussion is important because the details of the fortification pattern provide some support for the model of the local structure of the cortex in terms of the complex logarithmic map (Schwartz, 1977~).
Figure 8 shows a drawing of a fortification illusion pattern, reproduced from Richards (197 1). Richards pointed out that the pattern of concentric circles, or "C-shaped patterns, is consistent with the non-linear nature of cortical magnification factor, and suggested that a moving "wavefront" of cortical metabolic dis- turbance may be responsible for the fortification pat- tern. The global outline of the fortification pattern consists of exponentially spaced, concentric rings.
This is consistent with the global geometric struc- ture of the cortex, since a linear wavefront, as shown schematically in Fig. 8, would map either to a series of concentric circles, or log spirals, depending on it's angle of inclination with respect to the cortical axes (See Fig. 5). The local structure of the fortification illusion, consisting of angular "fortifications" with an angle of between 45 and 6OC, may be explained with reference to the local structure of the cortical map. Of particular relevance to this explanation is the fact that orientations that are perpendicular or parallel to the overall contour of the fortification illusion are never reported (Richards, 1971).
Richards has suggested that this is due to the fact that local orientation columns in the cortex are arranged in a hexagonal grid. This explanation, sug- gested before the detailed anatomical reconstruction of cortical columns in the cat and the primate, is not consistent with the actual pattern of orientation columns. which are in the form of parallel slabs, at least on the scale of 3-4 adjacent columns. However, with respect to. the model of local structure of the cortical columns based on the local complex logarith- mic mapping (Schwartq 1977a. b. c) a simple explana- tion is possible. The presumed metabolic disturbance associated with migraine headache, and fortification illusions (Richards. 1971) would initially afiect those cortical cells which possess the highest spontaneous activity; these cells are found in layer IVc, where the afferent input to the cortex largely terminates (Hubel and Wiesel, 1974), and which possess concentric circu- lar receptive field structure, and a high spontaneous activity. (Levay et a!., 1975). Simple cells in the sur- rounding laminae possess fairly low spontaneous dis- charge rates, and presumably are strongly inhibited by intra-cortical lateral inhibition. With reference to Fig. 8, it may be seen that those cells which converge to orientations which are perpendicular to the wave- front of disturbance will be inhibited earliest by the advancing migraine associated disturbance. Their excitatory input to the surrounding simple cells will be diminished, and the activity of these cells will be depressed. Correspondingly, their neighbors on either side will be disinhibited, and will experience an eleva- tion in firing rate. These columns. which correspond
to orientations which are in the range of 3 0 4 0 " from the perpendicular orientation to the advancing wave- front, would be perceived as the jagged fortification pattern of Fig. 8. This provides an explanation for the absence of perpendicular orientation in fortification illusions.
Even the doubling of the lines of the fortification illusion may be explained by the fact that binocular cortical cellular disinhibition, by the mechanism sug- gested above, would be associated with a "disparitym in the visual field, i.e. with a slightly displaced pair of oriented lines. Thus, the detailed percept associated with fortification illusions may be understood as the result of endogenous stimulation of the cortex by an advancing wavefront of metabolic depression. The simple linear wavefront of Fig. 8, in interaction with the local and global functional architecture of the striate cortex, is capable of producing the fortification illusion "percept" of Fig. 8. This reasoning indicates that there is a relatively complicated relation between the pattern of stimulation applied to the cortex, and the percept which is ultimately "seen" by the patient. Richards quotes the astronomer Hubert Airy, who was himself a victim of migraine, that "fortification illusions probably represent a 'realistic photograph of processing in the brain'" (Richards, 1971). In other words, fortification illusions represent a realistic map of the relation between cortical stimulation and per- ceptual pattern; if so, then the ability to explain forti- fication illusions in terms of the local and global m a p ping structure of the cortex ought to have direct rele- vance to the nature of the input which should be applied to a cortical prosthetic stimulation array.
This point is reinforced by noting that discrete cor- tical stimulation produce percepts which are some- times described as point-like phosphenes (Dobelle and Mladejowsky, 1974). and sometimes described as "pinwheels", or I-otating stars. This latter description is simply explained with reference to the sequence regularity property of the cortex, since a locally mov- ing electrical disturbance in cortex would excite suc- cessive orientations of columns of cells, which would correspond to a rotating, logarithmically structured pinwheel. This is an exact analogy to the fortification illusion discussion: a moving wavefront on a global scale corresponds to exponentially spaced circles or log spirals, while a moving disturbance on a local level will correspond to a local log spiral pattern (i.e. pinwheel) (as in Fig. 5).
One final point concerning the fortification pattern relates to the detailed structure of the local cortical map. Two possible models for sequence regularity may be considered: (1) elongated visual receptive fields mag rotate around a central point. resulting in a centrally symmetric "star" configuration. Geometri- cally, this corresponds to the pattern of the diameters of a circle. (2) receptive fields may rotate around an eccentric point. Geometrically, this corresponds to the pattern of radii of a circle. Both of these possibilities have been represented by detailed models (Schwartz.

Computational anata my of striate cortex 665
1977~). However, the pattern of fortifications is clearly the second of the two alternatives. No "stars" or "X" patterns are reported to occur in these illu- sions. This may be interpreted as circumstantial s u p port for the second of the two models mentioned above.
DISCUSSION: GLOBAL PERSPEmIVES
IN THE NEL'ROBIOLOGY OF VISION
Neural representation of visual data and perceptual coding
The nature of the neural representation of the vis- ual world is at present unknown. Only three generic physiological models have been seriously considered as a possible basis for perceptual coding: (1) single cell feature extraction (Barlow. 1972); (2) Fourier analysis-spatial frequency models (Sekuler, 1974); and (3) Configurational or spatio-temporal models (John and Schwartz, 1978).
Each of these approaches suffers from major con- ceptual and experimental problems. Single cell and spatial frequency models have been popular recently, due to their close relationship to the major experi- mental methodologies of neurophysiology and psy- chophysics. Spatio-temporal configurational models have tended to be unpopular. due to the lack of a computationally detailed and physiologically correct formulation. In the following discussion. a short out- line of the deficiencies of single cell feature extraction and Fourier analysis models will be presented: Finally, a modification of the configurational, or "Gestalt" approach will be developed, based on the concept of computational anatomy discussed in this paper-
A critique of single cell feature extraction
The hypothesis of single cell feature extraction, sup- ported by the classic paper of Lettvin er al. (1959) and the early work of Hubel and Wiesel (1962). states that the visual scene is analyzed in terms of the firing of "labeled" cells whose firing "corresponds to a high degree of confidence that.. . the percept is present in the external world" (Barlow, 1972). The problem with this approach has been recently reviewed (John and Schwartz. 1978), and may be stated succinctly: the trigger features of cortical cells are multivariate. The edge response of cortical cells is a prominent. but by no means unique aspect of their activity: the angle of tilt of body axes has been reported to affect orienta- tion tuning, as does auditory stimulation in the appropriate region of visual space; the firing rate of hypercomplex cells is defined as a bivariate function of stimulus orientation and length: the response rate of cortical cells is a continuous function of contrast. In general. the firing rate of a cortical cell is a multi- variate function or angle, length. direction. velocity. binocular disparity, color. vestibular and auditory stimulation (at the least). But. how is i t possible. from the firing of a single cell to determine the existencu of
a high contrast edge at one orientation, a lower con- trast edge at a more favored orientation, a short edge moving at high velocity, a long edge moving at a lower velocity, but a more favored direction, or influences from the auditory, vestibular and oculo- motor systems?
The very richness of the repertoire of cortical trigger features undermines the theoretical position which has been inferred from their existence. Thus. even if it were plausible that one could reliably represent the existence of a percept (Barlow, 1972) or concept Ikonorski, 1973) by the firing of a single "labeled" cell, one would still be left with the problem of "re- assembling" the visual world from the ensemble of such cells firing at any given moment in the brain. Single cell feature extractor approaches substitute the single cell for the "little green man" in the brain. Instead of solving the problem of the autonomous nature of neural computation, single cell approaches merely provide an infinite regression.
Critique of spaticrl frequency-Fourier analysis models
Campbell and Robson (1968) suggested that Four- ier analysis might provide the basis for visual repre- sentation. Just as an appropriately weighted sum of sinusoidal spatial grids is capable of representing a two-dimensional signal, via Fourier analysis, C a m p bell and Robson (1968) implied that the visual system also makes use of this form of representation. This suggestion stimulated a vast amount of experimental research and theoretical speculation. However a well- defined computational algorithm, which is in agree- ment with current knowledge of the anatomy and physiology of the visual system, has never been presented. For example, Pollen et al. (1971) proposed a model of Fourier analysis for the visual system based on strip integration. This model was stimulated by the Pact that cortical cells seem to integrate data on "strips", and that strip integration via Fourier analy- sis is a well-known reconstruction algorithm in radio- astronomy. However. no detailed neuronal implcmen- tation of this algorithm by the nervous system was presented. This lack of attention to computational detail characterizes most attempts at suggesting a role for Fourier analysis in vision. Although there is no doubt that phenomenological "spatial frequency channels" may be demonstrated to exist by a variety of methods (Sekuler, 1974). it is a long step to propose that the nervous system actually performs Fourier analysis. If this hypothesis is examined in detail. both with respect to the physiology and anatomy of the visual system. and to the computational details which are implied (Schwartq 1979~). the Fourier hypothesis rapidly loses its appeal. as is shown by the following points.
Most psychophysical support for Fourier models has come from demonstrations which showed some form of dependence of the power spectral content of a visual stimulus on one or another perceptual phenomenon. The means for reprcscntation of the

phase spectrum, however, remains unclear. But, the power spectrum of a stimulus is not sufficient for representational purposes. This has been demon- strated by Fiddy and Greenaway (1978). who have shown that in addition to trivial equivalence under shift and inversion, there exist infinite classes of stimuli with identical power spectra: non-zero min- ima in the two-dimensional intensity pattern are not distinguishable by power spectral measurements.
A Fourier model requires some form of non-local interaction across the visual field. Fourier analysis is an intrinsically global process, but receptive field structure in striate and circumstriate cortex is local Attempts to sidestep this problem have been based on the invocation of the term "piece-wise Fourier analy- sis" (Glezer et ol., 1973; Robson, 1975). However, this term has not been supported by a detailed explana- tion: how does one synthesize "pieces" of Fourier analysis into a global Fourier map? This is a non- trivial problem, both computationally and physiologi- cally, which has not been adequately addressed by any of the proponents of "piece-wise Fourier analy- sis". Finally, those areas of visual cortex which do possess the sort of large scale "receptive field" struc- ture required for a Fourier model, such as infer* temporal cortex, do not show any particular sensi- tivity to periodic stimuli, such as gratings (Gross er al., 1972). Since grid stimuli are not particularly effec- tive trigger features for in fero-temporal cortex, this area seems to be ruled out as an anatomical site for Fourier processing. But, if one omits receptotopically organi-zed areas, and also omits temporal cortex, then there is little visually excitable tissue left to act as a site for Fourier analysis.
Single cells, spatial frequency channels. and methodo- logical solipsism
In order to summarize the above critical state- ments. it is important to be precise about the nature of this criticism: the data of single cell neurophysio- logy, and the data of psychophysics are not the target of criticism. Instead, it is the identification of the methods of these disciplines with a theory of neural representation which is to be avoided. The confusion of an experimental method with a theoretical explana- tion has sometimes been called "metl~odological solipsism". The fact that a cell responds to a certain trigger feature by no means implies that there is any epistemological significance to the firing of any given cell in the nervous system.
Similarly, the existence of spatial frequency chan- nels, in the sense of threshold psychophysics, by no means implies that Fouricr analysis actually occurs in the nervous system. This statement may be illustrated by the following analogy: a Xerox machine acts as a high-pass spatial filter, since it tends to enhance con- trast at sharp boundaries such as lines. In fact, the basis of the high-pass filter characteristic of Xerox copiers is quite similar to the usual second order dif- ference operator description of lateral inhibition in
the retina (Hartline and Ratliff, 1973). An optical sys- tem (i.e. a lens) actually does perform Fourier analy- analysis, since the distribution of intensity in the focal plane of a conventional lens may be shown to be equal to the magnitude of the Fourier transform of the image (Goodman, 1965). Thus, although both Xerox machines and lenses may be described with the language of Fourier analysis. the lens system actually does perform a spatial Fourier transform while a Xerox machine does not. The spatial filter character- istics of the visual system seem to be most easily explained in terms of the properties of lateral inhibi- tion and spatial filtering. while there is little or no evidence that the actual mechanism of the. Fourier transform has anything at all to do with the visual system.
Critique of the Gestalt posirion
The suggestion that spatial patterns of activity in the visual system might form the basis of perceptual coding is historically associated with the early Gestalt psychologists (Kohler, 1947). The term "gestalten" means "configurations*, and Kohler specifically ident- ified the basis of perceptual coding with patterns of electrical field or current density in the brain. This position was undermined by the experiment of Sperry et al. (1955), who showed that the implantation of electrically grounded conducting grids, in rat visual cortex, did not interfere with visual conditioning. Al- though of great historical importance, this experiment is subject to considerable criticism from a modem point of view. Sperry et a!. (1955) merely demon- strated that interfering with visual cortex (i.e. by (
implanting wire grids) did not cause "blindness". Naturally, this result says little about the nature of perceptual coding in an intact visual cortical preparation. A much deeper criticism of the Gestalt position seems to be sterility of the concept of "the cortical movie screen" (Somjen, 1972). By rejecting Gestalt ideas, and focusing on the response properties of single cells, great progress was made in understand- ing the functional anatomy of the visual system. How- ever. in reaction to the "anatomical" models of Ges- talt psychology, the opposite extreme, in the form of the single cell feature extraction model. was embraced. It is therefore ironic that the most drama- tic results of single cell neurophysiology have led di- rectly back to functional neuroanaromy: columnar architecture and topographic mapping have provided exciting experimental results in recent years. while the discovery of important "trigger features" has come to be of secondary importance.
Con~purarional anaromj* as a ncn-C;csralr approucll ro perceprual coding
Many contemporary physiologists and psycholo- gists have emphatically rejected cortical mapping as being a significant aspect of perceptual coding. as is suggested by the follou ing quotes: "The anatomical fact of an approsimate wiring sysrem from retina to
Computational anatomy of striate cortex 667
brain has nothing to do with perception" (Gibson, 1966), or "Advances in mapping cortical projections tended to divert thought from the real problem of how the brain analyzes information. It was as though the representation could be an end in itself instead of serving a more subtle purpose . . . as t hougil what the cortex did was to cater to some little green man who sat inside the head and surveyed images played across the cortex.. . the world is represented in a far more distorted way; any little green man trying to glean information from the cortical projection would be puzzled indeed" (Hubel and W iesel, 1979). ,
The results of the present paper provide a clear altemative to the latter critique. The cortical map is not "distorted", but is mapped by the geometry of the complex logarithm function, both locally and glo- bally. It is precisely the distortions of the mapping, and of columnar structure, which provide the possibi- lity of computational anatomy. This thesis has been developed by showing that some aspects of size, rota- tion. and projection invariance are simplified by corti- cal geometry, and that feature extraction for certain visual sub-modalities may also be simplified by the neuroanatomy of the visual cortex. This allows a neo-Gestalt approach to visual perception which pro- vides several distinct computational roles for the func- tional architecture of the visual system.
The striate-temporal projection und the little green man in the brain
The idea that anatomy facilitates perceptual func- tion by "pre-processing" the central flow of visual information avoids the critique of "the little green man in the brain" watching the "cortical movie screen". although only a complete, autonomous, and self-organizing neural model is capable of completely avoiding this criticism. However, some mention of higher visual processing may be considered. The infer-temporal cortex is an important visual area which has often been considered as a site for categori- cal analysis of visual data (Gross et al.. 1972). The response properties of the neurons of infer-temporal cortex have been elusive, since conventional visual trigger features (e.g. bars, gratings, spots, etc.) do not seem to selectively excite cells of infero-temporal cor- tex. Complex trigger features. such as the outline of a monkey's hand have been observed (Gross er dl.. 1972). Following the analysis of the present paper, and particularly the analysis of the Mackay comple- mentary image and the fortification illusion presented above, a possible role for infero-temporal cortex may be suggested (Schwartz, 19794). The striate cortex is essentially an orientation map of visual space, with successive orientations represented by parallel bands of cells. The cell of striate cortex may be viewed as a medium-bandwidth oriented filter viewing retinal space: if one considers circumstriate cortex to view striate cortical patterns with oriented spatial filters. then the corresponding trigger features for these cir- cumstriate cells would be boundary curvature. This
follows because a given spatial interval in striate cor- tex corresponds to a component of curvature (i.e. to a difference in orientation). Boundary curvature is an extremely potent shape descriptor (Zahn and Roskies, 1972); the response of infero-temporal cortical cells to complex shapes such as a monkey's hand or a feather (Mishkin, 1979) might be most economically explained by the hypothesis that boundary curvature is the effective stimulus for cells of the infero- temporal cortex. Thus, a stimulus which consists of a closed boundary with a large degree of boundary cur- vature (e.g. the "monkey's hand") is also very close in shape to the basic eigenfunctions of a boundary cur- vature descriptor (Schwarta 1979d). These curvature eigenfunctions consist of a circle (constant curvature, 0th term) plus closed figures which resemble a circle which has been "pushed in" at n points (nth term). Any closed, simply connected shape may be concisely defined by a linear sum of these shape descriptors. Using these shape descriptors, i t should be possible to test the hypothesis that infer-temporal cortical cells are responsive to components of boundary curvature. rather than specific environmental stimuli such as "feathers" and "monkey hands" (Schwartz, 1979d).
Summary
The preceding discussion has indicated that spatial mapping approaches to perceptual coding have been rejected for the most part because there have been few attempts to formulate appropriate computational roles for the specific patterns of functional architec- ture of the visual system. At the same time, single cell feature extraction and Fourier analysis models have been embraced, despite severe logical and experimen- tal problems. The principal goal of the present paper has been to review work which demonstrates that the architecture of the striate cortex may be concisely summarized in terms of the geometric properties of the complex logarithm function. By providing a simple analytic approximation to the local and global map structure of the cortex. insight into a variety of problems connected with the physiology, anatomy. development, and psychology of the visual system may be gained. The "distortions" caused by the non- linear map structure of the cortex ma! dctually sim- plify certain visual computations related to size. rota- tion, and projection symmetry. Similarly, the "distor- tions" associated with columnar structure may sim- plify certain aspects of feature extraction and segmen- tation. Several visual illusions are imply explained when their structure at the level of the striate cortex. rather than the retina, is examined. Thus. the concept of computational anatomy provides a well-defined alternative hypothesis regarding the nature of percep- tual coding and early visual processing. The fascinat- ing architecture of the retino-striate system may he more than mere "developmental packaging". and may actually provide the key to the means by which the visual world is represented within the central nervous system.
Acknowledgemenrs-I would like to thank Francisco Var- ela and Geoffrey Arden for reading preliminary versions of this manuscript and making many useful comments. and special thanks to Donald Kelly and Sansar Sharma for providing encouragement through their interest in this work. and to E. Roy John for his generous support. both intellectual and material.
REFERENCES
Ahlfors L. (1966) Complex Analysis. McGraw-Hill New York.
Albus K. (1975) A quantitative study of the projection area of the central and paracentral visual field in area 17 of the cat. Expl Brain Res. 24. 159-1 79.
Allman J. H. and Kaas J. (1971) Representation of the visual field in striate and adjoining cortex of the owl monkey brain. Brain Res. 35, 89-106.
Barlow H. B. (1972) Single units and sensation: a neuron doctrine for perceptual psychology. Perception . I , 37 1-380.
Blakemore C. and Campbell F. W. (1969) On the existence of neurons in the human visual system selectively sensi- tive to the orientation and size of retinal images. J. Phy- siol. 203, 237-2150,
Brindley G. S. and Lewin W. S. (19681 The sensations pro- duced by electrical stimulation of the visual correx. J. Physiol.. Lond. 1%. 479493.
Brousil J. K. and Smith D. R. (1967) A threshold logic network for shape invariance. 1.E.E.E. Tram Cornput. EC-16, 818-878.
Campbell F. W. and Robson J. G. (1968) Application of Fourier analysis to the visibility of gratings. J. Ph!-siol. 197, 55 1-566.
Cavanagh P. (1978) Size and position invariance in the visual system. Perceptioti 7, 167-1 77.
Casasent D. and Psaltis P. (1976) Position. scale a r~d size invariant optical correlation. Appl. Oprirs 15. 1795-1 800.
Chaiken G. and Wieman C. (1977) Lop spiral grids in com- puter pattern recognition. Technical Report, Old Dominion University.
Colonnier M. (1964) The tangential organization of the visual cortex. J. Anar. 98. 237-344.
Courant H'. (1953) Dirichler's Principle. hlcGraw-Hill. New York.
Cowey A. (1964) Projection of the retina onto striate and prestriat e cortex in the squirrel monkey, Sainliri sciureus. J . Neurophysiol. 198. 366-393.
Cowiy A. a n d -Kolis f.-~:-(19f4) ~ u m a n cortical magnifi- cation factor and its relation to visual acuity. Expl Brain Res. 21. 447-454.
Creutdeldt 0. D., Kuhnt U. and Benevento L. A. (1973) An intracellular analysis of cortical neurons to moving stimuli: responses in a cooperative neuroncil network. Expl Brain Res. 21. 251-274.
Daniel M. and Whitteridge D. (1961) The representation of the visual field on the cerebral cortex in monkeys. J. Physiol. 159, 203-22 1 .
Dobelle W. and Mladejovsky M. G. (1974) Phosphenes produced by electrical slimulation of human occipital cortex and their application to the development of a prosthesis for the bl~nd. J. Physiol. 243. 553-576.
Dobelle W. H.. Mladejovsky M. G. and Evans J. R . (19761 Braille reading by a blind volunteer by visual cortex stimulation. Nature 259, 1 11-1 12.
Drasdo N. (1977) The neural representation of visual space. Nature 256, 554-556.
Duda P. and Hart P. (1973) Introd~~crion ro Srarisrical Par- rern Recognition. Wiley, New York.
Fiddy M. A. and Greenawav A. H. (19781 Object recon- struction from noisy data. ,Valirro 276. 42 1.
Fischer B. (1973) Overlap of receptive field centers and representation of the visual field in the optic tract. Vision Res. 13, 2113-2120.
Gibson J. J. (1966) The Senses Considered as Perceptual Systems. 262 pp. Houghton-MoWin. Boston, Mass.
Glezer V. D.. Cooperman A. M.. lvanov V. A. and Tscher- bach T. A. (1973) investigation of complex and hyper- complex receptive fields of visual cortex of the cat as spatial frequency filters. Vision Res. 13. 1875-1904.
Goodman J. W. (1 965) Inrroducrion to Fourier Oprics. McGraw-Hill. New York.
Gross C. G.. Rocha-Mirand C. E. and Bender D. (1972) Visual properties of neurons in infero-temporal cortex of the Macaque. J. Neirrophysiol. 235. 9 6 1 1 I .
Gulick H'. L. and Lawson R. N. (1976) Human Srrreopsis. Oxford University Press. .
Hartline F. and Ratliff F. (1973) Studies on excitation and inhibition in the retina Rockefeller University Press, New York.
Hubel D. H. and Wiesel T. N. (1962) Receptive fields. bino- cular interaction and functional architecture in the cats visual cortex. J. Ph~a io l . 160. 106- 154.
Hubel D. H. and Wiesel T. N. (1970) Stereoscopic vision in macaque monkey. Narure 225. 41 4.
Hubel D. H. and Wiesel T. N. (1974) Uniformity of mon- key striate cortex: a parallel relationship between field size. scatter. and magnification factor. J. co171p. Neurol. 158. 295-302.
Hubel D. H. and Wiesel T. N. (1979) Brain mechanisms of vision, p. 152. Scienr. Am. 241. 150-163.
Hubel D. H., Wiesel T. N. Strykker M. (1977) Orientation columns in monkey striate cortex and their relationship to ocular dominance column. 7th Ann. Meet . Sociery for Nu~croscit~nce. Abstract No. 1852.
Hubel D. N.. Wiesel T. S. and Stryer M. P. (19781 Anatomical demonstrations of orientation columns in macaque monkey. J. Comp. h'rurol. 177. 361 - 380.
Jolin E. R. and Schwartz E. L. (1978) The neurophysiology of information processing and cognition. Ann. Rer. P s p ~ h o l . 29, 1-29.
Julesz B. ( 1971 ) Foundalions o/ Cyclopean Percaprion. Uni- versity of Chicago Press, Chicago.
Kelly D. H. (1972) Adaptation effects of sine wave sensi- tivity thresholds. Vision Res. 12, 89-10].
Kelly D. H. (1975) Spatial frequency selectivity in the retina. Vision Res. 15, 665672.
Kelly D. H. and Magnuski H. S. I19751 Paitern detection and the 2D Fourier transform: circular targets. Vision Res. 15, 91 1-915.
Koenderink J. J. and van Doorn A. J. (1976) Geometry of binocular vision and a model for stereopsis. Biol. Cyber- nerics 21, 29-35.
Kohler W. (1947) Ges ldr Psychologj.. Liverright Press. Konorski I. (1973) ltlregrarive Acticirj of the Brain. An
Irirerdisciplinary Approach. University of Chicago Press. Chicago.
Lettvin J., Maturana H., Pittls W. and McCuiloch W. S. 11959) What the frog's eye tells the frog's brain. Proc. I.R.E.. 47. 51.
Lehay S.. Hubel D. H. and Wiese~ T. N. (1975) The pattern + of ocular dominance columns in macaque visual cortex revealed by a reduced silver stain. J. ronrp. Neurol. 159.
. 559-576. Leva! S.. Strykker M. P. and Shatz C. J. (19781 Develop
ment of ocular dominance columns. J. comp. hirurol. s
179, 223-244. Lorente de N o R. (1936) Auditory sensation. Larj~ngoscope
42. 1-30. hlackay D. M. (1964) Anomalous visual responses to
simple massed stimuli. In Infirnurrinn Processing in ilrr .Vurr:o~rs Sysrrnl. pp. 181- 186. (Edited by Gerard R. and Duyff J. W.) E~cerpta hledica Foundation. .Amsterditm.

Computational anatomy of st'riate cortex 669
Mackay D. M. (1970) Perceprion and Brain Function. Second Neuroscience Srudy Program, pp. 303-3 15. M.I.T. Press. Cambridge, Mass.
Marg E. (1973) Recording from single cells in the human visual cortex. In Handbook of Sensory Physiology, Vol. VII/3, Springer, Berlin.
Merzenich M., Knight P. and Roth G. L. (1975) Tonotopic mapping in the auditory cortex of the cat. J. Neurophp siol. 38, 23 1-255.
Mishkin M. A. (1979) A sequential neural model of visual perception, memory and affect. In Karl Lashley Lec- tures: Neuropsychology Afier Lashley. Queens College,
b New York. Morse P. M. and Feshback H. (1953) Methods of Theoreti-
cal Physics. McGraw Hill, New York. Moulton D. G. (1976) Spatial mapping in the olfactory
system. Physiol. Rer. 56, 578. Pennington K. S.. Will P. M. and Sheiton G. L. (1970) Grid
coding: a technique Tor extraction of differences from scenes. Optics Commun. 2, 1 13-1 19.
Poggio G. F. and Fischer 0. (1977) Binocular interaction and depth sensitivity in striate and pre-striate cortex of behaving rhesus monkey. J. Neurophysiol. 40, 1392-1405.
Pollen D.. Lee J. R. and Taylor J. H. (1971) How does the striate cortex begin the reconstruction of the visual world. Science 173, 74-77.
Rakic P. (1977) Prenatal development of the visual system in rhesus monkey. Phil. Trans. R. Soc. 278, 24S260.
Richards W. (1971) Fortification illusions, associated with migraine headache, Scienr. Am. 78, 1 1S1.20.
Robson J. G. (1975) Receptive fieids: neural representation of the spatial and intensity attributes of the visual image. In Handbook of Perception (Edited by Carterelle E. C. and Friedman M. P.J. Vol. 5. pp. 8 1-1 12. Academic Press, New York.
Rolls E. T. and Cowey A. (1970) Topography of the retina and striate cortex and its relationship to visual activity in rhesus and squirrel monkeys. Expl Brain Res. 10. 298-330.
Scholes J. H. (1979) Yerve fibre topography in th? retinal projection to the tectum. "Vaiurr 278, 620-624.
. Schwartz E. L. (1976a) Analytic structure of the retinotopic map and relevance to perception. 6th Ann. Neuroscience .tleerit~g, Abstract No. 1636.
Schwartz E. L. (1976bl retinotopic mapping in the striate cortex. Physiologisr 358.
Schwartz E. L. (1977al Spatial mapping in the primate sen- sory projection: Analytic structure and relevance to per- ception. Biol. Cybernrrlcs 25. 18 1 - 1 94.
Schwartz E. L. (I977b) The development of specific visual connections in the _eoldfish and the monkey: Outline of a geometric theory of visual perception. J. rheor. Biol. 69, 655-483.
Schwartz E. L. ( 1977~) Afferent geometry in the primate visual cortex and the generation of neuronal trigger features. Biol. Cj~bernrrics 29. 1-24.
I
Schwartz E. L. (1978) Spatial mapping in the visual system. J . opt. Soc. Am 68, 137 1.
Schwartz E. L. (1979a) Columnar architecture and com- putational anatcmy in primate visual system: segmen- tation of the visual scene by color, depth and form. 9th Ann. Meet. Society for Neuroscience. Abstract No. 2725.
Schwartz E. L. (1979b) Developmental specification 'of '
columnar and retinotopic structure of retino-geniculo- striate system via a moving boundary diffusion-decay system. 9th Ann. Meet. Society for Neuroscience. Abstract No. 573.
Schwartz E. L. (1980a) A quantitative model of the func- tional architecture of human striate cortex with appli- cation to visual illusion and cortical texture analysis. Biol. Cybernetics 37,63-76.
Schwartz E. L. (1980b) Cortical anatomy and spatial frequency analysis. Perception. In press.
Schwartz E. L. (1979d) Columnar architecture and compu- tational anatomy in primate visual system: global feature extraction via spatio-temporal coding of form, color and depth. Biol. Cybernetics. In press.
Sekuler R. (1974) Spatial vision. Ann. Rev. Psychol. 25, 195-232.
Somjen G. Sensory Coding in the Mammalian Ner~vus Sys- tem. Appleton-Century-Croft, New York (1972).
Sperry R. W., Miner N. and Myers R. E. (1955) Visual pattern perception following sub-pial splicing and tantu- lum wire implanations in the visual cortex. J. cornp. Phy- siol. Psychol. 38, 50-58.
Strausfeldt N. J. (1971) The organization of the insect vis- ual system I. Projections and arrangements of neurons in the lamina ganglionaris of Diptera. 2. Zellforsch. mik- rosk. , h a [ . 121. 377441.
Strykker M., Hubel D. N. and Wiesel .T. N. (1977) Ann. Meet. Society for Neuroscience. Abstract No. 1852.
Talbot S. A, and Marshal W. H. (1941) Physiological studies on neural mechanisms of visual localization and discrimination. Am.J. Opthal. 24, 1255-1263.
Tusa R. J., Palmer L. A. and Rosenquist A. C. (1978) The retinolopic organization of area 17 (striate cortex) in the cat. J . cornp. Neurol. 177, 2 13-236.
Uttal W. (1975) An Auto-Correlation Theory of Patfern Recognition. Erlbaum, Potomac.
Werner G. (1970) The topology of the body representation in the somatic afferent pathway. In The Neurosciences Second Scudv Program (Edited by Schmidt F. 0.). Rocke- feller University Press. New York.
Wilson H. R. (1978) Quantitative prediction of line spread function measurements: implications for channel band- widths. Vision Res. 18. 493196.
Woolsey C. N.. Marshall W. H. and Bard P. (1972) Somatotopic mapping. Bull. Johns Hopkins Hospital 70. 339.
Zahn C. T. and Roskies R. Z. (1972) Fourier descriptors of plane closed curves. I .E .E .E . Trans. Conrputrrs CZI. 269-15 1.